
Submitted:
10 May 2023
Posted:
12 May 2023
You are already at the latest version
Abstract
Background: As pediatric BOLD SV is relatively novel, there is a need to provide a foundational framework that gives researchers an entry point into engaging with the topic. This begins with clarifying the definition of BOLD variability by identifying and categorizing the various metrics utilized to measure BOLD SV; Methods: A systematic review of the literature was conducted. Inclusion criteria were restricted to studies utilizing any metric of BOLD signal variability (BOLD SV) and with individuals younger than 18 in the study population. The definition of BOLD SV was any measure of intra-individual variability in the BOLD signal. Five databases were searched: Psychinfo, Healthstar, Medline, Embase, and Scopus; Results: Seventeen observational studies, including male (n =1796) and female (n =1324) pediatric participants were included. Eight studies quantified variability as the amount of deviation from average BOLD signal, 7 used complexity-based metrics, 3 used correlation measures of variability, and 1 used structure of the hemodynamic response function. Ten methods of quantifying signal variability were identified. Associations and trends in BOLD SV were commonly found with age, factors specific to mental and/or neurological disorders like attention deficit disorder, epilepsy, psychotic symptoms, and performance on psychological and behavioral tasks. Conclusions: BOLD SV is a potential biomarker of neurodevelopmental and neurological conditions and symptom severity in mental disorders for defined pediatric populations. Studies that establish clinical trends and identify the mechanisms underlying BOLD SV with a low risk of bias are needed before clinical applications can be utilized by physicians
Keywords:
BOLD Signal Variability
; Pediatrics
; Biomarker
; fMRI
; Neurodevelopment
1. Introduction
Variability in the blood-oxygen-level-dependent (BOLD) signal has emerged as a metric with potential clinical relevance. It is no longer viewed as simply “noise” from confounding events during functional magnetic resonance imaging (fMRI) [1,2,3]. At its most inclusive, BOLD signal variability, hereafter referred to as BOLD SV, is a measure of the intraindividual change of the measured BOLD signal, a proxy for neural activity. BOLD SV has been associated with age and cognitive function over the lifespan [4], as well as clinical symptoms in eating disorders [5], attention deficit hyperactivity disorder (ADHD) [6], or 22q11.2 deletion syndrome [2]. Despite the growth of BOLD SV being utilized in pediatric research, there remains inconsistency around its definition and the metrics used to characterize variability. Which metrics exist and which should be used is unclear, rendering BOLD SV challenging to apply or interpret in a standardized manner, especially in a clinical setting. For example, cortical morphology metrics like cortical thickness confound BOLD SV measurements, but this is not consistently demonstrated or accounted for across all metrics [7].
Overall, younger individuals are reported to be more variable in neural processing than older populations. Specifically, an inverted U-shaped trend of cognitive performance and whole brain variability level has related to age. At the same, BOLD SV of individual brain regions presents differing trends across the lifespan [8]. Understanding pediatric BOLD SV may provide insight into critical neuro-developmental processes including maturation of neurotransmitter systems, pruning and neuroplasticity, myelination and white matter integrity, and functional network changes [9,10,11]. For example, higher BOLD SV in medial prefrontal areas comprising the default mode network (DMN) has been shown to positively correlate with ADHD symptom severity [6]. Importantly, infancy and adolescence are unique periods of brain development in which early screening and surveillance can mitigate neurodevelopmental issues. Diagnosing neurological and developmental disorders early on in a child’s life can result in earlier identification and therefore improved chances for intervention [5]. BOLD SV has the potential to be established as a neurodevelopmental biomarker, and contribute to the diagnosis, prognosis, and treatment of neurological disorders in pediatric development [4].
As pediatric BOLD SV is relatively novel, there is a need to provide a foundational framework that gives researchers an entry point into engaging with the topic. This includes clarifying the definition of BOLD SV through identifying and categorizing the various metrics used to measure BOLD SV, and how it has been utilized in the literature.
2. Materials and Methods
2.1. Operational Definitions
BOLD SV in this review was defined as any measure of intra-individual variance in the BOLD signal. The BOLD signal was acquired signal correlated with changes to blood flow and blood oxygenation to localized regions of the brain [12]. The signal also had to characterize the flow of oxygenated hemoglobin being used to support neuronal activity [12]. This definition was chosen to ensure a comprehensive set of all definitions, which are presently not well defined in the BOLD SV literature.
2.2. Article Search Strategy
This systematic review was conducted using the preferred reporting items for a systematic review and meta-analysis (PRISMA) [13]. The electronic literature search was conducted in November 2021 by using the MEDLINE (2003 to 2021), Ovid Healthstar (2003-2021), Psychinfo (2003-2021) and EMBASE (2003 to 2021) through the Ovid platform, as well as the Scopus (2003 to 2021) database. Google scholar was also searched, although no additional citations were captured. The same strategy was used for each database was used to search controlled vocabulary and keywords. These Key terms were: BOLD Signal AND (Variability OR standard deviation OR mean successive difference) AND (Paediatric OR Adolescent OR youth OR Infant. Forward and backward citation tracing were conducted to search for articles that may not captured in electronic databases or Google Scholar.
2.3. Study Inclusion and Exclusion
Articles included used BOLD SV to measure intra-individual variability, or variability changes across the lifespan. Measures of BOLD SV used to adjust for signal noise and other confounders were excluded. All studies possessed participants in their final study sample that were under the age of 18, even if individuals over the age of 18 were included in the study. The inclusion criteria permitted both studies that used an observational or experimental design. Only results relevant to pediatric samples were included in the final extraction. Review papers, conference abstracts and letters to editor case reports and case studies, non-peer reviewed studies, populations over 18, non-human studies, non-English papers, editorials, and any study without enough data (i.e., did not identify age) were all excluded.
2.4. Study Selection and Quality Assessment
A two-stage screening process was conducted to identify relevant articles. All articles were first identified through the electronic database searches and imported into the systematic review management system known as Covidence. Duplicates of captured articles were then removed. Abstract and Title screening was completed by two authors (MD, DRP) who screened in an inclusively, to avoid the removal of potentially relevant articles. Then, a full-text review was independently conducted by two authors (MD, DRP). The review team collaboratively reviewed full-text articles and resolved conflicts. Risk of bias (ROB) and quality assessment of the identified studies were performed using the Downs and Black [14].
2.5. Data Synthesis
Mean and standard deviations (SD) were used to describe the study population’s age and the number of control and diseased patients. In addition, the number and percentage of analysis conducted in studies, and the total number of male and female participants were also calculated from all studies included. Given the heterogeneity of the identified BOLD SV definition subgroups, and of the pediatric populations studied, a meta-analysis was not performed. A data extraction spreadsheet was developed to capture information pertaining to the definitions, study characteristics, sample characteristics, patient characteristics, variability metrics, scales, independent variables, and results of each article. Tables were constructed to summarize study characteristics, BOLD SV metrics and associated findings, and study objectives. Figures were constructed to summarize results of the search via the PRISMA flowchart, summarize overall findings of Metric type and prevalence, and to summarize significant findings in the literature.
3. Results
3.1. Study Sample
Of the five databases searched, Psychinfo contained 20 results, Healthstar had 41, Medline had 46, Embase had 96 and Scopus with 191. 185 unique studies were identified, 17 studies were included. The PRISMA flowchart, depicts the number of studies included and excluded at each screening step (Figure 1). This study included ten different metrics of BOLD SV, a total of 3258 participants and 2869 total pediatrics (1796M/1324F). Metrics classification and associated findings can be found in Table 2. Of the 17 studies, 8 used deviation from average BOLD signal [8,15,16,17,18,19,20,21], 4 used correlational measures of BOLD SV [9,22,23,24], 7 used signal complexity [15,19,21,25,26,27,28] and 1 used the structure of the HRF [29] (Table 1).
3.2. Study Characteristics
As presented in Table 1, all studies were observational. Of these 11/17, (65%) are cross-sectional studies and 6/17 (35%) are case control. 11/17 of the studies exclusively included children (those under the age of 18) and 6/17 included a mixed population that included more than 1 child in their study population.
The statistical analyses performed in the included studies were heterogenous, with the most common being partial least squares analysis (n = 4, 24%) [11,15,16,17], followed by temporal fractal analysis (n = 2, 12%) [25,26] and principle component analysis (PCA) (n = 1, 5.9%) [27]. Age-based variability trends (n= 5, 29.4%) [8,17,18,27,29], behavioural and psychological task performance (n = 2 , 12%) [16,22], and mental disorders (n = 5, 29%) [15,17,19,23,25], neurological disorders (e.g. Autism, ADHD, schizophrenia/psychotic symptoms, and anorexia) (n = 3, 18%) [26,28,29], and genetic conditions (n = 3, 18%) [17,18,24], were examined in relation to BOLD SV. Appendix Table A1 indicates the various objectives of the included articles.
3.3. BOLD SV Metrics (stopped editing here)
Variability metrics were grouped into four categories: BOLD signal deviation from the mean, measures of BOLD SV derived through a correlational analysis of signal, measures of BOLD signal complexity, and measures that utilize characteristics of the hemodynamic response function (HRF). Table 2 presents the descriptions of each variability metric identified in the review.
3.4. Findings Associated with Deviation from the Average BOLD Signal
3.4.1. Standard Deviation of the BOLD Signal (BOLDSD)
Five studies utilized BOLDSD (n=5, 72.5%) [16,17,18,20,21] quantifying an average amount of deviation from the typical BOLD signal (Table 2). Most studies had an objective of characterizing variability differences between healthy or typically developing controls and those with a mental disorder, neurological issue or genetic condition (n = 2, 40%) [17,18]. The next most common objective was identifying lifespan and age based patterns in variability (n= 2, 40%) [17,18]. Only one of these studies looked at structural changes across the lifespan (n=1, 20%)8, while the rest looked at network-based changes (n=4, 80%) [17,18,20,21].
A longitudinal study of white matter structure in healthy children, and a cross-sectional study on 22q11.2 deletion syndrome, assessed aging and its effect on BOLDSD of the brain and age-related variability patterns, respectively. A global association of increasing BOLDSD with age, particularly in the frontal gyrus, supramarginal gyrus, middle temporal gyrus, and superior parietal lobule was reported [20]. BOLD SV and white matter micro and macro structure metrics like white matter volume, mean fractional anisotropy (FA) and mean diffusivity (MD) measured at younger ages were predictive of BOLD SV at older ages [20]. BOLDSD associations with these macro and micro structural alterations changed over the lifespan and across various regions throughout the brain.
Two studies focussed on 22q11.2 deletion syndrome, a genetic disorder commonly associated with schizophrenia, and its relationship to BOLDSD [2,18]. Strong positive psychotic symptoms (PS+) were associated with aberrant age-relationships and concurrently saw BOLD SV increase in visual regions and decrease in the cortices of the prefrontal and orbitofrontal regions of the brain [18]. Both of the studies identified elevated and reduced BOLDSD across different brain regions, often being lower in regions of the DMN (medial prefrontal cortex, posterior cingulate cortex (PCC), and lateral parietal cortex) [2,18]. Notably, the lack of association between age and BOLDSD was identified in the dACC or DMN of patients with high psychotic symptom scores (PS+) [2] or schizophrenia, which was typical of healthy controls [2,18] and populations with less severe psychotic symptoms (PS-) and the 22q11.2 deletion [2]. This resulted in globally reduced variability in the dACC region of children with PS+ when compared to children with PS [2].
A task-based study measured internally directed creative cognition using a future simulation task, and an alternate uses task (AUT) also has correlations with BOLDSD. Performance, which acts as an index of creativity, was negatively correlated with the BOLDSD [16].
3.4.2. Mean Successive Squared Difference (MSSD)
MSSD is another way deviation from the average signal is measured (Table 1). Three studies utilized MSSD as a metric of BOLD SV [8,15,19] (n = 3, 27.5%). Although heterogeneous, studies in this section focused on diseased based findings. One study assessed BOLD SV’s relationship to autism spectrum disorder (ASD) [15], and another assessed lifespan related trends in various networks across the brain [8]. The third study looked at recovered anorexia patients, but found no significant findings using the metric [19].
A cross-sectional study of ASD and typically developing individuals used MSSD as a metric to quantify BOLD SV. Variability increased linearly in the SN nodes (anterior insula) and the ventral temporal cortex and decrease across subcortical, visual, sensorimotor, DMN, and central executive network (CEN) regions [8,15]. When MSSD was used in a population of children with ASD, positive correlations between MSSD of the BOLD time series and GE in structural networks are present. Brain regions that had positive correlations with GE also had a negative correlation with behavioural severity scores such as the social responsiveness scale (SRS) [15].
3.5. Findings Associated with Correlational Measures of BOLD SV
The following section includes all metrics that attained variability measures through correlation-based methods (n = 4, 24%). This includes temporal variability, GLM derived measures of variability and the BOLD% signal change. Supplementary Table S2 includes the definitions of these metrics.
3.5.1. Temporal Variability
To characterize temporal variability in the functional regions, temporal variability was used in 1 study which included subjects with mental disorders and healthy controls (n=1, 25%) [23]. In typically developing children, age-related trends demonstrated significant increases of temporal variability across the inhibition network, from childhood to adulthood [23]. When characterizing relationships in mental disorders, children with schizophrenia had decreased variability in DMN regions associated with increased activity and connectivity compared to typically developing patients. This decreased variability was also associated with neurocognitive symptoms characteristic of schizophrenia [23]. Increased variability was seen in subcortical regions (thalamus, putamen, and pallidum) in these patients, while children with ADHD, saw increased variability in regions of the DSN and decreased variability in subcortical regions. Variability levels were not the same in the DMN regions of typically developing children with autism and ADHD, with the medial frontal areas mainly affected in ASD, and the posterior cingulate in ADHD [23]. Importantly, regions with the highest variability in controls, (i.e trans modal areas) have lower levels of variability in disorders [23]. Those areas in controls with the lowest variability, like primary sensory regions, are more prevalent in mental disorders [23].
Half of the regions showing significant variability changes in the three disorders are in the top 10% of regions with the highest or lowest variability in controls [23]. Negative correlations between the variability of a brain region and its BOLD activity were found. Low DMN variability was consistently identified alongside strong functional connectivity (FC) within the DMN during resting state fMRI [23].
3.5.2. Multilinear and GLM Derived Variance Measurement
Two studies used multilinear models or GLM derived variance measures (n = 2, 50%) [22,24]. A reading skill task used to investigate deviations from the mean BOLD signal by measuring the standard deviation of a beta series representing mean activation. In the left inferior frontal gyrus pars triangularis, the SD of the series appears to account for additional variance in reading skill, measured as task performance [22].
Only one study measured BOLD SV as the % change in signal. This study was task-based, studying a “Go/No-Go” behavioural task in children and assessed neural correlates of inhibitory control and genetic variation in the DA receptor gene. Having 7-repeats in the variable number of tandem repeats (VNTR) of the DA receptor gene DRD4 (7R+). Having 7 repeats in the VNTR region of DRD4 (7R+) has been associated with psychiatric disorders that present self-regulation issues such as ADHD [24]. Lower variability was found in those with 7R+ when compared to 7R- groups during successfully inhibited prepotent motor response. This was observed in two regions located in the prefrontal cortex, one in the cerebellum and one in the occipital lobe [24]. There were no differences in behavioral performance of the “Go/No-Go” task and correlations between task-related BOLD response were not observed during the task [24].
3.5.3. Difference of Residuals
One cross-sectional study used the difference of residuals metric (n=1, 25%) [9]. This variability metric compares the difference in variability between the two residual models of observed and expected BOLD response. BOLD SV in the inhibition network, was reported as lower in children than adults during a successful stopping task [9].
3.6. Findings Associated with Signal Complexity
Signal complexity (as defined in Table 2) was also used to measure the variability in the BOLD signal. Signal complexity is also described as unpredictability of a signal over its time series [30]. Seven studies were identified that utilized this metric (n=7, 41%) [15,19,21,25,26,27,28].
3.6.1. Entropy/Sample Entropy
One way it is estimated is by using an entropy metric such as sample entropy (SE). SE is used to identify repetitive patterns in a time series, and the degree of regularity of patterns of activation observed [30].
Only 1 study used an entropy-based metric of BOLD SV in populations of children with and without autism spectrum disorder (n=1, 14%) [15]. Distributed brain regions showed increases in MSSD and entropy from childhood through adolescence and positive correlations between entropy, general efficiency (GE) and age in both ASD and typically developing groups [15]. Negative correlations with SRS scores and entropy [15]. Lower levels of sample entropy are seen in ASD individuals during social and non-social tasks [15].
3.6.2. Fractal Dimensionality
Two studies used fractal dimension, obtained by fractal analysis, as a measure of the complexity derived from hurst exponents (n = 2, 29%) [25,26]. FD is a statistical measure of how completely a fractal appears to fill the space in the geometric sense. When used for signals, it can become a metric of structural complexity across a given time domain [31].
Reduced signal complexity in ASD participants with respect to controls in the amygdala, the vermis, the basal ganglia, and the hippocampus. Decreases were correlated with autism diagnostic interview-revised (ADI-R) and autism diagnostic observation schedule (ADOS) scores [25]. The nucleus accumbens and the caudate head showed significantly reduced fractal dimension. Regions of the cerebellum in the ASD cohort showed significant reduced FD, specifically in the vermis with mild correlations with the ADIRRB and ADOSRRB metrics [25].
A cross-sectional study of children with mTBI utilized FD as a metric of BOLD SV. There were 11 brain regions where FD significantly decreased for mTBI patients, including the caudate nucleus and nucleus accumbens [26]. The FD also decreased for mTBI patients when compared with the uninjured control group in both these areas.
3.6.3. Power Based Metrics
Power or spectral density-based variability metrics are an index of the signal amplitude of sinusoidal oscillations within and across frequencies over a time series [10]. Signal which demonstrates scale-free behavior, require fractal-like self-similarity in a spatial or temporal scale to use a power law measure of complexity [21].
Only one study used this metric to quantify complexity in healthy participants (n = 1, 14%) [21]. Increases in complexity were found throughout the whole brain during adolescence and early adulthood, excluding the DMN and attention control networks. Complexity did not change with age in a subset of gray matter regions and dorsal attention networks [21]. Decreases in complexity were observed in other regions of the brain, but the largest reductions occurred in the subcortical gray nuclei [21]. A strong positive correlation between local connectivity (ReHo) and complexity in endogenous brain activity fluctuations was also identified [21]. White matter and areas of gray matter with lower local connectivity exhibited more randomness in their BOLD fluctuations. Basal ganglia, thalami, and spinocerebellum showed relatively lower complexity than would be predicted from ReHo [21].
3.6.4. Fractional amplitude of low-frequency fluctuation (fALFF)
Three studies utilized fALFF as a metric of complexity (n = 3, 43%) [19,27,28]. One cross-sectional study found that fALFF metrics were associated with age, with 5.2% of variability in age attributed to the complexity. This distinguished areas of the DMN and salience network from occipital, temporal, superior parietal, and pre/post central gyral regions. The age-associated fALFF component was also distinguishable from the posterior from anterior cortical regions. DMN anterior regions showed a more pronounced decline, relative to non-DMN posterior regions [27].
Two studies identified used fALFF in populations with mental disorders or neurological conditions [19,28]. It was found that in children with nocturnal enuresis (NE), fALFF was higher in right insula and in the typical spectral band. Regional Homogeneity (ReHo) increased in the left insula and the right thalamus in NE children, and fALFF was increased in the right insula in NE patients [28]. In the slow-5 frequency band fALFF increased in the superior cerebellum, superior temporal gyrus in those with NE. The fALFF in slow-2 were mainly seen in white matter and appeared negative in other bands [28]. In anorexia nervosa patients and healthy controls, values indicated alterations in the temporal gyrus and cerebellum of recovered anorexic patients. Group differences in fALFF were also observed in the cerebellum, specifically in the vermis [19].
3.7. Findings Associated with Characteristics of the Hemodynamic Response Function (HRF)
The hemodynamic response function (HRF) describes behaviour of the BOLD response over time by measuring the change in the HRF with respect to time. A single cross-sectional study uses the “time to peak” in the function, as well as the overall shape, as a metric of variability.
A study of pediatric epilepsy patients discovered that the shape of the HRF changes in children, specifically the amplitude, decreased significantly with greater EEG spike frequency in epileptic patients. When looking at age related trends in the these patients, the intrasubject variability of the amplitude of the HRF does not vary significantly across the age groups of epileptic children [29]. In epilepsy cases, authors reported differences in age could not be distinguished using time to peak or amplitude based metrics of the HRF [29].
4. Discussion
4.1. Summary of Evidence
4.1.1. Metrics
Seventeen studies and a total of 10 unique metrics of BOLD SV were included in this review. These metrics were categorized into 4 types of variability measures: 8 used deviation from average BOLD signal, 4 used correlational measures of BOLD SV, 7 used signal complexity and 1 used the structure of the HRF. In addition, only 7 studies included healthy controls (HCs) exclusively, while 10 included patients with neurological, psychiatric, or genetic disorders.
4.1.2. The Inverted U Trend and BOLD SV
Global increases in whole brain BOLD SV were associated with aging in 3 of the 4 metric types in pediatric populations. This literature has competing perspectives on age-based variability trends. Typically, an inverted U like pattern of variability is reported over the lifespan, suggesting that variability is functionally related to cognitive performance, and increases through childhood to adulthood and decreases in older age [32]. Multiple studies included in this review demonstrate that in both resting state and task-based protocols, whole brain variability increased from 0-18 years of age [15,17,18,25]. This inverted U may relate to development of cognitive capacity, dynamic range and therefore efficiency that increases in childhood, peaks at young adulthood and declines in older age [32]. One cross-sectional study that was identified proposed that lifespan-based trends in BOLD SV are better characterized by networks that simultaneously increase and decrease in variance over the lifespan. They report resting state fMRI data which indicates regions of the SN nodes (anterior insula) and the ventral temporal cortex increase while there are decreases across subcortical, visual, sensorimotor, DMN, and CEN regions [8].
Though not established yet in pediatrics, the inverted U trends of cognitive performance and variability over the lifespan, also follows dopamine signalling strength [34]. Cognition appears to change as DA signaling strength becomes too low or too high, and may play a role in the change in variability throughout the lifespan [34,35]. It should be noted that higher levels of BOLD SV has been specifically associated with elevated levels of cognitive flexibility [32]. In younger and older adults, suboptimal dopamine synthesis capacity is also associated with reduced cognitive flexibility, in addition to reduced BOLD SV [34,37].
4.1.3. BOLD SV Trends in Mental and Neurological Conditions
BOLD SV trends were identified in individuals with ASD, ADHD, schizophrenia, epilepsy, NE, recovered anorexia mTBI and VNTR 7R deletion syndrome. In all disorders, atypical variability trends were uniquely observed across a variety of brain regions and compared to health controls. Regions associated with mental disorders, brain injury and higher symptom severity were also associated with changes in variability.
Interestingly lower variability of DMN specifically was seen in those with schizophrenia, while increased DMN variability in Autism/ADHD were identified, reporting opposite relationship [23]. Schizophrenia and ASD’s/ADHD’s opposite variability trends in similar regions, may be a result of their differing function in the social development patterns associated with the two diseases [33]. In the identified mental disorders, variability trends were inconsistent across regions, with some showing increases, aligning with the global variability trend, while others showed decreases or no change, breaking the trend. Elevated and reduced variability levels compared to healthy controls were consistent across all studies with a focus on mental disorders and neurological conditions, often in affected regions (Figure 3).
4.1.3. Recommendations for Clinical Applications:
Although the literature around BOLD SV does not currently support its use as a clinical biomarker at the moment, it has the potential to become an important one in the future. This includes the use of BOLD SV as a biomarker for normal neurodevelopment and neurodevelopmental issues such as in mental disorders like schizophrenia. Reduced or elevated levels of BOLD SV may also act as a target for treatment in pediatric populations with dopaminergic drugs, especially for those with poor cognitive function and low BOLD SV.
Given global variability’s associations with age in childhood development, there are benefits to producing standardized thresholds of BOLD SV in a typical healthy patient across the different neurodevelopmental milestones in different populations (healthy, diseased, injured etc.). This can be for associated brain regions, networks or across the whole brain. This would allow for the establishment of BOLD SV as a biomarker of neurodevelopment and neurological conditions. To achieve this, consistent use of BOLD SV metrics in the literature and the recruitment of larger pediatric cohorts with low risk of bias is vital. For BOLD SV to be a useful clinical biomarker, researchers must produce normative and non-normative distributions of BOLD SV for various regions of the brain in healthy populations and those effected by different neurodevelopmental disorders respectively.
4.2. Future Directions and Limitation
Given the plethora of metrics identified, future studies should seek to implement multiple variability metrics into their analysis to validate their findings are consistent across metrics and add to the existing knowledge on variability metrics and their limitations. More work must be done in this field to establish or standardize these metrics in a logical way that highlights the strengths and weaknesses of each from a signal processing perspective. This will help create a common framework for their use in a variety of situations as more high-quality evidence is procured.
A complimentary risk of bias analysis was conducted (Table A2), identifying that included articles displayed a risk of bias for external and internal validity overall. Using the Modified Downs and Black checklist identified total scores of 64% for reporting bias, 37% for external validity, 42% internal validity bias, 37% for internal validity confounding and a 11% score for power (Appendix Table A2). An overall score of 47% was obtained from all articles (Appendix Table A2). Criteria that were not included in studies were given a score of 0 unless otherwise indicated. In addition, 7 studies included healthy controls while the rest were cross-sectional and included none. Of the 17 studies, 10 (n=10, 59%) studies included patients with neurological, psychiatric, or genetic disorders. Many of the findings identified come from cross-sectional and case control studies with a risk of bias. These studies are both observational and non-randomized, making it difficult to make etiologic or casual statements regarding risk factors effect on variability. Higher quality evidence with a lower risk of bias will be important to the future of this promising and developing field in order to validate present trends in the literature [34,38]. Once studies on BOLD SV present higher quality results in terms of typical and atypical pediatric populations, BOLD SV can be used as an important biomarker for neurodevelopment.
Author Contributions
Conceptualization, M.F.D., D.P., S.D.R, R.E; writing—original manuscript preparation, M.F.D.; writing—review and editing, M.F.D. and D.P.; visualization, M.F.D.; supervision, S.D.R, RE. All authors have read and agreed to the published version of the manuscript.
Funding
This work was supported by the London Health Science Center. No external funding was received. Opinions in this review are from the authors and do not reflect the position of the LHSC.
Protocol Registration
A review protocol was not registered, though it was prepared. No amendments were made at this time.
Conflicts of Interest
The authors declare no conflict of interest.
Appendix Table.2.
This modified Downs and Blacks checklist, 27 questions were used to score the risk of bias for each article, in each section, and to estimate an overall risk of bias. Item 27 was given no points if the studies power was not reported. This Table uses an “X” to identify a cell that cannot be filled with valid information.
References
- Bray, S. Age-associated patterns in gray matter volume, cerebral perfusion and BOLD oscillations in children and adolescents. Hum. Brain Mapp. 2017, 38, 2398–2407. [Google Scholar] [CrossRef] [PubMed]
- Easson AK, McIntosh AR. BOLD signal variability and complexity in children and adolescents with and without autism spectrum disorder. Developmental Cognitive Neuroscience. 2019, 36, 100630. [Google Scholar] [CrossRef] [PubMed]
- Thompson A, Schel MA, Steinbeis N. Changes in BOLD variability are linked to the development of variable response inhibition. Neuroimage 2021, 228, 117691. [Google Scholar] [CrossRef] [PubMed]
- Roberts RP, Grady CL, Addis DR. Creative, internally-directed cognition is associated with reduced BOLD variability. NeuroImage. 2020, 219, 116758.. [CrossRef]
- Zöller D, Schaer M, Scariati E, Padula MC, Eliez S, Van De Ville D. Disentangling resting-state BOLD variability and PCC functional connectivity in 22q11.2 deletion syndrome. Neuroimage. 2017, 149, 85–97.. [CrossRef]
- Malins JG, Pugh KR, Buis B, et al. Individual Differences in Reading Skill Are Related to Trial-by-Trial Neural Activation Variability in the Reading Network. J. Neurosci 2018, 38, 2981–2989. [CrossRef] [PubMed]
- Nomi JS, Bolt TS, Ezie CEC, Uddin LQ, Heller AS. Moment-to-Moment BOLD Signal Variability Reflects Regional Changes in Neural Flexibility across the Lifespan. J. Neurosci 2017, 37, 5539–5548. [CrossRef]
- Mulligan RC, Kristjansson SD, Reiersen AM, Parra AS, Anokhin AP. Neural correlates of inhibitory control and functional genetic variation in the dopamine D4 receptor gene. Neuropsychologia 2014, 62, 306–318. [Google Scholar] [CrossRef]
- Zhang J, Cheng W, Liu Z, et al. Neural, electrophysiological and anatomical basis of brain-network variability and its characteristic changes in mental disorders. Brain 2016, 139, 2307–2321. 2321. [CrossRef]
- Zöller D, Padula MC, Sandini C, et al. Psychotic symptoms influence the development of anterior cingulate BOLD variability in 22q11.2 deletion syndrome. Schizophr. Res. 2018, 193, 319–328. [Google Scholar] [CrossRef]
- Dona O, Hall GB, Noseworthy MD. Temporal fractal analysis of the rs-BOLD signal identifies brain abnormalities in autism spectrum disorder. PLoS ONE 2017, 12, e0190081. [CrossRef] [PubMed]
- Jacobs J, Hawco C, Kobayashi E, et al. Variability of the hemodynamic response as a function of age and frequency of epileptic discharge in children with epilepsy. Neuroimage. 2008, 40, 601–614. [Google Scholar] [CrossRef] [PubMed]
- Seidel M, Geisler D, Borchardt V, et al. Evaluation of spontaneous regional brain activity in weight-recovered anorexia nervosa. Transl. Psychiatry 2020, 10, 395. [CrossRef] [PubMed]
- 14. Anderson JS, Zielinski BA, Nielsen JA, Ferguson MA. Complexity of low-frequency blood oxygen level-dependent fluctuations covaries with local connectivity. Hum. Brain Mapp 2013, 35, 1273–1283. [CrossRef]
- Dona O, Noseworthy MD, DeMatteo C, Connolly JF. Fractal Analysis of Brain Blood Oxygenation Level Dependent (BOLD) Signals from Children with Mild Traumatic Brain Injury (mTBI). PLoS ONE 2017, 12, e0169647. [CrossRef] [PubMed]
- Wang H, Ghaderi A, Long X, Reynolds JE, Lebel C, Protzner AB. The longitudinal relationship between BOLD signal variability changes and white matter maturation during early childhood. NeuroImage 2021, 242, 118448. [Google Scholar] [CrossRef] [PubMed]
- 17. Zheng X, Sun J, Lv Y, et al. Frequency-specific alterations of the resting-state BOLD signals in nocturnal enuresis: an fMRI Study. Sci. Rep 2021, 11, 12042. [CrossRef]
- Ke J, Zhang L, Qi R; et al. Altered blood oxygen level-dependent signal variability in chronic post-traumatic stress disorder during symptom provocation. Neuropsychiatr. Dis. Treat. 2015. [CrossRef]
- Zöller D, Padula MC, Sandini C; et al. Psychotic symptoms influence the development of anterior cingulate BOLD variability in 22q11.2 deletion syndrome. Schizophr. Res. 2018. [Google Scholar] [CrossRef]
- Garrett DD, Kovacevic N, McIntosh AR, Grady CL. The Importance of Being Variable. J. Neurosci. 2011. [Google Scholar] [CrossRef]
- Garrett DD, Kovacevic N, McIntosh AR, Grady CL. Blood Oxygen Level-Dependent Signal Variability Is More than Just Noise. J. Neurosci. 2010, 30, 4914–4921. [Google Scholar] [CrossRef] [PubMed]
- Spalatro A V., Amianto F, Huang Z; et al. Neuronal variability of Resting State activity in Eating Disorders: Increase and decoupling in Ventral Attention Network and relation with clinical symptoms. Eur. Psychiatry 2019. [Google Scholar] [CrossRef]
- Nomi JS, Schettini E, Voorhies W, Bolt TS, Heller AS, Uddin LQ. Resting-state brain signal variability in prefrontal cortex is associated with ADHD symptom severity in children. Front. Human. Neurosci. 2018. [CrossRef]
- Pur DR, Eagleson RA, de Ribaupierre A, Mella N, de Ribaupierre S. Moderating Effect of Cortical Thickness on BOLD Signal Variability Age-Related Changes. Front. Aging Neurosci. 2019. [CrossRef]
- Nomi JS, Bolt TS, Ezie CEC, Uddin LQ, Heller AS. Moment-to-Moment BOLD Signal Variability Reflects Regional Changes in Neural Flexibility across the Lifespan. J. Neurosci. 2017, 37, 5539–5548. [Google Scholar] [CrossRef] [PubMed]
- Thompson A, Schel MA, Steinbeis N. Changes in BOLD variability are linked to the development of variable response inhibition. Neuroimage 2021, 228, 117691. [Google Scholar] [CrossRef]
- Garrett DD, Samanez-Larkin GR, MacDonald SWS, Lindenberger U, McIntosh AR, Grady CL. Moment-to-moment brain signal variability: A next frontier in human brain mapping? Neurosci. Biobehav. Rev. 2013, 37, 610–624. [Google Scholar] [CrossRef]
- Wang H, Ghaderi A, Long X, Reynolds JEE, Lebel C, Protzner ABB. The longitudinal relationship between BOLD signal variability changes and white matter maturation during early childhood. NeuroImage 2021, 242, 118448. [Google Scholar] [CrossRef]
- Zou QH, Zhu CZ, Yang Y; et al. An improved approach to detection of amplitude of low-frequency fluctuation (ALFF) for resting-state fMRI: Fractional ALFF. J. Neurosci. Methods 2008, 172, 137–141. [Google Scholar] [CrossRef]
- Page MJ, McKenzie JE, Bossuyt PM; et al. The PRISMA 2020 statement: An updated guideline for reporting systematic reviews. BMJ 2021, 372, n71. [Google Scholar] [CrossRef]
- Downs SH, Black N. The feasibility of creating a checklist for the assessment of the methodological quality both of randomised and non-randomised studies of health care interventions. J. Epidemiol. Community Health 1998, 52, 377–384. [Google Scholar] [CrossRef]
- Easson AK, McIntosh AR. BOLD signal variability and complexity in children and adolescents with and without autism spectrum disorder. Dev. Cogn. Neurosci. 2019, 36, 100630. [Google Scholar] [CrossRef]
- Roberts RP, Grady CL, Addis DR. Creative, internally-directed cognition is associated with reduced BOLD variability. NeuroImage 2020, 219, 116758. [Google Scholar] [CrossRef]
- Zöller D, Padula MC, Sandini C; et al. Psychotic symptoms influence the development of anterior cingulate BOLD variability in 22q11.2 deletion syndrome. Schizophr. Res. 2018, 193, 319–328. [Google Scholar] [CrossRef]
- Zöller D, Schaer M, Scariati E, Padula MC, Eliez S, Van De Ville D. Disentangling resting-state BOLD variability and PCC functional connectivity in 22q11.2 deletion syndrome. Neuroimage 2017, 149, 85–97. [Google Scholar] [CrossRef]
- Seidel M, Geisler D, Borchardt V; et al. Evaluation of spontaneous regional brain activity in weight-recovered anorexia nervosa. Transl. Psychiatry 2020, 10, 395. [Google Scholar] [CrossRef]
- Wang H, Ghaderi A, Long X, Reynolds JE, Lebel C, Protzner AB. The longitudinal relationship between BOLD signal variability changes and white matter maturation during early childhood. NeuroImage 2021, 242, 118448. [Google Scholar] [CrossRef]
- Anderson JS, Zielinski BA, Nielsen JA, Ferguson MA. Complexity of low-frequency blood oxygen level-dependent fluctuations covaries with local connectivity. Hum. Brain Mapp. 2013, 35, 1273–1283. [Google Scholar] [CrossRef]
- Malins JG, Pugh KR, Buis B; et al. Individual Differences in Reading Skill Are Related to Trial-by-Trial Neural Activation Variability in the Reading Network. J. Neurosci. 2018, 38, 2981–2989. [Google Scholar] [CrossRef]
- Zhang J, Cheng W, Liu Z; et al. Neural, electrophysiological and anatomical basis of brain-network variability and its characteristic changes in mental disorders. Brain 2016, 139, 2307–2321. [Google Scholar] [CrossRef]
- Mulligan RC, Kristjansson SD, Reiersen AM, Parra AS, Anokhin AP. Neural correlates of inhibitory control and functional genetic variation in the dopamine D4 receptor gene. Neuropsychologia 2014, 62, 306–318. [Google Scholar] [CrossRef]
- Dona O, Hall GB, Noseworthy MD. Temporal fractal analysis of the rs-BOLD signal identifies brain abnormalities in autism spectrum disorder. PLoS ONE 2017, 12, e0190081. [Google Scholar] [CrossRef]
- Dona O, Noseworthy MD, DeMatteo C, Connolly JF. Fractal Analysis of Brain Blood Oxygenation Level Dependent (BOLD) Signals from Children with Mild Traumatic Brain Injury (mTBI). PLoS ONE 2017, 12, e0169647. [Google Scholar] [CrossRef]
- Bray, S. Age-associated patterns in gray matter volume, cerebral perfusion and BOLD oscillations in children and adolescents. Hum. Brain Mapp. 2017, 38, 2398–2407. [Google Scholar] [CrossRef]
- Zheng X, Sun J, Lv Y; et al. Frequency-specific alterations of the resting-state BOLD signals in nocturnal enuresis: An fMRI Study. Sci. Rep. 2021, 11, 12042. [Google Scholar] [CrossRef]
- Jacobs J, Hawco C, Kobayashi E; et al. Variability of the hemodynamic response as a function of age and frequency of epileptic discharge in children with epilepsy. Neuroimage. 2008, 40, 601–614. [Google Scholar] [CrossRef]
- Richman JS, Lake DE, Moorman JR. Sample Entropy. In: Methods in Enzymology. Vol 384. Numerical Computer Methods, Part E. Academic Press. 2004; pp. 172-184. [CrossRef]
- Raghavendra BS, Dutt DN. Computing Fractal Dimension of Signals using Multiresolution Box-counting Method. 2010, 16.
- Garrett DD, Samanez-Larkin GR, MacDonald SWS, Lindenberger U, McIntosh AR, Grady CL. Moment-to-moment brain signal variability: A next frontier in human brain mapping? Neurosci. Biobehav. Rev. 2013, 37, 610–624. [Google Scholar] [CrossRef]
- Crespi B, Badcock C. Psychosis and autism as diametrical disorders of the social brain. Behav. Brain Sci. 2008, 31, 241–261, discussion 261–320. [Google Scholar] [CrossRef]
- Li SC, Lindenberger U, Bäckman L. Dopaminergic modulation of cognition across the life span. Neurosci. Biobehav. Rev. 2010, 34, 625–630. [Google Scholar] [CrossRef]
- Guitart-Masip M, Salami A, Garrett D, Rieckmann A, Lindenberger U, Bäckman L. BOLD Variability is Related to Dopaminergic Neurotransmission and Cognitive Aging. Cereb. Cortex. 2016, 26, 2074–2083. [Google Scholar] [CrossRef]
- Developmental Psychopathology. 1st ed. John Wiley & Sons, Ltd; 2015. [CrossRef]
- Berry AS, Shah VD, Baker SL; et al. Aging Affects Dopaminergic Neural Mechanisms of Cognitive Flexibility. J. Neurosci. 2016, 36, 12559–12569. [Google Scholar] [CrossRef]
- Alavash M, Lim SJ, Thiel C, Sehm B, Deserno L, Obleser J. Dopaminergic modulation of hemodynamic signal variability and the functional connectome during cognitive performance. NeuroImage 2018, 172, 341–356. [Google Scholar] [CrossRef]
- Goto Y, Otani S, Grace AA. The Yin and Yang of Dopamine Release. Neuropharmacology 2007, 53, 583–587. [Google Scholar] [CrossRef]
- Tu W, Ma Z, Ma Y, Dopfel D, Zhang N. Suppressing Anterior Cingulate Cortex Modulates Default Mode Network and Behavior in Awake Rats. Cereb. Cortex 2021, 31, 312–323. [Google Scholar] [CrossRef]
- Zhou L, Pu W, Wang J; et al. Inefficient DMN Suppression in Schizophrenia Patients with Impaired Cognitive Function but not Patients with Preserved Cognitive Function. Sci. Rep. 2016, 6, 21657. [Google Scholar] [CrossRef]
- Hadders-Algra, M. Early Diagnostics and Early Intervention in Neurodevelopmental Disorders—Age-Dependent Challenges and Opportunities. J. Clin. Med. 2021, 10, 861. [Google Scholar] [CrossRef]
Figure 1.
Preferred Reporting Items for Systematic Reviews and Meta-Analyses (PRISMA) Diagram.
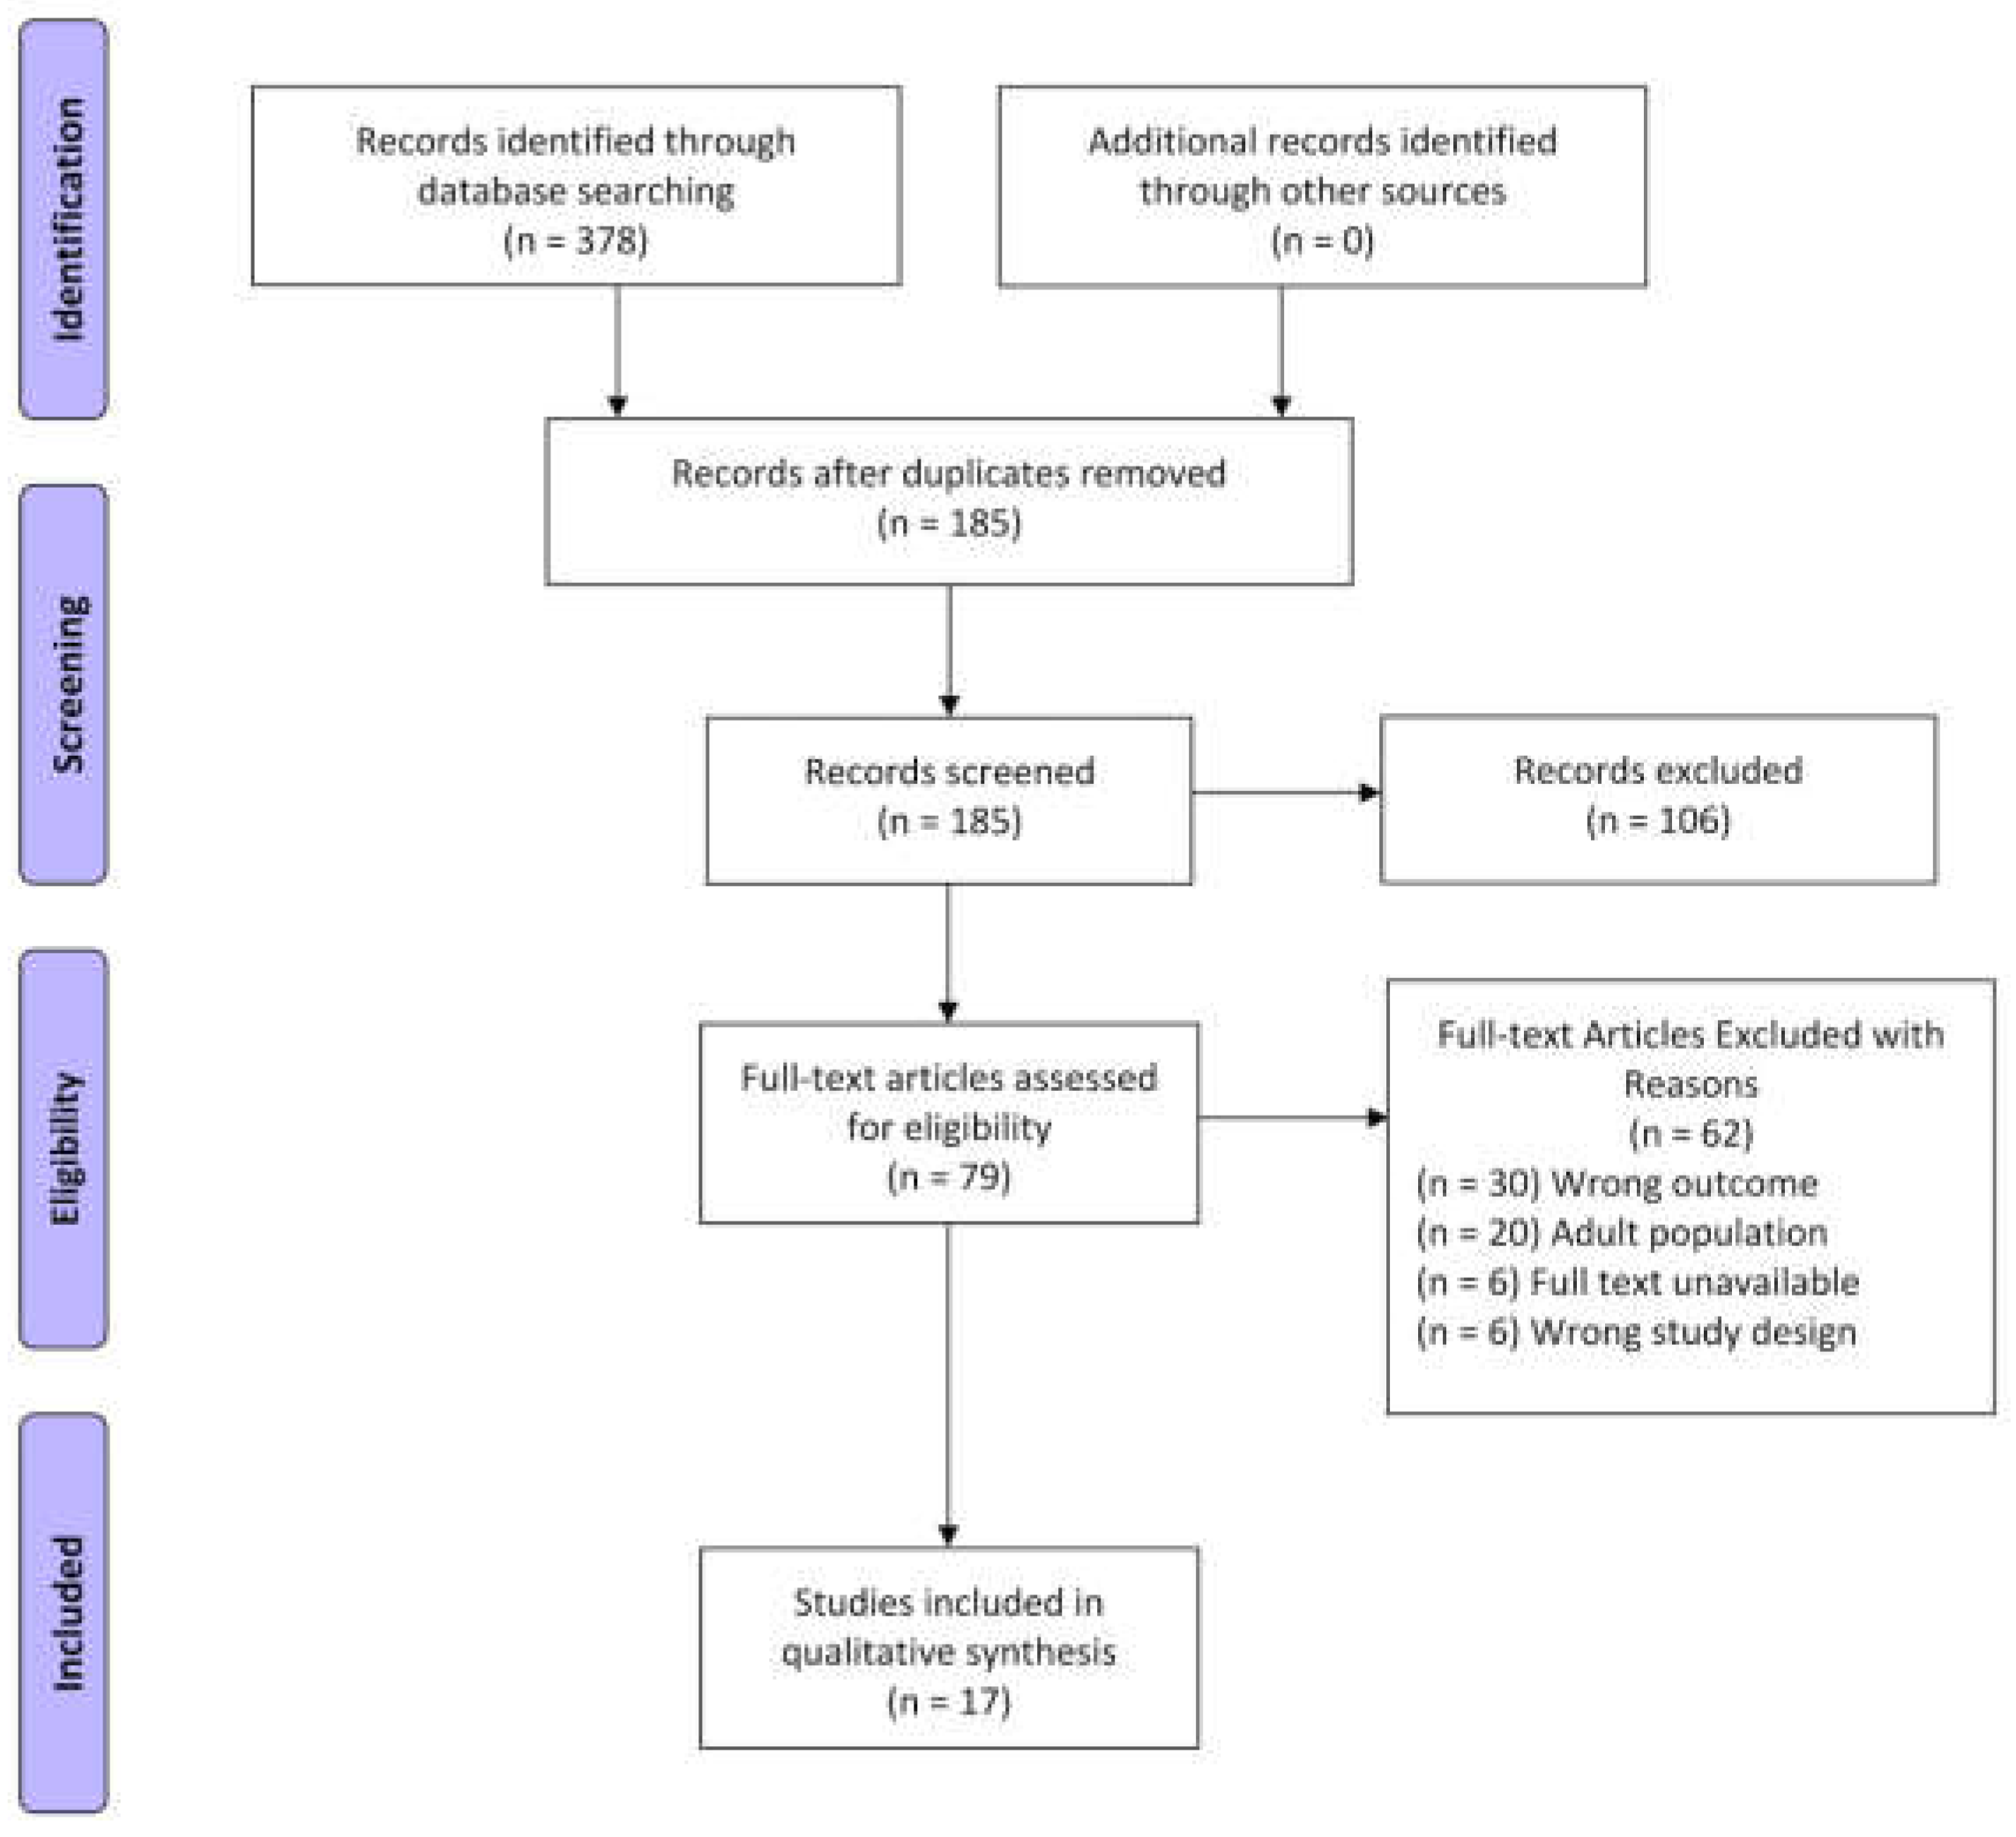
Figure 2.
Summary of BOLD SV Metric Prevalence in the Pediatric Literature. Circles of the same colour belong to a common metric subtype. The area of each circle is proportionate to the number of papers published that utilized the metric. BOLDSD appeared in 6 papers, being the largest circle. Colours were used to indicate metrics belonged to a common subtype of variability (i.e Deviation from Average BOLD Signal).
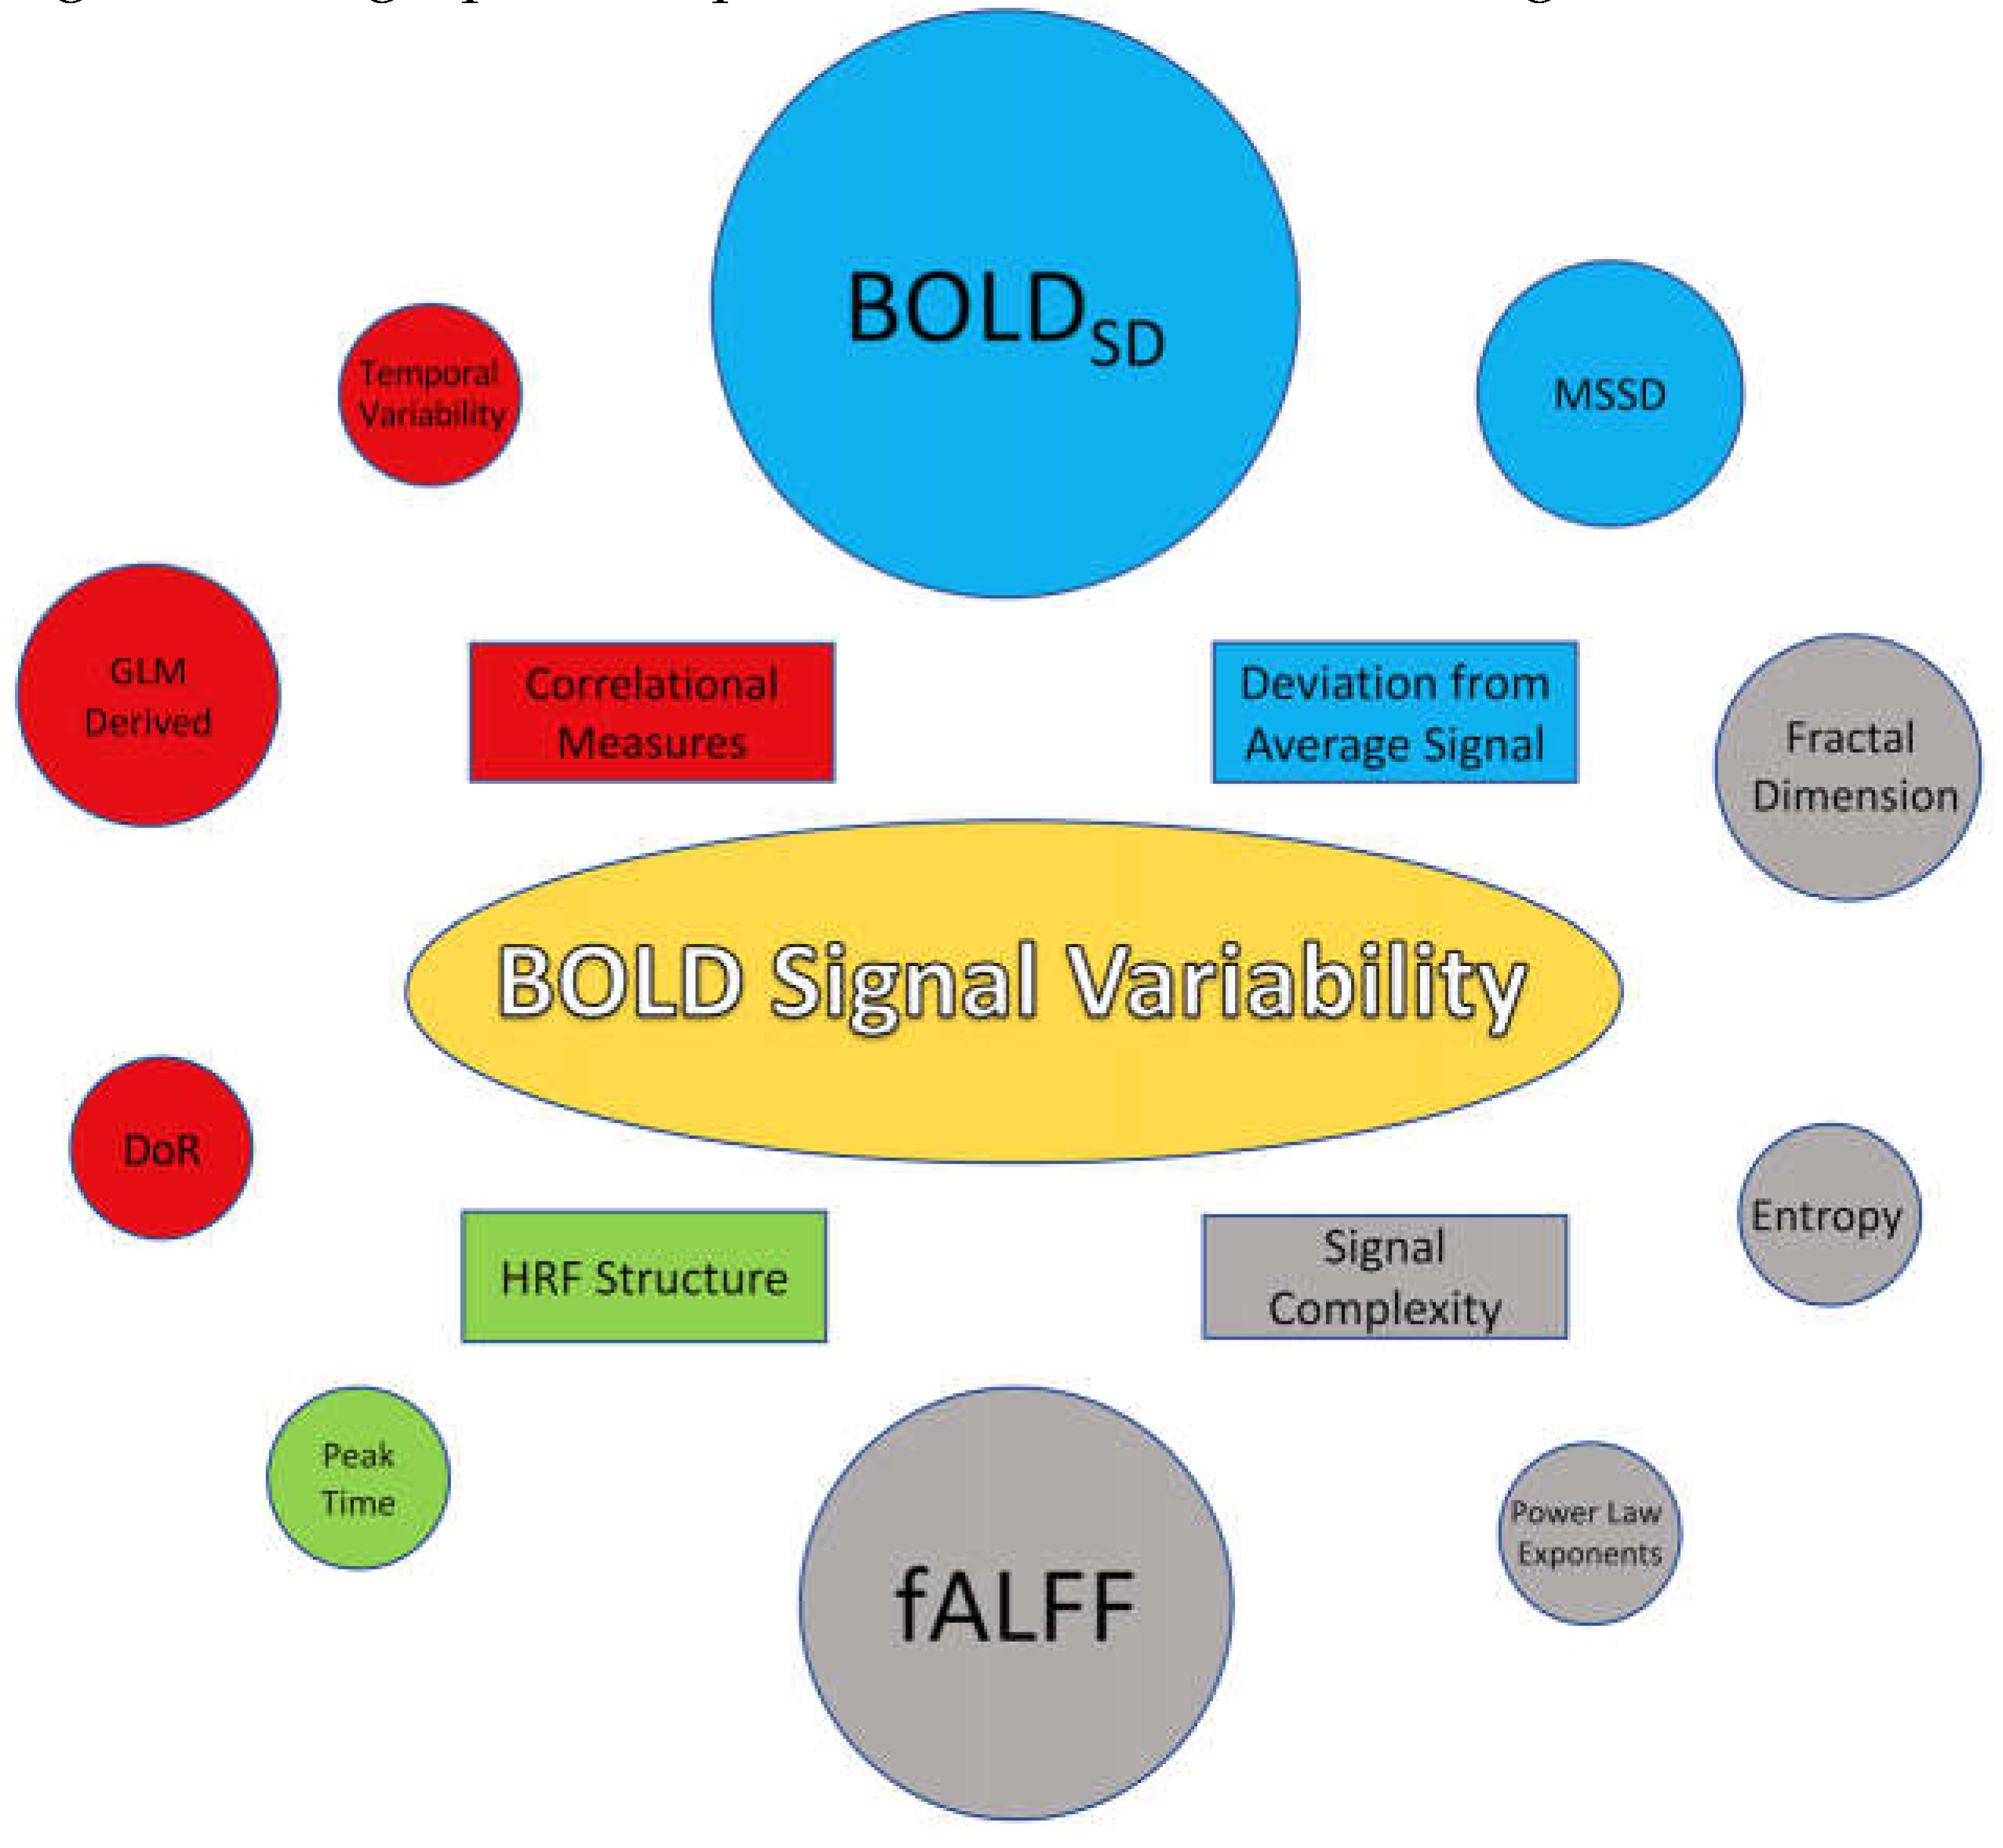
Figure 3.
Reduced or Elevated BOLD SV as a Biomarker of Mental Disorders. When symptom severity scores and other markers of mental and neurological condition severity are present, BOLD SV is often reported as elevated or reduced in regions associated with the condition. Though it has promise as a biomarker, this model is only a representation of trends in the present literature.
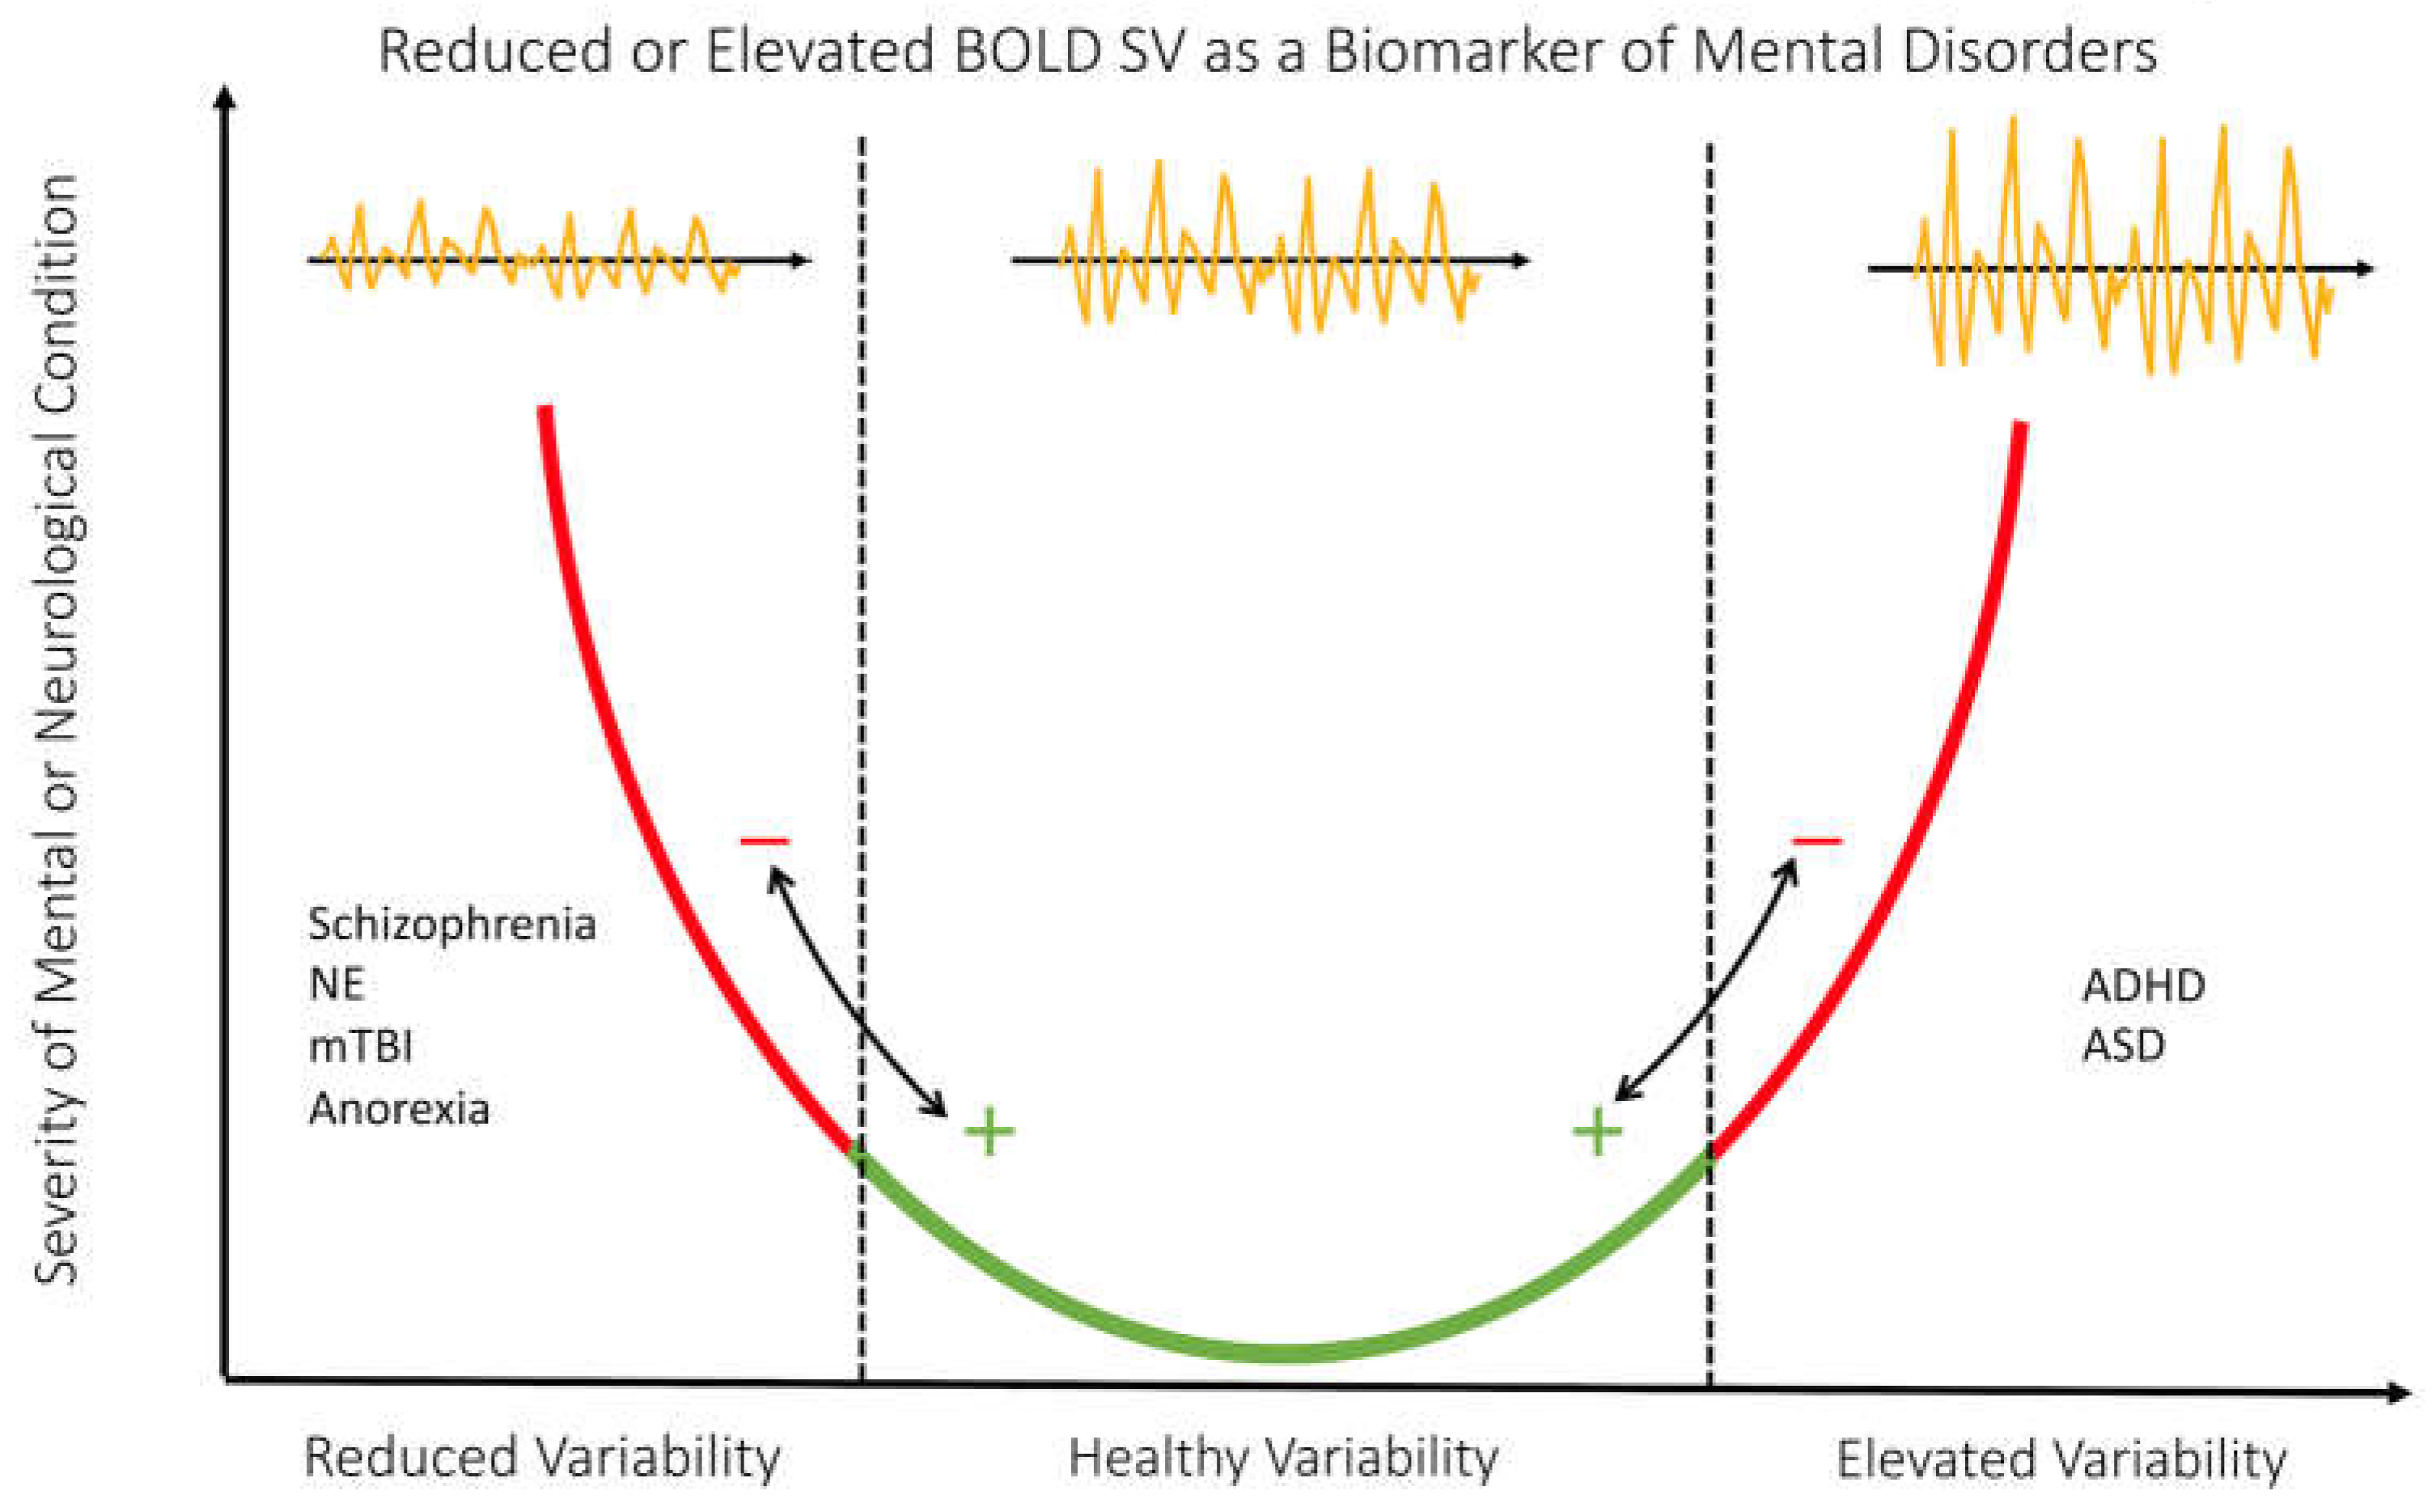

Table 1.
BOLD Signal Variability Study Characteristics.
| Title | Author and Year | Location (Region, Country) | Study Design | Age of Subjects |
Sex | Sample Size | Case definition |
| Age-Associated Patterns in Gray Matter Volume, Cerebral Perfusion and BOLD Oscillations in Children and Adolescents | Bray et al. 2017 | Calgary, Alberta, Canada | Cross-Sectional | Mean= 13.8, SD = 3.12 Range = 7–18 |
Typically developing females = 34 Typically developing males = 25 |
Typically developing = 59 | All participants healthy (No cases) |
| BOLD SV and complexity in children and adolescents with and without autism spectrum disorder | Easson, et al. 2019 | Toronto Ontario Canada | Cross-Sectional | ASD Group Mean = 13.25, SD = 2.87 ASD Group Range = [9.6 – 17.80] Typically Developing Mean = 13.42 SD = 3.21 Typically Developing Range [8.10 – 17.60] |
ASD Males= 20 Typically Developing Males = 17 |
ASD = 20 Typically Developing = 17 Total Sample Size = 37 |
Autism spectrum disorder was defined by the Autism Brain Imaging Data Exchange (ABIDE) II database (Where cases ascertained from) |
| Changes in BOLD variability are linked to the development of variable response inhibition: BOLD variability and variable response inhibition | Thompson et al. 2020 | London UK | Cross-Sectional | Children Range = [10 – 12] Children Mean = 11.56, SD = 0.83 Adult Range = [18 – 26] Adult Mean = 21.55, SD = 2.31 |
Females = 10 Males = 9 |
Children 10-12 = 19 Adults 18-26 = 26 Total = 45 |
All participants healthy (No cases) |
| Creative internally directed cognition is associated with reduced BOLD variability | Roberts,et al. 2020 | Auckland, New Zealand | Cross-Sectional | Range = [17-25] Mean = 21 years, SD = 4 years |
8 Males and 16 Females | 24 typically developing | All participants healthy (No cases) |
| Disentangling resting-state BOLD variability and PCC functional connectivity in 22q11.2 deletion syndrome | Zöller et al. 2017 | Geneva Switzerland | Case Control | 22q11.2 Gene Age Range = [9.0-24.8] Mean 22q11.2 Gene Age = 16.53 ± 4.25 Control Group Age Range = [9.5 - 24.9] Mean Control Group Age = 16.44 ± 4.20 |
Males = 21 Females = 29 |
Healthy Controls = 50 (22/28) 2q11.2DS = 50 (21/29) Total = 100 |
50 patients with 22q11.2DS, which is a specific type of microdeletion in chromosome 22 |
| Individual Differences in Reading Skill Are Related to Tiral-by-Trial Neural Activation Variability in the Reading Network | Malins et al. 2017 | United States | Cross-Sectional | Discovery Sample Range = [7.8 – 11.3] Discovery Sample Mean = 9.3, SD = 0.6 Confirmation Sample Range = [7.5 – 11.3] Cnfirmation Sample Mean = 9.4, SD = 1.1 |
Sample 1 females: 18 female Sample 1 males: 26 male Sample 2 females: 14 female Sample 2 males: 18 males |
Sample 1 = 44 Sample 2 = 32 Total = 76 |
All participants healthy (No cases) |
| Moment-to-Moment BOLD Signal Variability Reflects Regional Changes in Neural Flexibility across the Lifespan | Nomi et al 2017 | Miami, Florida USA | Cross-Sectional | Slow repetition time Range = [6–85] Slow repetition time Mean = 42.26, SD = 23.60 Fast repetition time Range = [6–85] Fast repetition time Mean = 42.46, SD = 23.30 |
191 participants, 132 Female, 59 male | 191 Particpants | All participants healthy (No cases) |
| Neural correlates of inhibitory control and functional genetic variation in the dopamine D4 receptor gene | Mulligan et al. 2014 | Alberta, Canada | Cross-Sectional | All Participants are 18 | Female population = 33 Male population = 29 |
7R+ = 23 7R- control = 39 Total = 62 |
(R7+) group (dopamine D4 receptor gene (DRD4) with 7 repeats in the Variable Number of Tandem Repeats section (VNTR) of DRD4) |
| Neural, electrophysiological and anatomical basis of brain-network variability and its characteristic changes in mental disorders | Zhang et al. 2016 | Nanjing, PR, China | Case Control | Total Study Age Range = [8-52] UM Sample Controls = 15.1 +/- 3.7 Autism = 3.6 +/- 2.4 Peking University-PKU Sample Controls = (11.4 +/- 1.9) ADHD = (12.1 +/- 2.0) New York University-NYU Controls = (12.2 +/- 3.1) ADHD = (12.2 +/-13.1) |
Autism UM dataset controls = (48/16) Autism UM dataset Autism = (31/7) ADHD PKU dataset controls = (84/59) ADHD PKU dataset ADHD = (89/10) ADHD NYU dataset controls = (54/54) ADHD NYU dataset ADHD = (106/34) |
Autism MU dataset controls = 64 Autism MU dataset Autism = 38 ADHD PKU dataset controls = 143 ADHD PKU dataset ADHD = 99 ADHD NYU dataset controls = 108 ADHD NYU dataset ADHD = 140 Total = 592 (we only use a subset of 1180 total in this study due to age exclusions) |
Schizophrenia case definition as defined by: [Dataset 1: Taiwan (Guo et al., 2014); Dataset 2: COBRE], Autism case definition as defined by: (Dataset 3: New York University-NYU; and Dataset 4: University of Melbourne-UM, which are from ABIDE Consortium) and ADHD case definition (Dataset 5: Peking University-PKU; and Dataset 6: New York University-NYU, which are part of the 1000 Functional Connectome Project) |
| Psychotic symptoms influence the development of anterior cingulate BOLD variability in 22q11.2 deletion syndrome | Zöller et al. 2017 | Geneva Switzerland | Case-Control | Between 10 and 30 years old | PS+ = 28 (12/16) PS - = 29 (14/15) Healthy controls = 69 (30/39) |
22q11.2 gene = 57 Healthy Controls = 69 Total = 126 |
Chromosome 22q11.2 deletion syndrome (22q11DS) is a neurodevelopmental disorder associated with a broad phenotype of clinical, cognitive, and psychiatric features. It is a specific type of microdeletion in chromosome 22 |
| Temporal fractal analysis of the rs-BOLD signal identifies brain abnormalities in autism spectrum disorder | Dona et al. 2017 | Austin, Texas, United States | Case-Control | ASD (12.7 ± 2.4 y/o) 55 age-matched (14.1 ± 3.1 y/o) healthy controls |
ASD = 46 male and 9 females, Healthy controls = 38 male and 9 females. |
ASD = 55 Healthy Control = 55 Total = 110 |
ASD and age matched controls. Definition of ASD defined by NITRC database and the ABIDE project |
| Variability of the hemodynamic response as a function of age and frequency of epileptic discharge in children with epilepsy | Jacobs et al. 2007 | Germany and Montreal Canada | Cross-Sectional | Range = [5 months - 18 years] (Mean and SD not calculated) | 12 Female, 25 Male | 37 | Epilepsy, case definition of epilepsy not explicit but EEG-fMRI data were only acquired in children who fulfilled the following criteria: 1) indication for an anatomical scan on the basis of the necessity to investigate a lesion seen on a prior anatomical MRI scan or to diagnose their epilepsy syndrome and exclude pathological changes, and 2) frequent spikes (N 10 in 20 min) recorded on routine EEG outside the scanner, without occurrence in bursts. |
| Evaluation of spontaneous regional brain activity in weight-recovered anorexia nervosa | Seidel et al. 2020 | Germany | Case Control Study | Total Study Range = 15.5–29.7 recAN Mean = 22.06, SD = 3.38 HC Mean = 22.05, SD = 3.34 |
Healthy Control = 65 Female recAN = 65 female |
Healthy Control = 65 recAN = 65 Total = 130 |
Recovered Anerexia Nervosa (Weight Recovered). Defined as recAN subjects had to (1) maintain a body mass index (BMI) (kg/m2) > 18.5 (if older than 18 years) or above the 10th age percentile (if younger than 18 years); (2) men- struate; and (3) have not binged, purged, or engaged in restrictive eating patterns during at least 6 months before the study. |
| Complexity of low-frequency blood oxygen level-dependent fluctuations covaries with local connectivity | Anderson et al. 2013 | N/A | Cross-Sectional | Range = [7–30] Mean = 8.3, SD = 5.6 |
Male = 590 Female = 429 |
1019 | Not Specified |
| Fractal Analysis of Brain Blood Oxygenation Level Dependent (BOLD) Signals from Children with Mild Traumatic Brain Injury (mTBI) | Dona et al. 2017 | N/A | Cross-Sectional | mTBI Subjects = 13.4 ± 2.3 Age-matched Healthy Controls = 13.5 ± 2.34 |
N/A | mTBI = 15 Healthy Control = 56 Total = 71 |
Case Control |
| The longitudinal relationship between BOLD signal variability changes and white matter maturation during early childhood | Wang et al. 2021 | Canada and Australia | Cross-Sectional | Range = 1.97–8.0 years Mean age at intake = 4.42 ± 1.27 |
Females = 43 Males = 40 |
83 | Cross-Sectional so None |
| Frequency-specific alterations of the resting-state BOLD signals in nocturnal enuresis: an fMRI Study | Zheng et al. 2021 | China | Case Control | Range approx = [7-12] NE Patients 9.27(± 1.760) Control 9.68(± 1.601) |
NE males = 57 NE Females = 14 Control Males = 19 Control Females = 16 |
Children with nocturnal enuresis (NE) = 129 Healthy controls = 37 |
Case Control |
Abbreviations: BOLD, Blood oxygen level dependant; SV, signal variability; BOLDSD, blood oxygen level dependant standard deviation, GMV, gray matter volume; fALLF fractional amplitude of low frequency fluctuations; ASD, autism spectrum disorder; DRD4, Dopamine Receptor D4; VNTR, Variable Number of Tandem Repeats; VNTR 7-repeats present, 7R+; No VNTR 7-repeats present, 7R-; ADHD, attention deficit hyperactive disorder; recAN weight-recovered anorexia; acAN, acute anorexia; fMRI, functional magnetic resonance imaging; resting state, rs; recovered anorexia, recAN; MSSD, mean square successive difference; mTBI, mild traumatic brain injury, NE, nocturnal enuresis.
Table 2.
Classification of BOLD Signal Variability Metrics.
| Metric Type | Authors | Variability Metric | Description | Findings and Associations |
|---|---|---|---|---|
| Deviation from Average BOLD Signal | (Roberts et al. 2020 Zöller et al. 2017, Zöller et al. 2018, Wang et al. 2021, Anderson et Al. 2013) | BOLDSD | Quantified the deviation of average BOLD signal from the mean signal. | BOLD Signal variability globally increased with age in all metrics (some regions decrease) BOLD variability in dACC did not change over age in PS+ patients and increased in PS−. Variability increased with age in the DMN. Positively correlated with GE in structural networks and negatively correlated with performance in ASD behavioral severity (SRS). Negative associations with indexes of creativity |
| (Nomi et al. 2017a, Seidel et al. 2020 Amanda K. Easson and McIntosha 2019) | MSSD | Calculated by subtracting the amplitude of the signal at time point t from time point t + 1, squaring, and then averaging the resulting values from the entire voxel time course. | ||
| Correlational Measures of BOLD Signal Variance | (Zhang et al. 2016) | Temporal Variance | The BOLD time series were segmented into non-overlapping windows, a whole brain signal measure is obtained using Pearson correlation, and a region’s variability is compared to others. | Lower variability of DMN in schizophrenia, and increased variability in Autism/ADHD. Changes in variability were closely related to symptom scores and in the 10% most variable regions. Variability increases with age in the inhibition network. More variability in the network was associated with less variability in behavioral performance. Low variability in the DMN was correlated with high FC. Lower variability in 7R+ when compared to 7R- when participants successfully inhibited a prepotent motor response. Primarily seen in the prefrontal cortex, occipital lobe, and cerebellum. |
| (Malins et al. 2018, and Mulligan et al. 2014) | GLM Derived Variance | GLM produced trial β series estimates of the signal which was used to estimate a variance. | ||
| (Thompson et al. 2021) | Differences of Residuals | The difference in the variability between the two residual models. | ||
| Signal Complexity | Amanda K. Eassona and McIntosha 2019 | Sample Entropy | SE was used in identifying repetitive patterns in a time series. The degree of regularity of these patterns of activation were also observed, with fewer complex signals are more random. | Positive correlations were identified between entropy, GE and age. Negative correlations with SRS severity scores and FD in social and non-social tasks, ADIR and ADOS. Grey matter rs-BOLD FD in mTBI patients had reduced FD. Power law exponents remained unchanged or decreased with age and are linearly related to ReHo, which covaried across subjects and gray matter regions. Grey matter rs-BOLD FD in mTBI patients had reduced FD. The fALFF increased with age, distinguishing posterior, and anterior regions. Higher fALFF values in recAN patient’s cerebellum and the inferior temporal gyrus compared to controls. The fALFF decreased in the right insula in children with NE. |
| (Dona et al. 2017a and Dona et al. 2017b) | Fractal Dimension | Measure of the structural complexity of a signal derived from hurst exponents and quantified structural complexity across different predefined time windows. | ||
| (Anderson et al. 2013) | Power Law Exponents | Power based index of sinusoidal amplitudes in the BOLD signal. Signal that follows fractal characteristics that were self-similar within and across frequencies over a time series were measured. | ||
| (Seidal et al. 2020, Zheng et al. 2021, Bray 2017) | Fractional amplitude of low-frequency fluctuations (fALFF) | The ratio of the low frequency power spectrum, specifically in the range of 0.01–0.08 Hz, to the entire signal frequency range. | ||
| Structure of Hemodynamic Response Function | (Jacobs et al. 2008) | HRF Structure | Using the structure of the HRF, like peak time, amplitude or other signal characteristics not mentioned above. | Could not identify an age specific HRF. Longer peak times of the HRF 0 to 2 yrs. |
Abbreviations: BOLD, Blood oxygen level dependent; BOLDSD, blood oxygen level dependent standard deviation; fALLF fractional amplitude of low frequency fluctuations; ASD, autism spectrum disorder; ADHD, attention deficit hyperactive disorder; FD, fractal dimension; HRF, hemodynamic response function; HRF, hemodynamic response function; recAN weight-recovered anorexia; acAN, acute anorexia; ReHo, regional homogeneity fMRI, functional magnetic resonance imaging; resting state, rs; recovered anorexia, recAN; MSSD, mean square successive difference; mTBI, mild traumatic brain injuryA total of eight studies measured variability as a deviation from the mean BOLD signal time series [8,15,16,17,18,19,20,21]. Of these, five studies utilized BOLDSD as a measure of variability [16,17,18,20,21] and, three used mean sample standard deviation (MSSD) [8,15,19] of the BOLD signal. In addition, four studies utilized correlational metrics to quantify the variability in the BOLD Signal [9,22,23,24]. This included two articles producing a beta series derived from linear modeling or regression to quantify variability [22,24], and one with a difference of residuals-based calculation9. Seven studies were identified that used a complexity-based metric of BOLD SV [15,19,21,25,26,27,28]. Of these, three used Fractional amplitude of low-frequency fluctuation (fALFF) as a metric of variability [19,27,28], two used fractal density (FD) [25,26], 1 used sample entropy (SE) [15] and 1 used power law exponents [21]. Finally, only 1 study used changes in key features of the hemodynamic response as a measure of variability [29]. Figure 2 is a graphical representation of the four categories of variability metrics.
Disclaimer/Publisher’s Note: The statements, opinions and data contained in all publications are solely those of the individual author(s) and contributor(s) and not of MDPI and/or the editor(s). MDPI and/or the editor(s) disclaim responsibility for any injury to people or property resulting from any ideas, methods, instructions or products referred to in the content. |
© 2023 by the authors. Licensee MDPI, Basel, Switzerland. This article is an open access article distributed under the terms and conditions of the Creative Commons Attribution (CC BY) license (http://creativecommons.org/licenses/by/4.0/).
Copyright: This open access article is published under a Creative Commons CC BY 4.0 license, which permit the free download, distribution, and reuse, provided that the author and preprint are cited in any reuse.


