1. Introduction
Since the late 1980s,there has been a frenzy of mergers and acquisitions in which brands have played a major role, brand equity marketing has been looked at and a comprehensive model of global brand equity has been proposed (Reza Motameni, Manuchehr Shahrokhi, 1998). In the US and UK, trade shows are a multi-billion dollar business, but little is known about the determinants of trade show effectiveness. In the 1990s, trade shows performance was proposed and a model was constructed to examine the differences in trade show effectiveness across industries, companies and between the US and UK (MG Dekimpe, P Francois,1997). At the beginning of the 21st century,exhibition events' value in the centre of museums marketing and destination marketing continues to receive attention, providing an effective trademark to address museum positioning and suggesting factors to consider when constructing a standardised evaluation model for exhibitions (C Scott, 2000; J Carlsen, D Getz, G Soutar, 2000). After brands were developed by consumer companies, the concept of brand equity gained a new interpretation in a specific industrial marketing context, and the sources of brand equity, appropriate communication strategies and the relative importance of brands also gained research and attention (M Bendixen, KA Bukasa, R Abratt,2004).
Since the beginning of the 21st century, the exhibitions industry has become an important part of the Chinese economy. However, the lack of brands of many emerging trade shows has become a serious obstacle to their development. How to discover the success factors of trade shows and their synergistic mechanisms, and accordingly propose practical brand building strategies, have become hot and difficult issues in the exhibitions industry. Participation in trade shows (TSs) has become an increasingly important marketing activities for many companies, and a model comprising four dimensions (i.e. information gathering, relationship building, image building and incentive activities) has been developed to assess exhibitors' perceptions of their TS performance, based on a taxonomy of control systems based on outcomes and behaviours in the marketing literatures (K Hansen, 2004). 125 papers (from 1927 to 2016) in the review study by Sarmento, C Simões (2016) were grouped into the following themes: 1) trade shows participation and outcomes; 2) trade shows marketing and management, and 3) structural significance of trade shows. Researchers are guided to further understand the thematic and structural significance of trade shows, thus providing a coherent and robust body of theory for academics and practitioners. There are three existing research approaches to trade shows brand assessment. The first is the museum brand equity model, where Chyong-Ru Liu, Han-Kuei Liu, Wei-Rong Lin (2013) first proposed a museum brand equity model from a customer perspective. The second is a conceptual model of service brand equity, which uses the exhibition industry as an example of a highly international competitive environment (Anja Geigenmüller, Harriette Bettis-Outland, 2012). The third is the exhibition brand preference model, the exhibition brand preference model or structural equation model (SEM) evaluates a structural model with two pathways: 1) from relationship quality to exhibition brand preference, and 2) from destination attractiveness to exhibition brand preference (Jin, Xin, 2011; X Jin, K Weber, 2013).
Although the above assessment models provide an important reference for exhibitors and investors in their decision making, they do not really address the issue of B2B exhibition brand assessment, especially investment value estimation, and do not answer the differences between B2C and B2B brands(B Österle,MM Kuhn, J Henseler,2018). A comprehensive B2B brand building model does not exist, nor is there a thorough empirical study to illustrate the applicability of a complete brand equity model in a B2B context (KAL Kuhn, F Alpert, NKL Pope, 2008). Based on this, this paper focuses comprehensively on B2B exhibition brand value assessment, fully introducing the seven indicators of the Interbrand brand value assessment method (leadership, stability, market, internationality, trends, support and protection), and delving into the B2B exhibition brand value AHP model through a hybrid study. Three core questions will be asked, firstly, are the first level indicators in the B2B exhibition brand value AHP model to be replicated across the board or adapted to the characteristics of the exhibition? Secondly, how are the secondary indicators in the B2B exhibition brand value AHP model selected? Thirdly, how to construct and validate the hierarchy of B2B exhibition brand value AHP model? This paper combines qualitative and quantitative analysis, and constructs the AHP model of B2B exhibition brand value through the expert interview method, guided by the Interbrand brand evaluation model framework. Against the background of the increasing number of project mergers and acquisitions in the international exhibition market, especially in the context of the booming capital market of China's exhibition industry and the encouragement of the branding development of the exhibition industry by Chinese governments at all levels, this paper can provide a scientific and reasonable model path for B2B exhibition brand value assessment, which can provide a decision-making reference for the exhibition mergers and acquisitions in the capital market, as well as a local government exhibition brand promotion behaviour Decision-making tools, exhibition industry coefficients, trend indicators, etc. enrich the perspective of exhibition brand value research.
2. Literature review and conceptual model design
2.1. Exhibition branding research and review
Brand equity or brand value was earlier defined as "added value", the value added by a brand to a given product. A brand is a name, symbol, design or logo that enhances the value of a product beyond its functional use (Jones 1986; Leuthesser 1988). PH Farquhar (1989) examines three ways of acquiring brand equity: self-branding, borrowing and buying. Breiter and Milman (2006) suggest that the venue where an exhibition is held is also an integral part of the exhibition brand, and that the quality of the venue's facilities and services, together with the venue staff, directly affects exhibitor satisfaction and intention to exhibit. Jinxin (2013) traces the research on branding theory from the perspective of exhibition science, arguing that early researchers believed that Yoo Donthu and Lee (2000) point out that brand value is influenced by several factors such as consumer perceived quality, brand loyalty and brand association. Vargo and Lusch’s (2004) point out that the service sector differs from the production sector, in that the logic of branding has shifted from a company providing a product or service to stakeholders co-creating the value of the brand. Jinxin (2013) explores the value components and influencing factors of exhibition brands from a theoretical perspective, suggesting that the exhibition organiser, the exhibition itself, the venue and the destination constitute the brand of the exhibition. ZC Belenioti (2017) proposed the basic components of the brand concept within the museum industry, such as brand equity, brand loyalty and brand resonance.M Petromilli,D Morrison,M Million (2002) built on the concept of branding and proposed the concept of brand architecture as the way in which a company organises, manages and markets its brand. H Dib, A Alhaddad (2014) proposed a model of brand equity that includes four dimensions such as brand awareness, brand trust, perceived quality and brand loyalty.
Camarero,MJ Garrido,E Vicente (2010) proposed to explore the determinants of brand equity for cultural events from the perspective of internal and external visitors, advocating four elements of brand equity (loyalty, brand image, perceived quality and brand value) in arts and cultural events and evaluating them.P Alberca-Oliver ( 2015) explored a multi-stage approach oriented to the DEA model and a non-parametric test to assess the efficiency index of operational trade fairs.JWC Wong,IKW Lai (2018) conducted an empirical study on increasing the value of exhibitions using the three-factor theory.
At this stage, there is no universally accepted definition for the assessment of the brand value of exhibitions. For example, some Chinese scholars believe that exhibition evaluation mainly refers to the evaluation of the operation status, actual effect and the reflection of all parties of the exhibition (Chen Zeyan, 2007). Li Zhiling (2007) points out the reference and limitations of the UFI accreditation model to the evaluation of exhibitions in China, saying that the UFI accreditation standard cannot fully summarise the actual situation and needs of the exhibition industry in China, and that the UFI accreditation model focuses on "accreditation" and there is a difference between accreditation and evaluation.Yang Fangping (2010) constructed an evaluation index system for brand exhibitions from four aspects: recognition and influence of exhibitions, exhibition products and exhibition supporting services. Although the above-mentioned researches have introduced the theory of brand value to analyse exhibition brands, they are all countermeasure qualitative researches
Through combing domestic and foreign literature, this paper finds that:1.the existing researches on exhibition evaluation mainly focus on practical summary,mostly analyzing the gains and losses of exhibition evaluation practice and evaluating exhibition evaluation standards, lacking in-depth and systematic analysis and solution of problems existing in exhibition brand evaluation from a theoretical height.2.the events academic community begins to introduce brand theory to study exhibition, focusing on the definition of the concept of exhibition brand and the research on the countermeasures of exhibition brand construction, with mostly descriptive qualitative research and a lack of empirical and quantitative research.3.The theoretical tools and analytical framework for exhibition brand assessment, especially exhibition brand value assessment, need to be solved.
2.2. Current situation of exhibition brand value assessment
At present, exhibition brand assessment in the international arena is mainly organized and implemented by some exhibition non-governmental organizations. There are three relatively representative ones:
(1) Statistics and audit standards of the exhibition industry of the International Association of the Exhibition Industry (UFI)
UFI is by far the most important international non-governmental organisation in the world exhibition industry. The assessment of UFI is the overall quality assessment of exhibitions, which is to certify the quality of exhibitions, and the certified exhibitions can use the UFI logo, but usually it does not involve the brand value assessment of exhibitions.
(2) Auditing standards of the Exhibition and Event Industry Audit Council (EEIAC)
The Exhibition and Event Industry Audit Commission (EEIAC) is a third party body composed of representatives from US exhibitors and exhibition organisers, whose main responsibility is to audit the audience data of various events. Audit Standards for Trade Shows" and "Audit Standards for Consumer Shows". This audit is similar to the UFI accreditation programme.
(3) Fairs data audit by the German Association for the Voluntary Audit of Trade Fair Statistics (FKM)
The authoritative trade fair evaluation body in Germany is the FKM, known as Gesellschaft zur Freiwilligen Kontrolle vonMesse-und Ausstellungszahlen, whose members are required to report trade fair statistics in accordance with the rules and standards of the FKM and to undergo an audit of the statistics by a special body organised by the FKM. The statistics are audited by a specialised agency of the FKM organisation. Those who have passed the FKM certification will also be allowed to use the unique FKM logo and can receive funding and support from the German government.
Since entering the 21st century, China's exhibition industry has developed rapidly and by 2019, China has grown to become the second largest exhibition market and the number one exhibition market in the world. The practice of Chinese exhibition branding is mainly reflected at two levels:
(1) National level
There are two main standards, one is the Rules for Reviewing Exhibition Data, which was officially released in 2012. This is a recommended national standard. This standard stipulates the basic principles, working procedures, audit scope and audit methods for auditing exhibition statistics, as well as the qualification requirements for auditing institutions and personnel,which is applicable to the audit of exhibition statistics and can also be used as a basis for exhibitors, visitors and other relevant parties to make selection and evaluation of exhibition activities. The second one is the Guidelines on Grading and Assessment of Economic and Trade Fairs proposed by the National Technical Committee for the Standardisation of the Exhibition Industry. The objective of formulating this guideline is to help the government and relevant parties in the industry understand the development status and key positioning of the exhibition industry in the region through the grading of exhibitions, provide data support for the creation of exhibition clusters with distinctive industrial characteristics and regional features, provide guidance direction for the allocation of market resources and guide the healthy and orderly development of the exhibition industry.
(2) Local level
In 2006, Shanghai launched the "Rules for Assessing Shanghai International Exhibition Projects(for Trial Implementation)",which assesses all kinds of international exhibitions that have been approved by the competent government departments and held in the Shanghai area. The promotion of assessment has played a role in promoting the development of Shanghai's exhibition industry, especially for projects certified as Shanghai brand exhibitions,Shanghai quality exhibitions and Shanghai key cultivation exhibitions.In recent years,provinces such as Jiangsu and Guangdong have also carried out institutionalised and standardised assessment of exhibition brands.
Studying the above assessment progress,this paper finds that:1.major countries in Europe and America have representative exhibition assessment standards, which have been promoted and implemented for a long time and are more mature in assessment.2. international mainstream exhibition assessment practice mainly focuses on data certification related to exhibition operation quality, and exhibition brand assessment related to exhibition brand value is not sufficiently developed.3.China's exhibition brand assessment has been explored innovatively to some extent, but it does not meet the requirements of the exhibition capital market and the exhibition industry.There is an urgent need to carry out more targeted exhibition brand value assessment work.
2.3. Conceptual model design for exhibition brand value assessment
The conceptual model of exhibition brand valuation is mainly derived from the Interbrand brand valuation model.R Abratt,G Bick (2003) reviewed the literature on brand valuation, highlighting brand valuation research, barriers and valuation methods for brand valuation, brand valuation and valuation methods, highlighting important but neglected issues such as discount rates, growth rates and useful life.K Janoskova,A Krizanova (2017) compared 12 selected (Apple, Google, Microsoft, Coca-Cola, Facebook, Toyota, IBM, Disney, McDonald's, General Electric, Samsung and Amazon) internationally recognised brand valuation methods and found that Forbes and Interbrand provided the highest relevance of brand value.M Agus Harjoto,J Salas (2017) found that strategic corporate social responsibility can enhance brand value,while irresponsible activities that go against social norms, values and ethics can adversely affect the legitimacy of a company and have a negative impact on changes in brand reputation.A Seetharaman,ZABM Nadzir (2001) found that the four main valuation methods, including the Interbrand brand value assessment model, are dependent on the suitability of the brand conditions for its current use.KL Keller,DR Lehmann (2009) research confirms that brand durability comes from retention of brand consumption by existing customers;brand growth comes from increased consumption by existing customers and future new customers.CP Kirk,I Ray,B Wilson (2013) argues that changes in brand value have a lasting impact on the valuation of a company.E Bagna,G Dicuonzo, A Perrone,V Dell'Atti (2017) analyses the results of a study conducted between 2013 and 2015 by Interbrand, Brand Finance and BrandZ for a sample of 71 brands valued by Interbrand and BrandZ.The results show that brand valuations provided by independent agencies are value-related.L Duguleană, C Duguleană (2014) raises the question of the credibility of the ranking of the best global brands,confirming that brand owners and investors are interested in the potential value of brands and the ranking of global brands.
A further model is Keller's customer-based brand equity model. As defined by Keller (1993),brand equity occurs when a brand is known in consumers' memories and has some strong, favourable and unique associations.Keller (1993) developed a CBBE model similar to Maslow's needs model,with four interlocking steps required to build a strong brand,namely brand identity,brand meaning,brand Reaction,and Brand Relationship.These four steps are made up of six brand building blocks - salience, representation, image, judgement, feeling and resonance.The ultimate goal is to reach the pinnacle of the CBBE pyramid - resonance - where there is a completely harmonious relationship between the customer and the brand.Keller's model facilitates the fine-tuned building of brand equity, has specific adaptations to the context and is not applicable to all B2B industrial sectors (KA Kuhn,F Alpert, 2004).
In a recent study, the brand value of Sberbank in 2019-2020 was calculated by analysing Interbrand's brand equity valuation methodology, comparing selected brand values provided by Interbrand and Brand Finance (Amazon, Google, Apple, Microsoft, Savings Bank). The results of the study show that it is necessary to deal with different brand valuation models, taking into account country and industry specificities and overall needs as well as overall brand valuation objectives, and that there are significant biases and different dynamics in brand value assessment (D Rozhkova, N Rozhkova, D Gonzalez Serna, 2022).
In summary, the existing brand value assessment models have specific objects and applicable environments. As a classic brand value assessment model, the Interbrand brand value assessment model provides a theoretical framework for the analysis of B2B exhibition brand value assessment, and through a hybrid study on the basis of the Interbrand brand value assessment model, the exhibitionization of primary indicators and secondary indicators are explored based on the Interbrand Brand Value Assessment Model, the conceptual model of Shanghai exhibition brand value assessment based on AHP is constructed to provide a reference for the international exhibition brand value assessment in Shanghai, China.
3. Research Methodology
3.1. Research design
This paper constructs and validates the exhibition brand value assessment model through an exploratory mixed research combining qualitative and quantitative approaches.Structured questionnaire interviews are conducted through researching stakeholders such as Shanghai's exhibition management department,exhibition enterprises, venues, exhibitors and visitors to provide descriptive index evidence for the construction of the exhibition brand value assessment model.The quantitative research stage is mainly achieved through six steps, including constructing the index hierarchy, establishing pairwise comparison matrices, calculating the maximum eigenvalues and normalised eigenvectors of each comparison matrix, conducting consistency check, group decision matrix synthesis and assigning weights to the indexes of exhibition brand value assessment.
3.2. Expert interviews and data collection
A Bogner,B Littig,W Menz (2009) in Expert Interviews pointed out that expert interviews as a qualitative empirical research method aimed at developing expert knowledge have been developed significantly since the early 1990s. In scientific research, a person is called an expert because the researcher assumes - for whatever reason - that he or she has knowledge that she or he alone does not necessarily possess, but that is not available to anyone in the field of action under study. Expert interviews are by no means just "information-gathering sessions" used primarily to gather facts and knowledge;they are also a perfectly legitimate method for certain forms of research.When the main purpose of such interviews is not to establish a reliable factual basis, but to follow the core objective of qualitative research: to reconstruct the potential content of meaning, the degree of consideration that must be given to the method increases proportionally.Expert knowledge is characterised by the opportunity to "become hegemonic in an organisational and functional context in the field of practice" and thus "influential in constructing the conditions for action for other actors.
The data collection in this paper is divided into two main steps.In the first step, the seven primary indicators were reinterpreted through in-depth interviews with eleven industry experts, combining the Interbrand brand assessment method and exhibition characteristics, to make them exhibition-specific. The reinterpretation was as follows:
(1) Leadership, i.e. the influence of the exhibition.
(2) Stability, i.e. the sustainability of the exhibition.
(3) Market, i.e. the exhibition is a multilateral market, taking into account both visitors and exhibitors.
(4) Internationality, i.e. the extent to which the exhibition attracts overseas visitors and exhibitors.
(5) Trends, i.e. the future prospects of the exhibition
(6) Support, i.e. the points that can constitute support for the brand of the exhibition.
(7) Protection, i.e. the extent to which the exhibition can apply laws and regulations to protect the rights and interests of the brand.
In the second step, 11 industry experts were interviewed through questionnaire research to construct the secondary indicators of the brand value assessment model from the actual situation of the exhibition. According to the principles of scientificity, reasonableness, groundedness and accessibility of assessment indicators,23 secondary indicators were developed (see
Table 1). The principle of developing indicators is derived from practice and in line with the actual situation, and the principle of screening indicators is that they should be operable and easily accessible.
3.3. Data analysis
The first step is to construct an indicator hierarchy. When dealing with complex issues, using a hierarchical structure to decompose them is conducive to systematic simplification. We can construct the indicator system for brand exhibitions according to the general target layer (A), sub-target layer (B) and specific indicator layer C (
Table 1).
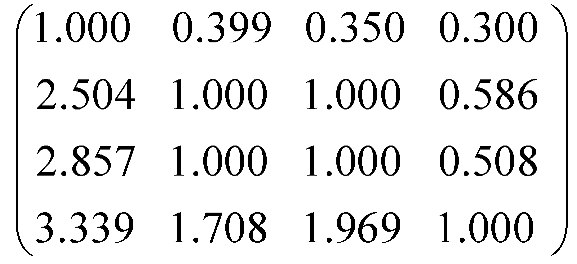
The second step is to establish a paired comparison matrix. Experts from the exhibition industry are invited to compare and assign values to the relative importance between the above two two indicators and construct a pairwise comparison matrix. The current study generally adopts 1-5 and its reciprocal as the evaluation scale to describe the relative importance of each indicator(see
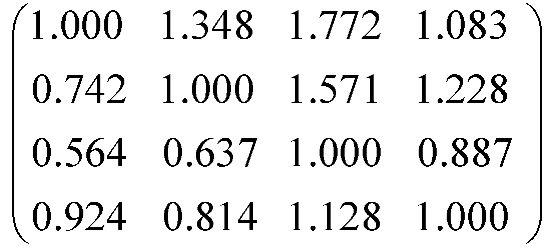
Table 2).The pairwise comparison matrices for each objective were constructed based on the expert assignments (see Table 4)
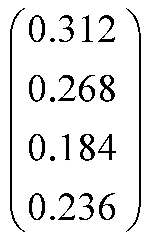
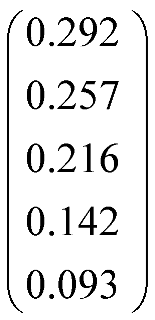
The third step is to calculate the maximum eigenvalues and normalized eigenvectors of each comparison matrix. After establishing the comparison matrix, the maximum eigenvalue and its corresponding eigenvector value can be found by the eigenvalue solution method commonly used in numerical analysis, and then the weights of each stratum element can be found. In this paper, the system function eig() of MATLAB 7.2 is used to find the eigenvalues and eigenvectors directly, so that the maximum eigenvalues and their corresponding eigenvectors can be found and the eigenvectors can be normalized.
3.4. Brand Index
Hierarchical analysis was used to calculate the "branding index".The interviews revealed that the intangible assets of the fair are mainly the fair's brand, the fair's team and the fair's database.
Table 3.
Exhibition Brand Index Hierarchy.
Table 3.
Exhibition Brand Index Hierarchy.
| Total Objective A |
Sub-target B |
Indicator Meaning |
| Exhibition Intangibles A |
Exhibition Brand B1 |
The extent to which the show brand influences intangible assets |
| Exhibition Team B2 |
The extent to which the show management team influences intangible assets |
| Exhibition Database B3 |
The extent to which the show database influences intangible assets |
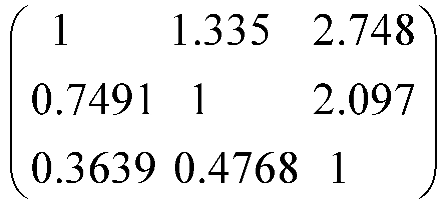
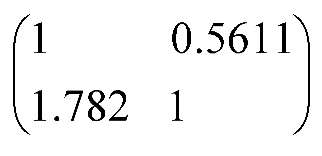
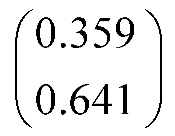
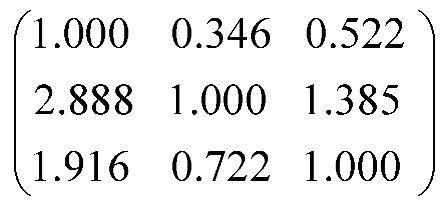
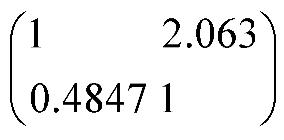
Experts from the exhibition industry were invited to compare and assign values to the relative importance of the above three indicators and construct a pairwise comparison matrix, using 1-5 and its reciprocal as the evaluation scale to describe the relative importance of each indicator. The pairwise comparison matrices for each target are constructed according to the experts' assigned values.
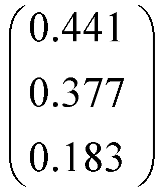
Once the comparison matrix has been constructed, the largest eigenvalues and their corresponding eigenvector values can be found by the eigenvalue solution method commonly used in numerical analysis, and the weights of each element in the hierarchy can then be derived. The combined pairwise comparison matrix (
Table 4) is created, the eigenvectors and eigenvalues are calculated and checked for consistency.
4. Research findings
4.1. Consistency test
The ideal comparison matrix should satisfy the consistency condition well: if a is more important than b and b is more important than c, then a is more important than c. That is, the comparison values between the factors in the pairwise comparison matrix should be logical, otherwise the comparison matrix loses its meaning. In practice, the consistency of the comparison matrices may be somewhat flawed due to differences in personal preferences as well as cognitive levels, therefore, the Consistency Index (CI) is used to measure the consistency of the matrices.
The Consistency Index (CI) is used to measure the consistency of the matrix.
where is the maximum characteristic root of the comparison matrix and n is the order of the comparison matrix. If CI=0, it means that the before and after decisions are perfectly consistent; if CI=1, it means that the before and after decisions are inconsistent; if CI0.1, it is an allowable error.
No comparison matrix can be perfectly consistent due to subjective factors. The Random Index (RI), which can be obtained from the table of standard values of the mean random consistency test (see
Table 5), is used to determine the consistency of the comparison matrix within a certain range.
The Consistency Ratio (CR) is used to determine whether the consistency of the comparison matrix is within a reasonable range by combining the CI and RI values.
CR=,if CR, indicates a good degree of consistency of the matrix.
4.2. Group decision matrix synthesis
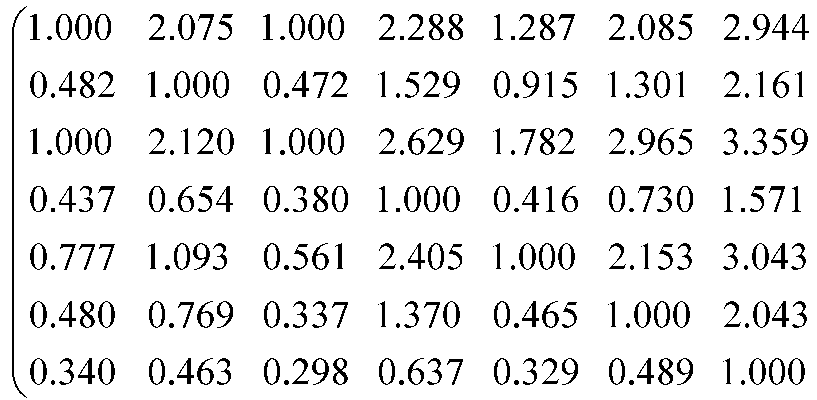
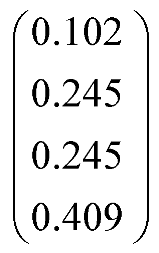
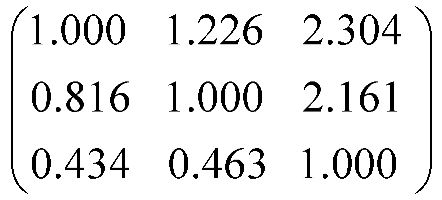
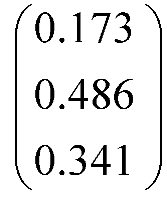
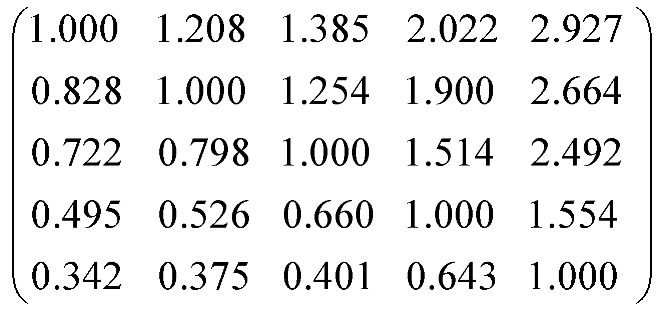
After the overall mean was obtained by applying geometric averaging to each judgment matrix of the valid questionnaire,the synthesised pairwise comparison matrix (
Table 6) was created, the eigenvectors and eigenvalues were calculated, and consistency checks were performed.
The consistency of the paired comparison matrices was determined to be consistent, with the individual consistency ratios (CRs) and the CRs and CIs of the combined opinions of the 11 expert samples being less than "0.1". The consistency ratios (C.R.H.) for the entire hierarchy were calculated using equations (6) to (9) as follows:


C.R.H is less than 0.1 and therefore consistent with the overall hierarchy.
4.3. Weight allocation of exhibition brand evaluation indexes
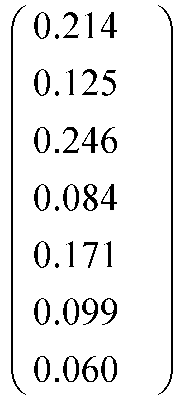
According to the above calculation,we can get the weight distribution of comprehensive evaluation indexes of exhibition brand value,which is shown in
Table 7.
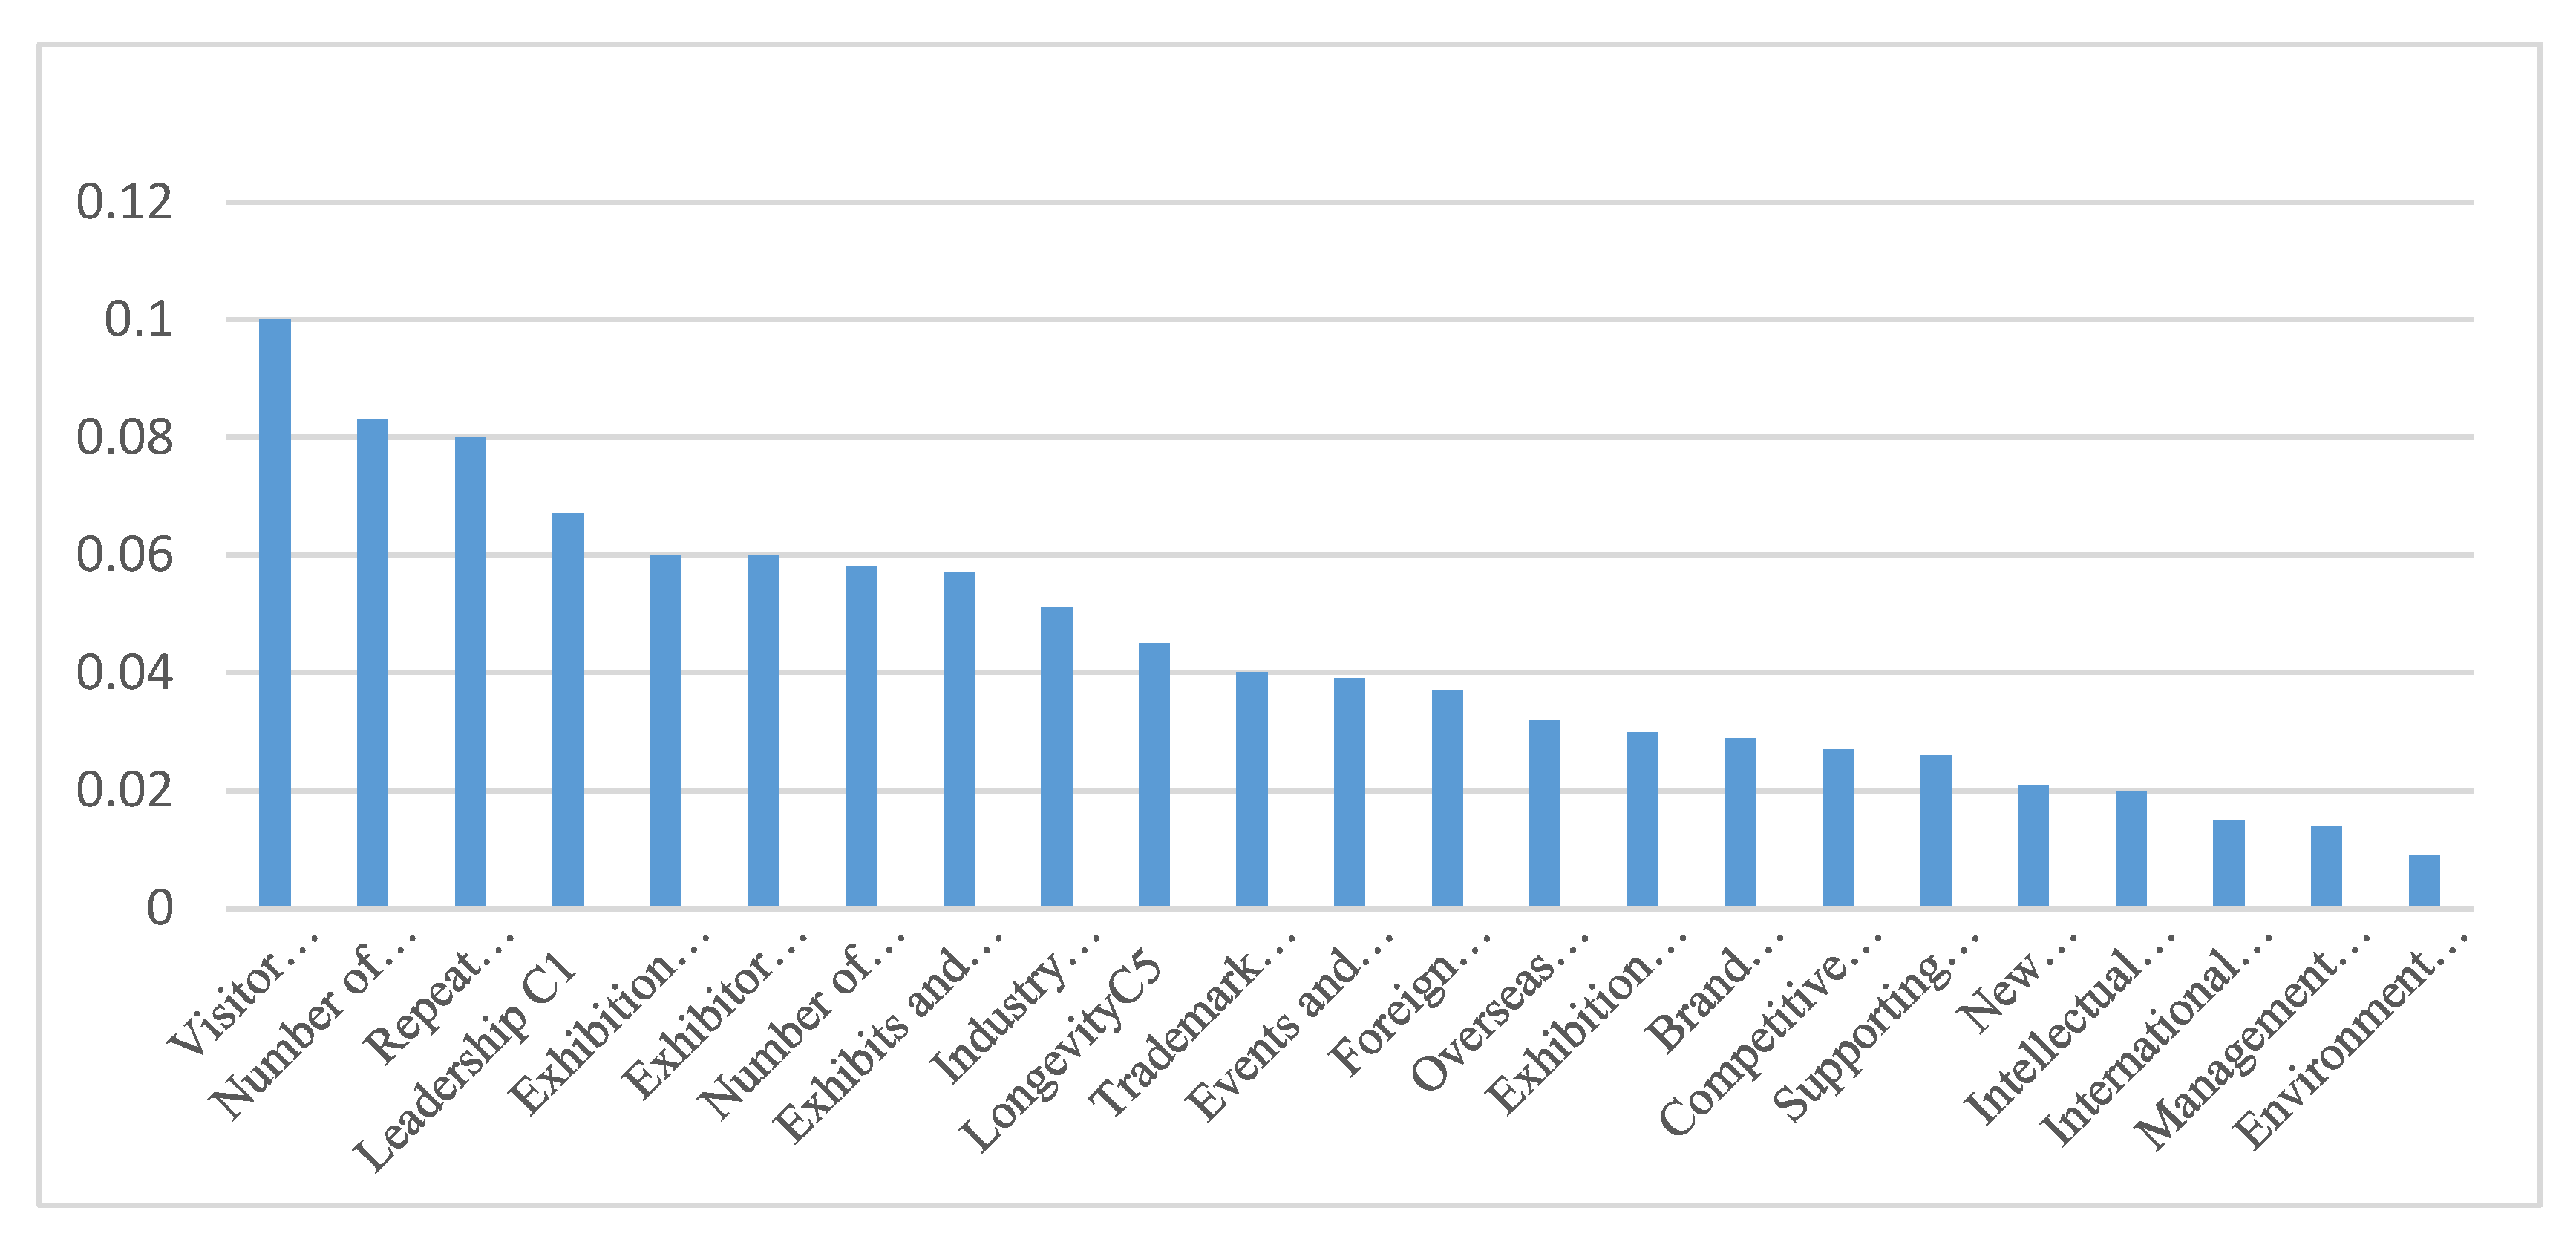
Based on the above table, the weighting of the secondary indicators were ranked into a horizontal bar chart (as in
Figure 1) for comparison. We found that visitor satisfaction, number of visitors and repeat participation rate are the three most important indicators for evaluating brand exhibitions. Exhibition leadership, exhibitor satisfaction, show size, number of exhibitors, exhibits and technology, participation of leading industry players, and exhibition longevity also ranked among the top ten indicators for evaluation.These are the key indicators that exhibition organisers need to focus on when branding their shows.
4.4. Weight distribution of the role of exhibition intangibles
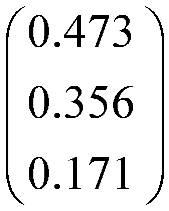
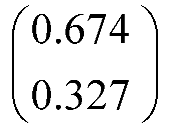
As can be seen from the table above, the experts believe that the brand of the exhibition has an index of 0.473 on intangible assets, which is greater than the impact of the project team and the project database on the intangible assets of the project. That is, the value of the increase or decrease in intangible assets has to be multiplied by 0.473 to be the part of the future benefits of the exhibition's intangible assets that should be attributed to the brand.
4.5. Exhibition industry coefficient
In view of the differentiation of the exhibition itself and this characteristic of the double economic cycles of the industry it serves, this paper believes that the formula of Interbrand's brand value assessment needs to add an indicator reflecting the economic rise and fall of the industry, i.e. the industry coefficient indicator. For the calculation of the industry coefficient, the rate of change of the proportion of the total exhibition area of the industry to the total exhibition area of the region in the current year and the proportion in the previous year can be considered to reflect the volatility of the rise and fall of the industry. The calculation formula is as follows:
Industry factor = total exhibition area of the industry in the current year / total exhibition area of the region in the current year /(total exhibition area of the previous year / total exhibition area of the region in the previous year)
5. Research discussion
5.1. Practical contribution
This paper constructs a B2B exhibition brand value assessment model that can reflect the characteristics of exhibitions and is oriented to the current development of exhibitions as well as fully considering the future sustainable development potential of exhibitions, which has multiple practical values.
The first practical contribution is to solve the long-standing problem of the lack of tools for mergers and acquisitions in the capital market of commercial exhibitions. Although brand value assessment in the fields of consumer services and manufacturing has been carried out for decades, in the field of B2B exhibitions, brand value assessment has not been carried out satisfactorily, which has become the biggest obstacle restricting the capitalisation and scale operation of exhibitions, The market-oriented demand will open the door for exhibition enterprises to go public, raise funds and even merge and acquire.
The second practical contribution is to solve the long-standing problem of quantifying the intangible state-owned and public assets of government-led exhibitions. China and many developing economies have a large number of government-led exhibitions, such as China's Canton Fair, Yihui Fair, etc.These exhibitions obviously have the advantage of branding, but how to evaluate the brand value of exhibitions and ensure that state-owned assets are not lost on the premise of achieving value preservation and appreciation is a long-standing problem that has plagued governments around the world. The proposal of the B2B exhibition brand value assessment model will open up a new era of brand value evaluation for government-led exhibitions, which will promote the marketisation process of government-led exhibitions to a considerable extent and open up huge space for model innovation for the future development of government-led exhibitions.
The third practical contribution is to solve the difficult problem of brand value ranking in the international exhibition industry and the basis for the government's exhibition branding policy.The proposed B2B exhibition brand value assessment model will help promote the brand value ranking of exhibition projects in the international exhibition industry and help improve the quality and efficiency of the international exhibition industry, while the proposed model provides the government with an effective analysis framework.
5.2. Theoretical contributions
The theoretical contributions of this paper are mainly three.
The first theoretical contribution is the innovative construction of a B2B exhibition brand value assessment model. This paper also redistributes the weights of the secondary and tertiary indicators of exhibition brand value. Therefore, this paper not only provides a theoretical framework for the empirical study of exhibition brand value assessment, but also provides an operational theoretical tool and research paradigm for B2B exhibition brand value assessment.
The second theoretical contribution is the innovative development of the exhibition brand value assessment index. Combining the characteristics of the twin industries of exhibition industry and exhibition service industry, this paper introduces an indicator reflecting the economic rise and fall of the industry, i.e. adding an industry coefficient indicator, which enhances the objectivity of the brand value assessment model and is an important development of the theoretical tools for brand value assessment.
The third theoretical contribution is that the innovation has opened up a new perspective of brand value assessment of exhibitions. The previous brand value and pay insufficient attention to the future development potential and sustainable development capability of the brand. This transformation of research perspective will not only promote the assessment of exhibition brand value, but also bring new inspiration to all theoretical studies on brand value assessment.
5.3. Research limitations and future plans
The research in this paper also has certain limitations and shortcomings. In terms of expert interviews, although this paper has ensured that the experts are representative and authoritative of the exhibition industry, there is room for further optimisation in terms of the limitation of the number of experts and geographical representation. In terms of research methodology, the exhibition brand value model is mainly based on the hierarchical analysis method. Although consistency has been tested and weights have been assigned to different factors, further quantitative research and empirical verification are still needed on the correlation between index levels, scientificity and rationality. Future research can combine the needs of the government, industry associations and exhibition enterprises for exhibition brand value assessment, carry out empirical research on the B2B exhibition brand value assessment model, further revise and improve the adaptability of the model, and provide more argumentative basis and research paths for exhibition brand value research.
Author Contributions
Conceptualization,Mingguang Liu,Fangping Yang, Chunlei Li Wang; Formal analysis, Fangping Yang; Funding acquisition,Mingguang Liu;Investigation,Mingguang Liu,Fangping Yang;Methodology, Mingguang Liu,Fangping Yang;Writing—original draft, Mingguang Liu,Fangping Yang;Writing—review & editing,Mingguang Liu,Fangping Yang. All authors have read and agreed to the published version of the manuscript.
Funding
This research received no external funding.
Institutional Review Board Statement
Not applicable.
Informed Consent Statement
Not applicable.
Data Availability Statement
Data is unavailable due to privacy or ethical restrictions.
Conflicts of Interest
The authors declare no conflict of interest.
References
- Motameni, R.; Shahrokhi, M. Brand equity valuation: a global perspective. Journal of product & brand management 1998, 7, 275–290. [Google Scholar]
- Dekimpe, M.G.; et al. Generalizing about trade show effectiveness: A cross-national comparison. Journal of Marketing 1997, 61, 55–64. [Google Scholar] [CrossRef]
- Scott, C. Branding: positioning museums in the 21st century. International Journal of Arts Management 2000, 2, 35–39. [Google Scholar]
- Carlsen, J.; Getz, D.; Soutar, G. Event evaluation research. Event management 2000, 6, 247–257. [Google Scholar] [CrossRef]
- Bendixen, M.; Bukasa, K.A.; Abratt, R. Brand equity in the business-to-business market. Industrial marketing management 2004, 33, 371–380. [Google Scholar] [CrossRef]
- Hansen, K. Measuring performance at trade shows: scale development and validation. Journal of business Research 2004, 57, 1–13. [Google Scholar] [CrossRef]
- Sarmento, M.; Simões, C. The evolving role of trade fairs in business: A systematic literature review and a research agenda. Industrial Marketing Management 2018, 73, 154–170. [Google Scholar] [CrossRef]
- Liu, C.R.; Liu, H.K.; Lin, W.R. Constructing customer-based museums brand equity model: The mediating role of brand value. International Journal of Tourism Research 2015, 17, 229–238. [Google Scholar] [CrossRef]
- Geigenmüller, A.; Bettis-Outland, H. Brand equity in B2B services and consequences for the trade show industry. Journal of Business & Industrial Marketing 2012, 27, 428–435. [Google Scholar]
- Jin, X.; Weber, K. Developing and testing a model of exhibition brand preference: The exhibitors' perspective. Tourism Management 2013, 38, 94–104. [Google Scholar] [CrossRef]
- Österle, B.; Kuhn, M.M.; Henseler, J. Brand worlds: Introducing experiential marketing to B2B branding. Industrial Marketing Management 2018, 72, 71–98. [Google Scholar] [CrossRef]
- Kuhn KA, L.; Alpert, F.; Pope NK, L. An application of Keller's brand equity model in a B2B context. Qualitative Market Research: An International Journal 2008, 11, 40–58. [Google Scholar] [CrossRef]
- Farquhar, P.H. Managing brand equity. Marketing research 1989, 1. [Google Scholar]
- Edell, J.A. Advertising interactions: A route to understanding brand equity, Advertising exposure, memory and choice. Psychology Press 2013, 203–216. [Google Scholar]
- Gopalakrishna, S.; Lilien, G.L. A three-stage model of industrial trade show performance. Marketing science 1995, 14, 22–42. [Google Scholar] [CrossRef]
- Breiter, D.; Milman, A. Predicting exhibitor levels of satisfaction in a large convention center. Event Management 2006, 10, 133–143. [Google Scholar] [CrossRef]
- Jin, X. Exhibition brand preference in mainland China: the role of relationship quality and destination attractiveness 2011.
- Yoo, B.; Donthu, N.; Lee, S. An examination of selected marketing mix elements and brand equity. Journal of the academy of marketing science 2000, 28, 195–211. [Google Scholar] [CrossRef]
- Vargo, S.L.; Lusch, R.F. Evolving to a new dominant logic for marketing. Journal of marketing 2004, 68, 1–17. [Google Scholar] [CrossRef]
- Vassiliadis, C.; Belenioti, Z.C. Museums & cultural heritage via social media: an integrated literature review. Tourismos 2017, 12, 97–132. [Google Scholar]
- Petromilli, M.; Morrison, D.; Million, M. Brand architecture: Building brand portfolio value. Strategy & leadership 2002, 30, 22–28. [Google Scholar]
- Dib, H.; Alhaddad, A. The hierarchical relationship between brand equity dimensions. European Scientific Journal 2014, 10. [Google Scholar]
- Camarero, C.; Garrido, M.J.; Vicente, E. Components of art exhibition brand equity for internal and external visitors. Tourism Management 2010, 31, 495–504. [Google Scholar] [CrossRef]
- Alberca-Oliver, P.; Rodríguez-Oromendía, A.; Parte-Esteban, L. Measuring the efficiency of trade shows: A Spanish case study. Tourism Management 2015, 47, 127–137. [Google Scholar] [CrossRef]
- Wong, J.W.C.; Lai., I.K.W. Evaluating value co-creation activities in exhibitions: An impact-asymmetry analysis. International Journal of Hospitality Management 2018, 72, 118–131. [Google Scholar] [CrossRef]
- Chen, Z. Some issues on the evaluation of exhibition projects. In Proceedings of the 2007 Annual Academic Conference of China Conference and Exhibition Economy Research Society 2007.
- Li, Z. Drawing on the UFI validation model to establish China's exhibition evaluation system. Group Economic Research 2007, 10. [Google Scholar]
- Yang, F.; Yu, M. AHP-based brand exhibition project evaluation index research. Modern Management Science 2010, 4. [Google Scholar]
- Abratt, R.; Bick, G. Valuing brands and brand equity: Methods and processes. Journal of applied management and entrepreneurship 2003, 8, 21–39. [Google Scholar]
- Janoskova, K.; Krizanova, A. Comparison of selected internationally recognized brand valuation methods. Oeconomia Copernicana 2017, 8, 99. [Google Scholar] [CrossRef]
- Agus Harjoto, M.; Salas, J. Strategic and institutional sustainability: Corporate social responsibility, brand value, and Interbrand listing. Journal of Product & Brand Management 2017, 26, 545–558. [Google Scholar]
- Seetharaman, A.; Azlan Bin Mohd Nadzir, Z.; Gunalan, S. A conceptual study on brand valuation. Journal Of Product & Brand Management 2001, 10, 243–256. [Google Scholar]
- Keller, K.L.; Lehmann, D.R. Assessing long-term brand potential. Journal of Brand Management 2009, 17, 6–17. [Google Scholar] [CrossRef]
- Kirk, C.P.; Ray,, I.; Wilson, B. The impact of brand value on firm valuation: The moderating influence of firm type. Journal of Brand Management 2013, 20, 488–500. [Google Scholar] [CrossRef]
- Bagna, E.; et al. The value relevance of brand valuation. Applied Economics 2017, 49, 5865–5876. [Google Scholar] [CrossRef]
- Duguleană, L.; Duguleană, C. BRAND VALUATION METHODOLOGIES AND PRACTICES. Bulletin of the Transilvania University of Brasov. Series V: Economic Sciences 2014, 7. [Google Scholar]
- Keller, K.L. Conceptualizing, measuring, and managing customer-based brand equity. Journal of marketing 1993, 57, 1–22. [Google Scholar] [CrossRef]
- Kuhn K A, Alpert F. Applying Keller's brand equity model in a b2b context: limitations and an empirical test[C]//Proceedings of the Australian and New Zealand Marketing Academy (ANZMAC) Conference 2004. The Australian and New Zealand Marketing Academy, 2004: 1-7.
- Rozhkova, D.; et al. Brand valuation of the Russian bank: Interbrand model. Digital Science: DSIC 2021. Cham: Springer International Publishing, 2022. 219-230.
- Bogner, Alexander, Beate Littig, and Wolfgang Menz, eds. Interviewing experts. Springer, 2009.
|
Disclaimer/Publisher’s Note: The statements, opinions and data contained in all publications are solely those of the individual author(s) and contributor(s) and not of MDPI and/or the editor(s). MDPI and/or the editor(s) disclaim responsibility for any injury to people or property resulting from any ideas, methods, instructions or products referred to in the content. |
© 2023 by the authors. Licensee MDPI, Basel, Switzerland. This article is an open access article distributed under the terms and conditions of the Creative Commons Attribution (CC BY) license (http://creativecommons.org/licenses/by/4.0/).


