
Submitted:
05 May 2023
Posted:
08 May 2023
You are already at the latest version
Preprints on COVID-19 and SARS-CoV-2
Abstract
Covid-19 is a lung disease caused by a Coronavirus family virus. Due to its extraordinary prevalence and death rates, it has spread quickly to every country in the world. Thus, achieving peaks and outlines and curing different types of relapses is extremely important. Given the worldwide prevalence of Coronavirus and the participation of physicians in all countries, Information has been gathered regarding the properties of the virus, its diverse types, and the means of analyzing it. Numerous approaches have been used to identify this evolving virus. It is generally considered the most accurate and acceptable method of examining the patient's lungs and chest through a CT scan. As part of the feature extraction process, a method known as fractional Fourier transform (FrFT) has been applied as one of the time-frequency domain transformations. The proposed method was applied to a database consisting of 2481 CT images. Following the transformation of all images into equal sizes and the removal of non-lung areas, multiple combination windows are used to reduce the number of features extracted from the images. In this paper, the results obtained for KNN and SVM classification have been obtained with accuracy values of 99.84% and 99.90%, respectively.
Keywords:
Covid-19
; KNN
; SVM
; Fractional Fourier transform
; Feature Extraction
1. Introduction
Globally, over 660 million patients had been diagnosed with COVID-19 infection in January 2023, and about 6,6 million died from COVID-19 disease. It is important to screen for COVID-19 as soon as possible to prevent its spread through separation and medical treatment. COVID-19 is an infection initiated via a virus called (SARS-CoV-2). As a matter of fact, there are many different types of lung infections, which can range from a simple cold to a fatal condition. Coronaviruses are known to cause respiratory system symptoms, frequently mistaken for contagions caused by other viruses. In unusual cases, individuals may have slight, self-restraining infections with adversative properties like influenza. There are several symptoms of respiratory concerns, including fever, coughing, and having trouble breathing, as well as exhaustion, a sore throat, and a weak immune system [5,42, 24,41,31]. The use of CT scans and X-rays is without a doubt one of the most important methods for the detection of COVID-19. There is a consensus within the medical community that chest imaging is a quick and effective method of diagnosis. Numerous papers have pointed out that it is the first screening tool for widespread use. Several different computer vision techniques are used to segment and classify objects. As an alternative to a computer-based automatic method that allows the progression of patients infected by measuring the infection region and disintegrating it every two to six days, a computer-based automatic method that can run on partial computing devices is a great solution when the task is quick and straightforward. Medical recognition is essential, COVID-19 is a challenging syndrome to detect for professional medics [27,32]
The WHO called it a major universal public health crisis, and the situation remained well-thought-out as a public health problem. COVID-19 can be reported automatically through CT scans, making it an excellent way to extend traditional healthcare methods. However, CT has several limitations. [29]. It should be noted that despite this, Covid-19 cases continue to rise sharply. Covid-19 patients represent a significant number of patients that must be detected and monitored manually, which is challenging. Hence, one of the most significant responsibilities of stopping the spread of COVID-19 is to come up with a fast and precise method of diagnosing the disease. In the past few years, research into artificial intelligence has grown in popularity, attracting scholars to solve complex problems in many areas, such as medicine, economics, and cyber security. Artificial intelligence substantially benefits from replacing humans with machines that can accomplish repetitive and compound tasks [11, 38, 22, 43, 13]. Artificial intelligence (AI) can solve the analytical issues related to a rapid increase in patients. Many researchers believe machine learning can successfully detect COVID-19 patients using medical images. The development of machine learning techniques for chest CT and X-ray images of COVID-19 patients have been studied, and some have achieved outstanding results. Moreover, many have developed innovative and inspirational image-processing algorithms for COVID-19 [3].
Other important diagnostic tools, including radiological imaging, can also be used for COVID-19. It is commonly observed that CT images of COVID-19 patients demonstrate ground-glass opacities in the early stages of the disease and consolidation of the lungs in the later stages of the disease. The morphology of the lung may also be rounded, and there may be a peripheral lung distribution [17, 25, 10, 8, 7, 41, 48]. In situations where the patient is suspected of having viral pneumonia, CT scans can provide an early indication of infection. While there are several causes of viral pneumonia, the images of the various causes are similar. These images also overlap with those seen in other inflammatory and infectious lung diseases. Since COVID-19 cannot be distinguished from other viral pneumonia due to this, radiologists have difficulty diagnosing the disease. As the gold standard for diagnosing viral and bacterial infections at the molecular level, the RT-PCR method is used by most health authorities around the world to diagnose viral and bacterial infections [33]. To lower the disease curve, early detection and mass testing are necessary. To fulfill the demands on the healthcare system, all infrastructure must be expanded with the rapidly increasing number of newly diagnosed illnesses. It has been found that chest computed tomography can be useful in the early detection of the disease. In some cases, the PCR results initially showed a negative result for the patient. However, confirmation was dependent on the results of their CT scan. In addition, a chest CT screening was recommended since the patient exhibits symptoms that are compatible with those of COVID-19; however, the results of its PCR tests are negative [6]. Automatic detection tools will be key to preventing the spread of disease and speeding up the diagnosis process to prevent further spread and, at the same time, ensure that CT images are available to construct an AI-based device to prevent their spread. Several attempts have been made to identify alternative testing tools for COVID-19 infection to alleviate the shortage and inefficiency of current tests. Researchers have demonstrated that CT scans highly indicate COVID-19’s radiological features. CT scanners are readily available and can be used by a wide range of medical professionals, making them an efficient and useful tool for testing.
This paper investigates Covid-19 detection from CT images by Fractional Fourier Transform. The FrFT is a generalized form of the Fourier transform, considered a time-frequency transform, unlike the Fourier transforms, which only provides frequency information. The features extracted in this study are fractional Fourier transform coefficients, which are complex numbers, obtained by applying FRFT to the image.
An overview of the literature is presented in the following section. The next section provides an overview of the proposed database. After describing the database, the next section describes the proposed method, pre-processing, feature selection, and classification. In the following section, we summarize the results of the experiments. As a final section, the main conclusions of the study are presented.
2. Literature Review
In the medical imaging field, artificial intelligence has been primarily introduced to provide improved quality and efficiency of clinical care in response to the need for better clinical treatments. It is widely believed that the amount of radiology imaging data is growing much faster than the number of qualified readers. Due to this fact, healthcare professionals are constantly required to improve their efficiency in the way they analyze images to compensate for this lack of efficiency [47].
It is possible to describe image classification as the process of sorting images into various categories. Computer vision is a fundamental issue. A computer vision system is a foundation for other computing features such as detection, segmentation, and localization. Deep learning models have been used in recent years to address this problem by leveraging several layers of nonlinear acquired knowledge processing to extract and transform functions and classify and analyze patterns [33].
Medical imaging problems have benefited dramatically from computer-assisted image processing. Artificial intelligence has contributed significantly to image interpretation through recent advancements in deep learning, particularly in recognizing, classifying, and quantifying patterns in medical images. The innovation’s basis lies in using hierarchical function representations derived exclusively from data, as opposed to handcrafted features, often focused on domain-specific information. It is apparent. Therefore, deep learning may improve efficiency in many medical applications [36].
The detection of COVID-19 from CT images has been reported in several publications. According to Chua, chest CT will be instrumental in detecting early signs of a pneumonic injury that leads to respiratory death, especially if the patient is scanned two or more days following the onset of symptoms [2,6]. Several studies have proposed that using deep learning techniques could provide valuable insight into the occurrence of COVID-19 from chest CT images [26, 39]. According to the study published by (Shi et al. 2020), machine-learning-based methods will be used to screen the COVID-19 virus from an online COVID-19 CT dataset [12].
The study by Khan implemented a Deep Neural Network-centered model to diagnose COVID-19 using chest X-ray images. They achieved a classification accuracy of 89.5%, which outperformed a randomly-generated classifier by more than ten percentage points [22].
A study by Wu has developed a deep learning technique to support a radiologist in directly detecting Covid-19 from CT scans. The image analysis relied on a ResNet50 model for its features. The achieved result demonstrated an AUC of 73.2%, an Accuracy of 70 %, a Sensitivity of 73%, and a Specificity of 61.5% [42].
According to Dansana, CT scan and X-ray image data sets containing 360 images were processed using a CNN-based approach. The data were transformed using the Inception_V2, DT, and VGG-19 methods based on a binary classification pneumonia method. We have demonstrated that a fine-tuned version of the VGG-19, Inception_V2, and DT method produces high training accuracy and validation rates. [10].
In the case of feature extraction-based approaches, several frameworks have recently been developed, usually relying on a CNN. In addition to applying a 3D CNN to the whole CT volume in one stage, 2D CNNs are applied to CT slices, and the slice-level results are aggregated through an aggregation mechanism. The results obtained in a study by Wang on a dataset that included only COVID-19 cases and normal cases showed an accuracy of 90.1%, a sensitivity of 84.0%, and a specificity of 98.2% with a three diaomensional CNN-based classifier [25].
As Hu demonstrated that the same label can be applied to all slices of a CT scan. This enables training a detailed model that utilizes intermediate CNN layers to determine classification features. Final decisions are made by combining these features. Based on the three-way classification proposed by the researchers, their proposed method achieved an overall accuracy of 87.4 because each volume of the CT scan contains many slices without any visible infection area, utilizing patient-level labels for all slices is unreasonable and will add errors to the system [16].
According to Ouyang, the lung segmented and infected regions were analyzed to extract radionic features, and then the features were selected using a multi-stage random forest classifier. Based on infection size, patients were divided into four groups based on their infection size. In the final classification step, a random forest model is trained for each group, achieving 87.0% accuracy, 90.7% sensitivity, and 83.3% specificity [29].
As described by Pathak, the proposed system is considered a pre-proposed transfer learning method for the detection of COVID-19 in CT scans. A 2D convolutional neural network was used to classify CT images using the ResNet50 algorithm. A 10-fold cross-validation procedure was used on 413 images of COVID-19 and 439 images of non-COVID-19, and the proposed system performed with an accuracy of 93.01% [30].
Compared with RT-PCR testing mechanisms, radiographic patterns on Computed Tomography (CT) chest scanning models provide superior sensitivity and specificity. Furthermore, a variety of methods have been developed to make use of CT and X-ray image datasets for the implementation of automated classifications. Furthermore, it is demonstrated that CT and RT-PCR are complementary to each other in the prediction of COVID-19. CT features act as instant diagnostic indicators, while RTPCR is used to confirm the diagnosis. Additionally, it is necessary to differentiate COVID-19 from other pneumonia infections in CT chest screening by leveraging the detective capabilities of artificial intelligence (AI). A Deep Learning (DL) method is particularly effective in separating COVID-19 cases from other types of pneumonia [35].
To classify 150 COVID-19 and non-COVID-19 images, Barstugan [4] used machine learning algorithms instead of deep learning approaches. A support vector machine was employed to classify the extracted features, using several feature extraction methods such as the grey-level size zone matrix (GLSZM) and the discrete wavelet transform (DWT). Two, five, and ten folds of cross-validation were conducted in the experiments. As a result of the use of the GLSZM feature extraction method, a accuracy rate of 99.68% was achieved.
The Kassani [20] study used several pre-trained networks to extract the features of images in the publicly available dataset so that COVID-19 could be differentiated from normal cases. The networks used were MobileNet, DenseNet, Xception, InceptionV3, InceptionResNetV2, and ResNet. After feature extraction, a series of machine learning algorithms were applied, including a decision tree, random forest, XGBoost, AdaBoost, Bagging, and LightGBM. Kassani concluded that the Bagging classifier produces the most accurate results based on features extracted from the pre-trained network DESNSEA121, with an accuracy of 99.00%.
According to Gupta, deep learning detected Covid-19 disease as a new method. Several CNN architectures include Xception, Inception V3, Efficient Nets (B0-B5), ResNet-50, and DenseNet-121. The result shows tan an accuracy of 85% is acquired after using five different deep transfer learning architectures [13].
A team at Horry College of Science and Math has published a study analyzing various types of images. They’ve looked at two specific images: X-rays and CT scans. The researchers pre-processed the noises from these images, most likely irrelevant to the conclusion. They achieved an accuracy of 86% in X-rays and 84% in CT scans [2].
HQ-CNN is a model proposed by Houssein to enhance CNN performance on medical images and predict COVID-19 cases. In the HQ-CNN model, one quantum commuting layer is followed by three convolutional layers, followed by a rectified linear activation function, followed by two max-pooling layers, followed by two fully connected layers (FC). As a result of using HQ-CNN, they were able to achieve an accuracy of 98.6 percent [14].
Based on fuzzy entropy, Houssein proposes an efficient method for segmenting CT images from COVID-19. This type of entropy is measured using various thresholds, and I-EO is an effective method for determining them. It is also necessary to evaluate I-EO on a set of benchmark problems since it is a modified algorithm for global optimization. As a result of physical principles, EO is based on a mathematical algorithm. As a metaphor, it is based on estimating the dynamic and equilibrium states of a control volume by considering its mass balance. By utilizing the concept of dimensional learning hunting (DLH), the authors provide an improved version of the EO algorithm. By enhancing the search power of the original EO, balancing the interaction between exploration and exploitation phases, and alleviating the possibility of the EO algorithm getting stuck in a local optimum, the DLH algorithm improves the original EO search capability [15].
3. Materials and Methods
In this paper, the first step of the proposed method is explaining the COVID-19 dataset. In this case, the images were in .png format and did not require any filtering or normalization. Once all images have been equalized in 200*200 size, K-means segmentation is applied to the images to remove any non-lung parts from the images. As a result of this, FrFT coefficients are used for feature extraction with diverse fractional orders. Real, absolute, imaginary, and phase components of the complex coefficients are computed as part of the equation for the complex coefficients. Next, a novel method called adjacent rectangular windows is applied to determine which features will produce the best results. The coefficients of a 2-D window containing coefficients were calculated based on the maximum, minimum, median, and mean values. In the end, K’s nearest neighbors (KNN) and Support Vector Machines (SVM) were applied to classify the images with the most accurate features extracted by the windowing method.
These various stages are applied to achieve the best accuracy and separate COVID-19 from Non-Covid-19. The structure of each step is shown in Figure 1
3.1. Database
The suggested dataset (SARS-COV-2) contains 2481 CT images shared among 1252 patients infected with COVID-19 and 1229 CT scans for non-Covid patients. Data were gathered from hospitals in Sao Paulo, Brazil. In this case, the data consist of 60 patients infected with Coronavirus 28 of them were female and 32 were male [37]. The size of the images in this database was different; the size of all the images equalized before the pre-processing stage. (Figure 2)
3.2. Pre-Processing
To begin with, every image in the database was equalized by 200 * 200. This is due to the fact that the images in the database are of different sizes and each image has a different number of pixels. Furthermore, since Coronavirus is a lung disease, it is imperative to distinguish lung areas from other body parts. In other regions of the image, white borders can be seen that were derived from the original image using K-means segmentation and morphological methods. Lung image is illustrated in Figure 3, following the application of the pre-processing method.
3.3. Fractional Fourier Transform
An alternative to the traditional Fourier transform (FT) is the fractional Fourier transform (FrFT), which extends the FT to the entire time-frequency domain using fractional powers of the Fourier operator. As a generalization of the FT, the FrFT adds an extra parameter related to the rotation of the signal in the time-frequency domain. A chirp function basis is used in such a scheme to decompose the temporal signal. Thus, the FrFT provides a unified time-frequency representation of the signal with a higher time-frequency resolution than other techniques [28]. Numerous applications of the FrFT can be found in quantum mechanics, optics, and signal and image processing. Scholars believe that The extracted features must excellently separate the desired output classes.
The extracting features can be applied in frequency, time, and time-frequency domains based on the paper’s purpose. In this paper, FrFT is used for feature extraction. In 1980, Namias offered this operative to explain Hamilton’s second-order function in quantum-mechanical systems [9]. After that, few scholars developed it in numerous applications, such as mathematic approaches to the matrix in image processing and swept-frequency filters [36].
In addition to being a linear transformation, FrFT is a generalization format of the normal Fourier Transform that includes a specific order parameter α that varies from zero to one; FrFT is illustrated in Figure 4. and there is no way of determining the most acceptable value of α to provide accurate data analysis. As soon as α = 1, As a conventional Fourier Transform, the Fractional Fourier Transform behaves as well. FrFT can be used in several techniques, for instance, the rotation of a function in the time-frequency domain, fractional powers of the Fourier Transform, and differential equations [26]. Accordingly, the linear integral transform explanation was used as the most direct and concrete explanation based on the linear transform explanation for computing. The function usually be represented as
‘a’ is the number of rotations on the interval 0 ≤ |a| ≤ 2 and is the kernel, which is symmetric and has the following explanation when α = π∕2:
The kernel is δ(u − ) when α = 2nπ as well as the kernel is δ(u + ) when α + π = 2nπ [39].
Determining the appropriate alpha value is one of the challenges of this project, which uses fractional Fourier transform to extract features. The coefficients of the fractional Fourier transform are obtained after applying the fractional Fourier transform to extract features. It is very important to note that these coefficients are complex numbers. The concept of real and imaginary parts, absolute value, and phase are all included. We have separated and processed each of these components separately in the course of this research.
3.4. Feature Extraction and Selection
A subset of features can be derived in two ways: by feature extraction and selection. Feature extraction is extracting properties with a resolution, whereas feature selection is selecting subsets from the main feature set. Feature separation is impossible when a quality strongly correlates with the feature set. In some cases, a part may play a role in classification accuracy despite poor relevance [12]. According to Heisenberg’s uncertainty principle, the accuracy of time and frequency measurements cannot be increased simultaneously. In this way, by increasing the accuracy in the time domain, the accuracy of the work in the frequency domain decreases.
In the same way, if the accuracy in the frequency domain increases, the accuracy in the time domain decreases. Frequency in biological signals at different times can have very different meanings. This limitation can be used in image and signal processing. Frequency domain transformations. These transformations include the fractional Fourier transform, fractional S Transform, and fractional wavelet transform. In this paper, After extracting the feature, due to the large volume of features extracted by fractional Fourier transform, we needed to select the feature and reduce its values. As shown in Figure 5, the proposed method is outlined step by step. A novel windowing method was used to reduce features. As a result of the pre-processing method, each image is converted to 200 by 200 pixels. The feature extraction process resulted in the extraction of 40,000 features. The number of features needed to be reduced. The features were reduced using two-dimensional windows. First, one-dimensional vector features have been reconstructed into a two-dimensional matrix of 200 x 200 features. To reduce the features, a two-dimensional transition window is used. These images were scaled in the proportions of 10 x 10, 20 x 20, to 100 x 100. In the case of a 10 x 10 window, the number of features will decrease from 40,000 to 200. In the case of a 100 x 100 window, the number of features will decrease from 40,000 to 200. After applying the windowing, the statistical methods of mean, median, minimum, and maximum were used.
3.5. Classification
As a result of image processing after feature extraction, the most practical features to use for classification consist of identifying COVID-19 in each image. In this paper (KNN) K-nearest neighbor and the (SVM) Support Vector Machine are used for classification.
KNN is one of the most popular classifiers in pattern recognition. It is a popular method for supervised binary classification and two-class learning, which can be used for machine learning. This classifier is designed to distinguish classes based on the detection of hyperplanes. SVM is designed to identify distinct classes of data points by finding hyperplanes in an N-dimensional space. SVM measures the margin distance between data points of the two classes. This is because there are several options for choosing the hyperplane. This margin should be maximized to provide a clear decision boundary for classifying future data points [1,2].
Data are divided into two groups using the Hold-out method: train and test. Several possible divisions exist, such as 40/60, 30/70, or 20/80. Therefore, training is conducted on training data, and evaluation is performed on test data to produce the desired model. This method is called holdout validation. If the number of classes in the test and train groups does not match, the Holdout method will not be able to train the model correctly. Consequently, both the training and test groups must have the same distribution of classes. Classification is based on the division 10/90 in this project.
This method compares the training group to a test group based on similarity. The distance between the entered new sample and all training samples can then be calculated, and the k-nearest model will be chosen to classify the updated sample. After organizing Non-Covid and COVID-19 subjects, nominated features were classified with various properties for the train and test stage. The primary step was to allocate 10% of Non-Covid and the remaining for the test stage. Then the amount of training is reduced to 10%. The performance of the suggested method is evaluated using Specificity, Accuracy, sensitivity, and precision, which are defined as follows:
The performance has been stated with the performance factors via two classifiers.
4. Results
After extracting features, such as the derived phase, imaginary, real, and absolute value, a classification procedure was used. The fractional order of 0.8 and 0.7 had been achieved for KNN and SVM classifier. This order that had achieved by trial and error; unfortunately, there aren’t any other techniques to determine this order. In this study, the 2-D windowing method was used to select features, and the derivative calculated the difference in features. This operator is used to convert the feature matrix into a new space, with significantly promising results. The declared average value is the average taken from the indicators (Specificity, Accuracy, Precision, and Sensitivity).
To evaluate its performance, different features of the proposed technique are examined in Figure 6, such as the absolute, real, imaginary, and phase coefficients. Figure 6 shows that the best coefficient for KNN is determined based on phase, while the best coefficient for SVM is determined based on absolute value.
At the end of the process, the features are classified. It was necessary to preprocess images before FrFT to determine the best fractional order. Each coefficient was used to specify the optimal characteristics for each step. Figure 7 shows the most accurate k-neighbor (1-9) value for KNN classifiers. With 99.80% accuracy, the best k-neighbor value is achieved at k=1. the best features were selected, illustrated in 90% of the training and one neighborhood by using a 2-D window (including mean, median, maximum, and minimum coefficients) with different dimensions. As an important point to note, FrFT with 0.8 and 0.7 fractional orders may provide more accurate results than FrFT with other fractional orders for KNN and SVM classifiers. This applies specifically when = 1, which is equivalent to FT. From Figure 8, the Euclidean distance between Chebyshev, Hamming, and Minkowski classifiers yields the highest average and accuracy with 99.74% and 99.09%, respectively, for the KNN classifier. In comparison to the other training results for the KNN classifier, 90% of the training results have higher accuracy than the others. Median, Maximum, and Minimum, when compared by the mean static method, have accuracy and average of all indicators of 99.89% and 93.96%, respectively (Figure 9).
Among the most significant parameters involved in SVM classification is the selection of the appropriate kernel. Table 1 shows that the polynomial kernel, the most accurate one, achieves 99.90% and 97.49% respectively at both the average and accuracy levels of SVM kernels. There is a significant difference between 90% of the training results for the SVM classifier that are more accurate in comparison to the rest of the results. As a result of using the median static method between Mean, Maximum, and Minimum, the accuracy and average of all indicators were 99.89% and 93.96%, respectively (Table 2).
The following steps determine an appropriate number of optimal features after the classification step. Our first objective was to determine what was the average performance of classifiers across all criteria. Afterward, it was determined which features resulted in the highest level of accuracy. According to these findings, 80 and 200 features are appropriate for the detection of Covid-19 using KNN and SVM classifiers. With the use of KNN and SVM classifiers, Figure 10 displays the average accuracy of each feature. In addition, it displays an average of 95.05% and 99.90% due to using KNN and SVM classifiers.
As a result of this experiment, it appears that fractional Fourier Transforms can produce increasingly good results when used in conjunction with CT images for classification. The results presented in this paper were produced by following some steps to be as reliable as possible. In the beginning, only lung parts were segmented from the dataset. A large feature plane was constructed using 40,000 features extracted from the fractional Fourier Transform coefficients based on the size of each image (200*200). An innovative method, including 2-D windowing, was used to select the best features. We used a 2-D window with different dimensions to calculate the mean, median, maximum, and minimum coefficients. Consequently, the number of features decreased from 40,000 to 80 for KNN and 200 for SVM. Results were best obtained with KNN and SVM classifier inputs. With 90% training (the training dataset is completely different from the test dataset) and k = 1, Euclidean distance for KNN, and polynomial kernel for SVM classifiers, they were able to accomplish this objective. All four coefficients, real, absolute, imaginary, and phase, were extracted as different features in each step.
A review of previous works reveals that all used CT scan images and employed supervised and unsupervised classification methods and deep learning. A clear comparison between the results of the proposed method and those of traditional methods can be achieved by comparing the results of the proposed method to those of traditional methods, such as those shown in Table 3. To obtain a reliable comparison, the conditions of the experiments should be similar. Accordingly, it is impossible to recommend one study over another. Taking a quick look at the information, the Fractional Fourier Transform method is found to be a sufficient method for extracting features There are many advantages to using the fractional Fourier transform. These include its coefficients, which are the same characteristics that were examined in this study. Mixture coefficients provide both amplitude and phase as well as the absolute value and imaginary part. They are much simpler and faster than the methods currently being used. The 2D windowing method is used in this research to reduce features. This is an innovative method that is also fast and reliable and relies on simple mathematical algorithms such as minimum and maximum. that provide satisfactory results in classifying Covid-19 and Non-Covid-19.
5. Conclusions
To validate the results, our model outputs were cross-checked with healthcare professionals. Our goal is to demonstrate the potential of artificial intelligence-based methods in the fight against the current pandemic by using reliable diagnostic methods that can be obtained easily, such as chest radiographs, to aid in the fight. In this paper, the FrFT technique is suggested for COVID-19 classification. The proposed method is accurate and fast. The results initiate the application of the presented process. This technique will help doctors and scholars with COVID-19 detection much quicker and more accurately than other previous methods. The results of this study specify the capability of FrFT and the influence of this technique in COVID-19 detection.
Author Contribution
Allie Nokhostin Methodology, Software, Formal analysis, Writing - Original Draft, Review, and Editing, Saeid Rashidi Supervision, The idea of the research, Helping in programming, Helping in writing and editing of the paper.
Conflict of Interest
It is declared that neither the authors nor any of the members of their research team have a financial interest or any personal relationship that may have influenced the results reported in this article.
References
- Asmaa Abbas, Mohammed M Abdelsamea, and Mohamed Medhat Gaber. (2021). Classification of Covid-19 in chest x-ray images using detract deep convolutional neural network. Applied Intelligence, 51(2):854–864.
- Parnian Afshar, Shahin Heidarian, Farnoosh Naderkhani, Anastasia Oikonomou, Konstantinos N Plataniotis, and Arash Mohammadi. (2020). Covid-caps: A capsule network-based framework for identification of Covid-19 cases from x-ray images. Pattern Recognition Letters, 138:638–643. [CrossRef]
- Bansal, Ankita and Jain, Abha (2022). “Utilization of images in an open source software to detect COVID-19” In Computational Intelligence in Software Modeling edited by Vishal Jain, Jyotir Moy Chatterjee, Ankita Bansal, Utku Kose, and Abha Jain, 121-142. Berlin, Boston: De Gruyter.
- Barstugan, M. , Ozkaya, U., & Ozturk, S. (2020). Coronavirus (Covid-19) classification using ct images by machine learning methods. arXiv preprint, arXiv:2003.09424.
- Wang Biao, Tang Jiansheng, Yu Fujian, Zhu Zhiyu (2018). “Identification of Sonar Detection Signal Based on Fractional Fourier Transform,” Polish Maritime Research, 2018. [CrossRef]
- Brunese L, Mercaldo F, Reginelli A, Santone A (2020). Explainable deep learning for pulmonary disease and coronavirus Covid-19 detection from x-rays. Comput Methods Programs Biomed;196: 105608. [CrossRef]
- Corman, Victor M., Olfert Landt, Marco Kaiser, Richard Molenkamp, Adam Meijer, Daniel KW Chu, Tobias Bleicker et al. (2020) “Detection of 2019 novel coronavirus (2019-nCoV) by real-time RT-PCR.” Eurosurveillance 25, no. 3: 2000045. [CrossRef]
- Chu, Daniel KW, Yang Pan, Samuel MS Cheng, Kenrie PY Hui, Pavithra Krishnan, Yingzhi Liu, Daisy YM Ng, et al (2020). “Molecular diagnosis of a novel coronavirus (2019-nCoV) causing an outbreak of pneumonia.” Clinical chemistry 66, no. 4: 549-555. [CrossRef]
- Chung, Michael, Adam Bernheim, Xueyan Mei, Ning Zhang, Mingqian Huang, Xianjun Zeng, Jiufa Cui et al (2020). “CT imaging features of 2019 novel coronavirus (2019-nCoV).” Radiology.
- D.Dansana, R. D.Dansana, R. Kumar, A. Bhattacharjee, et al. (2020), “Early diagnosis of COVID-19-affected patients based on X-ray and computed tomography images using deep learning algorithm,” Soft Computing, p, 1–9,.
- Du, J.-X. , et al. (2007), Shape recognition based on neural networks trained by differential evolution algorithm. Neurocomputing. 70(4-6): p. 896-903. [CrossRef]
- Gómez-Echavarría, Alejandro, Juan P. Ugarte, and Catalina Tobón (2020). “The fractional Fourier transform as a biomedical signal and image processing tool: A review.” Biocybernetics and Biomedical Engineering 40, no. 3: 1081-1093. [CrossRef]
- Gupta, Siddharth (2022). “Accurate prognosis of Covid-19 using CT scan images with deep learning model and machine learning classifiers.” Indian Journal of Radio & Space Physics (IJRSP) 50, no. 1: 19-24.
- Houssein, E. H. , Abohashima, Z., Elhoseny, M., & Mohamed, W. M. (2022). Hybrid quantum-classical convolutional neural network model for COVID-19 prediction using chest X-ray images. Journal of Computational Design and Engineering, 9(2), 343-363. [CrossRef]
- Houssein, E. H. , Helmy, B. E. D., Oliva, D., Jangir, P., Premkumar, M., Elngar, A. A., & Shaban, H. (2022). An efficient multi-thresholding based COVID-19 CT images segmentation approach using an improved equilibrium optimizer. Biomedical Signal Processing and Control. 73, 103401.. [CrossRef]
- Hu, S. , Gao, Y., Niu, Z., Jiang, Y., Li, L., Xiao, X.,... & Yang, G. (2020). Weakly supervised deep learning for Covid-19 infection detection and classification from ct images. IEEE Access 8, 118869–118883. [CrossRef]
- Huang C, Wang Y, Li X et al (2020) Clinical features of patients infected with 2019 novel coronavirus in Wuhan, China. Lancet 395:497–506.
- Huibing Wang, Jinbo Xiong, Zhiqiang Yao, Mingwei Lin, and Jun Ren (2017). Research survey on support vector machine. In Proceedings of the 10th, EAI International Conference on Mobile Multimedia Communications pages 95–103.
- Iwai, Reiko, and Hiroyuki Yoshimura (2010). “A new method for improving the robustness of registered fingerprint data using the fractional Fourier transform.” Int’l J. of Communications, Network and System Sciences 3, no. 09: 722. [CrossRef]
- Kassania, S. H. , Kassanib, P. H., Wesolowskic, M. J., Schneidera, K. A., & Detersa, R. (2021). Automatic detection of coronavirus disease (COVID-19) in X-ray and CT images: a machine learning based approach. Biocybernetics and Biomedical Engineering. 41(3), 867-879.. [CrossRef]
- M. Kaur, V. M. Kaur, V. Kumar, V. Yadav, D. Singh, N. Kumar, and N. N. Das (2021), “Metaheuristic-based deep COVID-19 screening model from chest X-ray images,” Journal of Healthcare Engineering, Article ID 8829829, 2021. [CrossRef]
- Khan, A. , Shah, J., Bhat, M. (2020), CoroNet: A Deep Neural Network for Detection and Diagnosis of Covid-19 from Chest X-ray Images. [CrossRef]
- Kumar, Gaurav, and Pradeep Kumar Bhatia (2014). “A Detailed Review of Feature Extraction in Image Processing Systems,” 2014 Fourth International Conference on Advanced Computing & Communication Technologies.
- S. Kumar, V. S. Kumar, V. Maheshwari, J. Prabhu, et al. (2020), “Social-economic impact of COVID-19 outbreak in India,” International Journal of Pervasive Computing and Communications, vol. 16, no. 4, pp. 309–319.
- Li, Qun, Xuhua Guan, Peng Wu, Xiaoye Wang, Lei Zhou, Yeqing Tong, Ruiqi Ren, et al (2020). “Early transmission dynamics in Wuhan, China, of novel coronavirus–infected pneumonia.” New England journal of medicine.
- Mendlovic, David, Haldun M. Ozaktas, and Adolf W. Lohmann (1993). “Fourier transforms of fractional order and their optical interpretation.” In Optical Computing, pp. OWD-6. Optica Publishing Group.
- S. K. Mathivanan, P. S. K. Mathivanan, P. Jayagopal, S. Ahmed, et al. (2021), “Adoption of e-learning during the lockdown in India,” International Journal of System Assurance Engineering and Management, pp. 1–10.
- V. Namias (1980), The fractional order Fourier transform and its application to quantum mechanics, IMA J. Appl. Math. (Institute Math. Its Appl.) 25 241–265. [CrossRef]
- Oulefki, S. Agaian, T. Trongtirakul, and A. Kassah Laouar (2021), “Automatic COVID-19 lung infected region segmentation and measurement using CT-scans images,” Pattern Recognition, vol. 114, article 107747. [CrossRef]
- Ouyang, X. , Huo, J., Xia, L., Shan, F., Liu, J., Mo, Z.,... & Shen, D. (2020). Dual-sampling attention network for diagnosis of COVID-19 from community-acquired pneumonia. IEEE Transactions on Medical Imaging. 39(8), 2595-2605. [CrossRef]
- Pathak, Y. , Shukla, P. K., Tiwari, A., Stalin, S., & Singh, S. (2020). Deep transfer learning based classification model for COVID-19 disease. IRBM. [CrossRef]
- K. B. Priya, P. K. B. Priya, P. Rajendran, S. Kumar, et al. (2020), “Pediatric and geriatric immunity network mobile computational model for COVID-19,” International Journal of Pervasive Computing and Communications, vol. 16, no. 4, pp. 321–330. [CrossRef]
- S. Rajendran and P. Jayagopal (2021), “Accessing COVID-19 epidemic outbreak in Tamilnadu and the impact of lockdown through epidemiological models and dynamic systems,” Measurement, vol. 169, article 108432. [CrossRef]
- Rawat, Waseem, and Zenghui Wang (2017). “Deep convolutional neural networks for image classification: A comprehensive review.” Neural computation 29, no. 9: 2352-2449.
- Salvador Garcia, Julian Luengo, Jose Antonio Saez, Victoria Lopez, and Francisco Herrera (2012). A survey of discretization techniques: taxonomy and empirical analysis in supervised learning. IEEE Transactions on Knowledge and Data Engineering, 25(4):734–750. [CrossRef]
- Shankar, K. , Mohanty, S. N., Yadav, K., Gopalakrishnan, T., & Elmisery, A. M. (2021). Automated COVID-19 diagnosis and classification using a convolutional neural network with a fusion-based feature extraction model. Cognitive Neurodynamics 1–14. [CrossRef]
- Shen, C. Yu, N., Cai, S., Zhou, J., Sheng, J., Liu, K., et al. (2020). Quantitative Computed Tomography Analysis for Stratifying the Severity of Coronavirus Disease 2019. J. Pharm. Anal. 10 (2), 123–129. [CrossRef]
- Soares, Eduardo, Plamen Angelov, Sarah Biaso, Michele Higa Froes, and Daniel Kanda Abe (2020). “SARS-CoV-2 CT-scan dataset: A large dataset of real patients CT scans for SARS-CoV-2 identification.” MedRxiv.
- Szegedy, C. , et al (2015). Going deeper with convolutions. in IEEE conference on computer vision and pattern recognition (CVPR). Boston, MA, USA: IEEE.
- Zahra Taghizadeh, Saeid Rashidi, Ahmad Shalbaf (2021). “Finger movements classification based on fractional Fourier transform coefficients extracted from surface EMG signals,” Biomedical Signal Processing and Control. [CrossRef]
- Tahamtan and, A. Ardebili (2020), ``Real-time RT-PCR in COVID-19 detection: Issues affecting the results,’’ Expert Rev. Mol. Diag., vol. 20, no. 5,p p. 453_454, Apr. [CrossRef]
- M. Venkatesan, S. K. Mathivanan, P. Jayagopal, et al. (2020), “Forecasting of the SARS-CoV-2 epidemic in India using SIR model, flatten curve and herd immunity,” Journal of Ambient Intelligence and Humanized Computing, pp. 1–9.
- Yue Yuan, Si Chen, Huichang Zhao, Wei Wu, Daniel M. Fleetwood, Enxia Zhang (2019). “A New Imaging Method for Forward-looking Linear-array SAR based on Fractional Fourier Transform,” 2019 IEEE Radar Conference (RadarConf).
- Wang D, Hu B, Hu C et al (2020) Clinical characteristics of 138 hospitalized patients with 2019 novel coronavirus-infected pneumonia in Wuhan, China. JAMA.
- S. Wang, B. Kang, X. Zeng, et al. (2021), “A deep learning algorithm using CT images to screen for Corona Virus Disease (COVID-19),” European Radiology, pp. 1–9. [CrossRef]
- Wang, Minghuan, et al (2020). “Deep learning-based triage and analysis of lesion burden for COVID-19: a retrospective study with external validation.” The Lancet Digital Health 2.10: e506-e515. [CrossRef]
- Wang, X. , Deng, X., Fu, Q., Zhou, Q., Feng, J., Ma, H.,... & Zheng, C. (2020). A weakly-supervised framework for COVID-19 classification and lesion localization from chest CT. IEEE transactions on medical imaging. 39(8), 2615-2625. [CrossRef]
- Wu, G. , Kim, M., Wang, Q., Munsell, B. C., and Shen, D. (2016). Scalable High-Performance Image Registration Framework by Unsupervised Deep Feature Representations Learning. IEEE Trans. Biomed. Eng. 63, 1505–1516. [CrossRef]
- Zhang, Naru, Lili Wang, Xiaoqian Deng, Ruiying Liang, Meng Su, Chen He, Lanfang Hu, et al (2020). “Recent advances in the detection of respiratory virus infection in humans.” Journal of medical virology 92, no. 4: 408-417. [CrossRef]
Figure 1.
Block diagram of the proposed method.
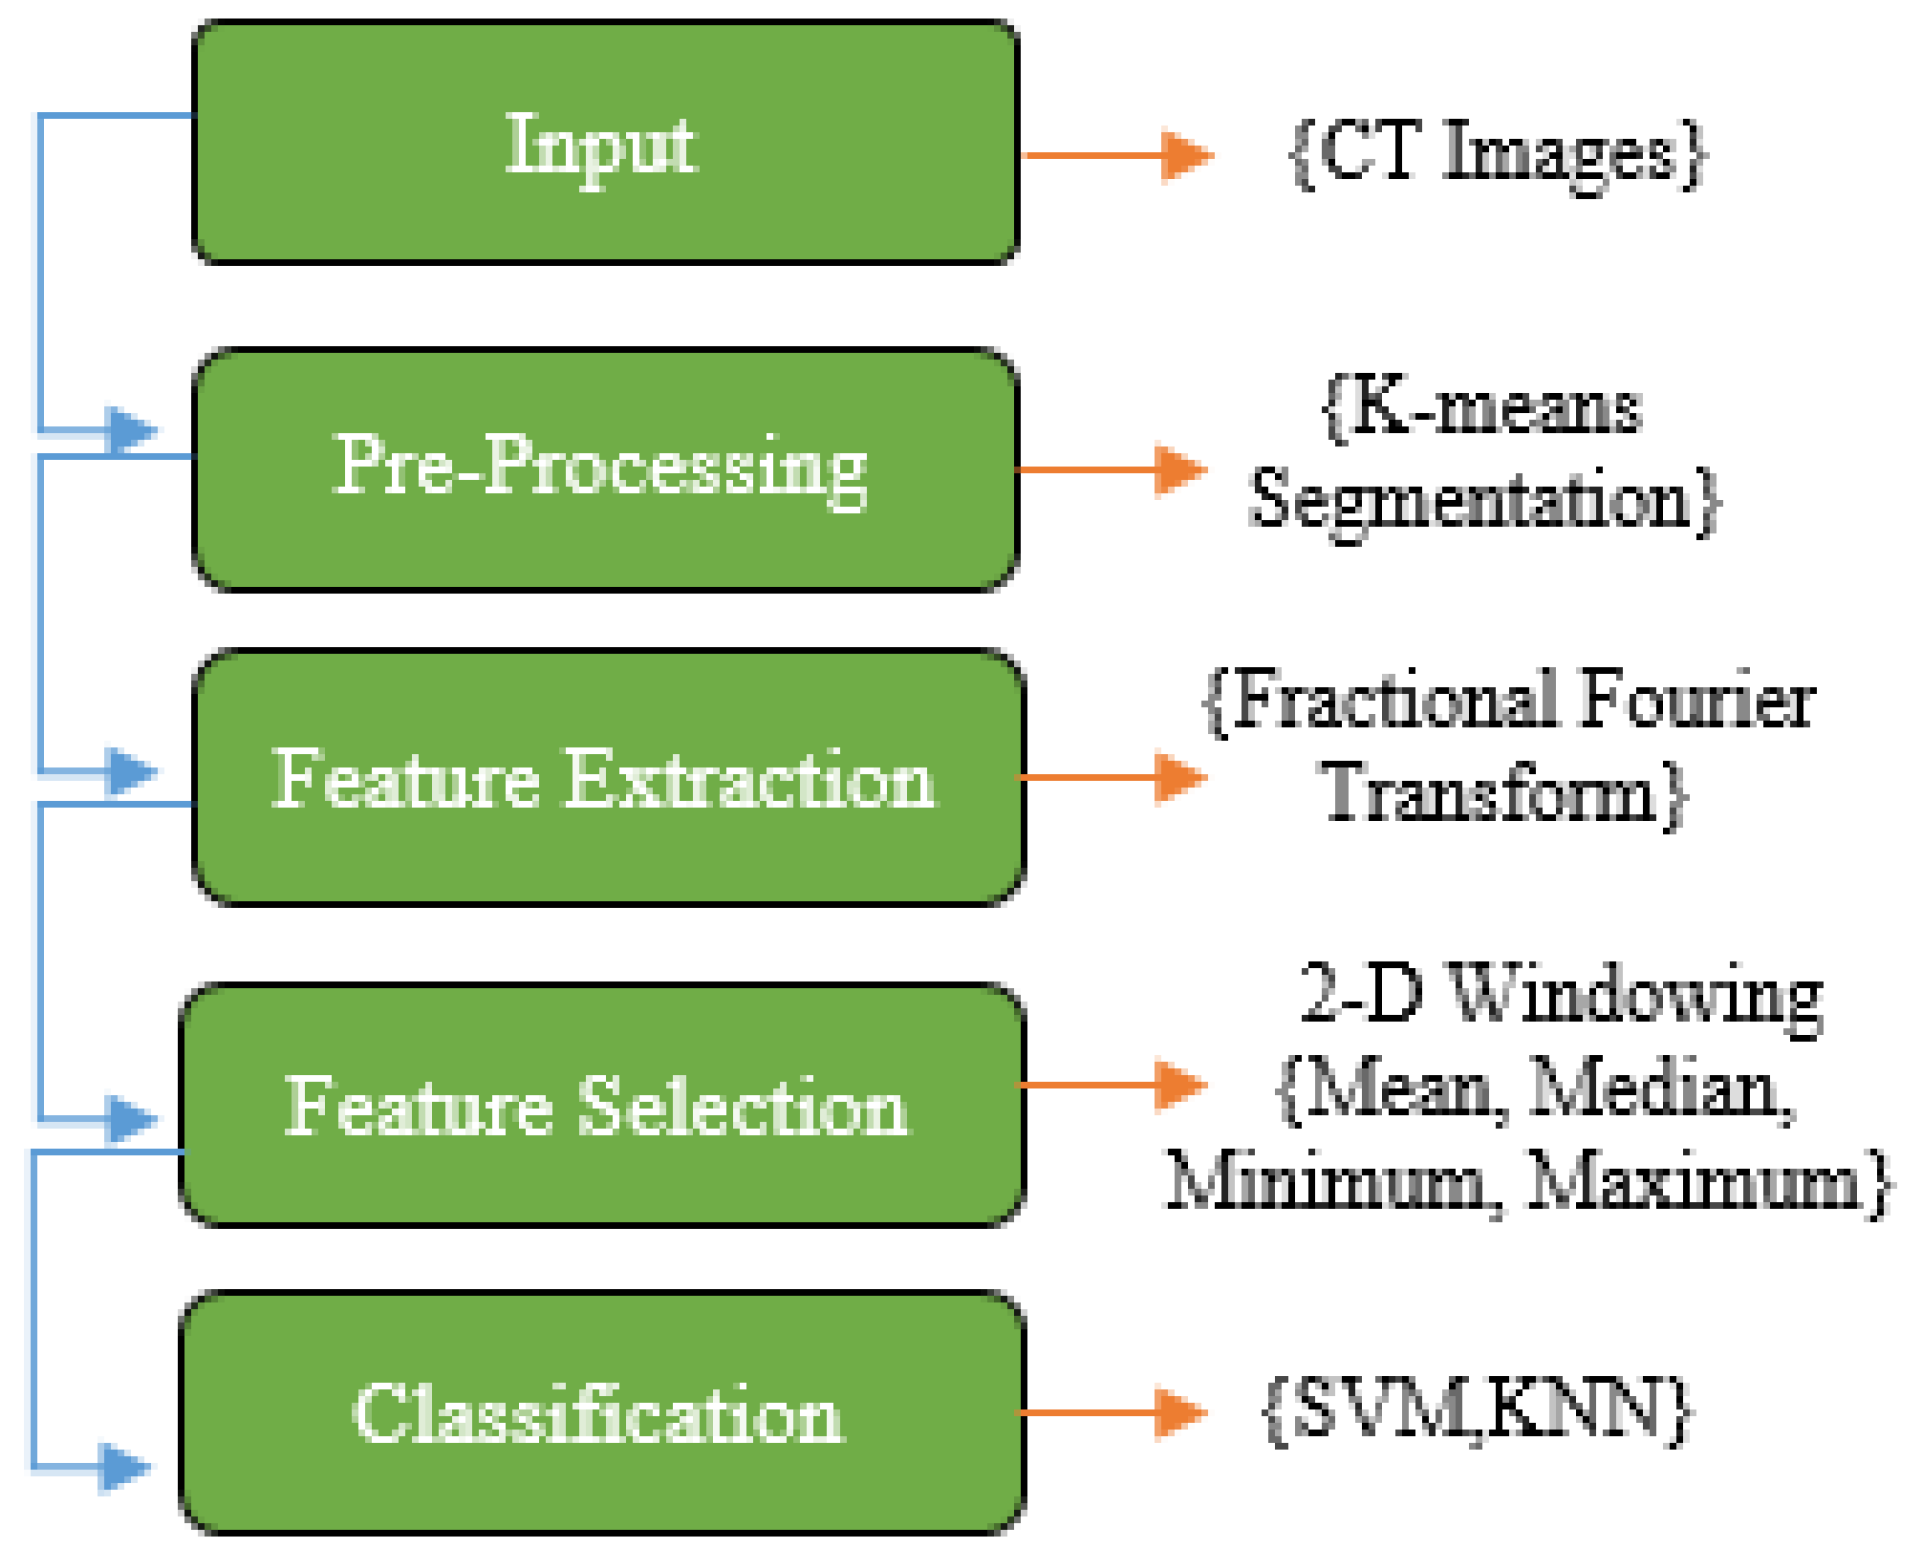
Figure 2.
Database sample images.
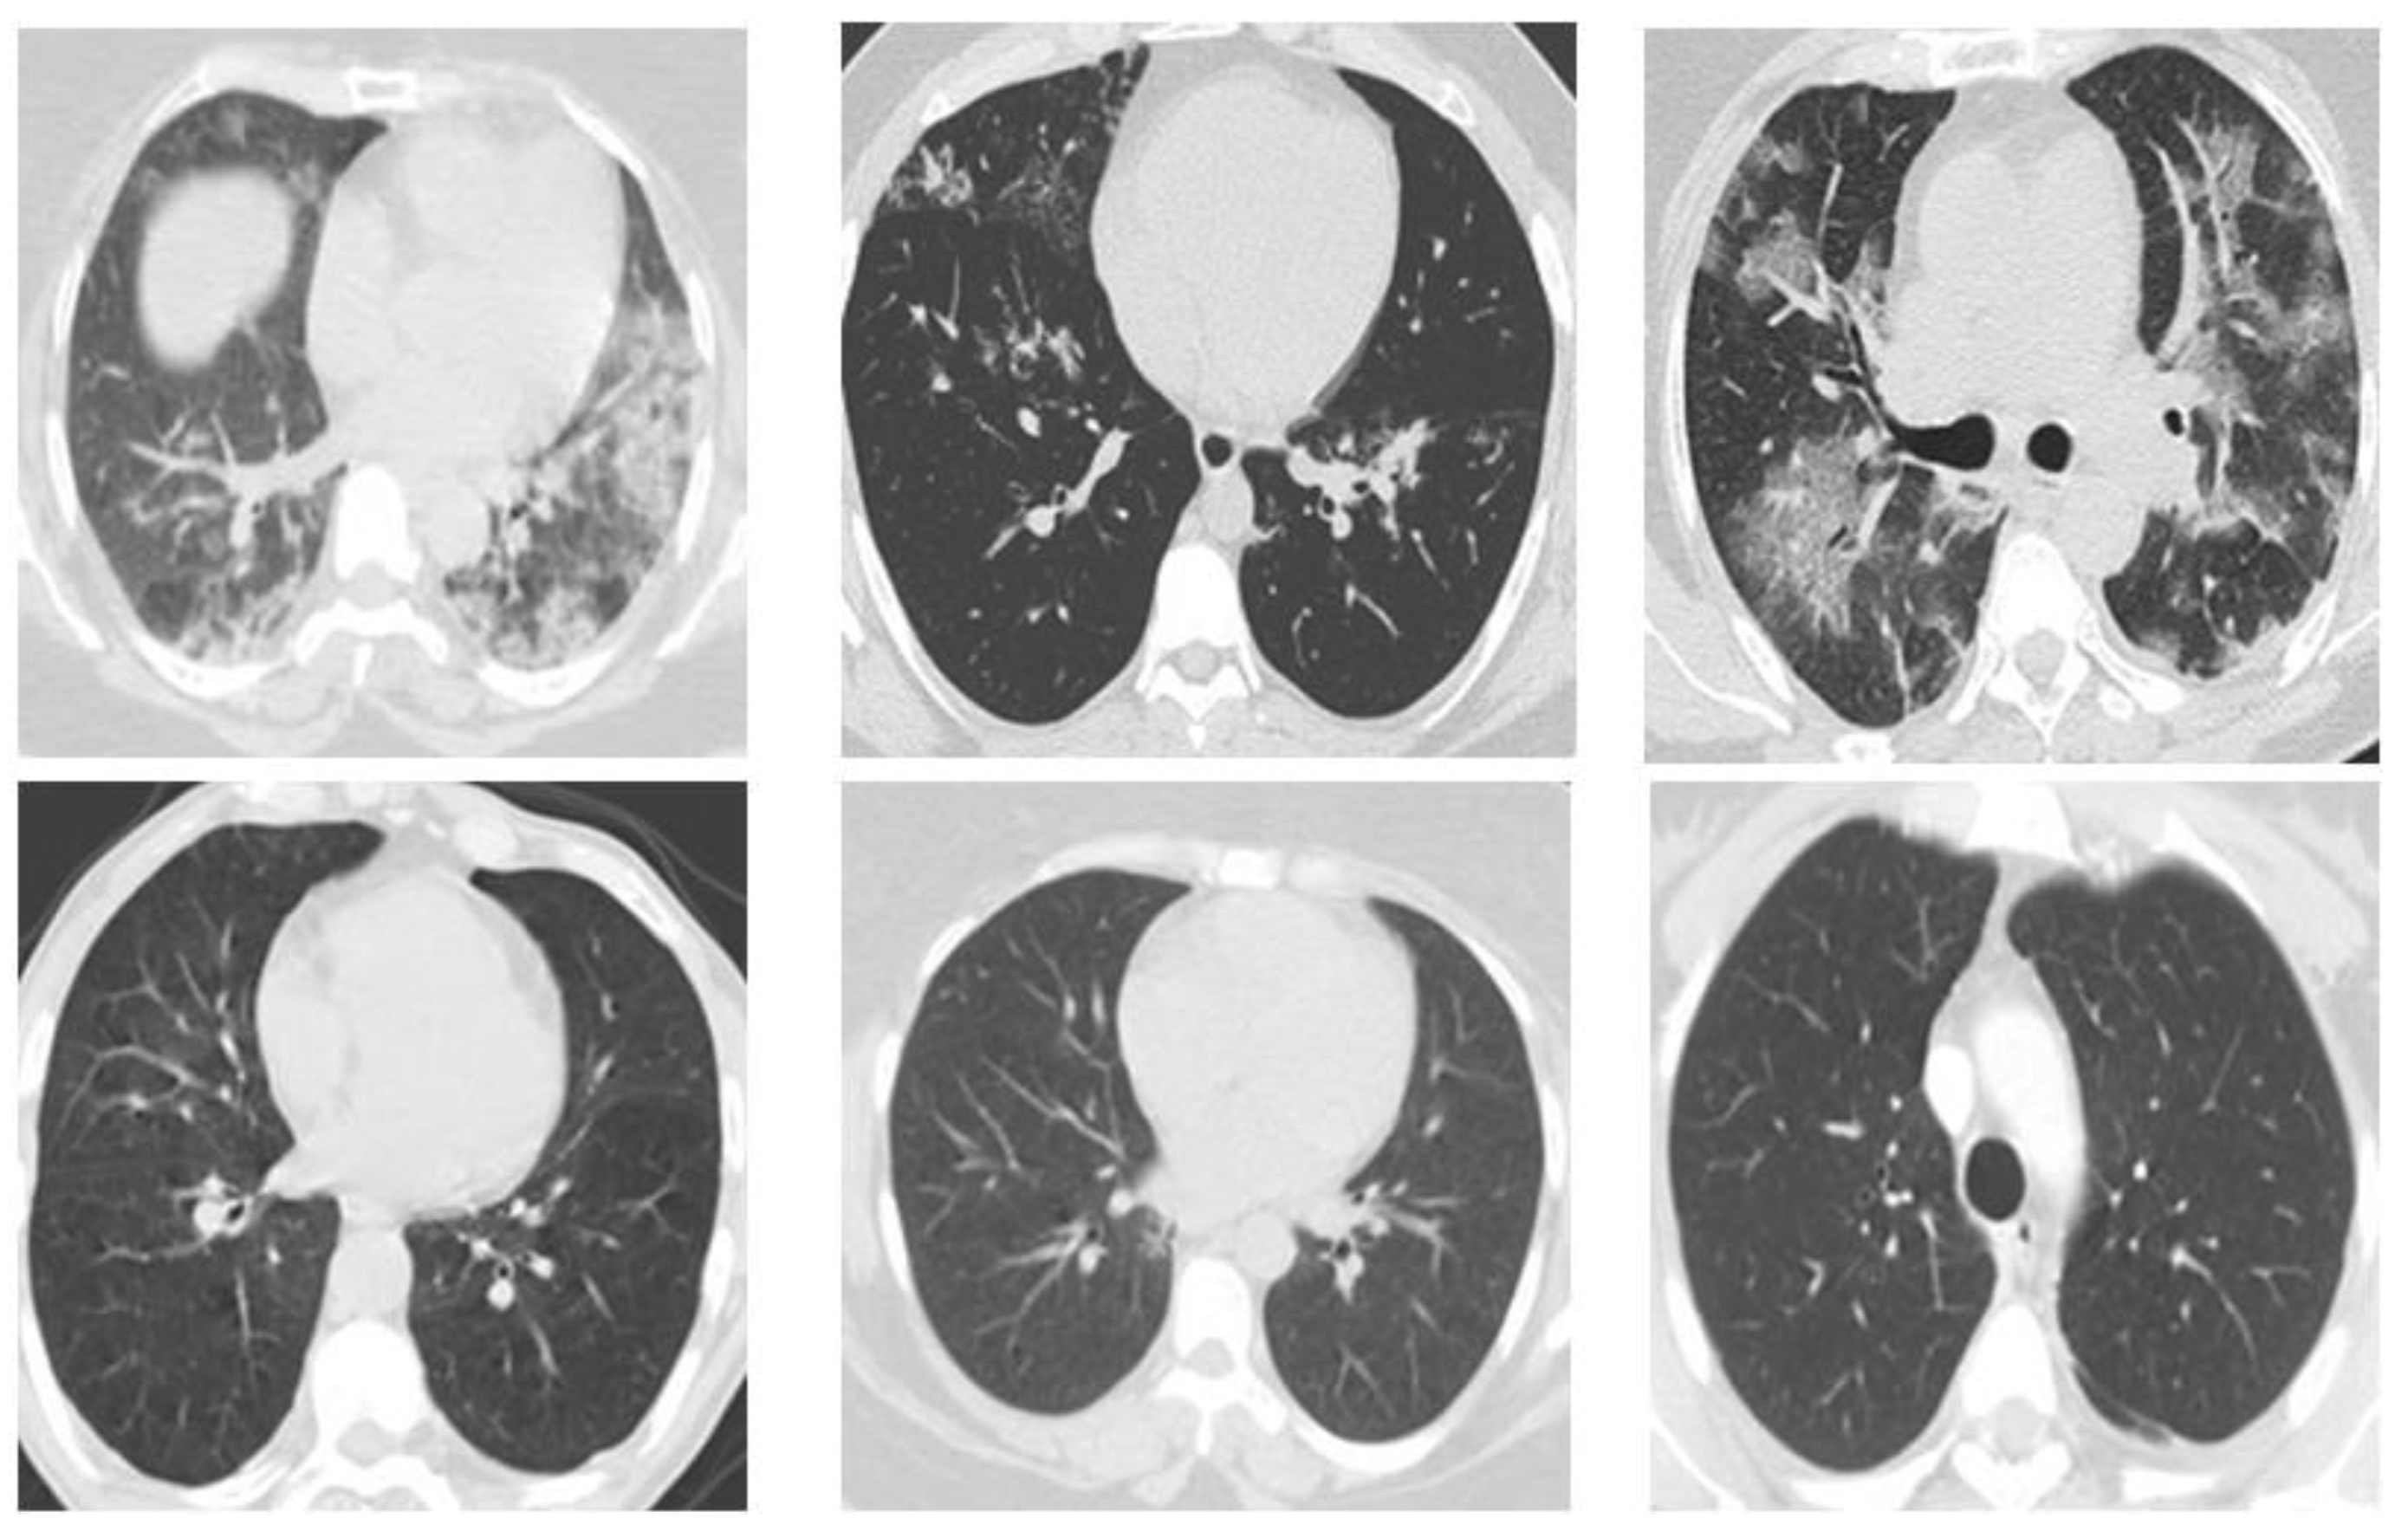
Figure 3.
The raw image of the lung of a person infected with Covid-19 (A), the image of the lung after pre-processing (B).
Figure 3.
The raw image of the lung of a person infected with Covid-19 (A), the image of the lung after pre-processing (B).

Figure 4.
FrFT is represented by two axes and whose axes are oriented by ϕ.
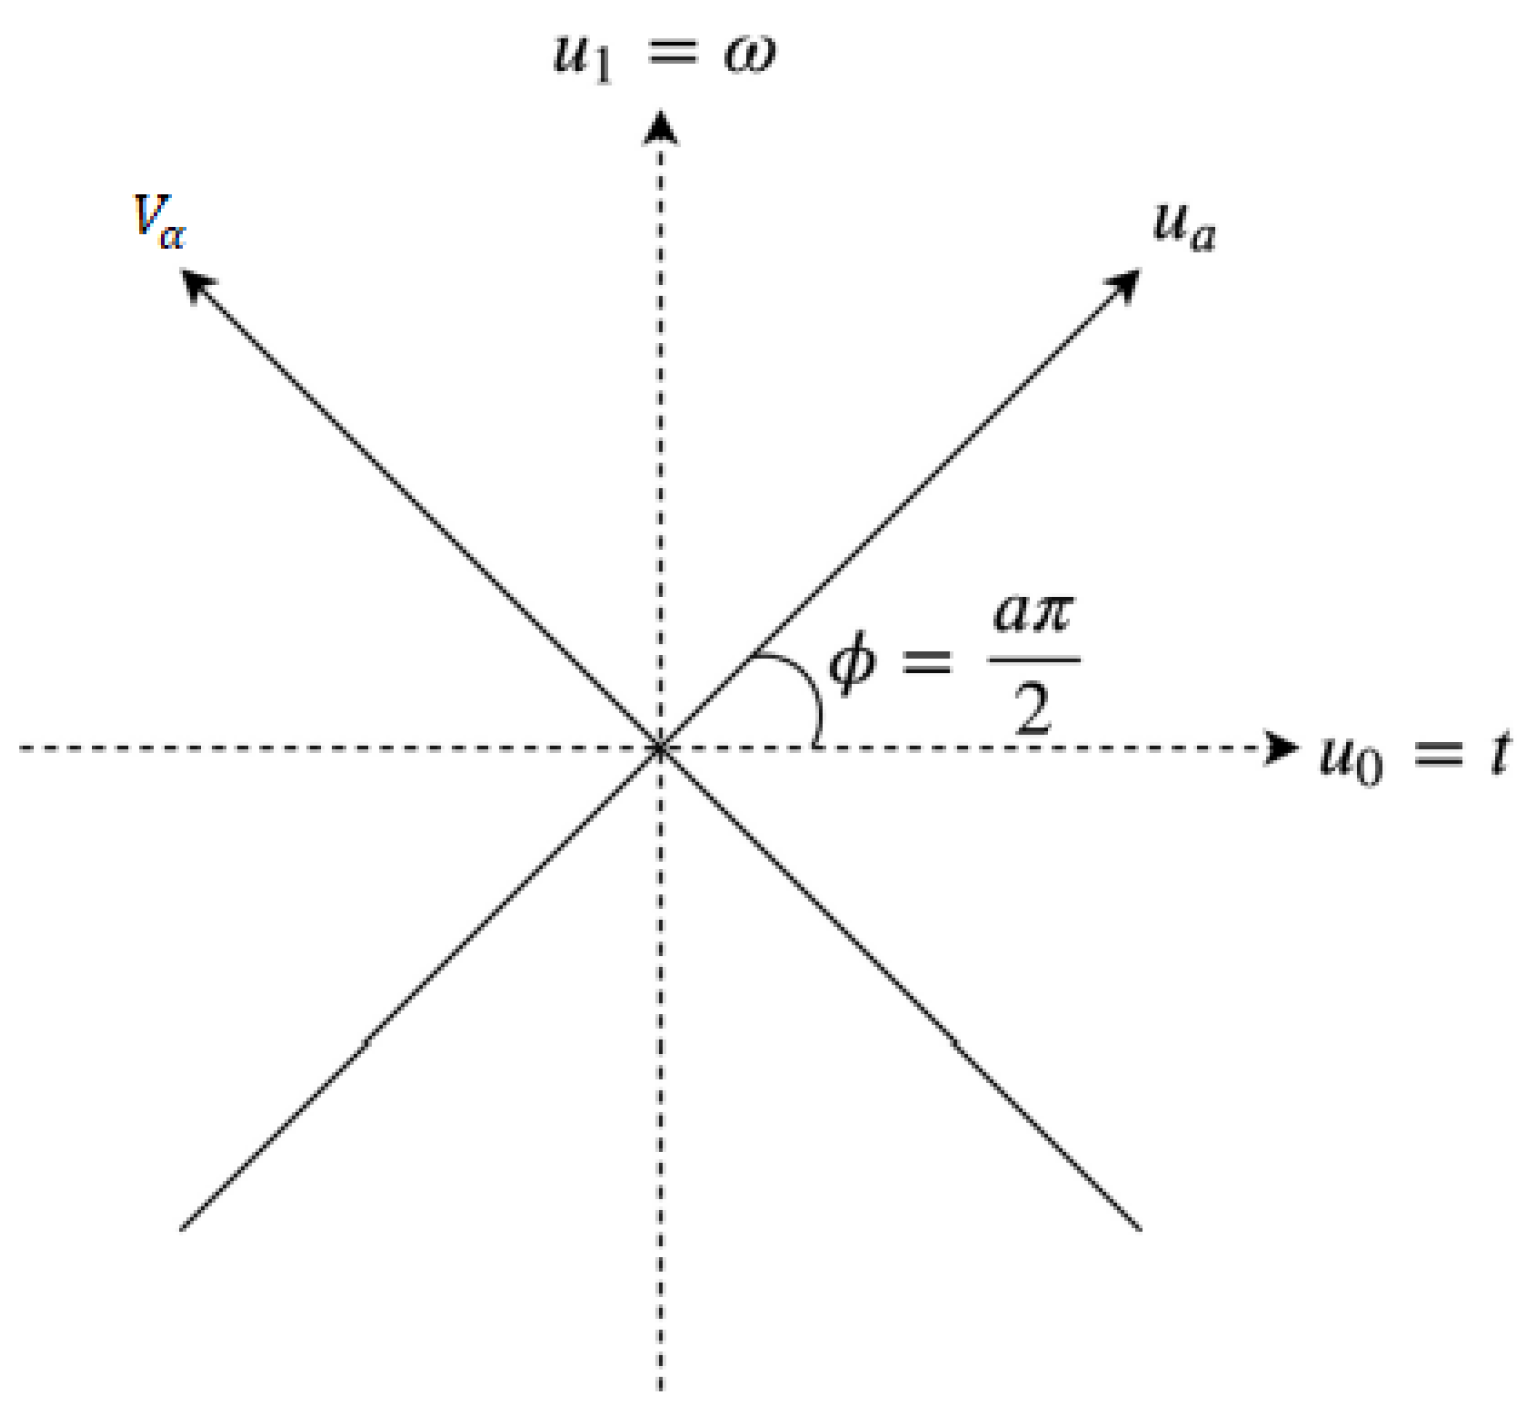
Figure 5.
An overview of the proposed method.
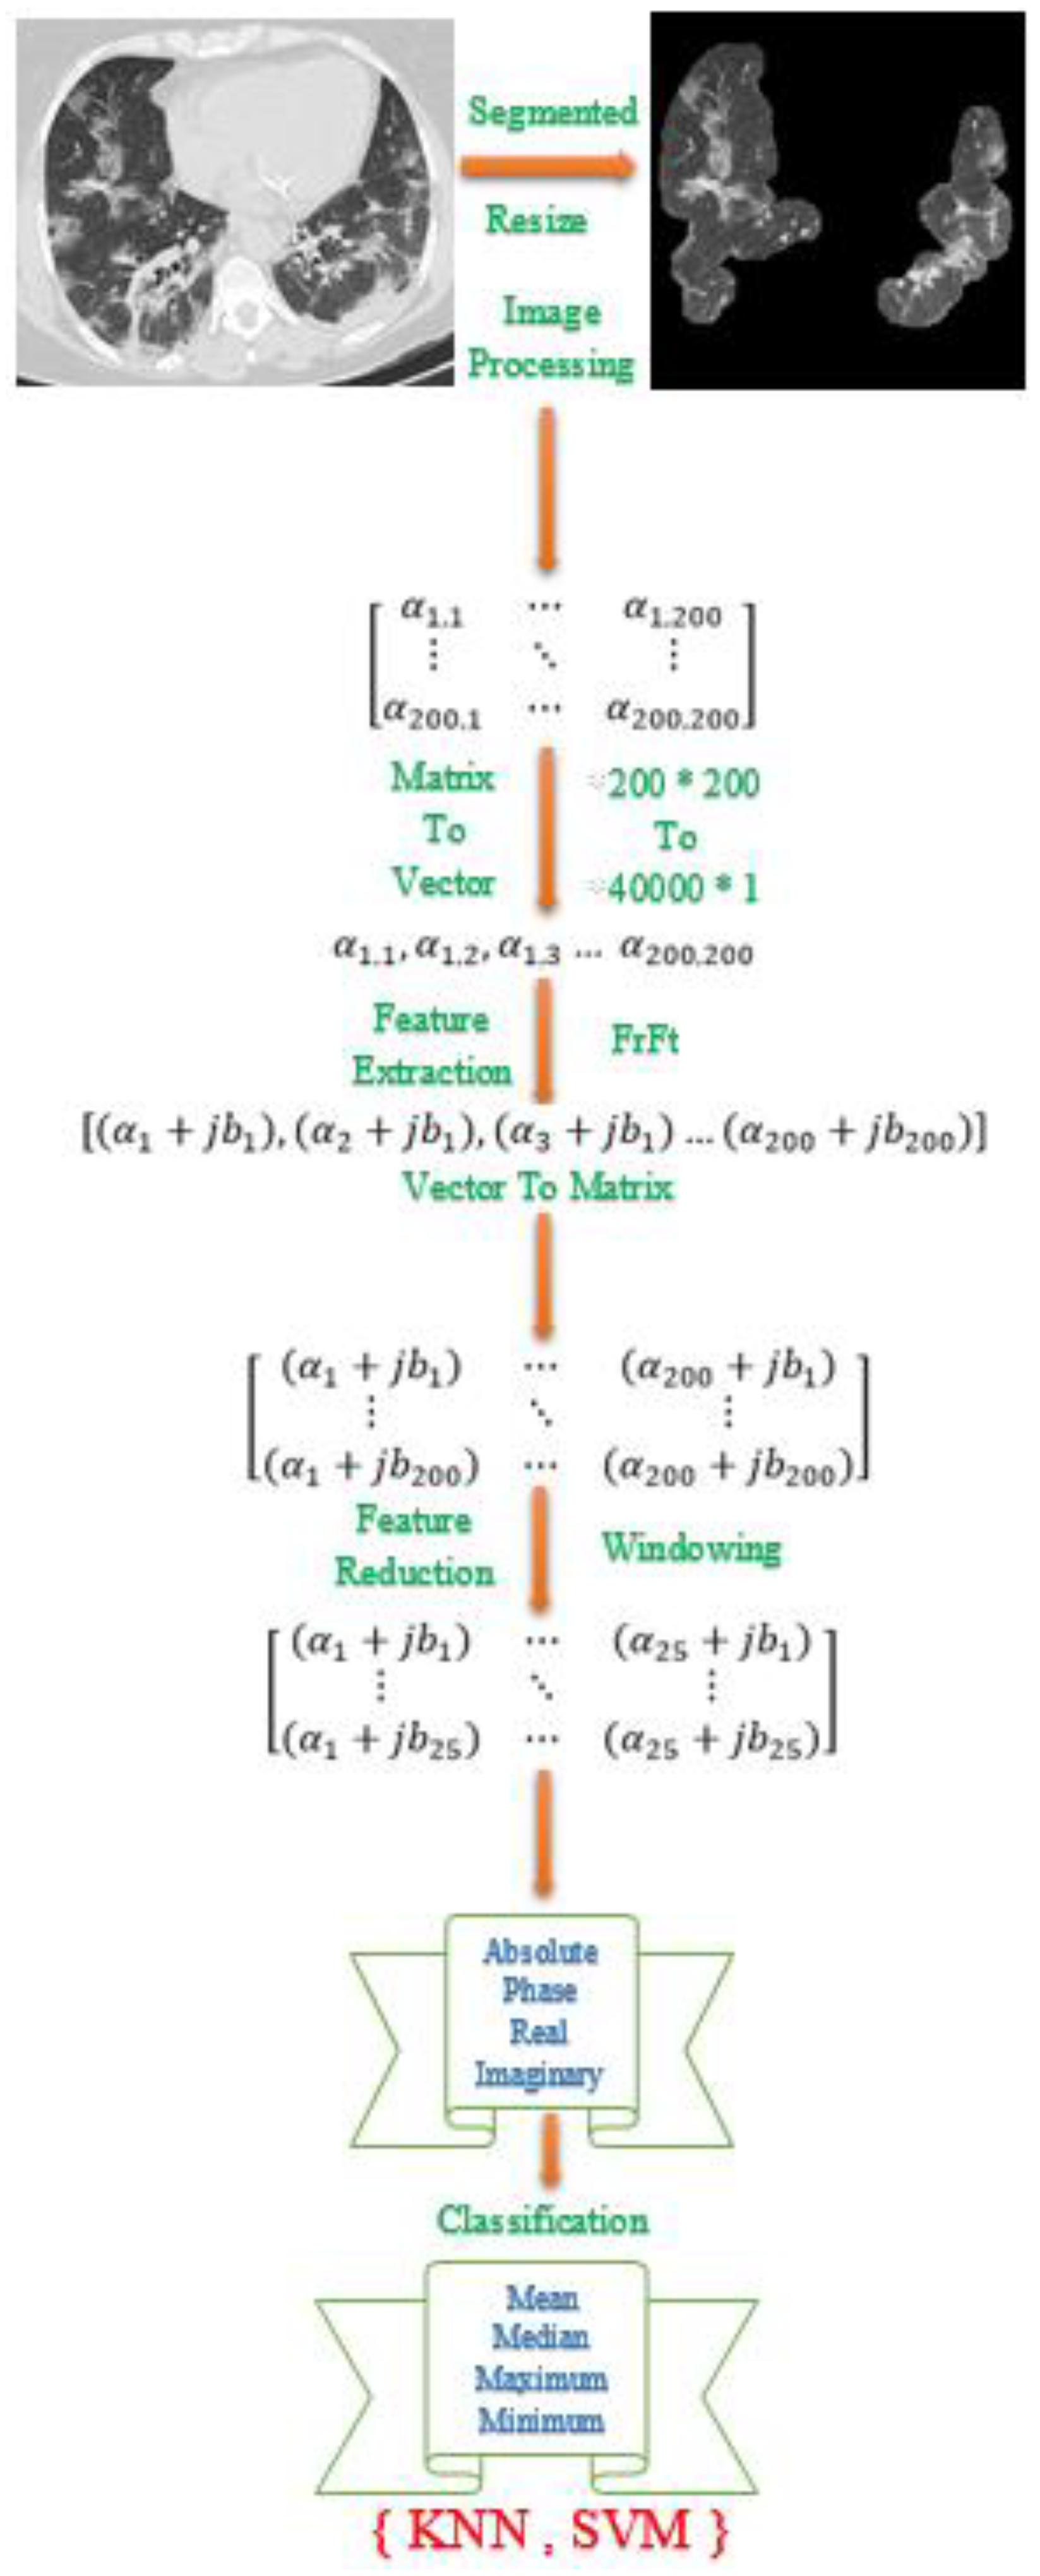
Figure 6.
Classification based on average results of fractional Fourier transform coefficients of imaginary, real, absolute value, and phase.
Figure 6.
Classification based on average results of fractional Fourier transform coefficients of imaginary, real, absolute value, and phase.
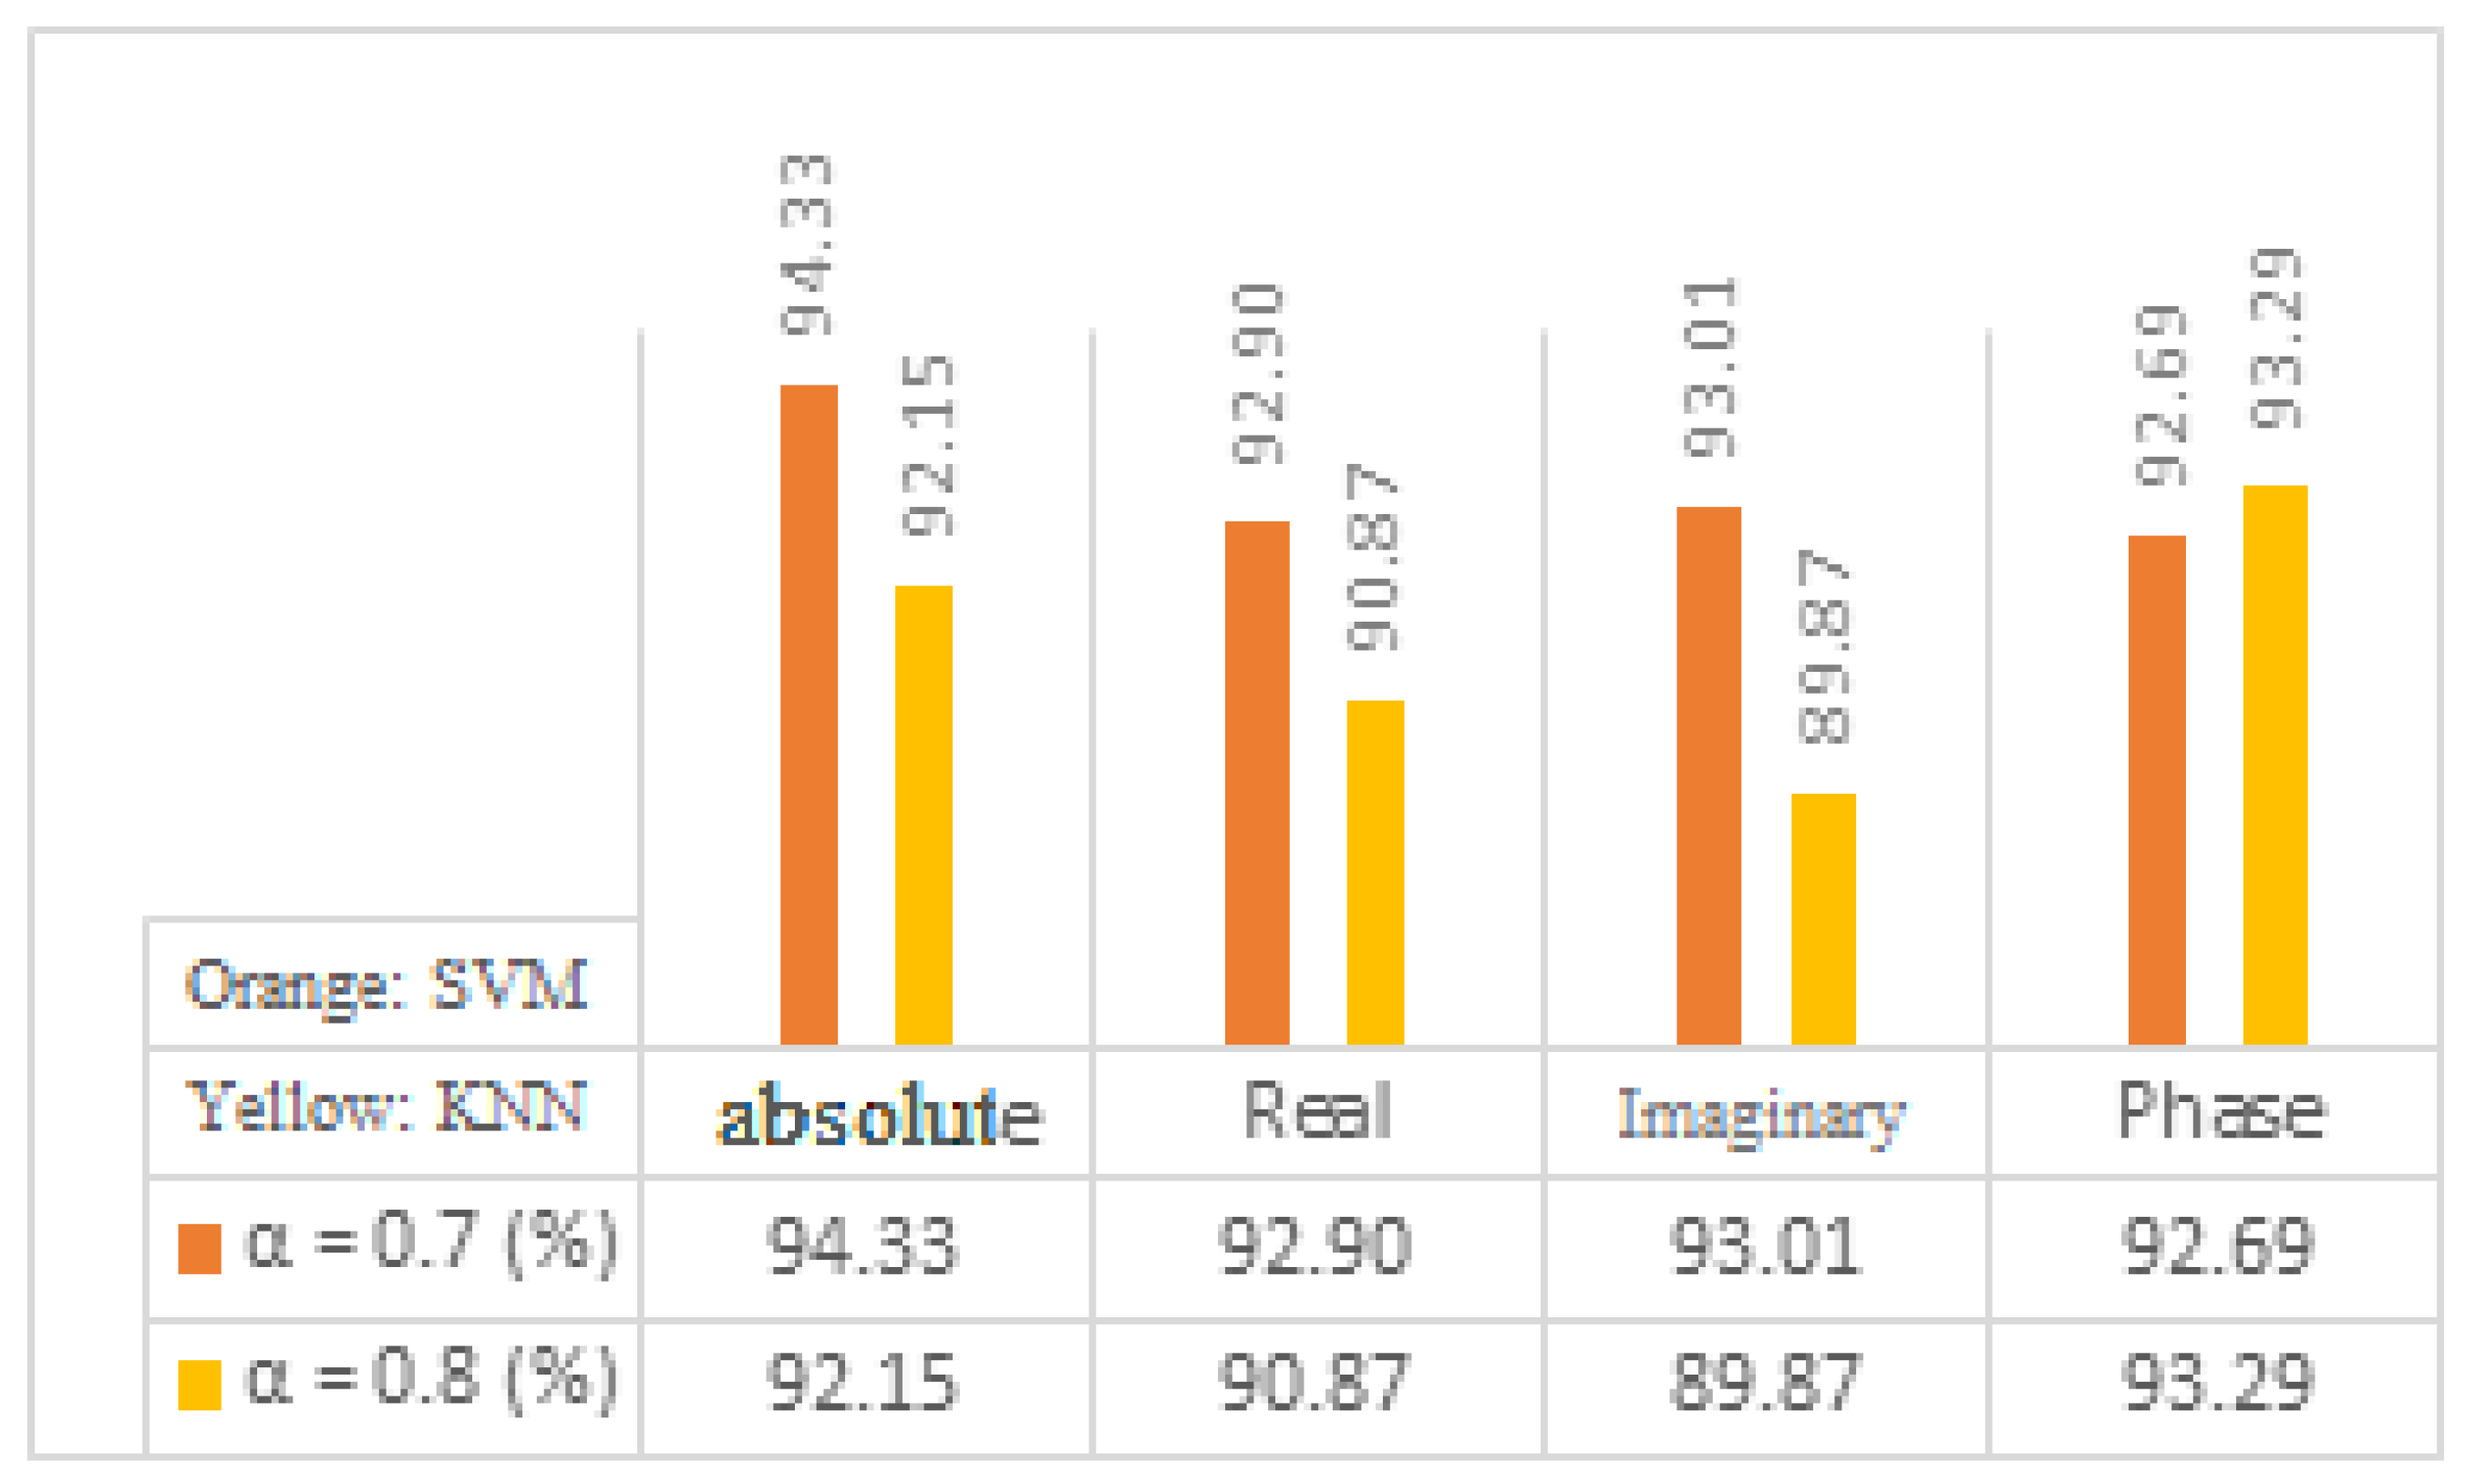
Figure 7.
The average accuracy result of KNN classification based on the number of K-neighbors for α = 0.8.
Figure 7.
The average accuracy result of KNN classification based on the number of K-neighbors for α = 0.8.
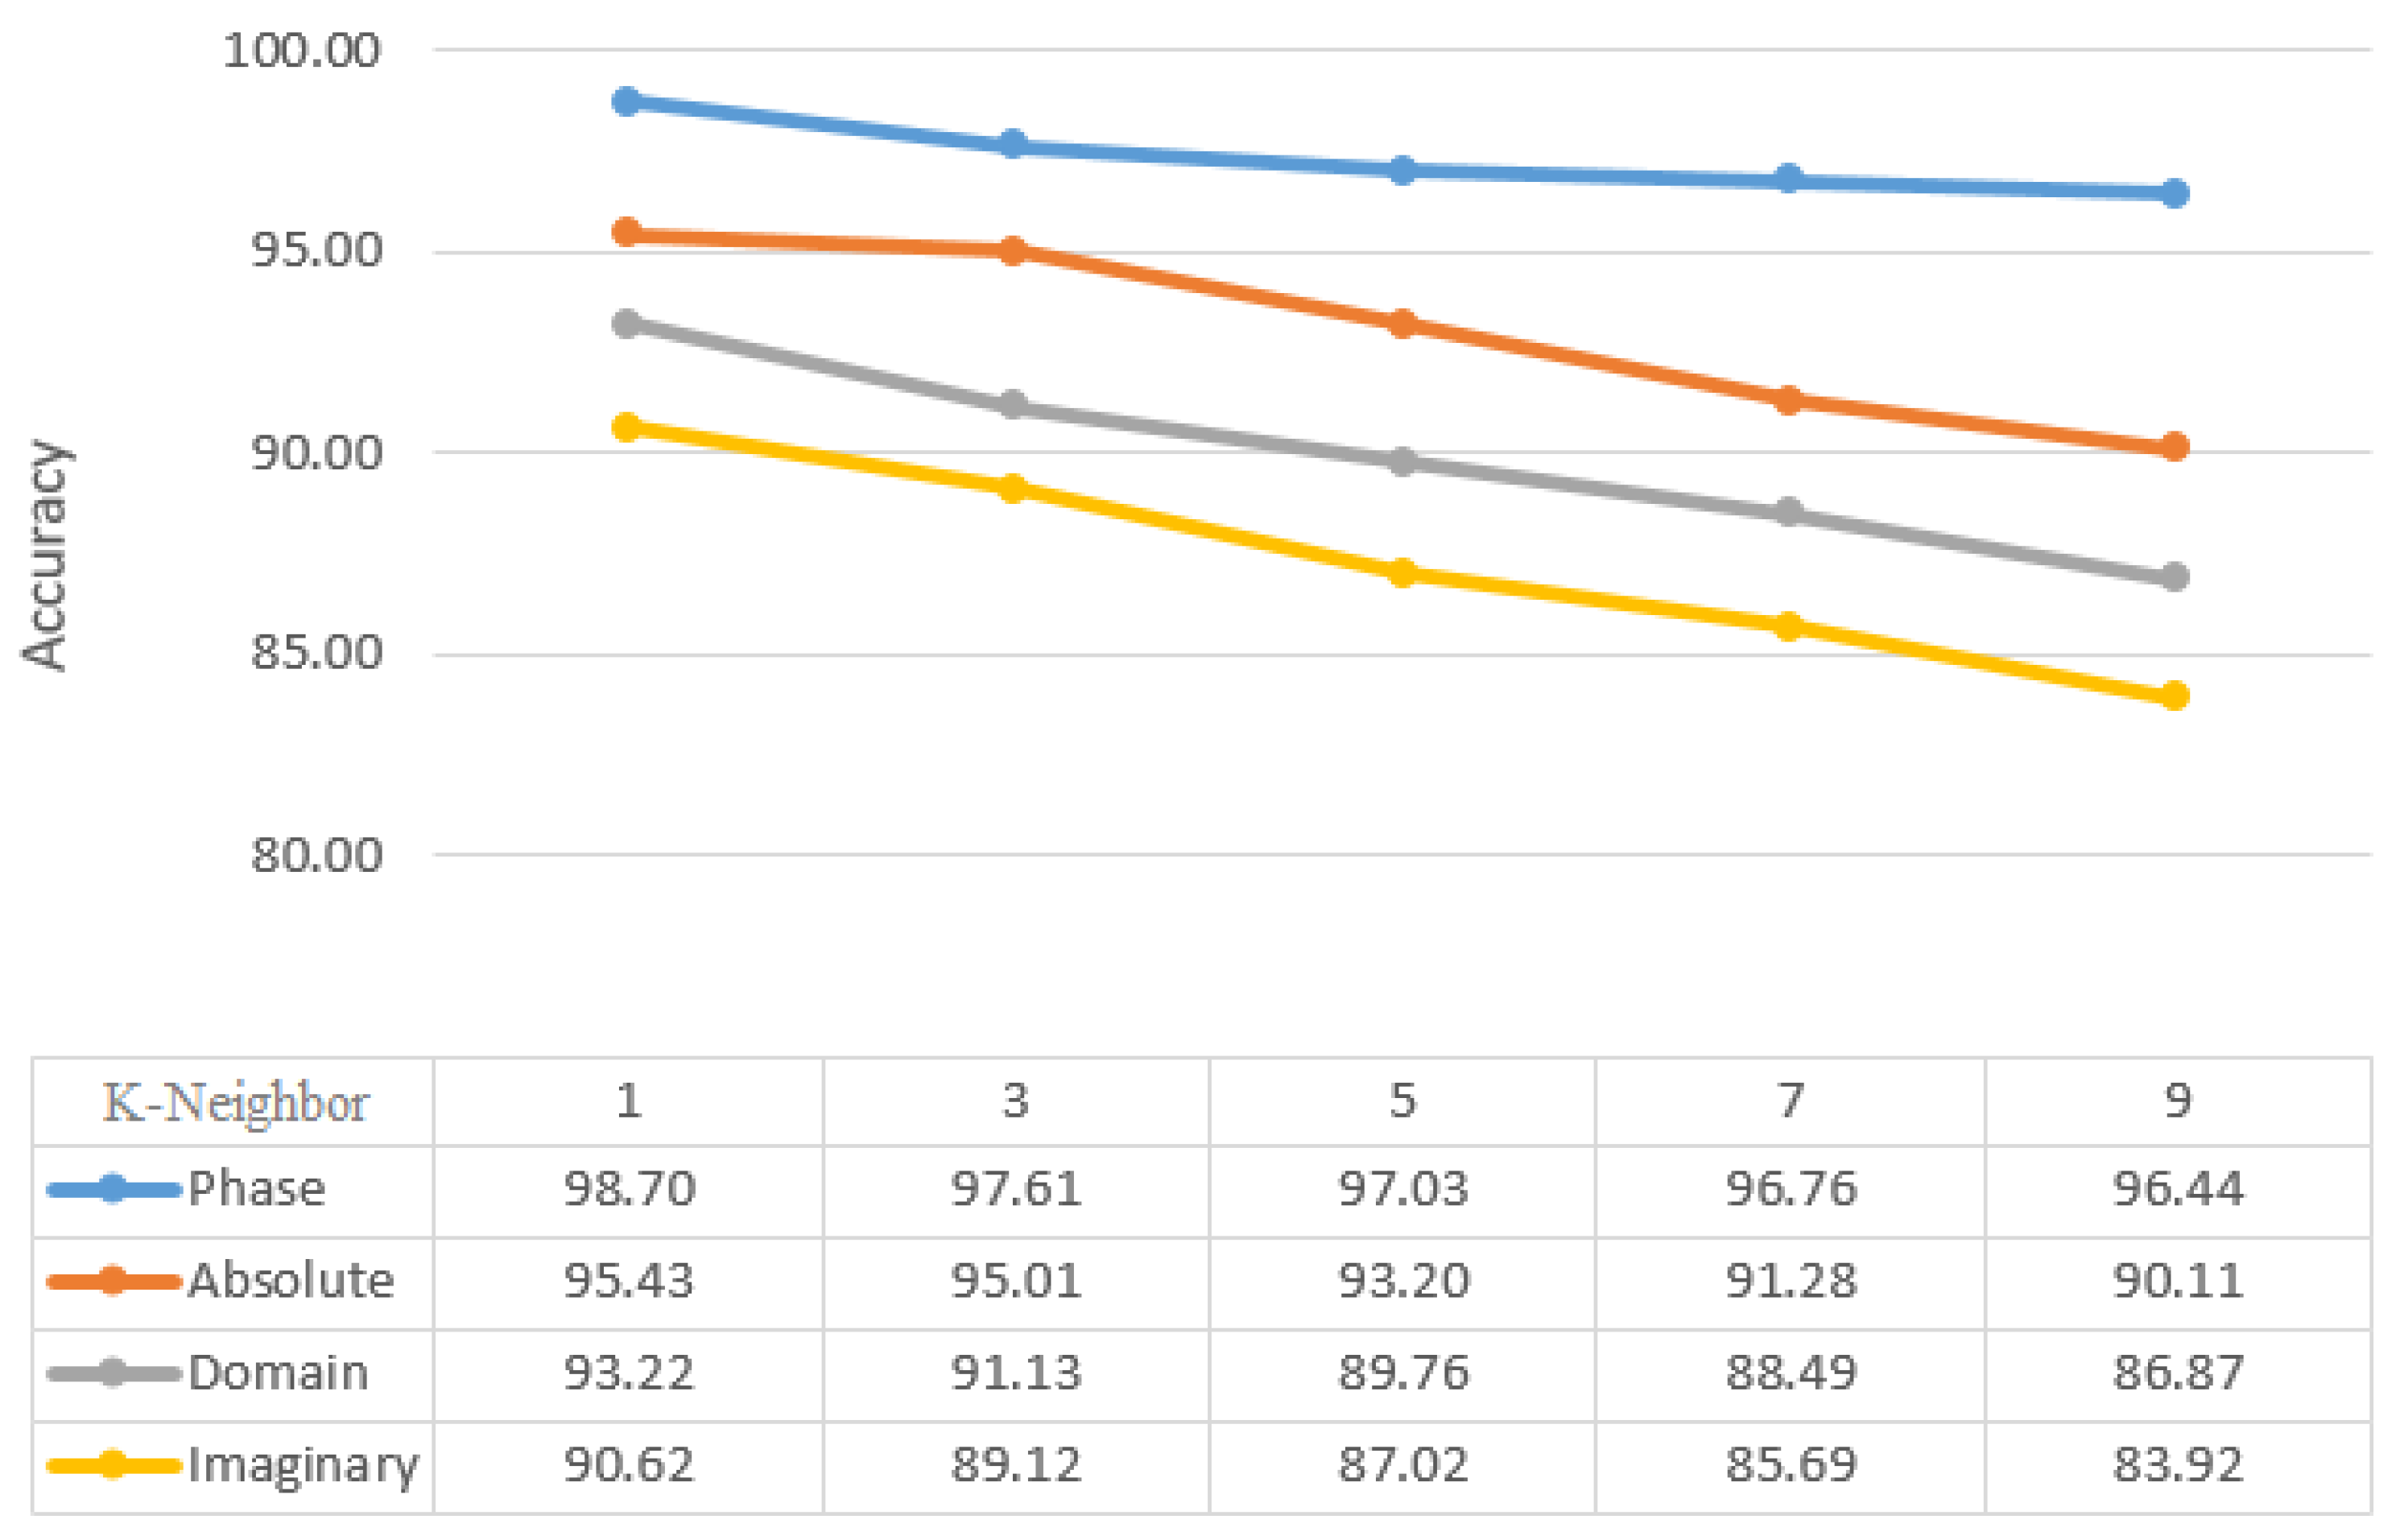
Figure 8.
The average accuracy results of the KNN classification based on distance type (Euclidean, Chebyshev, Mahalanobis, Minkowski) for α = 0.8.
Figure 8.
The average accuracy results of the KNN classification based on distance type (Euclidean, Chebyshev, Mahalanobis, Minkowski) for α = 0.8.
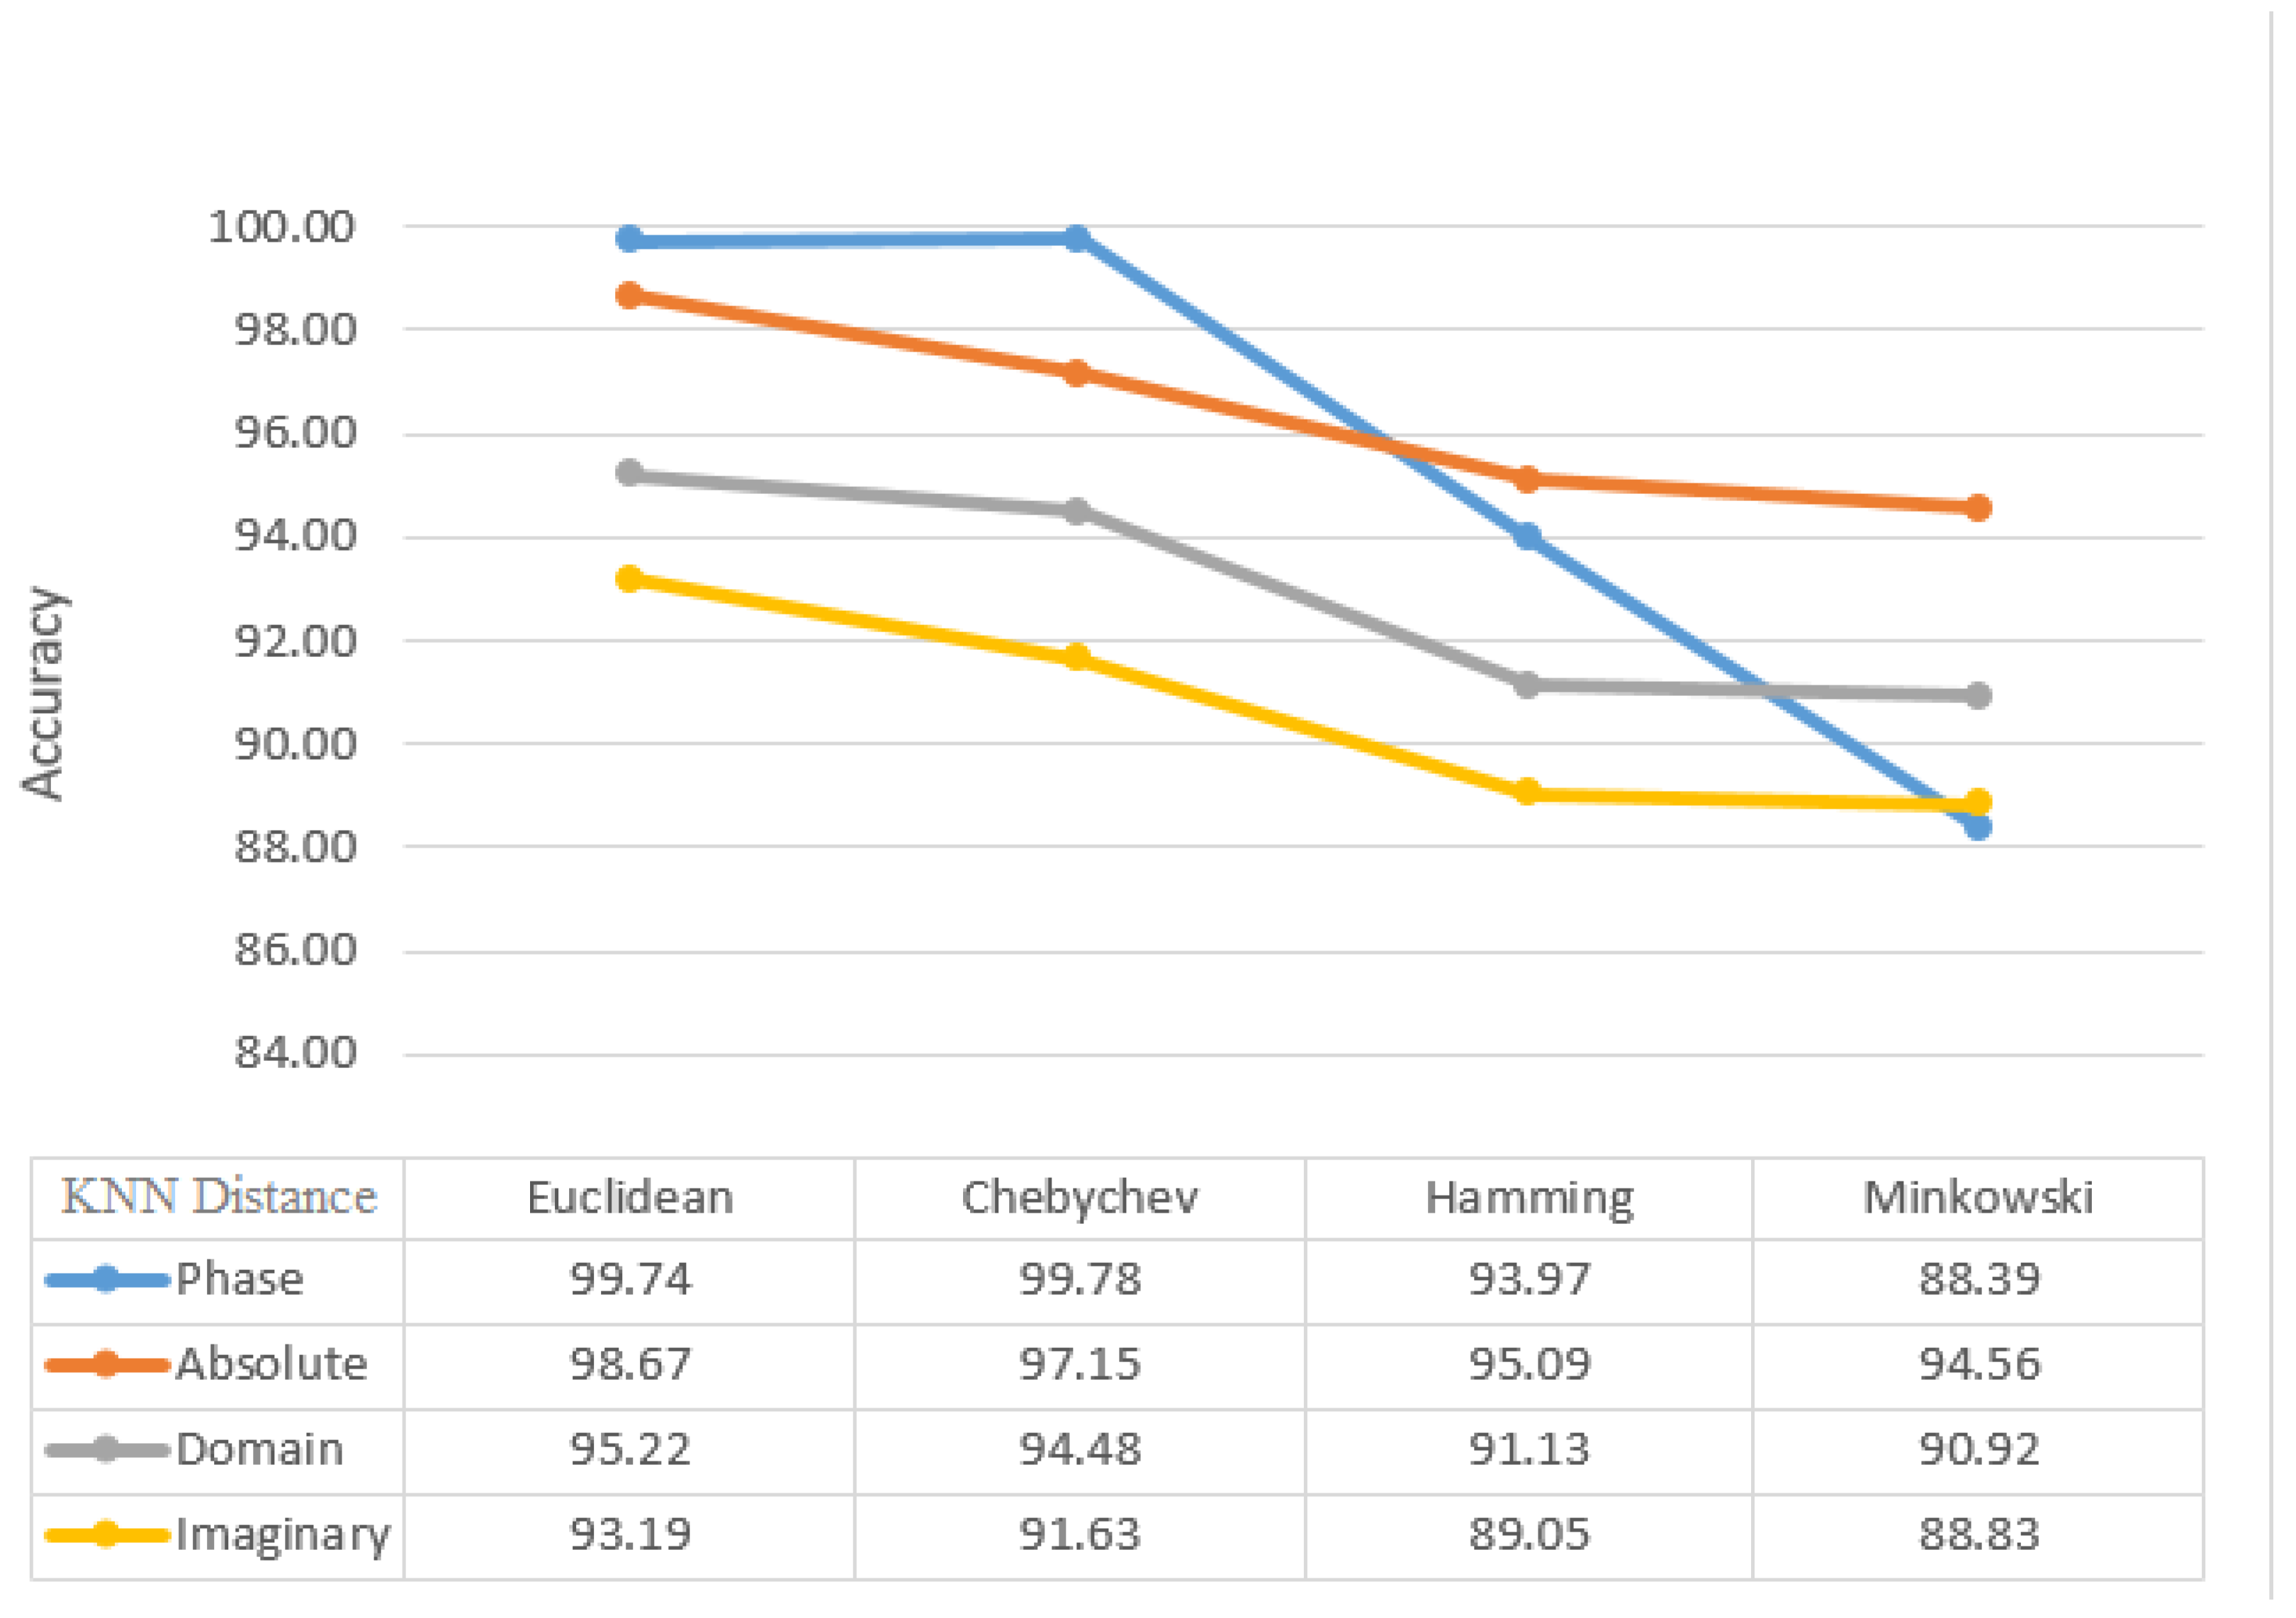
Figure 9.
KNN classification results based on statistical method after applying 2-D windowing and Euclidean distance with K-neighbor 1 (Mean, Median, Min, Max) for α = 0.8.
Figure 9.
KNN classification results based on statistical method after applying 2-D windowing and Euclidean distance with K-neighbor 1 (Mean, Median, Min, Max) for α = 0.8.
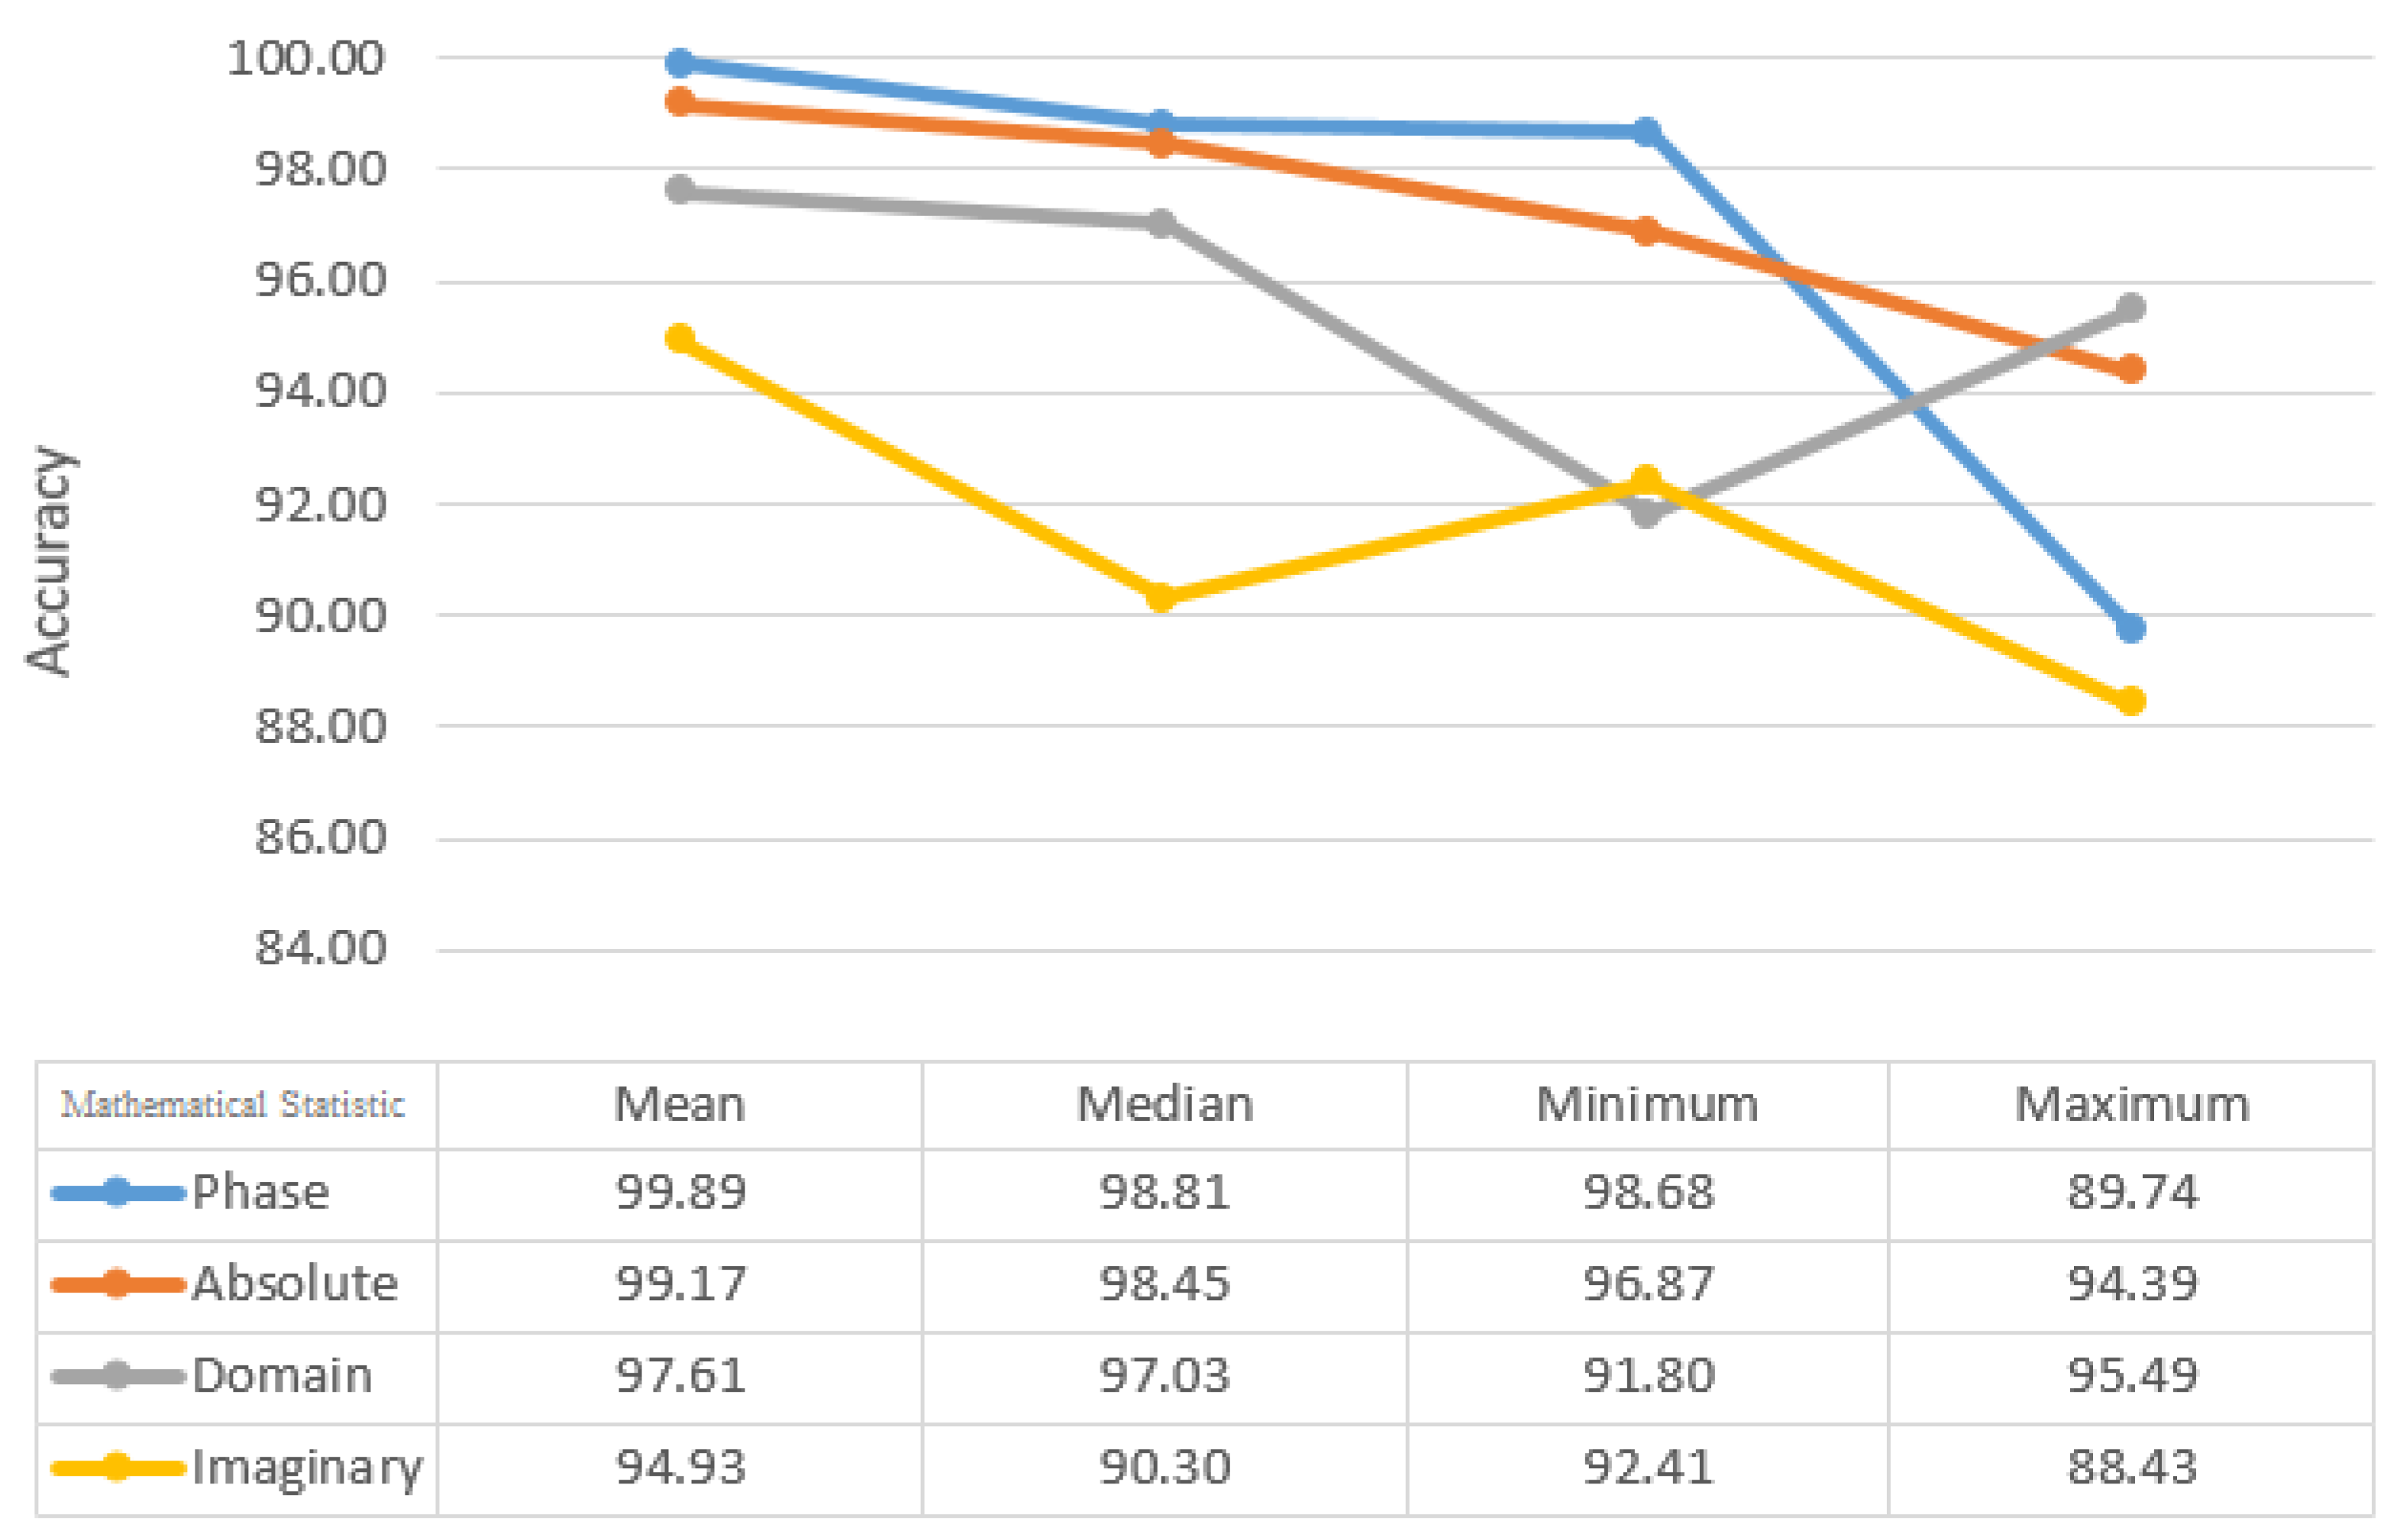
Figure 10.
Average results by number of features from α = 0.8, Euclidean distance with mean from phase for the KNN and, α = 0.7, Polynomial Kernel with median for the SVM.
Figure 10.
Average results by number of features from α = 0.8, Euclidean distance with mean from phase for the KNN and, α = 0.7, Polynomial Kernel with median for the SVM.
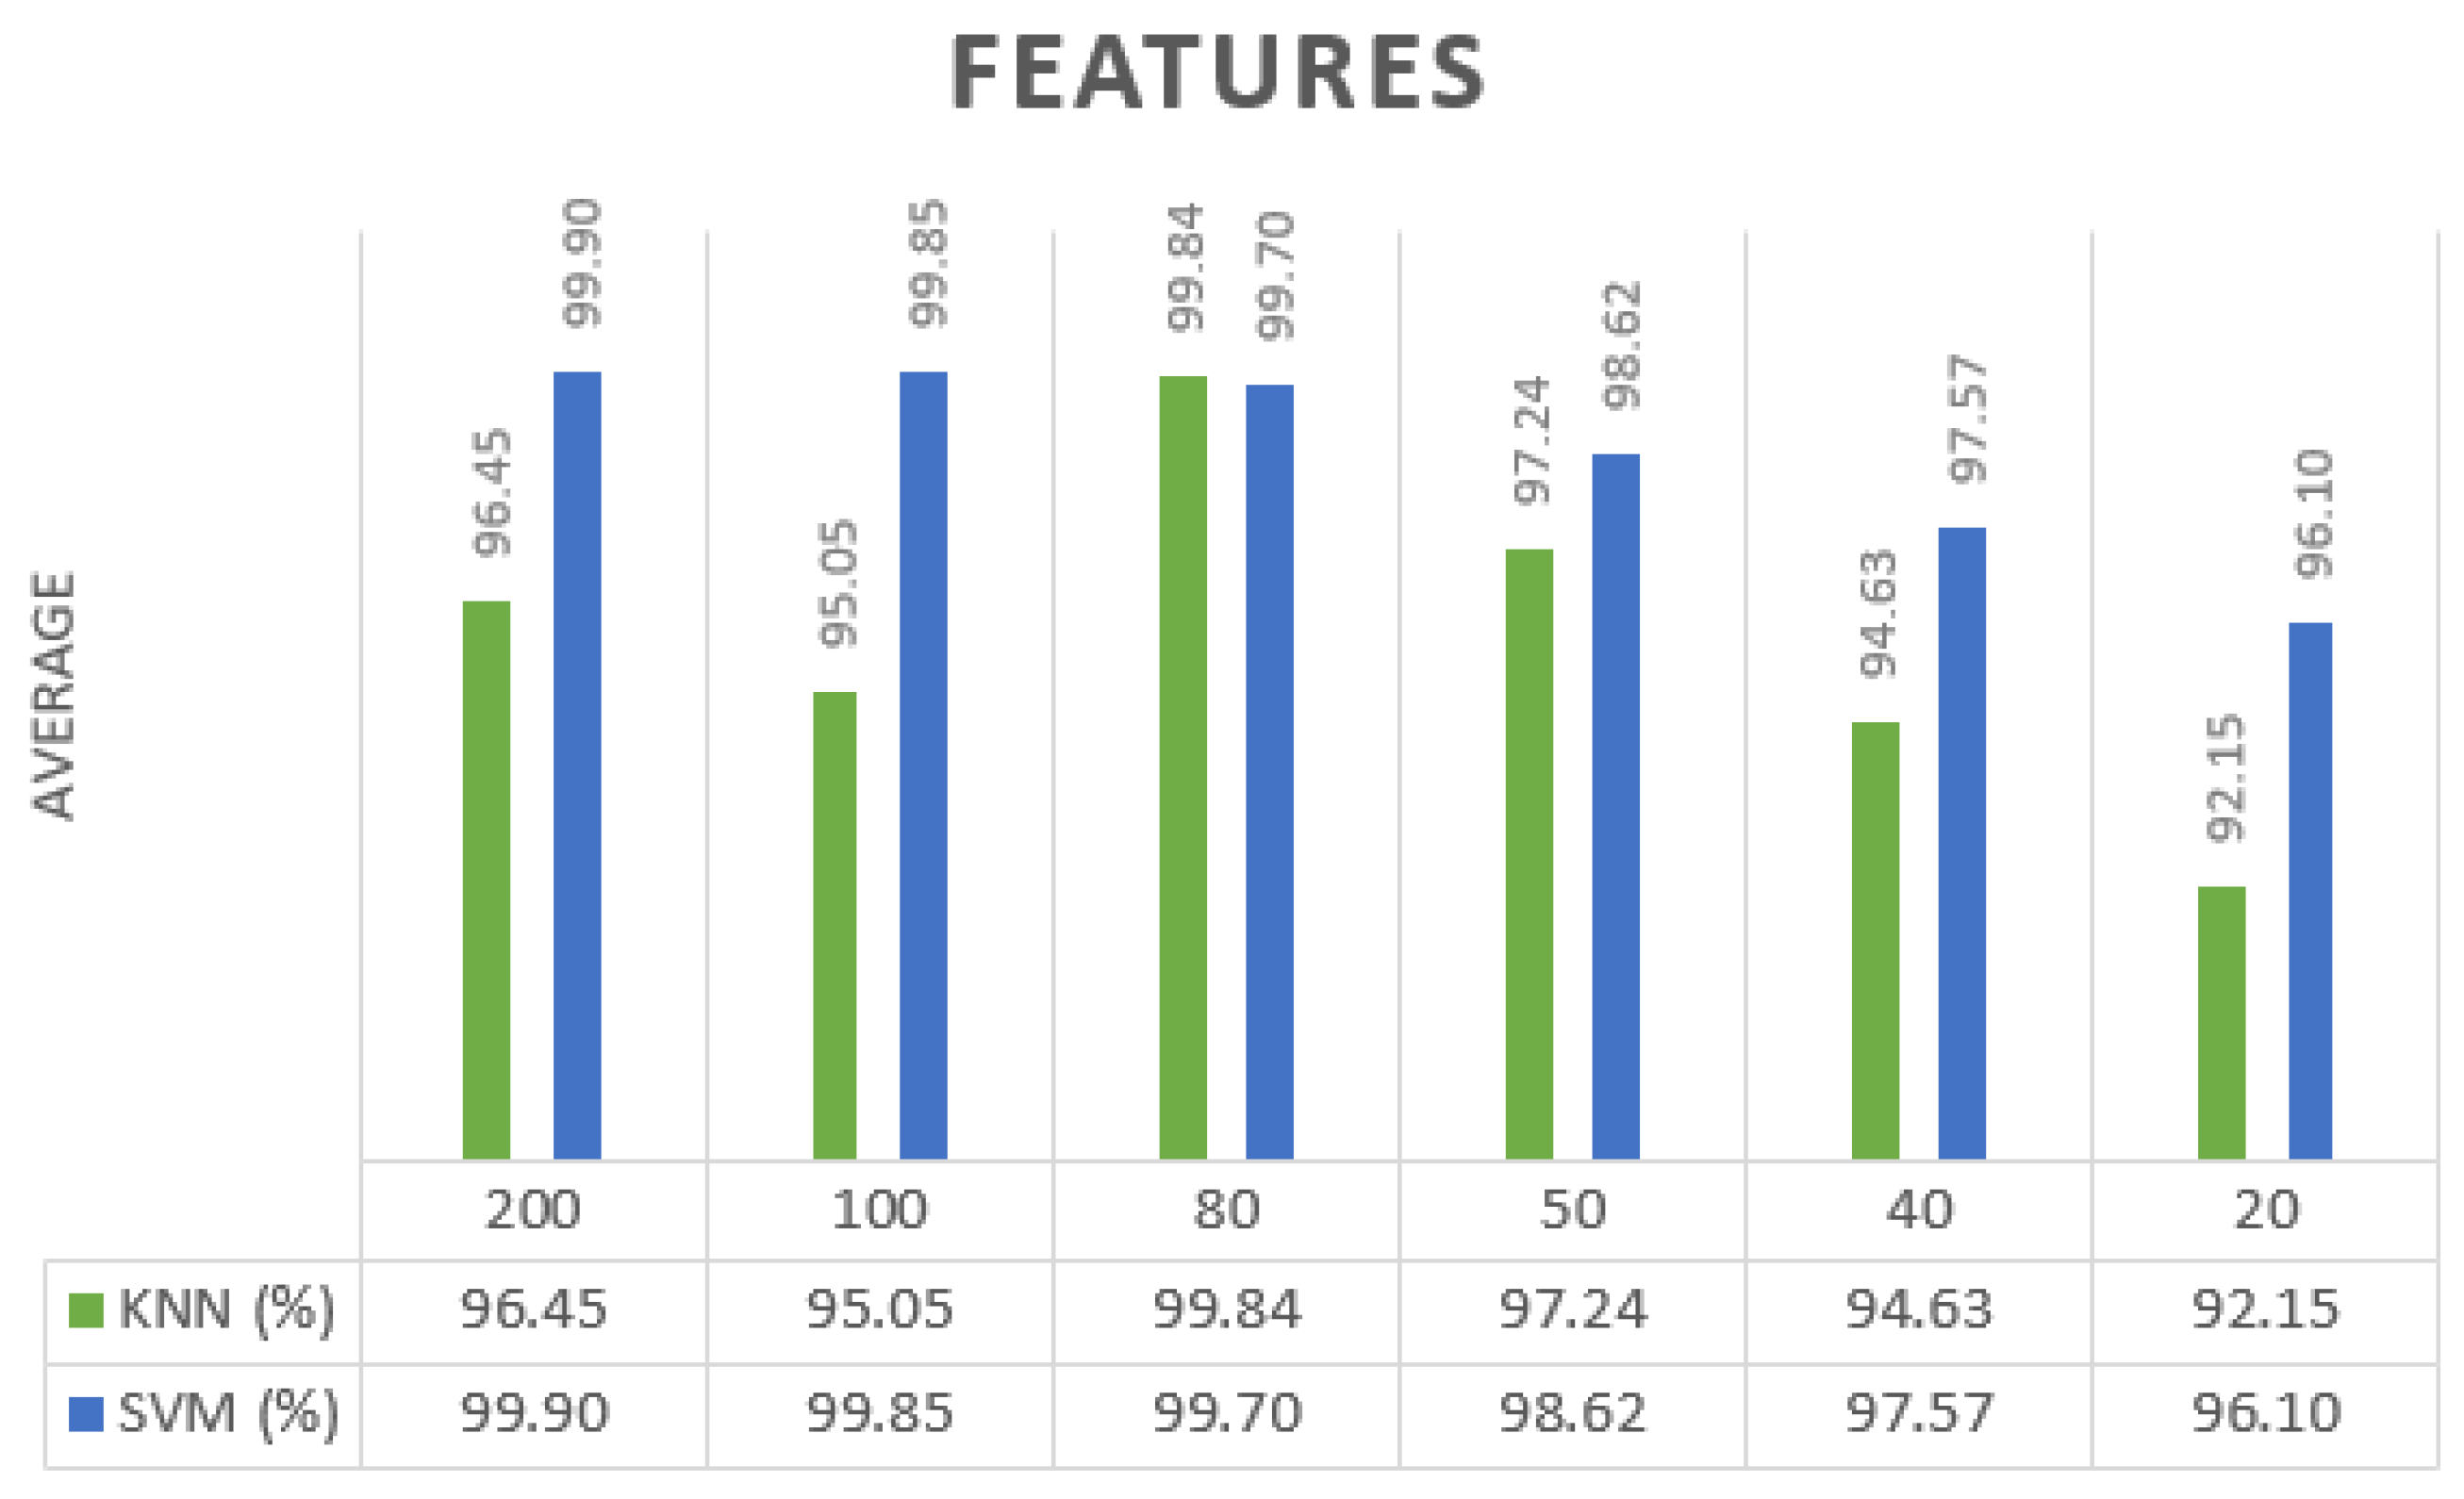

Table 1.
SVM classification results based on SVM kernels with Median statical method (RBF, Polynomial, Linear) for α = 0.7.
Table 1.
SVM classification results based on SVM kernels with Median statical method (RBF, Polynomial, Linear) for α = 0.7.
| SVM | Kernels | ||
|---|---|---|---|
| RBF(%) | Linear(%) | Polynomial(%) | |
| Accuracy | 99.59 | 92.53 | 99.86 |
| Specificity | 99.18 | 89.04 | 99.69 |
| Sensitivity | 100 | 100 | 100 |
| Precision | 99.20 | 91.06 | 99.75 |
Table 2.
SVM classification results based on statistical method after applying 2-D windowing for Polynomial kernel with 200 features (Mean, Median, Minimum, Maximum) for α = 0.7.
Table 2.
SVM classification results based on statistical method after applying 2-D windowing for Polynomial kernel with 200 features (Mean, Median, Minimum, Maximum) for α = 0.7.
| Mathematical Statistic |
||||
|---|---|---|---|---|
| Mean (%) | Median (%) | Minimum (%) | Maximum (%) | |
| Accuracy | 96.41 | 99.90 | 98.30 | 95.88 |
| Specificity | 92.75 | 99.83 | 96.58 | 92.69 |
| Sensitivity | 100 | 100 | 100 | 100 |
| Precision | 93.36 | 99.84 | 96.75 | 94.56 |
Table 3.
The comparison of other research for the diagnosis of Covid-19.
| Study In literature | Model Used | Dataset | Results (%) |
| Dansana et al. | CNN | 360 Covid-19 |
ACC: 79.30 |
| Wu et al. | ResNet50 | 1252 Covid-19 1229 Non-Covid |
AUC 73.20 |
| Gupta et al. | ResNet-50, and DenseNet-121. |
1252 Covid-19 1229 Non-Covid |
AUC: 85 |
| Khan et al. | Used deep learning to develop a model | 290 Covid-19 |
ACC. 89.50 |
| Proposed Method |
FrFT |
1252 Covid-19 1229 Non-Covid |
SVM ACC: 99.90 KNN ACC: 99.84 |
Disclaimer/Publisher’s Note: The statements, opinions and data contained in all publications are solely those of the individual author(s) and contributor(s) and not of MDPI and/or the editor(s). MDPI and/or the editor(s) disclaim responsibility for any injury to people or property resulting from any ideas, methods, instructions or products referred to in the content. |
© 2023 by the authors. Licensee MDPI, Basel, Switzerland. This article is an open access article distributed under the terms and conditions of the Creative Commons Attribution (CC BY) license (http://creativecommons.org/licenses/by/4.0/).
Copyright: This open access article is published under a Creative Commons CC BY 4.0 license, which permit the free download, distribution, and reuse, provided that the author and preprint are cited in any reuse.


