
Submitted:
05 May 2023
Posted:
06 May 2023
You are already at the latest version
Abstract
The digital twin (DT) research field is experiencing rapid expansion, yet the research in industrial practices in this area remains poorly understood. This paper aims to address this knowledge gap by sharing feedback and future requirements from the manufacturing industry. The methodology employed in this study involves an examination of a survey that received 99 responses and interviews with 14 experts from 10 prominent UK organisations, most of which are in the defence industry in the UK. The survey and interviews explored topics such as DT design, return on investment, drivers, inhibitors, and future directions for DT development in manufacturing. The study findings indicate that DTs should possess characteristics such as adaptability, scalability, interoperability, and the ability to support assets throughout their entire life cycle. On average, completed DT projects reach the break-even point in less than two years. The primary motivators behind DT development were identified to be autonomy, customer satisfaction, safety, awareness, optimisation, and sustainability. Meanwhile, the main obstacles include a lack of expertise, funding, and interoperability. The study concludes that the federation of twins and a paradigm shift in industrial thinking are essential components for the future of DT development.
Keywords:
digital twins
; federation of twins
; industrial current practices
; interviews
; review
; survey
1. Introduction
Digital twins (DTs) are becoming increasingly popular in the manufacturing industry as they offer the potential for the application of concepts like smart manufacturing, industry 4.0 [1,2], and digital factories [3]. DTs are digital replicas of physical assets, which can be used to improve the speed, quality, and cost-efficiency of manufacturing systems. They enable the simulation of production scenarios, allowing manufacturers to identify and resolve issues before they occur in the physical world. This is supported by studies like Biesinger, Kraß and Weyrich that show the potential of DTs in production planning [4].
DT technology can also be applied from the early design phase of the product life cycle to improve the cost-efficiency of asset management. This is supported by studies like Panarotto, Isaksson and Vial that show the benefits of DTs in the design phase [5]. Additionally, DT technology is widely recognised for its ability to effectively support the maintenance of complex systems. Studies show that DTs can be used for real-time monitoring, maintenance prediction, and decision support for maintenance activities [6]. Furthermore, DTs can be used for anomaly detection, as seen in studies like Calvo-Bascones et al. [7]. They can also be used in combination with ontologies for failure detection [8].
This study aims to examine the current state of DT usage in the industry through a mixed-methods exploration of the applications, drivers, inhibitors, properties, and future needs of DTs. Data was gathered from UK industry experts through a combination of an online survey and interviews, with a focus on the application areas, development process, investment requirements, lessons learnt, and future needs for DT development. The research questions guiding this study are:
- What is the application landscape of DT in manufacturing?
- What are the current practices in manufacturing?
- What are the future needs?
The main contribution to knowledge is an insight into the current industry practices in the adoption of the DT paradigm, and the future steps and requirements.
The authors focused on a broad catchment area with the survey. At this point, it was important to gather information from as many companies as possible and map out the present landscape of DT applications. The authors aimed to go deeper into understanding the DTs' features, drives, inhibitors, and future requirements when conducting the interviews. The survey in the first phase was utilised to determine participants who were involved with DTs to capture their general understanding of the application landscape and the state of the project. As part of the survey, participants were invited to a second interview phase to capture specific knowledge on the DT projects they were associated with. Thus, for the second interview phase, only participants who agreed to disclose further information were involved in a semi-structured interview. This paper thus presents both the outcomes from the survey together with the information captured as part of the interview phase. Care was taken to keep the information to a generic level due to the commercial sensitivity associated with the information shared. It must also be noted that the analysis and opinions presented do not represent any specific organisation and are based on the author’s interpretation of the information.
The methodology and the results have been divided into two sections, one dedicated to the online survey and one dedicated to the interviews, to separate and compare the results obtained from each data collection method. Therefore, the remainder of the paper is structured as follows; Section 2 presents a literature review, Section 3 presents the online survey methodology and related results, Section 0 presents the methodology and results of the interviews, Section 5 the discussion of the results presented in the previous two sections, and in Section 6 the conclusions, including limitations and future works.
2. Background and literature review
2.1 Academic review
DT definitions, features, applications, and design ramifications were thoroughly investigated by Barricelli et al. [9]. They looked at 75 articles from a range of disciplines, including manufacturing, precision medicine, hospital administration, and aviation. It must be noted that the study did not report DTs for infrastructure. DTs were also the subject of literature reviews by Trauer et al. [10] and Jones et al. [11], which looked at a total of 57 and 92 publications, respectively. These studies covered the definitions and traits of DTs, but they didn't directly examine whether or not they were accepted in business, particularly the infrastructure sector. DT definition, functional components and differences between DT and Cyber-Physical systems are the subjects of the paper submitted by Boyes and Watson [12]. In their study, information management, architecture and design, life cycle, and safety and security, are the areas that need further research. DT definition, application context, and research challenges are the subjects of the systematic review published by Semeraro et al. [13].
2.2 Industrial reports
One of the points that emerged during this paper regards the current mindset of companies, which is a hindrance in the development of DTs and the need to change for DT development to progress. The current mindset of companies refers to the way companies currently approach the development and implementation of DTs. This can include a lack of understanding of the technology and its potential benefits, internal managerial and procedural issues, and a lack of necessary skills among team members. This mindset can act as a hindrance in the development of DTs, as it can limit the implementation, adoption and successful use of the technology. As more companies are designing a digital workforce in manufacturing, Deloitte has outlined four components in creating a framework for a digital workforce: collaboration, technology, governance, and value [14]. Some important actions that are shaping the future of the digital workforce include:
- Reskilling the team
- Hiring individuals with the necessary skills
- Building an environment that attracts talent
- Retaining that talent.
Although the study of DTs in infrastructure is still in its infancy, substantial investments and efforts are being made worldwide, including in the UK, to establish DT ecosystems. To implement the recommendations from the National Infrastructure Commission's 2017 "Data for the Public Good Report," for instance, the Centre for Digital Built Britain created the National Digital Twin Project1 [15].
Accenture in a report of 2022 states that manufacturing executives that are successful in implementing this next-generation manufacturing systems architecture will fundamentally outperform their competitors by increasing productivity, raising customer happiness, and lowering costs [16]. Based on another analysis, between now and 2030, DTs can save CO2 emissions by 7.5 Gt and add up to $1.3 trillion in economic value [17].
ISO 23247:2021 is a set of standards for the development and use of DTs in manufacturing. It provides a framework for defining, developing, and deploying DTs, and defines some functional entities that are supported by DTs. The standard is divided into four parts. The scopes of the four parts of this series are: i) ISO 23247-1: General principles and requirements for developing DTs in manufacturing; ii) ISO 23247-2: Reference architecture with functional views; iii) ISO 23247-3: List of basic information attributes for the observable manufacturing elements; iv) ISO 23247-4: Technical requirements for information exchange between entities within the reference architecture.
ISO 23247 defines the DT as a “(manufacturing) fit for purpose digital representation of an observable manufacturing element with synchronisation between the element and its digital representation”. Where digital representation is defined as a “(manufacturing) data element representing a set of properties of an observable manufacturing element”, and an observable manufacturing element (OME) is an “item that has an observable physical presence or operation in manufacturing”, such as personnel, equipment, material, process, facility, environment, product, and supporting documentation. The standard is intended to be used by manufacturers to develop and deploy DTs that can improve their manufacturing processes. It is also intended to be used by researchers and practitioners to develop new and innovative applications for DTs.
Despite the growing interest in DTs and their potential benefits, there is still a lack of understanding of the current industrial practices of DTs [12]. This lack of understanding is also reflected in the difficulties that companies are facing when it comes to designing and implementing DTs. Many companies are struggling to find standardisation and guidance for designing DTs, which can lead to errors and inefficiencies in the process. This paper is an initial attempt in filling this gap, providing the current application landscape and the future needs from an industrial point of view.
The AMRC report "Untangling the Requirements of a Digital Twin" provides a comprehensive overview of the requirements for developing and deploying DTs [18]. The report highlights some quantitative benefits of the implementation of the DT in the industry, such as:
- 50% reduction in unplanned downtime (€ 40,000/minute by a German Automotive)
- 40% reduction in maintenance costs (forging line proactively fixing saves $200,000)
- 1%-3% reduction of capital equipment costs
- 5%-10% reduction in energy cost
The AMRC report highlights also some gaps in the current state of DT development and deployment. These gaps include:
- Lack of a unified definition of DT. There is no single, agreed-upon definition of DT. This can make it difficult to communicate about DTs and to compare different approaches to DT development and deployment.
- Lack of a systematic approach to DT development. There is no single, agreed-upon approach to developing DTs. This can make it difficult to develop DTs robustly and reliably.
- Lack of empirical evidence on the benefits of DTs. There is limited empirical evidence on the benefits of DTs. This makes it difficult to assess the value of DTs and to justify the investment in DT development and deployment.
- Lack of standards for DT development and deployment. There are no standards for DT development and deployment. This can make it difficult to develop and deploy DTs in a consistent and interoperable way.
- Lack of skilled personnel. There is a shortage of skilled personnel with the knowledge and experience to develop and deploy DTs. This can make it difficult to develop and deploy DTs in a timely and cost-effective way.
Biesinger et al. argue that the benefits of a DT outweigh the costs. The article concludes by arguing that automotive manufacturers should consider implementing a DT to improve their efficiency, reduce their costs, improve their quality, and increase their flexibility [4]. The article identifies several gaps in the literature on DTs. First, there is a lack of research on the specific benefits that DTs can provide for different types of businesses. Second, there is a lack of research on the specific challenges that businesses face when implementing DTs. Third, there is a lack of research on the specific strategies that businesses can use to overcome the challenges of implementing DTs. While Broo et al. also highlight the lack of a common set of standards for DTs. There is currently no common set of standards for DTs, which makes it difficult to share data and information between different DT implementations [19].
Both in industry and academia, there is a need for studies that outline insights about DT applications from numerous perspectives such as areas of use, benefits achieved, challenges experienced, and development methods. This paper represents a first attempt to address these gaps through the analysis of the results of a detailed industrial survey and a series of interviews with experienced stakeholders. Over 45 organisations have been involved in this research to share their point of view on DTs. Capturing and collating insights from industrialists presents valuable guidance on current and future research needs.
3. Online survey
3.1 Methodology
The online survey aimed to map the current application landscape of DTs in manufacturing, primarily in the UK. The survey was conducted online and consisted of 16 questions, 12 of which required short answers or multiple-choice responses. We used the Forms tool within the Office 365 suite to collect the data. The results were then analysed using MS Excel and are presented in a .xlsx table. The questions (see Table 1) were grouped into themes: the first 6 pertained to the DT project itself, the next 5 (questions 7-11) focused on the project's size, status, and investment, and the final 5 (questions 12-16) were about the company, including contact information and industry sector. Overall, we found significant interest in DTs among participants in the manufacturing industry.
The knowledge base that has been developed is important as it reflects on the current interests in DTs in terms of application areas and captures the level of benefit that may be achieved from DT projects.
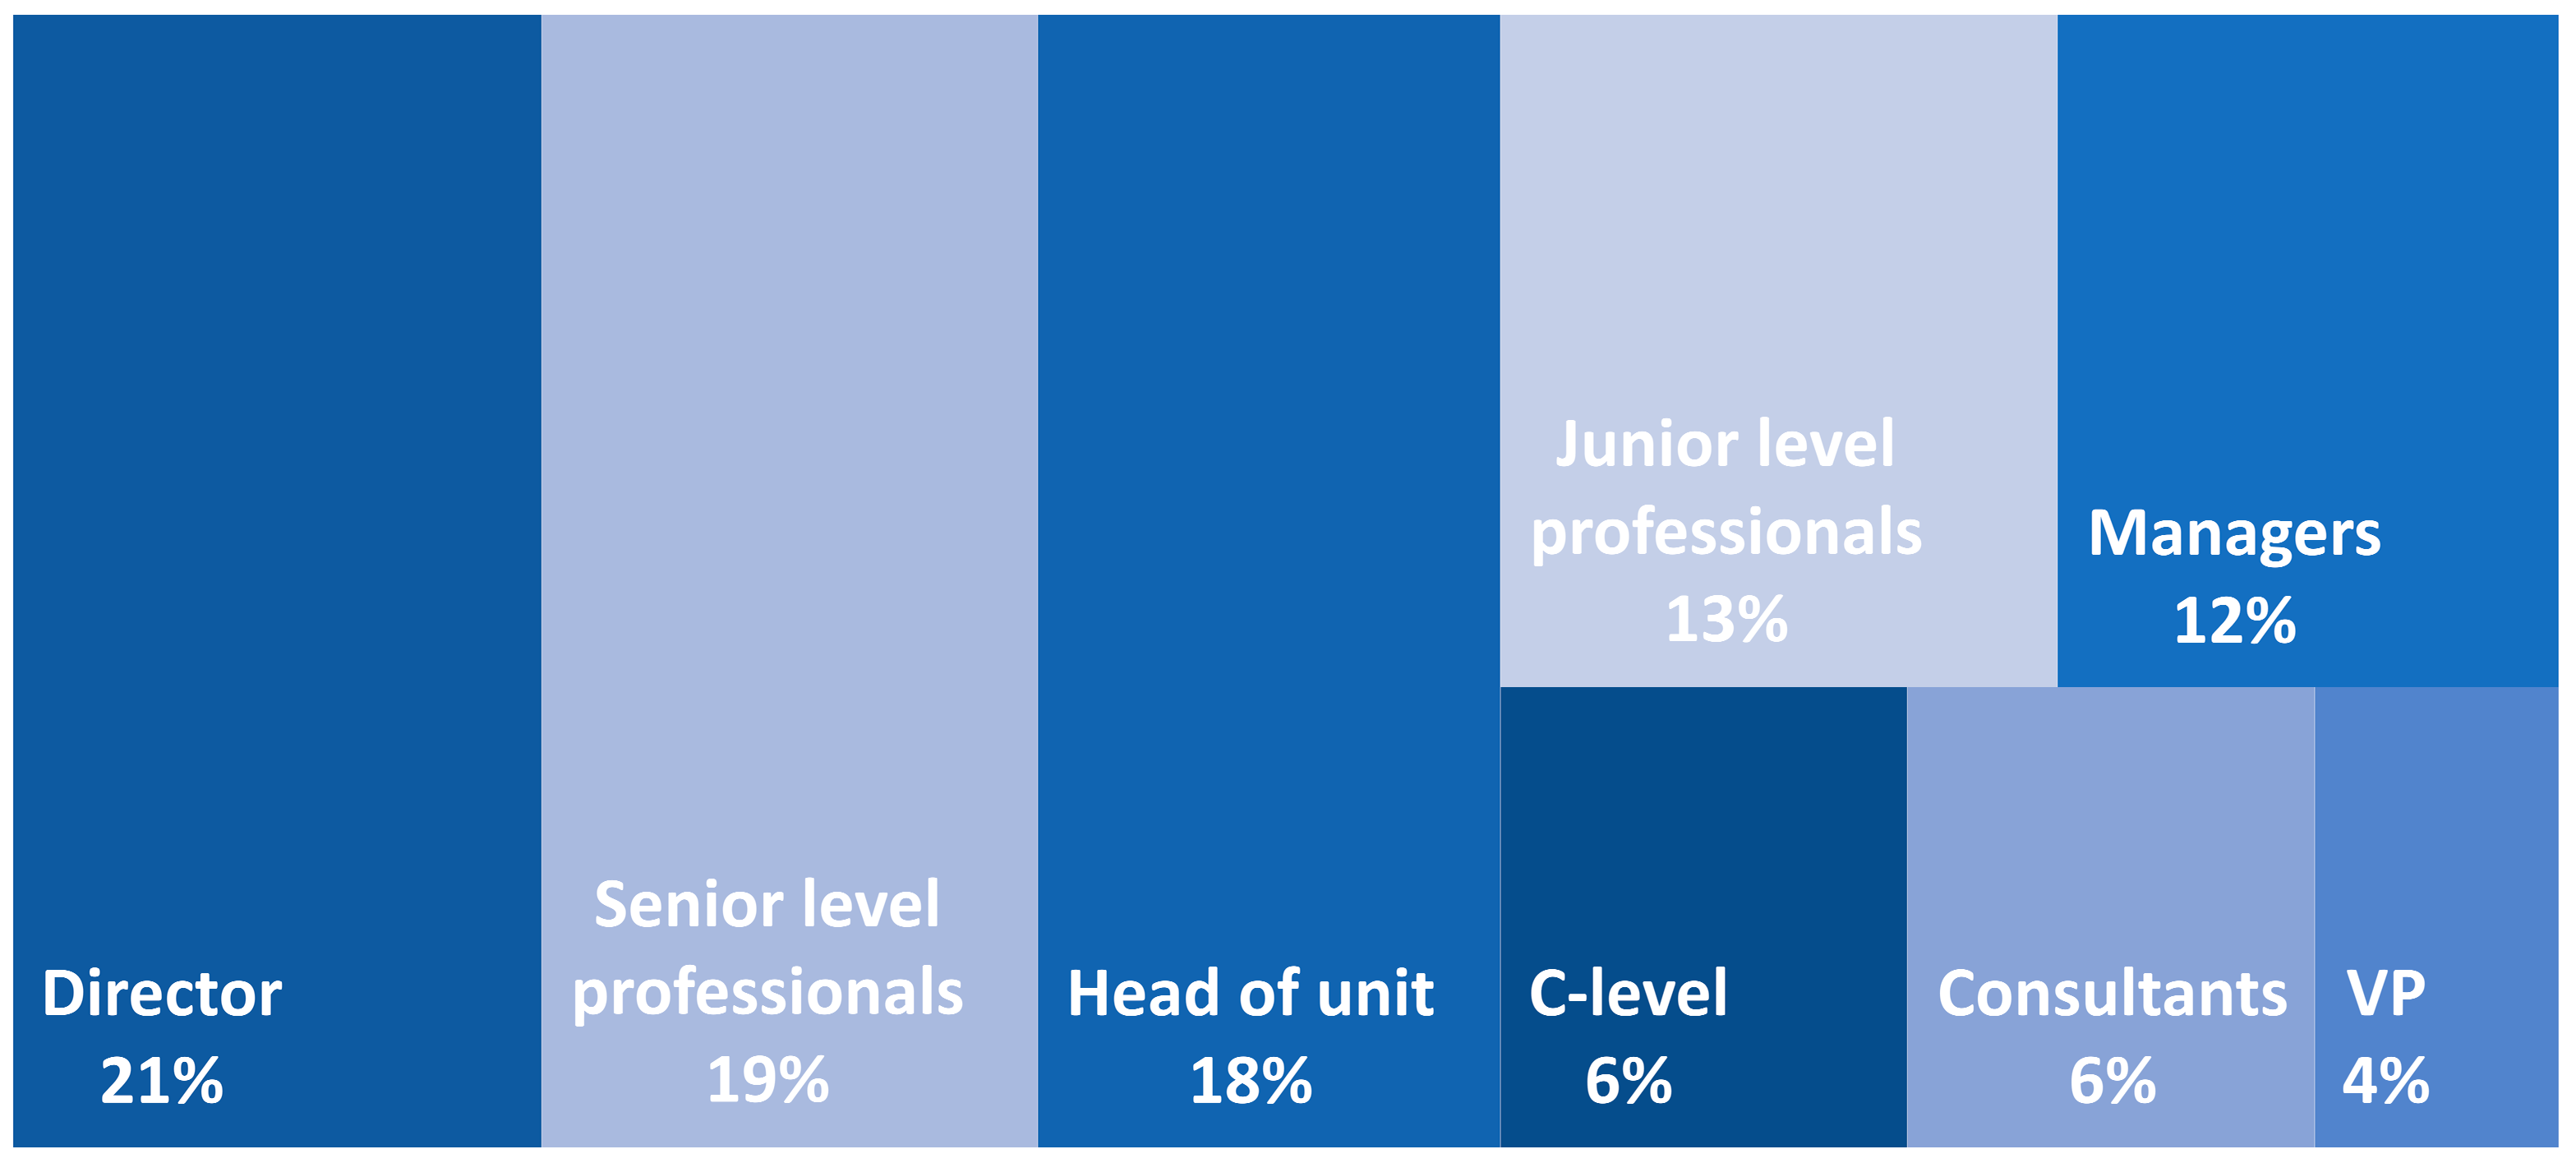
The survey has been promoted through a series of workshops delivered by the Team Defence Information (TD-Info) group2, within the TD-Info - Digital Twin Community of Practice (DefSp DTCOP). A working group on DT mapping was hosted by Prof. John Ahmet Erkoyuncu from Cranfield University (UK) and an online survey was launched on the 23rd of June 2021. 99 responses were collated from 49 organisations. The survey was filled out by people in a variety of roles such as C-level Executives, Vice Presidents, Directors, Heads of Units, and Consultants. From this, as follow on, for more detailed analysis ten organisations have been successively interviewed.
3.2 Results from the online survey
Results have been divided into three macro groups: i) area of implementation, ii) maturity, and iii) impact.
The "area of implementation" group refers to the specific manufacturing sectors where DT technology is being applied, at what stage of the product life cycle, and the scale of the project. This information provides insight into the industries and applications in which DT technology is being used, and how it is being used within those industries.
The "maturity" group refers to the level of maturity of DT projects and the status of DT projects. This information provides insight into how advanced DT technology is within different industries and how widely it is being adopted. It also gives an idea of the progress of DT projects in different industries.
The "impact" group refers to the budget allocation, investments, and the return expected from DT projects. This information provides insight into the financial aspects of DT projects, such as the costs and benefits associated with implementing DT technology. It also gives an idea of the return on investment that companies expect from DT projects.
This approach allowed the authors to present the content in a logical structure so that the reader can interpret the key findings of the study and how they relate to the research question.
The survey results regarding the implementation area show that the defence, aviation, and maritime sectors are the primary sources for DT deployment, as seen in Figure 1. This information was obtained from question 7 (What sector is your digital twin applied to?). Figure 2 showcases the results of question 4 (What areas are applicable to your digital twin?) and reveals that the phases of the asset's life cycle during operation, including in-service optimisation, maintenance, repair, and overhaul (MRO), and mid-life upgrade and modification, play a significant role in DTs. Question 9 (What is the scale of the project?) results can be seen in Figure 3 on the left.
The DT projects are almost evenly distributed between large, medium, and small sizes. Figure 3 (centre) shows the results from question 2 (What level of maturity is your project?). Specifically, the DT project maturity is considered across conceptual, prototype, proof of value, initial operating capability, or full operating capability. Besides, Figure 3 (right) shows the results from question 8 (project status). The distinction here is between completed DT projects (with available outcomes); in-progress DT projects; scheduled DT projects (planned and funded); and aspirational DT projects (planned and unfunded). Interesting to see the combination of the shares of completed DT projects and in-progress projects that together are more than 50% (about 68%) with the largest portion of the pie (41%) is dedicated to projects that are currently in progress. The remaining 2 portions are divided among planned, and scheduled projects, each making up approximately 16% of the chart.
Figure 4 shows the results from the combination of question 10 (What is the project start date?) and question 11 (What is the forecast return on investment (when will benefits in the business case be realised)?). The forecasted return on investment is expressed in years and indicates the breakeven point (BEP) of the DT projects. The 3 charts in the figure indicate the BEP in years for completed DT projects (on the left), for large DT projects (in the centre), and for small DT projects (on the right). Across the completed projects that were declared, the BEP was less than 2 years. Furthermore, the BEP for large projects was just under 4 years, and it was around 2 years for small projects.
The study highlights that across the proposed DT examples, there has been an emphasis on having a better understanding of the 'end-to-end capability' and 'processes' linked to the asset, as shown in Figure 5. This emphasis on understanding the full life cycle of the asset suggests that the goal of using DT technology is to improve the asset and the outcomes that can be achieved from the asset.
Figure 6 shows a multidimensional diagram. The BEP in years in the X-axis is put against the DT project size in the Y-axis. This visualisation has been created using an open-source tool called Orange3. While the colours represent the status of the DT projects and the shapes represent the maturity level of the DT projects. In this way, we can see all these dimensions in one single graph. As already shown in Figure 4, medium and large DT projects have, on average, a higher BEP compared to the small ones. Another interesting data is that completed/delivered projects (blue in the chart), have on average a smaller BEP (within 1 year).
For a more detailed analysis, the following figures represent box plot diagrams of the BEP for each of the above-mentioned three dimensions (DT project size, DT project status, and DT project maturity). Box plots are used in statistics to graphically display various parameters at a glance. These box plots have been generated using an open-source data mining tool called Orange. Figure 7 shows the analysis represented with box plots of the BEP value over the DT project size. In the horizontal axis, the BEP number, which is expressed in years, and the three box plots represent the distribution of the BEP respectively for small, medium, and large projects. The box plot shows the median (yellow line), the mean (thick blue vertical line), the interquartile portion (the blue highlighted area) and the standard deviation (the thick blue horizontal line) also indicated by the number after the ± symbol. Figure 7 highlights how the median of the BEP more than doubles between small and large projects. The blue highlighted area indicates the BEP values for 50% of respectively small, medium, and large projects. This area also increases along with the size of the project. That means that the majority of large projects have a higher BEP.
Figure 8 shows a similar analysis. The BEP values’ distribution over the DT project status. Interesting to see how the BEP of completed projects is shorter compared to the ones of the other statuses. This figure shows also how the BEP is longer but also that the results are more spread for scheduled/planned projects and live projects. The median (yellow line) in this case increases from 1 year in completed projects to 2.42 in live projects.
Figure 9 shows the BEP values’ distribution over the maturity of DT projects. The figure shows that full operating capability, conceptual, and initial operating capability DT projects have a similar distribution of BEP, with the median respectively of 1, 1.47, and 1.55 years. In this case, it can also be seen that proof of value projects have a higher BEP on average and a wider distribution of BEP. The main point to be considered is the uncertainty associated with this category of projects. The same uncertainty is probably considered in scheduled and live projects in Figure 8. The median in this case is contained in a small range of values, between 1 and 2.21.
The focus of DT has primarily been centred on the product (e.g., asset) as declared by 46% of the survey respondents. Only 23% of the responses focused on the system (e.g., processes) that consisted of, among other things, the supply chain. This is an important message, which may indicate that DT has commonly been considered for products, which generate commercial and performance gains for organisations. This could be because organisations can make a connection between the commercial/performance gains that can be accumulated from the asset and the added value that a DT can bring. This may have been more difficult for justifying the value that can be gathered from DTs for improving systems/processes. Moving forward it is likely that there will be a growing interest to enhance systems/processes to improve outcomes that can be achieved through the product.
The individuals responding to the survey typically occupied senior positions such as ‘Director’, ‘C’ level, ‘Head of Unit’, ‘Manager’, or ‘VP’. Less than 10% of the respondents were in junior-level positions. This is also an interesting observation, as senior-level interest may facilitate faster development and implementation of DTs. Moving forward it will be good to explore the impact that this may have on DT development.
The study notes that the most common area of interest among the proposed DT examples is to develop an 'end-to-end capability', or a tool that can be used from the conceptualisation to the disposal of the twinned asset. This suggests that DT is not being considered for only one particular phase of the asset's life, but rather as a flexible construction that can be used across the life cycle based on the needs.
This conclusion highlights the versatility of the DT technology suggesting its ability to support the whole life cycle of the asset. This suggests that DT has the potential to be used in different industries and applications to improve the overall performance of the asset, thereby increasing productivity and efficiency at optimal costs. Additionally, by using the DT across the life cycle of the asset, it can provide valuable insights, allowing for better decision-making, optimisation and maintenance.
Figure 11.
Job roles of respondents.
The survey was promoted primarily within the defence sector, which is why we attracted the largest rate of responses from this sector. The defence sector had coverage of defence, aviation, and maritime. Other sectors that were represented through the survey included areas such as nuclear, rail, and communication and information. The survey response for sectoral representation is demonstrated in Figure 1. It is important to note that the response rate does not indicate which sector is more mature in DT implementation. It merely helps to confirm that there is a strong level of interest from the defence sector, which was our target audience. It has also been useful to realise the various areas of focus that have been shown across sectors.
At the end of the survey, as indicated in the introductory section above, the participants representing the identified organisations were given the option to indicate their availability and willingness to participate in the second phase of interviews to provide additional information specific to their involvement in DT projects. The following section presents the methodology and the results deduced from these interviews.
4. Interviews
4.1 Methodology
The study conducted an online survey to gather initial information on DT projects and then used the information gathered from the survey to prepare a set of questions for in-depth interviews. The goal of the in-depth interviews was to gain a more detailed understanding of the current state of DT projects and to gather valuable insights from experts on their DT projects. Using the list of volunteers provided in the last question of the survey, the researchers contacted 14 experts from 10 companies. These experts agreed to participate in the interview and provided valuable information on their DT projects, including requirements, lessons learnt, and future scenarios. The interview questions were refined based on the information gathered during the interview process to ensure the use of a consistent set of answers for analysis. The profile of the 14 experts from the 10 companies that participated in the interview can be found in Table 2. The authors evolved their questions based on the experience gained over the interviews, in order to have a homogeneous set of answers to analyse.
The strategy for the interviews in this study was to use open-ended questions to gather as much detailed information as possible from the interviewees. The goal of the interviews was to understand the companies' perspective on digital transformation (DTs) and how they approach it. The researchers aimed to gather information on the companies' definition of DTs, their design process if any, the return on investment considered for DT projects, funding sources, steps and validation of the design process, semantic or interoperability approaches used, data visualisation, business challenges faced during the DT process, lessons learnt, and plans for the future. The questions were based on a semi-structured format, which means that they were open-ended but still followed a general structure. The questions were evaluated based on expert interviews conducted with 10 companies based in the UK, to ensure that they were relevant and appropriate for the study. To avoid bias, the participants did not know the questions beforehand and were not aware of the answers provided by other participants, which allows for more objective data collection.
- How do you define a Digital Twin?
- How do you design a DT and how the DT design team is composed, do you have any formal procedure?
- How long is the ROI that a DT project should have?
- How did you get the funding and where from?
- How did you launch the design process? How do you validate the design process? What steps do you go through? Do you have any milestones to reach?
- Have you considered any ontology/semantic approach in DT development?
- Do you see a common approach that could be developed across the industry, or do you think it’s going to have to be company driven? (Federation of Twins) Talking about interoperability, and the link between software platforms, how much of a challenge do you see in interoperability, and how do you think that will become addressed over time?
- How do users make decisions? Where the visualisation (Dashboard, VR, AR, XR, etc) has a role here in terms of improving the process of making a decision?
- What are the challenges you faced, and why you needed a DT? What business challenge is your digital twin project looking to address?
- What worked and what didn’t work?
- What are the lessons learned from the whole process (business case definition, design, and development)?
- What do you think are the next steps?
Thematic analysis is a method of analysing qualitative data, such as interview transcripts, that involves identifying and coding recurrent themes in the data. The method, as described by Braun and Clarke (2006), is systematic, meaning that it is a step-by-step process that is applied consistently to all of the data [20]. The steps of the thematic analysis, as described in Table 3 of a paper by Braun and Clarke (2021), likely include initial familiarisation with the data, development of a coding scheme, identification of themes, and interpretation of the themes. The specific steps may vary depending on the study and the research question being addressed. Thematic analysis can be useful in identifying patterns and themes in data, which can help to guide further research and analysis [21].
4.2 Results from the interviews
The study conducted 10 interviews with 14 experts from 10 different organisations. The 10 interviews were recorded and the transcripts of these interviews were manually noted in 10 separate Microsoft Word documents. The authors chose not to use any speech-to-text tool to transcribe the interviews in order to get familiar with the content of each interview. The transcripts were then formatted to be used in the NVivo 12 qualitative analysis tool. NVivo is a software tool used for coding and analysing qualitative data. For this research, a University (site-level) license was used to access the tool.
As the first step, each interview transcript was coded and the codes were grouped by a predefined subject based on the information provided during the interview. The subjects were then grouped with similar subjects to form themes. This process allowed the researcher to identify patterns and commonalities in the data, which was then used to identify key themes and insights. The use of NVivo software in this process allowed for a more systematic and efficient way of coding and analysing data.
The coding phase in qualitative research is a crucial step in the process of organising, analysing, and making sense of data collected from interviews.
The process typically begins with transcribing the interviews. This involves taking the recorded audio or video of the interview and writing down exactly what was said by the participants. Transcribing the interviews allowed the researcher to have a written record of the data that can be easily read and analysed. Once the interviews have been transcribed, the researcher began the process of reading through the answers provided by the participants. This is typically done multiple times in order to identify key themes or concepts that emerge from the data.
After identifying key themes or concepts, the researcher summarises them into a single sentence or "code" that represents the main idea being expressed. This allowed the researcher to analyse and understand the data and identify patterns or trends in the responses. This process is called thematic analysis. The four themes that have been extracted from the data in this study are drivers & inhibitors, DT properties, finance, and next steps & needs. These themes represent the key concepts or patterns that emerged from the data collected from the interviews with experts from different companies.
The theme "drivers & inhibitors" refers to factors that either promote or hinder the implementation or use of DT technology within the companies. These factors could include things like technological capabilities, regulatory requirements, and organisational culture.
The theme "digital twin properties" refers to the characteristics or features of DT technology that are relevant to the companies. This could include things like accuracy, scalability, and interoperability.
The theme "finance" refers to the financial aspects of implementing or using DT technology within companies. This could include things like costs, benefits, and return on investment.
The theme "next steps & needs" refers to the steps or actions that need to be taken by the companies in order to move forward with implementing or using DT technology. This could include things like training, research, and partnerships.
These themes are defined in Table 4, which provides more detailed information on each theme and how they were identified from the data. The themes will allow the authors to analyse and understand the data and identify patterns or trends in the responses. They can also be used to provide insights and recommendations for companies.
4.2.1. Drivers & Inhibitors
This subsection focuses on the theme of drivers and inhibitors, the results are presented in two separate tables, one for drivers and one for inhibitors. As mentioned in Table 4, this theme includes the benefits that the DT development brought to the companies, as well as the barriers and problems that the companies have found in the DT development process.
The tables (Table 5, Table 6, Table 7, Table 8, Table 9, Table 10, Table 11 and Table 12) include codes that have been extracted from the transcripts of the interviews and grouped into themes, these codes are listed in alphabetical order. The tables also include additional information, such as the source and reference of each code.
The 'Sources' column in the table indicates the likely number of interviews in which the specific code was mentioned. This allows the reader to see how frequently a particular driver or inhibitor was mentioned across the interviews.
The 'References' column in the table indicates how many times a specific code was mentioned within the interviews. This allows the reader to see how important a particular driver or inhibitor was to the participants.
The tables also allow the reader to see the specific drivers and inhibitors that were identified in the study and how frequently they were mentioned. This information provides insight into the benefits and barriers that companies are experiencing when implementing DT technology and can be used to understand the current state of DT implementation in the industry.
Table 5 presents the drivers or the benefits that the DT development process has been able to address. The table presents the codes that have been extracted from the transcripts of the interviews and grouped into themes related to drivers.
As can be seen from the table, the most mentioned benefit is the "improvement of the knowledge base and awareness" about the twinned asset. This factor has been mentioned 4 times in 3 interviews. This suggests that the participants of the study see the DT as a way to increase the understanding of the asset and how it behaves, which can be used to optimise and improve the asset's performance. The interviewees also mention the capability of the DT to move the working load from the physical world to the virtual world, being more flexible and “autonomous” to perform engineering tasks in the digital world as a benefit. Additionally, they mention that if "customer satisfaction" is the benefit that the DT brings to the company then it is worth the investment. Moreover, the DT enables the "system of systems" paradigm which allows companies to connect different systems and improve the overall efficiency of their operations. Further, having DTs improves the "overall company's efficiency", "optimising" costs and performance of the assets. Developing DTs is expected to lead to better outcomes in "safety" aspects and also force companies to "simplify complexity" and improve overall "sustainability".
Overall, the table presents the benefits that the interviewees see in the development of DTs, which can be used to understand the current state of DT implementation in the industry and help companies to understand the potential benefits they can get from implementing DTs.
An extract from the interview, Agent A12: “The opportunity the DT provide us is to make that much more dynamic and real-time and lead to more true predictive maintenance, and better data coming out.”.
Table 6 presents the inhibitors highlighted from the interviews. The inhibitors are the barriers and the problems that the companies have found in the DT development process. The table presents the codes that have been extracted from the transcripts of the interviews and grouped into themes related to inhibitors.
Among the most mentioned inhibitors in the table are “interoperability issues” and the “company’s mindset”. The “interoperability issue” has risen in 8 out of 10 interviews and was mentioned 17 times within those interviews. This issue includes the absence of standards or standardised approaches in the codification and the sharing of data and information. This can make it difficult for different DT systems to communicate and share data, which can hinder the effectiveness of the DTs.
Another inhibitor highlighted in the table is the “company’s mindset, lack of skills, and understanding”. This issue has risen in 4 out of 10 interviews and was mentioned 9 times within those interviews. This issue includes mostly the managerial mindset of companies, which often precludes the innovation and the adoption/integration of new technologies in already existing tried and tested processes or technologies. This is usually due to a lack of skills or understanding of decision-makers, people who usually take decisions inside the companies.
In addition to the above inhibitors, the table also highlights issues such as the “complexity” of managing sophisticated tools, such as databases and ontologies, within the development of the DT. “Quality of data” is also an inhibitor, which includes the problem of having poor-quality input data, it’s not a matter of quantity but rather of quality. This can lead to issues such as integrity, accuracy, and trust in the dataset. The “uncertainty” issue has also been highlighted, where this factor is considered as the discrepancy between the data and the physical model in the DT.
Finally, the last inhibitor considered is the “expense”, mostly for large companies rather than small ones, where they are not financially supported to start a pilot DT project. This highlights the financial burden that companies may face when implementing DTs.
An extract from the interview, Agent A08: “Dealing with uncertainty is a difficult part of the DT. In the work that we’ve done, we generally have data and a physical model, and we deal with some sort of uncertainty. Bringing those three things together is what gives you something that allows you to make decisions which you can trust. As your physical model gets better, or as the available data gets better, the uncertainty can reduce, and so you are not dependent so much on the sort of math too.”.
4.2.2 DT properties
This theme focuses on the factors that characterise DT. These factors include the attributes, the elements that constitute the DT, the semantic properties, and the visualisation properties. The theme includes a section dedicated to DT attributes, which would include information on the characteristics that make up a DT, such as the data it uses, the level of accuracy, and the level of detail. The section on DT design covers the process of designing and creating a DT. This could include information on the methods and techniques used to create a DT, as well as any guidelines or best practices for DT design. The section on DT visualisation covers how DTs can be visualised and presented to users. This could include information on different visualisation techniques, such as 3D models and virtual reality, as well as the advantages and disadvantages of different visualisation methods. Finally, the section on DT semantics covers the meaning and interpretation of the data and information or rather the ontology used in a DT. This could include information on how to interpret and understand the data, as well as any ontology methods used.
Overall, the theme provides an in-depth look into the different factors that make up a DT and the processes used to create and interpret them. This information is useful for understanding the current state of DT technology and can be used to improve the design, visualisation, and interpretation of DTs.
4.2.2.1 DT attributes
Table 7 presents the attributes of DTs that have been highlighted in the interviews. Similar to the assessments presented above, the main attributes highlighted in the table are "portability", "scalability" and "interoperability". These attributes have been mentioned 3 times in 3 interviews.
"Portability" refers to the ability of a DT to be transferred or adapted to different platforms, environments, or systems without loss of functionality or performance. This attribute is important for companies as it allows for flexibility in using the DT in different situations or contexts.
"Scalability" refers to the ability of a DT to adapt or grow to accommodate changes in the volume or complexity of the data or asset being twinned. This attribute is important for companies as it allows for the DT to be used in a wide range of applications and to handle different levels of complexity.
"Interoperability" refers to the ability of a DT to communicate and share data with other systems, platforms, or DTs. This attribute is important for companies as it allows for the DT to be integrated into existing systems and for data to be shared across different departments or organisations.
Overall, the table presents the attributes of DTs that the interviewees see as important. These attributes can be used to understand the current state of DT technology and to improve the design and capabilities of DTs. Another attribute highlighted in the table is that a DT does not have to work “necessarily in real-time”. Depending on the purpose and the asset, discrete communication might also work. This means that depending on the specific use case and the asset being twinned, it may not be necessary for the DT to update in real-time. For example, if a DT is used for monitoring and analysing the performance of a machine or equipment, it may only need to update at specific intervals or when certain conditions are met.
Another attribute highlighted in the table is that DT has to “support the twinned asset through life”, it is not specifically for one part of the life cycle. This means that a DT should be able to support the asset throughout its entire life cycle, from design to disposal, and not just a specific part of it. This is important as it allows companies to gain insights and make decisions throughout the entire life cycle of the asset and not just during specific stages.
An extract from the interview, Agent A01: “There is an attribute evaluation during the design process. Attributes that we consider would be portability, scalability and interoperability. So different DT solutions will require to focus on different attributes.”.
4.2.2.2. DT design
Table 8 presents the factors related to the design process of DTs. The table shows that a defined procedure for DT design is not commonly used, as 4 out of 10 interviewees mentioned a “defined procedure”, while 5 out of 10 “do not follow a formal procedure”. One of the most important factors highlighted in the design process is the need for a “diverse team” to design a DT. This includes having people from different departments of the company, with different roles in the life cycle of the asset, and with different points of view. This allows for a wider range of perspectives and expertise to be brought to the design process, which can lead to more innovative and comprehensive DTs. Additionally, the table shows that having a mix of experienced operators and freshly graduated data scientists, working together can bring added value to the DT design. This is because it allows for different levels of experience to contribute to the design process, which can lead to more comprehensive DTs that take into account all aspects of technical, economical, and practical nature.
One of the most mentioned factors in the design phase is the motivation behind the DT design. This has been mentioned 8 times, by 6 out of 10 interviewees highlighting the fact that an important step in the DT design process is “starting from the purpose”. In other words, start from the value proposition, understand the requirements, and focus on the output one would like to achieve. Another starting point highlighted was the strategy to start the DT design through a “research project”. The other factors mentioned are: “focus on simulation”, “focus on safety”, and “DT for data validation”. These refer respectively to the simulation aspect of the DT, the safety aspect, and the use of the DT to validate the data gathered from the asset. The simulation aspect highlighted refers to the ability of the DT to find the optimal point through the evaluation of what-if scenarios.
An extract from the interview, Agent A03: “We didn’t apply all this modern AI technology to our engine specifically for DT development, but to optimise operation and costs, and because we’ve created this kind of digital thread across our organisation. Talking about the DT hierarchy, people don’t often know where to start to become a DT organisation and I always say, you just start everywhere. If you don’t forecast your fleet, start forecasting your fleet, and start creating models. If you don’t have digital inspection across everything, including MRO, start implementing it. If you don’t look at how to manage individual components through your supply chain, there will be a value proposition associated with just that.”.
4.2.2.3 DT visualisation
Table 9 shows the results of the interviews regarding the visualisation aspect of the DT design. The main aspect that emerged is the focus on the meaning of the visualisation rather than on the visualisation itself. The “focus on value”, which was mentioned 13 times in 7 interviews, refers to the idea that visualisation should support the decision-making process by keeping the information simple and using a standardised approach with graphically represented information. The “focus on data”, which was mentioned 2 times in 2 interviews, refers to the importance of focusing on the data rather than the product itself and building trust in the data and analytics capabilities of the DT.
Regarding the means of visualisation, the “XR (AR, VR, MR)” technologies have been more widely used among the interviewees and were mentioned 4 times in 3 interviews. These technologies are playing an increasing role in DT visualisation. “Dashboards”, which were mentioned 2 times in 1 interview, are still considered useful for visualising useful information to support decision-making. Overall, the table provides insight into how the interviewees view the visualisation aspect of DT design and what factors they consider important.
An extract from the interview, Agent A14: “I think building up that trust in the data in there and the analytics capability, I think is key. I think the other aspect is being able to visualise the data in the right context, dependent on the user, and ensure that what the data is projecting or saying is truly understood and interpreted in the right way. I have seen examples of dashboards being created to almost tell the story that somebody wants to tell as opposed to undertaking analysis of the data to determine what could be done or should be done.”.
4.2.2.4 DT semantic
Table 10 shows the results related to the use of semantics in the design process of DTs. The table indicates that only 1 out of 10 interviewees was "not aware" of any semantic approach in their DT design process. 3 out of 10 interviewees reported using ontologies in their DT design process. Additionally, 6 out of 10 interviewees reported that they were either trying to use or looking for "standard approaches" to govern semantics in the DT design process; this was mentioned 9 times within those interviews. This includes using a standard ontology, using open-source solutions, or using a shared language approach across all connected devices. However, 2 out of 10 interviewees thought that semantics in DT design is still a research topic and they are not aware of any standard approach yet. The table suggests that while some companies are using ontologies and standard approaches in their DT design process, others are not aware of these methods or consider them to still be a topic of research.
An extract from the interview, Agent A08: “I think the modularisation of ontologies, from an application level to a top-level one is very important, mostly in the space domain. I am less familiar with the temporal side, which I think is a trickier problem. The other problem is how you deal with uncertainty within the context of ontologies.”.
4.2.3. Finance
Table 11 presents the results of the interviews regarding the length of time it takes for a company to see a return on their investment in a DT project. The table includes a combination of both qualitative and quantitative data, such as the specific timeframe, textual information and the return on investment (ROI) in percentage.
ROI is a financial metric used to evaluate the efficiency of an investment. It's calculated by dividing the net benefit of an investment by the cost of the investment and expressing the result as a percentage. A positive ROI indicates a profit from the investment, while a negative ROI indicates a loss. It's commonly used to measure the performance of an investment over time and is expressed as a percentage or a ratio. It is used in many industries to assess the profitability and effectiveness of specific investments [22].
What has been represented as the timeframe in the table is also called the breakeven point (BEP) in the literature. The breakeven point is the point in time at which the total revenue from a project or investment equals the total costs associated with that project or investment. In other words, it is the point at which the revenue generated by an investment or project is sufficient to cover all of its associated costs, resulting in a net profit of zero [23].
From the table, it can be seen that 2 years has been considered the right breakeven point by 1 interviewee. One interviewee mentioned an ROI of 30/40%, whilst 2 out of 10 interviewees mentioned a significant ROI, above 100%. 4 out of 10 interviewees considered a “short time” ROI, with a breakeven point within a year or a maximum of 2 years. While one interviewee considered also a “long time” ROI, more than 2 years. However, 2 out of 10 interviewees did “not consider any ROI” in their DT projects.
From the qualitative point of view, interesting insights have been reported. A few interviewees (4 out of 10) see the DT as an “opportunity benefit, rather than an investment”. That means, developing a DT allows the company to discover inefficiencies that could not be seen without the DT. The benefits that a company can have applying the DT journey, cannot be always calculated in advance. Nowadays, a few companies are not aware of those inefficiencies. For 3 out of 10 interviewees, again it is an opportunity to “optimise the processes”, which allows “not to waste money later” in the journey. Additionally, for 1 out of 10 interviewees, DT allows “reducing the time-to-market”, and in saving time, they save money.
It is important to note that the breakeven point can vary depending on the industry, the size of the company, the type of DT project, and other factors.
An extract from the interview, Agent A04: “If the DT is working well, you won’t necessarily see where it’s saving money. You’re dealing with an issue before it becomes an issue, so therefore, you’re not necessarily having to invest money to solve a problem later down the line, because you’re solving it before it becomes a problem. So, it might be difficult to identify that kind of return of investment because it might look like it’s quite a process rather than financial reward or a financial benefit.”.
4.2.4. Next steps and needs
Table 12 presents the outcomes for the future steps and needs identified by the companies interviewed. The data in the table indicates that nearly all of the interviewees emphasised the need for a "system of systems" approach, building an ecosystem or federation of twins, or rather a network of DTs connected and semantically interoperable in order to enhance the knowledge over the network. In general, achieving semantic interoperability between twins is a necessary future step or fundamental next step. This idea was mentioned 29 times in 9 out of 10 interviews. Various methods were suggested to achieve this goal, such as a common architecture, use of ontologies, shared language approach, universal framework, creation of a hub for interoperability, universal DT, open-source solutions, and standard approaches.
The second main need identified is the need to ”change the company's mindset and reskill the team”, which was mentioned 26 times in 8 out of 10 interviews. This includes improving education and reskilling the team, incorporating data experts into the design team, involving domain experts in the design team, fostering collaboration within and outside the company, introducing more flexible project management strategies, transitioning from paper-based or pdf-based to a data-based mentality, and shifting from a single entity mindset to a system of systems thinking.
Another important suggestion mentioned is the "think big, start small" strategy, which was mentioned 8 times in 7 out of 10 interviews. This approach suggests starting with a small project to quickly see benefits while keeping the bigger picture in mind. Additionally, 4 out of 10 interviews emphasised the importance of “focusing on data”, with plans to improve the quality of input data to increase the consistency and overall value of the DT.
The observation about the “marketplace and registry of best practices” highlighted in the interviews refers to the need for companies to have access to a database or resource where they can find information about past experiences, both successful and unsuccessful, in the development of DTs. This would include information such as lessons learnt, common challenges faced, and best practices for implementing and using DTs. The idea behind this is that by having access to this information, companies would be able to avoid making the same mistakes as others and would be able to more quickly and effectively implement and use DTs in their operations.
Additionally, the idea of having plug-and-play tools that can be customised for specific applications is also mentioned. This refers to the idea of having pre-built, ready-to-use DT solutions that can be easily integrated into a company's existing systems and processes, without the need for extensive customisation or development. This would save time and resources for companies, as they would not have to start from scratch in developing their DT solutions.
Moreover, the need for a marketplace where the supply and demand for DT solutions can meet is also mentioned. This would provide companies with a central place to find and purchase the DT solutions they need, at both the B2B and B2C level. This would make it easier for companies to find and acquire the DT solutions that best meet their needs, and for DT solution providers to connect with potential customers.
Companies brought out the need for “cloud migration”, which is the process of moving data, applications, and other business operations from a traditional on-premises environment to a cloud-based environment. This has been mentioned by 3 out of 10 interviewees, who believe that more solutions for cloud storage are needed. They also suggested the creation of a restricted defence cloud, where companies that work for both defence and commercial sectors can apply similar solutions for both sectors. This is because cloud technology is becoming increasingly popular in the commercial sector. Additionally, 2 out of 10 interviewees brought attention to the need for “more grants” to initiate future DT projects. They also emphasised the need for “customer satisfaction” and growing together with customers, as they ask for more complex solutions and providers need to be able to satisfy those requests. Besides, 1 out of 10 interviewees stressed the need to stay “up to date with the progress” in the field.
The need for improving predictive analytics and “predictive maintenance” capability in DTs was highlighted by 2 out of 10 interviewees. Predictive analytics refers to the use of data, statistical algorithms, and machine learning techniques to identify the likelihood of future outcomes based on historical data. Predictive maintenance, on the other hand, uses this data to predict when maintenance or repairs are needed on a piece of equipment or machinery, allowing for proactive maintenance rather than reactive. This approach can save costs and improve equipment uptime by preventing unexpected breakdowns.
Additionally, one interviewee mentioned the concept of “self-defining DTs”. As automation and low-code/no-code environments continue to advance, DTs in the future may be able to define themselves based on scans of the physical entities they are monitoring. This would mean that the DT would be able to automatically adjust its parameters and settings based on the state and condition of the physical entity, without the need for human intervention. This could further increase the efficiency and effectiveness of DTs in the future.
An extract from the interview, Agent A14: “I personally think that as we get into low-code no-code environments, I think that digital twins almost be self-defining in that based upon all sorts of scans the original entity, how that's interpreted, how I can apply proven analytics models to that capability. I think that's just the future of digital. And I think it's a strap-on and try and hold on for the ride. Because I think it's going to take people much further, a lot quicker. It requires things like comms infrastructures to be in place and searchlight.”.
5. Discussion
This study analyses the application landscape, current practices, and future needs of DT technology in manufacturing industries. Both industry and academia are lacking and in need of those insights in the area of DTs. They have been addressed in this research through the examination of the survey and interview data. Businesses have contributed to this research by offering their perspective on DTs. The input of those from the business world raises the significance of this study and introduces those viewpoints to the scientific community.
The key contribution to knowledge is the capture of the DT paradigm and its implementation together with novel and innovative practices and procedures that are both in existence and development within the industry. The literature on contemporary DT industrial practices is limited and this paper is an attempt to address that gap. This study presented the findings from an analysis of the feedback from 49 UK-based organisations. According to the authors' best knowledge, this is a first in the field of DTs. It is envisaged that the knowledge imparted from this publication would improve and encourage the development of DTs together with establishing industry best practices in place due to the high levels of uncertainty that currently exist.
This paper presents a comprehensive analysis of the implementation and impact of DT technology in manufacturing industries. It is divided into two parts: the first part focuses on a survey, and the second part presents the results of interviews.
The survey categorises results into three macro groups: area of implementation, maturity, and impact. Primary sectors for DT deployment include defence, aviation, and maritime, with a focus on assets rather than systems. DT projects are generally in progress or completed, with an even distribution of sizes. Return on investment is usually realised within two years for small projects and under four years for large ones.
The interviews reveal four themes: drivers & inhibitors, DT properties, finance, and next steps & needs. Drivers include improved knowledge, customer satisfaction, efficiency, safety, the system of systems, and sustainability, while inhibitors involve interoperability, mindset, complexity, data quality, uncertainty, and expense. DT properties consist of transparency, traceability, responsiveness, adaptability, and connectivity.
The paper further discusses DT attributes, design, visualisation, and semantics, with portability, scalability, and interoperability as key features. Designing a DT requires diverse teams, purpose-driven approaches, and motivation. Visualisation techniques offer various advantages and disadvantages, and semantics deal with data meaning and interpretation.
Financial aspects cover ROI and BEP, which can vary depending on factors such as industry, company size, and project type. DT projects may yield process improvements rather than direct financial benefits.
Lastly, the paper discusses the next steps and needs, emphasising a "system of systems" approach, semantic interoperability, mindset shifts, reskilling, and data focus. Other suggestions include a "think big, start small" strategy, a marketplace of best practices, plug-and-play tools, cloud migration, grants, customer satisfaction, staying up-to-date, and improving predictive analytics and maintenance capabilities. The concept of "self-defining DTs" is mentioned as a potential future development.
The challenges identified in the study related to the implementation of DT technology in manufacturing industries include:
- Interoperability issues: Difficulty in integrating DTs with existing systems, software, and data formats can hinder seamless communication and data exchange between different components of a manufacturing process.
- Company mindset: Resistance to change within an organisation or a lack of understanding of the potential benefits of DT technology can slow down adoption and limit its effectiveness.
- Complexity: The inherent complexity of DTs, including the need to create accurate, high-fidelity models of physical assets and processes, can pose challenges in terms of resources, expertise, and time required for implementation.
- Quality of data: Ensuring the accuracy, consistency, and reliability of the data used in DTs is critical for effective decision-making. Incomplete, outdated, or inaccurate data can compromise the effectiveness of the DT.
- Uncertainty: Uncertainty surrounding the return on investment, potential benefits, and long-term impact of DT technology can make organisations hesitant to adopt it or allocate sufficient resources for its implementation.
- Expense: The cost of implementing and maintaining DT technology, including the required hardware, software, and personnel training, can be a significant barrier for companies, particularly small and medium-sized enterprises.
- Security concerns: Implementing DT technology can expose companies to potential security risks, such as unauthorised access to sensitive data, intellectual property theft, and cyberattacks targeting critical infrastructure. Ensuring the confidentiality, integrity, and availability of information within DTs is crucial for protecting both the digital and physical assets of a company.
Addressing these challenges requires targeted strategies, such as promoting a culture of innovation and collaboration, investing in employee training and education, developing standardised frameworks and protocols for interoperability, ensuring data quality, conducting cost-benefit analyses to better understand the potential ROI of DT projects, encryption, secure authentication, and access control mechanisms.
Based on the findings presented in the paper, there is evidence to suggest that the use of DTs is likely to increase in the manufacturing industry. The study found that the majority of DT projects are in progress or completed, with an even distribution of sizes, and that the return on investment for DT projects was generally realised within two years for small projects and under four years for large projects. Furthermore, the paper highlights future needs for DT technology, including a focus on the system rather than just the product, achieving semantic interoperability between DTs, reskilling the team, cloud migration, marketplaces of best practices, plug-and-play tools, and improving predictive analytics and maintenance capability in DTs. These needs suggest that there is a growing interest in and recognition of the potential benefits of DT technology in the manufacturing industry and that efforts are being made to overcome some of the challenges identified in the study. Additionally, the increasing interest in the literature on DTs and their potential applications in various industries, including manufacturing, suggests that there is a growing awareness and understanding of the benefits of DT technology, which is likely to contribute to its increased use in the future.
The biggest impact of DT technology is likely to be made in improving efficiency and productivity in the manufacturing industry. The study found that DT projects were primarily focused on optimising the asset's life cycle during operation, including in-service optimisation, MRO, and mid-life upgrade and modification, which can lead to better efficiency and productivity. Additionally, the study identified the properties of DTs, such as transparency, traceability, responsiveness, adaptability, and connectivity, as well as the financial aspects of DTs, such as ROI and BEP, as important considerations for their implementation. Addressing the challenges identified in the study, such as interoperability issues, mindset shifts, reskilling, and data focus, can also contribute to the successful implementation of DT technology and its impact on improving efficiency and productivity in the manufacturing industry.
There are several ways to overcome the barriers and challenges associated with the implementation of DT technology in the manufacturing industry. These include:
- Promoting a culture of innovation and collaboration within the organisation to foster a positive mindset towards DT technology and its potential benefits.
- Investing in employee training and education to reskill the workforce and enable them to effectively implement and use DT technology.
- Developing standardised frameworks and protocols for interoperability to ensure seamless communication and data exchange between different components of a manufacturing process.
- Ensuring data quality by using accurate, consistent, and reliable data in DTs, is critical for effective decision-making.
- Conducting cost-benefit analyses to better understand the potential ROI of DT projects and identify opportunities for process improvements.
- Implementing encryption, secure authentication, and access control mechanisms to protect the confidentiality, integrity, and availability of information within DTs.
By addressing these challenges, organisations can more effectively implement DT technology and leverage its potential benefits to improve efficiency, productivity, and other key performance indicators in the manufacturing industry.
A roadmap for wider adoption of DT technology in the manufacturing industry could include the following steps:
- 13.
- Conduct a comprehensive assessment of the company's current capabilities and identify potential areas where DT technology can be applied to improve efficiency, productivity, and other key performance indicators.
- 14.
- Develop a clear vision and strategy for implementing DT technology, including identifying key stakeholders, setting goals, and establishing a timeline for implementation.
- 15.
- Develop a comprehensive plan for reskilling the workforce and providing the necessary training and education to enable employees to effectively use DT technology.
- 16.
- Establish standardised frameworks and protocols for interoperability to ensure seamless communication and data exchange between different components of a manufacturing process.
- 17.
- Implement secure authentication, access control mechanisms, and encryption to protect the confidentiality, integrity, and availability of information within DTs.
- 18.
- Conduct cost-benefit analyses to better understand the potential ROI of DT projects and identify opportunities for process improvements.
- 19.
- Leverage cloud migration to enable better accessibility and scalability of DT technology.
- 20.
- Foster a culture of innovation and collaboration to promote a positive mindset towards DT technology and its potential benefits.
- 21.
- Establish marketplaces and registries of best practices to enable companies to learn from each other and achieve better outcomes.
- 22.
- Develop plug-and-play tools to enable companies to quickly and easily implement DT technology.
- 23.
- Increase the availability of grants to enable companies to invest in DT technology and achieve better outcomes.
- 24.
- Stay up-to-date on the latest advances in DT technology and continue to improve predictive analytics and maintenance capabilities.
By following these steps, companies can more effectively implement DT technology and leverage its potential benefits to improve efficiency, productivity, and other key performance indicators in the manufacturing industry.
6. Conclusions and future work
This paper aims to fill the current gap in the literature about the current industrial practices of DTs. This paper addresses this gap providing insights into the scientific literature about the application landscape, current practices, and future needs of DTs directly from the people who work and manage DT projects in the industry. Those insights have been extracted from the analysis of the results coming from an online survey and semi-structured interviews. The three main contributions are presented answering the three research questions posed in the introduction section.
1) What is the application landscape of DT in manufacturing? The application landscape of DTs in manufacturing, based on the results presented and on the reference sample, shows that the defence, aviation, and maritime sectors are the primary sources for DT deployment. The phases of the asset's life cycle during operation, including in-service optimisation, MRO, and mid-life upgrade and modification, play a significant role in DTs. The study also found that the majority of DT projects are in progress or completed, with almost even distribution between large, medium, and small sizes. The focus of DT has primarily been centred on the product (e.g., asset) rather than the system (e.g., processes) that consisted of, among other things, the supply chain. The return on investment for DT projects was generally realised within two years for small projects and under four years for large projects.
2) What are the current practices in manufacturing? Based on the results presented, current practices for DTs in manufacturing involve considering several factors that can promote or hinder the implementation of DT technology within companies. Three themes have been considered for factor. The first theme highlights the drivers and inhibitors related to the implementation of DT technology in companies, which include benefits such as improved knowledge base, customer satisfaction, overall efficiency, safety, the system of systems, and sustainability. Inhibitors include interoperability issues, the company's mindset, complexity, quality of data, uncertainty, and expense. The second theme discusses the properties of DTs, including attributes, elements, semantic properties, and visualisation properties. The attributes of DTs highlighted in the interviews include portability, scalability, and interoperability, and the design process involves starting from the purpose and motivation behind the DT design. The third theme discusses the financial aspect of DTs, particularly the ROI and the BEP. While some interviewees considered DT as an opportunity benefit rather than an investment, some interviewees did not consider any ROI in their DT projects. The BEP can vary depending on various factors such as industry, company size, and project type. Overall, the results suggest that implementing DT technology within companies involves considering a range of factors, including the benefits and barriers of DT technology, the properties of DTs, and in some cases the financial aspects of DTs.
3) What are the future needs? Based on the results presented in the paper, the future needs for DT technology in manufacturing industries are as follows:
- More focus on the system rather than just the product: The study found that the focus of DT has primarily been centred on the product (e.g., asset) rather than the system (e.g., processes) that consisted of, among other things, the supply chain. Thus, there is a need to shift the focus towards the system to achieve better outcomes.
- Addressing the inhibitors of DT technology: The inhibitors of DT technology such as interoperability issues, the company's mindset, complexity, quality of data, uncertainty, and expense need to be addressed to promote the implementation of DT technology in companies.
- Achieving semantic interoperability between DTs: Semantic interoperability between DTs is a necessary step for building an ecosystem or federation of twins. This can be achieved through a "system of systems" approach.
- Reskilling the team: There is a need to change the company's mindset and reskill the team to enable the effective implementation and use of DT technology.
- Cloud migration: There is a need for cloud migration to enable better accessibility and scalability of DT technology.
- Marketplaces and registries of best practices: The need for marketplaces and registries of best practices can enable companies to learn from each other and achieve better outcomes.
- Plug-and-play tools: The need for plug-and-play tools can enable companies to quickly and easily implement DT technology.
- Grants: More grants can enable companies to invest in DT technology and achieve better outcomes.
- Improving predictive analytics and maintenance capability in DTs: This can enable companies to optimise processes and achieve better outcomes.
- Self-defining DTs: The concept of "self-defining DTs" could increase efficiency and effectiveness in the future.
The key takeaways from this study on DT technology in the manufacturing industry include:
- Growing interest and adoption: The study shows that there is an increasing interest and adoption of DT technology in various sectors, such as defence, aviation, and maritime, with a focus on assets rather than systems.
- Identified challenges: Interoperability issues, company mindset, complexity, data quality, uncertainty, expense, and security concerns are the primary challenges faced during the implementation of DT technology in the manufacturing industry.
- DT properties and financial aspects: Key properties of DTs, such as transparency, traceability, responsiveness, adaptability, and connectivity, are essential considerations for their implementation. ROI and BEP are significant financial aspects that influence the adoption of DT technology.
- Future needs and developments: The study identifies several future needs and potential developments in the field of DT technology, including a "system of systems" approach, semantic interoperability, mindset shifts, reskilling, data focus, cloud migration, marketplaces of best practices, plug-and-play tools, and improving predictive analytics and maintenance capabilities.
- Roadmap for wider adoption: A strategic roadmap is proposed for the wider adoption of DT technology in the manufacturing industry, including steps such as conducting assessments, developing a clear vision and strategy, reskilling the workforce, standardising frameworks and protocols, implementing security measures, conducting cost-benefit analyses, and fostering a culture of innovation and collaboration.
- Collaboration between industry and academia: The study highlights the importance of collaboration between industry and academia to advance the understanding and implementation of DT technology, leading to the development of best practices, innovative solutions, and effective dissemination of knowledge.
In summary, this study offers an extensive examination of the adoption and implications of DT technology within manufacturing industries. The findings presented serve to inform both academic researchers and industry professionals about the present landscape and prospective requirements of DTs in this domain. The insights garnered may be instrumental in guiding the formulation of best practices and strategies for the successful implementation and utilisation of DT technology.
However, this research is constrained by the limited sample size of companies surveyed, all of which were located in the UK and predominantly engaged in the defence sector. The data collected comprises 99 responses from an online questionnaire and 10 semi-structured interviews conducted with representatives from 10 distinct companies. A more comprehensive study, employing a larger sample size and incorporating international representation, would yield a broader and more holistic perspective on the subject matter. Future research could encompass a wider array of companies and industries to assess the progress of ongoing projects and identify new initiatives that have emerged in the interim. This approach would facilitate the collection of more extensive data and insights into the current state and future potential of DT technology across various sectors and geographical locations.
This article yields numerous results that can be employed as a foundation for further research projects or to generate new investigative endeavours. The aspects of DTs highlighted in response to the third research question represent key areas that companies are keen to explore in the near future.
It would be beneficial to conduct further investigation to assess the implementation of DTs across a broader range of companies. As the research progresses, it would be advantageous to delve deeper into the subject matter using a more balanced survey that encompasses all relevant sectors and enables cross-sectoral comparisons. Furthermore, subsequent rounds of surveys and interviews can be carried out to evaluate the progress of current DT projects and identify any new initiatives that have been launched. This would contribute to a more comprehensive understanding of the present state of DT implementation and its ongoing evolution.
Acknowledgements
The authors acknowledge the Team Defence Information group (https://www.teamdefence.info/) that allowed the circulation of the online survey among their members. This work was funded by the Engineering and Physical Sciences Research Council (EPSRC) as part of the “Digital Toolkit for optimisation of operators and technology in manufacturing partnerships” project (DigiTOP; https://digitop.ac.uk; EP/R032718/1). This research was supported by the Centre of Digital Engineering and Manufacturing (CDEM) at Cranfield University (UK).
References
- P. Zheng et al., “Smart manufacturing systems for Industry 4.0: Conceptual framework, scenarios, and future perspectives,” Front. Mech. Eng. 2018 132, vol. 13, no. 2, pp. 137–150, Jan. 2018. https://doi.org/10.1007/S11465-018-0499-5. [CrossRef]
- F. Tao, Q. Qi, A. Liu, and A. Kusiak, “Data-driven smart manufacturing,” J. Manuf. Syst., vol. 48, pp. 157–169, Jul. 2018. https://doi.org/10.1016/J.JMSY.2018.01.006. [CrossRef]
- M. Rico, M. L. Taverna, M. R. Galli, and M. L. Caliusco, “Context-aware representation of digital twins’ data: The ontology network role,” Comput. Ind., vol. 146, p. 103856, Apr. 2023. https://doi.org/10.1016/J.COMPIND.2023.103856. [CrossRef]
- F. Biesinger, B. Kraß, and M. Weyrich, “A Survey on the Necessity for a Digital Twin of Production in the Automotive Industry,” 2019.
- M. Panarotto, O. Isaksson, and V. Vial, “Cost-efficient digital twins for design space exploration: A modular platform approach,” Comput. Ind., vol. 145, p. 103813, Feb. 2023. https://doi.org/10.1016/J.COMPIND.2022.103813. [CrossRef]
- J. Jorgensen, M. Hodkiewicz, E. Cripps, and G. M. Hassan, “Requirements for the application of the Digital Twin Paradigm to offshore wind turbine structures for uncertain fatigue analysis,” Comput. Ind., vol. 145, p. 103806, Feb. 2023. https://doi.org/10.1016/J.COMPIND.2022.103806. [CrossRef]
- P. Calvo-Bascones, A. Voisin, P. Do, and M. A. Sanz-Bobi, “A collaborative network of digital twins for anomaly detection applications of complex systems. Snitch Digital Twin concept,” Comput. Ind., vol. 144, Jan. 2023. https://doi.org/10.1016/J.COMPIND.2022.103767. [CrossRef]
- R. D. D’Amico, A. Sarkar, H. Karray, S. Addepalli, and J. A. Erkoyuncu, “Detecting failure of a material handling system through a cognitive twin,” IFAC-PapersOnLine, vol. 55, no. 10, pp. 2725–2730, 2022. https://doi.org/10.1016/j.ifacol.2022.10.128. [CrossRef]
- B. R. Barricelli, E. Casiraghi, and D. Fogli, “A survey on digital twin: Definitions, characteristics, applications, and design implications,” IEEE Access, vol. 7. Institute of Electrical and Electronics Engineers Inc., 2019. https://doi.org/10.1109/ACCESS.2019.2953499. [CrossRef]
- J. Trauer, S. Schweigert-Recksiek, L. O. Okamoto, K. Spreitzer, M. Mörtl, and M. Zimmermann, “Data-driven engineering definitions and insights from an industrial case study for a new approach in technical product development,” 2020. https://doi.org/10.35199/norddesign2020.46. [CrossRef]
- D. Jones, C. Snider, A. Nassehi, J. Yon, and B. Hicks, “Characterising the Digital Twin: A systematic literature review,” CIRP J. Manuf. Sci. Technol., vol. 29, pp. 36–52, May 2020. https://doi.org/10.1016/j.cirpj.2020.02.002. [CrossRef]
- H. Boyes and T. Watson, “Digital twins: An analysis framework and open issues,” Comput. Ind., vol. 143, Dec. 2022. https://doi.org/10.1016/J.COMPIND.2022.103763. [CrossRef]
- C. Semeraro, M. Lezoche, H. Panetto, and M. Dassisti, “Digital twin paradigm: A systematic literature review,” Comput. Ind., vol. 130, p. 103469, Sep. 2021. https://doi.org/10.1016/J.COMPIND.2021.103469. [CrossRef]
- D. Wright, D. Witherick, and M. Gordeeva, “The robots are ready. Are you? Untapped advantage in your digital workforce,” 2020.
- National Infrastructure Commission, “Data for the public good,” Jul. 2018.
- P. Brosset, T. Martins, S. Williams, and M. Watson, “Next Generation Manufacturing Systems Architecture.,” 2022.
- F. Verzelen, P. Lacy, and N. Stacey, “The critical role of virtual twins in accelerating sustainability,” 2021.
- J. Eyre et al., “Untangling the requirements of a Digital Twin,” 2020.
- D. Gürdür Broo, J. Schooling, and ur Broo, “Digital twins in infrastructure: definitions, current practices, challenges and strategies,” Int. J. Constr. Manag., 2021. https://doi.org/10.1080/15623599.2021.1966980. [CrossRef]
- V. Braun and V. Clarke, “Using thematic analysis in psychology,” Qual. Res. Psychol., vol. 3, no. 2, pp. 77–101, 2006. https://doi.org/10.1191/1478088706qp063oa. [CrossRef]
- V. Braun and V. Clarke, “One size fits all? What counts as quality practice in (reflexive) thematic analysis?,” Qual. Res. Psychol., vol. 18, no. 3, pp. 328–352, 2021. https://doi.org/10.1080/14780887.2020.1769238/FORMAT/EPUB. [CrossRef]
- J. J. Phillips, W. Brantley, and P. P. Phillips, Project Management ROI: A Step-by-Step Guide for Measuring the Impact and ROI for Projects. John Wiley & Sons, Inc., 2011.
- J. Dayananda, R. Irons, S. R. Harrison, J. L. Herbohn, and P. Rowland, Capital budgeting: Financial appraisal of investment projects. Cambridge University Press, 2002.
Figure 1.
Sectoral representation of respondents.
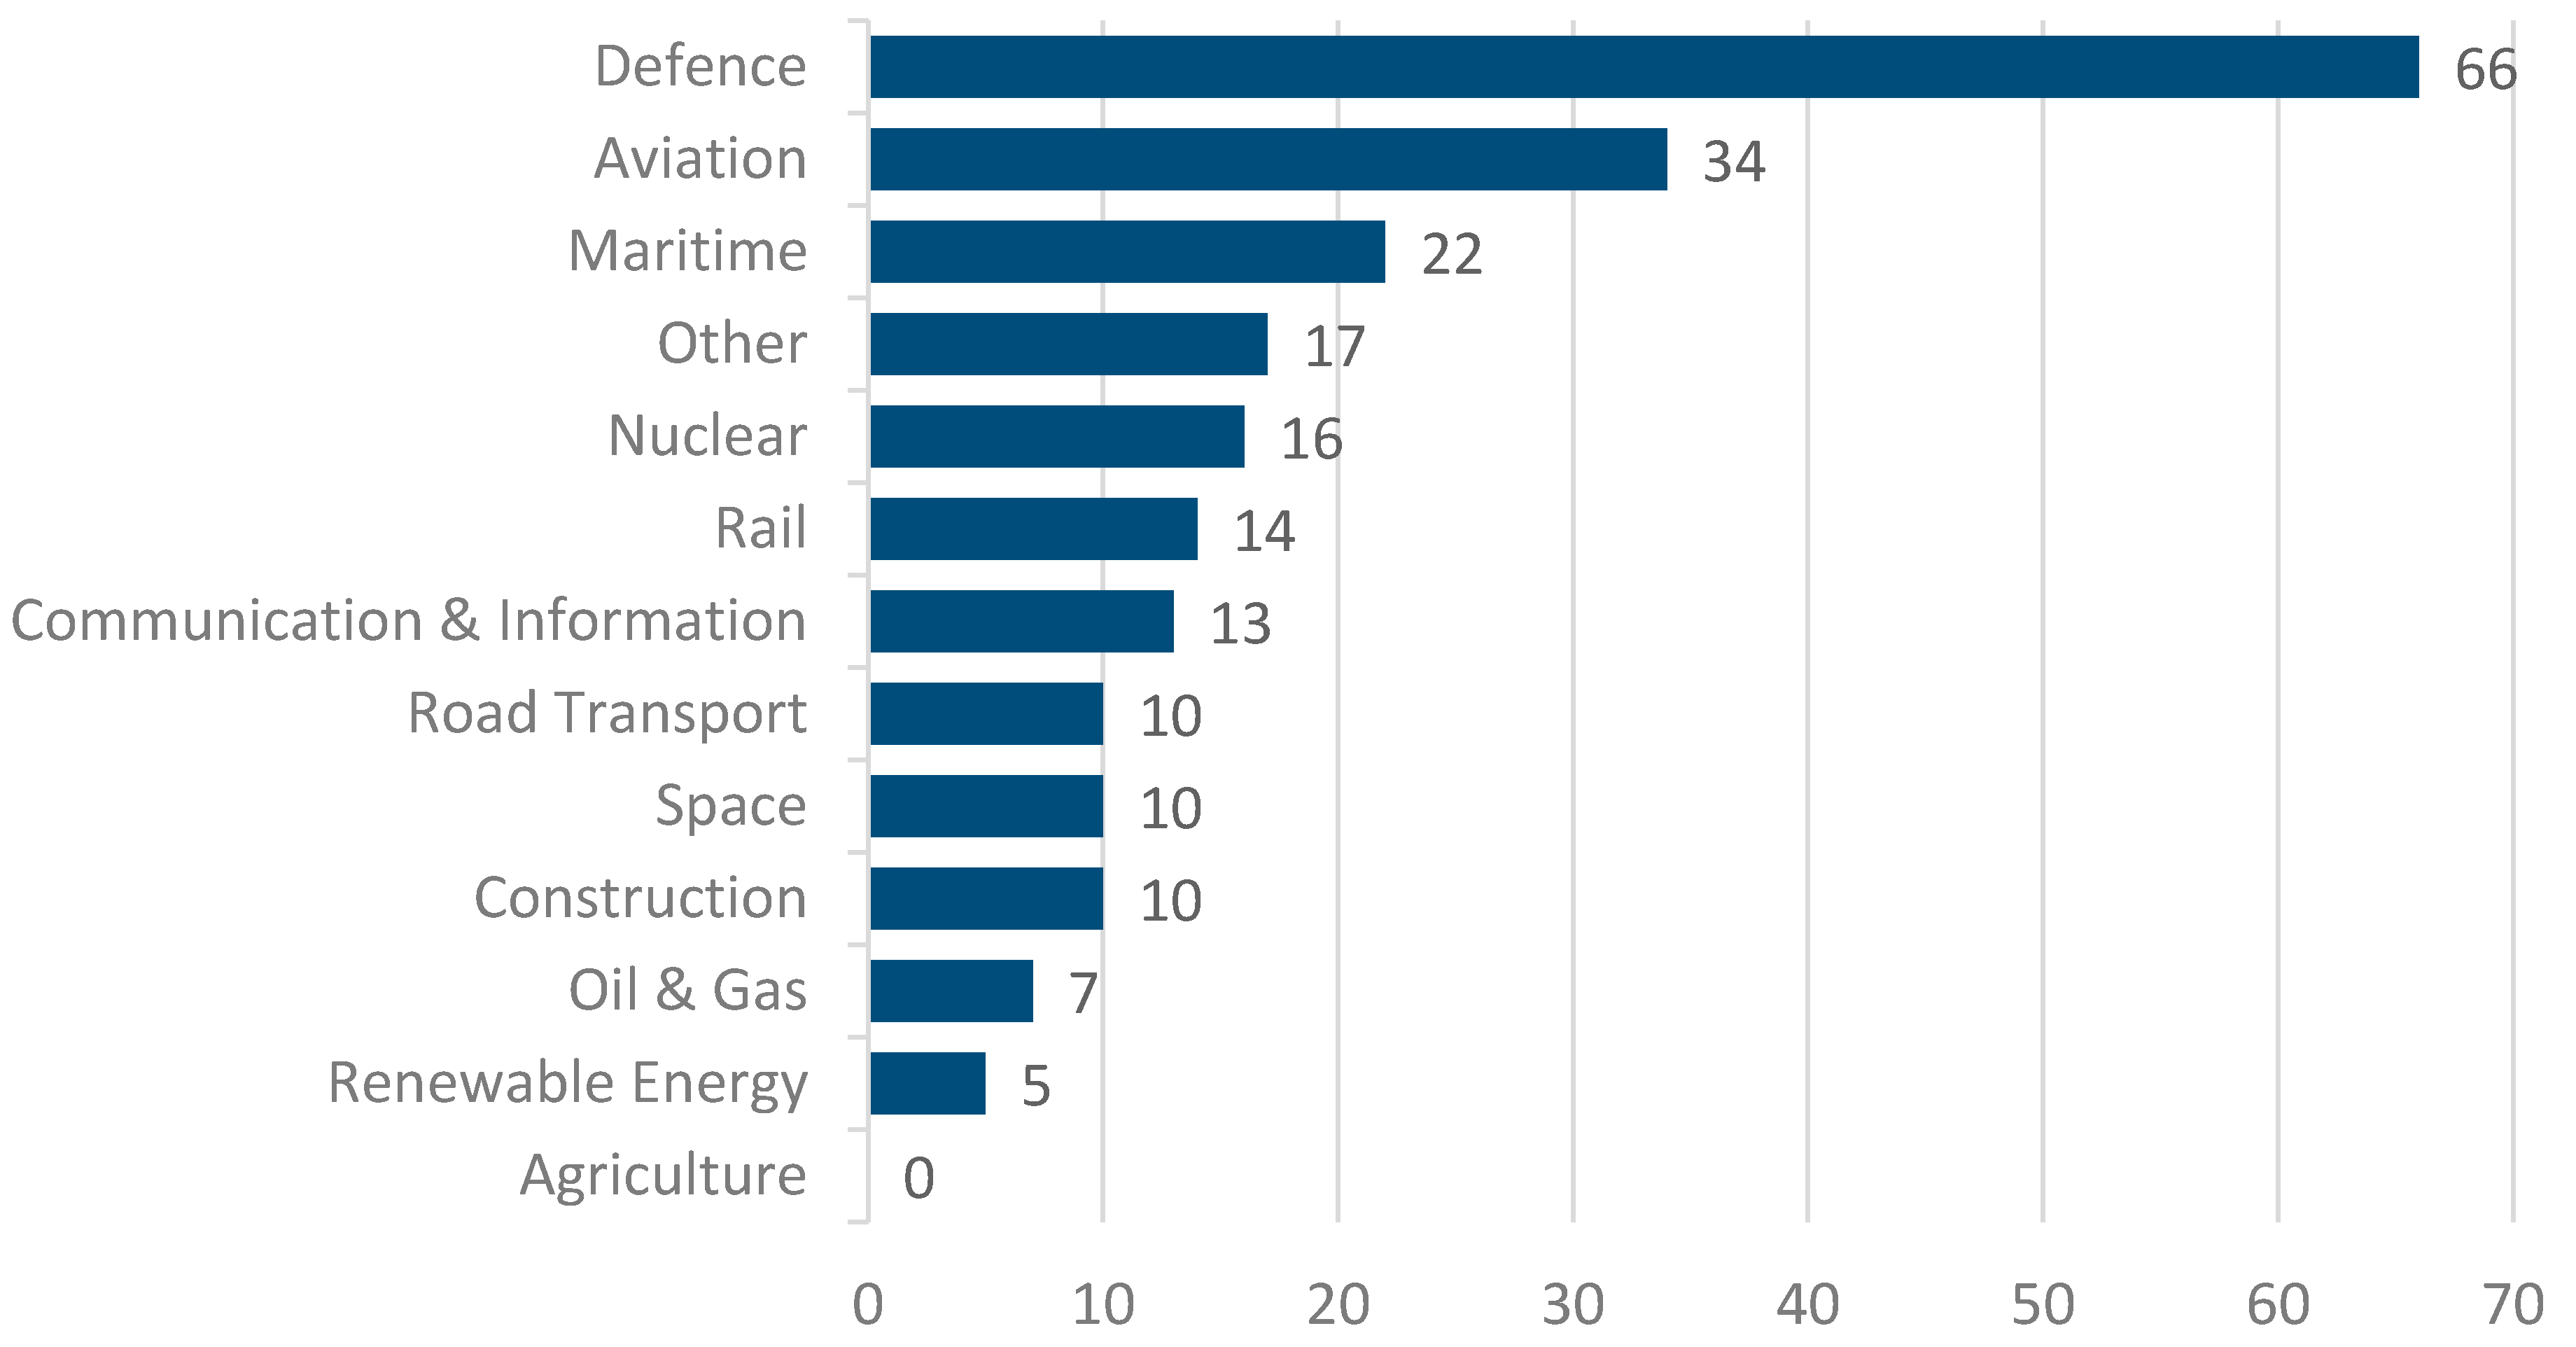
Figure 2.
Interest in DT implementation across the life cycle.
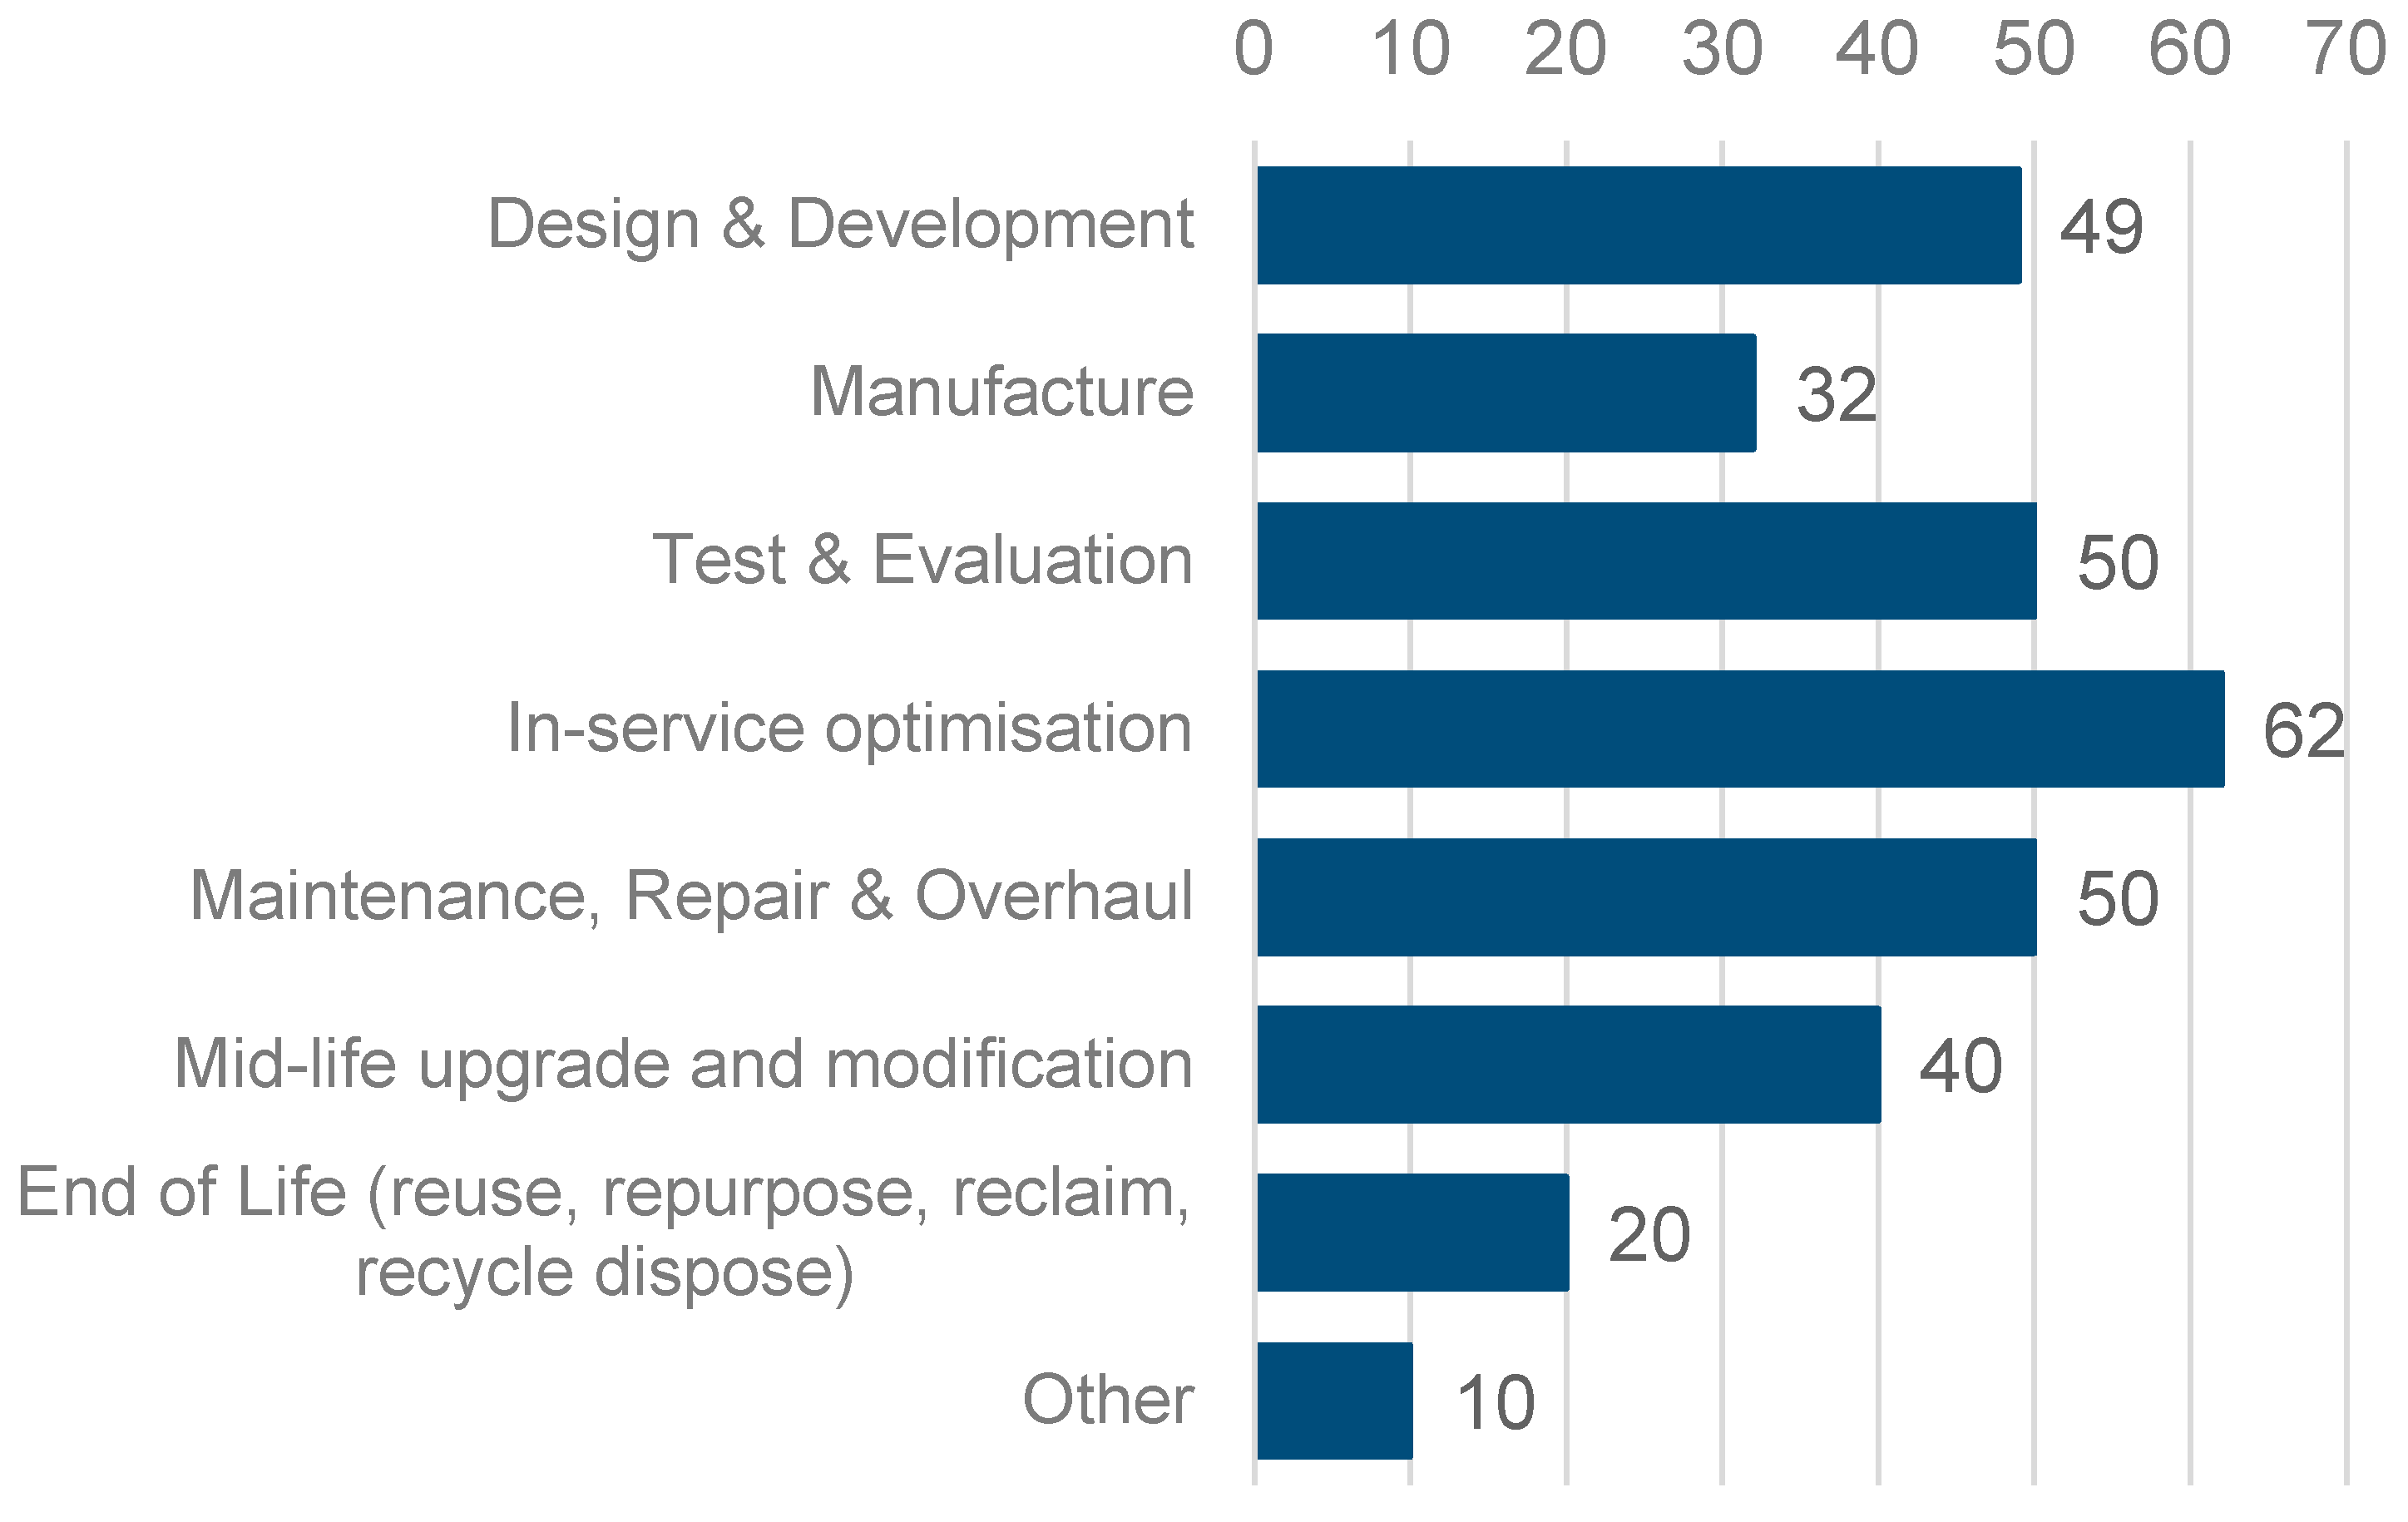
Figure 3.
Pie charts showing the scale of the DT project (left), the status of the DT project (centre), and the level of maturity of e DT project (right).
Figure 3.
Pie charts showing the scale of the DT project (left), the status of the DT project (centre), and the level of maturity of e DT project (right).
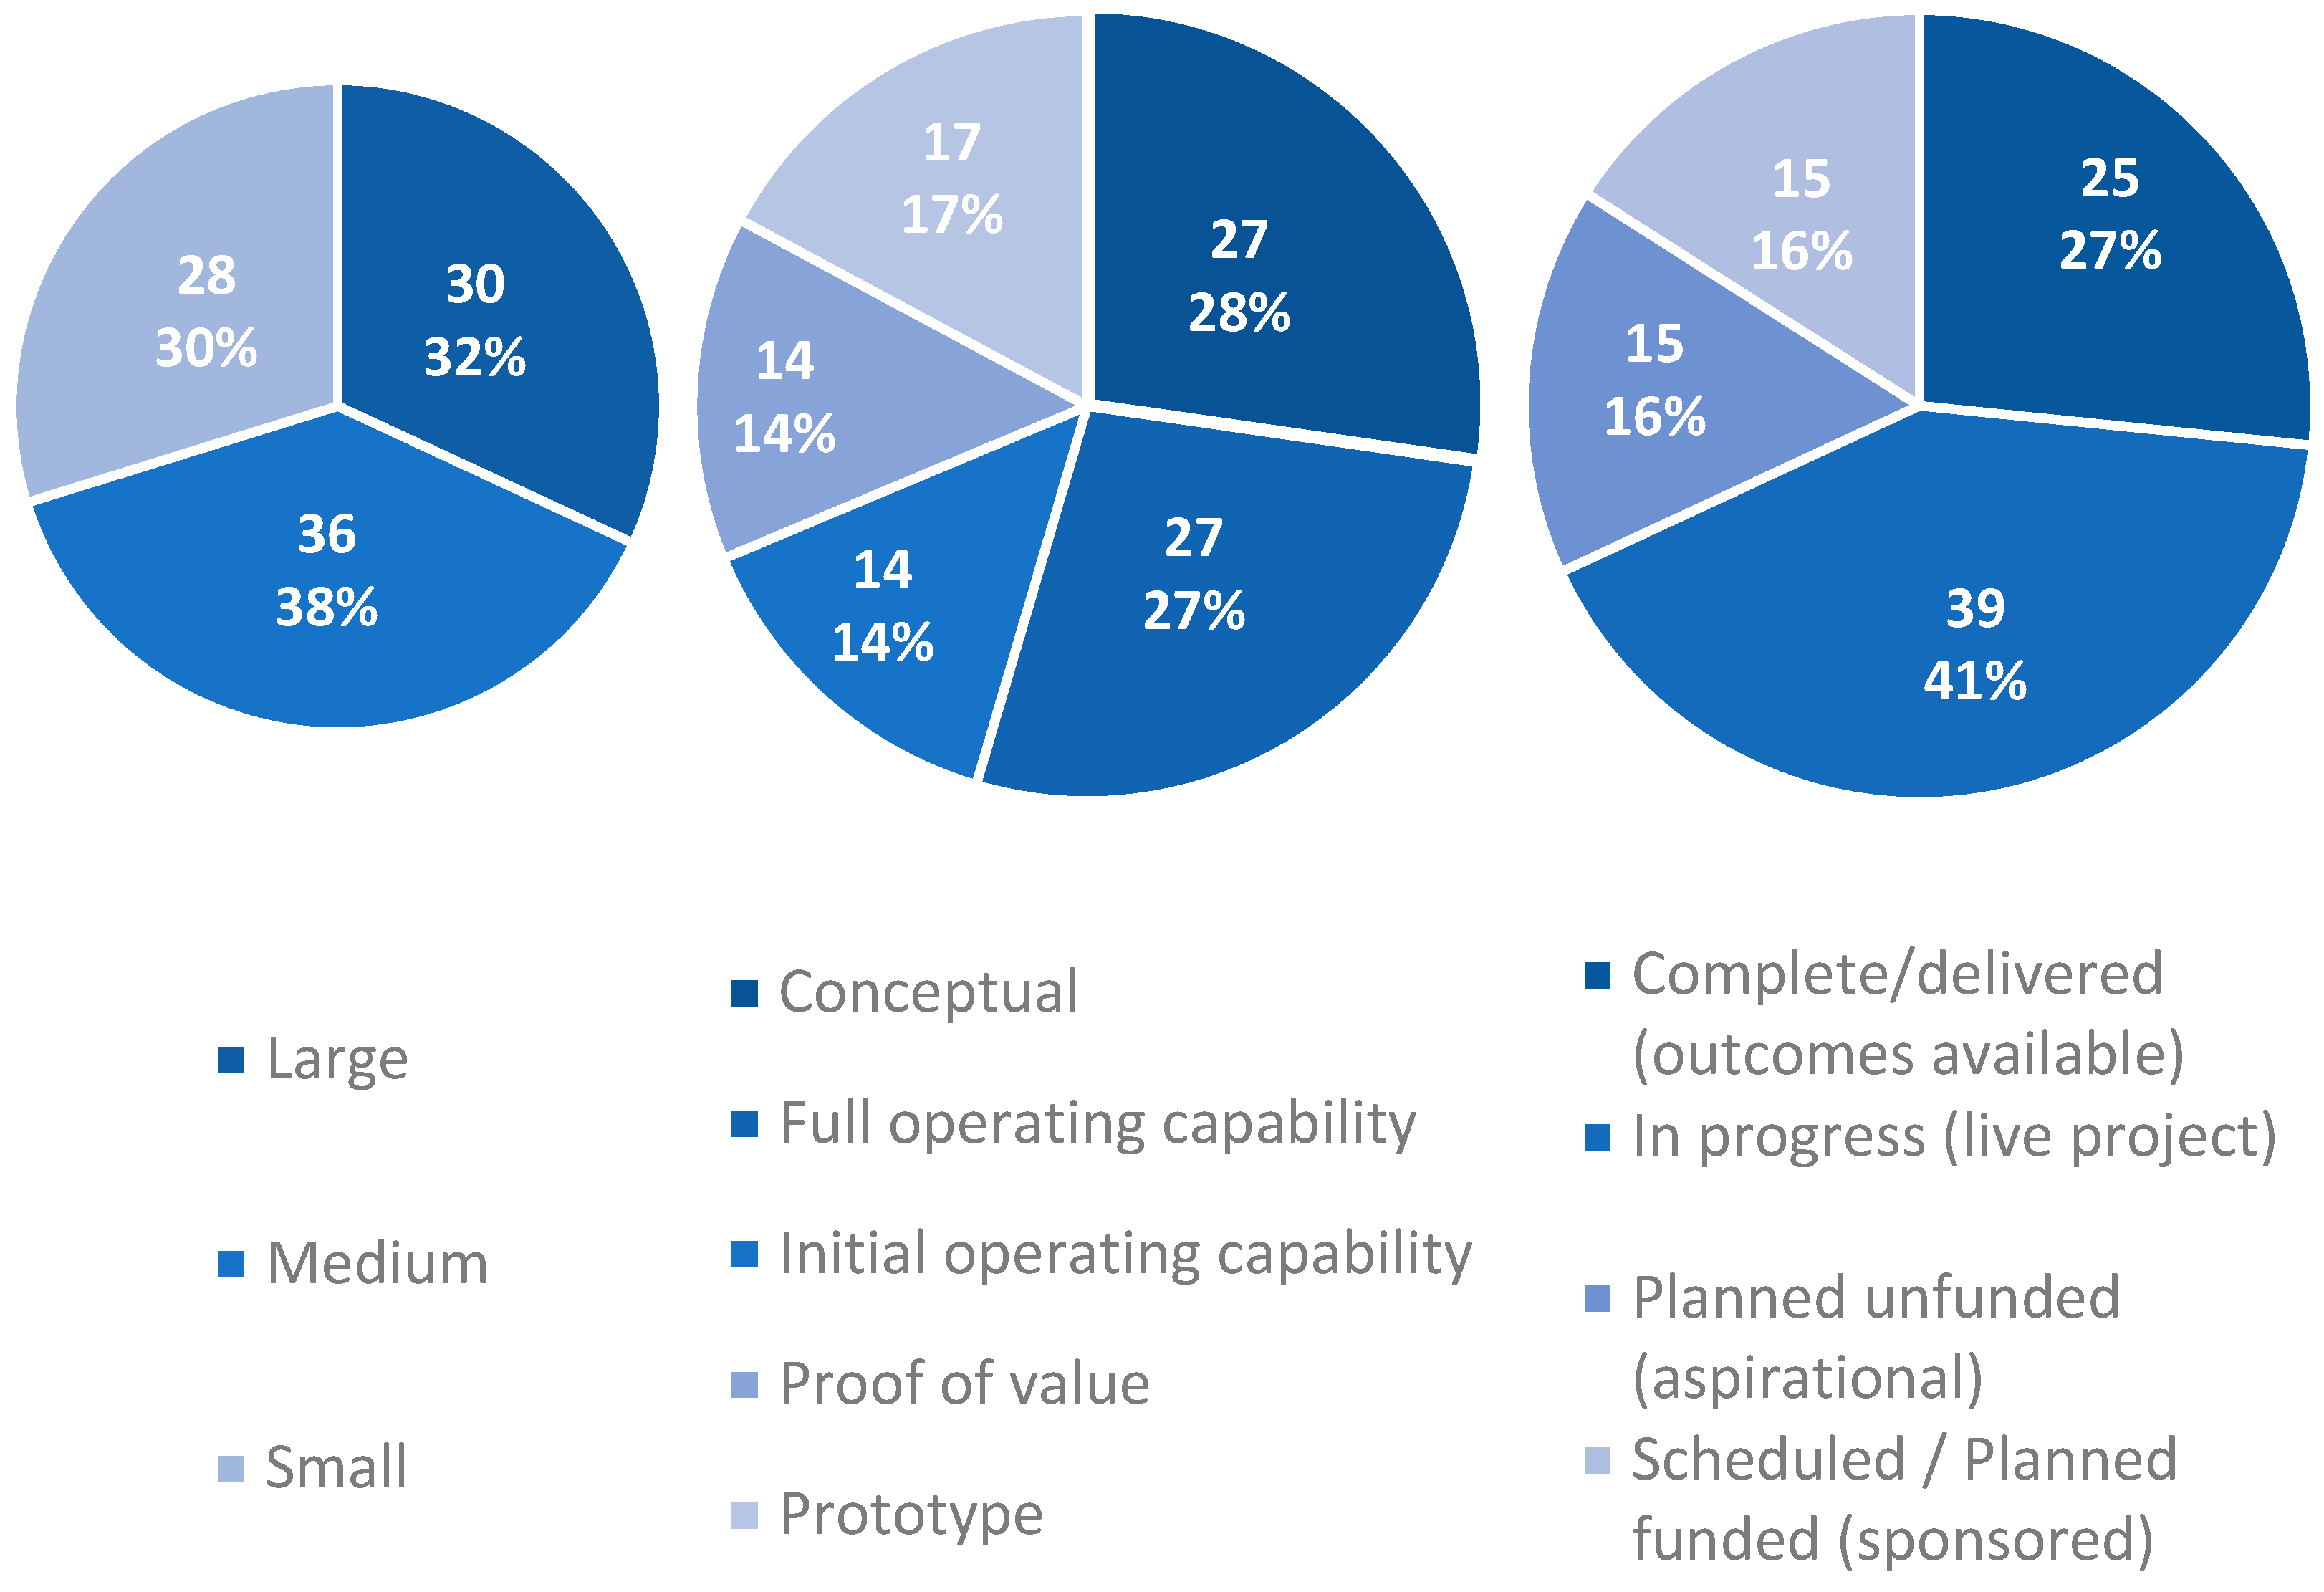
Figure 4.
BEP in years of DT projects divided between completed projects (left), large projects (centre), and small projects (right).
Figure 4.
BEP in years of DT projects divided between completed projects (left), large projects (centre), and small projects (right).
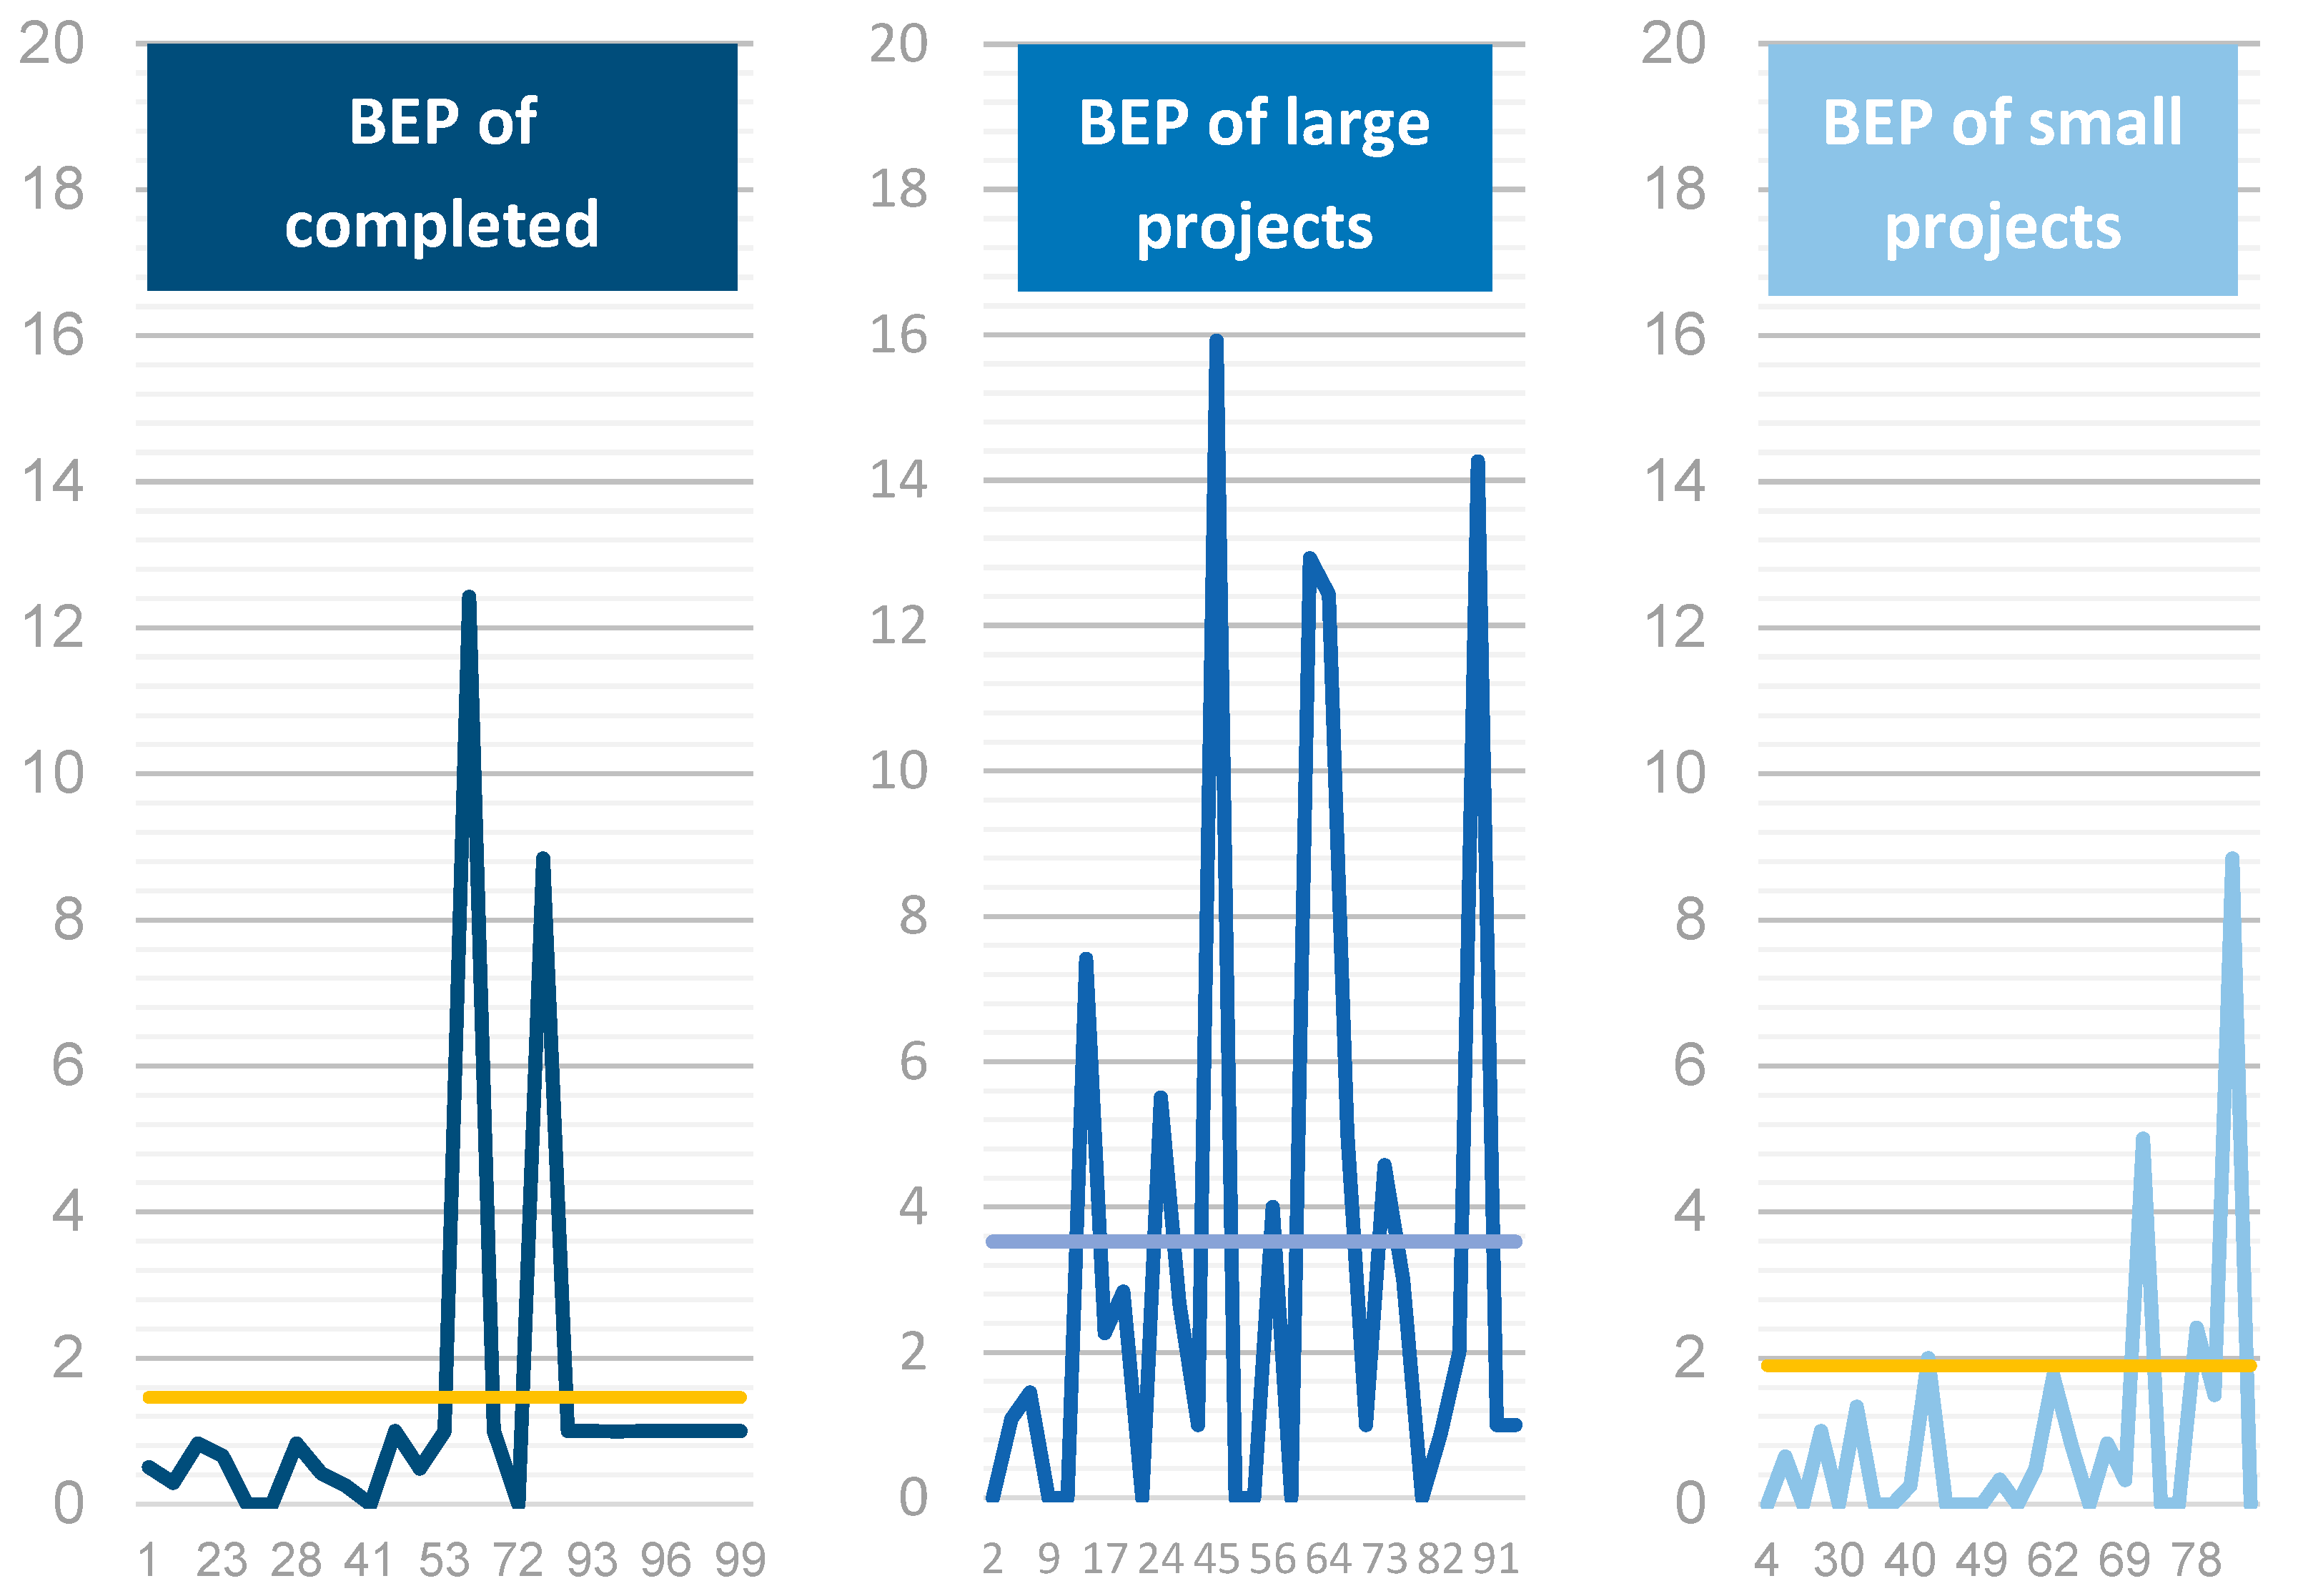
Figure 5.
The focus area of DT.
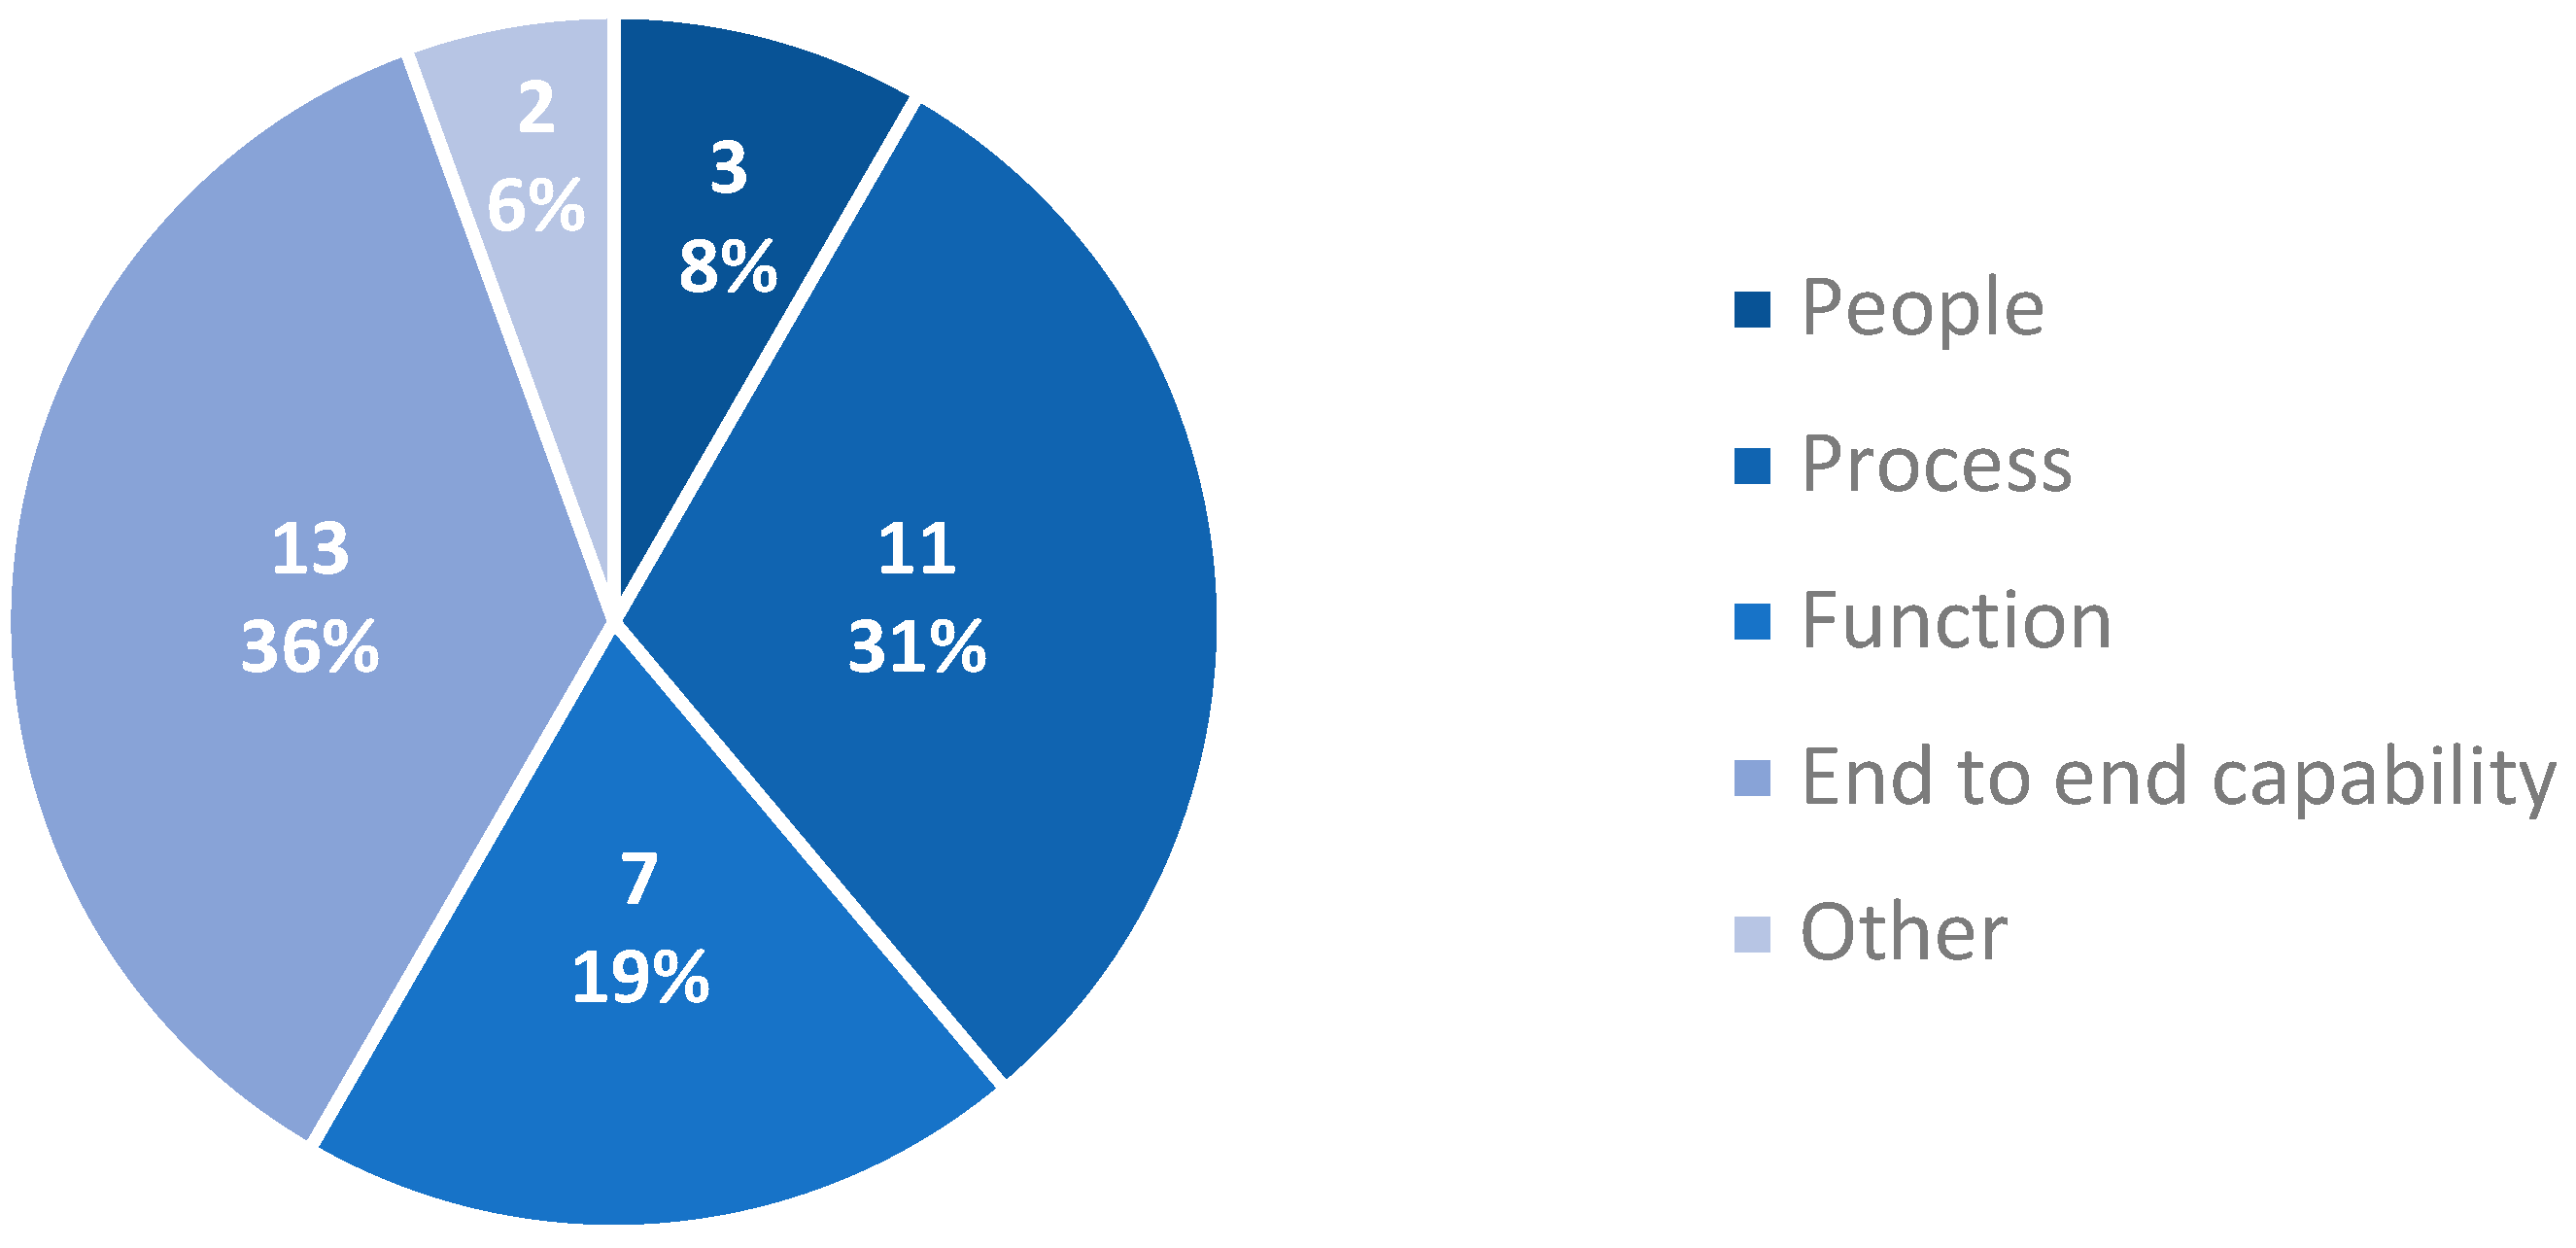
Figure 6.
BEP value based on project size, project status, and DT maturity.
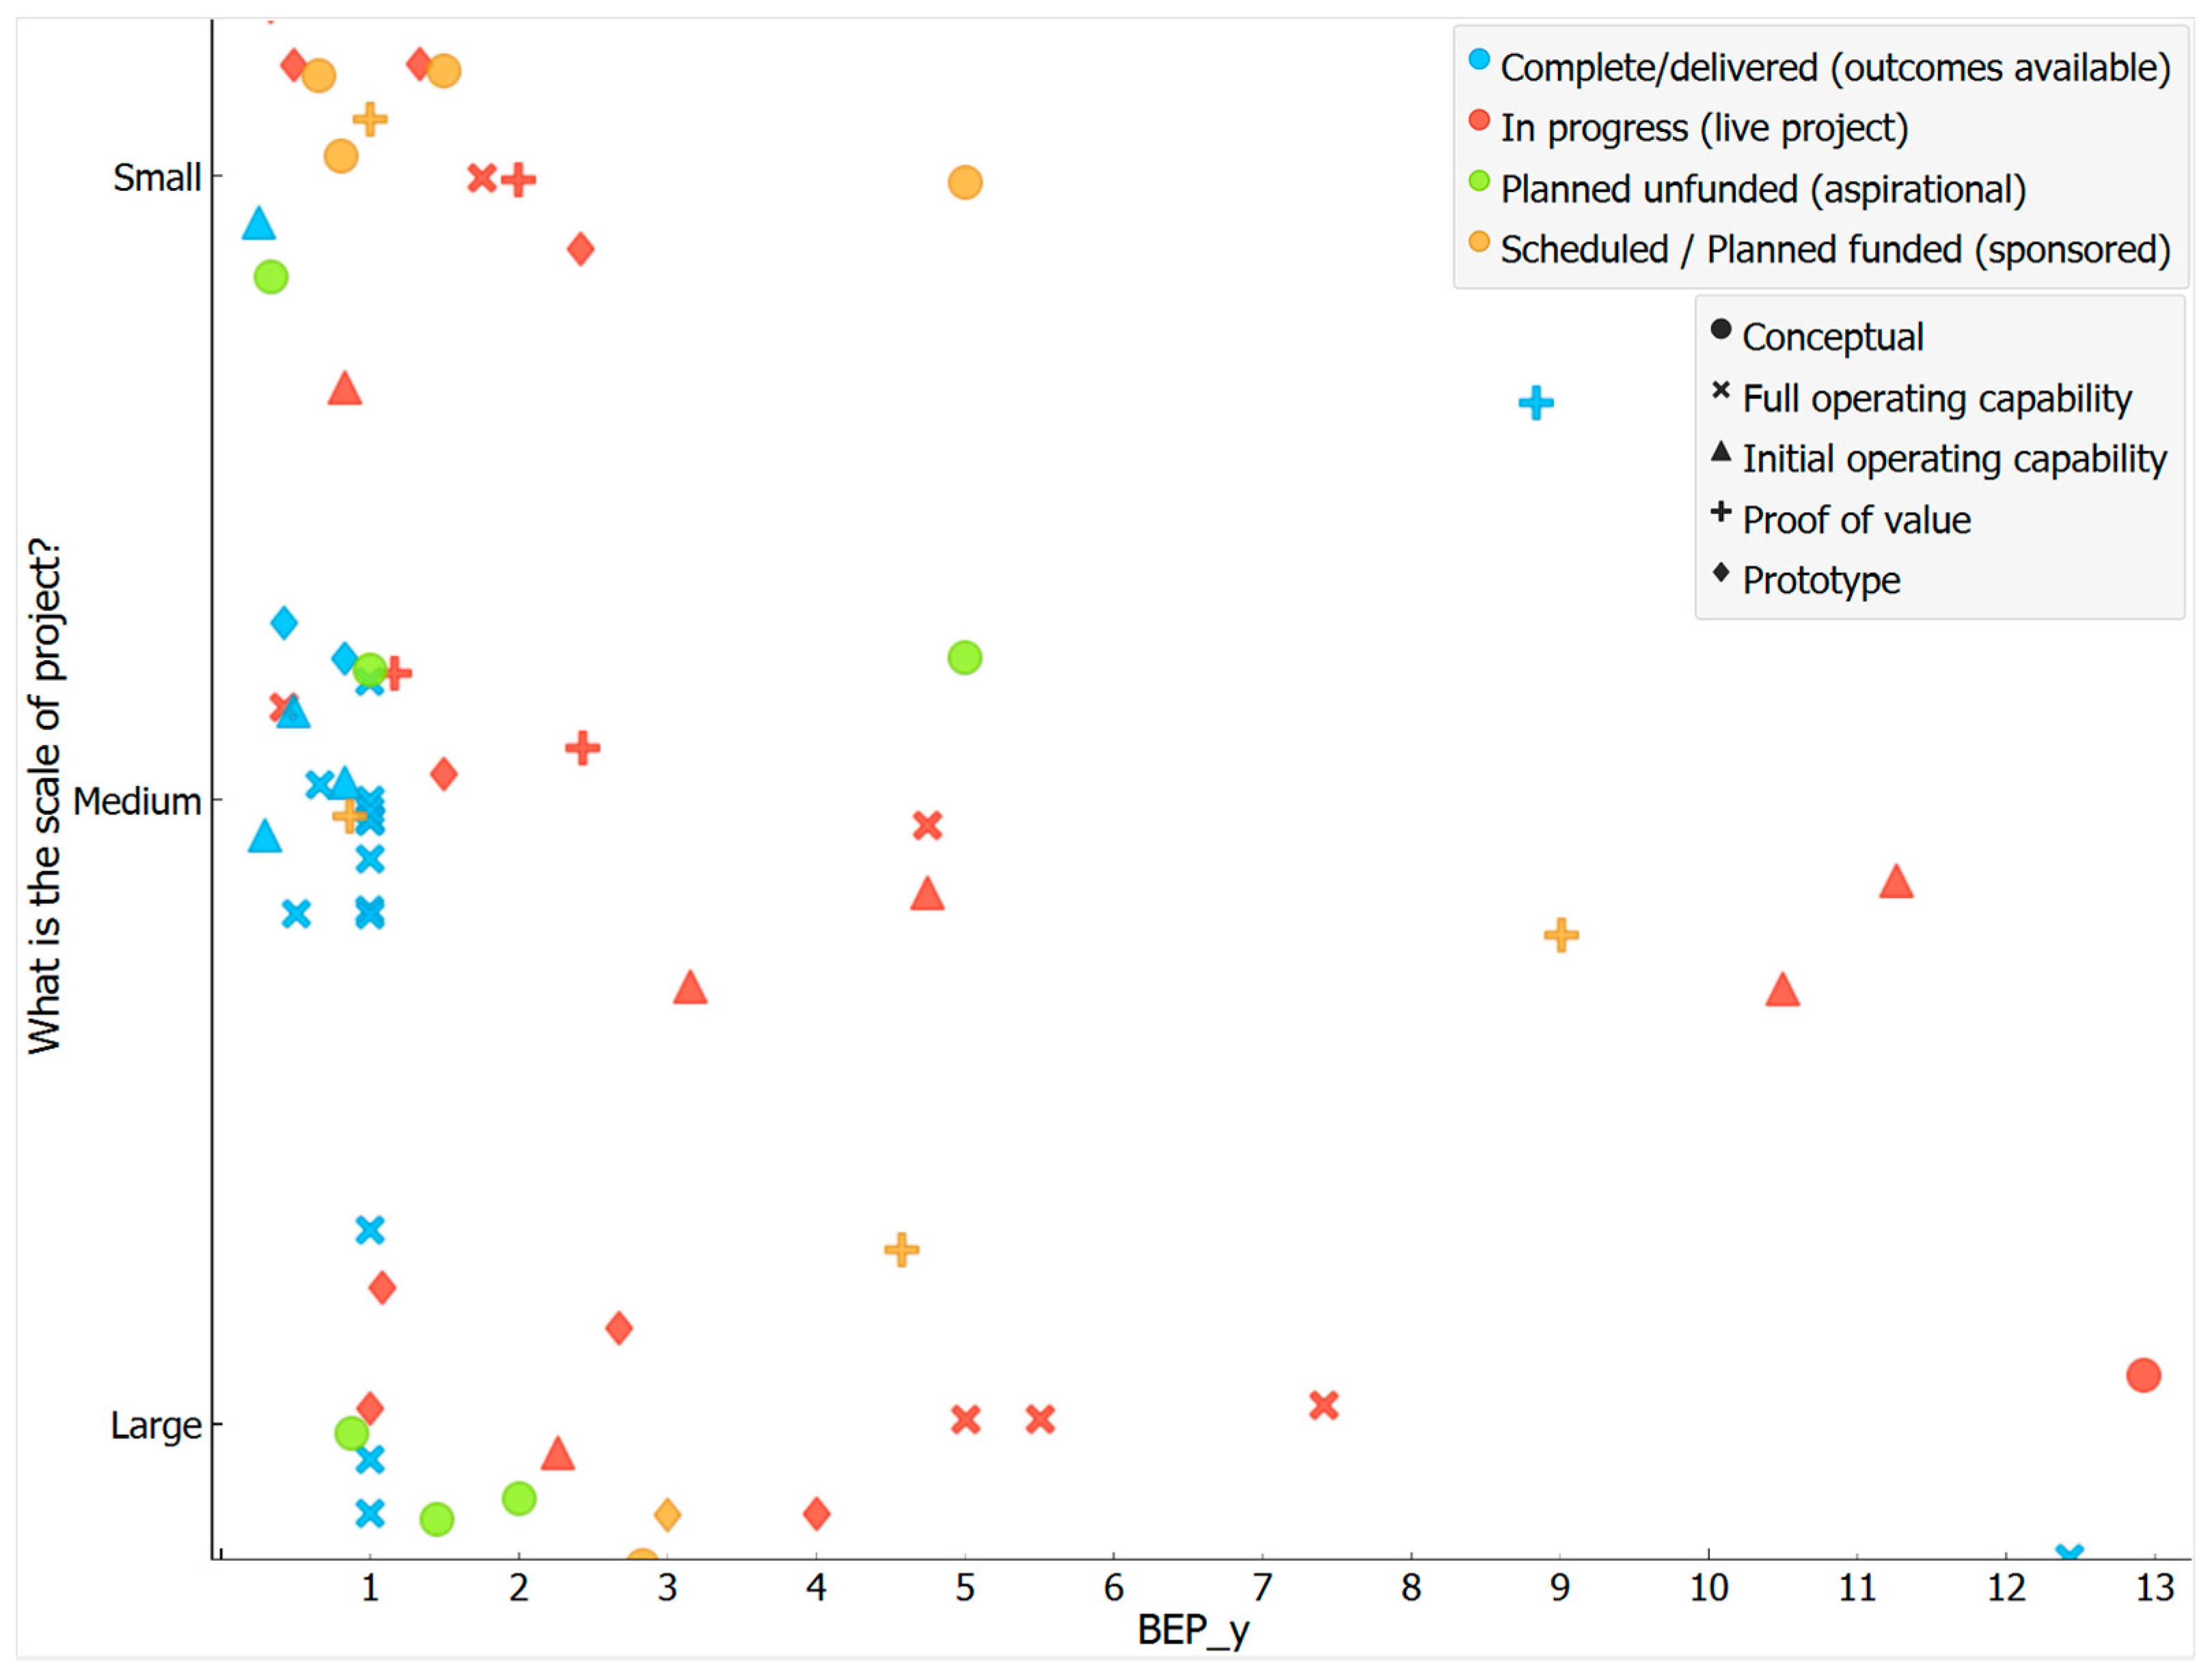
Figure 7.
Box plots of the distribution of the BEP over the DT project size.
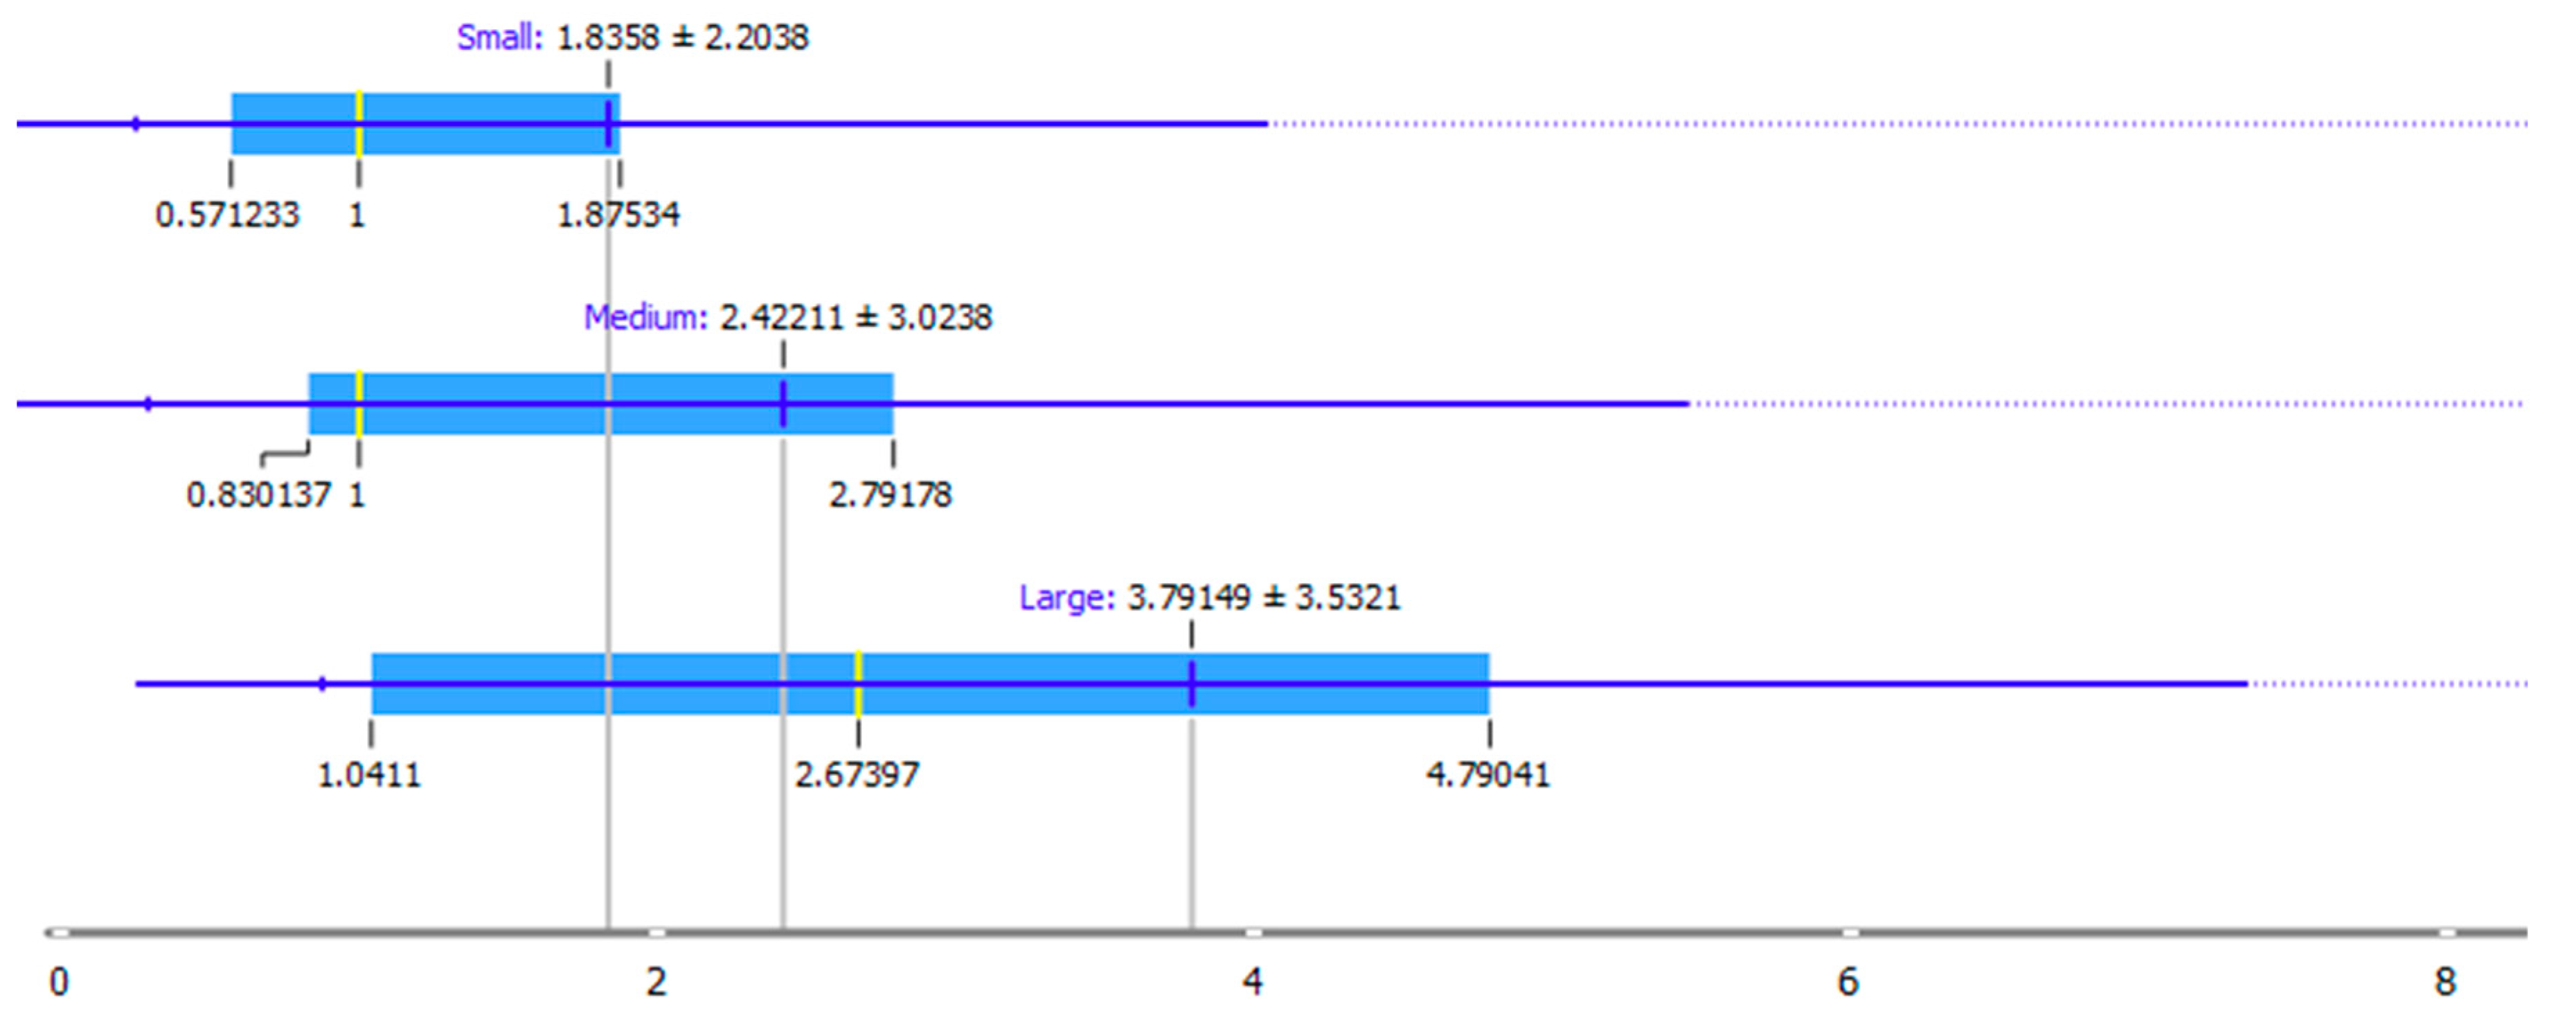
Figure 8.
Box plots of the distribution of the BEP over the DT project status.
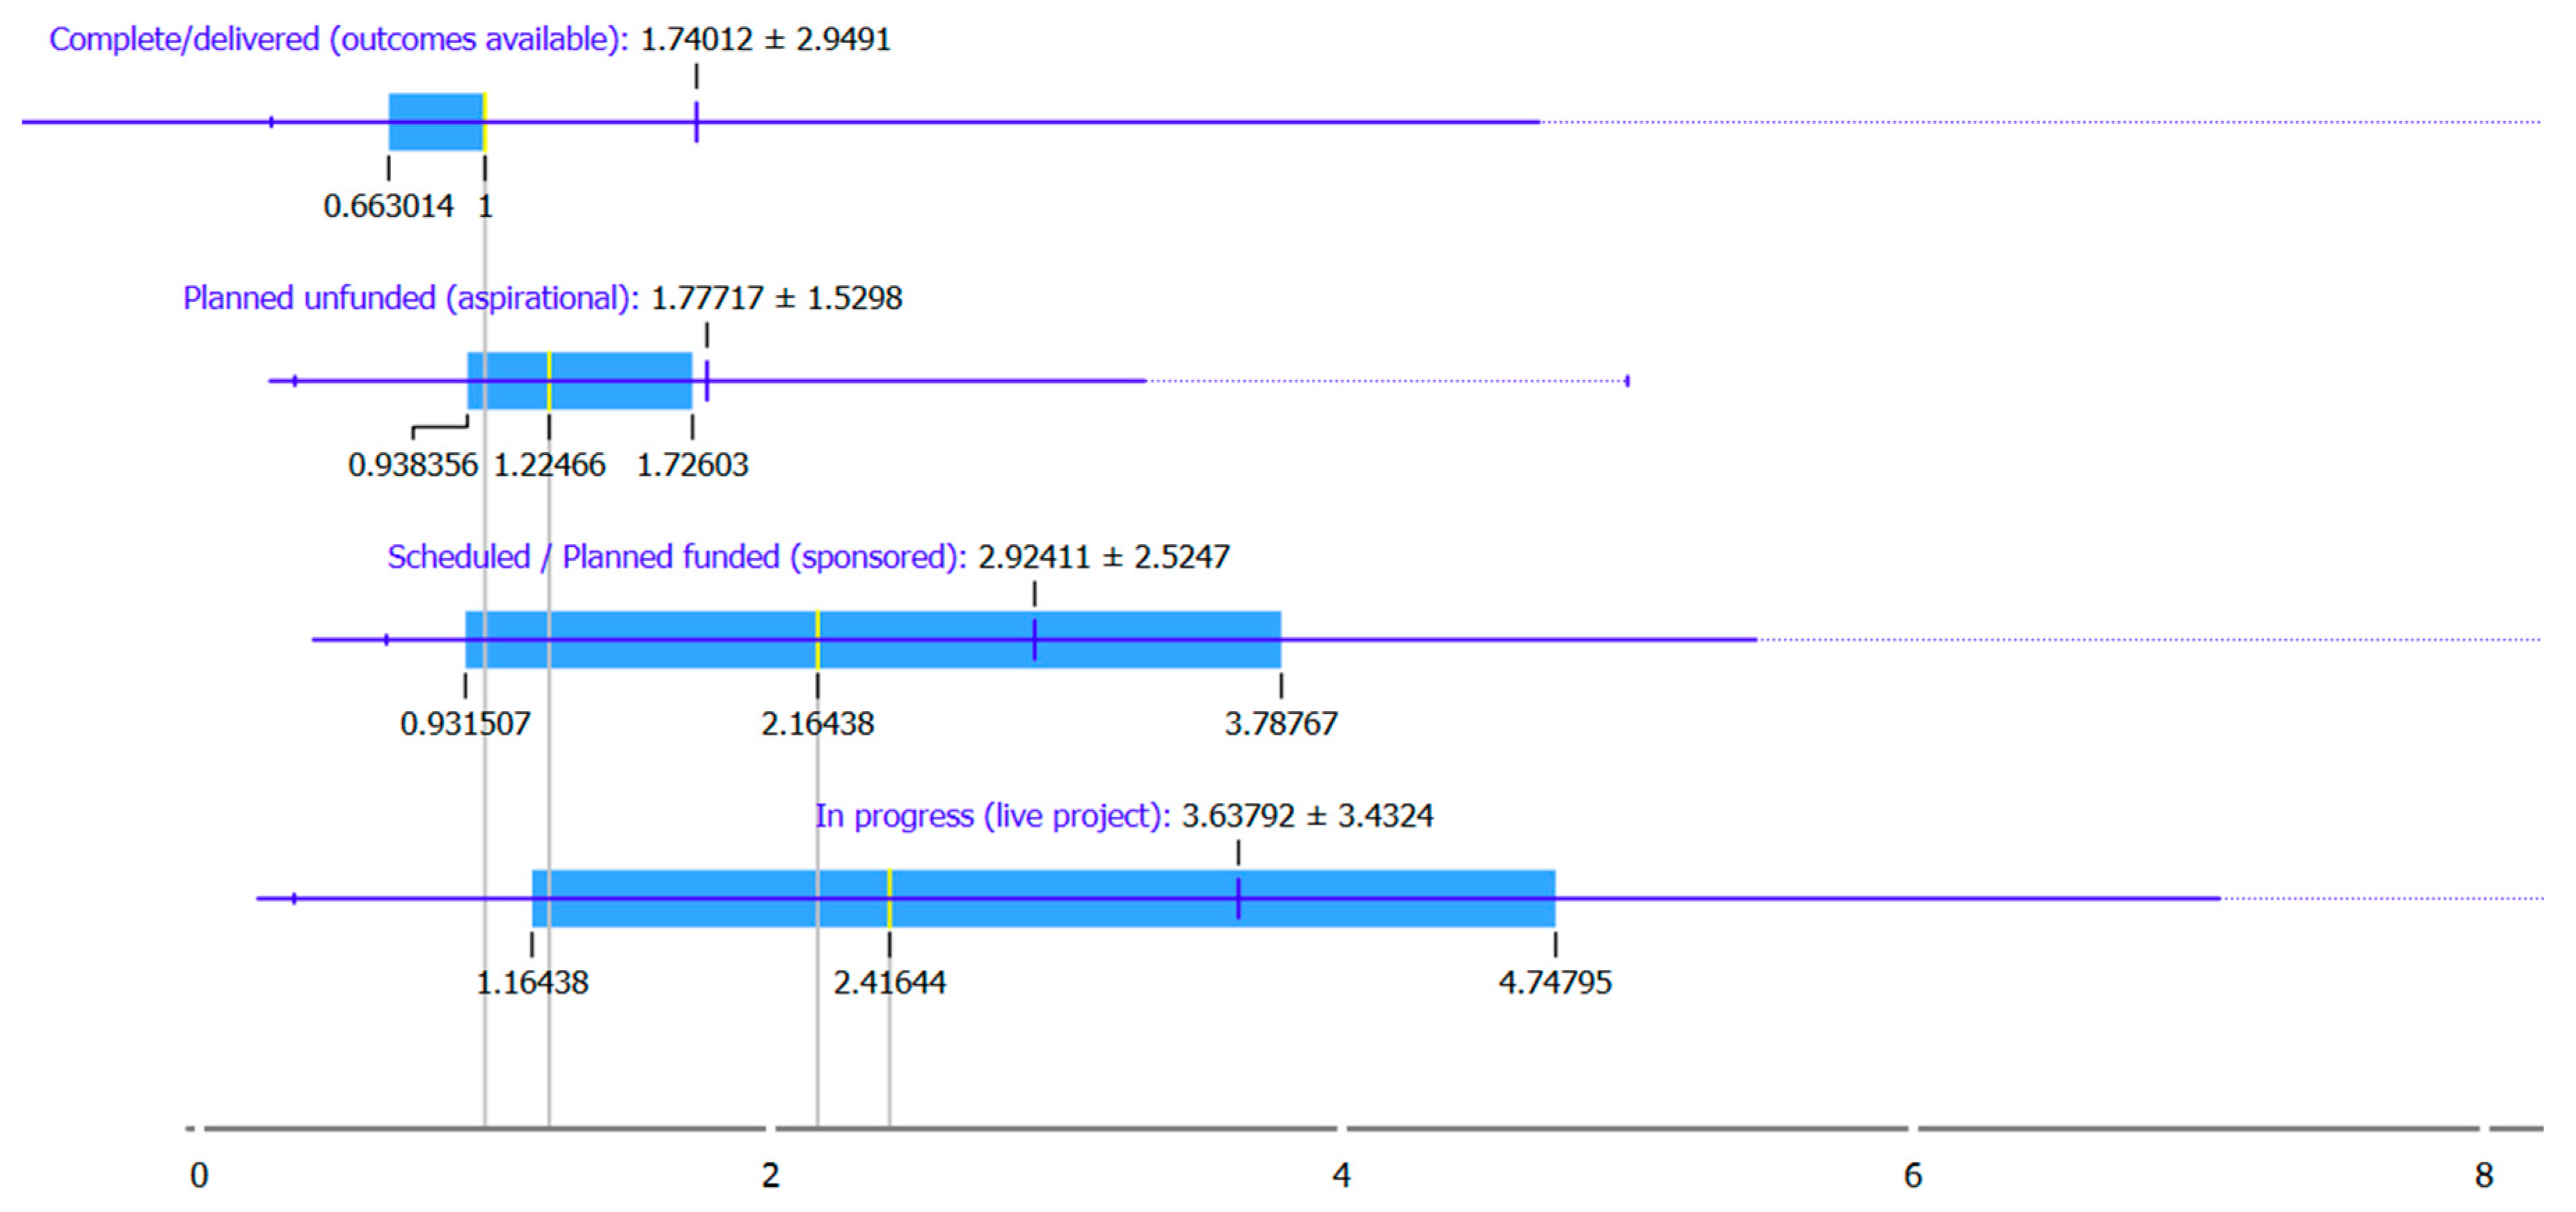
Figure 9.
Box plots of the distribution of the BEP over the maturity of the DT projects.
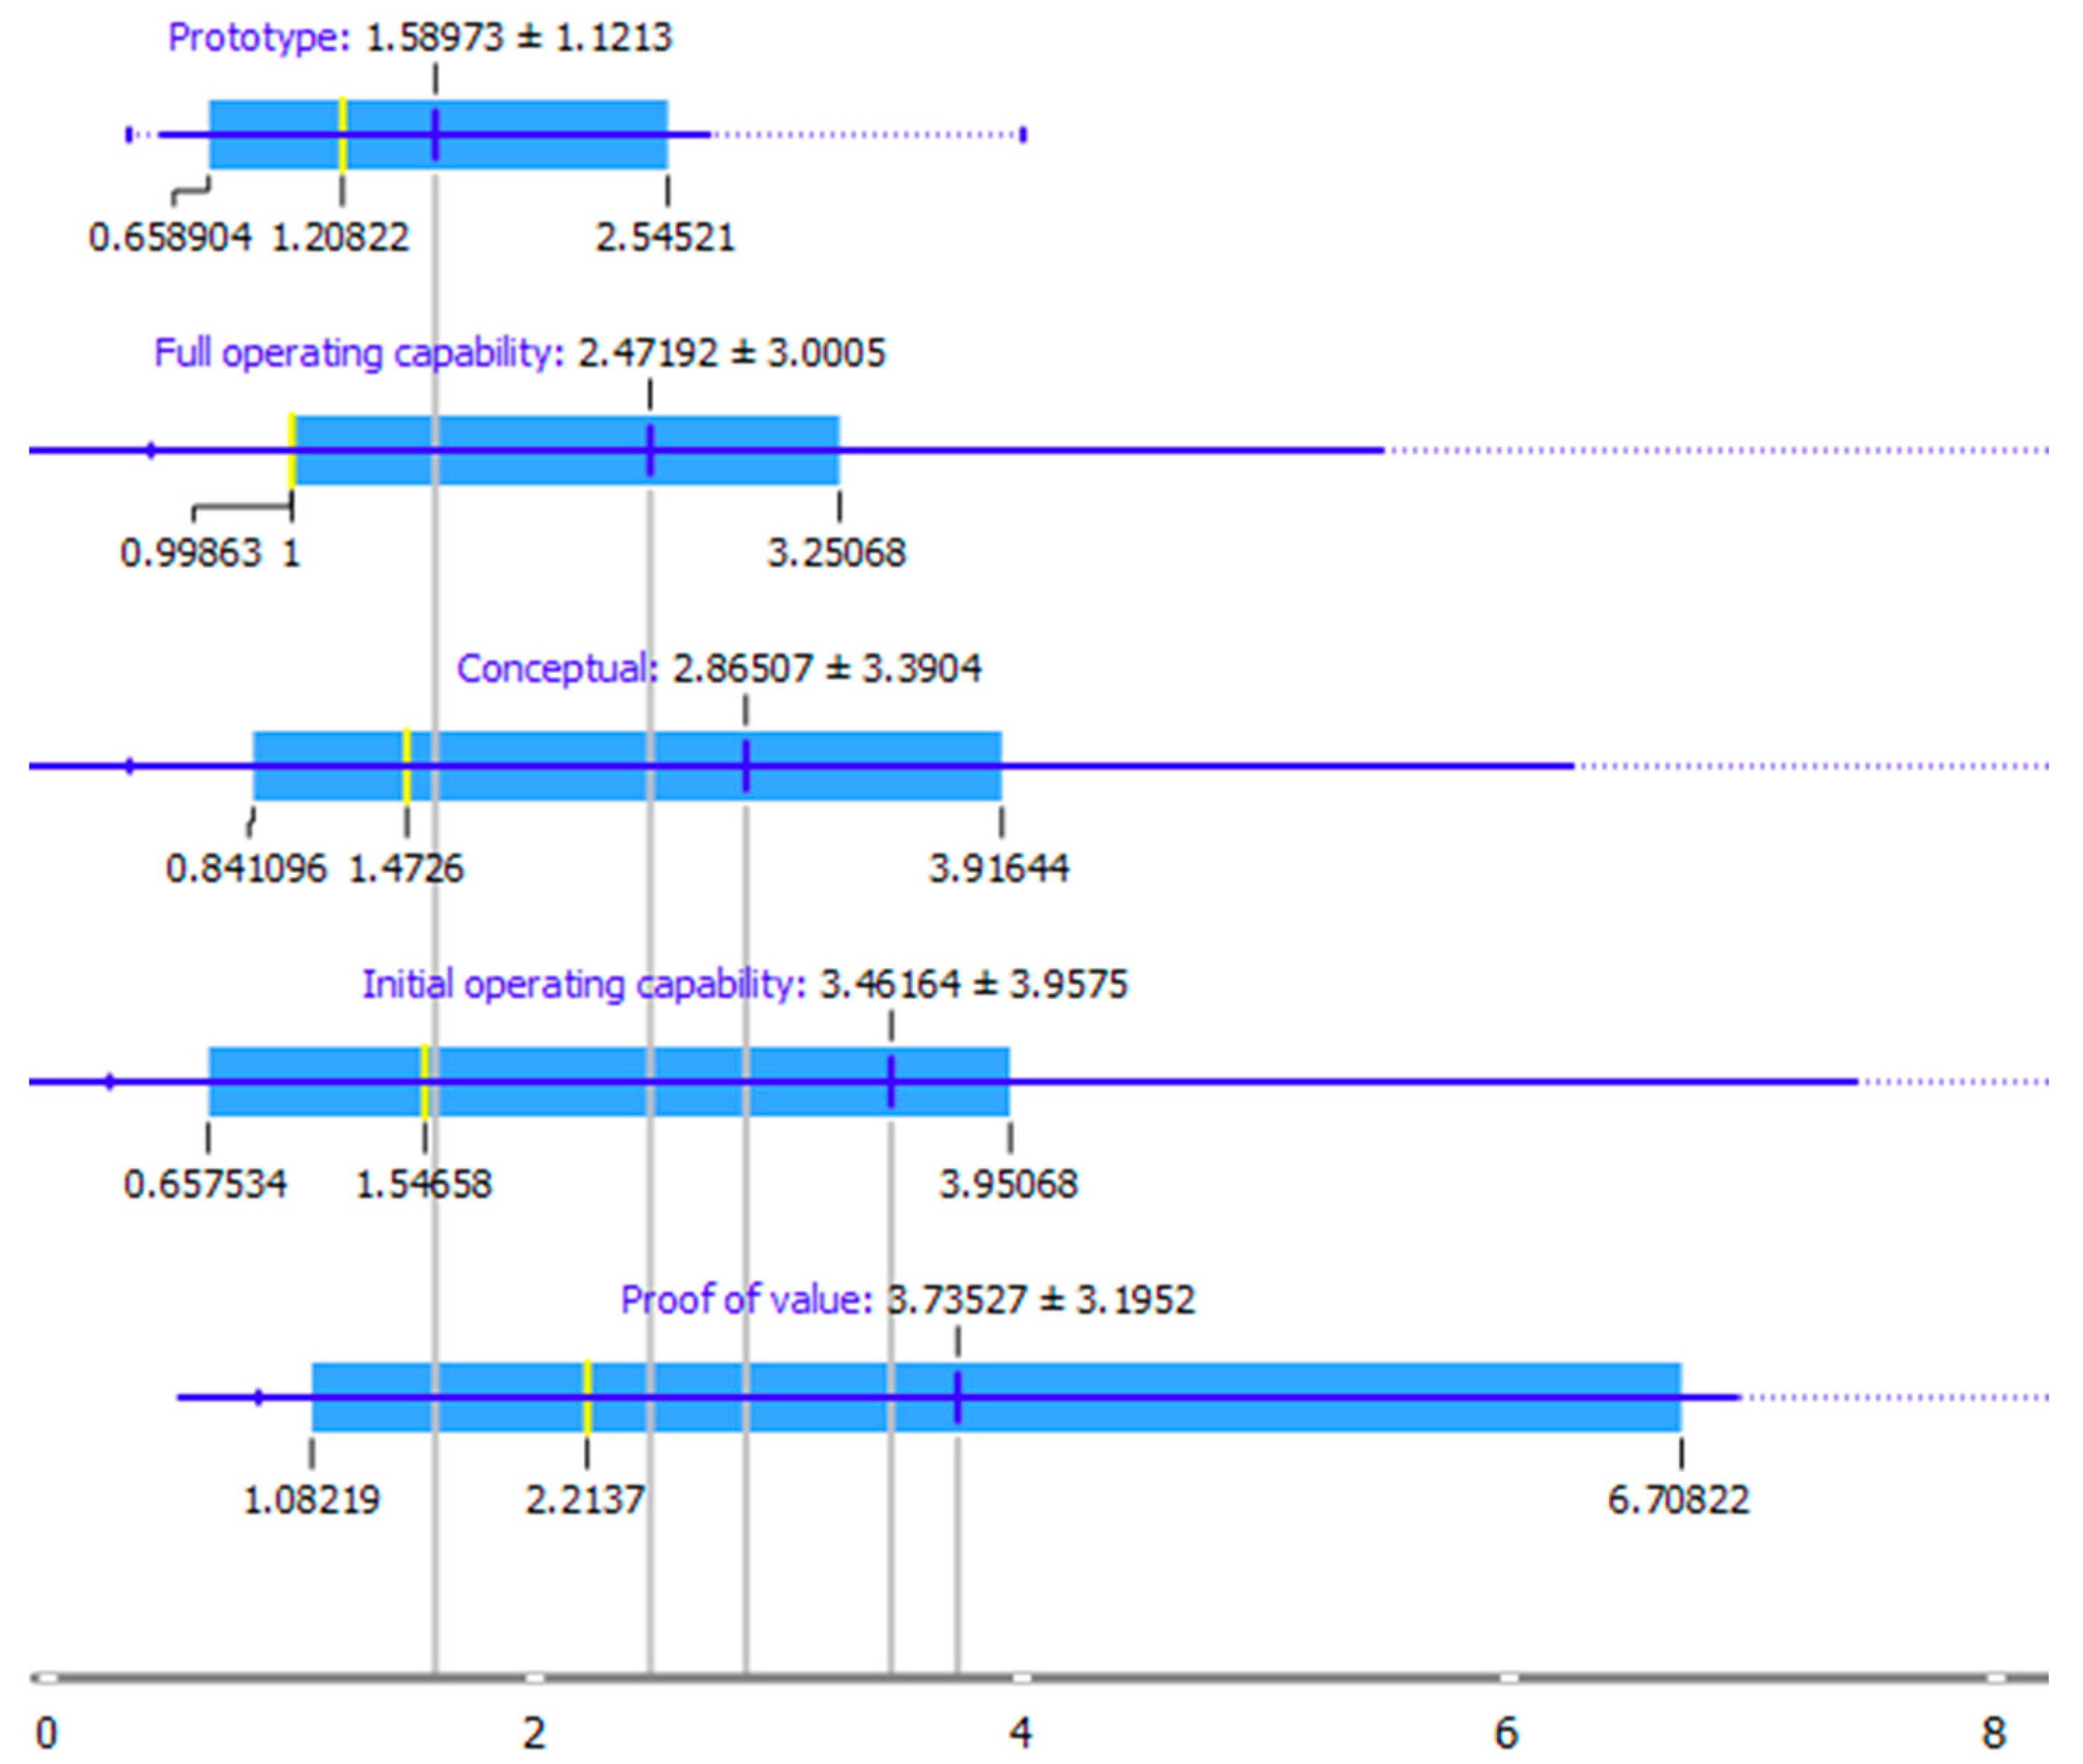
Figure 10.
Purpose area of DT.
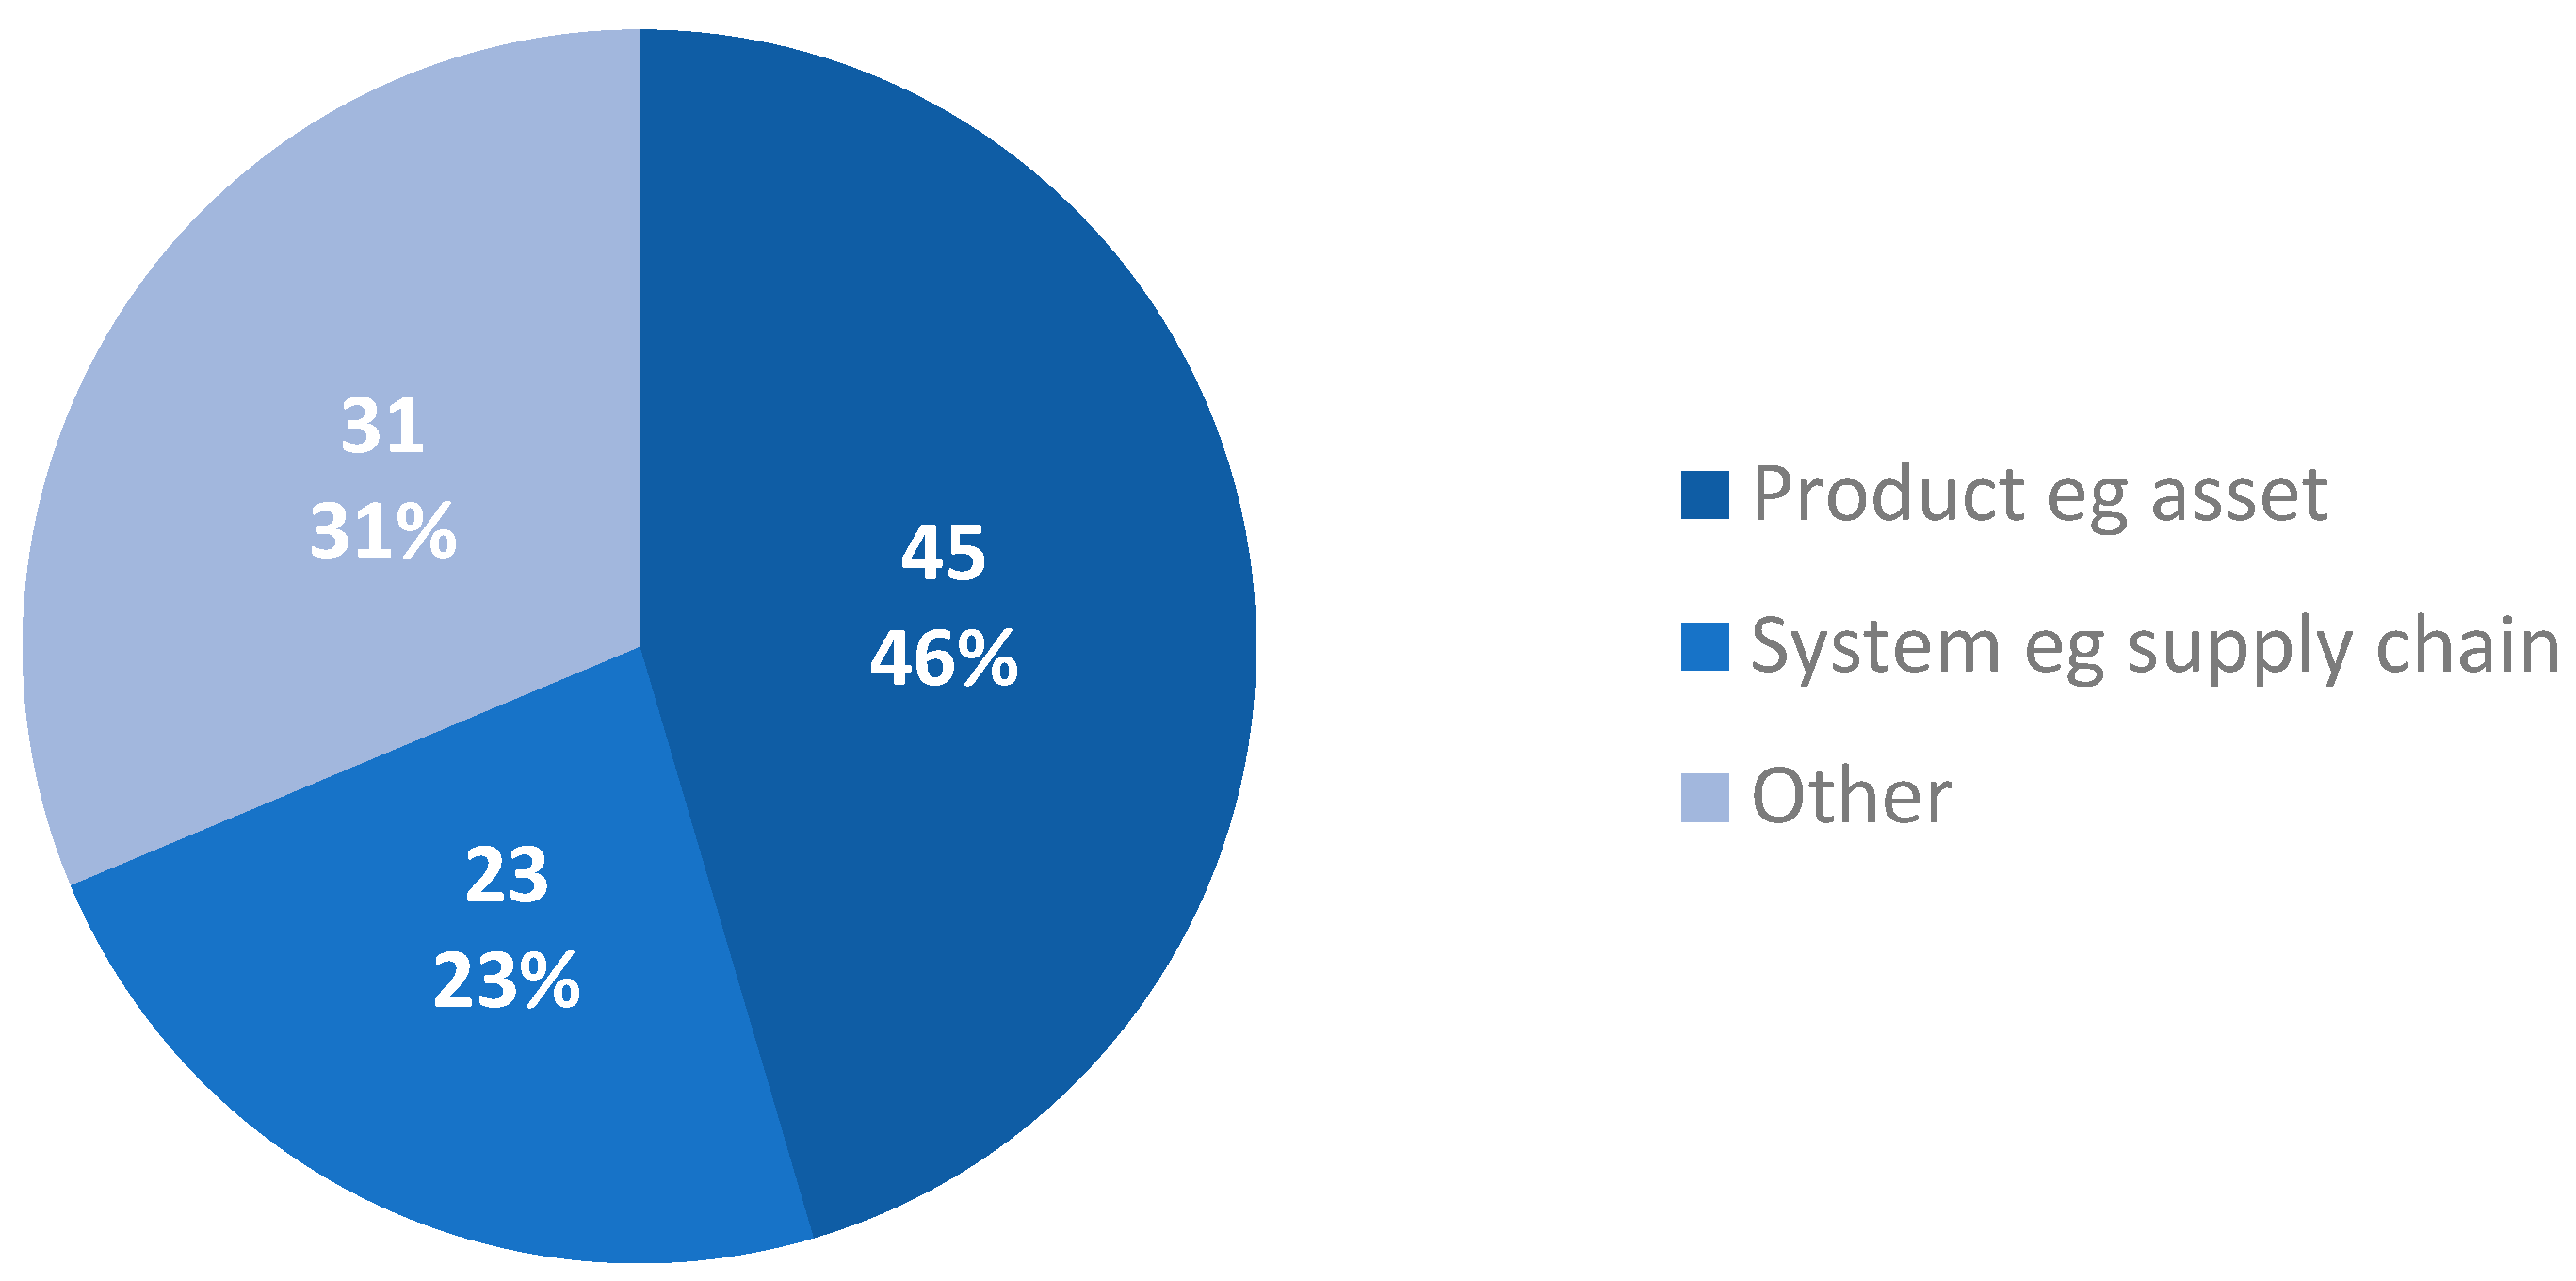

Table 1.
Online survey questions.
| # | Question | Type |
|---|---|---|
| 1 | What business challenge is your digital twin project looking to address? | [Open] |
| 2 | What level of maturity is your project? | [Multiple choice] |
| 3 | What is the theme of the digital twin application? | [Multiple choice] |
| 4 | What areas are applicable to your digital twin? | [Multiple choice] |
| 5 | What is the complex system scope or focus? | [Multiple choice] |
| 6 | Would you like to share any further details? | [Open] |
| 7 | What sector is your digital twin applied to? | [Multiple choice] |
| 8 | What is the status of your project? | [Multiple choice] |
| 9 | What is the scale of the project? | [Multiple choice] |
| 10 | What is the project start date? | [Short answer] |
| 11 | What is the forecast return on investment (when will benefits in the business case be realised)? | [Short answer] |
| 12 | Enter your organisation, department, and role | [Short answer] |
| 13 | If this is a consortium/team who else is involved? | [Open] |
| 14 | Who is the end customer, user, or target audience? | [Open] |
| 15 | Please provide your name and contact details. | [Short answer] |
| 16 | We may wish to contact you to gather additional information in relation to the creation of the compendium of Digital Twinning Implementation. If you would like to become a member of the Community of Practice. Please provide your consent below: | [Multiple choice] |
Table 2.
Profiles of interview meetings (online and 60 mins duration) and participants' details.
| Agent | Company | Location | Date | Years of experience | Role | Industry |
|---|---|---|---|---|---|---|
| A00 | Co_01 | UK | 14/09/2021 | 42 | IT manager | European multinational aerospace corporation |
| A01 | Co_02 | UK | 21/09/2021 | 21 | Head of Digital | European multinational company for the aerospace, defence, transportation and security sectors |
| A02 | Co_03 | UK | 24/09/2021 | 32 | Experimental and MRO Functional Lead | Aerospace design and manufacturing |
| A03 | Co_03 | UK | 24/09/2021 | 13 | Head of Innovation and New Product Design | Aerospace design and manufacturing |
| A04 | Co_04 | UK | 24/09/2021 | 14 | Commanding officer | British government department |
| A05 | Co_05 | UK | 30/09/2021 | 10 | Propositions Manager | Multinational logistics, supply chain, manufacturing and consultancy company |
| A06 | Co_05 | UK | 30/09/2021 | 26 | Chief of Staff and Enterprise Architect | Multinational logistics, supply chain, manufacturing and consultancy company |
| A07 | Co_05 | UK | 30/09/2021 | 23 | Head of Solutions | Multinational logistics, supply chain, manufacturing and consultancy company |
| A08 | Co_06 | UK | 12/10/2021 | 37 | Partner | Engineering and technology consultancy company |
| A09 | Co_07 | UK | 13/10/2021 | 14 | Systems Engineering Information Technologist | Multinational Aerospace, Arms industry, and Information security company |
| A10 | Co_07 | UK | 13/10/2021 | 40 | Engineering Manager | Multinational Aerospace, Arms industry, and Information security company |
| A11 | Co_07 | UK | 13/10/2021 | 12 | Service Integration Manager | Multinational Aerospace, Arms industry, and Information security company |
| A12 | Co_08 | UK | 19/10/2021 | 40 | Head Of Business Intelligence | Multinational Aerospace, Defence, and Space industry |
| A13 | Co_09 | UK | 19/10/2021 | 22 | Head of Data & Analytics | Information technology consulting and services |
| A14 | Co_10 | UK | 21/10/2021 | 25 | Head of Digital Integration | Multinational Aerospace and Defence company |
Table 3.
Steps of the thematic analysis.
| Step | Description of the process | Application to this work |
|---|---|---|
| Familiarising with data | Transcribing the interviews, reading and re-reading the transcripts, and noting down initial ideas. | Manual transcription of the recorded interviews. |
| Generating initial codes | Coding interesting features of the interviews in a systematic fashion across the entire data set, collating data relevant to each code. | Find common codes among all the interviews. Creation of codes in the NVivo tool. |
| Searching for themes | Collating codes into potential themes, gathering all data relevant to each potential theme. | Grouping codes based on themes and creation of themes. |
| Reviewing themes | Checking if the themes work in relation to the coded extracts and the entire data set. | Validate the themes by checking the codes for each interview. |
| Defining and naming themes | Generating clear definitions and names for each theme. | See Table 4. |
| Producing the report | Reporting the results obtained in a paper. | Writing the final paper. |
Table 4.
Themes resulted from the thematic analysis.
| Theme | Description |
|---|---|
| Drivers & inhibitors | This theme gathers the factors that drive or interfere the DT development. Those factors include the benefits, the challenges that the DT undertake, the barriers, and the problems. |
| Digital twin properties | This theme gathers the factor that characterises the DT. Those factors include the attributes, the elements that constitute the DT, the semantic properties, and the visualisation properties. |
| Finance | The theme gathers the factors that characterise the economic aspect of the DT. Those factors include the return on the investment, and the funding used to start a DT project. |
| Next steps & needs | The theme gathers the factors that provide a future vision in the DT context. Those factors include the future scenario, the suggestions, the needs, and the next steps. |
Table 5.
Table of DT drivers.
| Drivers | Sources | References |
|---|---|---|
| Autonomy | 1 | 1 |
| Customer satisfaction | 1 | 1 |
| Enable system of systems | 1 | 1 |
| Improve the company’s efficiency | 2 | 2 |
| Improve knowledge and awareness | 3 | 4 |
| Optimisation | 2 | 4 |
| Safety | 2 | 2 |
| Simplify complexity | 1 | 1 |
| Sustainability | 1 | 1 |
Table 6.
Table of inhibitors.
| Inhibitors | Sources | References |
|---|---|---|
| Company’s mindset, lack of skills, and understanding | 4 | 9 |
| Complexity | 4 | 7 |
| Expensive | 1 | 1 |
| Interoperability issue | 8 | 17 |
| Quality of data | 2 | 3 |
| Uncertainty | 2 | 2 |
Table 7.
Table of DT attributes.
| Attributes | Sources | References |
|---|---|---|
| Not necessarily real-time | 1 | 1 |
| Portability, scalability, and interoperability | 3 | 3 |
| Through life support of the real entity | 1 | 1 |
Table 8.
Table of DT design.
| DT design | Sources | References |
|---|---|---|
| Defined procedure | 4 | 4 |
| Diversity of the team | 7 | 9 |
| DT for data validation | 1 | 1 |
| Focus on safety | 1 | 1 |
| Focus on simulation | 1 | 2 |
| No formal procedure | 5 | 5 |
| Start from a research problem | 1 | 2 |
| Start from the purpose | 6 | 8 |
Table 9.
Table of DT visualisation.
| Visualisation | Sources | References |
|---|---|---|
| Dashboards | 1 | 2 |
| Focus on data | 2 | 2 |
| Focus on value | 7 | 13 |
| Headsets | 3 | 4 |
Table 10.
Table of DT semantics.
| Semantics | Sources | References |
|---|---|---|
| Not aware | 1 | 1 |
| Ontology | 3 | 3 |
| Standard approach | 6 | 9 |
| Still research topic | 2 | 2 |
Table 11.
Results from the return-on-investment questions.
| Return of investment | Sources | References |
|---|---|---|
| 2-year ROI | 1 | 1 |
| 30%-40% | 1 | 1 |
| Accept longer period returns | 1 | 1 |
| Opportunity benefit rather than investment | 4 | 6 |
| Optimise to not waste money later | 3 | 4 |
| Reduce time-to-market | 1 | 1 |
| ROI not considered | 2 | 2 |
| Significant return on the investment | 2 | 3 |
| Usually short | 4 | 4 |
Table 12.
Next steps and needs.
| Next steps and needs | Sources | References |
|---|---|---|
| Change the company's mindset and reskill the team | 8 | 26 |
| Customer satisfaction | 2 | 2 |
| Focus on data | 4 | 8 |
| Improve predictive maintenance | 2 | 2 |
| Keep pace with progress | 1 | 1 |
| Marketplace, registry of best practice | 4 | 4 |
| Migration to cloud | 3 | 3 |
| More grants | 2 | 2 |
| Self-defining DT | 1 | 1 |
| System of systems, ecosystem, the federation of twins | 9 | 29 |
| Think big, start small | 7 | 8 |
| 1 | |
| 2 | |
| 3 | |
Disclaimer/Publisher’s Note: The statements, opinions and data contained in all publications are solely those of the individual author(s) and contributor(s) and not of MDPI and/or the editor(s). MDPI and/or the editor(s) disclaim responsibility for any injury to people or property resulting from any ideas, methods, instructions or products referred to in the content. |
© 2023 by the authors. Licensee MDPI, Basel, Switzerland. This article is an open access article distributed under the terms and conditions of the Creative Commons Attribution (CC BY) license (http://creativecommons.org/licenses/by/4.0/).
Copyright: This open access article is published under a Creative Commons CC BY 4.0 license, which permit the free download, distribution, and reuse, provided that the author and preprint are cited in any reuse.


