1. Introduction
Cardiovascular disease remains to be the leading cause of death worldwide [
1,
2,
3,
4,
5,
6,
7,
8]. Drug eluting stents have demonstrated exceptional benefits in reducing in-stent restenosis [
9,
10]. These stents are commonly used in coronary angioplasty procedures to both provide structural support and release drug molecules locally at the implanted arterial site for preventing adverse outcomes
(such as in-stent restenosis) in the patients. Although drug-eluting stents are now the main choice of treatment in coronary interventions
(PCIs), questions regarding their longevity and safety are still prominent [
11]. In the United States
(US), present drug-eluting stent designs incorporate sirolimus and paclitaxel and release these drugs into the arterial wall from the eluting struts [
12,
13,
14]. Both sirolimus and paclitaxel eluting stents appear to have comparable clinical benefits.
Initial drug eluting stent treatments were prone to washout by transmural plasma flow, which lowered the drug residence time in the arterial vessel wall. This was a major hindrance since these implants were designed to provide local drug delivery to the diseased site. Hydrophobic drugs such as sirolimus and paclitaxel were reported to have higher retention times as compared to other drugs because they can bind to structural elements and intracellular targets in the vessel wall [
15,
16]. Hydrophobic drugs such as these exist in both bound and unbound states in the vessel wall and these states are in equilibrium and the binding is reversible. Consequently, the diffusion of a hydrophobic drug into the arterial wall from a stent cannot be modelled without interaction of both the bound and free drug forms in the vessel wall.
Several experimental and numerical investigations have been carried out recently with the objective of assessing the capability of drug eluting stents to reduce in-stent restenosis after implantation. Lovich et al. [
17,
18,
19] investigated the diffusion of heparin in implanted arteries and established that the presence of binding sites changes along the transmural direction, being higher in the endothelium and lower in the adventitia. Lovich and Edelman studied the effects of specific binding sites inside the arterial wall on the drug uptake, [
20] where the presence of specific binding site action was modelled using the reversible chemical reaction. Sakharov et al. [
21] neglected the convective influence on the transport of free drug in the arterial wall. Hwang et al. [
22] estimated the free and bound drug concentrations via solving for the distribution of both drugs using a multiplicative factor
(partition approach) to predict the drug concentration. Migliavacca et al. [
23] studied the drug release pattern in vascular wall from drug-eluting stents using a single species approach along with a partition coefficient approach to relate the free and the bound drug concentrations. Borghi et al. [
24] opined that the inclusion of reversible binding leads to delayed release and that the erosion of polymer affects the drug release from a single strut. Horner et al. [
25] developed a two-species drug delivery model including reversible binding sites. They used their model to predict that a single species drug delivery model cannot accurately predict the distribution of bound drug. They also concluded that a two-species approach that includes reversible binding is the way forward for future stent-based drug delivery systems.
Subsequently, Tzafriri et al., [
26] developed a second-order dynamic model that incorporated a saturating reversible binding process by describing the bound drug as a dynamic variable to investigate the drug interaction with cells of the arterial wall. In the majority of the studies cited above, the transient drug release has been modelled as a uniform release, which is unrealistic and not representative of actual drug eluting stent-based delivery. Alternatively, a simple time-dependent Dirichlet boundary condition is applied on the surface of the struts [
27,
28,
29]. Arterial properties, such as porosity and tortuosity, dictate the transport of drugs within the arterial tissue.
Once an endovascular drug-eluting stent is implanted, it has a profound effect on the structure of the arterial wall, which eventually influences the overall rates of diffusion through tissues [
30]. For diffusion in a porous medium, the effective diffusion coefficient is assumed to depend on two factors: porosity
(a dimensionless parameter, which is the ratio of pore volume to the total material volume) and diffusion path tortuosity
(ratio of the actual pore length to the distance between its ends; i.e. arc-chord ratio) [
31]—these parameters change the free diffusivity of the drug eluted from a pair of struts [
32].
The goal of this work is to develop a two-dimensional two species scalar finite-volume computational model that can model the reversible binding characteristics of PLGA released into a coronary artery wall from a single drug eluting strut. The model described in this work is an improvement over our previous work and considers the integrated process of the drug release in the PLGA coating, the free, bound, and internalized drug diffusion profiles with varying polymer drug concentration
(low and high), vascular diffusivities, tortuosity, porosity, and Peclet and Dahmokoler numbers over the course of 400 hours
(16.67 days) [
33]. The mechanism of diffusion in the PLGA is adopted from the work of Zhu and Braatz [
34] and that couples the drug diffusion to degradation and erosion along with the drug pharmokinetics taking place in the arterial wall.
2. Methodolgy
2.1. Model Development
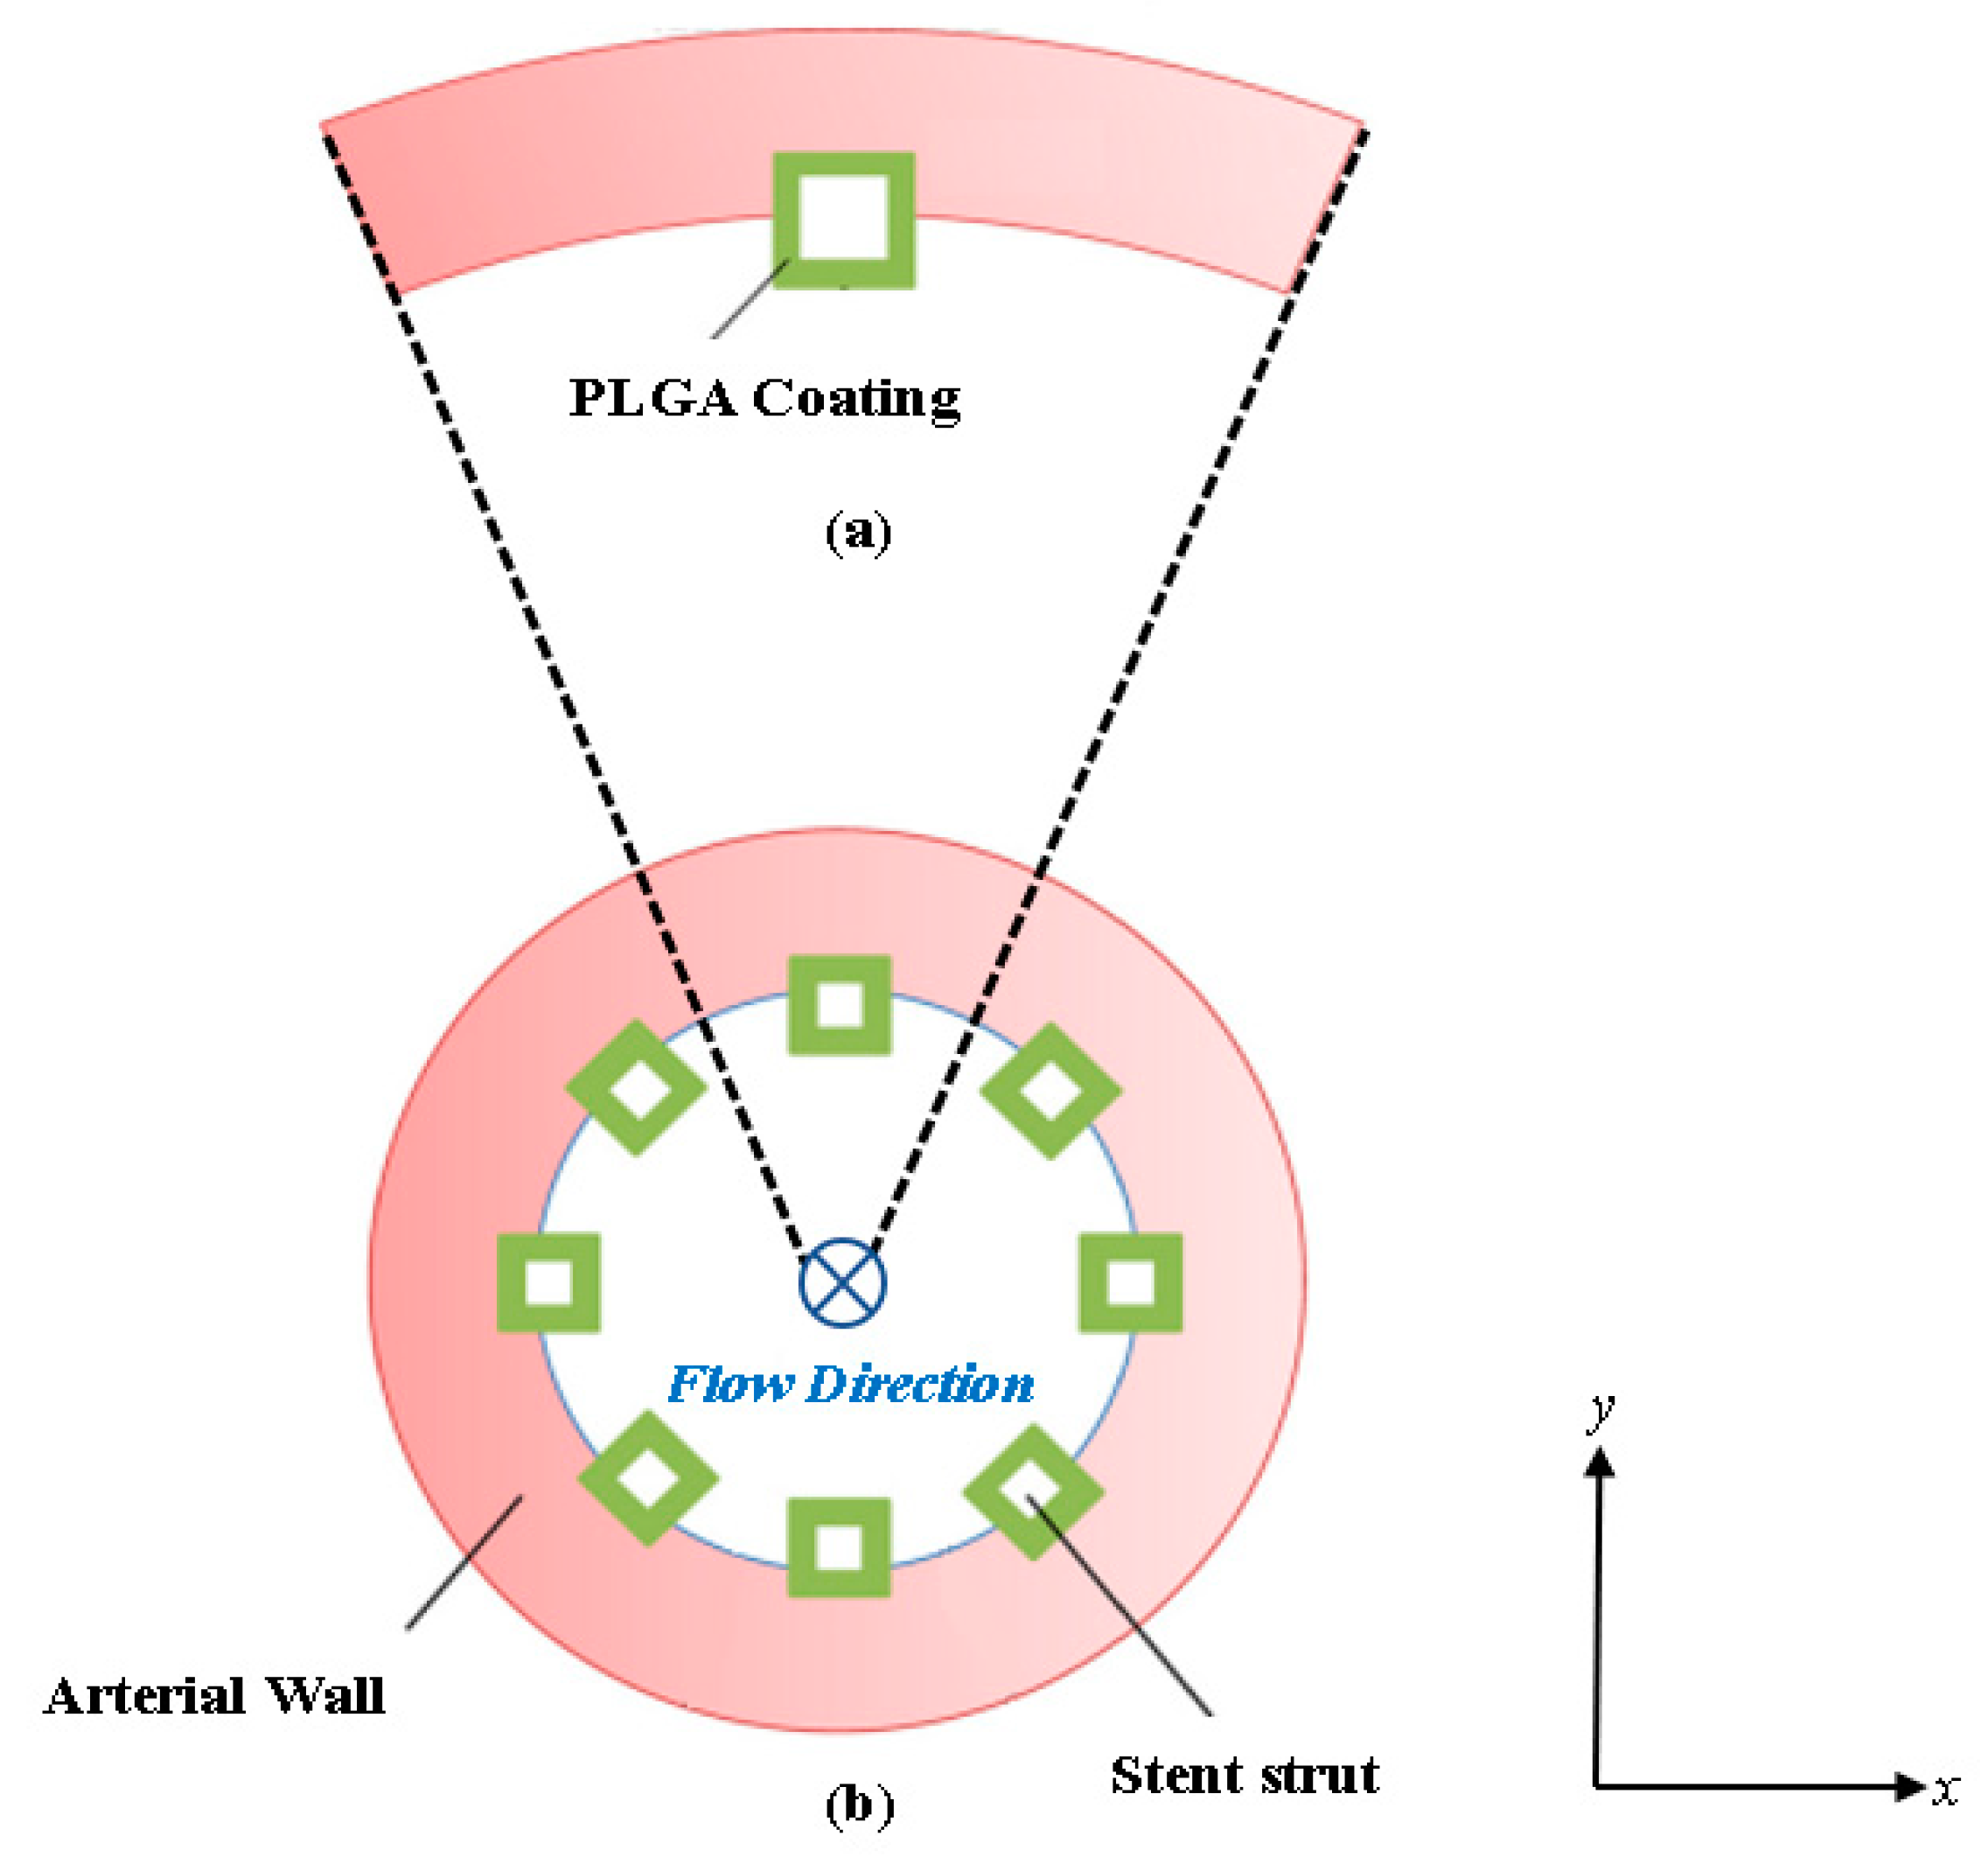
In this work, an implanted drug eluting coronary stent
(as shown in Figure 1a) is analyzed in the coronary artery where the stent struts are evenly placed and half-embedded in the cross section of the lumen
(as shown in Figure 1b). The strut arterial wall configuration is based on a previous study involving a bio-durable polymer coating carried out by the authors [
35] and is common for drug eluting stent diffusion analysis applications. The blood flow is moving in the direction of the paper plane as labeled in
Figure 1b. Standard square-shaped stent struts are considered in this work [
36,
37,
38]. Due to symmetry, a single stent strut with its surrounding arterial wall domain is extracted for the study to simplify the computational domain and reduce computational cost. The model was developed in ANSYS Spaceclaim
(2022) and deployed in ANSYS Meshing (2022) for meshing.
The extracted model domain is illustrated in
Figure 1a, where half of the stent strut is embedded into the arterial wall. Distinct from our previous study, here the curvature of the arterial wall is kept intact, and the computational domain consists of a cartesian coordinate system
(observed as x and y). The mathematical models for describing the drug delivery process are described in
Section 2.2 and
Section 2.3. The model for describing drug transport and pharmacokinetics in the arterial wall were developed based on a previous study for bio-durable coating [
35]. The next section described the boundary conditions for the developed domain model.
2.2. Boundary Conditions and Meshing
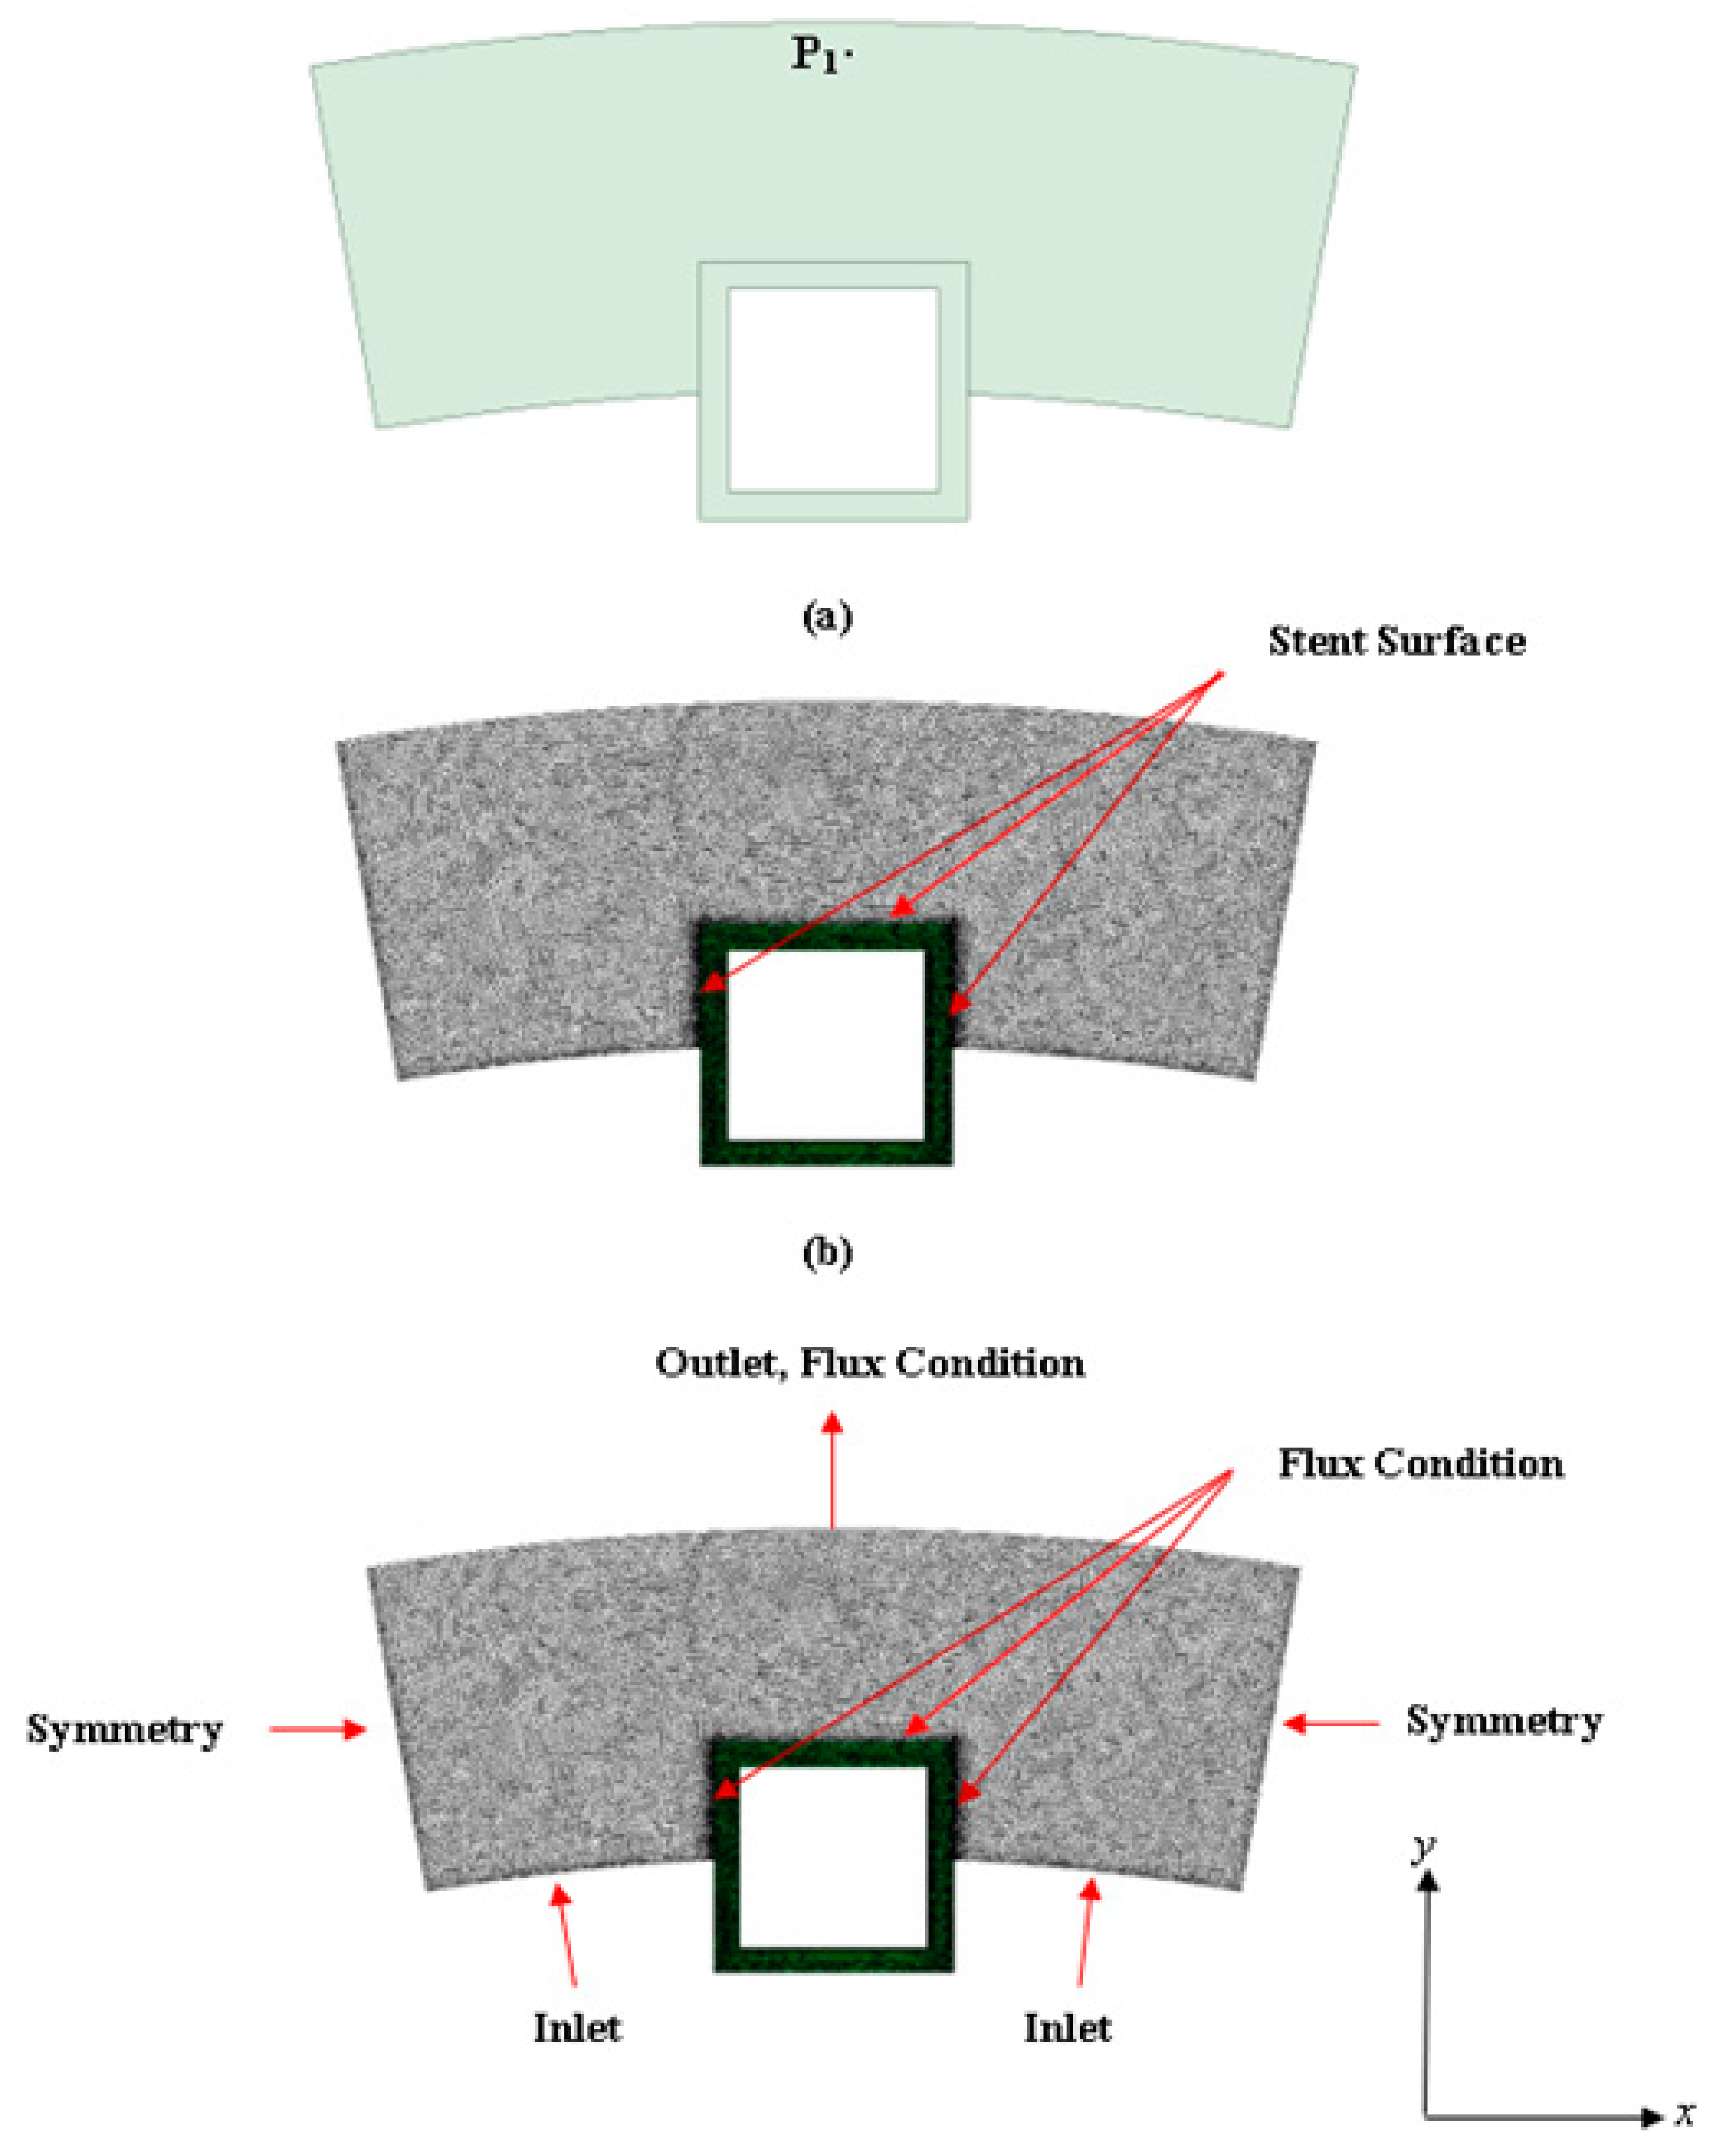
The names for each boundary zone are provided in
Figure 2. The
“inlet” boundary signifies the exposed inner surface of the artery where plasma flow enters the arterial domain. The
“stent surface” signifies the location where the stent is in contact with the vessel wall. At the PLGA coating and artery wall interface, the following flux condition is applied:
where
Rwp is the mass transfer resistance,
Cw, is the drug concentration on the arterial wall side of the interface, is the partition coefficient, and
Cp is the perivascular drug concentration. The right and left sides of the arterial zone domain are treated as symmetry boundary conditions as shown in
Figure 2.
ANSYS Meshing (2022) was used for meshing the computational domain. The meshing scheme used is a tetrahedral cell mesh type which is applied to all surfaces with the surface size meshed based on the edge spacing selection and an inflation scheme applied to rectify meshing irregularities. The next section describes the plasma flow modelling methodology.
2.3. Plasma Flow
In this work, ANSYS FLUENT
(2022 R1 (ver. 21.1)) computational fluid dynamic
(CFD) software was used to model both the fluid flow
(plasma flow) and the convection-diffusion of the free, bound, and internalized drug. For plasma flow in the arterial domain, a pressure drop filtration is implemented to simulate the steady flow of plasma through the domain. The arterial domain tissue is assumed to behave as a porous media. The Darcy Law model was used to solve for the plasma flow field. FLUENT allows implementation of the Darcy Law equation as a source term in the Navier–Stokes equations as shown below in Eqn. 1:
where
v is the velocity vector,
P is the pressure,
K is the permeability of the vessel wall, and
ρ is the density and
µ is the dynamic viscosity of plasma. The density of plasma is modelled as 1020 kg/m
3 and the dynamic viscosity as 0.0035 Pa∙s [
2,
3,
4,
5,
6,
7] at normal body temperature
(37 oC). Whale et al. [
39] investigated the effects of aging and pressure on the Darcy permeabilities of human aortic walls. In this work, a representative value of 2.0x10
-18 m
2 was implemented for this work. Equation (2) is evaluated with the incompressibility constraint. As mentioned previously, the vessel lumen is not modelled in the computational domain. This introduces an additional assumption because luminal flow decreases axial non-uniformity of the drug in the artery wall [
36,
40]. The degree of non-uniformity was observed to increase with increasing the aspect ratio of the stent strut [
40]. The impact of this assumption is minimized in the case of square struts and/or stents with an abluminal coating. The next sections discuss the drug transport modelling methodology.
2.4. Drug Transport in the PLGA Coating and Arterial Domains
When the drug is released into the arterial wall, the drug molecules are exposed and interact with the physiological environment. Various drug-tissue interactions occur that affect the arterial wall drug transport, distribution, and drug uptake. The drug-arterial wall interaction has been frequently modelled as a reversible binding reaction of the drug molecules with binding sites present in the arterial wall. During this process, the bound drug Cb is formed by connecting the free drug Cf with the available binding sites S0. In this case, the bound drug is immobilized, while the free drug is allowed to diffuse. The reversible binding process, however, does not provide a mechanism for drug consumption (e.g., drug uptake by tissue cells), which can be characterized by drug internalization. This work did not take into consideration the internalization of the drug.
where
x and
y are coordinates inthe horizontal and vertical directions,
ka and
kd are the rates of association and dissociation constants.
S0 is the net tissue binding capacity in the arterial wall.
DT is the is the true diffusivity of the free drug diffusing into the arterial wall and is expressed as:
where,
ε and
τ are the porosity and the tortuosity of the arterial wall material.
Dfree and
Deff (Eqns. 9 and 10) are the coefficients of free and effective diffusivity.
Rd=(kd/ka) is the equilibrium dissociation constant.
As mentioned in section 2.2, symmetry boundary conditions for both the free and bound drug are modelled at the proximal and distal walls of the computational domain. An impermeable boundary condition for the bound drug is also enforced at the perivascular wall, lumen-tissue and strut-tissue interfaces
(Eqn. 7). For the free drug, a perfect sink condition is modelled at the perivascular end
(Eqn. 8). In this work, we considered two situations, either that flowing blood is extremely efficient at washing out mural-adhered drug, modelled as a zero-concentration interface condition [
41], or that mural-adhered drug is insensitive to flowing blood, modelled as zero-flux boundary condition
(Eqn. 6). As a substitute to modelling the uniform release of free drug from the single strut, a simple time-dependent release kinetics with a flux condition
(Eqn. 9) is assumed at the strut eluting surface.
For the diffusivity of the drug, the contribution of the true diffusion term was minimized by setting
Db=1.0x10
-7Du. A 1.0x10
-7 pre-factor was adopted from the study of Horner et al. [
25] and was used to decrease the true drug diffusivity until the bound drug distribution became independent of the diffusivity results. A cartesian coordinate system was used to specify the components of the diffusion tensor
D in the x and y directions, corresponding to
Dxx and
Dyy respectively. Both
Du and
Db have two independent components:
PLGA tends to concentrate within elastic sheathes within the arterial wall. Hwang and Edelman [
22] has proven this experimentally. In our study, we assume that
Dyy is larger than
Dxx.
2.5. User Defined Scalar and Numerical Modelling
In this work, we implemented the user defined scalar (UDS) model available in ANSYS FLUENT for solving Eqns. 5-7. Fluent UDS model allows a user to define up to fifty UDS transport equations in a single computational model. The general (UDS) transport equation is shown below in Eqn. 12 with the four terms (transient, flux, diffusivity, and source terms) that can be customized. The UDS model allows the user to set boundary conditions for the variables within cells of a fluid or solid zone for a particular scalar equation. This is done by fixing the value of ϕk. When ϕk is fixed in each cell, the UDS scalar transport is not solved, and the cell is not included when the residual sum is computed. For the present work, the value of the initial drug concentration, C0 was fixed, and the coating diffusivity was allowed to vary as a function of ϕ, time, and molecular weight as shown previously in Eqn. was also allowed to vary with time. For the bound drug transport equation, the mass transport was deselected which allowed the convection term to be neglected, thus making the bound drug immobile. The same was done for the internalized drug transport equation. The source terms Sϕk include the reversible binding reactions in Eqns. 6 and 7.
For all drug transport and plasma flow simulations, the drug concentration was assumed to be low enough such that it does not affect the plasma velocity field. Hence, the velocity and scalar transport equations were decoupled and solved in sequence. The velocity field in the tissue was solved using a steady-state formulation. FLUENT’s pressure-based segregated solver was used with the pressure-implicit with splitting of operators (PISO) scheme to couple pressure and velocity degrees of freedom. The standard pressure interpolation scheme was used along with the second order up-winding for discretizing the velocity degrees of freedom. The default under-relaxation factor (URF) for pressure was increased to 0.5 and the URF for momentum was lowered to 0.4.
The convergence criterion for the steady fluid flow problem was 10-6 for the momentum equations. The drug transport problem was solved using a transient solver, with the velocity field fixed for all time steps. A first-order implicit time integrator was used along with the QUICK up-winding scheme for spatial discretization of the scalar transport equations. Smooth convergence was observed when using the default URFs of 1.0 for both transport equations. The convergence criterion for concentration at each time. All plasma flow and drug concentration simulations were conducted with a time step of 1 picosecond and resulted in a simulation run time of at least 15 days. All simulations were conducted on an ASUS desktop computer with 12 cores and a NVIDIA GeForce GTX 1660 TI graphics card. All simulations were conducted in parallel with 11 CPU cores and the NVIDIA graphics card.
2.6. Non-Dimensional Pre-Analyses
Similar to our previous work, we began with performing a dimensionless characteristic scaling analysis to gain insight of the dominant mechanisms of transport throughout the arterial wall. The dimensionless scaling parameters for scaling Eqns. 2 and 3 are shown below:

Using these characteristic dimensionless terms, the drug transport equations take the following form:
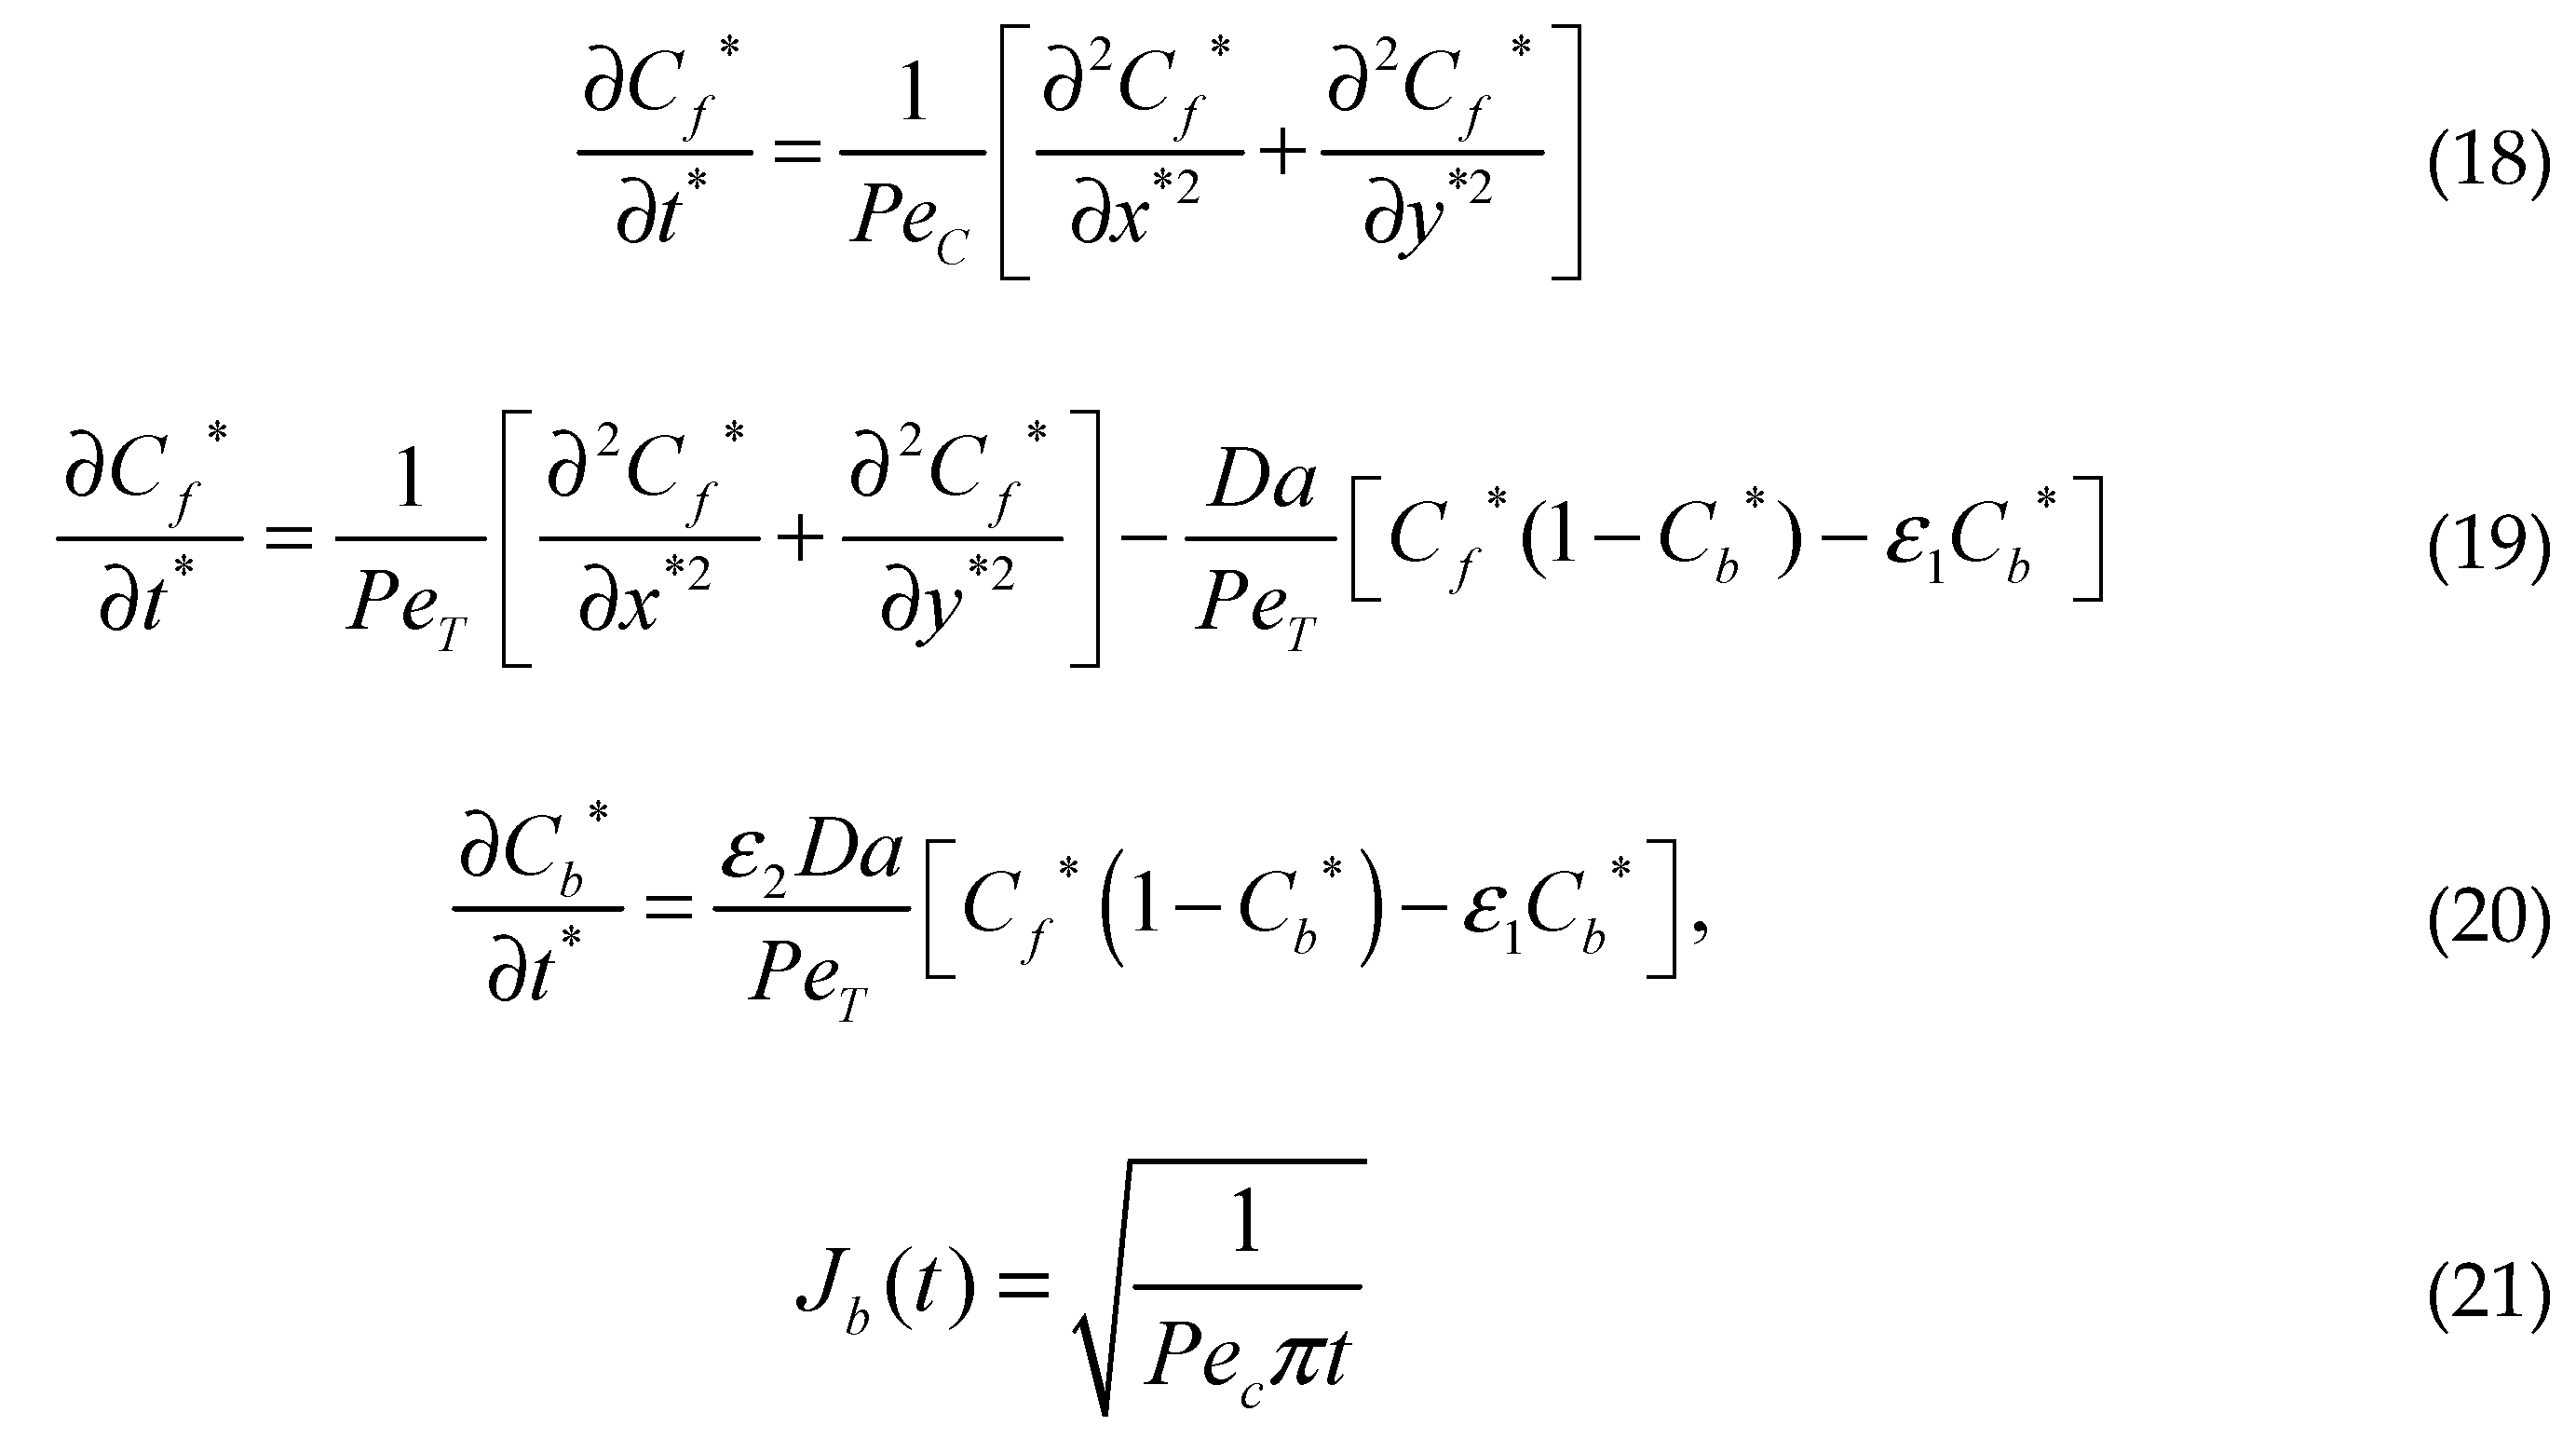
where
Vy is the transmural filtration velocity,
PeT=[Vyδ/(DT)] and
Da=[(k
aS
0δ
2)/(
DT)] are the Peclet and DamKöhler numbers in the tissue. Here,
ε1=(Rd/C0), ε2=(C0/S0), and
ε3=(Rd/S0) are three scaling parameters.
Pec=[Vy(h2/δ)]/Dc is the Peclet number in the coating of the strut and
h is the thickness of the coating of the strut.
In these dimensionless equations, three characteristic time scales appear,
τ1,
τ2, and
τ3, analogous to diffusion coating, transmural diffusion, and the binding reaction. The characteristic times scales are shown below:
The assessment of the scale of these three dimensionless terms gives τ1, 103 – 105s, τ2, 103 – 105 s and τ3 102 s, which implies that reversible binding is very fast compared to diffusion. The significance of diffusion and reversible binding in the wall is also implied by their relative dimensionless numbers, the DamKohler and Peclet numbers, respectively. Compared with the coefficient of transmural diffusion component (evaluated as one), the reaction components have very large DamKöhler numbers on the order of 102 – 104, which also implies that the binding reactions play a very strong role in the spatiotemporal dynamics.
2.7. Modelling Parameters and Grid Independence
The physiological and pharmokinetic parameters modeled in Eqns. 1-20 are listed in
Table 1. These values were obtained from other relevant works. A grid independence analysis was conducted on the developed computational domain for determining the suitable mesh size for model simulations.
The grid independence analysis was performed with constant drug diffusivities in the PLGA coating and in the arterial wall. The relative error was calculated for the drug release profile. The reference mesh uses sizes of 0.1 µm for the coating and 1 µm for the arterial wall and contained 1x10⁶ cells. During the analysis, the relative errors were similar and remained under 5% error for different mesh size of the arterial wall domain, while the mesh size of the coating remained the same at 1 µm. For this work, we chose a mesh size of 5 µm for the arterial wall domain and a mesh size of 0.5 µm selected for the coating, using tetrahedral cells and an inflation meshing scheme. Although not shown, the final mesh yielded a relative error of less than 5% and contained 372,125 cells. The next section presents the results obtained from the simulations.
3. Results
This section of the paper presents the results of the interstitial plasma flow profile into the arterial wall, the initial diffusion flow modelling results using an eroding polymer coating (free and bound drug concentration profile with interstitial flow), and the parametric study results of varying polymer drug concentration (low and high), tortuosity, porosity, and PeT and Da numbers over the course of 400 hours (16.67 days). The next section discusses the initial diffusion flow modelling results.
3.1. Interstitial Flow into the Arterial Wall
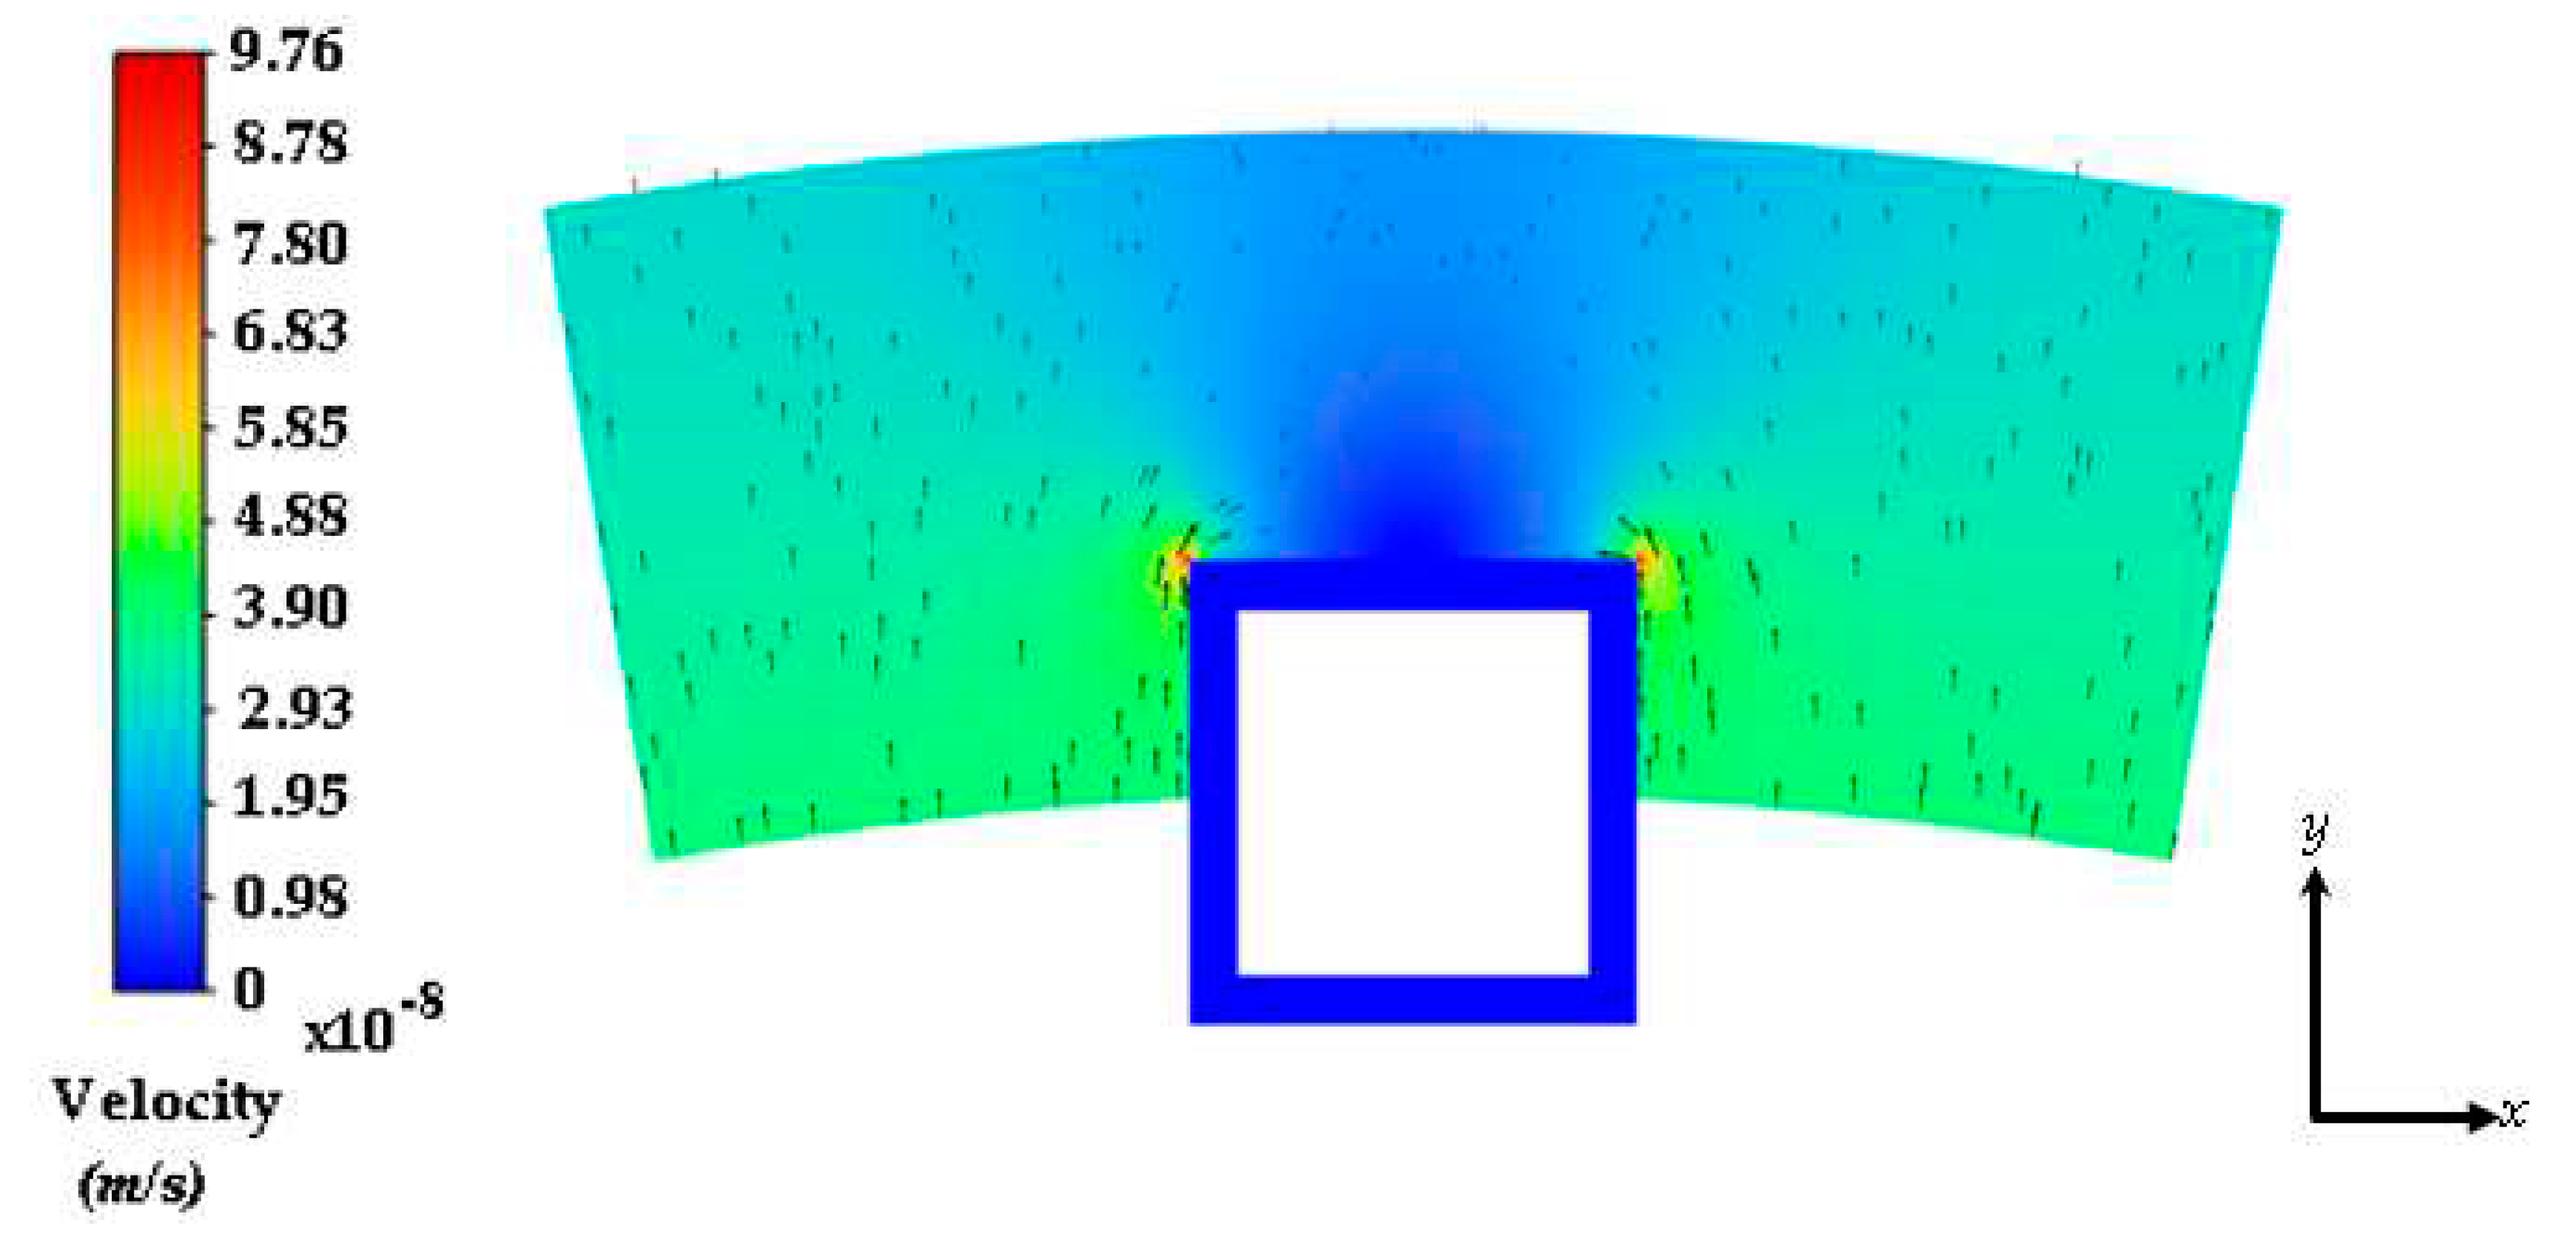
The steady flow of plasma through the cross-section of the coronary arterial vessel wall is shown in
Figure 3. The stent strut obstructs the plasma flow due to the no slip boundary condition being applied at the boundaries of the polymer coating. There are two small regions of high velocity due to the energy loss incurred by the sharp regions on the top edges of the strut. The flow magnitude dampens out away from the top and middle region of the strut. There were three drug concentration analyses that were conducted in this work: (1) a plasma flow and drug concentration analysis conducted without the no-slip condition applied at the polymer and arterial wall interface
(polymer erosion analysis), (2) a plasma flow and drug concentration analysis conducted with the no-slip condition, and (3) a drug concentration analysis conducted without plasma flow.
The next section discusses the free and bound drug concentration with erosion and interstitial flow results.
3.2. Free and Bound Drug Concentration Profiles with Erosion and Interstitial Flow
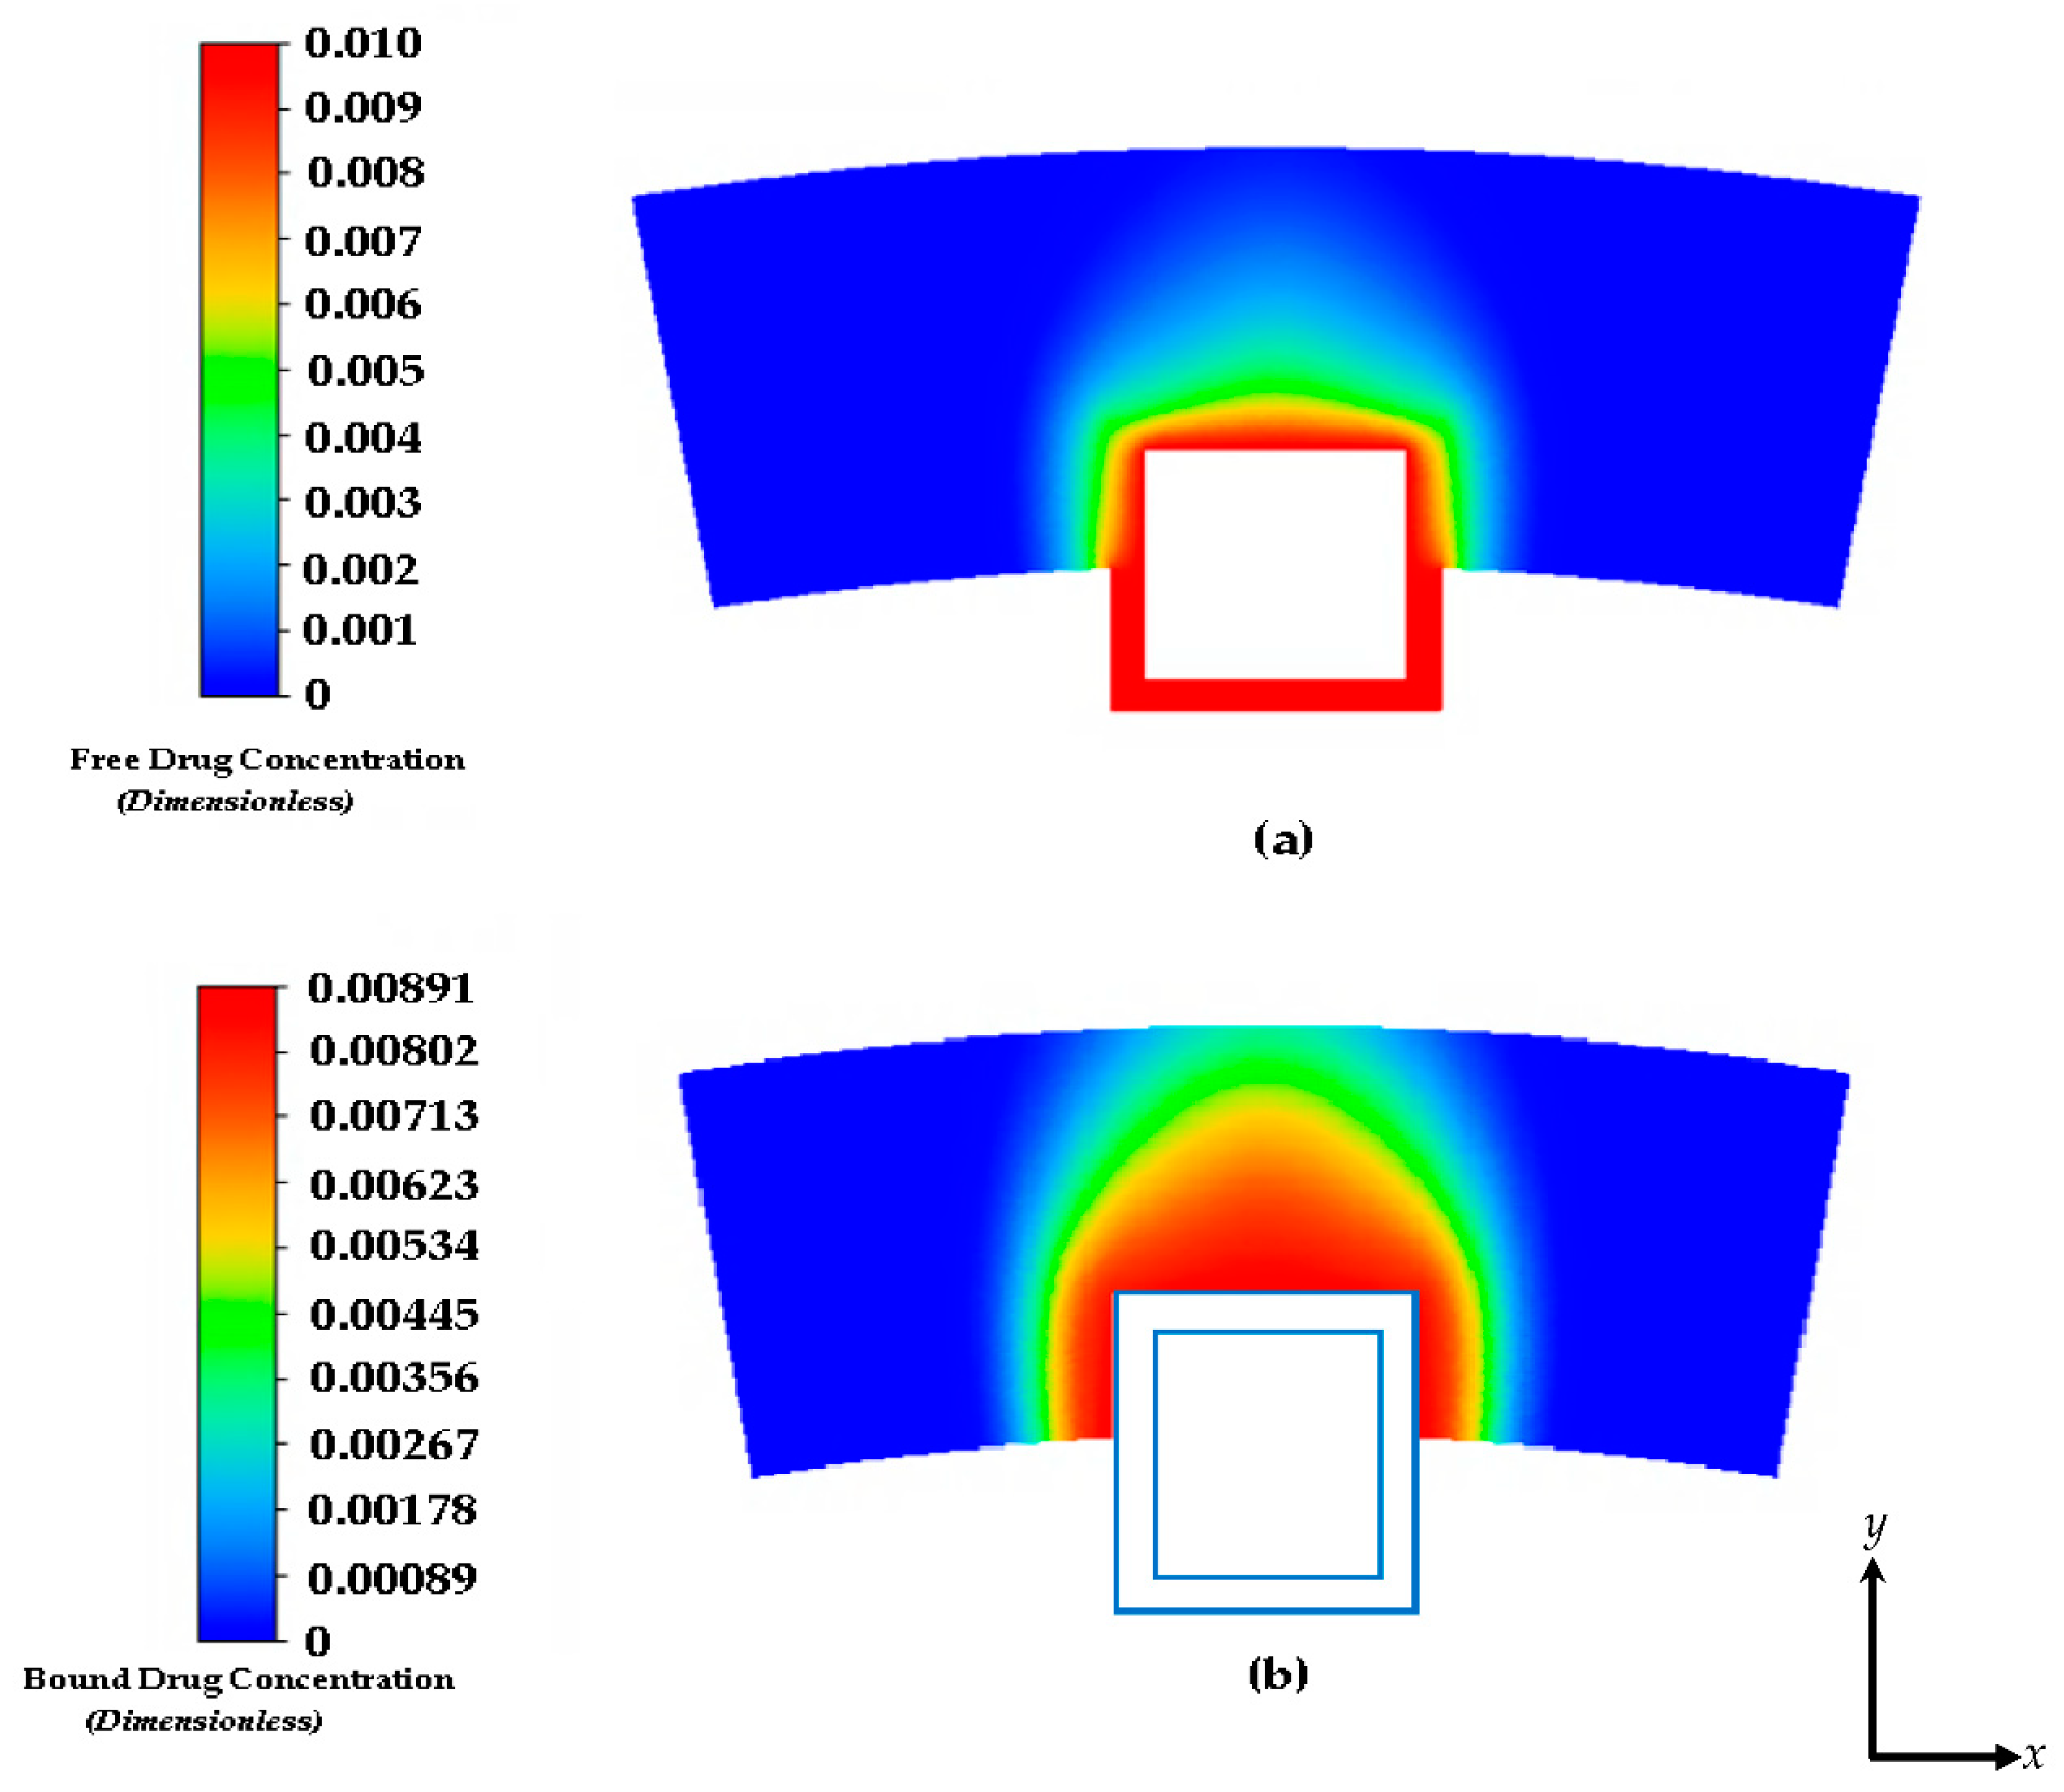
Figure 4a and 4b show the free and bound drug concentration profiles with erosion and interstitial plasma flow. The interstitial flow within the arterial wall is induced by the pressure difference between the lumen and the perivascular space and is typically very small
(in the range of 0.01–0.1 µm/s [
43]
) in reference to the centerline pulsatile flow, and the convective transport term for the arterial wall is often left out in the drug transport models of drug-eluting stents [
44,
45]. In this scenario, the no slip condition is not applied at the boundaries of the stent and the plasma flow is allowed to flow through the polymer which is modelled as a porous medium. In this case, the average free and bound drug concentrations in the arterial wall are significantly impacted by the presence of convection and causes the polymer region to erode as shown in both
Figure 4a and
Figure 4b. The peaking of the average drug concentrations also suggests an early expected resident time as the transient time of the bound drug is within 2 days. This is again due to the high convection due to plasma flow and the eroding effect of the polymer.
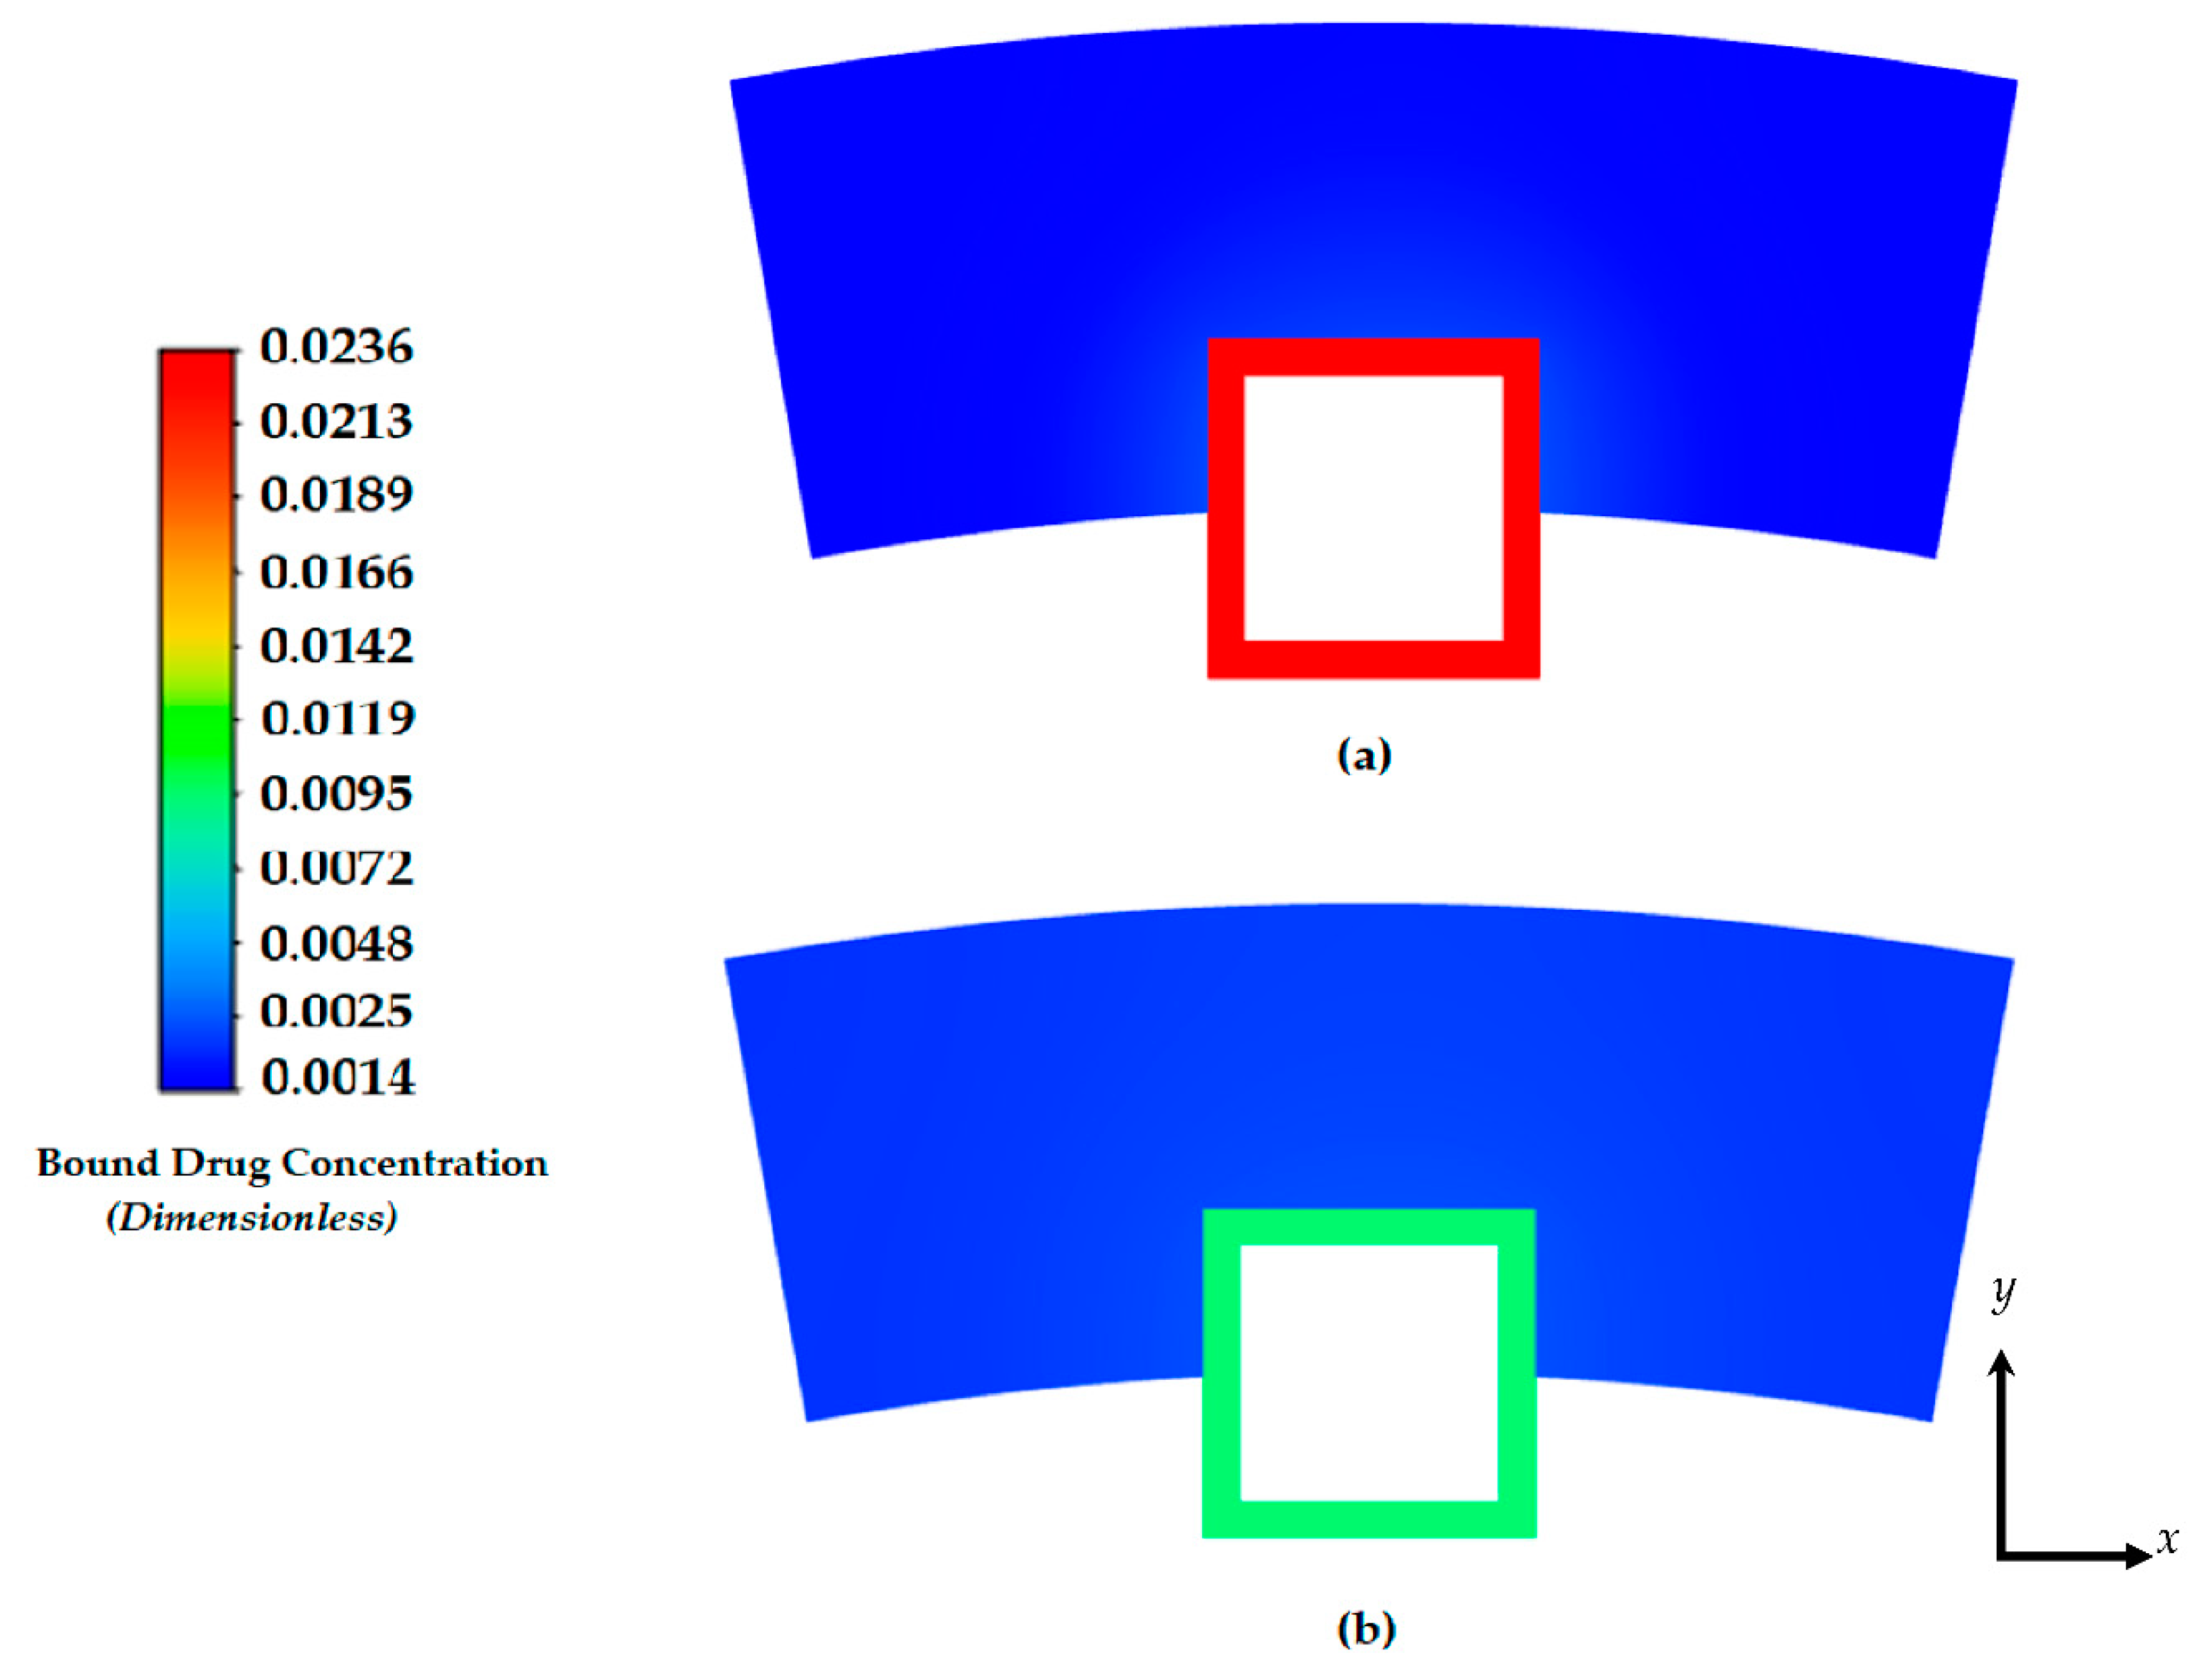
Figure 5 shows the free and bound drug concentration contours at 8 days. Similar to the results shown in
Figure 4a and 4b at 2 hours, the high convection due to plasma flow and the eroding effect of the polymer has a significant effect on the transit time and diffusion profile. It also appears that when modelling the polymer boundary as porous media without the no slip condition, washing out of the polymer tends to lower the concentration magnitudes. It is evident that the presence of interstitial flow increases the transport in the transmural direction and leads to faster drug clearance at the perivascular interface using this modelling method. In the effort to compare other works, we continued this study by applying the no slip condition at the boundaries of the polymer and arterial wall interface and not incorporating interstitial flow with plasma flow through the inlet. Convection is modelled with the tissue Peclet number.
3.3. Free and Bound Drug Concentration Profiles with Erosion and Convection
As mentioned previously, the results shown in this section are results from the simulation with applying the no slip condition at the boundaries of the polymer and the arterial wall interface and neglecting the interstitial flow with plasma flow through the inlet. Convection in this case is modelled with the tissue Peclet number.
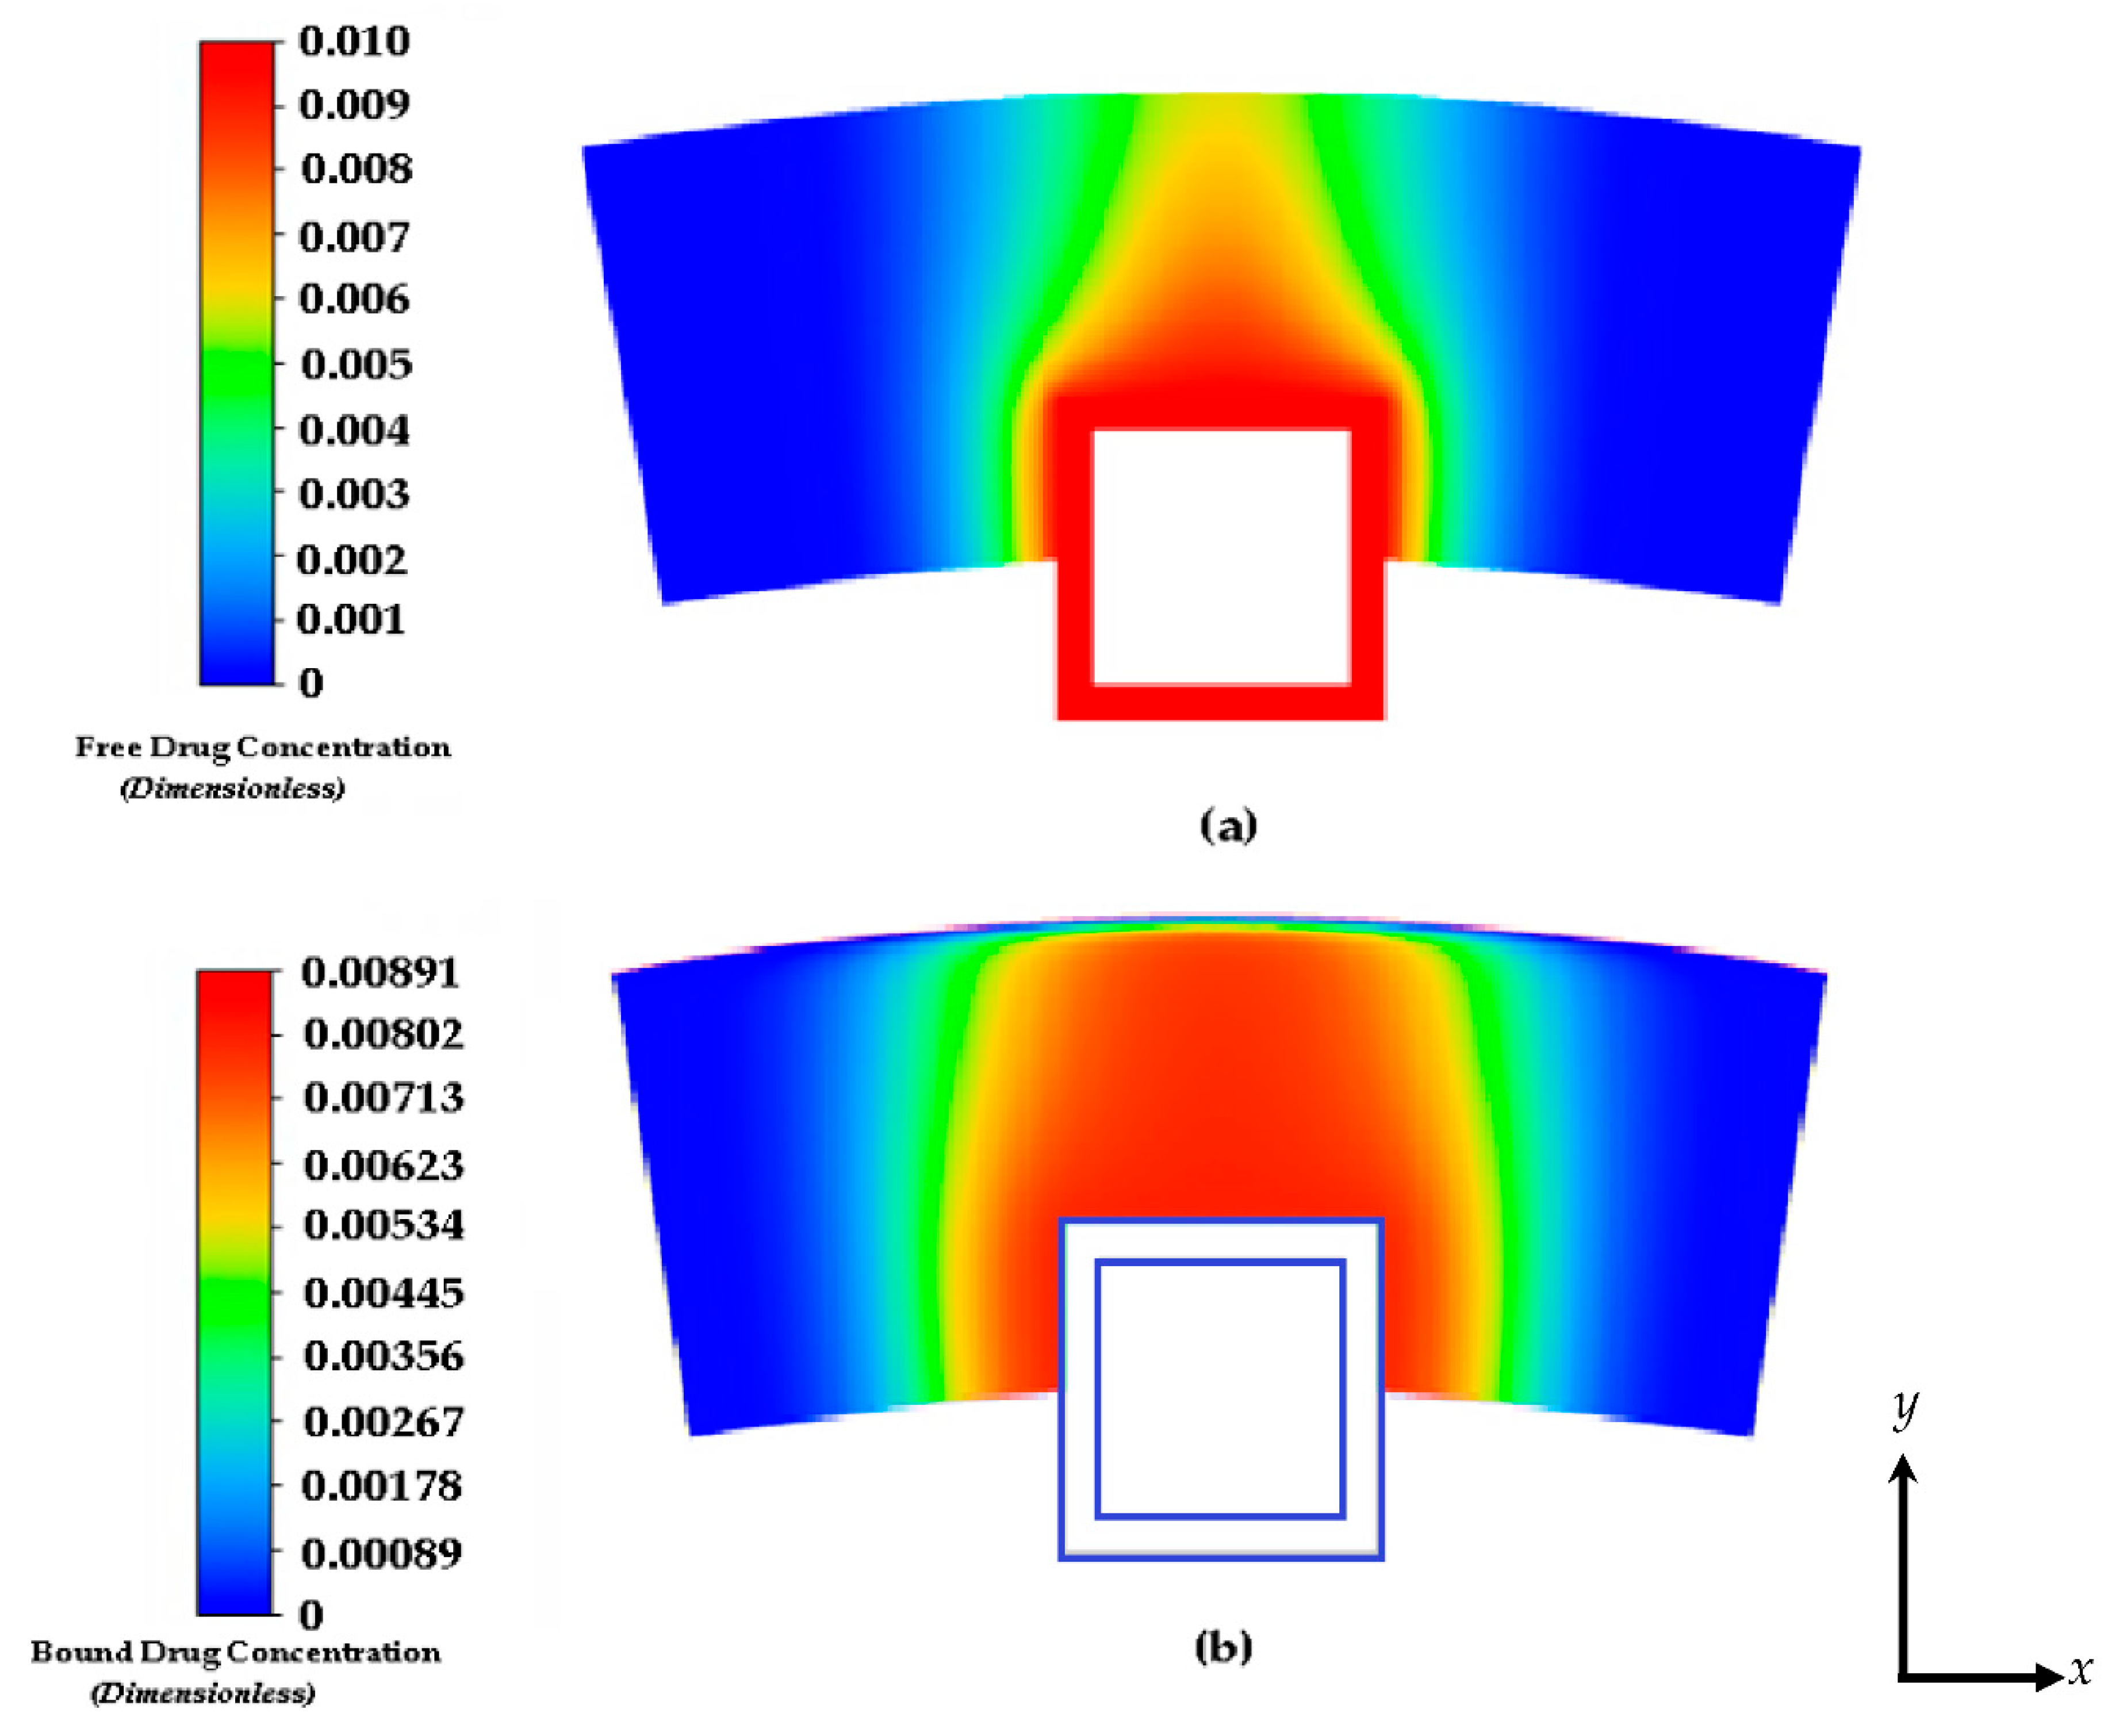
Figure 6a and 6b show the free drug diffusion contours in the arterial wall with convection modelled with the tissue Peclet number. The drug release contour profiles have similar release rates in the first 4 to 8 days when the PLGA diffusion, degradation, and erosion are insignificant. In
Figure 6b, a lower concentration of the free drug in the polymer coating is observed in case of time-dependent release of drug from the coating. This is due to the time-dependent boundary condition of Eqn. 21. The effect of release kinetics on the spatial distribution of the free drug can be visualized clearly in
Figure 7. In this case, the heterogeneous distribution and retention of the drug are found to be observed throughout the domain.
The characteristics of the release profiles in the intravascular delivery reported here are in good correspondence to what was reported for in vitro release in previous reported works [
46]. In the simulation comparison, significant drug release is achieved in the PLGA coating at around day 17. The arterial bound drug distributions are shown in
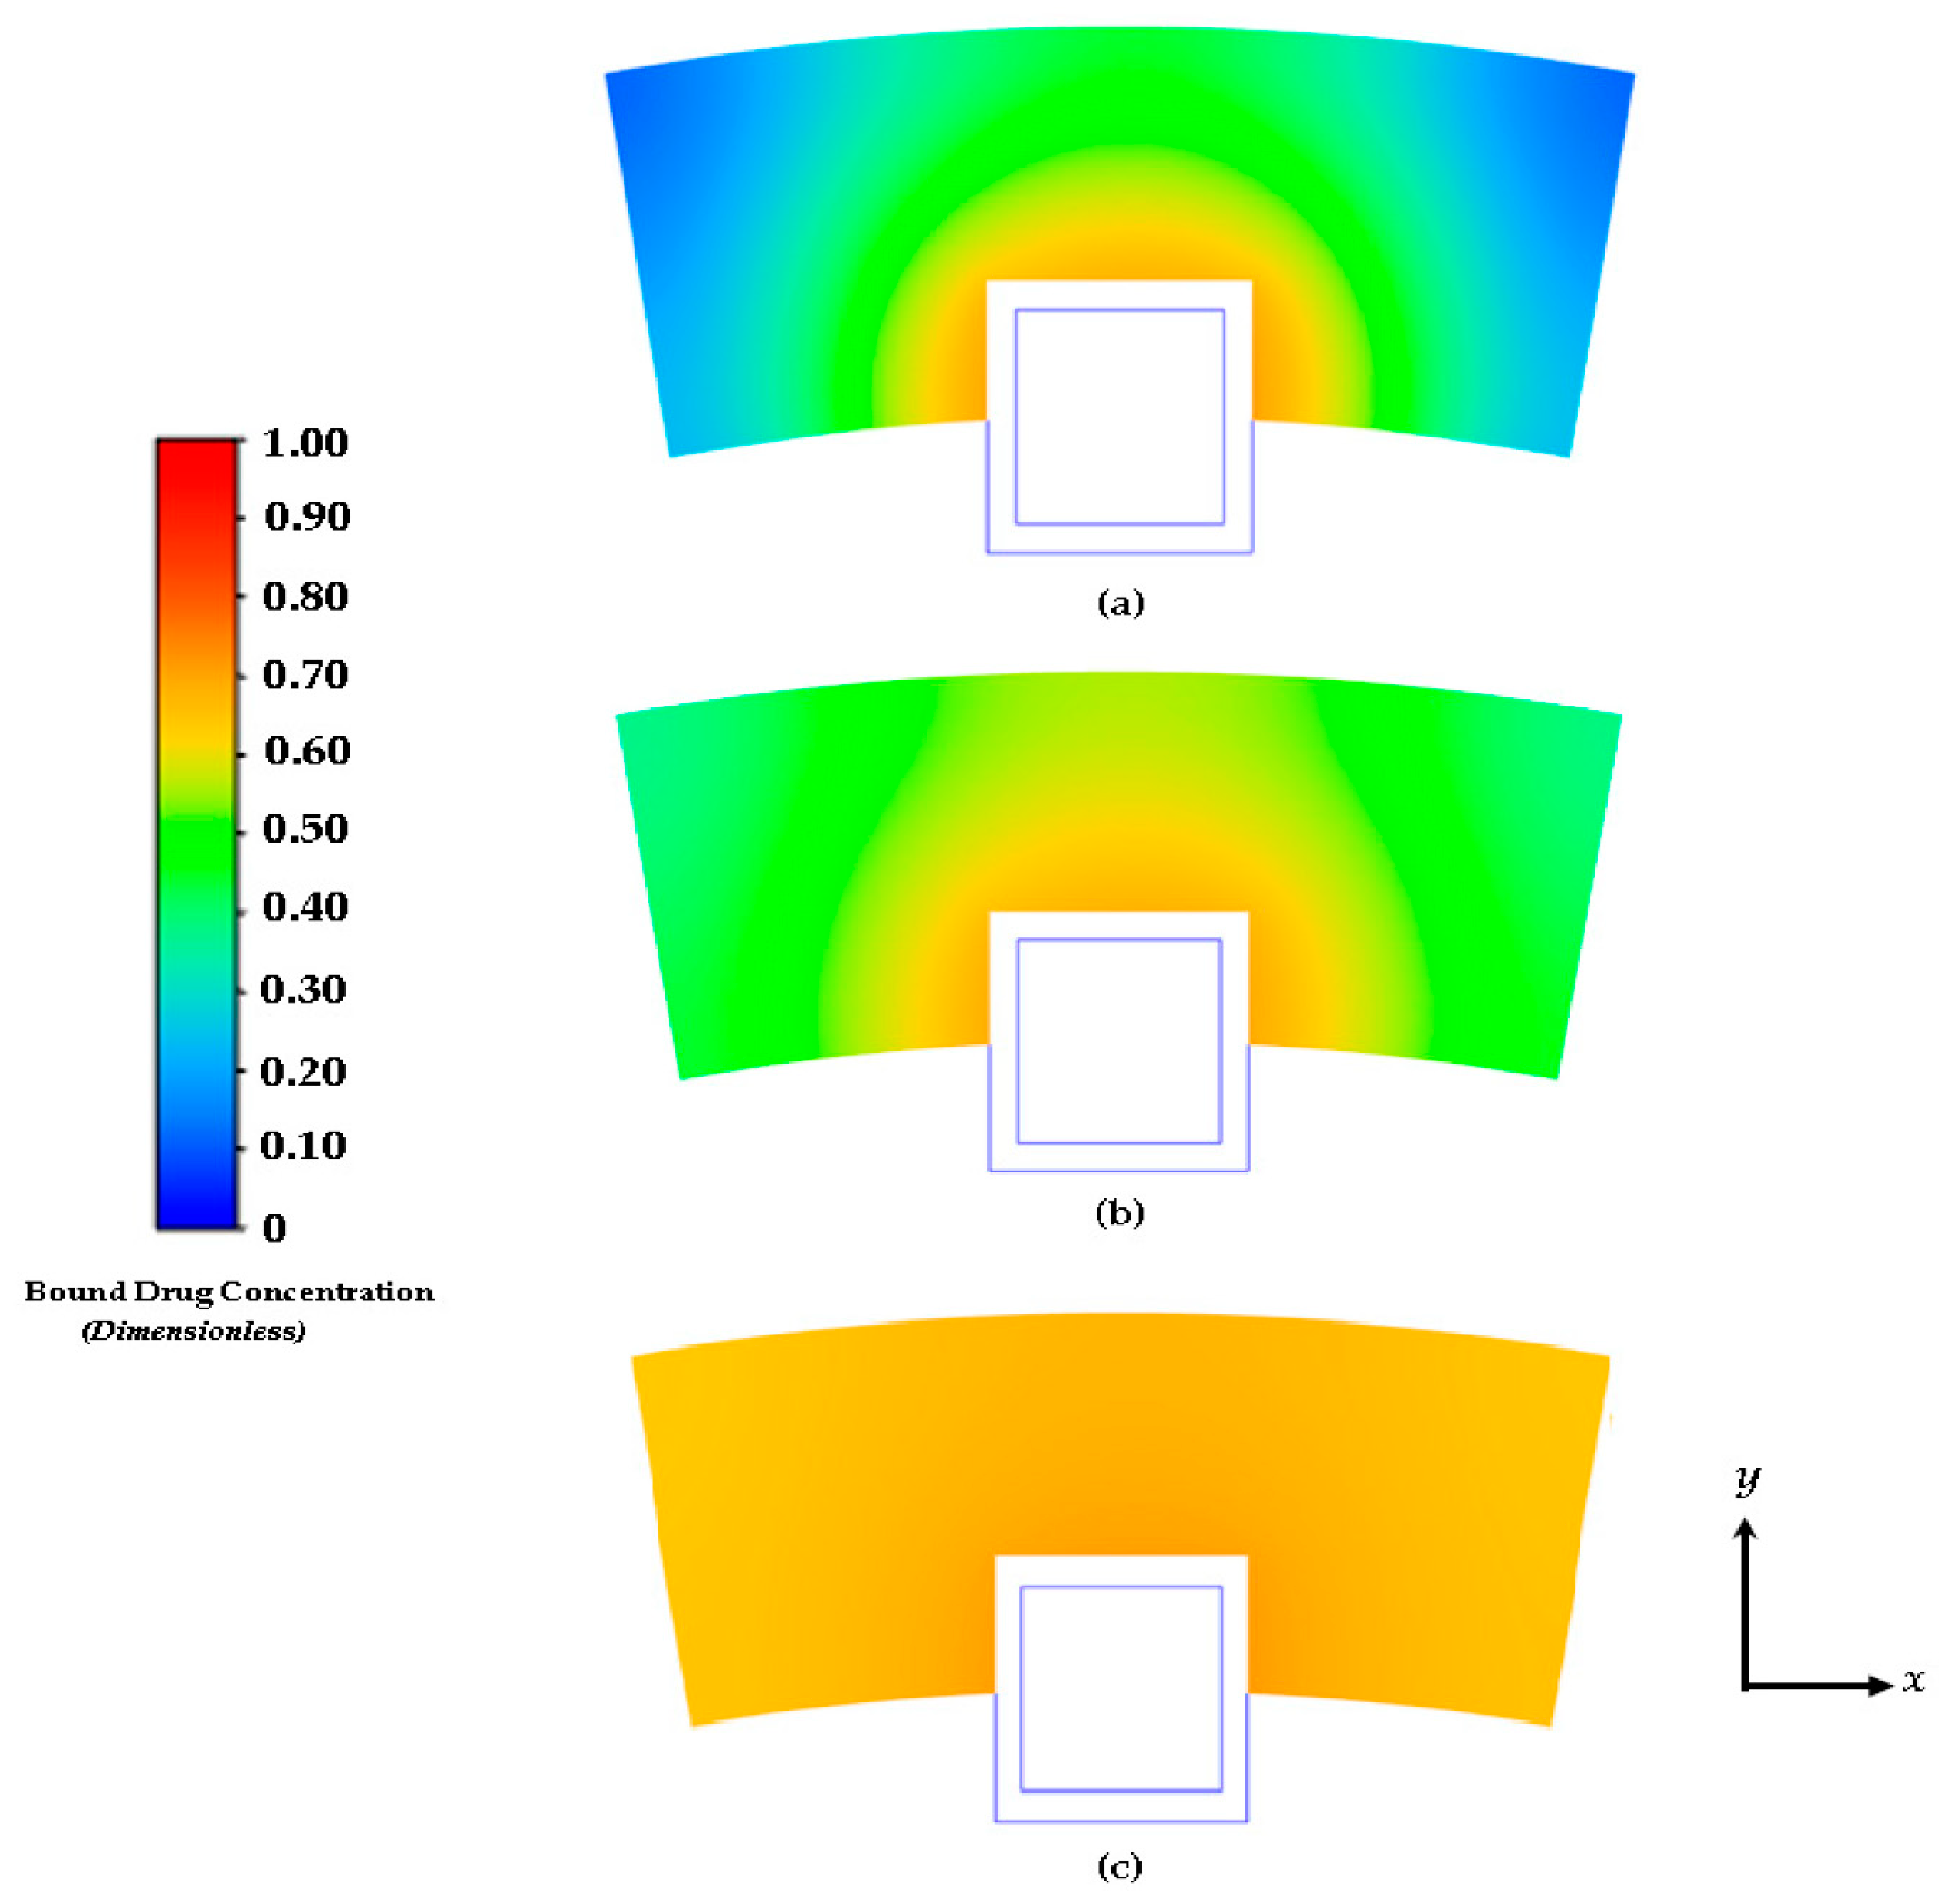
Figure 7 for the PLGA coating on day 17, shortly after the drug levels have peaked in the arterial wall. The bound drug distribution is close to uniform in the circumferential direction, whereas in the transmural direction a gradient is clearly observed closer to the perivascular interface. Improved uniformity in the circumferential direction is expected with the anisotropic drug diffusivity which results in fast drug diffusion in the circumferential direction. This is an improvement over the results shown previously in
Figure 4 and
Figure 5. In
Figure 6, the observed arterial drug distribution pattern for the PLGA coating case is similar to previous studies of a bio-durable coating [
34].
Although the free and bound drug concentration cases are shown here, the internalized drug is neglected. Although not modeled in this work, the drug internalization describes the cellular uptake of drug molecules after they associate with the binding sites. This is an important mechanism for drug metabolism in the physiological environment [
47,
48]. Only limited studies have considered the impact of the internalization process on the stent-based drug delivery [
49]. While the drug internalization rate may vary for the different drugs, and such data are lacking in the literature, the model discussed in this paper only considers the free and bound drug case. Future work will involve examining the internalized drug.
Figure 7.
Contours of drug diffusion into the arterial wall at: (a) 4 days, (b) 8 days, and (c) 16.67 days.
Figure 7.
Contours of drug diffusion into the arterial wall at: (a) 4 days, (b) 8 days, and (c) 16.67 days.
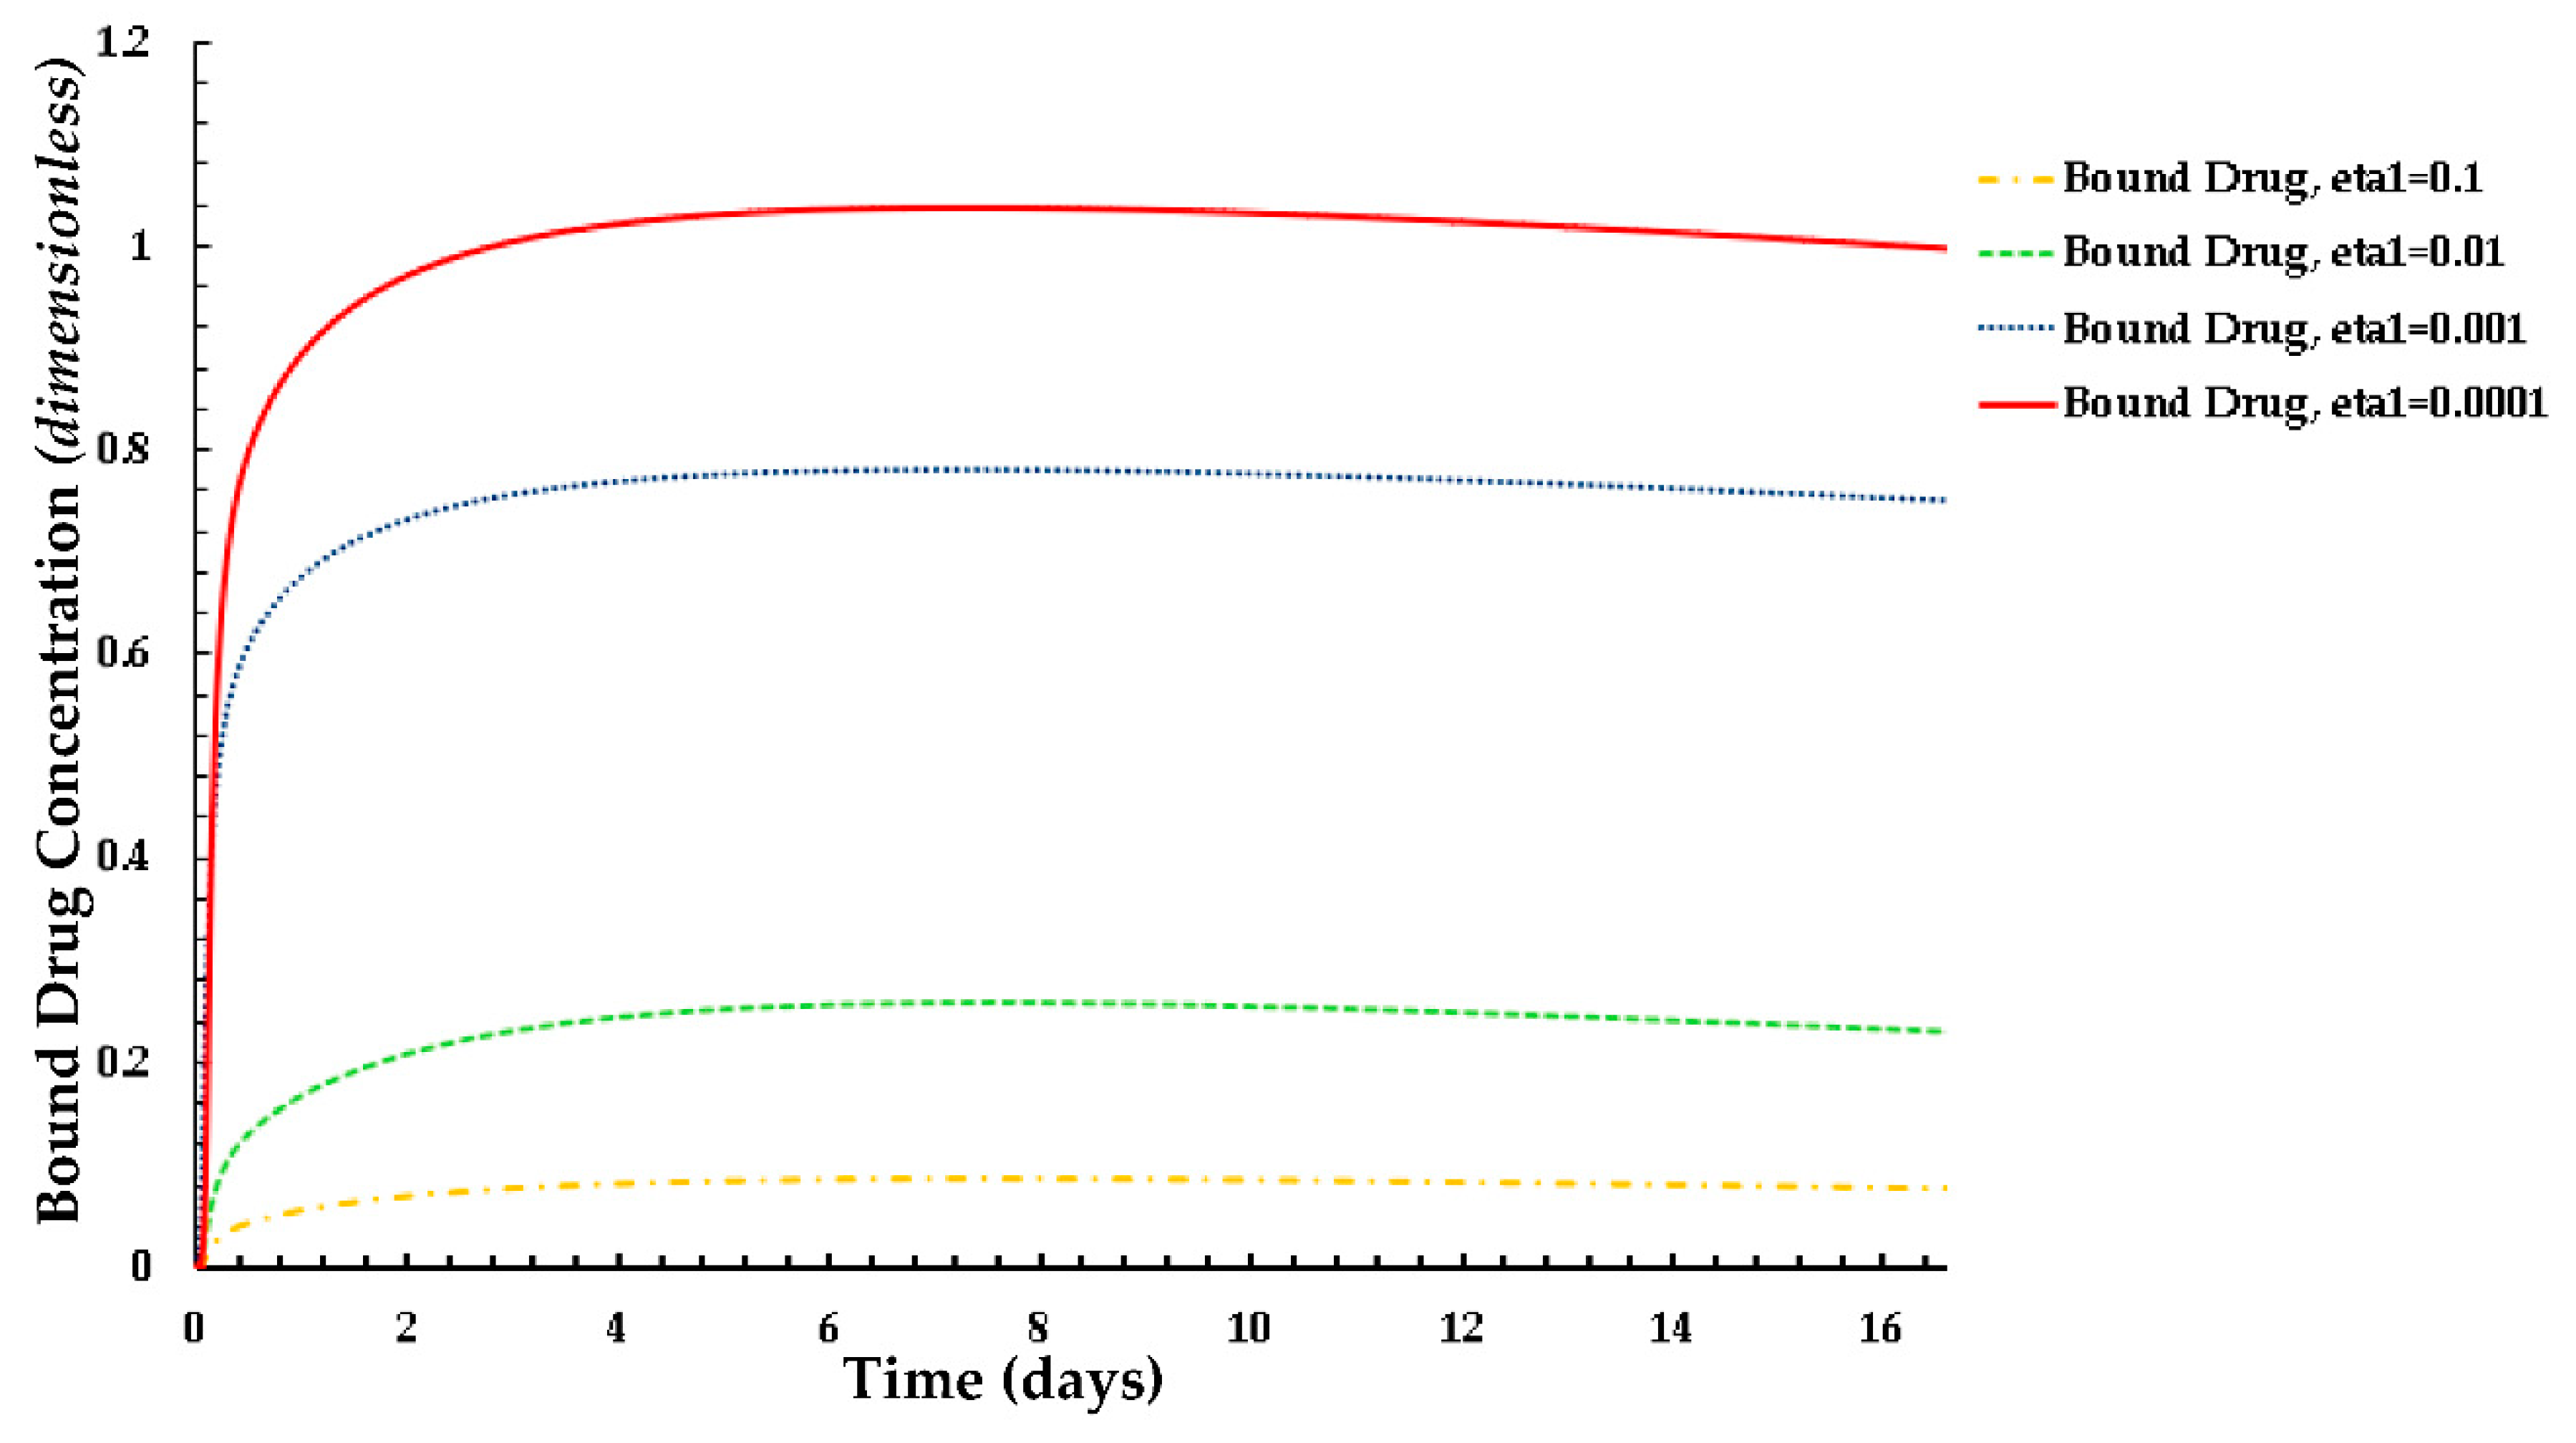
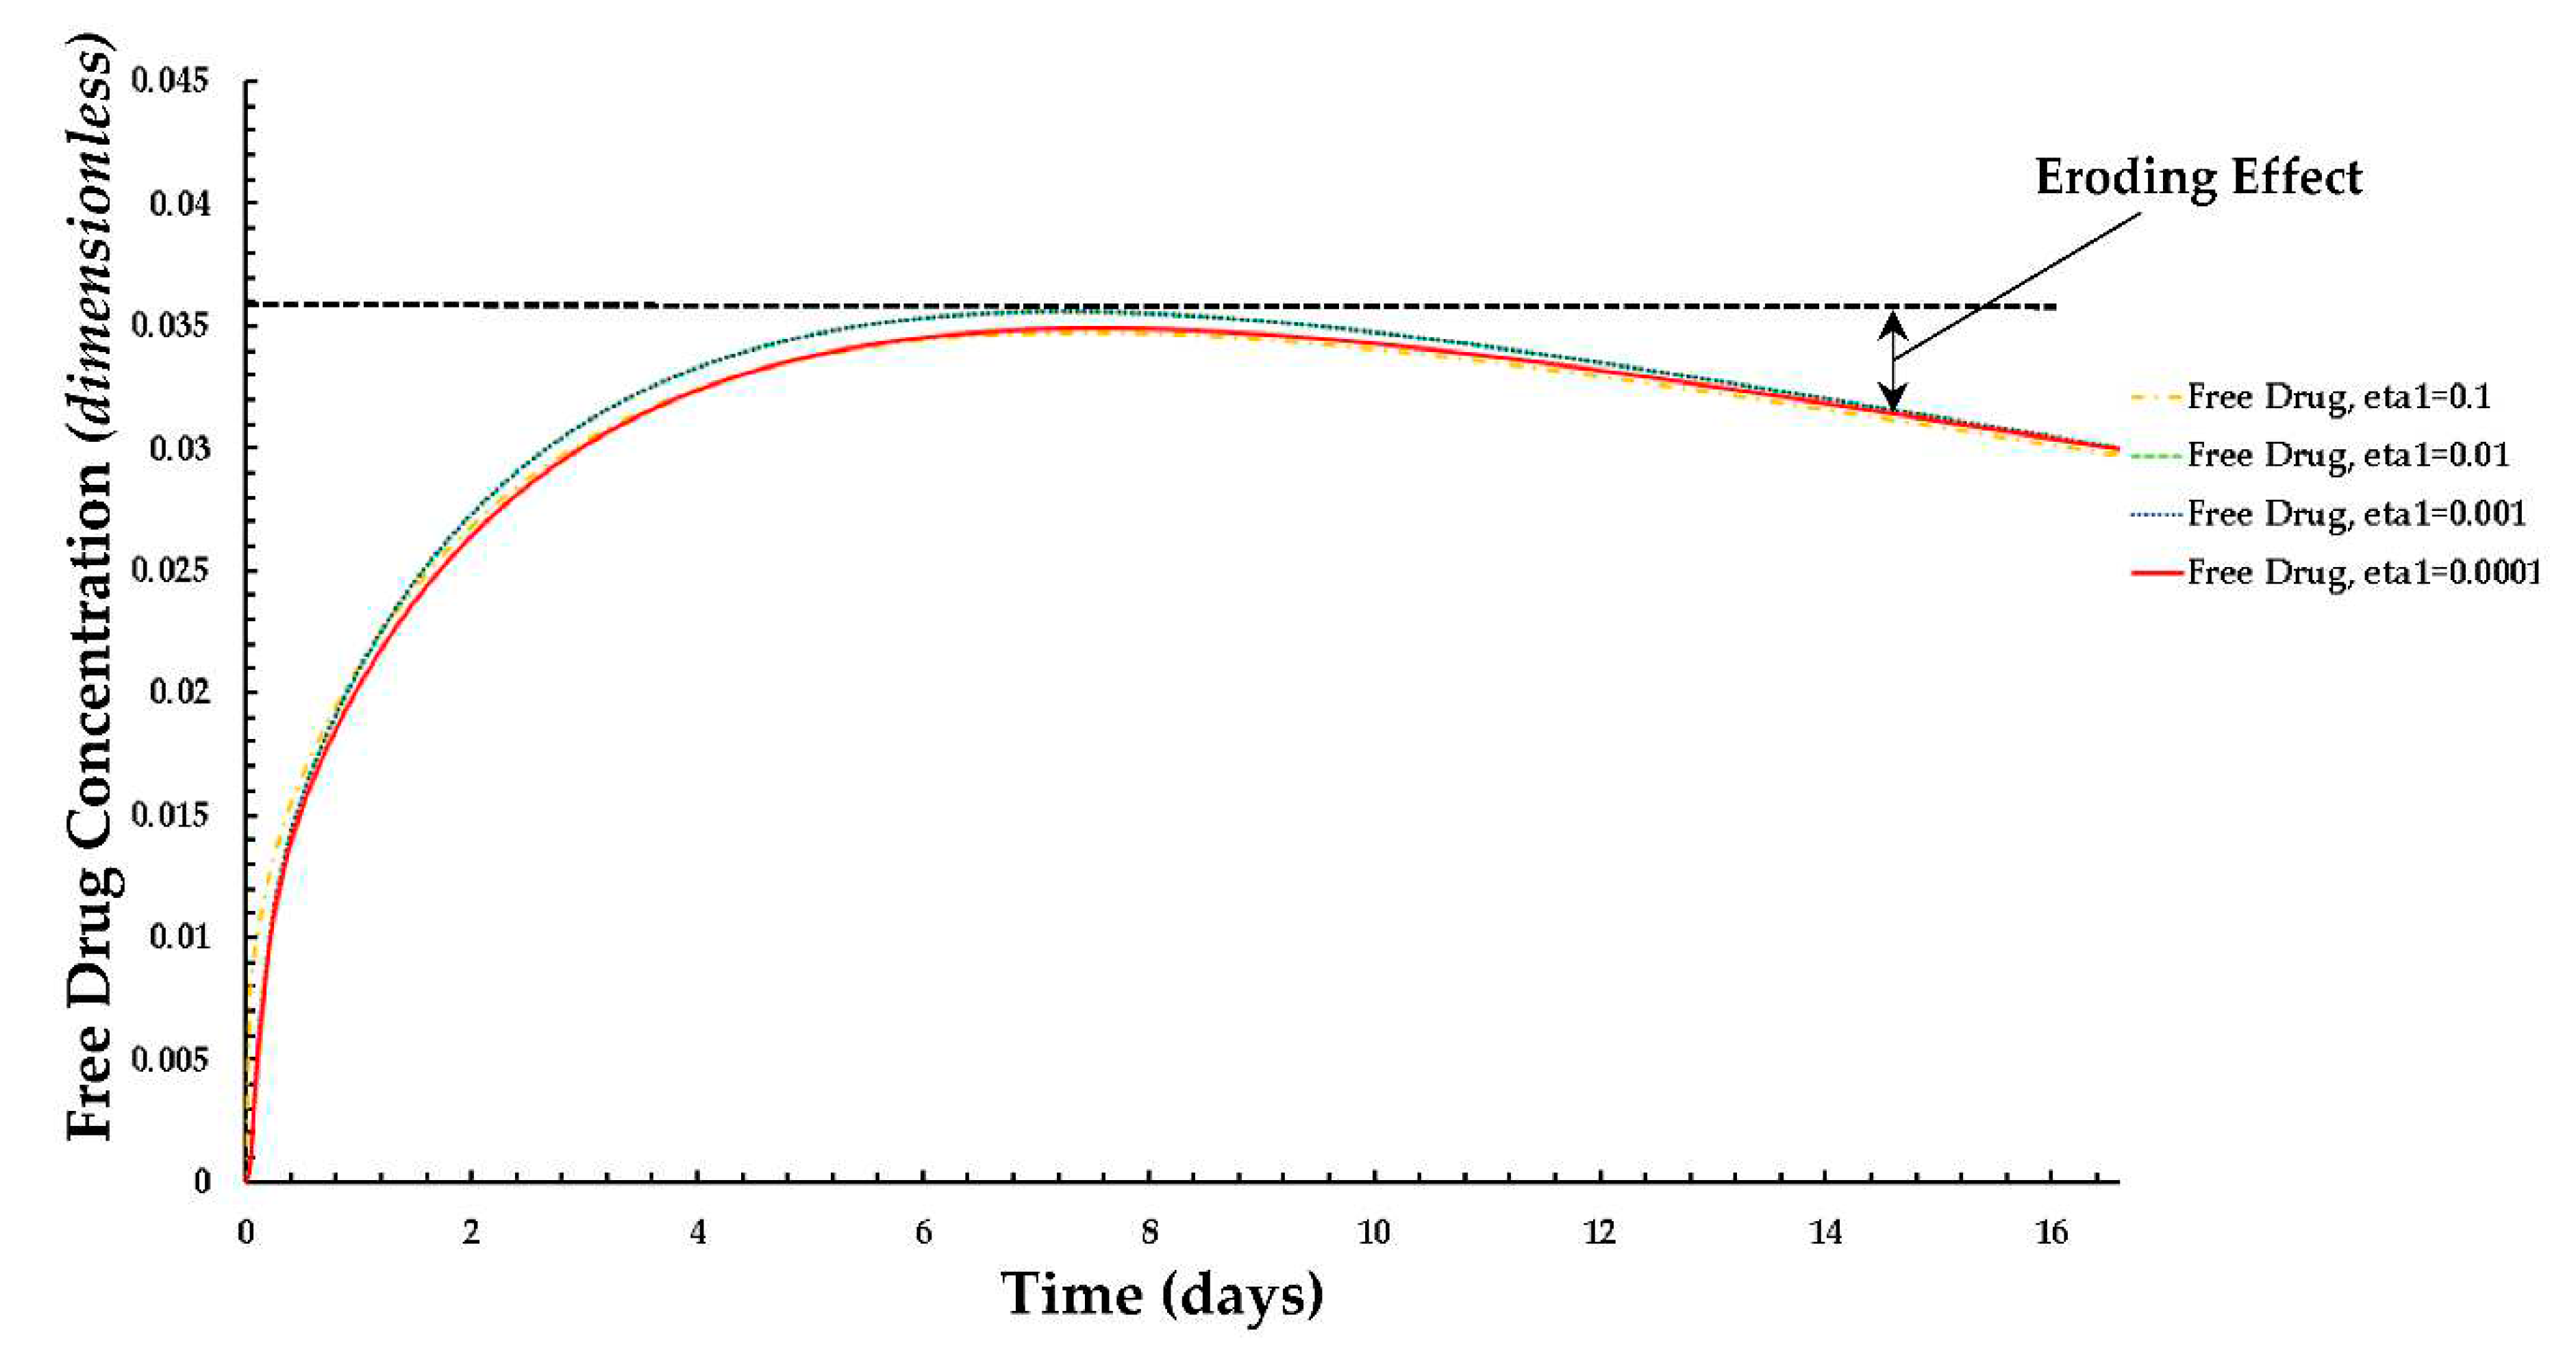
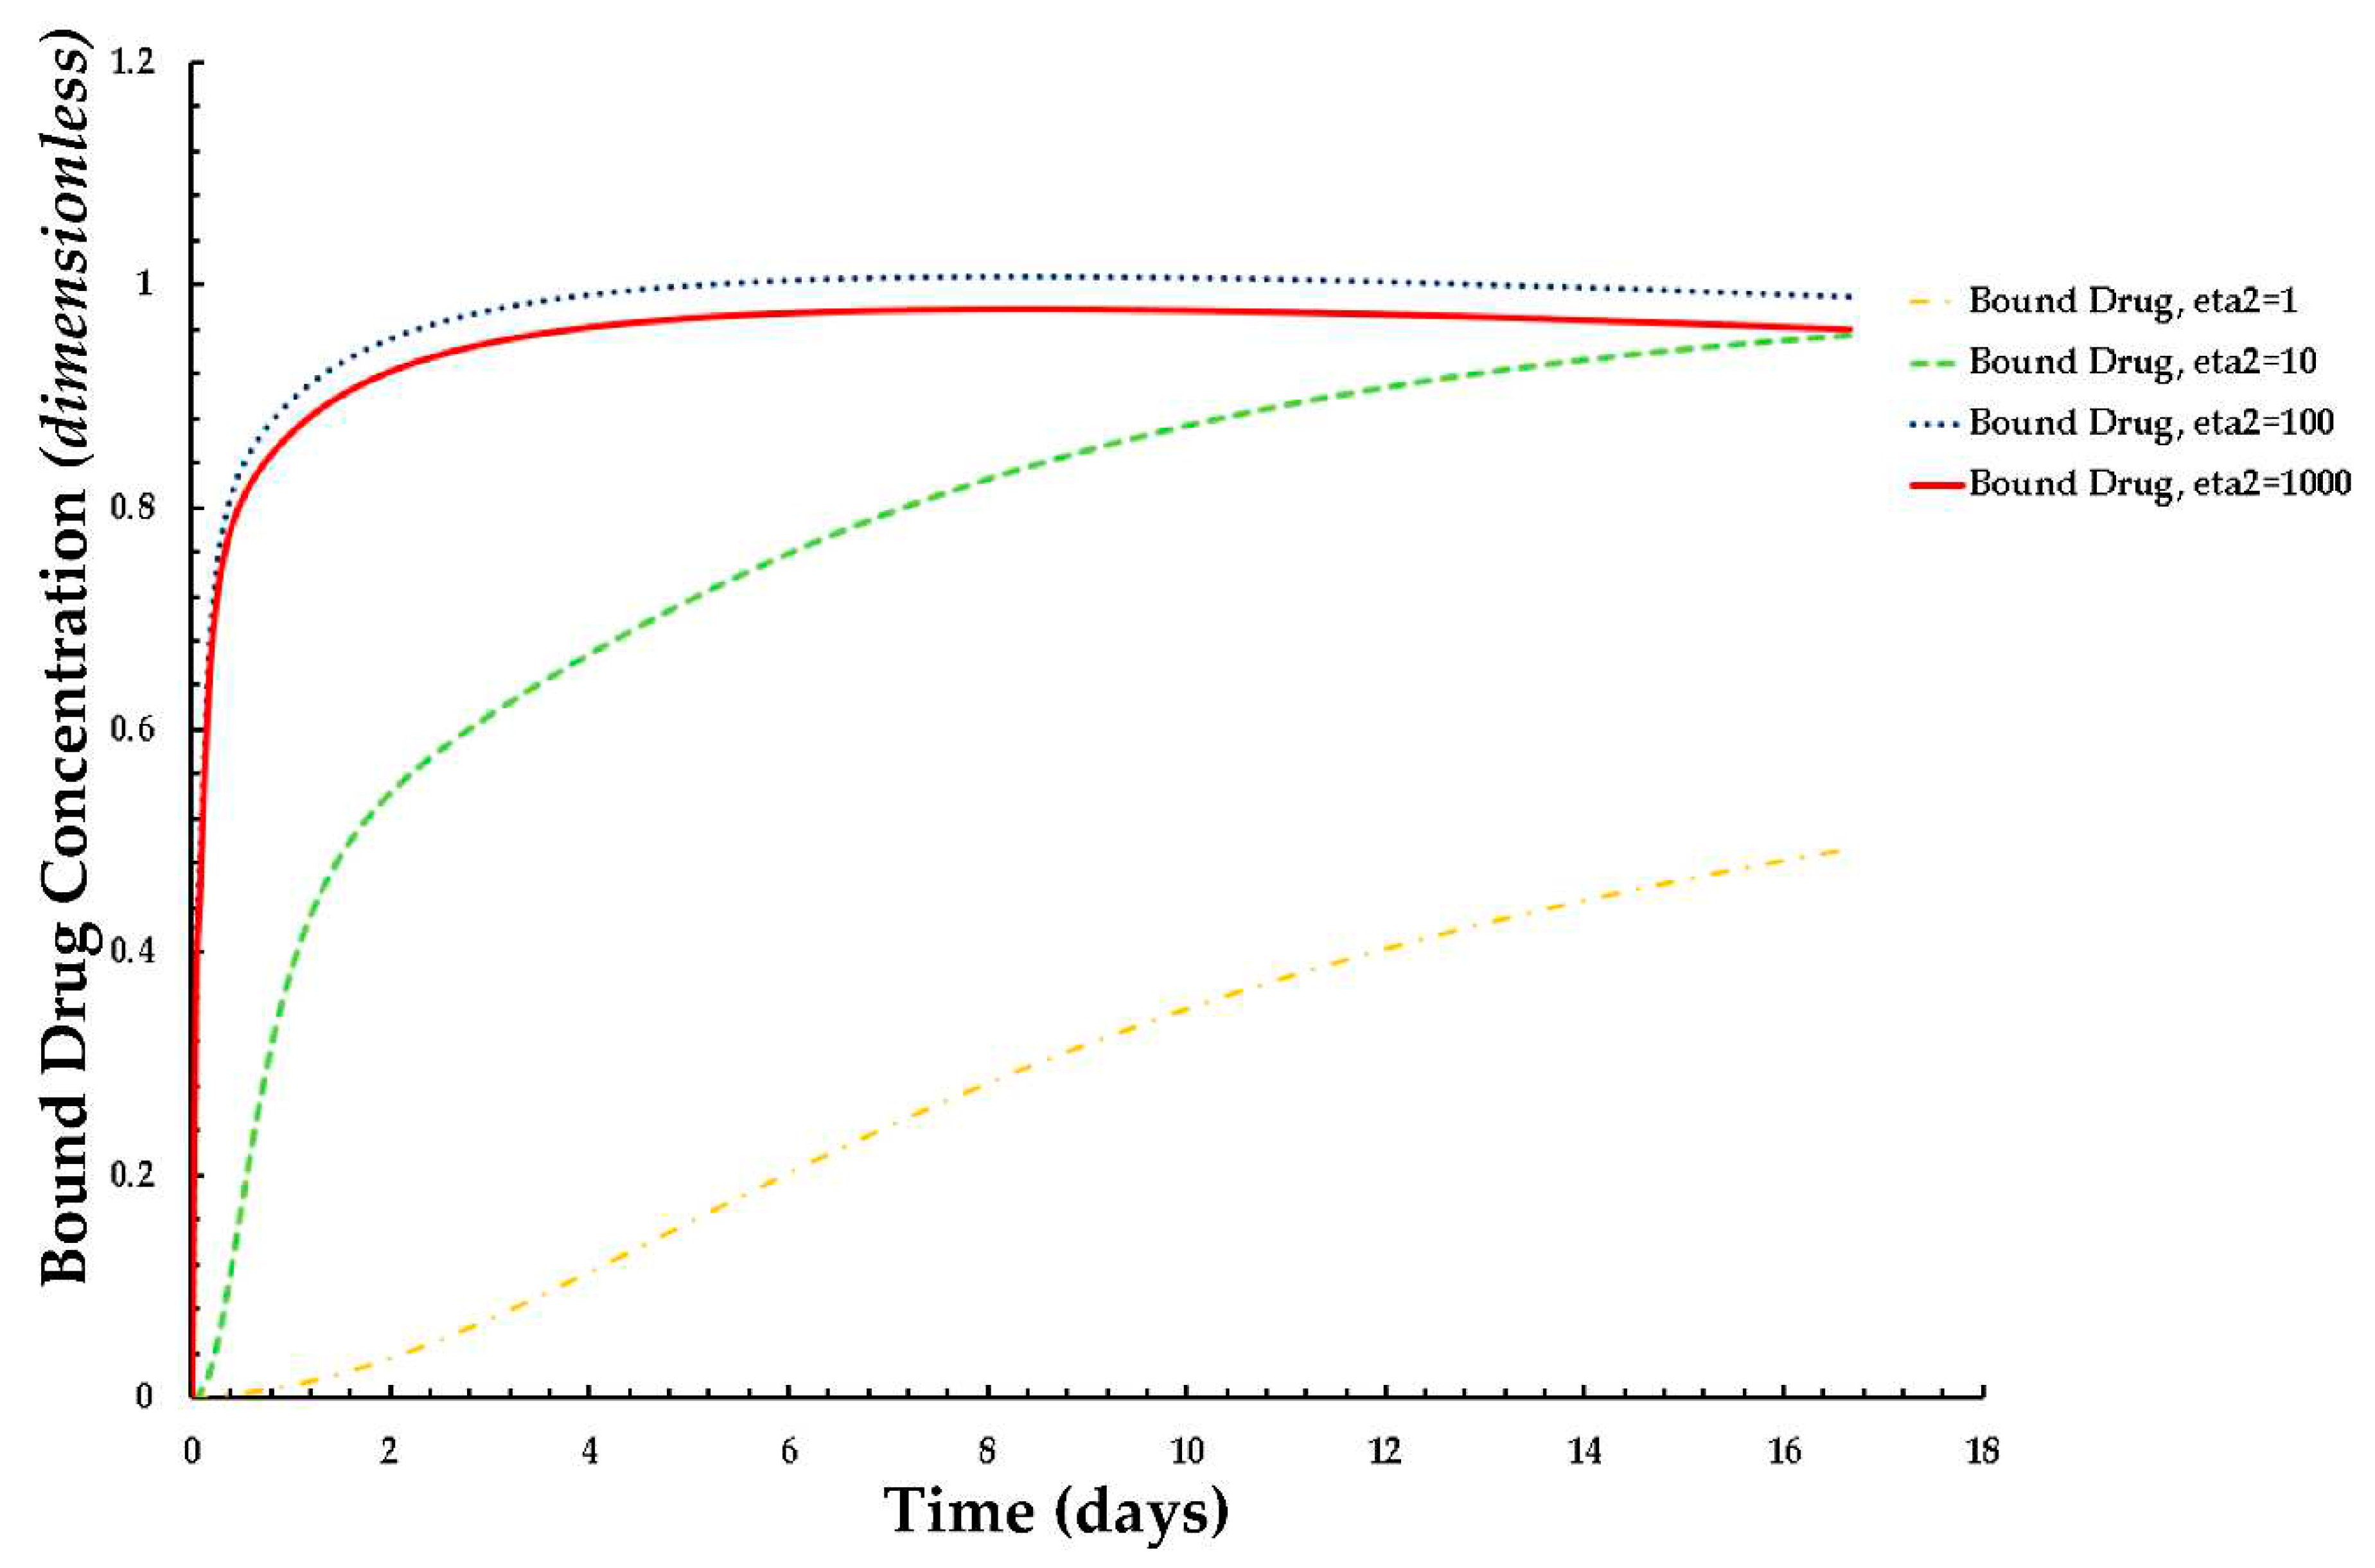
The distributions of the average weighted free and bound drug concentrations for varying values of the scaling parameter
ε1(= Rd/c0) are presented in
Figure 8 and
Figure 9 respectively, and the same for different values of
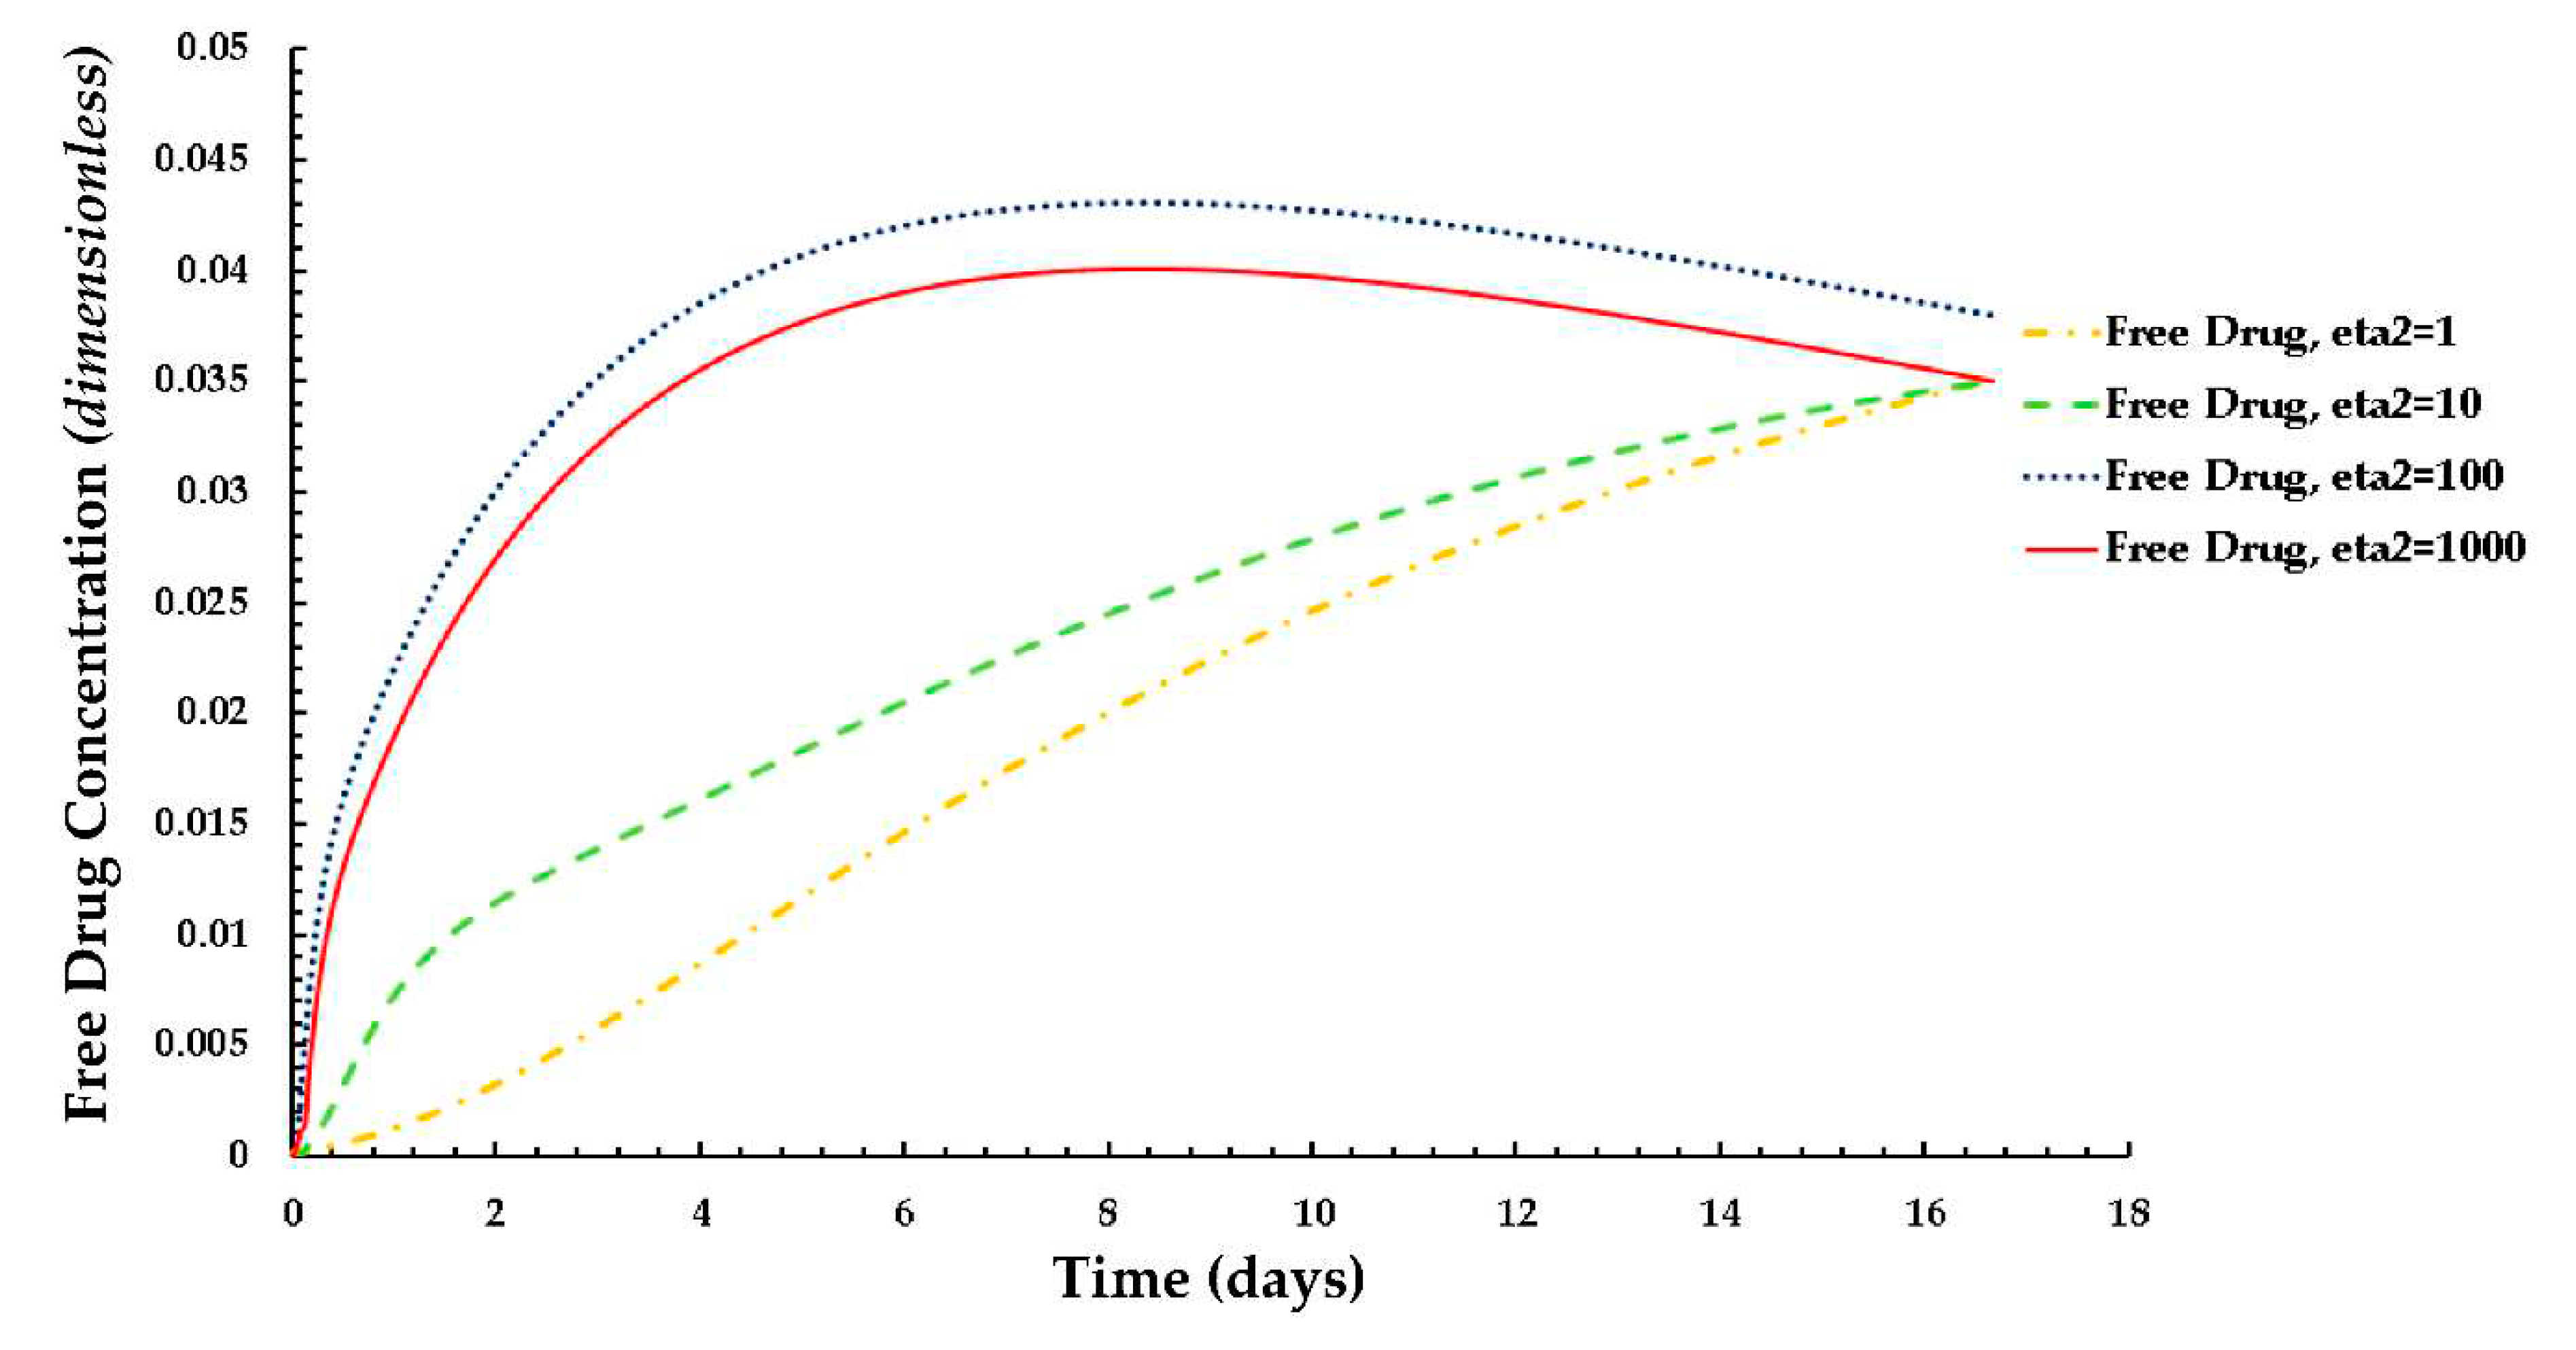
ε2(= c0/BM), which are shown in
Figure 10 and
Figure 11 respectively. The value of the scaling parameter
ε1, decreases with a decrease in the dissociation rate constant
kd and with an increase in the association rate constant
ka depending on
Rd (= kd/ka). Additionally, ε
2 increases with decreasing S
0 (while keeping c0 fixed).
Figure 3a shows that the normalized mean free drug concentration decreases with decreasing ε1 for
PeT = 2,
Da = 40,
ε2 = 100, up to a certain time and, thereafter, no significant changes occurred. It can be concluded and justified that, as
ε1 decreases, the rate of reversible binding
(kd) decreases and/or the rate of forward binding increases, which is lowering the mean concentration of free drug.
Figure 9. shows how the rates of forward and reversible binding influence the average weighted concentration of bound drug within the arterial tissue. It can be assumed that the average weighted concentration is increased with the decrease of ε
1, which is attributed to the increase in the rate of forward binding and/or to the decrease in the rate of reversible binding.
The effects of ε
2 (the net tissue binding potential on the average weighted concentrations of free as well as bound drug) are displayed in
Figure 10 and
Figure 11 respectively. As previously mentioned,
ε2 increases with decreasing binding potential.
The results of these figures specify that the average weighted concentration of free drug increases with decreasing binding potential up to ε2 = 100, however the concentration reaches a quasi-steady state for less binding capacity (ε2 = 1,000) as compared to the other cases.
In the case of the free drug for ε2 ≤ 100, the quasi-equilibrium is not fully established until approximately 17 days, while the PLGA coating has eroded significantly. On the other hand, in the case that bound drug for ε2 ≥ 10, the quasi-equilibrium is attained very rapidly.
3.4. Average Weighted Concentration Results for Varying Tortuosity
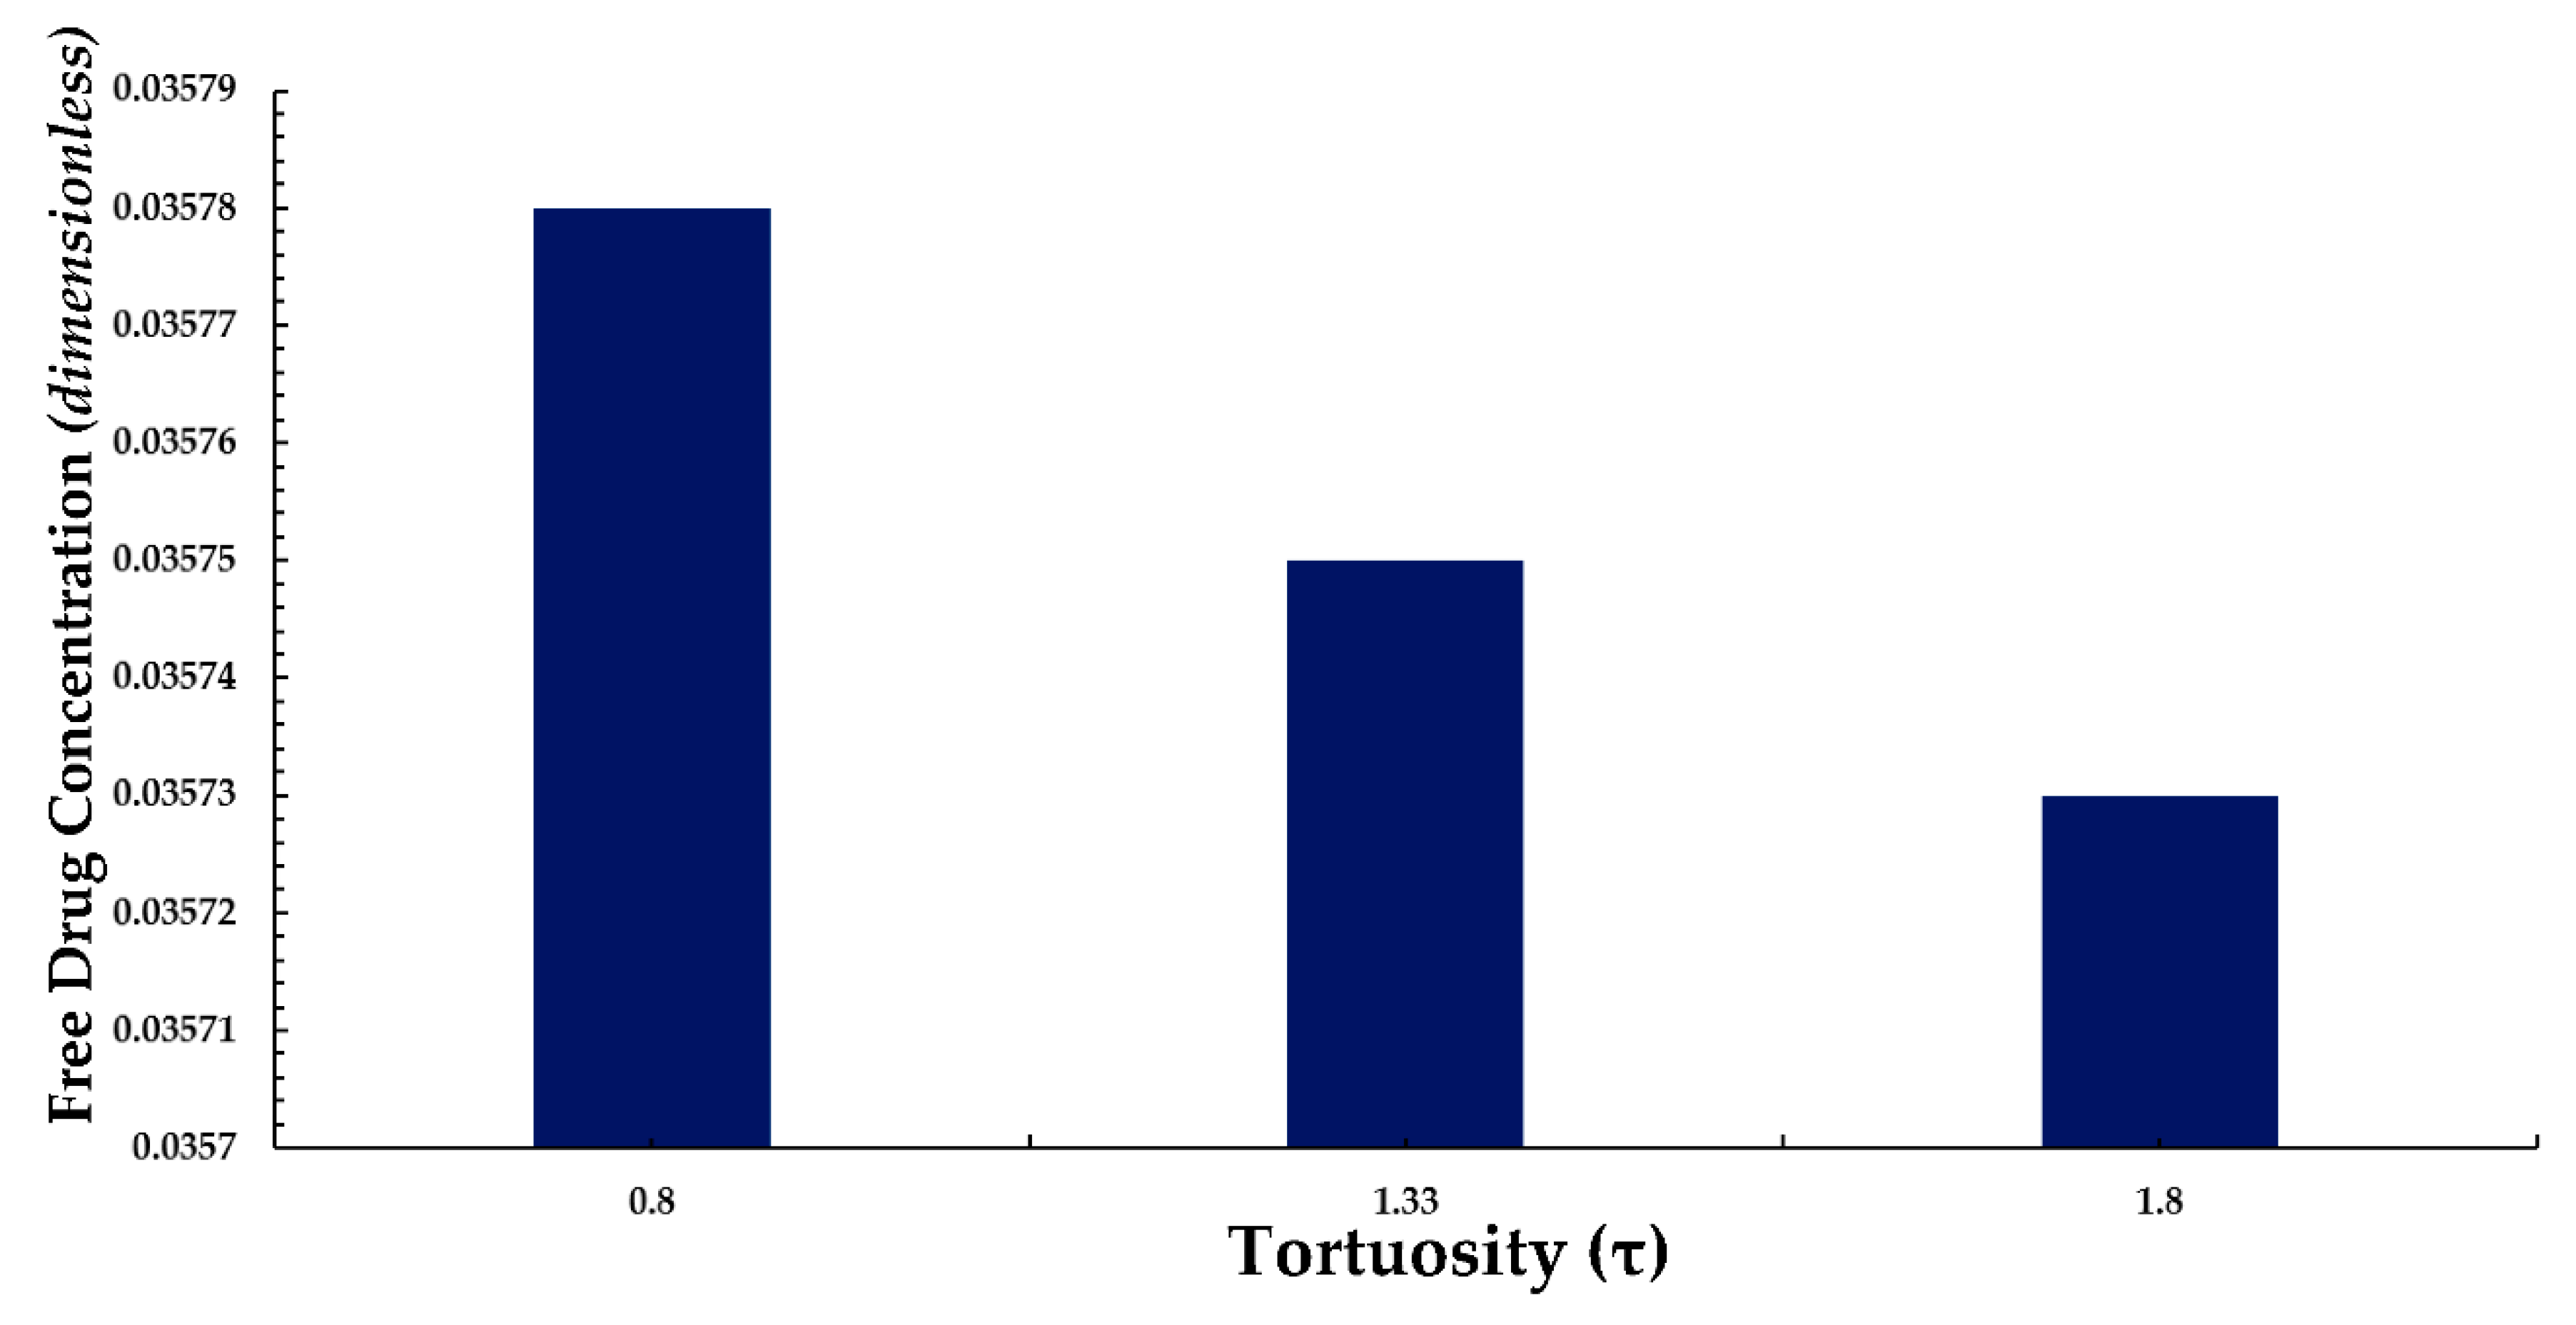
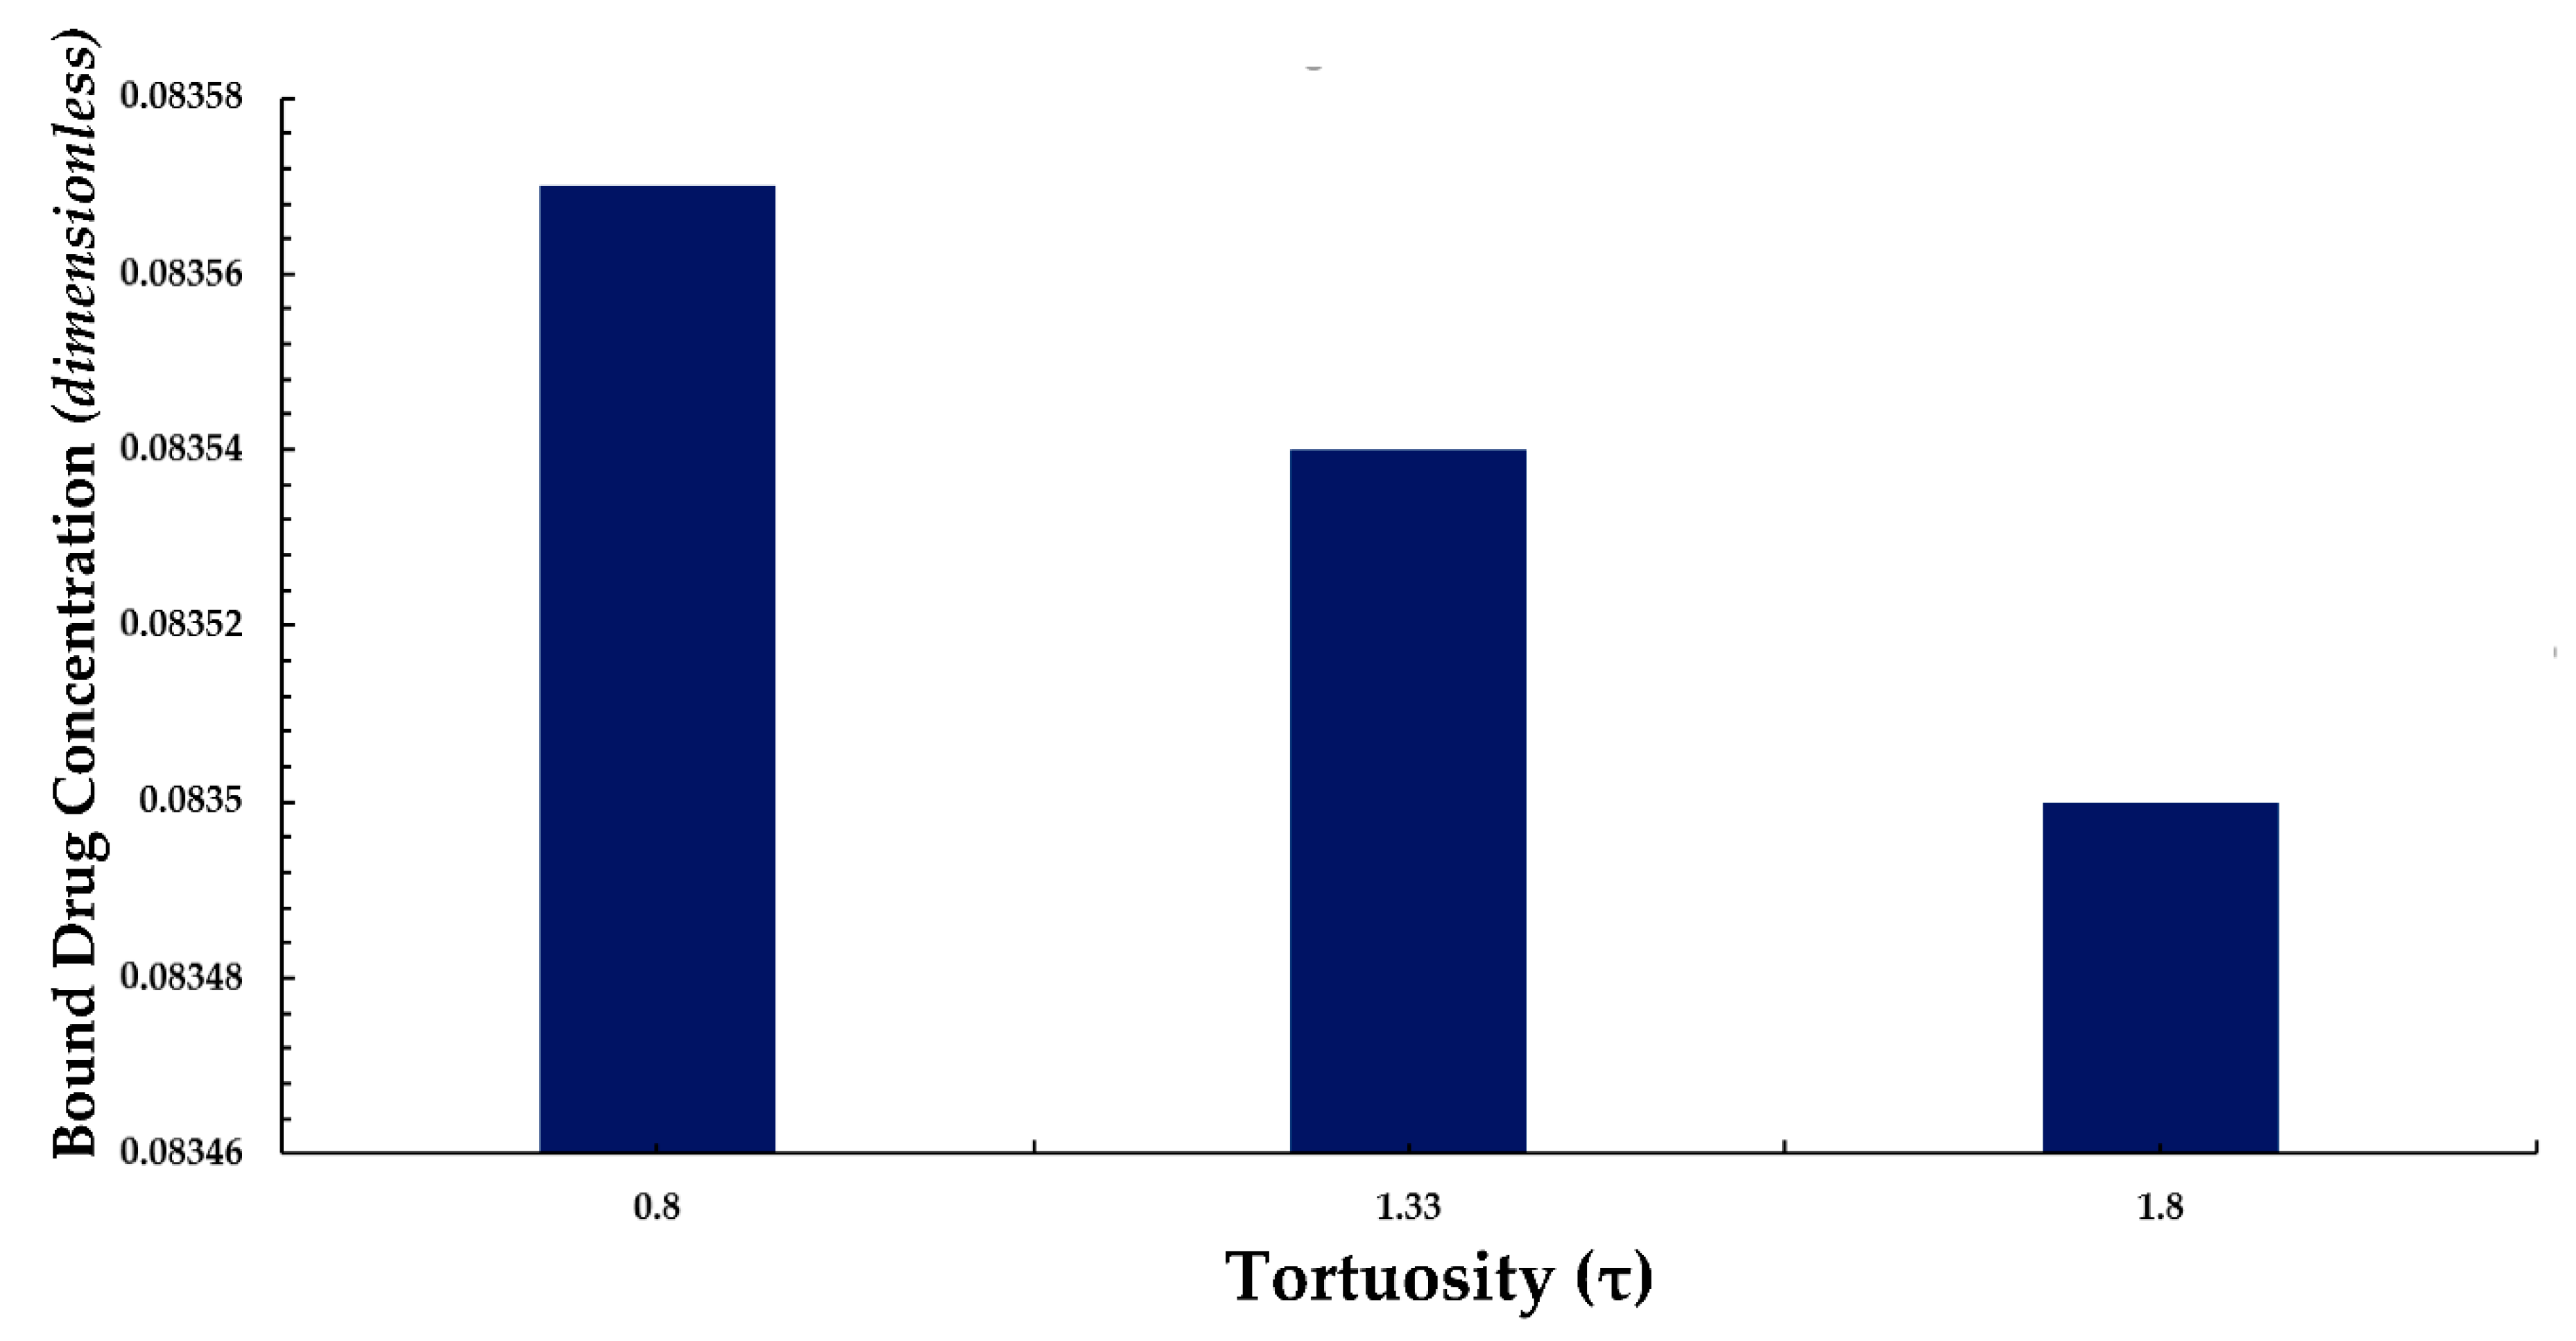
We also conducted a simple analysis to demonstrate the effect of tortuosity
(τ as listed in Eqn. 11) on the average weighted concentration. In this analysis, we observed that a decrease in the mean concentration of free drug occurred with an increase in tortuosity
(here an inverse relationship between free drug concentration and tortuosity is revealed). A similar pattern is also observed for bound drug in
Figure 13.
The above observation may be justified in the sense that as the tortuosity increases so too does the effective distance over which diffusion has to take place (i.e. the progression of diffusion eventually lowering the mean concentration of both drug forms is impeded).
4. Conclusions
This paper reports the methodology and findings of an investigation of the interstitial flow profile into the arterial wall and the free and bound drug diffusion profiles with a parametric study of varying polymer drug concentration (low and high), tortuosity, porosity, and Peclet and DamKöhler numbers over the course of 400 hours (16.67 days). Acquiring an understanding of the relationship between drug physicochemical properties and the local transport environment is crucial to the success of new drug stent designs. Computational models such as the one discussed in this work can provide highly detailed predictions of the drug distribution in the vessel wall over time. Most computational investigations of drug delivery include only one drug form. This has the drawback of not accounting for binding and convective diffusive transport directly. The developed mathematical model discussed in this paper provides the basis for evaluating and studying diffusion characteristics for drug-eluting stent applications.
Future work will be carried out to enhance this model to characterize the internalized drug, evaluate further the eluting behavior of the PGLA coating, compare PLGA to other bio durable coatings, describe the anisotropic behavior of the diffusion coefficient within the arterial wall with the ease of adaptation to more sophisticated scenarios (i.e., consideration of more pathological conditions) and compare the effect of stent position on drug diffusion profiles (i.e half, full, and partial embedment). Simulations using the presented computational model can help provide insight into the drug release and distribution by a stent with PLGA coating, as well as the potential impacts of various factors that can affect the efficacy of drug delivery and its effects on treating restenosis. With the developed model, optimization of the model parameters, such as different stent strut geometries and coating thickness, can also be performed for exploration on the design of drug-eluting stents.
Author Contributions
Conceptualization, R.L.H.J., M.E. and J.P.K.; methodology, R.L.H.J and J.P.K.; software, R.L.H.J.; validation, R.L.H.J. and M.E.; formal analysis, R.L.H.J., M.E. and J.P.K; investigation, R.L.H.J., M.E. and J.P.K.; resources, R.L.H.J.; data curation, R.L.H.J.; writing—original draft preparation, R.L.H.J.; writing—review and editing, R.L.H.J.; visualization, R.L.H.J.; supervision, R.L.H.J.; project administration, R.L.H.J.; funding acquisition, R.L.H.J. All authors have read and agreed to the published version of the manuscript.
Funding
This research received no external funding.
Data Availability Statement
The data from this work will be shared and made available upon request to the corresponding author.
Conflicts of Interest
The authors declare no conflict of interest.
Appendix A
This section provides an overview of the characteristic scaling methodology implemented to dimensionless Eqns. 4-6. In this method, we begin with stating the free and bound drug transport equations as mentioned previously:
The dimensionless scaling parameters used for scaling Eqns. A1 through A4 are shown below:
The first order free and bound drug concentration derivatives are first non-dimensionalized using the characteristic dimensionless parameters as shown below:
The second-order derivatives are scaled as shown below:
The dimensionless derivatives are now substituted into Eqn. A1 as shown below:
Dividing Eqn A12 through on both sides by C
0V
y/δ yields the following:
The finalized dimensionless form of the free-drug transport into the PLGA coating is shown below:
where
PeC=[Vyδ/(DC)]. The scaled free-drug concentration derivatives
(Eqns. A5 and A8-A11) are now substituted into the free drug transport equation into the arterial wall domain:
Dividing Eqn A15 through on both sides by C
0V
y/δ, factoring out the first and second-order derivative constants, and substituting the equilibrium constant
Rd=(kd/ka) yields the following:
Recognizing that the Peclet and DamKöhler numbers are
PeT=[Vyδ/(DT) and Da=[(
kaS0δ2)/(
DT)] are in the tissue and that
ε1=(Rd/C0) is an additional scaling parameter and yields the final non-dimenionsal form of the free-drug transport equation in the arterial domain as shown below:
The scaled free and bound-drug concentration derivatives
(Eqns. A5 and A8-A11) are now substituted into the free drug transport equation into the arterial wall domain:
References
- Edwards, M. , Hewlin, Jr., R.L., and Smith, M., "A 2-D Transient Computational Multi-Physics Model for Analyzing Magnetic and Non-Magnetic (Red Blood Cells and E. Coli Bacteria) Particle Dynamics in a Travelling Wave Ferro-Magnetic Microfluidic Device". ASME Journal of Engineering and Science for Medical Therapis and Diagnosis (Paper Accepted), 2023. [CrossRef]
- Hewlin, R.L., Jr.; Edwards, M. "Continuous Flow Separation of Red Blood Cells and Platelets in a Y-Microfluidic Channel Device with Saw-Tooth Profile Elec-trodes via Low Voltage Dielectrophoresis". Current Issues in Molecular Biology, 2023. 3. [CrossRef]
- Hewlin, J., R. L., Ciero, A., and Kizito, J.P., "Development of a Two-Way Coupled Eulerian-Lagrangian Computational Magnetic Nanoparticle Targeting Model for Pulsatile Flow in a Patient-Specific Diseased Left Carotid Bifurcation Artery". Cardiovasc. Eng. Technol., 2019. 10(2): p. 299-313. [CrossRef]
- Stanley, N. , Ciero, A., Timms, W., and Hewlin, Jr., R.L., "A 3-D Printed Optically Clear Rigid Diseased Carotid Bifurcation Arterial Mock Vessel Model for Particle Image Velocimetry Analysis in Pulsatile Flow". ASME Open J. Engineering ASME., 2023. [CrossRef]
- Hewlin, J., R. L., and Tindall, J.M., "Computational Assessment of Magnetic Nanoparticle Targeting Efficiency in a Simplified Circle of Willis Arterial Model". International Journal of Molecular Sciences, 2023. 24(3): p. 2545. [CrossRef]
- Hewlin, R.L., Jr.; Kizito, J.P. "Comparison of Carotid Bifurcation Hemodynamics in Patient-Specific Geometries at Rest and During Exercise" Proceedings of the ASME 2013 Fluids Engineering Division Summer Meeting. Volume 1A, Symposia: Advances in Fluids Engineering Education; Advances in Numerical Modeling for Turbomachinery Flow Optimization; Applications in CFD; Bio-Inspired Fluid Mechanics; CFD Verification and Validation; Development and Applications of Immersed Boundary Methods; DNS, LES, and Hybrid RANS/LES Methods. Incline Village, Nevada, USA. 7–11 July 2013. V01AT04A001. ASME. [CrossRef]
- Stanley, N. , Ciero, A., Timms, W., and Hewlin, R.L., Jr., "Development of 3-D Printed Optically Clear Rigid Anatomical Vessels for Particle Image Velocimetry Analysis in Cardiovascular Flow" Proceedings of the ASME 2019 International Mechanical Engineering Congress and Exposition. Volume 7: Fluids Engineering. Salt Lake City, Utah, USA. 11–14 November 2019. V007T08A004. ASME. [CrossRef]
- Hewlin, R.L., Jr.; Kizito, J.P. "Development of an Experimental and Digital Cardiovascular Arterial Model for Transient Hemodynamic and Postural Change Studies: “A Preliminary Framework Analysis”. Cardiovasc. Eng. Tech., 2018. 9: p. 1-31. [CrossRef]
- Daemen, J. , and Serruys, P.W., "Drug-Eluting Stent Update 2007 Part I: a Survey of Current and Future Generation Drug-Eluting Stents: Meaningful Advances or More of the Same?". Circulation, 2007. 116(3): p. 316-328. [CrossRef]
- Beshchasna, N. , et al., "Recent Advances in Manufacturing Innovative Stents". Pharnaceutics, 2020. 12(349). [CrossRef]
- Conway, C. , "Clinical Evidence Vs. the Testing Paradigm". Cardiovascular Eng Technol., 2018. 9(4): p. 752-760.
- Beckman, J.A. , and White, C.J., "Paclitaxel-Coated Balloons and Eluting Stents: Is There a Mortality Risk in Patients With Peripheral Artery Disease". Circulation, 2019. 140. [CrossRef]
- Capell, W.H. , Bonaca, M.P., Nehler, M.R., Kittelson, J.M, et al., "Rationale and Desitn for the Vascular Outcomes Study of ASA Along with Rivaroxaban in Endovascular or Surgical Limb Revascularization for Peripheral Artery Disease". Am Heart J, 2018. 199: p. 83-91. [CrossRef]
- Food and Drug Administration, "Update: Treatment of Peripheral Arterial Disease with Paclitaxel-Coated Ballons and Paclitaxel-Eluting Stents Potentiall Associated with Increased Mortality: Letter to Health Care Providers". https://www.fda.gov/medical-devices/letters-health-care-providers/update-treatment-peripheral-arterial-disease-paclitaxel-coated-balloons-and-paclitaxel-eluting, 12 March 2010, Accessed May 5, 2022.
- Levin, A. , Jonas, M., Hwang, C.W., and Edelman, E., "Local and Systemic Drug Competition in Drug-Eluting Stent Tissue Deposition Properties". J. Control. Release, 2005. 109: p. 226-243.
- Granada, J.F. , Stenoien, M., Buszman, P.P., et al, "Mechanisms of Tissue Uptake and Retention of Paclitaxel-Coated Balloons: Impact on Neointimal Proliferation and Healing". Open Heart, 2014. 1(1). [CrossRef]
- Lovich, M.A. , Philbrook, M., Sawyer, S., Weselcouch, E., Edelman, E.R.,, "Arterial Heparin Deposition: Role of Diffusion, Convection, and Extravascular Space". Am J Physiol, 1998. 275: p. H2236-H2242.
- Moses, J.W. , Stone, G.W., Nikolsky, E., Mintz, G.S., Dangas, G., Grube, E., "Drug-eluting Stents in the Treatment of Intermediate Lesions: Pooled Analysis from four Randomized Trials". J Am Coll Cardiol, 2006. 47: p. 2164-2171. [CrossRef]
- Serruys, P.W. , Sianos, G., Abizaid, A., Aoki, J., den Heijer, P., Bonnier, H., "The Effect of Variable Dose and Release Kinetics on Neointimal Hyperplasia using a Novel Paclitaxel-eluting Stent Platform: The Paclitaxel In-Stent Controlled Elution Study (Pices)". J Am Coll Cardiol, 2005. 46: p. 253-260.
- Lovich, M.A. , and Edelman, E.R., "Computational Simulations of Local Vascular Heparin Deposition and Distribution". Am J Physiol, 1996. 271: p. H2014-H2024.
- Sakharov, D.V. , Kalachev, L.V., Rijken, D.C., "Numerical Simulation of Local Pharmcokinetics of a Drug after Intervascular Delivery with an Eluting Stent". J Drug Target, 2002. 10: p. 507-513.
- Hwang, C. , Wu, D., Edelman, E., "Physiological Transport Forces Govern Drug Distribution for Stent-Based Delivery". Circulation, 2001. 104: p. 600-605.
- Migiliavacca, F. , Gervaso, F., Prosi, M., Zunino, P., Minisini, S., Formaggia, L., "Expansion and Drug Elution Model of a Coronary Stent". Comput Methods Biomech Biomed Engin, 2007. 10. [CrossRef]
- Borghi, A. , Foa, E., Balossino, R., Migliavacca, F., Dubini, G., "Modelling Drug Elutiogn from Stents: Effects of Reversible Binding in the Vascular Wall and Degradable Polymeric Matrix". Comput Methods Biomech Biomed Engin, 2008. 11: p. 367-377.
- Horner, M. , Joshi, S., Dhruva, V., et al, "A Two-Species Drug Delivery Model is Required to Predict Deposition from Drug-Eluting Stents". Cardiovascular Eng Technol., 2010. 1: p. 225-234. [CrossRef]
- Tzafriri, A.R. , Levin, A.D., Edelman, E.R., "Diffusion-limited Binding Explains Binary Dose Response for Local Arterial and Tumor Drug Delivery". Cell Prolif, 2009. 42: p. 348-363. [CrossRef]
- Higuchi, T. "Theoretical Analysis of Rate of Release of Solid Drugs Dispersed in Solid Matrices". J Pharm Sci, 1963: p. 1145-1149. [CrossRef]
- Mandal, A.P. , and Mandal, P.K., "An Unsteady Analysis of Arterial Drug Transport from Half-Embedded Drug Eluting Stent". Appl Math Comput, 2015. 266. [CrossRef]
- Mandal, A.P. and Mandal, P.K., "Computational Modelling of Three-Phase Stent-Based Delivery". J Explor Res Pharmacol, 2017. 2: p. 31-40.
- Saltzman, M.W. Drug Delivery: Engineering Principles for Drug Therapy". USA: Oxford University Press, 2001.
- Sarifuddin; Mandal, P.K. "Effect of Diffusivity on the Transport of Drug Eluted from Drug Eluting Stent". Int J Appl Comput Math, 2016. 2: p. 291-301. [CrossRef]
- O'Connel, B.M. , and Walsh, M.T., "Demonstrating the Influence of Compression on Artery Wall Mass Transport". Ann Biomed Eng, 2010. 38: p. 1354-1366.
- Edwards, M. , Kizito, J.P., and Hewlin, Jr., R.L., "A Time-Dependent Two Species Explicit Finite Difference Computational Model for Analyzing Diffusion in a Drug Eluting Stented Coronary Artery Wall: a Phase I Study." Proceedings of the ASME 2022 International Mechanical Engineering Congress and Exposition. Volume 4: Biomedical and Biotechnology; Design, Systems, and Complexity. Columbus, Ohio, USA. 30 October–November 3, 2022. V004T05A009. ASME. [CrossRef]
- Zhu, X. , Pack, D.W., and Braatz, R.D., "Modelling Intravascular Delivery from Drug-Eluting Stents with Biodegradable Coating: Investigation of Anisotropic Vascular Drug Diffusivity and Arterial Drug Distribution". Comput Methods Biomech Biomed Engin, 2014. 17(3): p. 187-198.
- Xiaoxiang, Z. , and Braatz, R.D., "Modelling and Analysis of Drug-Eluting Stents With Biodegradable PLGS Coating: Consequences on Instravascular Drug Delivery". J of Biomech Eng, 2015. 136.
- Balakrishnan, B. , Tzafriri, A.R., Arifin, D.Y., and Edelman, E.R., "Intravascular Drug Release Kinetics Dictate Arterial Drug Deposition, Rentention and Distribution". J. Controlled Release, 2007. 123(2): p. 100-108. [CrossRef]
- Vairo, G. , Cioffi, M., Cottone, R., Dubini, G., and Migliavacca, F., "Drug Release from Coronary Eluting Stents: A Multidomain Approach". J Biomech Eng., 2010. 43(8): p. 1580-1589.
- Hewlin, R.L., Jr. "Transient Cardiovascular Hemodynamics in a Patient-Specific Arterial System. Dissertation, North Carolina Agricultural and Technical State University, 2015.
- Whale, M. , Grodzinsky, A., and Johnson, M., "The Effect of Aging and Pressure on the Specific Hydraulic Conductivity of the Aortic Wall". Biorheology, 1996. 33(1): p. 17-44. [CrossRef]
- Kolachalama, V. , Tzafriri, A., Arifin, D., and Edelman, E>, "Luminal Flow Patterns Dictate Arterial Drug Deposition in Stent-Based Delivery". J. Controlled Release, 2009. 133(1): p. 24-30. [CrossRef]
- Baldwin, A.L. , Wilson, I., Gardus-Pizlo, R., et al., "Effect of Atherosclerosis on Transmural Convection and Arterial Ultrastructure: Implications for Loacl Vascualr Drug Delivery". Aterioscler. Thromb. Vasc. Biol., 1997. 17(12): p. 3365-3375.
- Saha, R. , and Mandal, P.K., "Modelling Time-dependent Release Kinetics in Stent-based Delivery". Journal of Explatory Research in Pharmacology, 2018. 3(2): p. 61-70.
- Wang, D. , and Tarbell, J., "Modelling Interstitial Flow in an Artery Wall Allows Estimation of Wall Shear Stress on Smooth Muscle Cells". ASMEJ. Biomech. Eng., 1995. 117(3): p. 358-363.
- Santin, M. , Colombo, P., and Brushci, G., "Interfacial Biology of In-Stent Restenosis". Expert Rev. Med. Dev., 2005. 2(4): p. 429-443. [CrossRef]
- Balakrishnan, B. , Tzafriri, A. R., Seifert, P., Groothuis, A., Rogers, C., and Edelman, E.R., “Strut Position, Blood Flow, and Drug Deposition-Implications for Single and Overlapping Drug-Eluting Stents”. Circulation, 2005. 111(22): p. 2958-2965. [CrossRef]
- Wang, X.T. , Venkatraman, S.S., Boey, F.Y.C., Loo, J.S.C., and Tan, L.P., “Controlled Release of Sirolimus from a Multilayered PLGA Stent Matrix”. Biomaterials, 2006. 27(32): p. 5588-5595. [CrossRef]
- Castellot, J.J. , Wong, K., Herman, B., et al., “Binding and Internalization of Heparin by Vascular Smooth Muscle Cells". J. Cell. Physiol., 1985. 124(1): p. 13-20. [CrossRef]
- Deux, J.-F. , Meddahi-Pelle, A., Le Blanche, A. F., et al., “Low Molecular Weight Fucoidan Prevents Neointimal Hyperplasia in Rabbit Iliac Artery In-Stent Restenosis Model,”. Arterioscler., Thromb, Vasc. Biol., 2002. 22(10): p. 1604-1609. [CrossRef]
- Lovich, M.A. , and Edelman, E. R., “Computational Simulations of Local Vascular Heparin Deposition and Distribution”. Am. J. Physiol.-Heart Circ. Physiol., 1996. 271(5): p. H2014-H2024. [CrossRef]
|
Disclaimer/Publisher’s Note: The statements, opinions and data contained in all publications are solely those of the individual author(s) and contributor(s) and not of MDPI and/or the editor(s). MDPI and/or the editor(s) disclaim responsibility for any injury to people or property resulting from any ideas, methods, instructions or products referred to in the content. |
© 2023 by the authors. Licensee MDPI, Basel, Switzerland. This article is an open access article distributed under the terms and conditions of the Creative Commons Attribution (CC BY) license (http://creativecommons.org/licenses/by/4.0/).

 where Vy is the transmural filtration velocity, PeT=[Vyδ/(DT)] and Da=[(kaS0δ2)/(DT)] are the Peclet and DamKöhler numbers in the tissue. Here, ε1=(Rd/C0), ε2=(C0/S0), and ε3=(Rd/S0) are three scaling parameters. Pec=[Vy(h2/δ)]/Dc is the Peclet number in the coating of the strut and h is the thickness of the coating of the strut.