Submitted:
28 April 2023
Posted:
28 April 2023
You are already at the latest version
Abstract
To determine promethazine (PMZ) and its metabolites promethazine sulfoxide (PMZSO) and monodesmethyl-promethazine (Nor1PMZ) in swine muscle, fat, kidney, and liver, a sample preparation and high-performance liquid chromatography-tandem mass spectrometry (LC-MS/MS) analysis method were established and validated. The sample was extracted with 0.1% formic acid-acetonitrile, and the extract was purified with acetonitrile-saturated n-hexane. After concentration by rotary evaporation, the extract was re-dissolved in 0.1% formic acid-water and acetonitrile (80:20, v/v). The HPLC-MS/MS column used was a Waters Symmetry C18 (100 mm × 2.1 mm i.d., 3.5 μm), with 0.1% formic acid-water and acetonitrile as the mobile phase, and the target compounds were determined by positive ion scan and multiple reaction monitoring. PMZ and Nor1PMZ were quantified with deuterated promethazine (PMZ-d6) as the internal standard, while PMZSO was quantified by external standard method. The limits of detection (LOD) and limits of quantification (LOQ) of PMZ and PMZSO in muscle, liver, and kidney spiked samples were 0.05 μg/kg and 0.1 μg/kg, respectively, while those of Nor1PMZ were 0.1 μg/kg and 0.5 μg/kg, respectively. The LOD and LOQ of analytes in fat spiked sample were 0.05 μg/kg and 0.1 μg/kg, respectively. The sensitivity of this method reaches or exceeds its presented in previous reports. The analytes PMZ and PMZSO showed good linearity within the range of 0.1 μg/kg to 50 μg/kg, while Nor1PMZ showed good linearity within the range of 0.5 μg/kg to 50 μg/kg, with correlation coefficients (r) greater than 0.99. The recoveries of the target compounds in the sam-ples were between 81.73% and 107.17%, and the precision ranged from 1.78% to 10.47%. This study developed for the first time an HPLC-MS/MS method for the determination of PMZ and its metabolites PMZSO and Nor1PMZ in four swine edible tissues, comprehensively covered target tissues of monitoring object, which is applicable for monitoring veterinary drug residues in ani-mal-derived foods and ensuring food safety.
Keywords:
promethazine
; promethazine sulfoxide
; monodesmethyl-promethazine
; swine edible tissues
; high-performance liquid chromatography-tandem mass spectrometry
1. Introduction
Promethazine (PMZ) is a first-generation antihistamine drug with anti-allergic properties. In addition to its anti-histamine effects, PMZ also has extensive central inhibitory effects on the subcortical regions of the brain, leading to significant central sedation, hypnotic, antiemetic, and antipyretic effects, making it commonly used for sedation and sleep [1,2,3]. In China, PMZ is approved for the treatment of allergic reactions in animals such as sheep and pigs, including urticaria and serum sickness. Occasionally, a small number of farmers illegally use it in the breeding process of food animals in order to reduce animal movement, quickly gain weight, or reduce stress reactions during transportation [4].
There are reports of adverse reaction of PMZ abuse in human nowadays, shown that drug induced mental disorder, cardiovascular disease in certain abusing people [5,6,7]. Illegal use of PMZ in animal feed and animal breeding can also result in health hazards to consumers through drug residues in animal-derived foods, and result in environmental pollution and other risk [8,9]. Chinese Ministry of Agriculture Announcement No. 176 and No. 2583 prohibit the use of promethazine hydrochloride in animal feed and drinking water. In March 2010, the Chinese Ministry of Health published the fourth batch of "non-food substances that may be illegally added to food and food additives that are easily abused" list, which included promethazine. Japan, the United States, and the European Union have regulations prohibiting the detection of thiazine tranquilizers and their metabolites in animal-derived foods. The use of PMZ formulations in food animals has not been approved by the European Union, the United States, and other countries and regions.
PMZ is mainly metabolized by CYP450 enzymes in animals, and several metabolites have been reported [10,11,12]. Most studies on PMZ were performed on humans and experi-mental animals. As metabolites of PMZ, PMZSO and Nor1PMZ normally were found in metabolism study on human or experimental animals. But report on study of PMZ on swine is rare till now. Therefore, according on the previous reports, PMZSO, Nor1PMZ and PMZ were chosen as target analytes of residues determining in edible tissues of swine in this study. Nor1PMZ was chosen as a target compound of analysis on drug residues in edible tissues for first time in this study.
Currently, there are various methods for detecting PMZ, including enzyme-linked immunosorbent assay [13,14], spectroscopy [15,16,17,18], chemiluminescence [19], capillary electrophoresis [19,20], high performance liquid chromatography [21,22], gas chromatography-mass spectrometry [23,24,25,26,27,28,29,30], and liquid chromatography-tandem mass spectrometry(LC-MS/MS) [31,32,33,34,35,36,37,38,39,40,41,42,43,44,45]. However, most of the detection methods reported are used to detect PMZ formulations or illegally added animal feed [33,36,46,47]. But only a few methods can detect residues of PMZ, or PMZ and one of its metabolites, PMZSO in animal-derived foods [14,22,34,38,42,44,46], and are only applicable to some edible tissues such as muscle, liver, kidney. Even that, fat tissue as an important animal source food have not included in previous studies. As an important animal source food and one of the target tissues of monitoring drug residues in food, fat tissues was included in researching objects for first time in this study. This study aims to establish a sample preparation and LC-MS/MS method for the detection of PMZ and two of its metabolites in all edible tissues of swine, including muscle, liver, kidney, and fat, in order to provide technical support for the monitoring of PMZ and its metabolites in pig edible tissues and to ensure food safety.
2. Materials and Methods
2.1. Standards and Reagents
Promethazine Hydrochloride standard, purity of 99.5%, was purchased from the China National Institute for Food and Drug Control, China. Promethazine-d6 Hydrochloride standard with a chemical purity of 98% and an isotopic purity of 99.5%, Promethazine Sulfoxide (PMZSO) standard with a purity of 96%, Monodesmethyl-Promethazine Hydrochloride standard with a purity of 97% were all purchased from Toronto Research Chemicals, Canada.
HPLC grade acetonitrile (ACN) and methanol (MeOH) were purchased from Thermo Fisher Scientific, USA. HPLC grade formic acid was purchased from Shanghai Macklin Biochemical Co., Ltd., China. Analytical grade n-hexane was purchased from Tianjin Damao Chemical Reagent Factory, China. Ultrapure water was collected from a Milli-Q water purification system (Millipore, Billerica, MA, USA).
2.2. Instruments and Equipment
High performance liquid chromatography-tandem mass spectrometer (Shimadzu LC-30AD 220V liquid chromatograph, Japan), with ESI5500 tandem quadrupole mass spectrometer equipped with Turbo Ionspray electrospray interface, Analyst 1.6.3 software workstation (Applied Biosystems, ABI, Corporation, USA).
Chromatographic column was a Symmetry C18 (100 mm × 2.1 mm i.d., 3.5 µm), Waters Corporation, USA. Rotary evaporator (N-1300V-W, Tokyo Rikakikai Co., Ltd., Japan), high-speed desktop centrifuge (LEGEND MACH 1.6R, Thermo Corporation, USA), vortex mixer (Vortex 3000, VIGEN TECH Co., Ltd., Germany). Nylon syringe filters, 13 mm, 0.22µm disposable, purchased from Shanghai Ampu Company, China.
2.3. Preparation of Solution
Standard stock solution: The promethazine hydrochloride standard (calculated as PMZ, C17H20N2S), PMZSO standard (calculated as PMZSO, C17H20N2OS), and Monodesmethyl-Promethazine hydrochloride standard (calculated as Nor1PMZ, C16H18N2S) were weighed accurately and put into 50 mL volumetric flasks respectively, dissolved in HPLC grade ACN and made up to volume, obtaining the stock solution of each standard at 1000 μg/mL. All standard stock solutions were stored at -22°C.
PMZ-d6 standard stock solution: 10 mg of promethazine-d6 hydrochloride standard (C17H15D6ClN2S) was transferred to a 10 mL volumetric flask, dissolved in HPLC grade MeOH and made up to volume, obtaining the PMZ-d6 stock solution at 1000 μg/mL, sealed and stored at -22°C.
Mixed standard working solution: 1 mL each of PMZ, PMZSO, and Nor1PMZ standard stock solutions were took, mixed and diluted with HPLC grade ACN to obtain series working solutions at concentrations of 2.5 μg/mL, 1 μg/mL, 0.5 μg/mL, 0.25 μg/mL, 0.05 μg/mL, 0.025 μg/mL, 0.005 μg/mL, and 0.0025 μg/mL. The mixed standard working solutions were stored at 4°C.
PMZ-d6 working solution: An appropriate amount of PMZ-d6 standard stock solution was diluted with HPLC grade ACN to obtain an internal standard solution at a concentration of 1 μg/mL, sealed and stored at 4°C.
Acetonitrile saturated n-hexane: An appropriate amount of analytical grade n-hexane was added an appropriate amount of ACN, mixed well and allowed to stand until layered.
0.1% Formic Acid Solution in Water: 1.00 mL of HPLC grade formic acid was transferred, diluted to 1 L volume with ultrapure water and mix well.
0.1% Formic Acid in Acetonitrile: Transferred 1.00 mL of HPLC grade formic acid and added ACN to 1 L.
0.1% Formic Acid Solution in Water-Acetonitrile (80:20, v/v): Transferred 200 mL of HPLC grade ACN to a 1 L volumetric cylinder, added approximately 800 mL of 0.1% formic acid solution in water to 1 L, and mix well.
2.4. Chromatography and Mass Spectrometry Parameters
Symmetry C18 (100 mm×2.1 mm i.d., 3.5 µm) was employed. Mobile phase composed of 0.1% phase A (0.1% formic acid solution in water) and phase B (acetonitrile, ACN). Flow rate 0.3 mL/min, gradient elution procedure as shown in Table 1.
Mass spectrometer operated in positive ion mode (ESI+), mass spectrometric scan mode was multiple reaction monitoring (MRM). The main operating parameters were shown in Table 2.
Standard stock solution from "2.3" was diluted respectively to 1 μg/mL with ACN, directly injected into the spectrometer for mass spectrometric optimization. The molecular ion peaks of target analytes and internal standard were determined by full-scan mass spectrometry in positive ion mode, where the m/z of PMZ was 285.2, PMZSO was 301.3, Nor1PMZ was 271.3, and PMZ-d6 was 291.3. Each precursor ion was MS/MS scanned to determine and assess monitored ions for each analyte as quantitative ion and qualitative ion. Operation parameters of each ion was optimized using mass spectrometric scan mode of multiple reaction monitoring (MRM). Finally, the m/z of 86.2 and 198.1 were determined as the quantitative and qualitative ions for PMZ, 198.2 and 239.1 for PMZSO, 197.3 and 240.3 for Nor1PMZ, and 92 and 240.3 for PMZ-d6. The qualitative and quantitative ion pairs, declustering potential, and collision energy for each target compound were shown in Table 3. Quantification of PMZ and Nor1PMZ were used PMZ-d6 as the internal standard, while quantification of PMZSO was used external standard method.
2.5. Sample Preparation
Approximately 500 g of muscle, liver, and kidney sample was removed connective tissue, blood vessels, and fat, then cut into pieces and chopped into uniform slurry using a homogenizer. Weighed 5.0 g±0.1 g of sample slurry in a 50 mL centrifuge tube, added 100 μL of PMZ-d6 internal standard working solution (1 μg/mL), vortex for 30 s and let stand for 30 min. Added 10 mL of 0.1% formic acid in acetonitrile, vortex for 1 min to mix and shook for 10 min using platform shaker at 100% speed, then centrifuged at 10000 rpm for 10 min. The supernatant was transferred to a pear-shaped bottle. Another 10 mL of 0.1% formic acid acetonitrile was added to the residue in the centrifuge tube, repeated the above operation to perform the second extraction. The two extraction liquids were collected in a pear-shaped bottle for purification and concentration.
Approximately 500 g of subcutaneous fat from pig was removed muscle and connective tissue, and homogenized with homogenizer to obtain a uniform slurry. Weighed 5.0 g±0.1 g of fat slurry in a 50 mL centrifuge tube and added 100 μL of PMZ-d6 internal standard working solution (1 μg/mL), vortex for 30 s and let stand for 30 min. Added 10 mL of acetonitrile saturated n-hexane, vortex until the fat is completely dissolved, let stand for 30 min. Added 10 mL of 0.1% formic acid in acetonitrile, vortex for 1 min, and shook for 10 min using platform shaker at 100% speed. After centrifuged at 10000 rpm for 10 min, the upper hexane layer was discarded. The lower extraction liquid was transferred to a new 50 mL centrifuge tube for purification.
The extraction liquid of muscle, liver, kidney and fat was added 10 mL of acetonitrile saturated n-hexane and vortex for about 30 s to mix, let stand for layering. The upper hexane layer was discarded. The lower extraction liquid was added 10 mL of anhydrous ethanol, and removed solvent using a rotary evaporator at 45℃. Then 5 mL of 0.1% formic acid water-acetonitrile was added and vortex for 30 s to dissolve the residue completely. Added 5 mL of n-hexane-saturated acetonitrile to the solution and vortex to mix, let stand for layering. Approximately 1 mL of the lower solution was transferred to a 1.5 mL centrifuge tube and centrifuged at 14000 r/min, 0℃ for 10 min. The clarified middle liquid was filtered with 0.22 μm nylon syringe filters, sealed in autosampler vial and stored at 4℃ for analysis.
2.6. Limit of detection and limit of quantification
Control blank tissue sample homogenate 5 g ± 0.1 g was added 100 μL of 1 μg/mL PMZ-d6 internal standard working solution and 100 μL of mixed standard working solution with concentrations of 0.05 μg/kg, 0.1 μg/kg, 0.5 μg/kg, and 1 μg/kg to prepare quality control samples. After processing by the method described in "2.5", detection was carried out according to the conditions in "2.4", and data analysis was performed using the Analyst 1.6.3 software workstation. The concentration of the sample with a signal-to-noise ratio (S/N) ≥ 3 was taken as the limit of detection (LOD), and the concentration of the sample with S/N ≥ 10 was taken as the limit of quantification (LOQ).
2.7. Calibration curve and linearity
Homogenized blank tissue samples of 5 g ± 0.1 g were taken, and 100 μL of PMZ-d6 internal standard working solution at 1 μg/mL and 100 μL of mixed standard working solution from "2.3" were added separately to obtain spiked samples with PMZ and PMZSO concentrations ranging from 0.1 μg/kg to 50 μg/kg and Nor1PMZ concentration ranging from 0.5 μg/kg to 50 μg/kg. The samples were processed using the method described in "2.5" and analyzed under the conditions specified in "2.4" using the Analyst 1.6.2 software workstation. The calibration curve and correlation coefficient (r) were obtained using a weighted least-squares method with the ratio of the concentration of PMZ, Nor1PMZ, and PMZ-d6 as the abscissa and the peak area ratio of the quantitative ion pairs of PMZ, Nor1PMZ, and PMZ-d6 as the ordinate, with the weight chosen as 1/X2. The calibration curve and correlation coefficient of PMZSO were obtained using a weighted least-squares method with the concentration of PMZSO as the abscissa and the peak area of the PMZSO quantitative ion pair as the ordinate, with the weight chosen as 1/X2. The experiment was repeated in triplicate.
2.8. Recovery and Precision
Homogenized blank tissue samples of 5 g ± 0.1 g were taken, then spiked 100μL of low, medium, and high concentration mixed standard working solutions to obtain spiked tissue samples with compound contents of 0.5 μg/kg, 5 μg/kg, and 50 μg/kg, respectively. Set up 6 parallels for each concentration. Follow the method described in "2.5" and test under the conditions in "2.4". Analyze the data using Analyst 1.6.2 software workstation, and calculate the recovery and relative standard deviation (RSD) of sample determination values. RSD is used to indicate precision. Repeat the experiment for three batches to test intra-day precision.
2.9. Investigation of matrix effects
Homogenized blank tissue samples of 5 g ± 0.1 g were taken, processed using the method described in "2.5" to obtain a sample matrix solution. Then 100 μL of mixed standard working solution from "2.3" was added separately into the sample matrix solution to prepare matrix-matched samples with concentrations of 0.1 μg/kg, 0.5 μg/kg, 1 μg/kg, 5 μg/kg, 10 μg/kg, 20 μg/kg, and 50 μg/kg. The samples were processed and analyzed, and the curve of the matrix-matched samples was obtained. The experiment was repeated in triplicate.
The mixed standard working solution from "2.3" was diluted with methanol to concentrations of 0.1 μg/L, 0.5 μg/L, 1 μg/L, 5 μg/L, 10 μg/L, 20 μg/L, and 50 μg/L, and analyzed under the conditions specified in "2.4", and the curve of the standard working solution was obtained.
Matrix effect refers to the influence of the sample matrix on the determination of the target compound. It is evaluated by comparing the slope of the curve of matrix-matched samples with that of the standard working solution of the same concentration. If ME>0, it indicates matrix enhancement, while if ME<0, it indicates matrix suppression. When 0≤|ME|≤20%, the matrix has low signal interference and can be ignored. When 20%<|ME|<50%, it indicates moderate matrix interference. When |ME|≥50%, it indicates strong matrix interference.
The formula for calculating matrix effect is as follows:
ME: Matrix Effect
Sm: Slope of the curve of matrix-matched samples
Ss: Slope of the curve of standard working solution
2.10. Stability Test
Homogenized 5g±0.1g of blank tissue sample was mixed with a low or high concentration of mixed standard working solution to obtain QC sample. The QC samples with target drug concentrations of 0.5 µg/kg and 50 µg/kg were processed according to the method described in section "2.5". The stability of the samples was evaluated after 30 days of storage at -22℃, 1 week of storage at 4℃, freeze-thaw cycle for 3 times, and 24 hours of exposure to room temperature and light. Three replicates were made for each concentration. The actual measured concentration was compared with the theoretical added concentration, and the deviation between the mean value of each concentration and the theoretical concentration was calculated to observe whether the RSD was within 15%.
3. Results
3.1. Optimization of HPLC-MS/MS Conditions
The Symmetry C18 column (100 mm × 2.1 mm i.d., 3.5 µm) (Waters, USA) was selected as the separation column in this study. Various combinations of mobile phases were tried, such as 0.1% formic acid water-acetonitrile, 0.1% acetic acid water-acetonitrile, 0.2% formic acid water-acetonitrile, and 0.1% formic acid-0.1% acetonitrile. The results showed that the mobile phase system of 0.1% formic acid water-acetonitrile achieved the best response value and retention time effect, as shown in Figure 1.
After optimizing operation parameters, the molecular ions and the product ions of PMZ, PMZSO, Nor1PMZ, and PMZ-d6 in standard working solution, were scanned under appropriate conditions, as shown in Figure 2.
3.2. Selection of Extraction Reagents
Four extraction reagents, namely acetonitrile, 0.1% formic acid in acetonitrile, ethyl acetate-acetonitrile (20/80, v/v), and 1% ammoniated acetonitrile were compared for the actual recovery rates of four analytes in muscle, liver, kidney, and adipose tissue, as shown in Figure 6. The extraction efficiency of 0.1% formic acid in acetonitrile was found to be the best among the four reagents. Therefore, it was decided to use 0.1% formic acid in acetonitrile as the extraction reagent for the four analytes.
3.3. Methodological Validation
Selectivity was assessed by comparing the chromatograms obtained from spiked tis-sues samples and blank tissues samples, after processing and detecting these samples by using the method described in Section 2.5 and Section 2.4. It was shown that no endogenous peak of blank samples, no interference signal was observed in blank samples, at the retention times of each monitored ion of analytes. With the method developed in this study, as described, qualitative and quantitative analysis for PMZ and its metabolites PMZSO, Nor1PMZ were accurate.
Limit of detection (LOD), limit of quantification (LOQ), linear range and linearity were assessed with spiked samples. After processing and detecting the samples using the method described in Section 2.6, LOD and LOQ of PMZ and PMZSO were 0.05μg/kg and 0.1μg/kg, respectively, while the LOD and LOQ of Nor1PMZ were 0.1μg/kg and 0.5μg/kg, respectively. Using the method described in Section 2.7, in the four types of tissues, PMZ and PMZSO showed good linear relationships in the range of 0.1μg/kg to 50μg/kg, while Nor1PMZ showed good linear relationships in the range of 0.5μg/kg to 50μg/kg, with correlation coefficients (r) 0.99. See Table 4 for details.
Recovery and precision were assessed with spiked samples, using the method described in Section 2.8. As shown in Table 5, the recovery rates of PMZ, PMZSO, and Nor1PMZ in muscle ranged from 81.73% to 103.28%, while those in liver ranged from 89.10% to 107.17%, those in kidney ranged from 84.30% to 104.30%, and those in fat ranged from 92.82% to 104.17%. The inter-day and intra-day precision of all tissues were less than 15%, which meets the requirements for residues analysis method.
After processing and detecting the samples using the method described in Section 2.9, matrix effect was shown in Table 6. The matrix effects of the four tissue types are generally negative, indicating matrix suppression effect to the signal of compounds. The matrix effect of the three target compounds in pig fat matrix shows weak matrix interference. The matrix effect to the three target compounds in pig meat and kidney matrix shows moderate matrix interference. The matrix effect to the three target compounds in pig liver matrix shows strong matrix interference. These findings emphasize the need to carefully consider the type of tissue matrix when analyzing analytes, as different matrices can affect the accuracy of the results obtained.
Sample stability was evaluated under the conditions described in Section 2.10. As shown in Table 7, the RSDs of each analyte content in tissue under conditions such as room temperature and light exposure for 24 hours, storage at 4°C for 48 hours, repeated freeze-thawing three times, and long-term storage for one month are generally around ±15%. Therefore, PMZ, PMZSO, and Nor1PMZ in tissue sample are relatively stable in terms of their structure and content under various conditions.
4. Discussion
Thiophene compounds contain amino groups, which dissociate in water and exhibit alkalinity, and may be adsorbed by residual silicon hydroxyl groups on the surface of the chromatographic column stationary phase. To overcome this problem, fully end-capped C18, phenyl, and C8 chromatographic columns are suitable to be selected. The Symmetry C18 column (100 mm × 2.1 mm i.d., 3.5 µm, Waters, USA) was selected for separation in this study. In LC-MS/MS analysis, the choice of mobile phase is crucial for the ionization efficiency and separation of compounds. The ESI+ mode is suitable for alkaline PMZ and its metabolites, while acidic mobile phase systems are prone to form [M+H] + ions. Acetonitrile and water are commonly used mobile phases, and their ratio can be adjusted according to specific needs. Formic acid or acetic acid are commonly used as protonation reagents in LC-MS mobile phase. The effects of adding different proportions of formic acid or acetic acid in mobile phase were compared in this study, and found that acetic acid would increase the baseline of Nor1PMZ representative ion chromatogram, which is not applicable. The retention time and representative ion chromatograms of the analytes obtained by adding 0.1% volume of formic acid in the aqueous phase were the best.
Matrix effects of animal tissues sample may affect accuracy of quantification while analyzing drug content in tissues. The internal standard method is commonly used to correct matrix effects and improve greatly the accuracy and precision of analysis. The in-ternal standard method was reported commonly in determination of PMZ and its metab-olites content. A compound named SKF525A was used as the internal standard for determining thiophenes sedatives as reported [29]. Metronidazole was used as internal standard for quantifying PMZ and PMZSO in rat plasma and various tissues [37]. PMZ-d6 and PMZSO-d6 were reported as internal standards to detect the content of PMZ and PMZSO in pig muscle, liver, and kidney [44]. Donepezil was used to detect drugs, include PMZ, in human plasma and urine [32]. Haloperidol was reported to be used as internal standard to quantify chlorpromazine and PMZ in pig kidneys [22]. And loratadine was used as internal standard when studying PMZ and ephedrine mixture [39]. The PMZ-d6, deuterated isotope of PMZ was employed as the internal standard for quantification in this study. Stability of PMZ-d6 was tested through experiments. The results indicate the response value of internal standard significantly decreased after removing solvent, and exposing in air, at room temperature for a week as long time. Therefore, during the preparation procedure of sample, the evaporation time of extract solvent should be minimized as much as possible. After removed solvent, sample with PMZ-d6 in it should be re-solved with solution and sealed immediately, stored at 4 ℃ wait for testing.
It was found that the recovery of PMZSO was generally significantly high (>120%) while quantified by PMZ-d6 with internal standard method, though the recovery of PMZ and Nor1PMZ was range of 80%-120%. After investigations, it was found that in spiked sample the actual extraction recovery of PMZ, PMZ-d6, and Nor1PMZ all were between 60% and 70%, which were very close. But the actual extraction recovery of PMZSO was above 85%, which was significantly different from the internal standard and other analytes, as shown in Figure 3. That PMZ-d6 is unsuitable for quantification analysis of PMZSO. As a metabolite, PMZSO shows stronger polarity than PMZ, with its chemical property differ from those of PMZ, PMZ-d6 and Nor1PMZ. Finally, the internal standard method was used for quantifying PMZ and Nor1PMZ, and the external standard method was used for quantifying PMZSO.
Based on the chemical property of target analytes in this study and previous reports [34,42,48], some kinds of extraction solvent such as ACN, 0.1% formic acid in ACN, ethyl acetate - ACN (20:80, v/v), and 1% ammoniated ACN were selected to investigate the extraction recovery of analytes in pig tissues. The results showed that using formic acid - acetonitrile had the highest extraction recovery for all analytes, as shown in Figure 3. Considering the extraction efficiency of PMZ, PMZSO, Nor1PMZ, and PMZ-d6 in the samples of four tissues, 0.1% formic acid in ACN was employed as extraction solvent of sample in this study. It was also found that extraction efficiency could be promoted as adding a small amount of acid, but as the volume of formic acid increased, the extraction liquid in the liver and kidney became darker, with more impurities and interfered with the instrument detection. Therefore as extractant, the optimal ratio is 0.1% formic acid in ACN.
Fat sample cause difficulties in sample preparation and detecting procedure with much lipophilic impurity in it. The extracting recovery of analytes in fat is usually very low. Some processes were attempted to improve extraction and purify efficiency in fat sample by many experiments in this study. It was shown that dissolving completely fat sample slurry with n-hexane before extracting analytes, would increase extracting recovery. In the sample concentration and purification process, before and after removing the extraction solvent with rotary evaporator, the rich content of lipophilic impurity in sample solvent could be discarded through extracting with n-hexane. The sample solution was centrifuged at 0 ℃ or lower temperature, which facilitates the separation of lipid interfering sub-stances to the upper layer.
5. Conclusions
A LC-MS/MS method for determination of promethazine and its two metabolites in all edible tissues of swine was developed and validated for the first time. In this method, the extraction solvent of 0.1% formic acid in acetonitrile was to extract the target compounds, and LC-MS/MS was to detect analytes. The limit of quantification is in range of 0.1 μg/kg-0.5 μg/kg, sensitivity meets or exceeds previous reports. Swine fat is included in researching objects and Nor1-PMZ is included in target analytes, for first time in this study. This study presented an accurate and reliable detection method for monitoring the residues of PMZ and its metabolites in swine edible tissues.
Author Contributions
Investigation, D.W., R.S., H.H., R.C., Y.Z. and H.C.; methodology, H.C., D.W., Rong Liu; validation, D.W., R.S., H.H., R.C. and Y.Z.; writing—original draft preparation, D.W. and R.C.; writing—review and editing, H.C.; project administration, H.C.; funding acquisition, H.C.. All authors have read and agreed to the published version of the manuscript.
Funding
This research was funded by FORMULATION AND REVISION OF NATIONAL STANDARDS FOR VETERINARY DRUGS, grant number: Formulation and revision of agricultural industry standards 125C0701.
Data Availability Statement
There is no publicly archived datasets created during the study.
Acknowledgments
The instrument parameters presented in this article were inspired by the master thesis of Ting Peng, Pharmacokinetic and Residue Elimination Study of Promethazine in Sheep.
Conflicts of Interest
The authors declare no conflict of interest.
References
- Liu, Y. Solution Structure of Chlorpromazine Hydrochloride and Promethazine Hydrochloride and Electrochemical Performance of Their Interaction with DNA; Nanjing University of Science and Technology, Nanjing, China, 2007.
- Alyami, H.S.; Ibrahim, M.A.; Alyami, M.H.; Dahmash, E.Z.; Almeanazel, O.T.; Algahtani, T.S.; Alanazi, F.; Alshora, D.H. Formulation of sublingual promethazine hydrochloride tablets for rapid relief of motion sickness. Saudi Pharm. J. 2021, 29, 478–486. [Google Scholar] [CrossRef]
- Wang, J.; Lu, C.; Liu, X.; Zhang, G.; Zhang, J.; Gao, M.; Liu, D.; Zhang, X.; Liu, Y. Histamine H1 receptor antagonist attenuates catecholamine surge and organ injury after severe burns. Front. Endocrinol. 2023, 14, 1068925. [Google Scholar] [CrossRef]
- Gao, Q. Determination of phenothiazine sedatives, neonicotinic insecticides, and amide herbicides in food by LC-MS/MS; Hebei Normal University: Heibei, China, 2016. [Google Scholar]
- Abeysundera, H.; Craig, B.; Pullich, Z. Promethazine-induced delirium with perceptual abnormalities: are we thinking broadly when assessing patients? BMJ case reports 2021, 14, e241784. [Google Scholar]
- Chiappini, S.; Schifano, F.; Corkery, J.M.; Guirguis, A. Beyond the ‘purple drank’: Study of promethazine abuse according to the European Medicines Agency adverse drug reaction reports. J. Psychopharmacol. 2021, 35, 681–692. [Google Scholar] [CrossRef]
- Adie, S.; Ingebrigtson, M.; Hamilton, D.; Tam, M. A case of promethazine-induced polymorphic ventricular tachycardia: conduction down the tankfrom consuming “purple drank”. J. Am. Coll. Cardiol. 2021, 77, 1870. [Google Scholar] [CrossRef]
- Ignoto, S.; Pecoraro, R.; Scalisi, E.M.; Buttigè, S.E.; Contino, M.; Ferruggia, G.; Salvaggio, A.; Brundo, M.V. Acute Toxicity of a Marine Emerging Pollutant (Promethazine Hydrochloride) on Artemia sp. ACS Omega 2022, 7, 39619–39623. [Google Scholar] [CrossRef]
- Zhou, Y.; Hua, X. The hazard and status quo of veterinary drug residues in animal derived food in China. Grain Oil 2021, 34, 18–20. [Google Scholar]
- Bornschein, I.; Pfeifer, S. Biotransformation of promethazine (Prothazin). Die Pharmazie 1979, 34, 750. [Google Scholar] [PubMed]
- Bornschein, I.; Pfeifer, S. Further sulfone metabolites of promethazine (Prothazin). Die Pharmazie 1980, 35, 648–649. [Google Scholar] [PubMed]
- Ramanathan, R.; Geary, R.S.; Bourne, D.W.; Putcha, L. Bioavailability of intranasal promethazine dosage forms in dogs. Pharmacol. Res. 1998, 38, 35–39. [Google Scholar] [CrossRef] [PubMed]
- Gao, B.L.; Liu, J.; Dong, L.X.; Zhang, L.; Qin, J.H.; Wang, J.P. Broad specific enzyme-linked immunosorbent assay for determination of residual phenothiazine drugs in swine tissues. Anal. Biochem. 2014, 454, 7–13. [Google Scholar] [CrossRef] [PubMed]
- Shi, F.S.; Liu, J.; Zhang, L.; Liu, J.X.; Wang, J.P. Development of an enzyme linked immunosorbent assay for the determination of phenothiazine drugs in meat and animal feeds. J. Environ. Sci. Health Part B 2016, 51, 715–721. [Google Scholar] [CrossRef] [PubMed]
- WU; Y; Xing, L. ; XU; Y Determination of promethazine and its metabolite in urine by solid——phase extraction with celite and UV derivative spectrophotometry. Chinese Journal of Forensic Medicine 1986. [Google Scholar]
- Zhang, S.R.; Yang, J.D. Simultaneous Determination of Chlorpromazine Hydrochloride and Promethazine Hydrochloride by Resonance Rayleigh Scattering Spectra. J. Instrum. Anal 2009, 12, 1362–1367. [Google Scholar]
- Yang, Q.Y.S.Z.L.W.Q.Z.J. Simultaneous determination of chlorpromazine hydrochloride and promethazine hydrochloride using near-infrared spectroscopy. Journal of Analytical Sciences 2013, 29, 61–64. [Google Scholar]
- Raja, D.A.; Shah, M.R.; Malik, M.I. Polyethyleneimine stabilized silver nanoparticles as an efficient and selective colorimetric assay for promethazine. Anal. Chim. Acta 2022, 1223, 340216. [Google Scholar] [CrossRef] [PubMed]
- Li, X.; Yang, Y.; Zhou, K. Simultaneous determination of chlorpromazine and promethazine and their main metabolites by capillary electrophoresis with electrochemiluminescence. Chinese Journal of Chromatography 2012, 30, 938–942. [Google Scholar] [CrossRef] [PubMed]
- Wang, L.; Yang, X.; Mo, J. Determination of epinephrine, chlorpromazine and promethazine by capillary electrophoresis with scanning voltammetric detector. Chinese Journal of Chromatography 1999, 17, 435–437. [Google Scholar]
- Vanapalli, S.R.; Kambhampati, S.P.; Putcha, L.; Bourne, D.W. A liquid chromatographic method for the simultaneous determination of promethazine and three of its metabolites in plasma using electrochemical and UV detectors. J. Chromatogr. Sci. 2001, 39, 70–72. [Google Scholar] [CrossRef]
- Chen, S.F.L.H.Z.Y.P. Establishment of detection method for chlorpromazine and promethazine residues in swine kidney. Chinese Journal of Veterinary Medicine 2005, 416, 412–413. [Google Scholar]
- Hui-Qin, W.; Yong-Chun, J.; Ming-Zha, C.; Xiao-Lao, H.; Zhi-Xin, Z. Simultaneous determination of 10 mental drugs by gas chromatography-mass spectrometry. Chinese Journal of Analytical Chemistry 2007, 35, 500–504. [Google Scholar]
- Liu, K.H.D.Z.H.L.C.L.L.L.X. Analysis of promethazine and its metabolites in rat urine by GC-MS. Journal of Instrument Analysis 2010, 220–225. [Google Scholar]
- Cheng, L.; Zhang, Y.; Shen, J.; Wu, C.; Zhang, S. GC–MS Method for Simultaneous Determination of Four Sedative Hypnotic Residues in Swine Tissues. Chromatographia 2009, 71, 155–158. [Google Scholar] [CrossRef]
- Tapadia, K.; Shrivas, K.; Upadhyay, L.S.B. GC–MS Coupled with Hollow-Fiber Drop-to-Drop Solvent Microextraction for Determination of Antidepressants Drugs in Human Blood Sample. Chromatographia 2011, 74, 437–442. [Google Scholar] [CrossRef]
- Wang, W.L.D.L.H.S.M.M.L. ASE-GC /MS analysis of common sedative hypnotic drugs in blood. Chinese Journal of Forensic Medicine 2014, 451–454. [Google Scholar]
- Wen-hai, L.I.; Xiu-yun, L.I.; Da-wei, L.I.N.; Hong-lei, S.U.N.; Kai, S.H.A.O. Analysis of Five Hypnotic Sedative Drugs in Blood by Gas Chromatography-Mass Spectrometry with Supported Liquid Extraction. Analysis And Testing Technology And Instruments 2018, 24, 34–38. [Google Scholar]
- Zhao, S.R.D. Determination of Four Sedative-hypnotic Drugs with GC/MS for a Case of Abnormal Death. Forensic Science and Technology 2020, 45, 545–547. [Google Scholar]
- Rosenberger, W.; Teske, J.; Klintschar, M.; Dziadosz, M. Detection of pharmaceuticals in “Dirty Sprite” using gas chromatography and mass spectrometry. Drug Test. Anal. 2021. [Google Scholar] [CrossRef]
- Liang, Q.; Qu, J.; Luo, G.; Wang, Y. Rapid and reliable determination of illegal adulterant in herbal medicines and dietary supplements by LC/MS/MS. J. Pharm. Biomed. Anal. 2006, 40, 305–311. [Google Scholar] [CrossRef] [PubMed]
- Liu, P.; Liang, S.; Wang, B.-J.; Guo, R.-C. Development and validation of a sensitive LC-MS method for the determination of Promethazine hydrochloride in human plasma and urine. Eur. J. Drug Metab. Pharmacokinet. 2009, 34, 177–184. [Google Scholar] [CrossRef] [PubMed]
- Suo, D.C. , et al. Simultaneous Determination of Seven Mental Drugs in Feeds by Liquid Chromatography-Tandem Mass Spectrometry. Chinese Journal of Analytical Chemistry 2010, 38, 1023–1026. [Google Scholar]
- Li, C.L.Z.Y.F.Z.H.H.R.H.L. Study on the Determination of Phenothiazide Residues in Aquatic Products by Liquid Chromatography Tandem Mass Spectrometry. Chinese Journal of Veterinary Medicine 2010, 392, 384–387. [Google Scholar]
- He, L.; Wang, J.; Zhang, G.; Liu, R.; Fang, B. Simultaneous Determination of Tranquilizers and Carazolol Residues in Swine Tissues by Liquid Chromatography-Tandem Mass Spectrometry. Anal. Lett. 2012, 45, 1377–1389. [Google Scholar] [CrossRef]
- Suo, D.C.; et al. Simultaneous Determination of beta-Agonists Psychiatric Drugs in Feeds by, L.C.-M.S.-M.S. Journal of Chromatographic Science 2014, 52, 604–608. [Google Scholar] [CrossRef] [PubMed]
- Liang, L. Application of Physiologically Based Pharmacokinetic Models for Assessing the Disposition of Promethazine in Simulated Weightless Rats; The Fourth Military Medical University: Xi'an, China, 2015. [Google Scholar]
- Cheng, L.; Shen, J.; Zhang, Q.; Zhang, Y.; Zhang, S. Simultaneous Determination of Three Tranquillizers in Lamb Liver by Ultra-Performance Liquid Chromatography–Tandem Mass Spectrometry. Food Anal. Methods 2014, 8, 1876–1882. [Google Scholar] [CrossRef]
- Li, L.G.Z.Z.L.W.Y.D.Y. Pharmacokinetic study of promethazine ephedrine combination in rats under the simulated microgravity condition. Journal of Beijing University of Technology 2018, 38, 216–220. [Google Scholar]
- Gao, S.; Zhou, X.; Lang, L.; Liu, H.; Li, J.; Li, H.; Wei, S.; Wang, D.; Xu, Z.; Cai, H.; et al. Simultaneous Determination of Schisandrin and Promethazine with Its Metabolite in Rat Plasma by HPLC-MS/MS and Its Application to a Pharmacokinetic Study. Int. J. Anal. Chem. 2019, 2019, 1–13. [Google Scholar] [CrossRef]
- Proença, P.; Monteiro, C.; Mustra, C.; Claro, A.; Franco, J.; Corte-Real, F. Identification and Quantification of Antipsychotics in Blood Samples by LC–MS-MS: Case Reports and Data from Three Years of Routine Analysis. J. Anal. Toxicol. 2020, 44, 915–922. [Google Scholar] [CrossRef]
- Chen, J.W.J.Y.X.W.S.Z.Q. Determination of 15 sedative drug residues in livestock and poultry meat by ultra-high performance liquid chromatography tandem mass spectrometry. Farm Products Processing 2020, 45–49. [Google Scholar]
- Fan, L. , et al. Development, validation, and application of a simple UPLC-MS/MS method for simultaneous quantification of five traditional antipsychotics in human plasma. Biomedical Chromatography 2021, 35. [Google Scholar] [CrossRef]
- Chen, X.; Zhou, J.; Jin, M. Determination of 4 chlorpromazine and promethazine and their metabolites in swine tissues by liquid chromatography-tandem mass spectrometry with isotope internal standard dilution technique. Journal of hygiene research 2022, 51, 476–482. [Google Scholar] [CrossRef] [PubMed]
- Chen, X.; Zhou, J.; Jin, M. Determination of 4 chlorpromazine and promethazine and their metabolites in swine tissues by liquid chromatography-tandem mass spectrometry with isotope internal standard dilution technique. Journal of hygiene research 2022, 51, 476–482. [Google Scholar] [CrossRef] [PubMed]
- Qi, L.; Duan, L.-M.; Sun, X.-H.; Zhang, J.; Zhang, Z.-Q. Simultaneous determination of three banned psychiatric drugs in pig feed and tissue using solid-phase reactor on-line oxidizing and HPLC-fluorescence detection. Biomed. Chromatogr. 2015, 29, 1535–1540. [Google Scholar] [CrossRef]
- Cunha, R.R. , et al. Fast determination of codeine, orphenadrine, promethazine, scopolamine, tramadol, and paracetamol in pharmaceutical formulations by capillary electrophoresis (vol 44, pg 1815, 2017). Journal of Separation Science 2021, 44, 3727. [Google Scholar]
- Huang, M.; Gao, J.-Y.; Zhai, Z.-G.; Liang, Q.-L.; Wang, Y.-M.; Bai, Y.-Q.; Luo, G.-A. An HPLC–ESI-MS method for simultaneous determination of fourteen metabolites of promethazine and caffeine and its application to pharmacokinetic study of the combination therapy against motion sickness. J. Pharm. Biomed. Anal. 2012, 62, 119–128. [Google Scholar] [CrossRef]
Figure 1.
Mass chromatogram of the characteristic ions of the analytes at 0.1% formic acid water-acetonitrile mobile phase system.
Figure 1.
Mass chromatogram of the characteristic ions of the analytes at 0.1% formic acid water-acetonitrile mobile phase system.
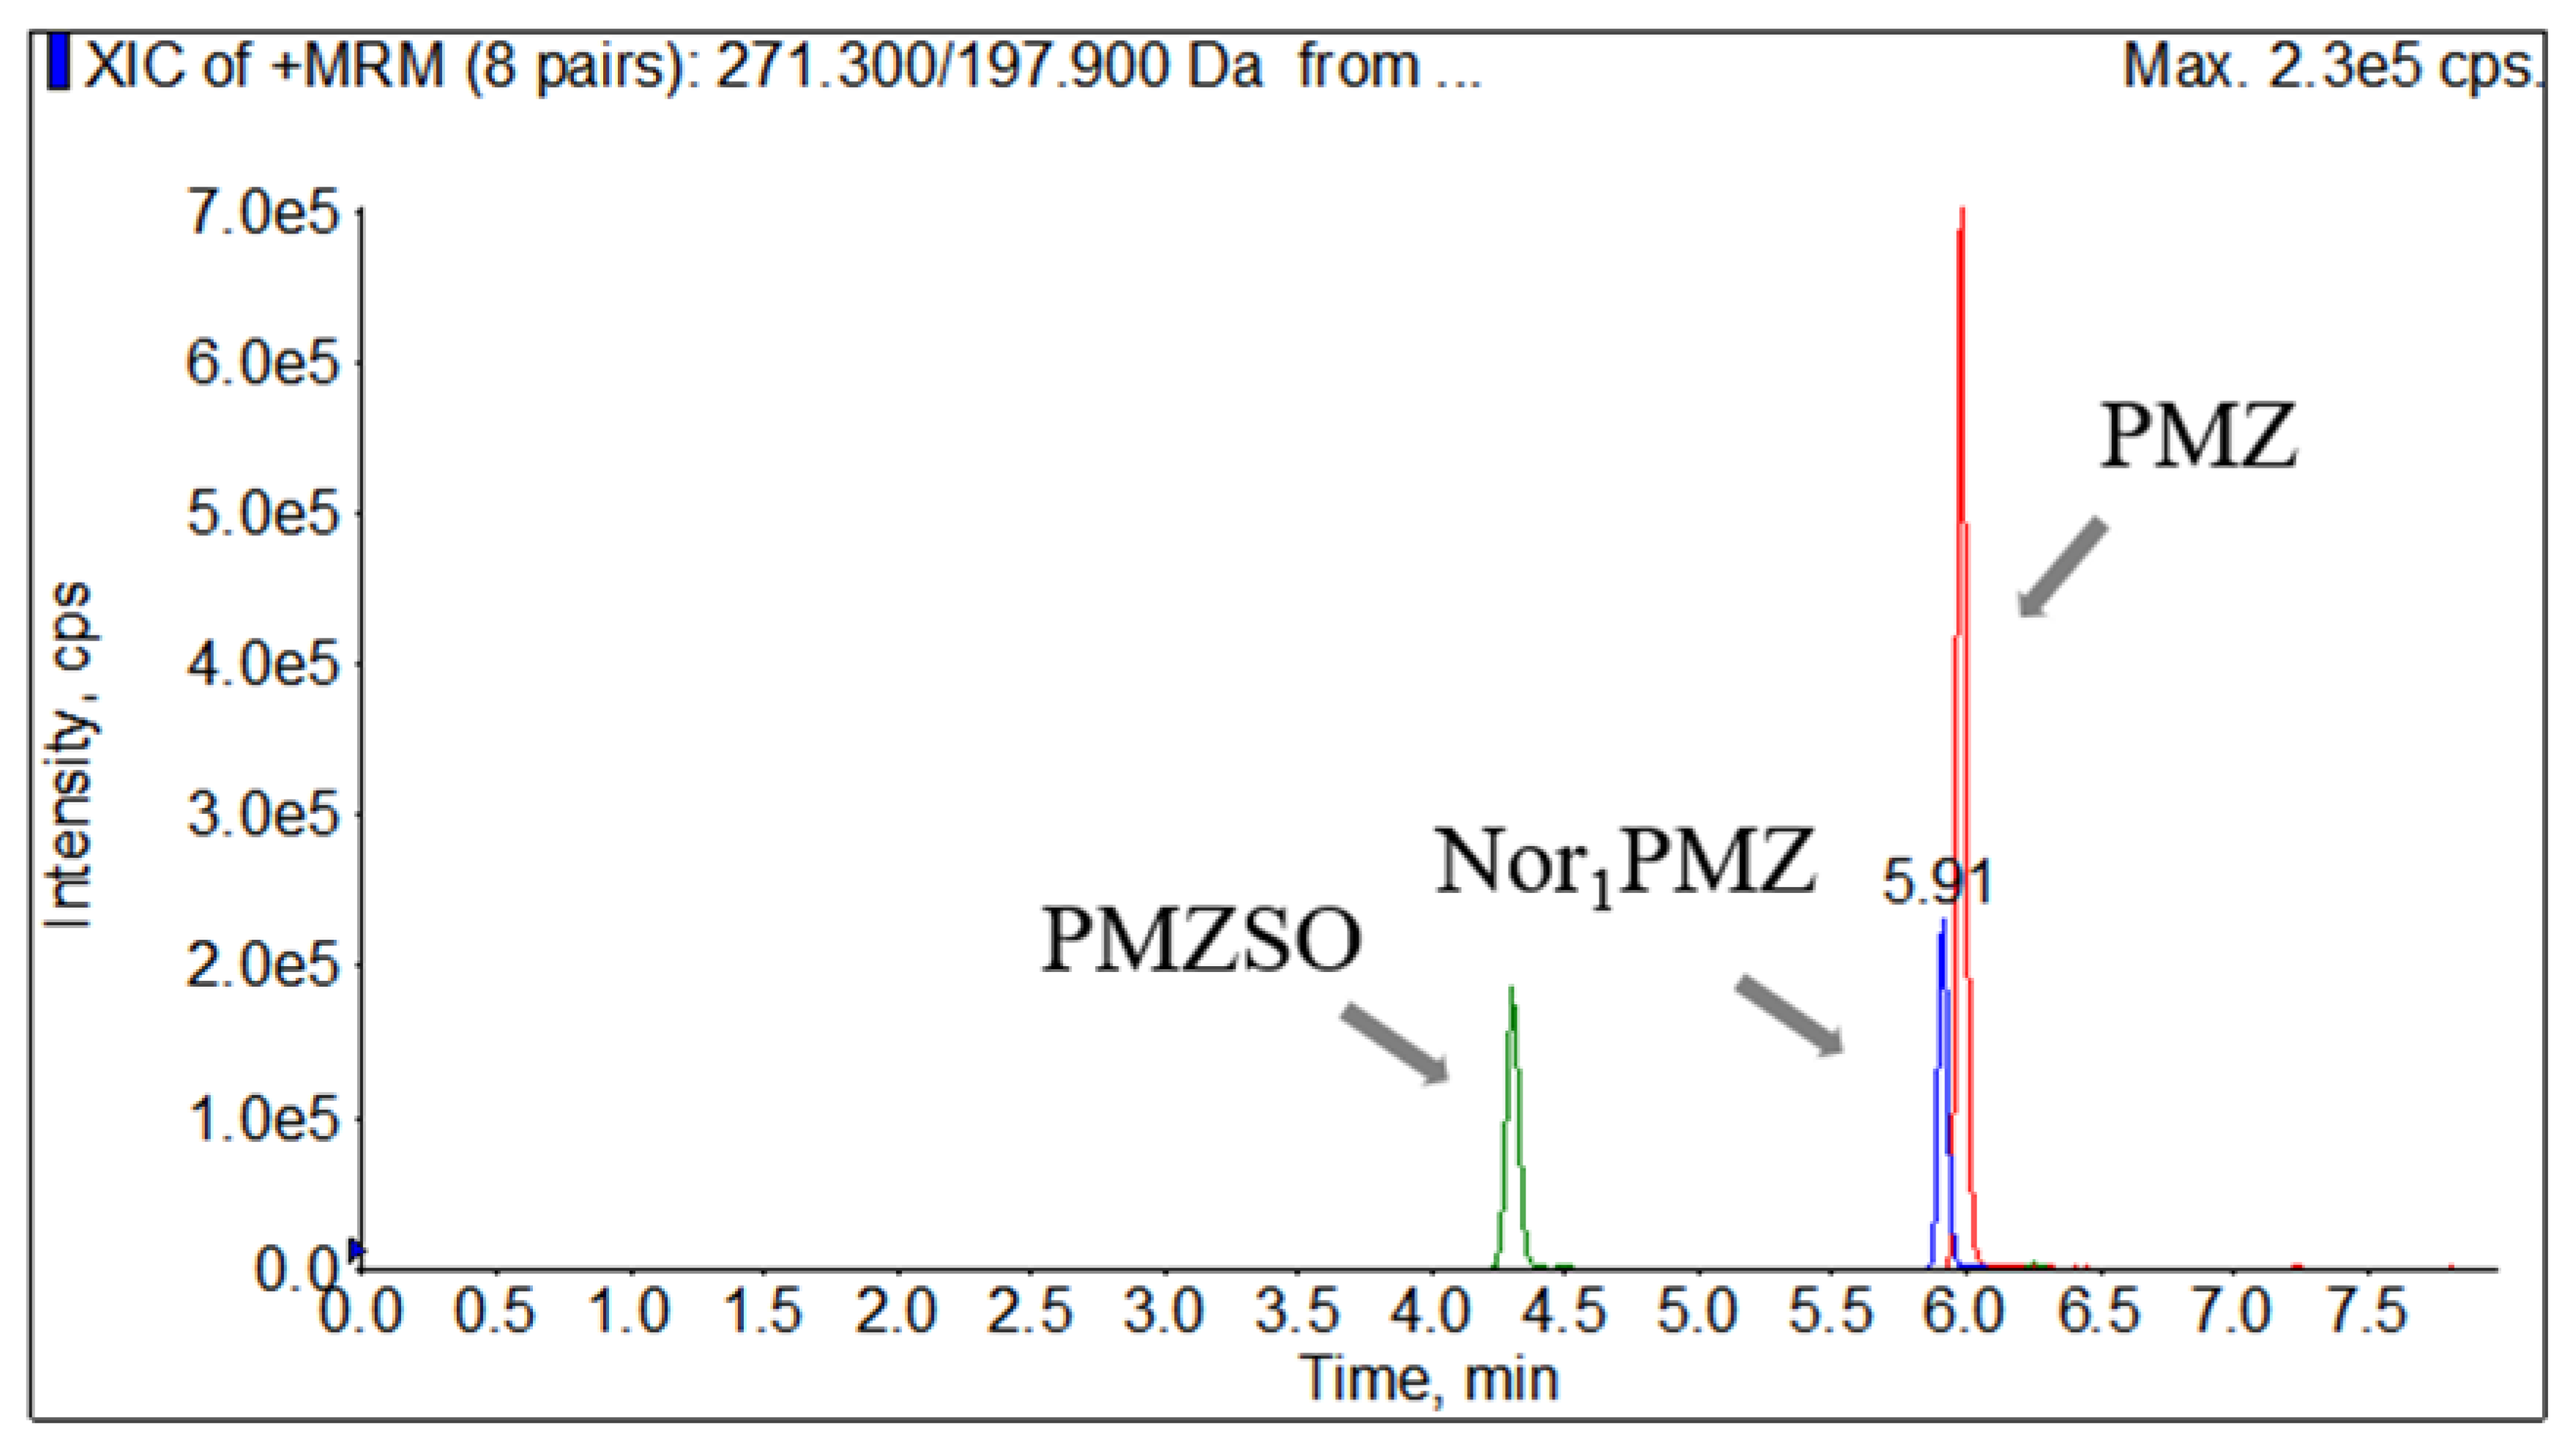
Figure 2.
Representative MRM chromatograms of the precursor ions and main product ions of analytes and internal standard in standard working solution, (a) for PMZ, (b) PMZ-d6, (c) PMZSO and (d) Nor1PMZ.
Figure 2.
Representative MRM chromatograms of the precursor ions and main product ions of analytes and internal standard in standard working solution, (a) for PMZ, (b) PMZ-d6, (c) PMZSO and (d) Nor1PMZ.
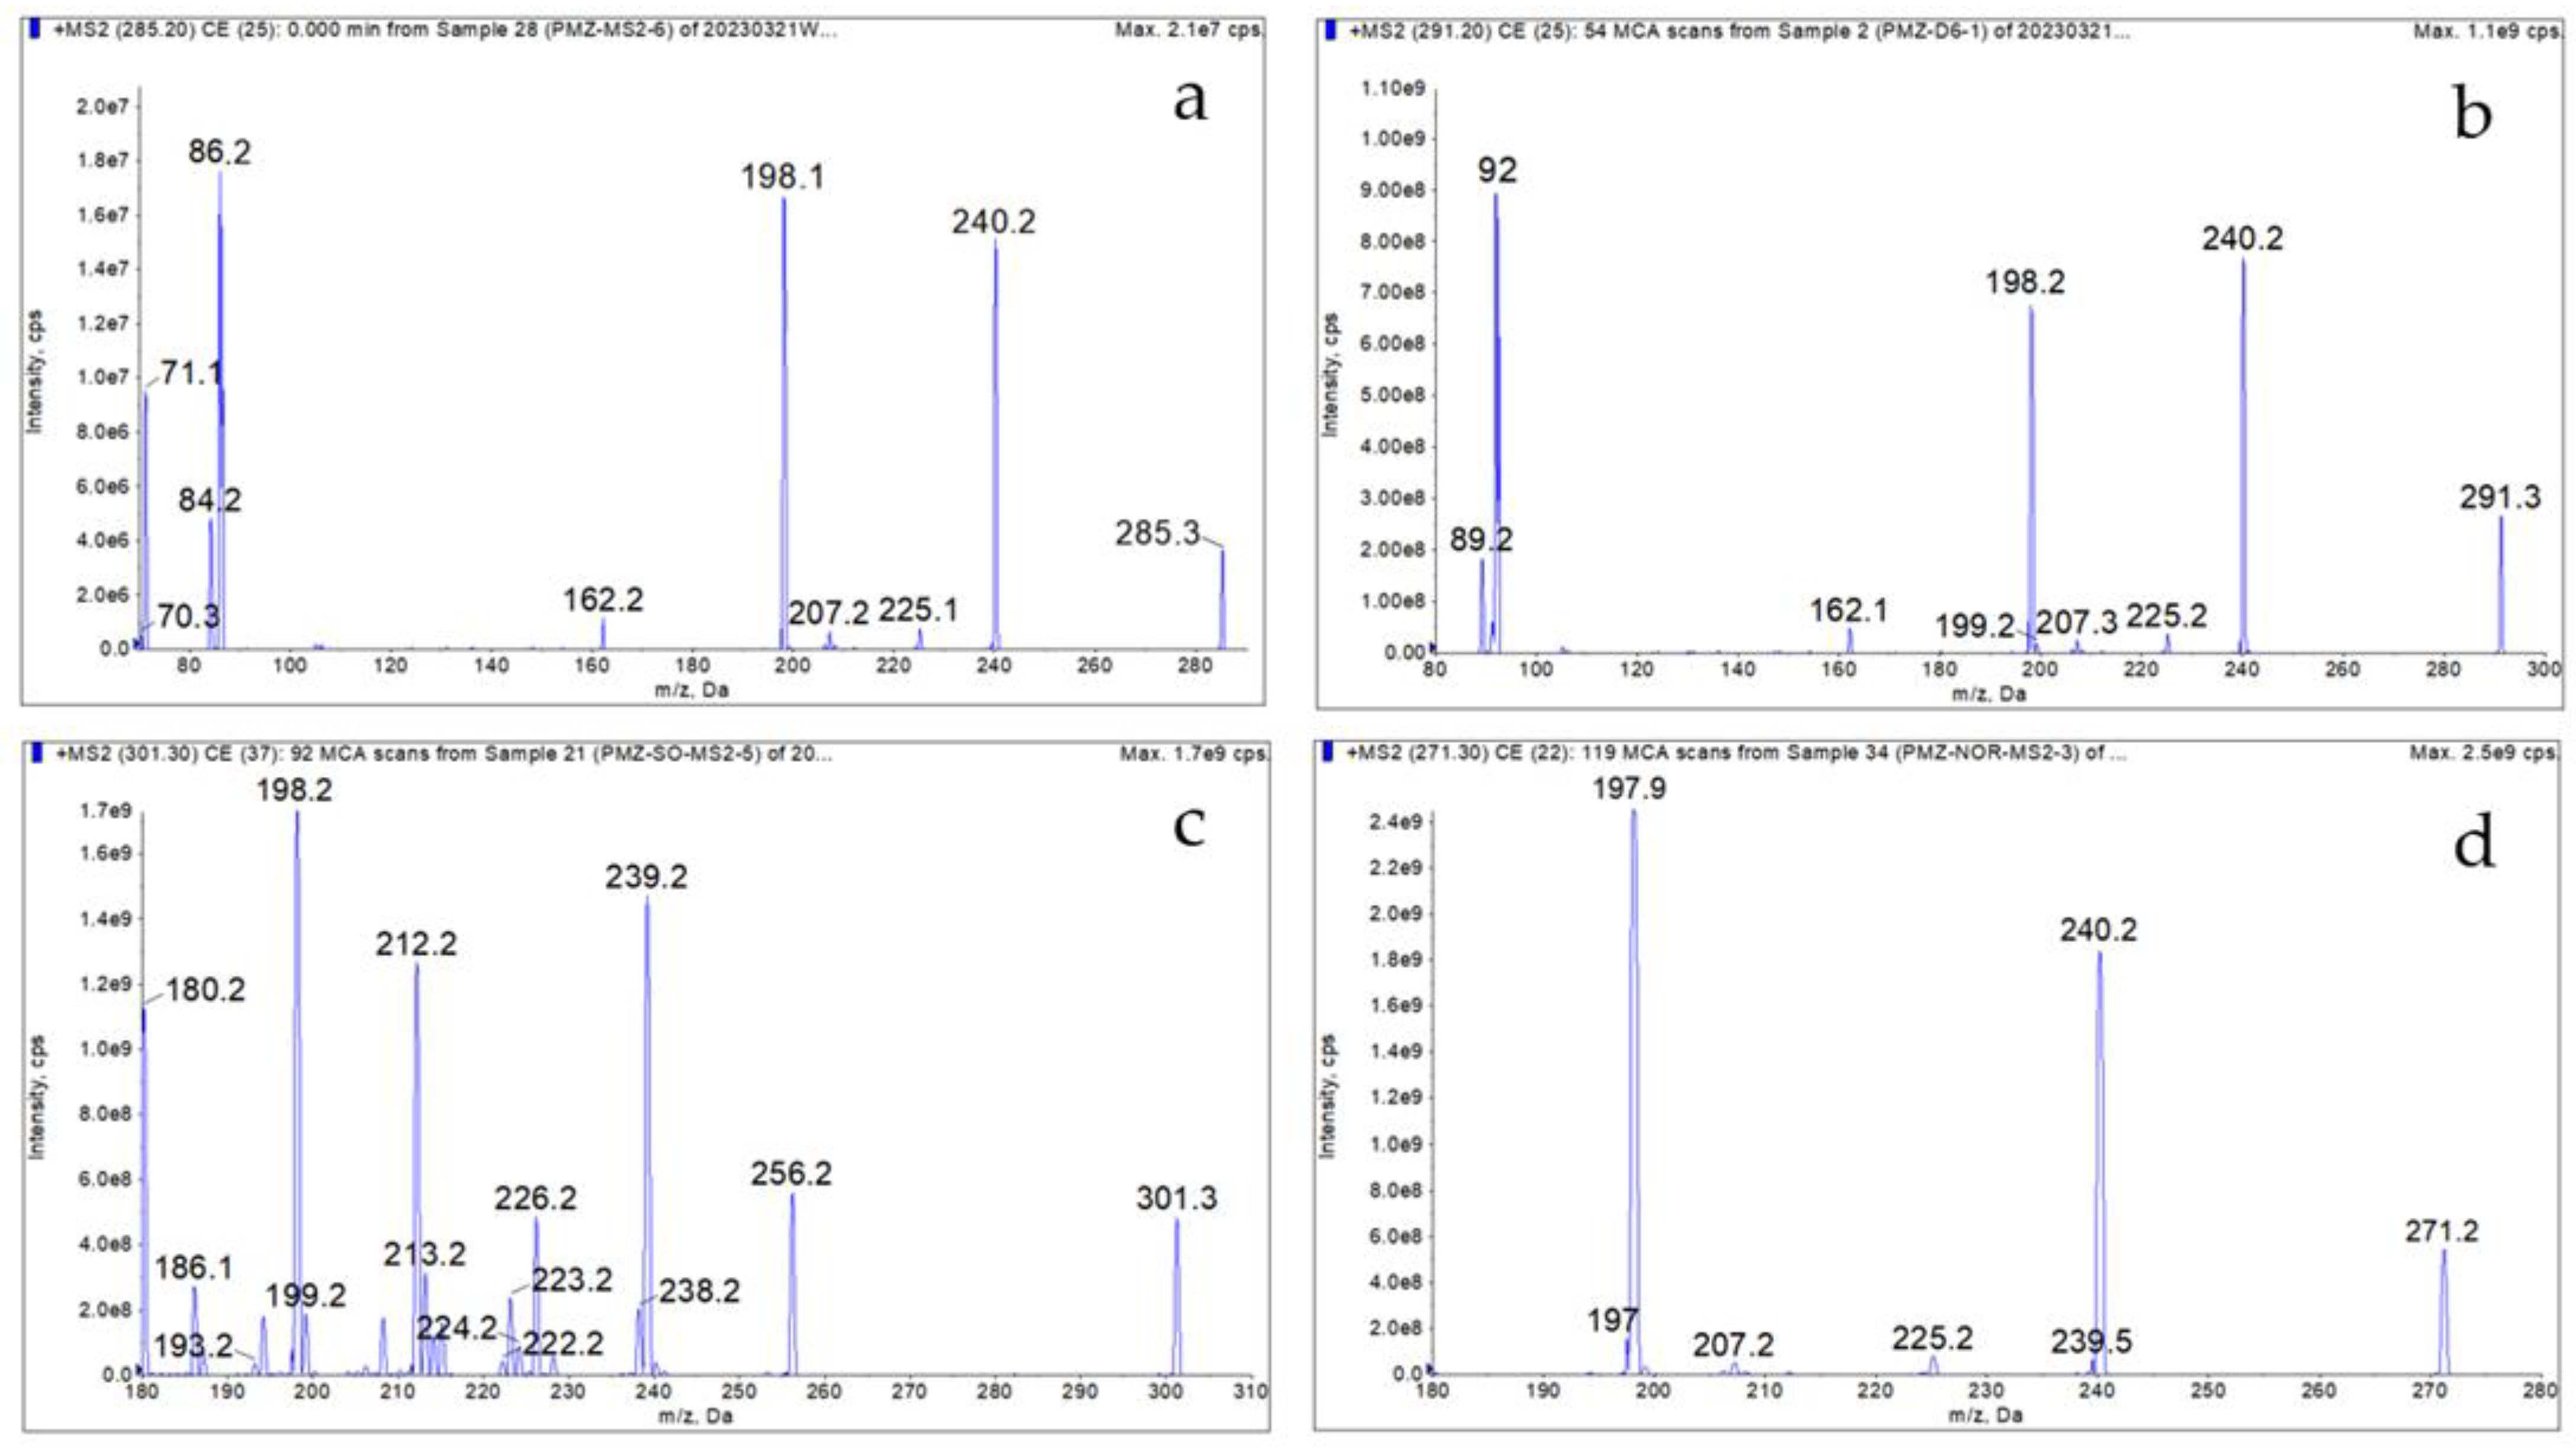
Figure 3.
Actual recovery rates of the analytes in four tissues in different extraction reagents.
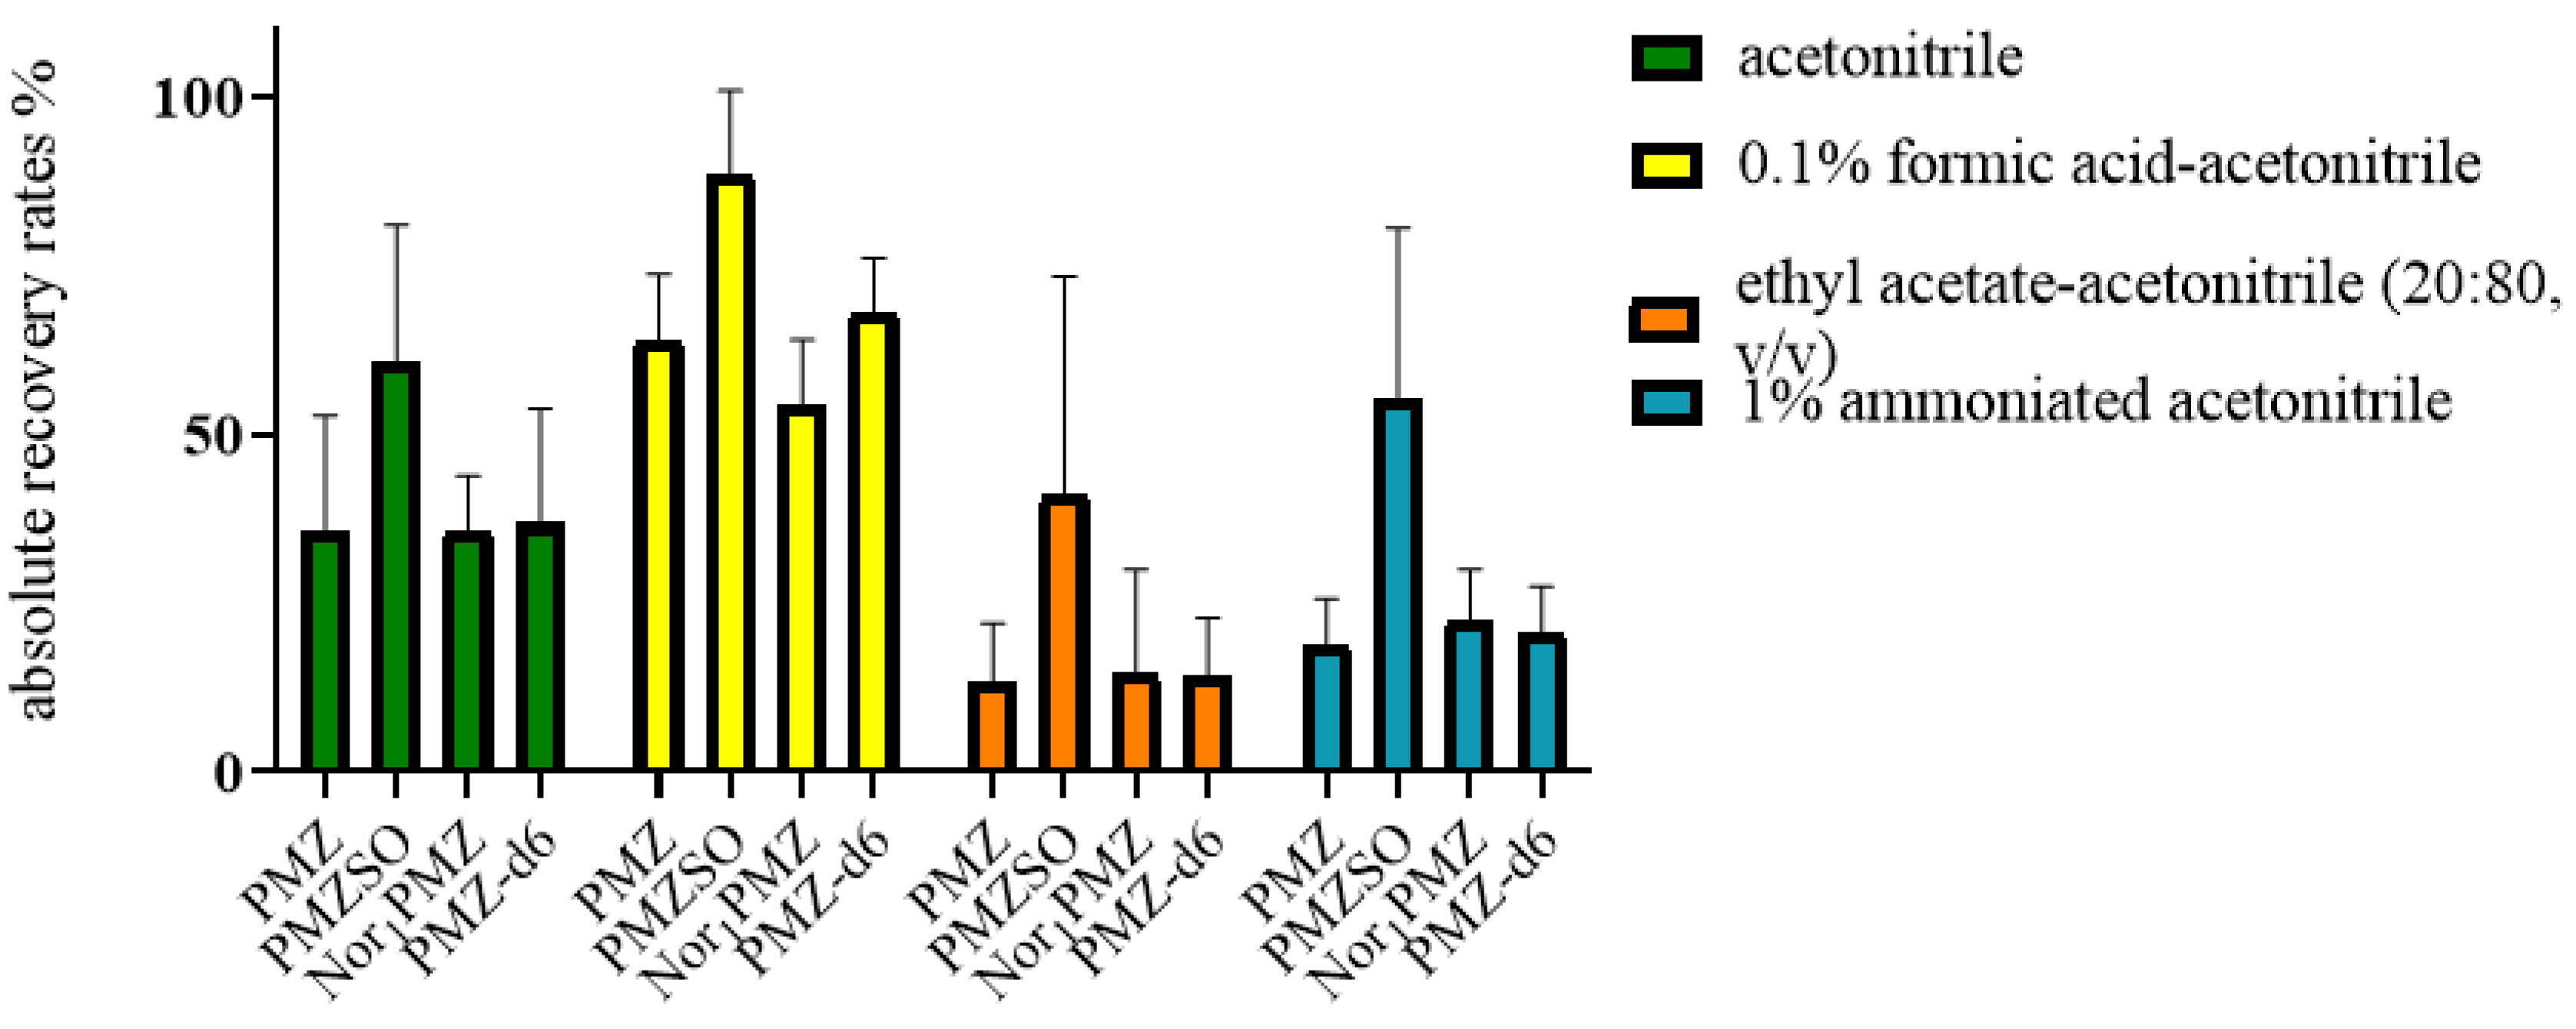

Table 1.
Gradient Program.
| Time | Phase B(%) | Phase A(%) | Flow rate(μL/min) |
|---|---|---|---|
| 1.5 | 10 | 90 | 300 |
| 6.7 | 50 | 50 | 300 |
| 7.0 | 10 | 90 | 300 |
| 8 | 10 | 90 | 300 |
Table 2.
Operating Parameters for Mass Spectrometer.
| Parameter | Condition |
|---|---|
| The source temperature, TEM | 550℃ |
| Collision Gas, CAD | 8psi |
| Curtain gas, CUR | 40psi |
| Nebulizer gas1, GS1 | 55psi |
| Ionspray, IS | 5500V |
| Sheath gas (N2) flow | 25 arbitrary units |
| Entrance Potential,EP | 10V |
| Collision Cell Exit Potertial,CXP | 18V |
| Ion source gas2, GS2 | 55psi |
| Dwell time, DT | 50ms |
Table 3.
Qualitative and Quantitative Ion Pairs, Declustering Voltage, Collision Energy for Analytes and Internal Standard.
Table 3.
Qualitative and Quantitative Ion Pairs, Declustering Voltage, Collision Energy for Analytes and Internal Standard.
| Analyte | Precursor ion (m/z) | Product ions (m/z) | Declustering Voltage (v) | Collision Energies (eV) | Retention time (min) |
|---|---|---|---|---|---|
| PMZ | 285.2 | 86.2*/198.1 | 60 | 25/33 | 5.99 |
| PMZSO | 301.3 | 198.2*/239.1 | 60 | 51/31 | 4.30 |
| Nor1PMZ | 271.3 | 197.3*/240.3 | 60 | 35/20 | 5.91 |
| PMZ-d6 | 291.3 | 92*/240.1 | 60 | 27/20 | 5.99 |
Note: The sub ions marked with "*" are the quantification ions.
Table 4.
Linear equations, correlation coefficient (r), limit of detection (LOD) and limit of quantification (LOQ) of PMZ and its two metabolites.
Table 4.
Linear equations, correlation coefficient (r), limit of detection (LOD) and limit of quantification (LOQ) of PMZ and its two metabolites.
| Tissues | Analyte | Linear Range | Regression Equation* | r | LOD(μg/kg) | LOQ(μg/kg) |
|---|---|---|---|---|---|---|
| Muscle | PMZ | 0.1-50μg/kg | Y=2.43x-0.0116 | 0.9993 | 0.05 | 0.1 |
| PMZSO | Y=1.49x+0.00797 | 0.9977 | ||||
| Nor1PMZ | 0.5-50μg/kg | Y=1.19x-0.00557 | 0.9993 | 0.1 | 0.5 | |
| Liver | PMZ | 0.1-50μg/kg | Y=2.82-0.062 | 0.9992 | 0.05 | 0.1 |
| PMZSO | Y=2.79x+0.0583 | 0.9992 | ||||
| Nor1PMZ | 0.5-50μg/kg | Y=1.19x-0.0316 | 0.9996 | 0.1 | 0.5 | |
| Kidney | PMZ | 0.1-50μg/kg | Y=2.22x+0.0125 | 0.9997 | 0.05 | 0.1 |
| PMZSO | Y=1.53x+0.022 | 0.9972 | ||||
| Nor1PMZ | 0.5-50μg/kg | Y=0.812x+0.00942 | 0.9988 | 0.1 | 0.5 | |
| Fat | PMZ | 0.1-50μg/kg | Y=1.38x+0.0595 | 0.9990 | 0.05 | 0.1 |
| PMZSO | Y=0.583x+0.0102 | 0.9996 | ||||
| Nor1PMZ | Y=0.926x+0000146 | 0.9985 |
*Y: peak area of analyte, x: concentration of analyte.
Table 5.
Recovery and precision of spiked blank samples (n = 6).
| Tissues | Analyte | Concentration(μg/kg) | Recovery(%) | SD(%) | Inter-day RSD(%) | Intra-day RSD(%) | |
|---|---|---|---|---|---|---|---|
| Spiked | Found | ||||||
| Muscle | PMZ | 0.1 | 0.082 | 81.73 | 9.12 | 11.16 | 9.86 |
| 5 | 4.72 | 94.47 | 4.51 | 4.78 | 5.12 | ||
| 50 | 50.08 | 100.27 | 3.84 | 3.83 | 6.12 | ||
| PMZSO | 0.1 | 0.099 | 99.22 | 10.31 | 10.39 | 8.26 | |
| 5 | 5.17 | 103.28 | 7.97 | 7.72 | 7.62 | ||
| 50 | 45.23 | 90.45 | 2.99 | 3.30 | 3.49 | ||
| Nor1PMZ | 0.5 | 0.47 | 94.33 | 8.84 | 9.37 | 10.01 | |
| 5 | 5.04 | 100.73 | 4.97 | 4.93 | 5.53 | ||
| 50 | 53.70 | 107.43 | 6.39 | 5.95 | 9.27 | ||
| Liver | PMZ | 0.1 | 0.097 | 96.72 | 6.09 | 6.29 | 8.42 |
| 5 | 5.37 | 107.17 | 2.48 | 2.32 | 10.42 | ||
| 50 | 44.53 | 89.10 | 3.87 | 4.35 | 4.84 | ||
| PMZSO | 0.1 | 0.98 | 97.52 | 7.88 | 8.08 | 7.58 | |
| 5 | 4.54 | 90.72 | 4.96 | 5.46 | 6.89 | ||
| 50 | 52.20 | 104.33 | 1.86 | 1.78 | 5.10 | ||
| Nor1PMZ | 0.5 | 0.47 | 94.17 | 6.01 | 6.38 | 7.47 | |
| 5 | 4.93 | 98.50 | 6.85 | 6.95 | 7.76 | ||
| 50 | 50.4 | 100.88 | 3.60 | 3.57 | 4.59 | ||
| Kidney | PMZ | 0.1 | 0.094 | 94.36 | 7.33 | 7.76 | 6.70 |
| 5 | 4.22 | 84.30 | 3.63 | 4.30 | 5.45 | ||
| 50 | 45.43 | 90.83 | 1.68 | 1.84 | 4.02 | ||
| PMZSO | 0.1 | 0.097 | 97.07 | 6.56 | 6.76 | 9.14 | |
| 5 | 5.10 | 101.95 | 3.11 | 3.05 | 4.55 | ||
| 50 | 45.47 | 90.90 | 2.19 | 2.04 | 4.58 | ||
| Nor1PMZ | 0.5 | 0.50 | 99.15 | 5.35 | 5.39 | 8.62 | |
| 5 | 5.22 | 104.30 | 6.13 | 5.88 | 7.86 | ||
| 50 | 49.70 | 99.32 | 2.69 | 2.71 | 6.32 | ||
| Fat | PMZ | 0.1 | 0.096 | 96.13 | 9.16 | 9.53 | 7.63 |
| 5 | 5.20 | 104.05 | 3.30 | 3.17 | 4.12 | ||
| 50 | 50.33 | 100.53 | 5.67 | 5.64 | 6.40 | ||
| PMZSO | 0.1 | 0.095 | 94.73 | 8.52 | 8.99 | 9.07 | |
| 5 | 4.89 | 97.85 | 5.20 | 4.22 | 7.73 | ||
| 50 | 46.4 | 92.82 | 2.99 | 3.23 | 4.79 | ||
| Nor1PMZ | 0.1 | 0.10 | 100.46 | 9.91 | 9.86 | 9.68 | |
| 5 | 5.22 | 104.17 | 7.68 | 7.37 | 6.37 | ||
| 50 | 49.38 | 98.73 | 4.93 | 4.99 | 7.53 | ||
Table 6.
Matrix effects (%) of PMZ and its metabolites in four tissue types (n = 3).
| Matrix | PMZ | SD(%) | PMZSO | SD(%) | Nor1PMZ | SD(%) |
|---|---|---|---|---|---|---|
| Muscle | -34.15 | 1.52 | -24.94 | 2.05 | -36.05 | 1.05 |
| Liver | -56.68 | 0.86 | -50.77 | 2.27 | -49.15 | 1.01 |
| Kidney | -19.75 | 1.91 | -27.55 | 2.76 | -22.96 | 2.71 |
| Fat | -9.14 | 1.63 | 5.14 | 1.65 | -0.14 | 1.86 |
Table 7.
Stability investigation of target compounds in various tissues, RSDs (n = 3).
| Analyte | Tissues | Liver | Kidney | Fat | Muscle | ||||
|---|---|---|---|---|---|---|---|---|---|
| Spiked (µg/kg) | 0.5 | 50 | 0.5 | 50 | 0.5 | 50 | 0.5 | 50 | |
| Content detected of PMZ after treated | Room temperature and light for 24 h | 9.06 | 9.54 | 5.71 | 9.54 | 4.21 | 5.44 | 8.68 | 4.68 |
| Stored at 4℃ for 48 h | 5.96 | 6.68 | 8.70 | 6.81 | 7.27 | 7.32 | 8.23 | 4.92 | |
| Stored at -22℃ for 30 days | 11.80 | 13.47 | 15.06 | 13.47 | 5.15 | 6.72 | 11.98 | 8.11 | |
| Repeated freeze-thawing 3 times | 5.75 | 8.34 | 7.73 | 8.34 | 7.79 | 5.69 | 7.72 | 9.87 | |
| Content detected of PMZSO after treated | Room temperature and light for 24 h | 9.66 | 9.69 | 6.43 | 5.86 | 5.92 | 7.63 | 10.42 | 6.05 |
| Stored at 4℃ for 48 h | 10.68 | 8.23 | 6.12 | 3.59 | 7.84 | 6.67 | 7.28 | 3.96 | |
| Stored at -22℃ for 30 days | 11.71 | 9.64 | 11.89 | 10.56 | 8.85 | 8.95 | 12.86 | 13.62 | |
| Repeated freeze-thawing 3 times | 9.58 | 11.88 | 6.66 | 14.79 | 5.52 | 8.44 | 8.48 | 13.99 | |
| Content detected of Nor1PMZ after treated | Room temperature and light for 24 h | 9.12 | 8.09 | 8.76 | 4.50 | 3.78 | 6.38 | 8.17 | 7.25 |
| Stored at 4℃ for 48 h | 11.06 | 9.14 | 7.77 | 7.44 | 6.12 | 2.30 | 7.34 | 2.06 | |
| Stored at -22℃ for 30 days | 10.19 | 12.55 | 13.48 | 11.21 | 14.19 | 10.44 | 12.16 | 13.83 | |
| Repeated freeze-thawing 3 times | 13.48 | 6.70 | 7.45 | 10.04 | 6.64 | 7.24 | 7.20 | 11.85 | |
Disclaimer/Publisher’s Note: The statements, opinions and data contained in all publications are solely those of the individual author(s) and contributor(s) and not of MDPI and/or the editor(s). MDPI and/or the editor(s) disclaim responsibility for any injury to people or property resulting from any ideas, methods, instructions or products referred to in the content. |
© 2023 by the authors. Licensee MDPI, Basel, Switzerland. This article is an open access article distributed under the terms and conditions of the Creative Commons Attribution (CC BY) license (http://creativecommons.org/licenses/by/4.0/).
Copyright: This open access article is published under a Creative Commons CC BY 4.0 license, which permit the free download, distribution, and reuse, provided that the author and preprint are cited in any reuse.


