
Submitted:
26 April 2023
Posted:
27 April 2023
You are already at the latest version
Abstract
Automatic and real-time pose estimation is important in monitoring animal behavior, health and welfare. In this paper, we utilized pose estimation for monitoring farrowing process to prevent piglet mortality and preserve the health and welfare of sow. State-of-the-art Deep Learning (DL) methods have lately been used for animal pose estimation. The aim of this paper was to probe the generalization ability of five common DL networks (ResNet50, ResNet101, MobileNet, EfficientNet and DLCRNet) for sow and piglet pose estimation. These architectures predict body parts of several piglets and the sow directly from input video sequences. Real farrowing data from a commercial farm was used for training and validation of the proposed networks. The experimental results demonstrated that MobileNet was able to detect seven body parts of the sow with median test error of 0.61 pixels.
Keywords:
deep learning
; convolutional neural networks
; livestock
; pose estimation
; animal behavior
1. Introduction
Worldwide, pork production is expected to increase tremendously within the next decades [1,2] which will challenge the economic sustainability of pig producers and the welfare and health of the animals [3]. The challenge is to meet both the growing animal health demands as well as growing pork demands without exploitation of the environment [4]. Further, farmers need to enhance animal health in order to not only increase revenue but also to decrease the use of medication such as antibiotics, and secure meat quality for the consumer. Unfortunately, the more intense the production the more challenging it is to preserve animal health and welfare. For instance, highly productive sows have longer farrowing durations, higher risk for puerperal disease, e.g., PostPartum Dysgalactia Syndrome (PPDS), and shorter longevity, and their litters are at higher risk of disease and mortality [5,6,7]. In order to reduce these diseases of sows and mortality of piglets, farmers would need sufficient time for monitoring the parturition of these animals. In real life, because the profit margin per individual animal is low, the available time for farm workers to attend parturition of individual sows and their litters is insufficient, which makes it more difficult to monitor and manage parturition correctly [1]. This is concerning for both the health and welfare of the animals as well as economics of the pig producers. Piglets dying before weaning can result in a economic losses between €12 and €23 per litter [5]. The economic losses caused by PPDS can reach between €300 and €470 per affected sow [5]. Therefore, intensive pig production with a high number of piglet-producing sows, high litter size, and long parturition are of economic, welfare and environmental concern. Farmers need to manage an increasingly demanding situation in balancing production costs and loss of revenues against financial returns. It is important to provide tools and support for pig farmers to produce pork sustainably and profitably, and to meet welfare demands at the same time [3].
Assessing the behavior of livestock is important because it is a cheap and non-invasive way to get information about animal health and welfare [1]. However, manual monitoring, documentation and assessment of animal behavior is difficult and inefficient because of the large number of animals and time-depend physiological changes in behavior around parturition [8,9]. Therefore, reliable technologies to assist farmers in continuous monitoring and interpretation of the health of individual animals are needed in future pig production [10]. Precision livestock farming (PLF) is used to optimize farming processes and reduce human workload [11]. PLF provides possibilities for the farmers to monitor individual animals despite the increase in the number of animals per farm [10]. According to [1,2], PLF will help farmers in continuous monitoring of their animals which will improve their health and welfare at any given time. As mentioned above, parturition is a critical event in pig production when it comes to improving survival and health of the animals as well as economics and sustainability of the producers. Several different PLF tools are now available which can be used at parturition to replace the farmer’s eyes and ears in monitoring individual animals [1,2,10]. Therefore, PLF is an excellent alternative to human observation in the monitoring of animal behavior around parturition.
Automatic intelligent monitoring systems provide an efficient way to continuously analysis animal behavior in order to detect anomalies and enhance the animal care. Animal behavior can be monitored with wearable sensors such as radio-frequency identification ear tags [12], Global Positioning System (GPS) [13] and Inertial Measurement Unit (IMU) [14]. However, the major drawback of using these sensors is installation and maintenance for each animal which bothers both human operators and animals. Therefore, sensors attached to the animal can disrupt normal behavior of the animal and can malfunction because they can get broken or contaminated due to laying of moving of the animal inside the farrowing pen [8]. Video-based monitoring systems are used as a practical and convenient solution to address this problem. As the systems use single or multiple cameras to capture images, they are also cost-effective due to cheaper hardware. Therefore, analysis of videos based on computer vision is currently considered as the best alternative because of a robust and non-contact sensor that allows for continuous monitoring and analyzing of animal behavior [8].
Pose Estimation (PE) plays a key role in intelligent systems for measuring behavior. It predicts the position of body parts of an animal and extracts information for different inspection purposes such as animal feeding [15], drinking [16], animal interaction [17], and tracking of movement [18]. In recent years, deep learning techniques such as Convolutional Neural Networks (CNNs) has made huge progress and has been used for pose estimation [19], object detection [20], image classification [21], and face recognition [22]. Moreover, CNN-based models have been used in pig pose estimation [23,24]. In spite of fact that the proposed CNN-based models could show good performance finding correlations and eventually the condition of animals, it is still a challenging task because of lack of clean background, light changes, and object deformation. Further, for predicting multiple animal positions, overcrowded scenes are problematic because occlusion occurs when several animals are too close and apparently combine with each other. In [25], we proposed a ResNet50 [26] model for the pose estimation of individual pigs in environments where several pigs are present in one pen. We got the results on an open source data and we annotated 2000 images of pigs from different locations and light conditions. As we found the ability the open-source toolbox in [25], DeepLabCut [27], for the pig pose estimation, we used the same toolbox here for developing pose estimation methods on our collected data.
In this paper, we propose a CNN-based pose estimation method to predict piglets and body parts of piglets in a sequence of images (video) without markers. A total of seven key points were manually annotated in each image for the location of left ront and hind leg, the right front and hind leg, shoulder, tail and snout of the sow. For the piglets, we only annotated the shoulder. We investigated the performance of five popular deep networks including ResNet50, ResNet101, MobileNet, EfficientNet and DLCRNet for pose estimation of sow and piglet(s). To our best knowledge, this is the first study using pose estimation for both sow and piglets during the farrowing process using DeepLabCut.
The remainder of the paper is organized as follows. Section 2 discusses some of the most important related works. The proposed DL-based pose estimation methods are described in Section 3 followed by the experimental setup in Section 4 and experimental results in Section 5. Finally, conclusion is presented in Section 6.
2. Related Work
Deep learning for pose estimation: Pose Estimation (PE) methods are categorized into two separated groups: 2D and 3D [28]. 2D spatial position of desired points are computed from the digital videos or images. 3D singular-object PE methods have potential to obtain 3D pose annotations of a animal or human body. Estimating a 2D singular-object position is much easier because advanced lab environments is needed to have a 3D version of body key points. The 2D PE methods are classified into single-object and multi-object. The single-object PE is applied when there is only a single object in the input image. Single-object PE methods can be classified into regression-based and heatmap-based. Figure 1 shows the framework of these two types of methods. Regression-based methods (Figure 1(a)) apply DL-based pose regressor to learn a mapping from an input image to body key points for generating joint coordinates [29]. Heatmap-based methods (Figure 1(b)) focused on estimating the probability of the existing key points in each pixel of an input image [30]. Therefore, the key body points will not directly detected from an input image.
Estimating poses for multi animals can be more difficult as it needs to understand the number of animals, recognize and group the key points of each animal and explore the position of each key point belonging to one animal. The multi-object PE can be classified into bottom-up methods and top-down methods [28]. In bottom-up methods (Figure 2(a)), first all key points of each animal body parts are detected. After that, poses of the animals are generated by grouping all parts belonging to distinct animals. In [25], the possibility of using DeepLabCut has been investigated for pig pose estimation task and a bottom-up method has been used. In top-down methods (Figure 2(a)), animals are first detected by using animal detectors to obtain bounding box of each animal. Then, single-animal pose estimators are employed for each bounding boxes to produce multi-animal poses. In [31], an advanced multi-person pose estimation framework using a top-down method has been proposed. The calculating time in top-down methods depends on the number of objects. Furthermore, the speed of estimating animal poses in bottom-up method is faster than in top-down method as there is no need to separately detect poses for each animal. Hence, the Bottom-up method is used in this paper to predict key points and estimate pig poses.
Sow Pose estimation: In order to prevent piglet mortality and preserve the health and welfare of the dam, monitoring of maternal behavior if highly important. This can be evaluated by monitoring the duration of postures, e.g., lateral and sternal recumbency, sitting and standing, and the frequency of posture changes [9]. In [32], the authors review the use of 2D and 3D imaging systems in identifying pig behaviours. Further, [33] reviewed the use of smart technology in animal farming, and [11] published a review on validated PLF technologies used in pig production for assessment of animal welfare. This review identified different sensor types, including cameras, that were used for monitoring activity and posture-related behavior in pigs [11]. Further, several research papers have been published about the use of camera technologies for monitoring different types of active and/or passive behavior, e.g., lying, standing, sitting and kneeling, as well as for transitions between these behavioral postures [34,35,36]. Also some studies about animal tracking in a multi-pig environment have been published [37,38,39,40,41,42]. Out of these publications, only a few have focused on monitoring posture and postural change of sows [8,43,44,45] and tracking of individual piglets [38] in a farrowing and lactation pen. Also a multi-pig trajectory tracking model based on DeepLabCut was described, but only in younger growing pigs [42]. Images were collected from either crated sows [38,43,45] or loose-housed sows [8,44] either before farrowing [46], during farrowing [38] or during lactation [8,43,44,45]. In these studies, either a 2D RGB-camera [38,44,46] or 3D Kinetic camera [8,43,45] was used. Most of the studies used MATLAB for image-processing and algorithm development [43,44,45]. However, MATLAB does not have all possibilities of a pose estimation tool such as DeepLabCut. In [46], an open source-tool Ybat was used for image annotations (Bounding Boxes) and YOLOv3 [47] for object detection algorithm. In [8], they applied a Faster R-CNN [48] to identify five postures and obtain accurate location of sows in loose pens. In [44], they recognize sow behaviors based on recognition of lateral recumbency, udder identification and piglet prediction at the udder from depth images. In [45], authors proposed an image processing algorithm for characterizing sow and piglet behavior from a depth imaging system.
3. An Overview of Proposed Deep Networks
In this section, we review five well-known CNN-based networks which have been studied in this paper for pose estimation.
3.1. ResNet
ResNet or Residual Network is a supervised, feed-forward deep neural network model [26]. It uses layers as learning activation functions which reference to the input layers, instead of using learning functions without any reference. In other words, it allows to establish and train neural networks consisting of a large number (even thousands) layers with a low percentage of training error. Due to the structure of ResNet, it is able to tackle the vanishing gradient problem [49] caused by the activation function during training network with gradient-based learning methods. A block of a ResNet network including two convolutional layers is shown in Figure 3, where x is entered as an input to a first convolution layer with the residual function , and x simultaneously is added to the output of second convolution layer to pass to next blocks.
3.2. MobileNet
MobileNet is a particular family of CNNs with the capability of applying into mobile, internet connected devices, and embedded systems in order to do computer vision tasks like object detection, face detection, and logo or text recognition [50]. Furthermore, it increasingly been used in the field of pose estimation, for instance, model [51] which is created based on the MobileNet architecture has been proposed to estimate human poses. MobileNet model is constructed to be utilized in mobile applications because of its small model size (low number of parameters) and because they are less complex compared to other models as fewer multiplications and additions are used in this kind of model. Therefore, the mentioned features help to have more accuracy, less needed memory, and minor time consumption [52]. Regarding to MobileNet structure, it is observed that a standard convolution layer has not been used in its skeleton, and it uses depthwise separable convolutions [52], which notably decrease the number of parameters. The computing process in depth-wise separable convolutions is performed by depth-wise and point-wise convolution. First, a filter is applied to each input channel by depth-wise convolution. A point-wise convolution layer then combines all output from the depth-wise convolution by applying a 1*1 convolution. In other words, the depth-wise convolution uses two separated layers for both filtering and combining processes, and this is exactly the difference between MobileNet and a standard CNN (see Figure 4).
3.3. EfficientNet
Scaling up convolutional network is a common way to get better accuracy on bench-marking datasets and to improve model quality. For instance, ResNet200 has achieved better accuracy than ResNet18 by just adding more layers [53]. The problem is that most of techniques (width-wise, depth-wise, and image resolution) used for scaling up convolutional network are picked randomly. As a consequence, the process of scaling up requires manual tuning and it is time-consuming. EfficientNet [54] is a impressive and easy scaling technique which help to scale up any CNN model more systematically to address the problem mentioned above. As shown in Figure 5, to construct EfficientNet, each scaling technique from width-wise to resolution scaling has been studied in [54] and they have noticed that balancing three dimensions (width, depth, and image resolution) with fixed set of coefficient affected model’s performance positively.
3.4. DLCRNet
There are some cases of DL-based architectures used in computer vision tasks, in which they can not show great performances. For instance, when these methods face digital images including objects of variable size and scale or when they have to perform visual task at pixel level. In these circumstances, deep learning-based techniques such as Faster-RCNN and YOLO are unsuccessful since visual features from small areas vanish during convolutional and pooling processes. One of solutions that is recently used in animal PE to extract features in any resolutions and scales is to employ a CNN-based multi-scale network architectures where the information from high resolution feature maps (small scale) integrates with information from low resolution feature maps (large scale) by neural networks [55,56]. In general, multi-scale network architectures are classified into three groups: multi-column network [57], skip-net [58] and multi-scale input [59]. In the multi-column network shown in Figure 6(a), input data are fed into various columns. The output data of each parallel column are then interconnected as the final output. In Figure 6(b), the skip-net connects low-scale features with a large-scale output. Thus, features of distinct scales are composed and fed into an output layer. In the multi-scale input method illustrated in Figure 6(c), the input images are divided into several scales. DLCRNet [27] is a multi-scale input architecture, and the input of this model is the fusion of both low- and high-resolution feature maps. This ability of DLCRNet method reducing missing keypoints and helps the PE system to recognize keypoints of animal bodies in each scale-level [56].
4. Experimental Setup
In this section, we first explain our dataset. Then, we present implementation details for the evaluation of the proposed pose estimation networks.
4.1. DataSet
Data was collected on a private family piggery located at Oripää (Finland) during 4-6.2021. The videos were recorded by three 5Mpixel IP cameras (HDBW5541R-ASE-0280B, Dahua, China) with 2.8 mm lens (102°x71° FOV), which were attached to a water supplying pipes on the height about 2 meters above the floor of free farrowing pens (Figure 7). The cameras were connected to a PC (16Gb, AMD Ryzen 7) with a video recording software (BlueIris) and farrowing were recorded and files stored on an external 4TB memory disk (Seagate).
Totally, video of 16 farrowings were recorded. The videos were saved starting two hours before the farrowing till 5 hours after the end of the farrowing. This time period is the most critical for preventing piglet mortality and preserving the health of the sow. The recording duration per farrowing was 12 to 32 hours, totalling 310 hours. Video ware recorded in different lighting conditions: from day light with direct sun light passing through windows till twilight with only red light from the infrared light in the piglet nest. In this study, we selected 856 frames generated from the recorded videos to represent different time points of the farrowing process and different light conditions. Each image consists of a sow and different number of piglets. The maximum number of piglets in an image was 18. Hence, totally maximum 19 objects were in an image including sow. We manually annotated each piglet and 7 different body parts of the sow.annotated 1 and 7 body parts of piglet and sow, respectively. The body parts of interest of the sow were the shoulder, left leg, right leg, left hoof, right hoof, tail and snout. For piglet, we only annotated the shoulder as there is not too much pixels in the image that belong to the piglet. Figure 8 shows an example image from our dataset and the annotation points.
4.2. Implementation Details
DeepLabCut toolbox (version 2.2.2) [27] has been used for body part pose estimation. DeepLabCut consists of a markerless technique that are invented to extract detailed human and animal poses without using any marker in locations with dynamic background. We evaluated five networks including ResNet-50, ResNet-101, MobileNet, EfficientNet and DLCRNet which are explained in Section 3. We trained all networks with 60000 number of training iterations with batch size 8. Adam [61] is used as an optimizer in all networks.
We used a random split to divide the dataset. 80% of the dataset served for training and the other 20% served for testing. Further, we used image augmentation to generate more images in order to create a robust and accurate model. For this purpose, we augmented the training dataset with random transformation including blur, image rotation, flip, crops and contrast change. An example image with different augmentation methods is illustrated in Figure 9.
5. Experimental Results
We computed the error and the root mean square error for evaluation of the performance of the five proposed networks. In addition, the score and location refinement maps are also computed for further analysing the results. Finally, the result of body part detection are illustrated for five networks on three images from test dataset.
5.1. Root Mean Squared Error (RMSE)
We calculated the RMSE between the location of the detected point and the reference point in pixels for each frame and keypoint in the test dataset. Figure 10(a) shows RMSE of sow’s body parts for the five proposed networks. The results show that all networks performed well for body part detection. The minimum RMSE belongs to the shoulder part of the sow. In DLCRNet, RMSE was 0.39, 0.95, 0.93, 0.89, 0.89, 0.48 and 0.77 pixels for shoulder, left leg, right leg, left hoof, right hoof, tail and snout, respectively. The median test errors of ResNet-50, ResNet-101, MobileNet, EfficientNet and DLCRNet were 0.93, 0.97, 0.61, 0.87 and 0.89, respectively. Therefore, the performance of MobileNet is better than other models.
We also obtained the RMSE for the one annotated body part of the piglets (shoulder). Figure 10(b) illustrates this result for the five networks in test dataset. It shows that the minimum error was achieved by MobileNet. However, values of RMSE for piglet’s shoulder in all networks are very similar.
5.2. Error
Error was used to evaluate the distance in pixels between the manual labels and the predicted ones for both training and test dataset. We also calculated this value with a defined parameter that is called "p-cutoff". The value of this parameter is set to 0.6, meaning that predictions with a likelihood of < 0.6 will be displayed as uncertain predictions. So "train error with p-cutoff" means how often the training data did not reach the p-cutoff. Table 1 shows these error values for all networks. The results show that ResNet101 got the minimum train error compared to other networks. However, the minimum test error was achieved by MobileNet. The minimum test and train error with p-cutoff were obtained from MobileNet and ResNet101, respectively.
5.3. Score and Location Refinement Maps
Score and location refinement maps were calculated based on ground truth data of annotated keypoints. Score maps show the probability that a keypoint occurs at a particular location. Location refinement maps predict offsets to mitigate quantization errors due to downsampled score maps [27,62]. From the result in Figure 11 and Figure 12, these maps can easily attend to any category of image and correctly identify the selected area. For instance, the red areas have higher attention scores as shown in Figure 12. In summary, all small piglets are detected in three images especially the one that is close to the pen’s wall (top right of images).
5.4. Qualitative Results
Figure 13 demonstrates three test dataset examples for each proposed networks. Dots represent the manual annotations whereas ’+’ represent the high confidence predictions. In Figure 13, the distance between the labeled (dots) and the predicted body parts (‘+’) is small. The same color code in Figure 8 is assumed for body parts in this image. The results show that these models can perform pose estimation with high accuracy (good generalization). However, there are a few false detections.
6. Conclusions
We predicted different body parts of the sow and piglets during farrowing. We investigated the performance of five deep learning-based networks for pose estimation. The obtained results on our collected data set show that the proposed methods can predict the body parts of both sow and piglet(s) efficiently. The developed method can be used to monitor and estimate the pose of the sow and her piglets during the parturition. Therefore, it can be used to reduce unnecessary disturbance of the animals which will most likely improve the welfare and health of the animals as well as economics and profitability of pig farmers. In addition, this work will lead from routine to evidence-based parturition management which will have an additional positive effect on piglet survival and health of the sow.
For future work, we will gather more input videos by using different sensors. For instance, by fusing lidar and infrared camera data, we may be able to get a more robust system which can monitor during different light conditions, especially at nighttime. Further, based on the pose estimation information, we plan to classify the behavior of the sow into sitting, lying, standing and walking. We will also define sudden changes in the posture of the sow, e.g., rolling. Tracking the piglets in space and time will allow to recognize, e.g., isolation of single piglets and synchronisation of piglet behavior within the litter.
Author Contributions
Fahimeh.F and Farshad.F conceived and designed the methodology; performed the experiments; analyzed the data; wrote the paper. S.B, V.B and M.P collected the data; analyzed the data; writing–review and editing. J.H. supervised the study and reviewed this paper. All authors have read and agreed to the published version of the manuscript.
Funding
This study was funded by the Finnish Ministry of Agriculture (grant decision 529/03.01.02/2018) and further financially supported by Vetcare Oy, Hankkija Oy, and the Finnish Veterinary Foundation
Acknowledgments
The authors wish to acknowledge CSC – IT Center for Science, Finland, for computational resources. Further, we would like to thank the owners of the private family farm in Oripää/Finland: Petri Matintalo and Karin Dahl.
Conflicts of Interest
Computational resources were provided by CSC-IT Center for Science Ltd., Espoo, Finland.
References
- Berckmans, D. Precision livestock farming technologies for welfare management in intensive livestock systems. Rev Sci Tech 2014, 33, 189–96. [Google Scholar] [CrossRef] [PubMed]
- Berckmans, D. General introduction to precision livestock farming. Animal Frontiers 2017, 7, 6–11. [Google Scholar] [CrossRef]
- Malak-Rawlikowska, A.; Gębska, M.; Hoste, R.; Leeb, C.; Montanari, C.; Wallace, M.; de Roest, K. Developing a Methodology for Aggregated Assessment of the Economic Sustainability of Pig Farms. Energies 2021, 14. [Google Scholar] [CrossRef]
- Kemp, B., D. S.C..S.N.M. Recent advances in pig reproduction: Focus on impact of genetic selection for female fertility. Reproduction in domestic animals = Zuchthygiene, 2018, 33, 28–36. [Google Scholar] [CrossRef]
- iemi JK, Bergman P, O. S.S.A.M.L.; M, H. Modeling the costs of postpartum dysgalactia syndrome and locomotory disorders on sow productivity and replacement. Frontiers in Veterinary Science 2017, 4. [Google Scholar] [CrossRef]
- Baxter, E.; Edwards, S. Piglet mortality and morbidity: Inevitable or unacceptable? In Advances in Pig Welfare; Spinka, M., Ed.; Elsevier: Netherlands, 2018; Elsevier: Netherlands, 2018; pp. 73–100. [Google Scholar] [CrossRef]
- Oliviero, C.; Junnikkala, S.; Peltoniemi, O. The challenge of large litters on the immune system of the sow and the piglets. Reproduction in Domestic Animals 2019, 54, 12–21. [Google Scholar] [CrossRef] [PubMed]
- Zheng, C.; Zhu, X.; Yang, X.; Wang, L.; Tu, S.; Xue, Y. Automatic recognition of lactating sow postures from depth images by deep learning detector. Computers and Electronics in Agriculture 2018, 147, 51–63. [Google Scholar] [CrossRef]
- Peltoniemi, O.; Oliviero, C.; Yun, J.; Grahofer, A.; Björkman, S. Management practices to optimize the parturition process in the hyperprolific sow. Journal of Animal Science 2020, 98, S96–S106. [Google Scholar] [CrossRef]
- Vranken, E.; Berckmans, D. Precision livestock farming for pigs. Animal Frontiers 2017, 7, 32–37. [Google Scholar] [CrossRef]
- Gómez, Y.; Stygar, A.; Boumans, I.; Bokkers, E.; Pedersen, L.; Niemi, J.; Pastell, M.; Manteca, X.; Llonch, P. A Systematic Review on Validated Precision Livestock Farming Technologies for Pig Production and Its Potential to Assess Animal Welfare. Frontiers in Veterinary Science 2021, 8. [Google Scholar] [CrossRef]
- Maselyne, J.; Adriaens, I.; Huybrechts, T.; De Ketelaere, B.; Millet, S.; Vangeyte, J.; Van Nuffel, A.; Saeys, W. Measuring the drinking behaviour of individual pigs housed in group using radio frequency identification (RFID). Animal : an international journal of animal bioscience 2015, 11, 1–10. [Google Scholar] [CrossRef]
- Pray, I.; Swanson, D.; Ayvar, V.; Muro, C.; Moyano, L.m.; Gonzalez, A.; Garcia, H.H.; O’Neal, S. GPS Tracking of Free-Ranging Pigs to Evaluate Ring Strategies for the Control of Cysticercosis/Taeniasis in Peru. PLoS neglected tropical diseases 2016, 10, e0004591. [Google Scholar] [CrossRef] [PubMed]
- Escalante, H.J.; Rodriguez, S.V.; Cordero, J.; Kristensen, A.R.; Cornou, C. Sow-activity classification from acceleration patterns: A machine learning approach. Computers and Electronics in Agriculture 2013, 93, 17–26. [Google Scholar] [CrossRef]
- Brown-Brandl, T.; Rohrer, G.; Eigenberg, R. Analysis of feeding behavior of group housed growing–finishing pigs. Computers and Electronics in Agriculture 2013, 96, 246–252. [Google Scholar] [CrossRef]
- Kashiha, M.; Bahr, C.; Haredasht, S.A.; Ott, S.; Moons, C.P.; Niewold, T.A.; Ödberg, F.O.; Berckmans, D. The automatic monitoring of pigs water use by cameras. Computers and Electronics in Agriculture 2013, 90, 164–169. [Google Scholar] [CrossRef]
- Viazzi, S.; Ismayilova, G.; Oczak, M.; Sonoda, L.; Fels, M.; Guarino, M.; Vranken, E.; Hartung, J.; Bahr, C.; Berckmans, D. Image feature extraction for classification of aggressive interactions among pigs. Computers and Electronics in Agriculture 2014, 104, 57–62. [Google Scholar] [CrossRef]
- Kashiha, M.A.; Bahr, C.; Ott, S.; Moons, C.P.; Niewold, T.A.; Tuyttens, F.; Berckmans, D. Automatic monitoring of pig locomotion using image analysis. Livestock Science 2014, 159, 141–148. [Google Scholar] [CrossRef]
- Jafarzadeh, P.; Virjonen, P.; Nevalainen, P.; Farahnakian, F.; Heikkonen, J. Pose Estimation of Hurdles Athletes using OpenPose. 2021 International Conference on Electrical, Computer, Communications and Mechatronics Engineering (ICECCME), 2021, pp. 1–6. [CrossRef]
- Farahnakian, F.; Heikkonen, J. Deep Learning Based Multi-Modal Fusion Architectures for Maritime Vessel Detection. Remote Sensing 2020, 12. [Google Scholar] [CrossRef]
- Jmour, N.; Zayen, S.; Abdelkrim, A. Convolutional neural networks for image classification. 2018 International Conference on Advanced Systems and Electric Technologies, 2018, pp. 397–402. [CrossRef]
- Yan, K.; Huang, S.; Song, Y.; Liu, W.; Fan, N. Face recognition based on convolution neural network. 2017 36th Chinese Control Conference (CCC), 2017, pp. 4077–4081. [CrossRef]
- Brünger, J.; Gentz, M.; Traulsen, I.; Koch, R. Panoptic Segmentation of Individual Pigs for Posture Recognition. Sensors 2020, 20. [Google Scholar] [CrossRef]
- Nasirahmadi, A.; Sturm, B.; Edwards, S.; Jeppsson, K.H.; Olsson, A.C.; Müller, S.; Hensel, O. Deep Learning and Machine Vision Approaches for Posture Detection of Individual Pigs. Sensors 2019, 19. [Google Scholar] [CrossRef]
- Farahnakian, F.; Heikkonen, J.; Björkman, S. Multi-pig Pose Estimation Using DeepLabCut. 2021 11th International Conference on Intelligent Control and Information Processing (ICICIP), 2021, pp. 143–148. [CrossRef]
- He, K.; Zhang, X.; Ren, S.; Sun, J. Deep Residual Learning for Image Recognition, 2015. [CrossRef]
- Mathis, A.; Mamidanna, P.; Cury, K.; Abe, T.; Murthy, V.; Mathis, M.; Bethge, M. DeepLabCut: markerless pose estimation of user-defined body parts with deep learning. Nature Neuroscience 2018, 21. [Google Scholar] [CrossRef]
- Zheng, C.; Wu, W.; Chen, C.; Yang, T.; Zhu, S.; Shen, J.; Kehtarnavaz, N.; Shah, M. Deep Learning-Based Human Pose Estimation: A Survey, 2020. [CrossRef]
- Toshev, A.; Szegedy, C. DeepPose: Human Pose Estimation via Deep Neural Networks. 2014 IEEE Conference on Computer Vision and Pattern Recognition. IEEE, 2014. [CrossRef]
- Dang, Q.; Yin, J.; Wang, B.; Zheng, W. Deep learning based 2D human pose estimation: A survey. Tsinghua Science and Technology 2019, 24, 663–676. [Google Scholar] [CrossRef]
- Fang, H.S.; Xie, S.; Tai, Y.W.; Lu, C. RMPE: Regional Multi-person Pose Estimation. 2017 IEEE International Conference on Computer Vision (ICCV), 2017, pp. 2353–2362. [CrossRef]
- Nasirahmadi, A.; Edwards, S.A.; Sturm, B. Implementation of machine vision for detecting behaviour of cattle and pigs. Livestock Science 2017, 202, 25–38. [Google Scholar] [CrossRef]
- Mahfuz, S.; Mun, H.S.; Dilawar, M.A.; Yang, C.J. Applications of Smart Technology as a Sustainable Strategy in Modern Swine Farming. Sustainability 2022, 14. [Google Scholar] [CrossRef]
- Chung, Y.; Kim, H.; Lee, H.; Park, D.; Jeon, T.; and, H.H.C. A Cost-Effective Pigsty Monitoring System Based on a Video Sensor. KSII Transactions on Internet and Information Systems 2014, 8, 1481–1498. [Google Scholar] [CrossRef]
- Ott, Sanne and Moons, Christel and Kashiha, Mohammadamin A and Bahr, Claudia and Tuyttens, Frank and Berckmans, Daniel and Niewold, Theo A. Automated video analysis of pig activity at pen level highly correlates to human observations of behavioural activities. LIVESTOCK SCIENCE 2014, 160, 132–137. [Google Scholar] [CrossRef]
- Kashisha, Mohammad Amin and Bahr, Claudia and Ott, Sanne and Moons, Christel and Niewold, Theo A and Tuyttens, Frank and Berckmans, Daniel. Automatic monitoring of pig locomotion using image analysis. LIVESTOCK SCIENCE 2014, 159, 141–148. [Google Scholar] [CrossRef]
- Ahrendt, P.; Gregersen, T.; Karstoft, H. Development of a real-time computer vision system for tracking loose-housed pigs. Computers and Electronics in Agriculture 2011, 76, 169–174. [Google Scholar] [CrossRef]
- Oczak, M.; Maschat, K.; Berckmans, D.; Vranken, E.; Baumgartner, J. Automatic estimation of number of piglets in a pen during farrowing, using image analysis. Biosystems Engineering 2016, 151, 81–89. [Google Scholar] [CrossRef]
- Wutke, M.; Heinrich, F.; Das, P.P.; Lange, A.; Gentz, M.; Traulsen, I.; Warns, F.K.; Schmitt, A.O.; Gültas, M. Detecting Animal Contacts—A Deep Learning-Based Pig Detection and Tracking Approach for the Quantification of Social Contacts. Sensors 2021, 21. [Google Scholar] [CrossRef]
- T. Psota, E.; Schmidt, T.; Mote, B.; C. Pérez, L. Long-Term Tracking of Group-Housed Livestock Using Keypoint Detection and MAP Estimation for Individual Animal Identification. Sensors 2020, 20. [Google Scholar] [CrossRef]
- Zhang, Y.; Cai, J.; Xiao, D.; Li, Z.; Xiong, B. Real-Time Sow Behavior Detection Based on Deep Learning. Comput. Electron. Agric. 2019, 163. [Google Scholar] [CrossRef]
- Liu, C.; Zhou, H.; Cao, J.; Guo, X.; Su, J.; Wang, L.; Lu, S.; Li, L. Behavior Trajectory Tracking of Piglets Based on DLC-KPCA. Agriculture 2021, 11, 1–22. [Google Scholar] [CrossRef]
- Lao, F.; Brown-Brandl, T.; Stinn, J.; Liu, K.; Teng, G.; Xin, H. Automatic recognition of lactating sow behaviors through depth image processing. Computers and Electronics in Agriculture 2016, 125, 56–62. [Google Scholar] [CrossRef]
- Yang, A.; Huang, H.; Zhu, X.; Yang, X.; Pengfei, C.; Shimei, L.; Xue, Y. Automatic recognition of sow nursing behaviour using deep learning-based segmentation and spatial and temporal features. Biosystems Engineering 2018. [Google Scholar] [CrossRef]
- Leonard, S.; Xin, H.; Brown-Brandl, T.; Ramirez, B. Development and application of an image acquisition system for characterizing sow behaviors in farrowing stalls. Computers and Electronics in Agriculture 2019, 163, 104866. [Google Scholar] [CrossRef]
- Küster, S., N. P.M.C.S.B..T.I. Automatic behavior and posture detection of sows in loose farrowing pens based on 2D-video images. Frontiers in Animal Science 2021, 64. [Google Scholar]
- Redmon, J.; Farhadi, A. YOLO9000: Better, Faster, Stronger. 2017 IEEE Conference on Computer Vision and Pattern Recognition (CVPR), 2017, pp. 6517–6525. [CrossRef]
- Ren, S.; He, K.; Girshick, R.B.; Sun, J. Faster R-CNN: Towards Real-Time Object Detection with Region Proposal Networks. NIPS; Cortes, C.; Lawrence, N.D.; Lee, D.D.; Sugiyama, M.; Garnett, R., Eds., 2015, pp. 91–99.
- Basodi, S.; Ji, C.; Zhang, H.; Pan, Y. Gradient amplification: An efficient way to train deep neural networks. Big Data Mining and Analytics 2020, 3, 196–207. [Google Scholar] [CrossRef]
- Howard, A.G.; Zhu, M.; Chen, B.; Kalenichenko, D.; Wang, W.; Weyand, T.; Andreetto, M.; Adam, H. MobileNets: Efficient Convolutional Neural Networks for Mobile Vision Applications, 2017. [CrossRef]
- Debnath, B.; O’Brien, M.; Yamaguchi, M.; Behera, A. Adapting MobileNets for mobile based upper body pose estimation. 2018 15th IEEE International Conference on Advanced Video and Signal Based Surveillance (AVSS), 2018, pp. 1–6. [CrossRef]
- Chollet, F. Xception: Deep Learning with Depthwise Separable Convolutions, 2016. [CrossRef]
- Huang, Y.; Cheng, Y.; Bapna, A.; Firat, O.; Chen, M.X.; Chen, D.; Lee, H.; Ngiam, J.; Le, Q.V.; Wu, Y.; Chen, Z. GPipe: Efficient Training of Giant Neural Networks using Pipeline Parallelism, 2018. [CrossRef]
- Tan, M.; Le, Q.V. EfficientNet: Rethinking Model Scaling for Convolutional Neural Networks 2019. [CrossRef]
- Chen, L.C.; Yang, Y.; Wang, J.; Xu, W.; Yuille, A.L. Attention to Scale: Scale-Aware Semantic Image Segmentation. Proceedings of the IEEE Conference on Computer Vision and Pattern Recognition (CVPR), 2016.
- Lauer, J.; Zhou, M.; Ye, S.; Menegas, W.; Nath, T.; Rahman, M.M.; Di Santo, V.; Soberanes, D.; Feng, G.; Murthy, V.N.; Lauder, G.; Dulac, C.; Mathis, M.W.; Mathis, A. Multi-animal pose estimation and tracking with DeepLabCut. bioRxiv, 2021. [Google Scholar] [CrossRef]
- Neverova, N.; Wolf, C.; Taylor, G.W.; Nebout, F. Multi-scale Deep Learning for Gesture Detection and Localization. Computer Vision - ECCV 2014 Workshops; Agapito, L., Bronstein, M.M., Rother, C., Eds.; Springer International Publishing: Cham, 2015; pp. 474–490. [Google Scholar]
- Eigen, D.; Fergus, R. Predicting depth, surface normals and semantic labels with a common multi-scale convolutional architecture. Proceedings of the IEEE international conference on computer vision, 2015, pp. 2650–2658.
- Farabet, C.; Couprie, C.; Najman, L.; LeCun, Y. Learning Hierarchical Features for Scene Labeling. IEEE Transactions on Pattern Analysis and Machine Intelligence 2013, 35, 1915–1929. [Google Scholar] [CrossRef]
- Wang, L.; Yin, B.; Guo, A.; Ma, H.; Cao, J. Skip-Connection Convolutional Neural Network for Still Image Crowd Counting. Applied Intelligence 2018, 48, 3360–3371. [Google Scholar] [CrossRef]
- Kingma, D.; Ba, J. Adam: A Method for Stochastic Optimization. International Conference on Learning Representations 2014. [Google Scholar]
- Insafutdinov, E.; Pishchulin, L.; Andres, B.; Andriluka, M.; Schiele, B. DeeperCut: A Deeper, Stronger, and Faster Multi-Person Pose Estimation Model. CoRR 2016, abs/1605.03170. [Google Scholar]
Figure 1.
Single-animal 2D PE frameworks. (a) Regression-based methods generate joint coordinates by directly learning a mapping from the source image to the kinematic body model (through a deep neural network). (b) Heatmap-based methods detect the position body part of animal using the supervision of heatmaps.
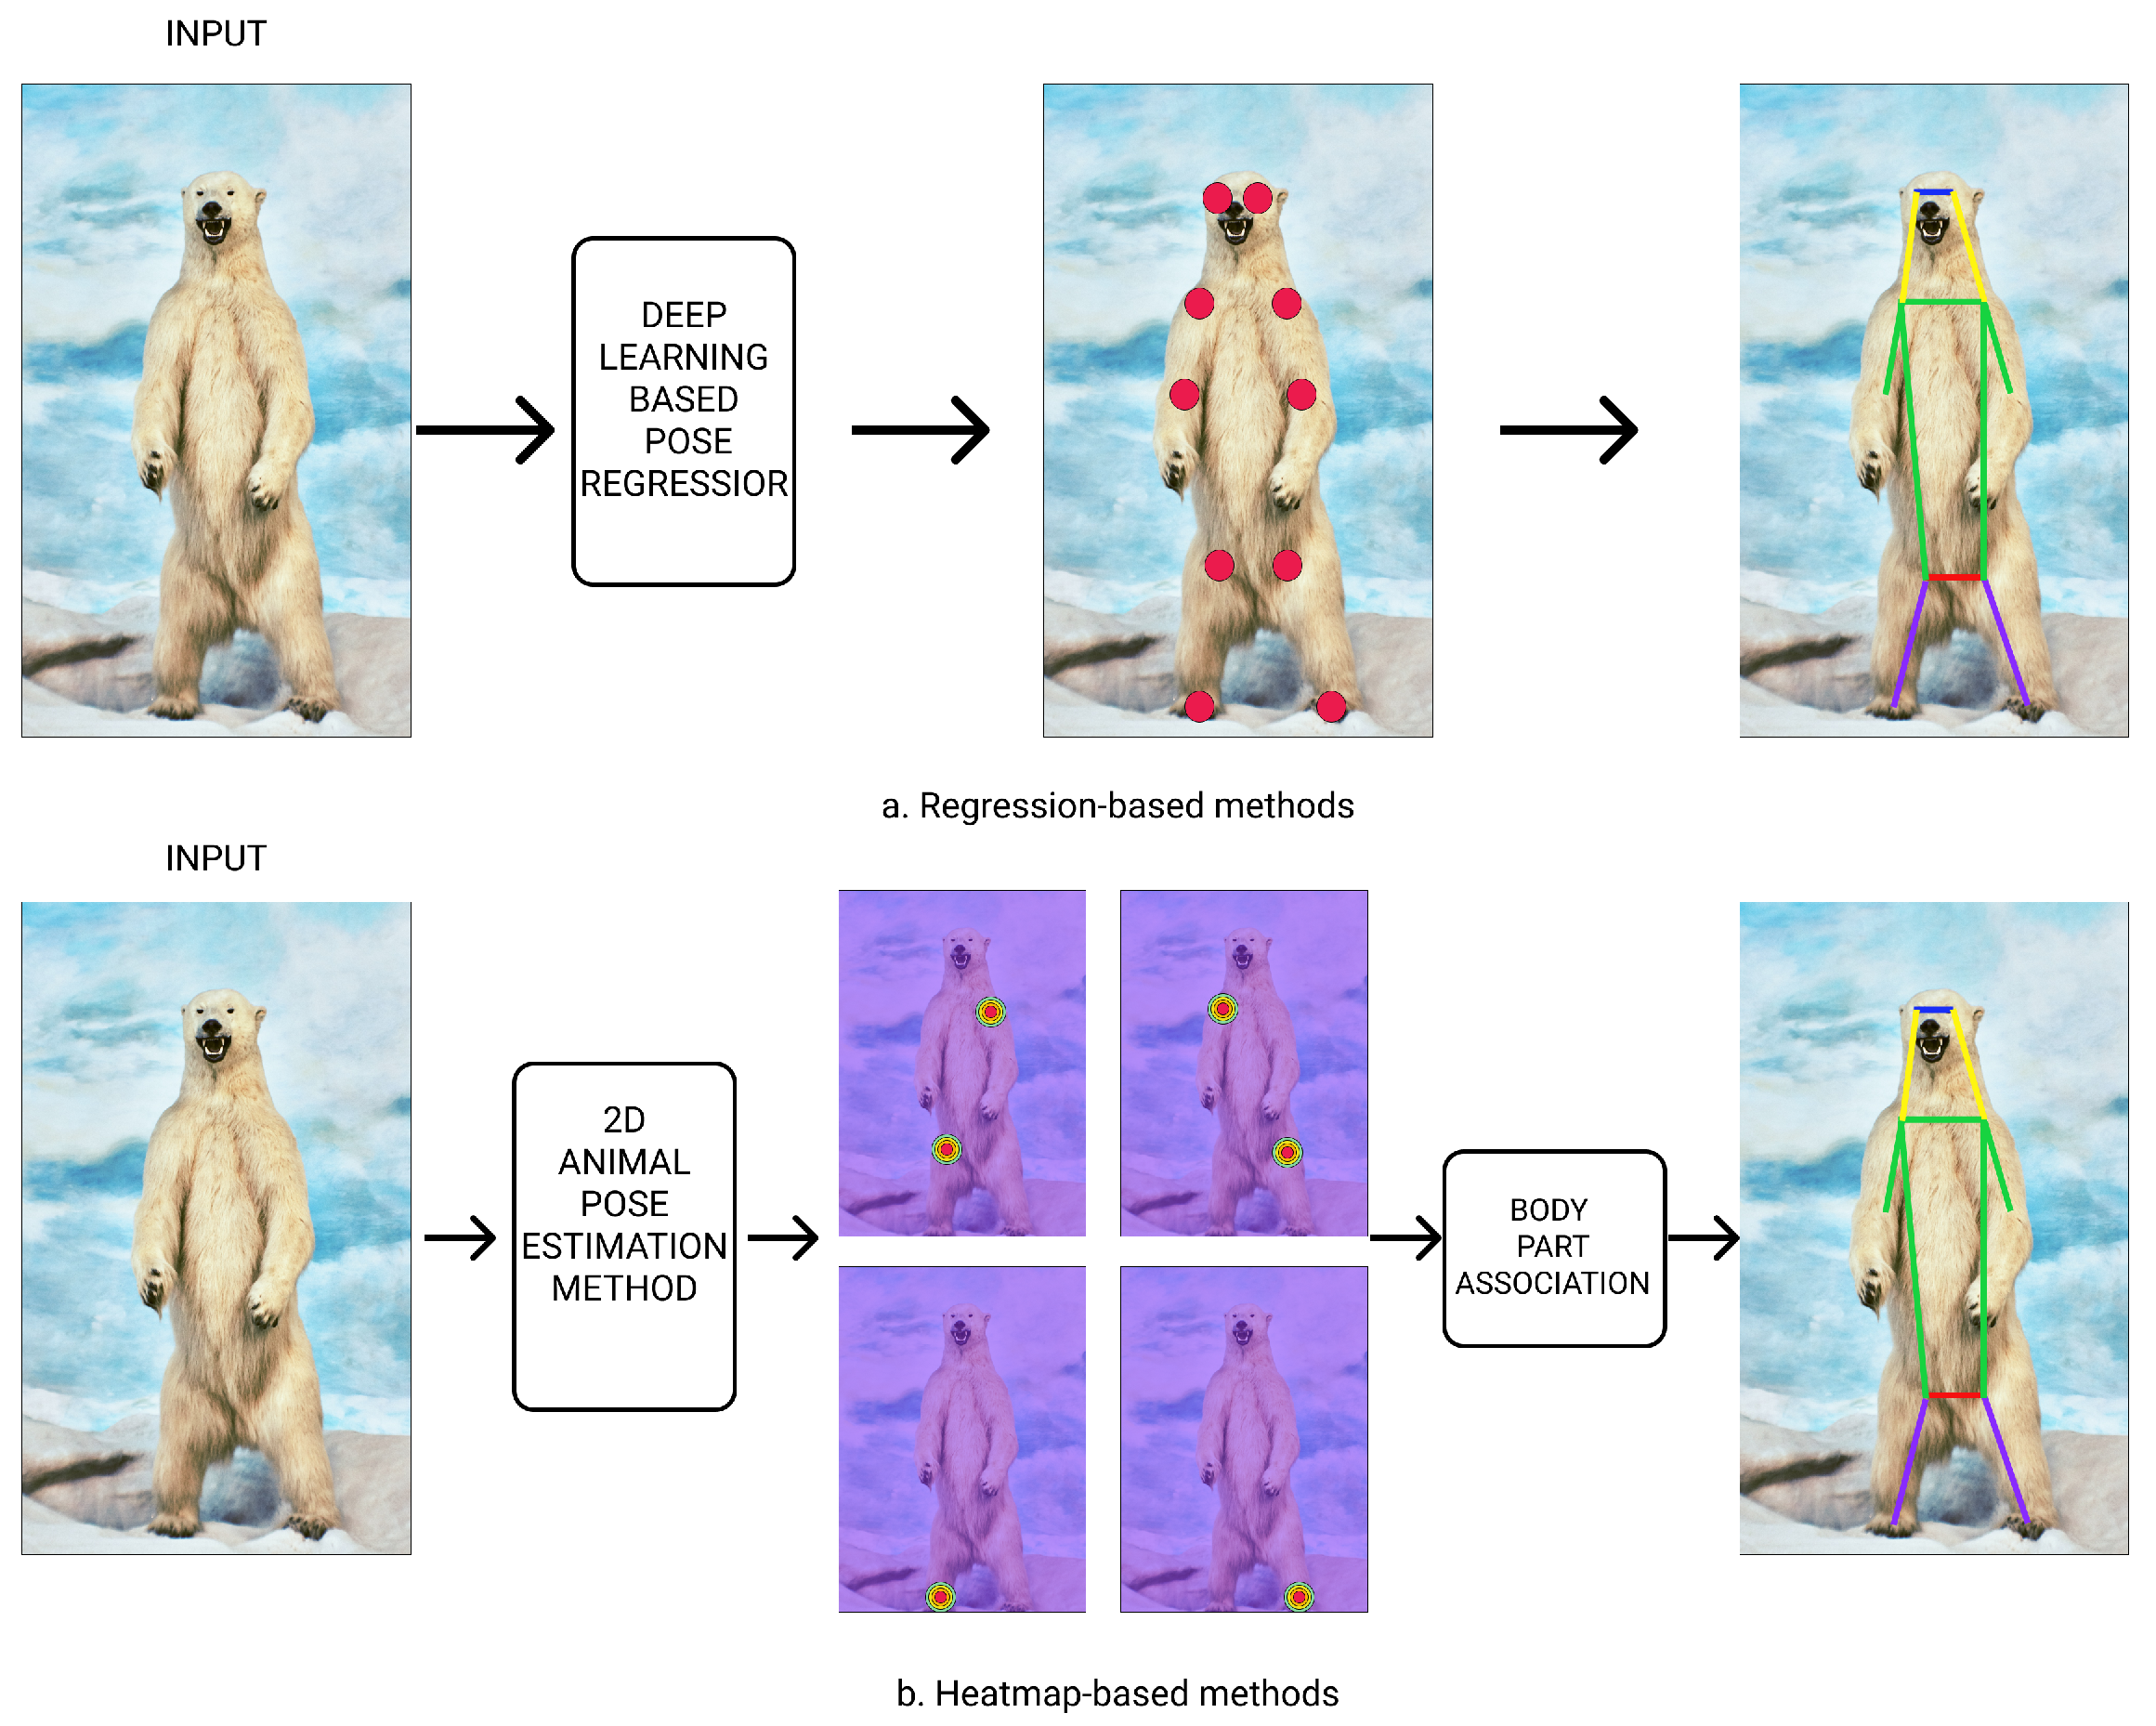
Figure 2.
Multi-animal 2D PE frameworks. (a) In bottom-up methods, all key points need to be detected (1). These key points are then associated to each animal and assembled for individual pose representations (2). (b) Top-down methods have two sub-tasks: (1) animal detection and (2) pose estimation in the region of a singe animal.
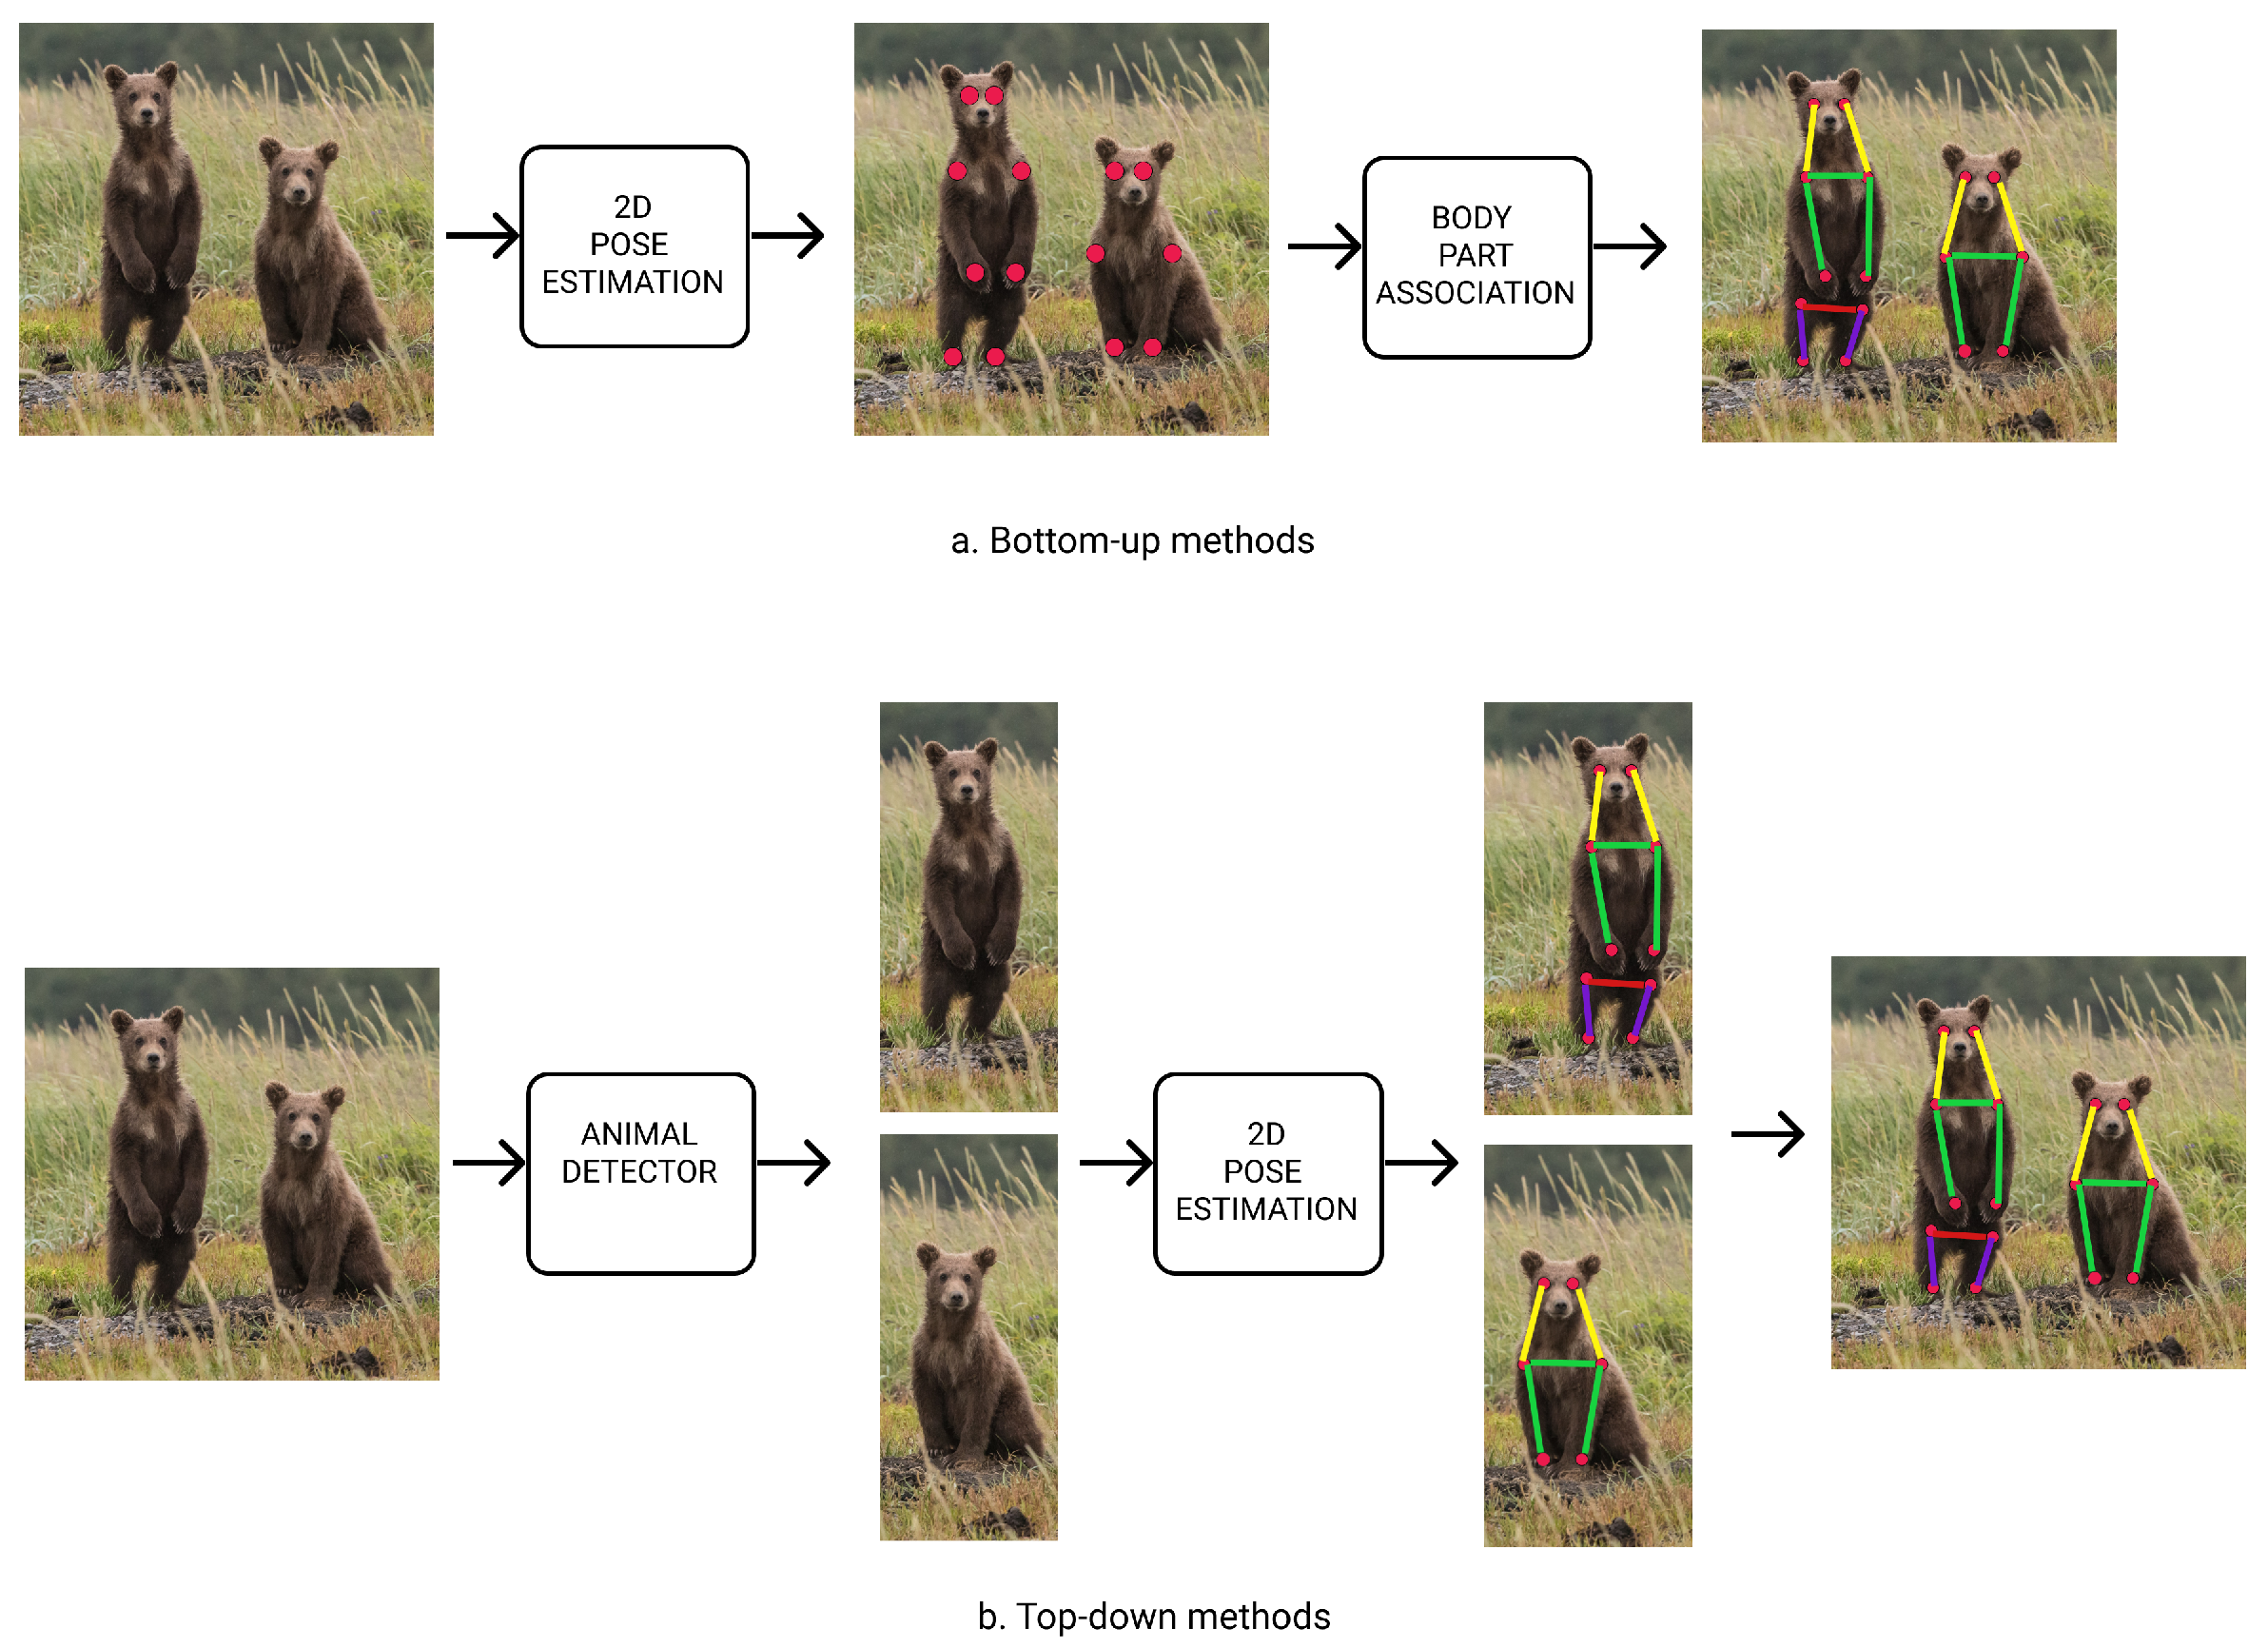
Figure 3.
A block of a ResNet network.
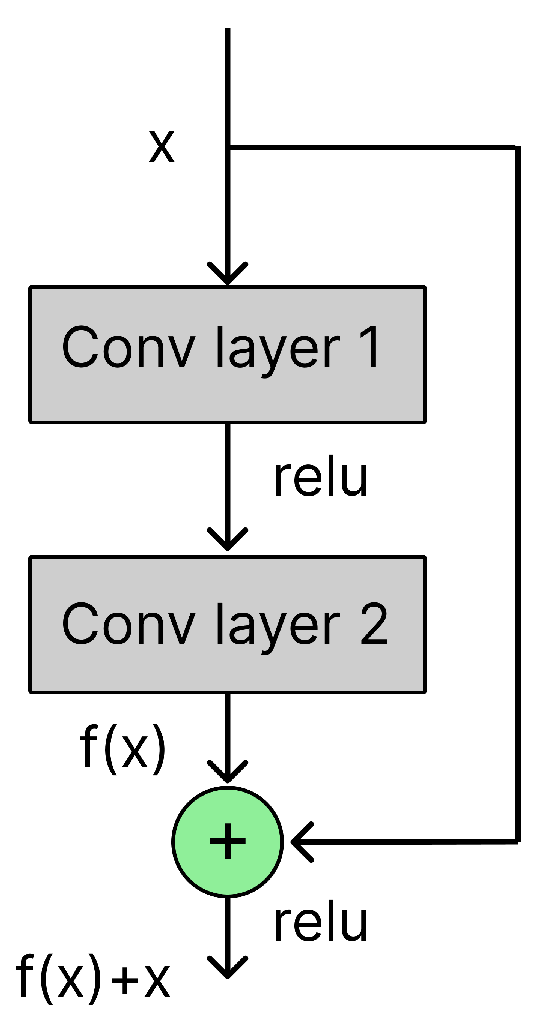
Figure 4.
(a) Standard convolutional network with Relu and batch norm. (b) Depth-wise separable convolution with depth-wise and pointwise layers which are followed by batch normalization and Relu.
Figure 4.
(a) Standard convolutional network with Relu and batch norm. (b) Depth-wise separable convolution with depth-wise and pointwise layers which are followed by batch normalization and Relu.
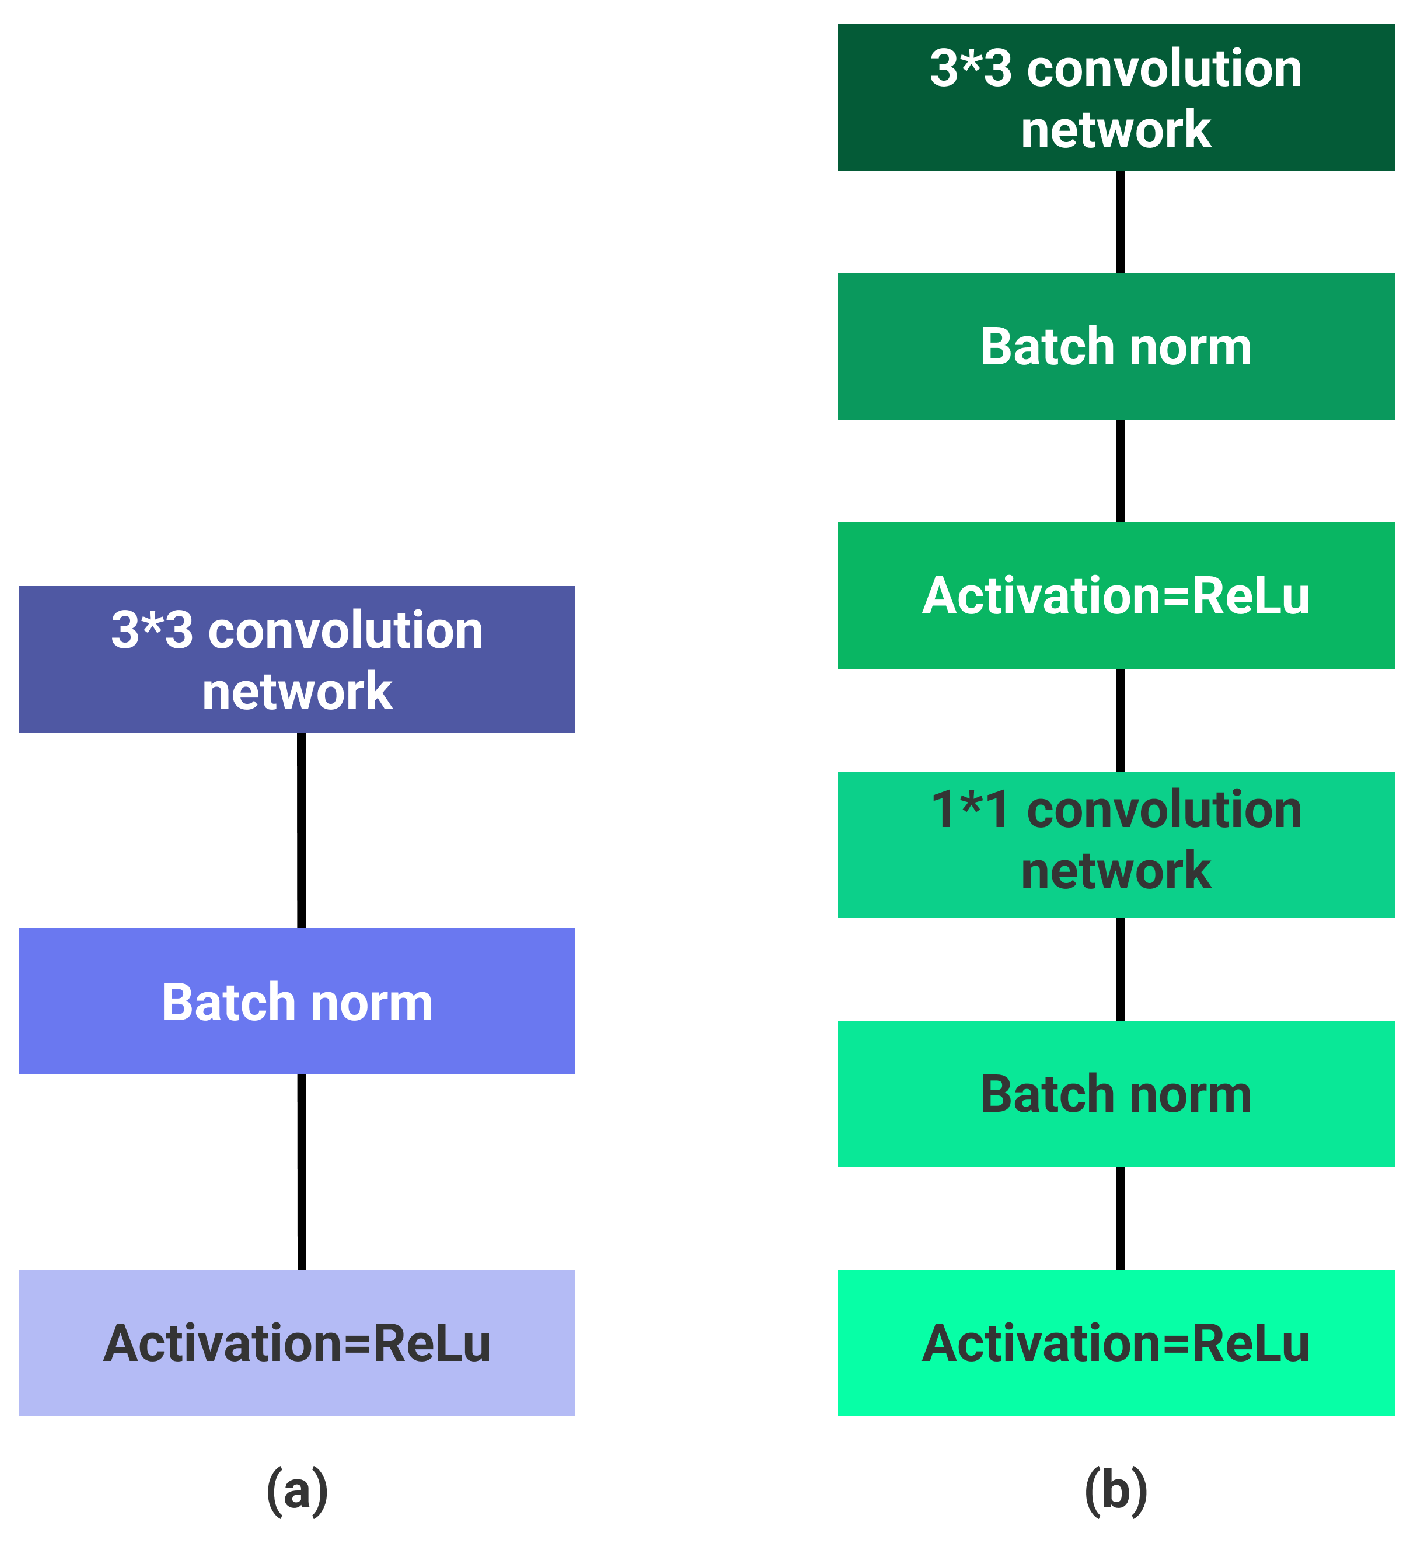
Figure 5.
Various scaling methods and compound scaling [54].
Figure 5.
Various scaling methods and compound scaling [54].
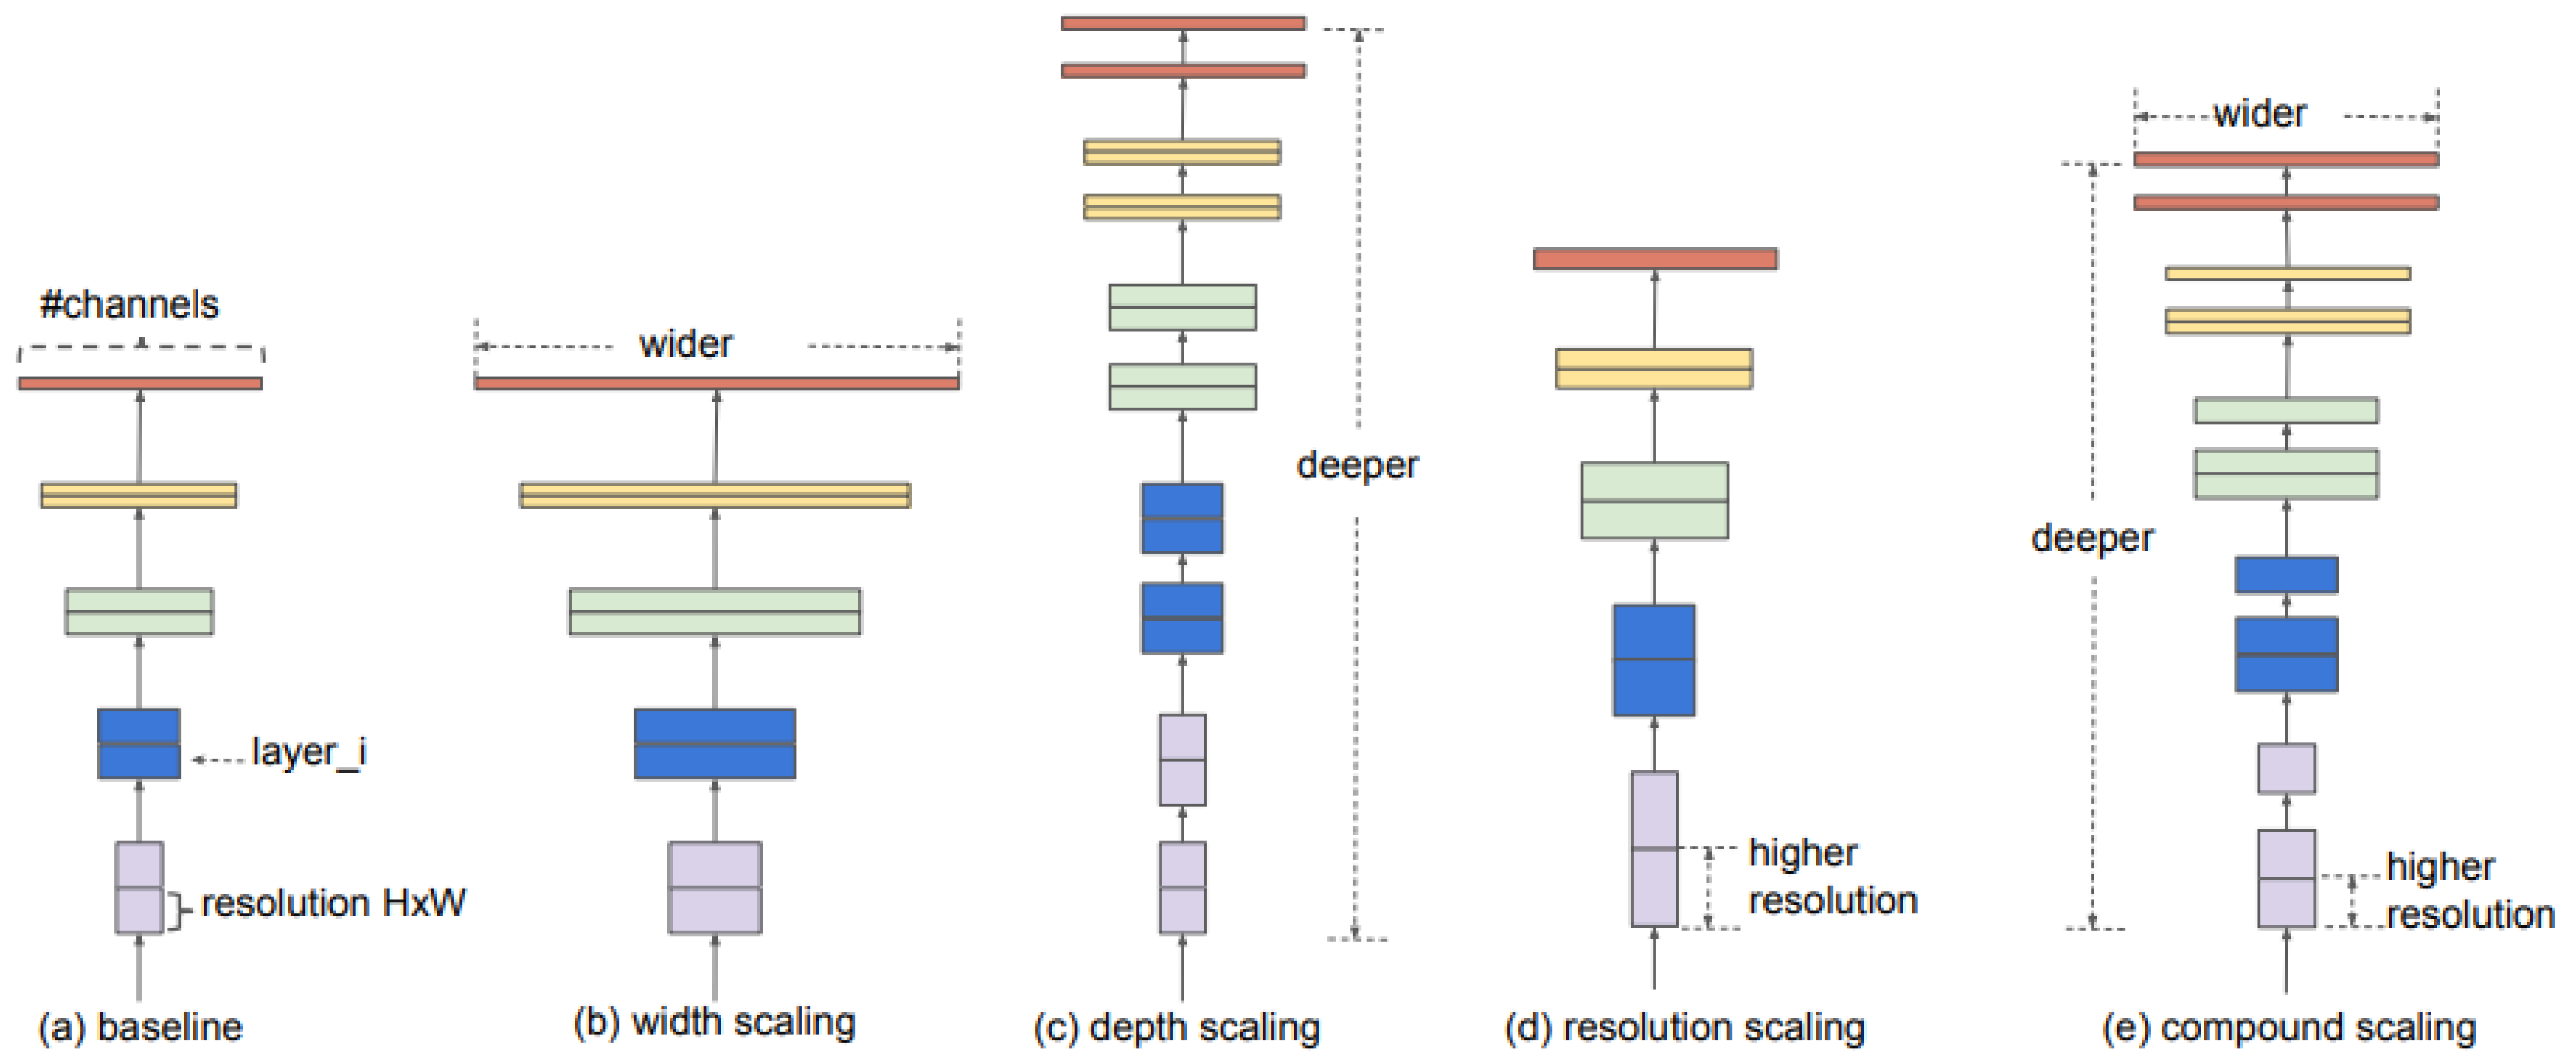
Figure 6.
a) multi-column network, b) skip-net, c) multi-scale input [60].
Figure 6.
a) multi-column network, b) skip-net, c) multi-scale input [60].
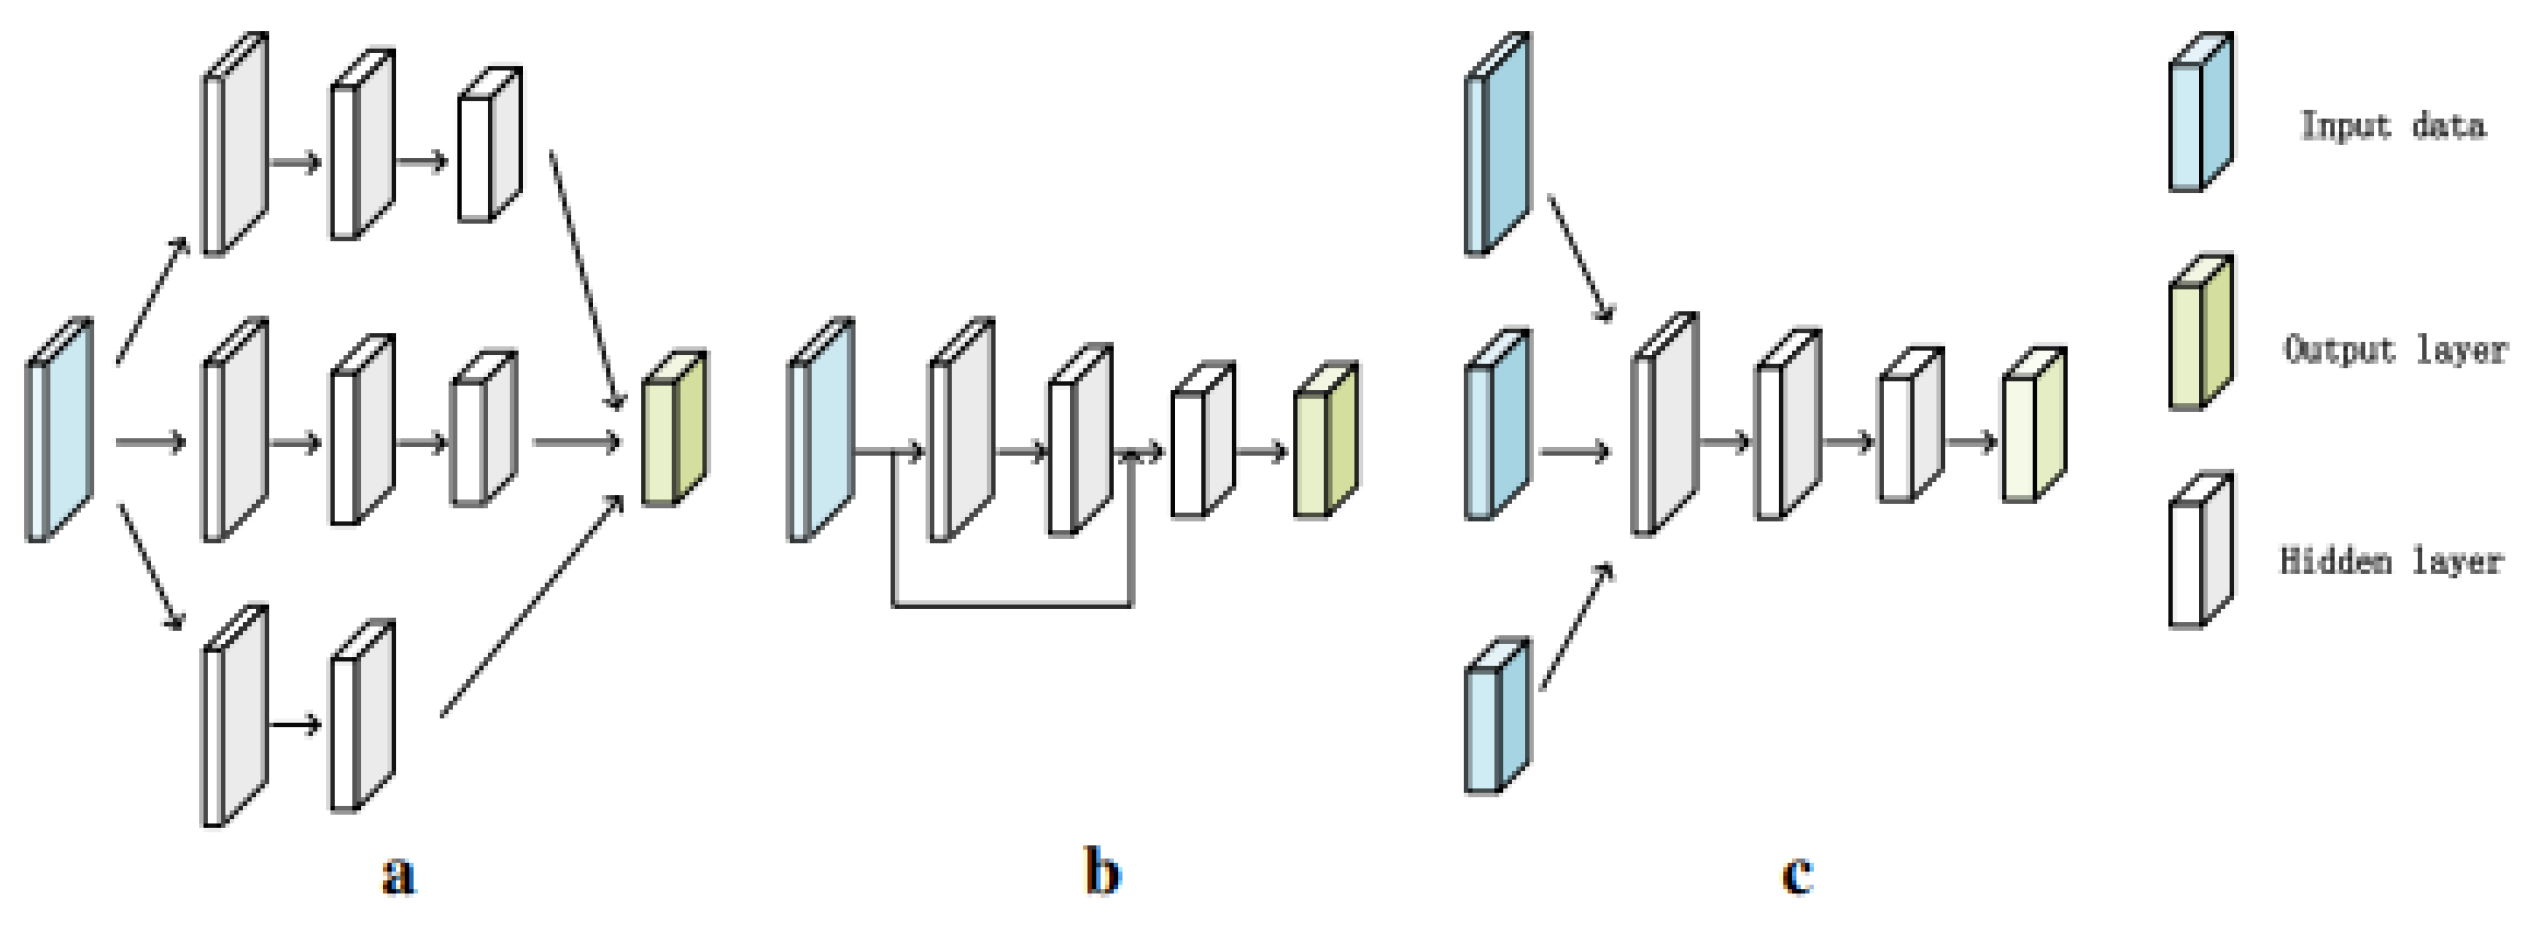
Figure 7.
Setup of the recording camera.(a) Side view and (b) Camera view.
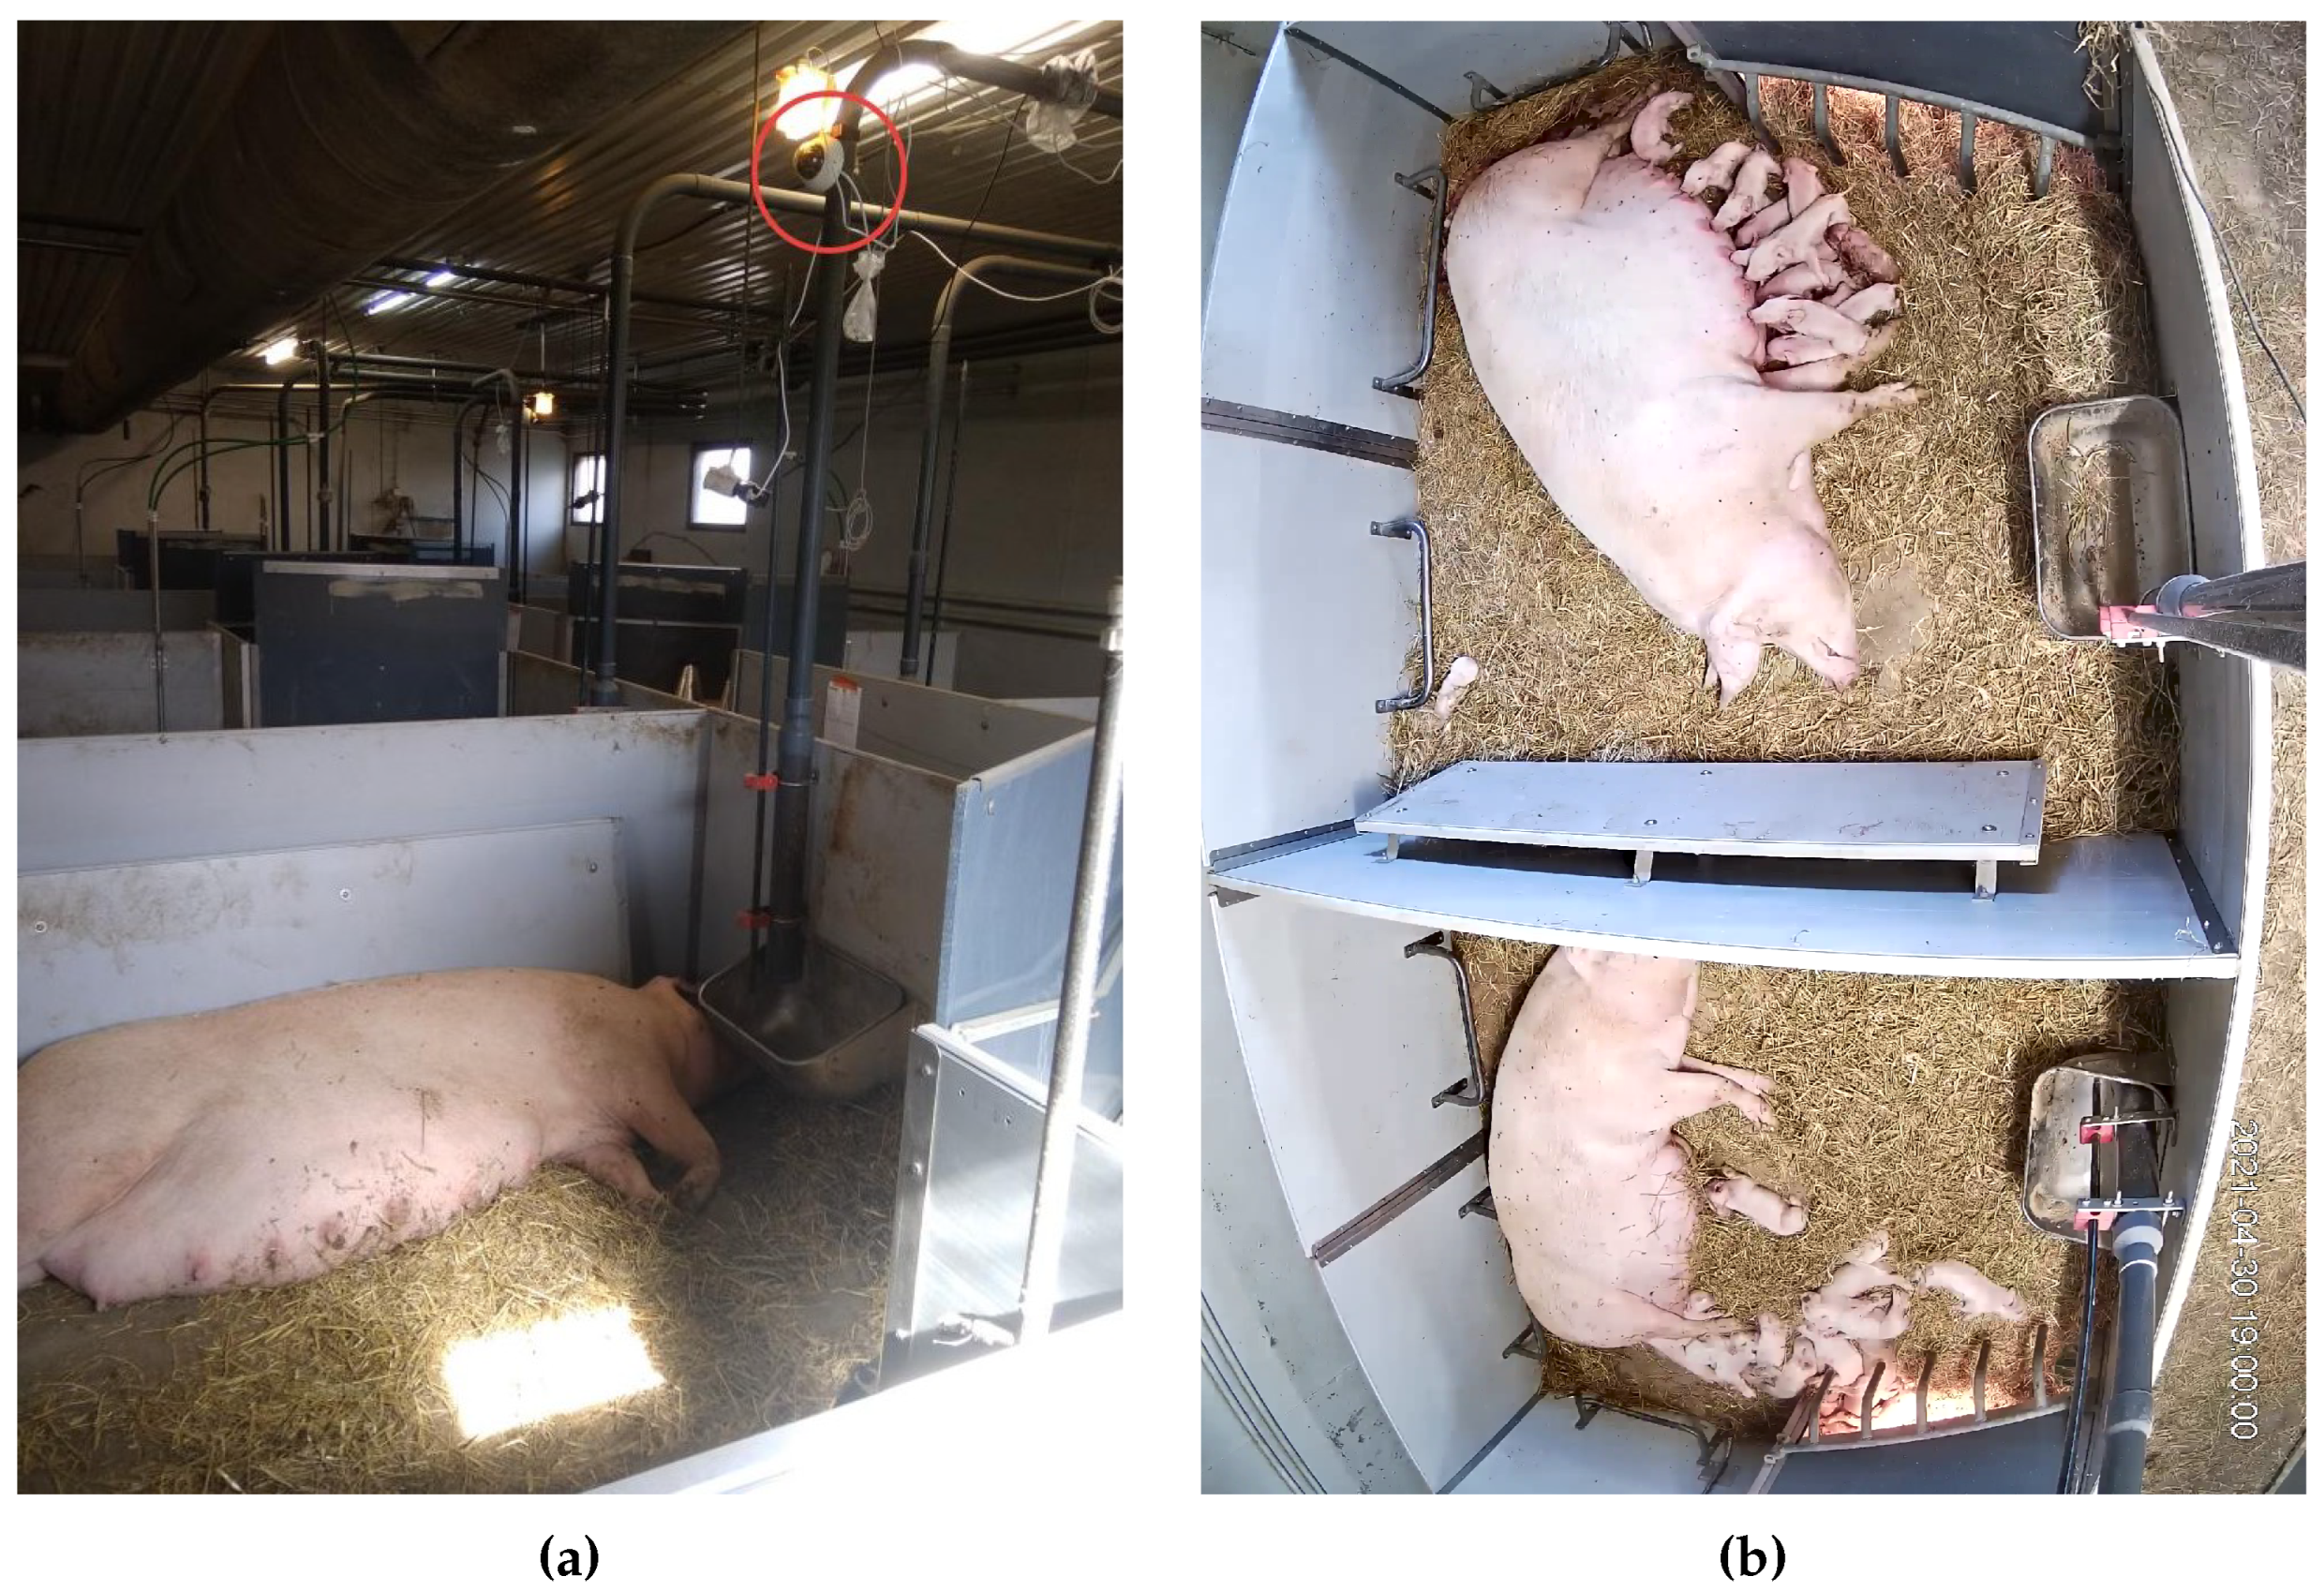
Figure 8.
Example of an annotated image from our dataset with different colors corresponding to the body part of the sow and piglets.
Figure 8.
Example of an annotated image from our dataset with different colors corresponding to the body part of the sow and piglets.
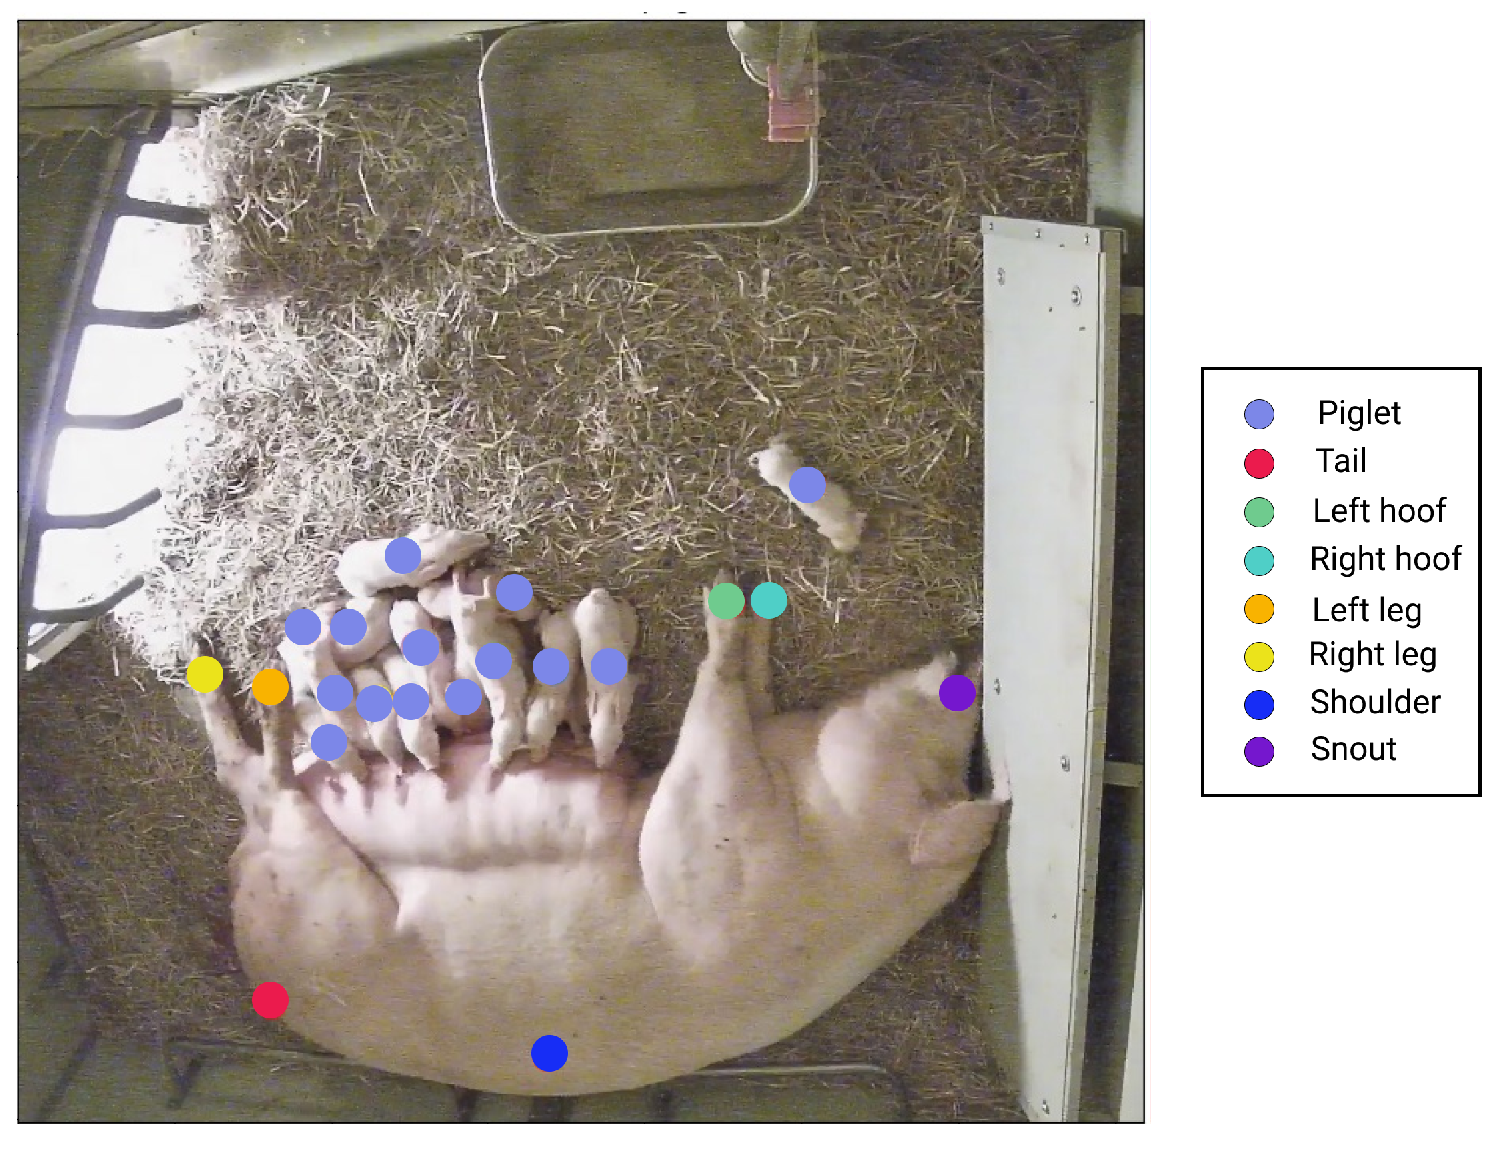
Figure 9.
The proposed augmentation techniques on an example image from the dataset.
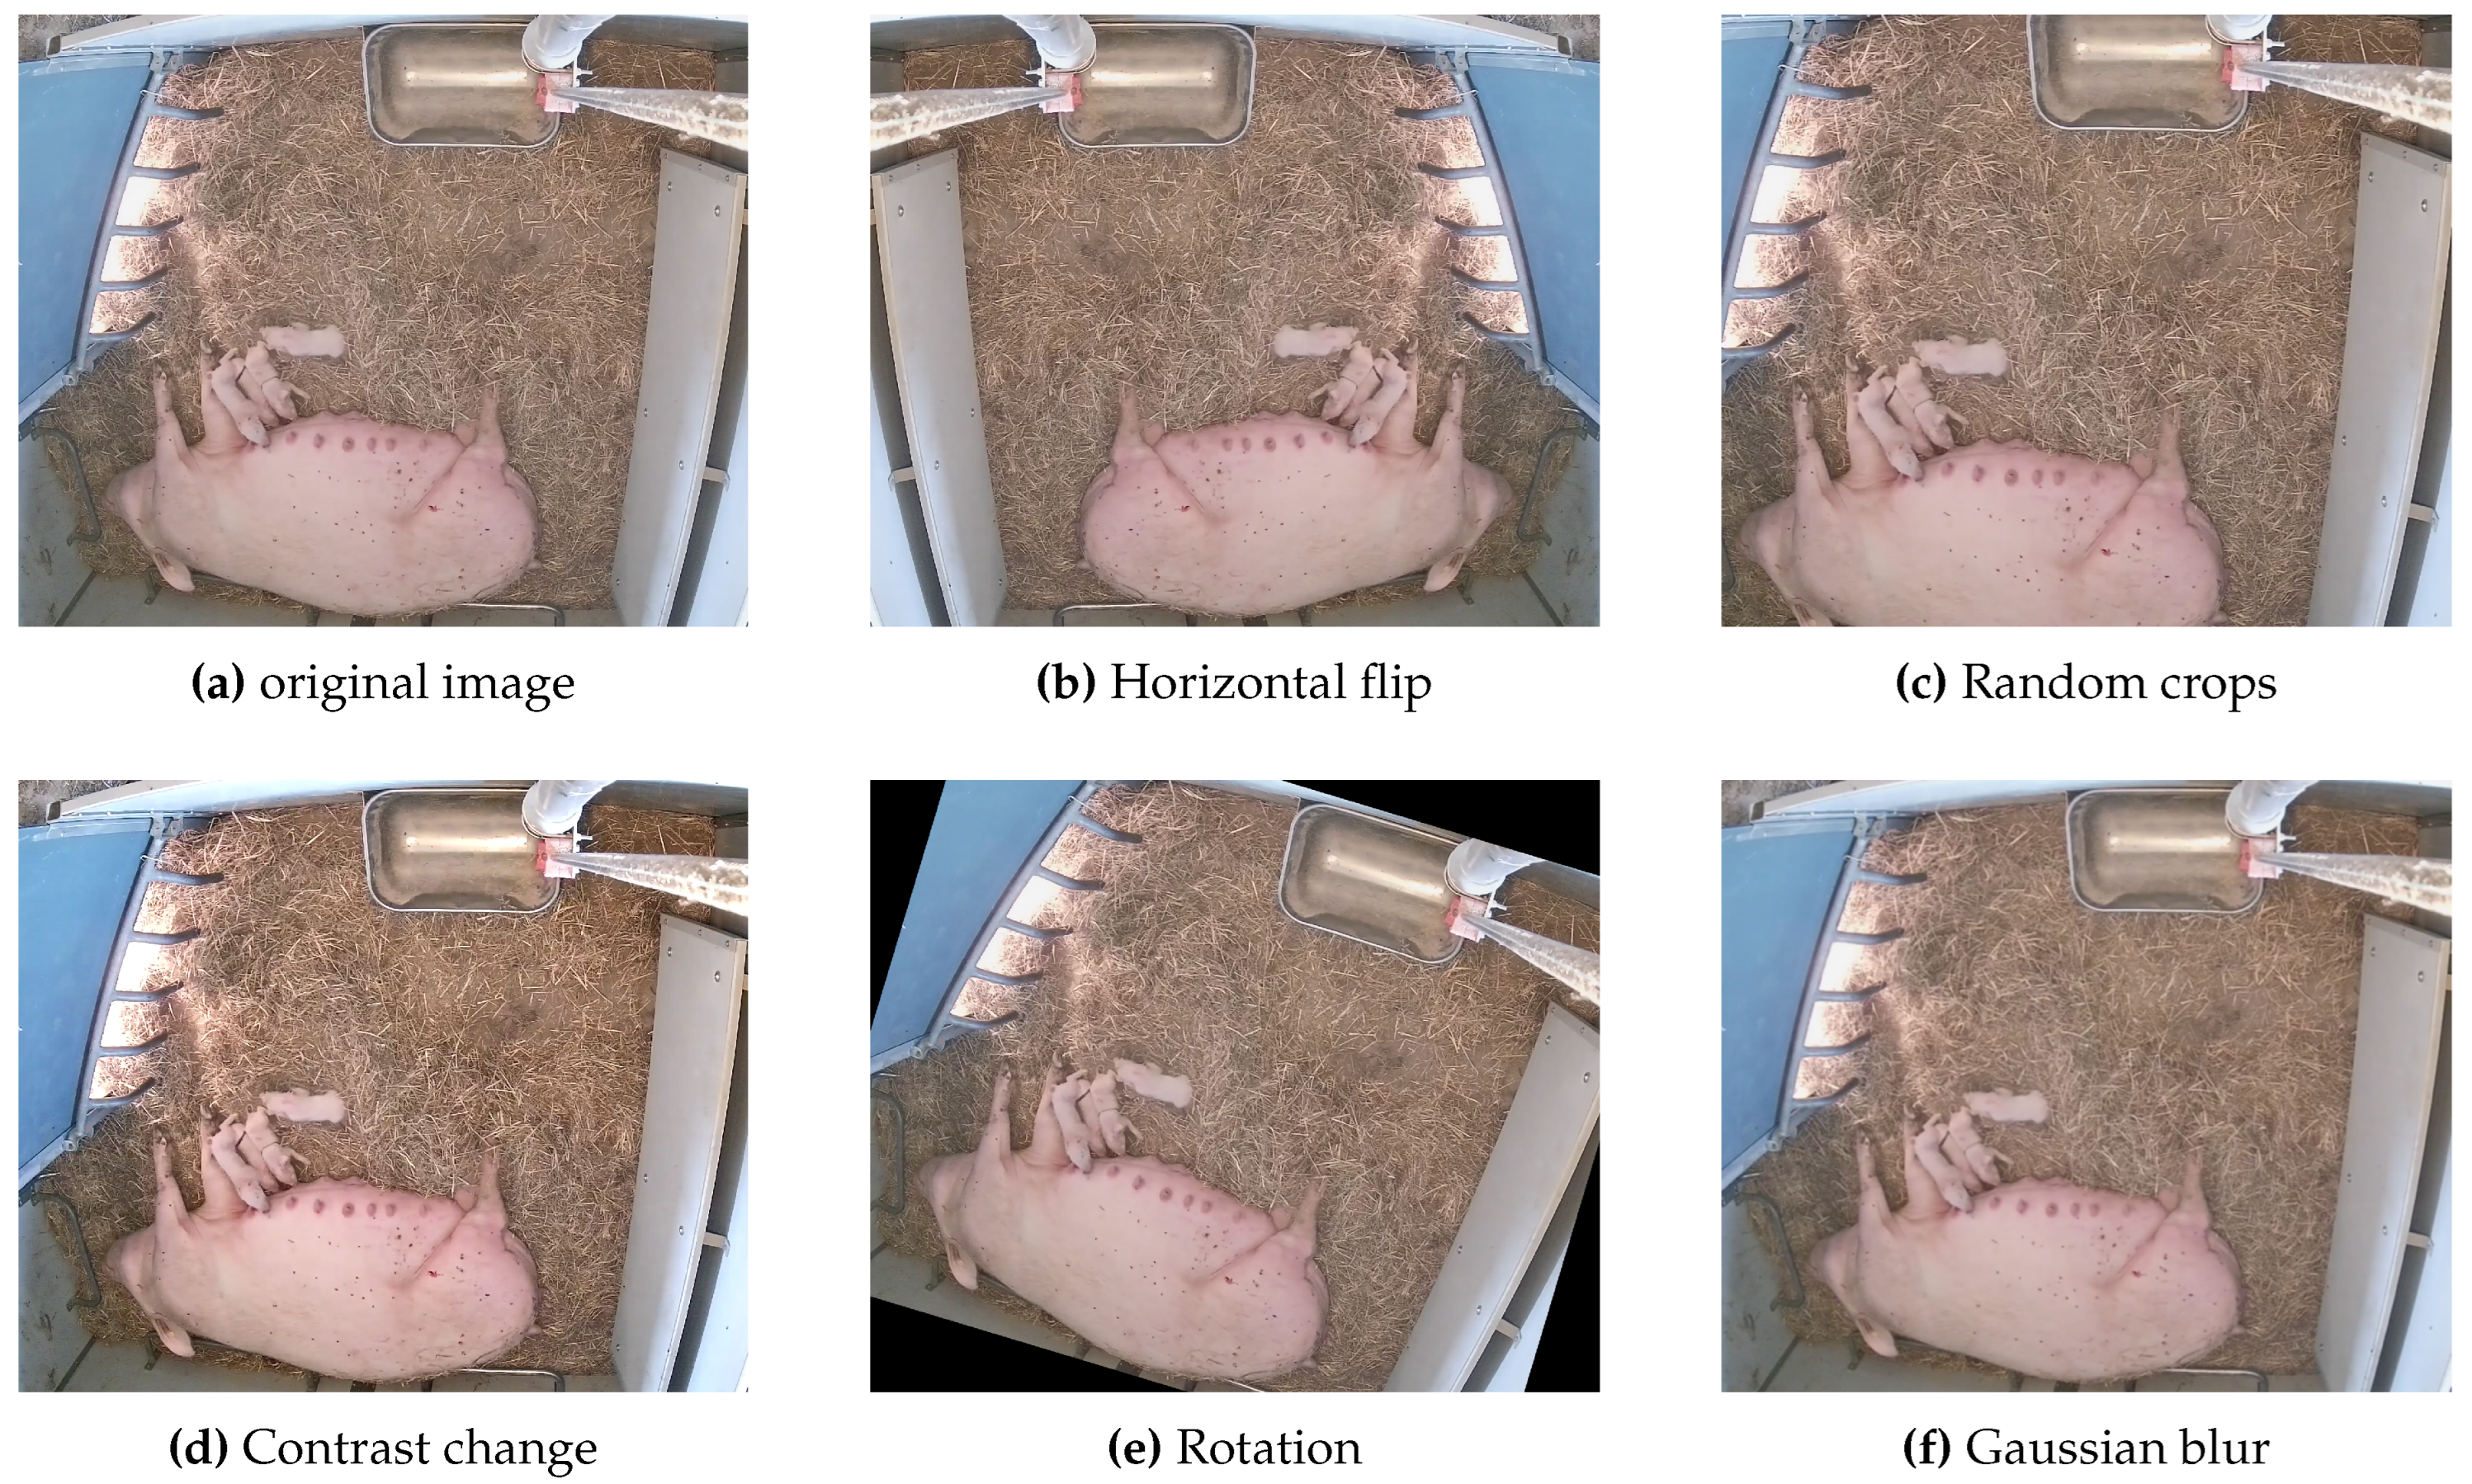
Figure 10.
The RMSE of (a) sow’s body parts and (b) piglet’s shoulder in pixels for each network.
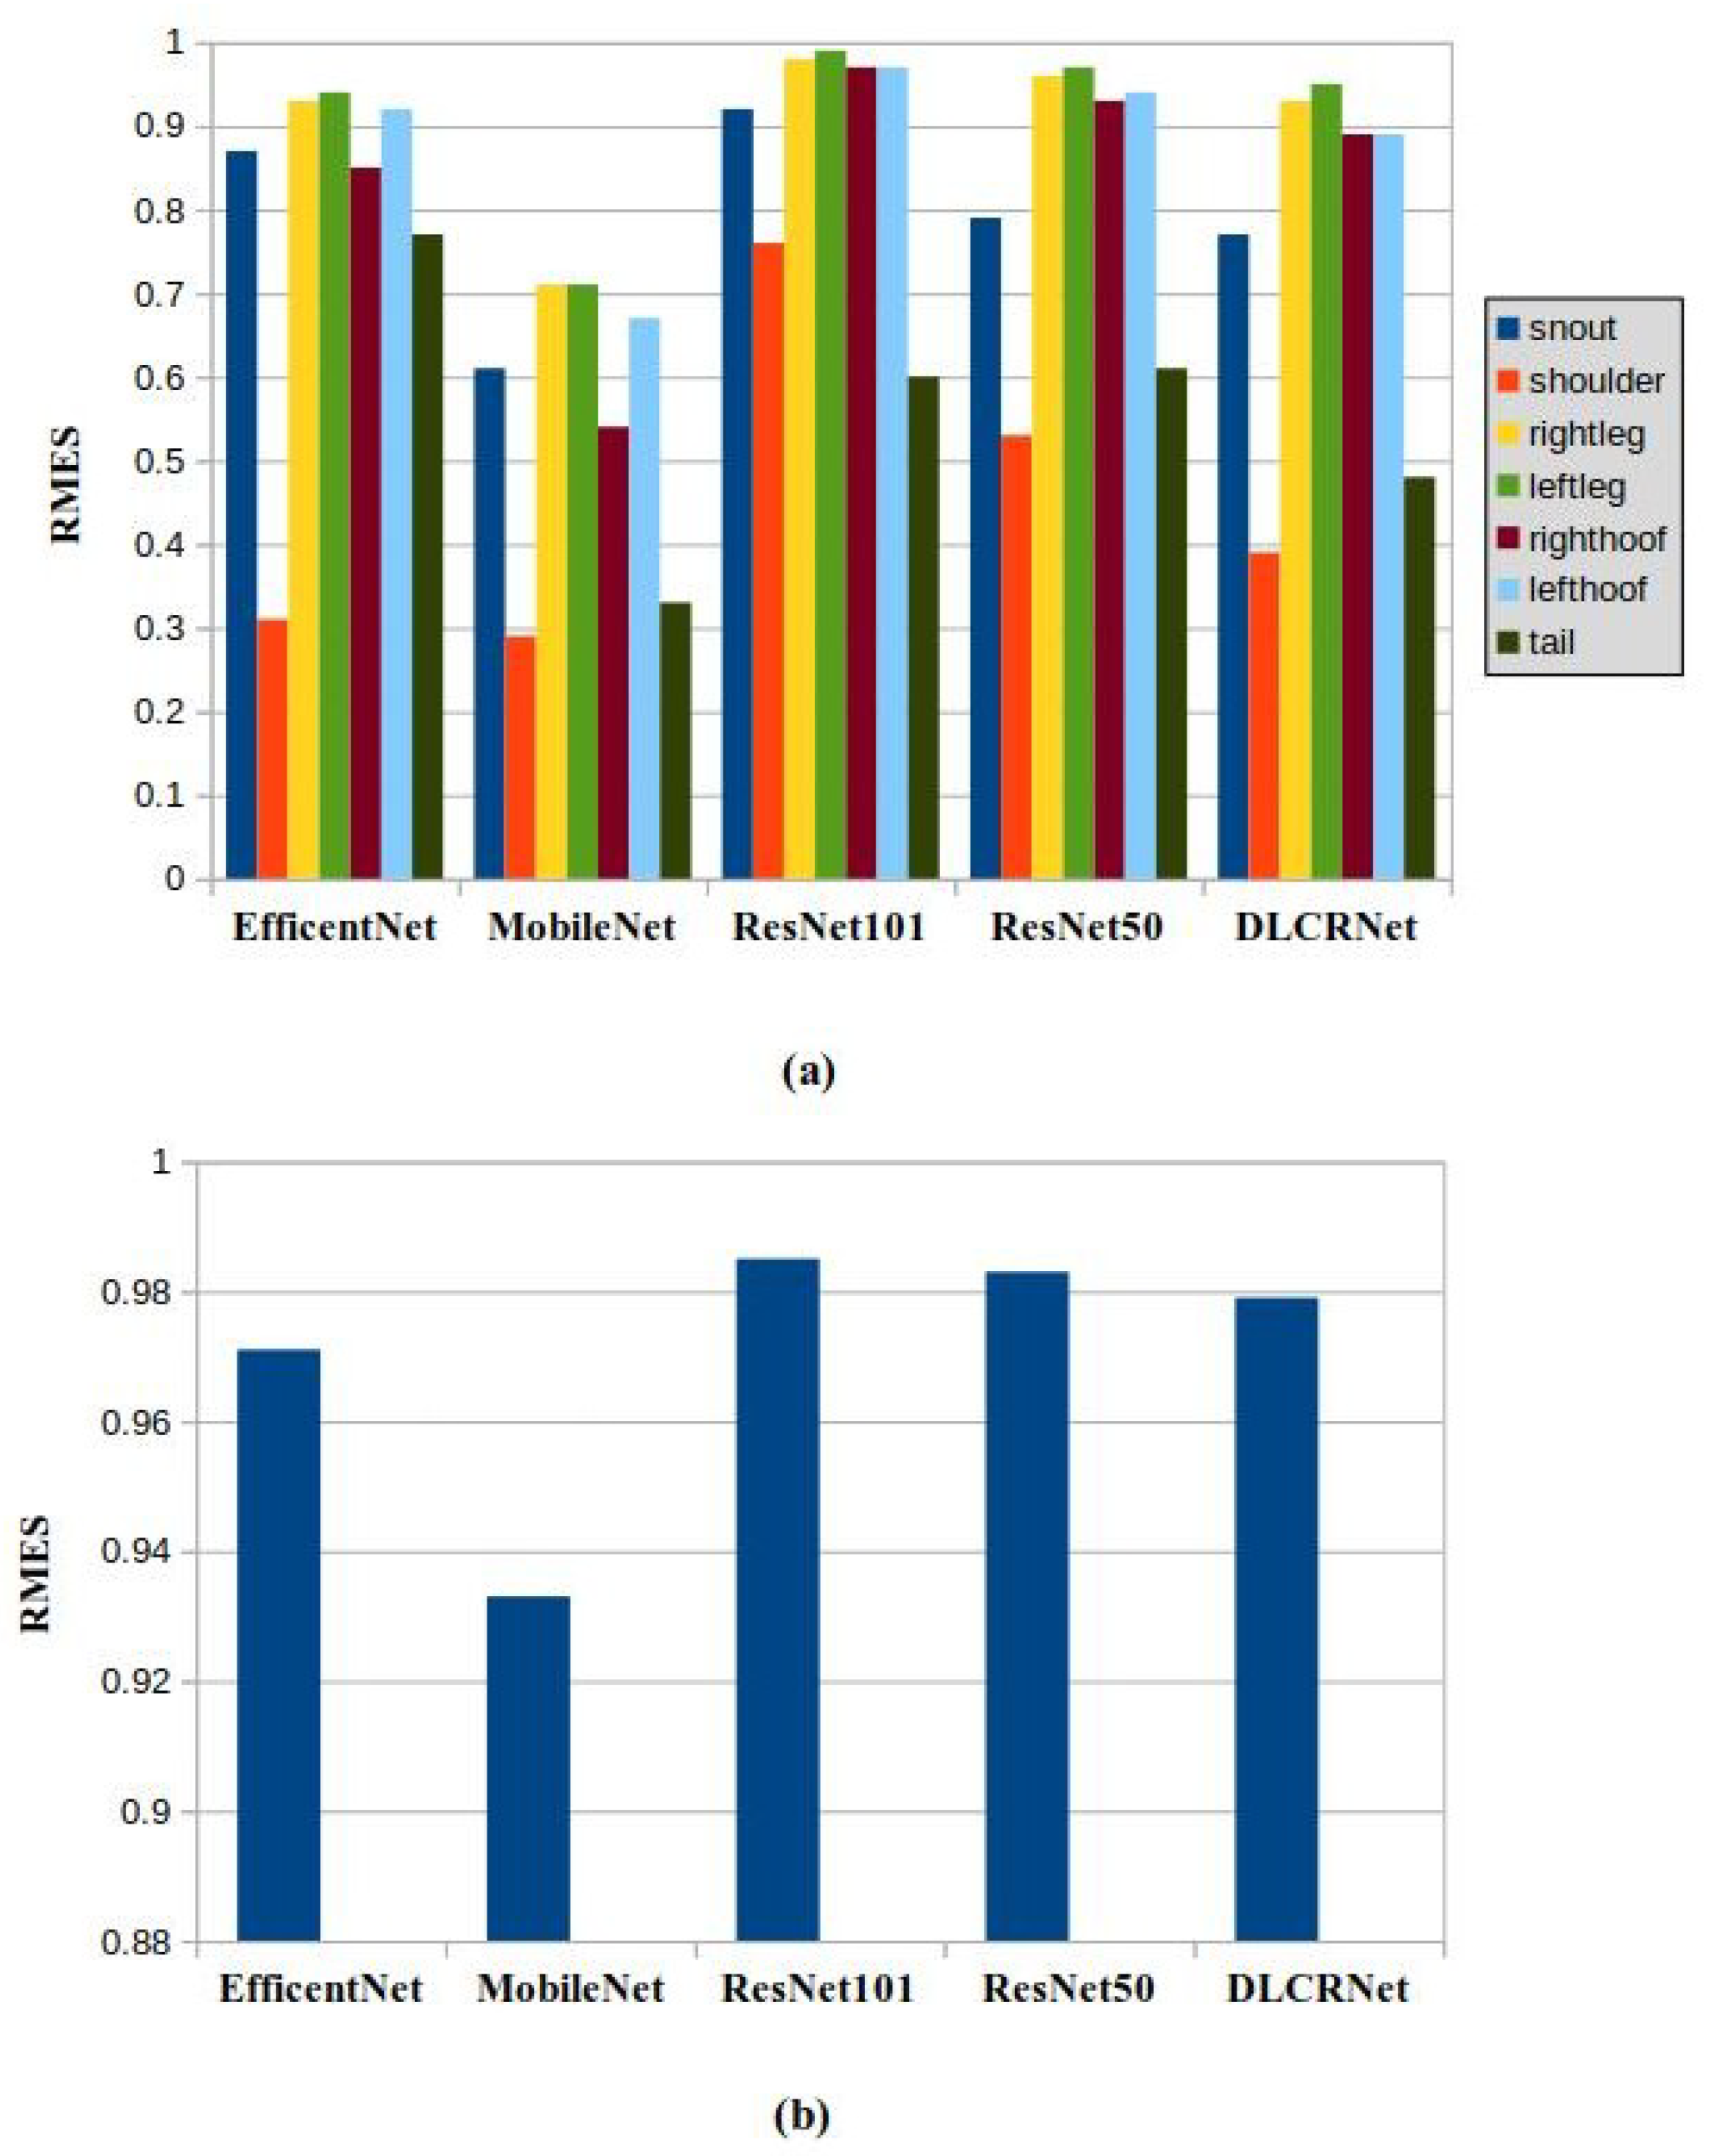
Figure 11.
The comparison of the score maps of the proposed networks.
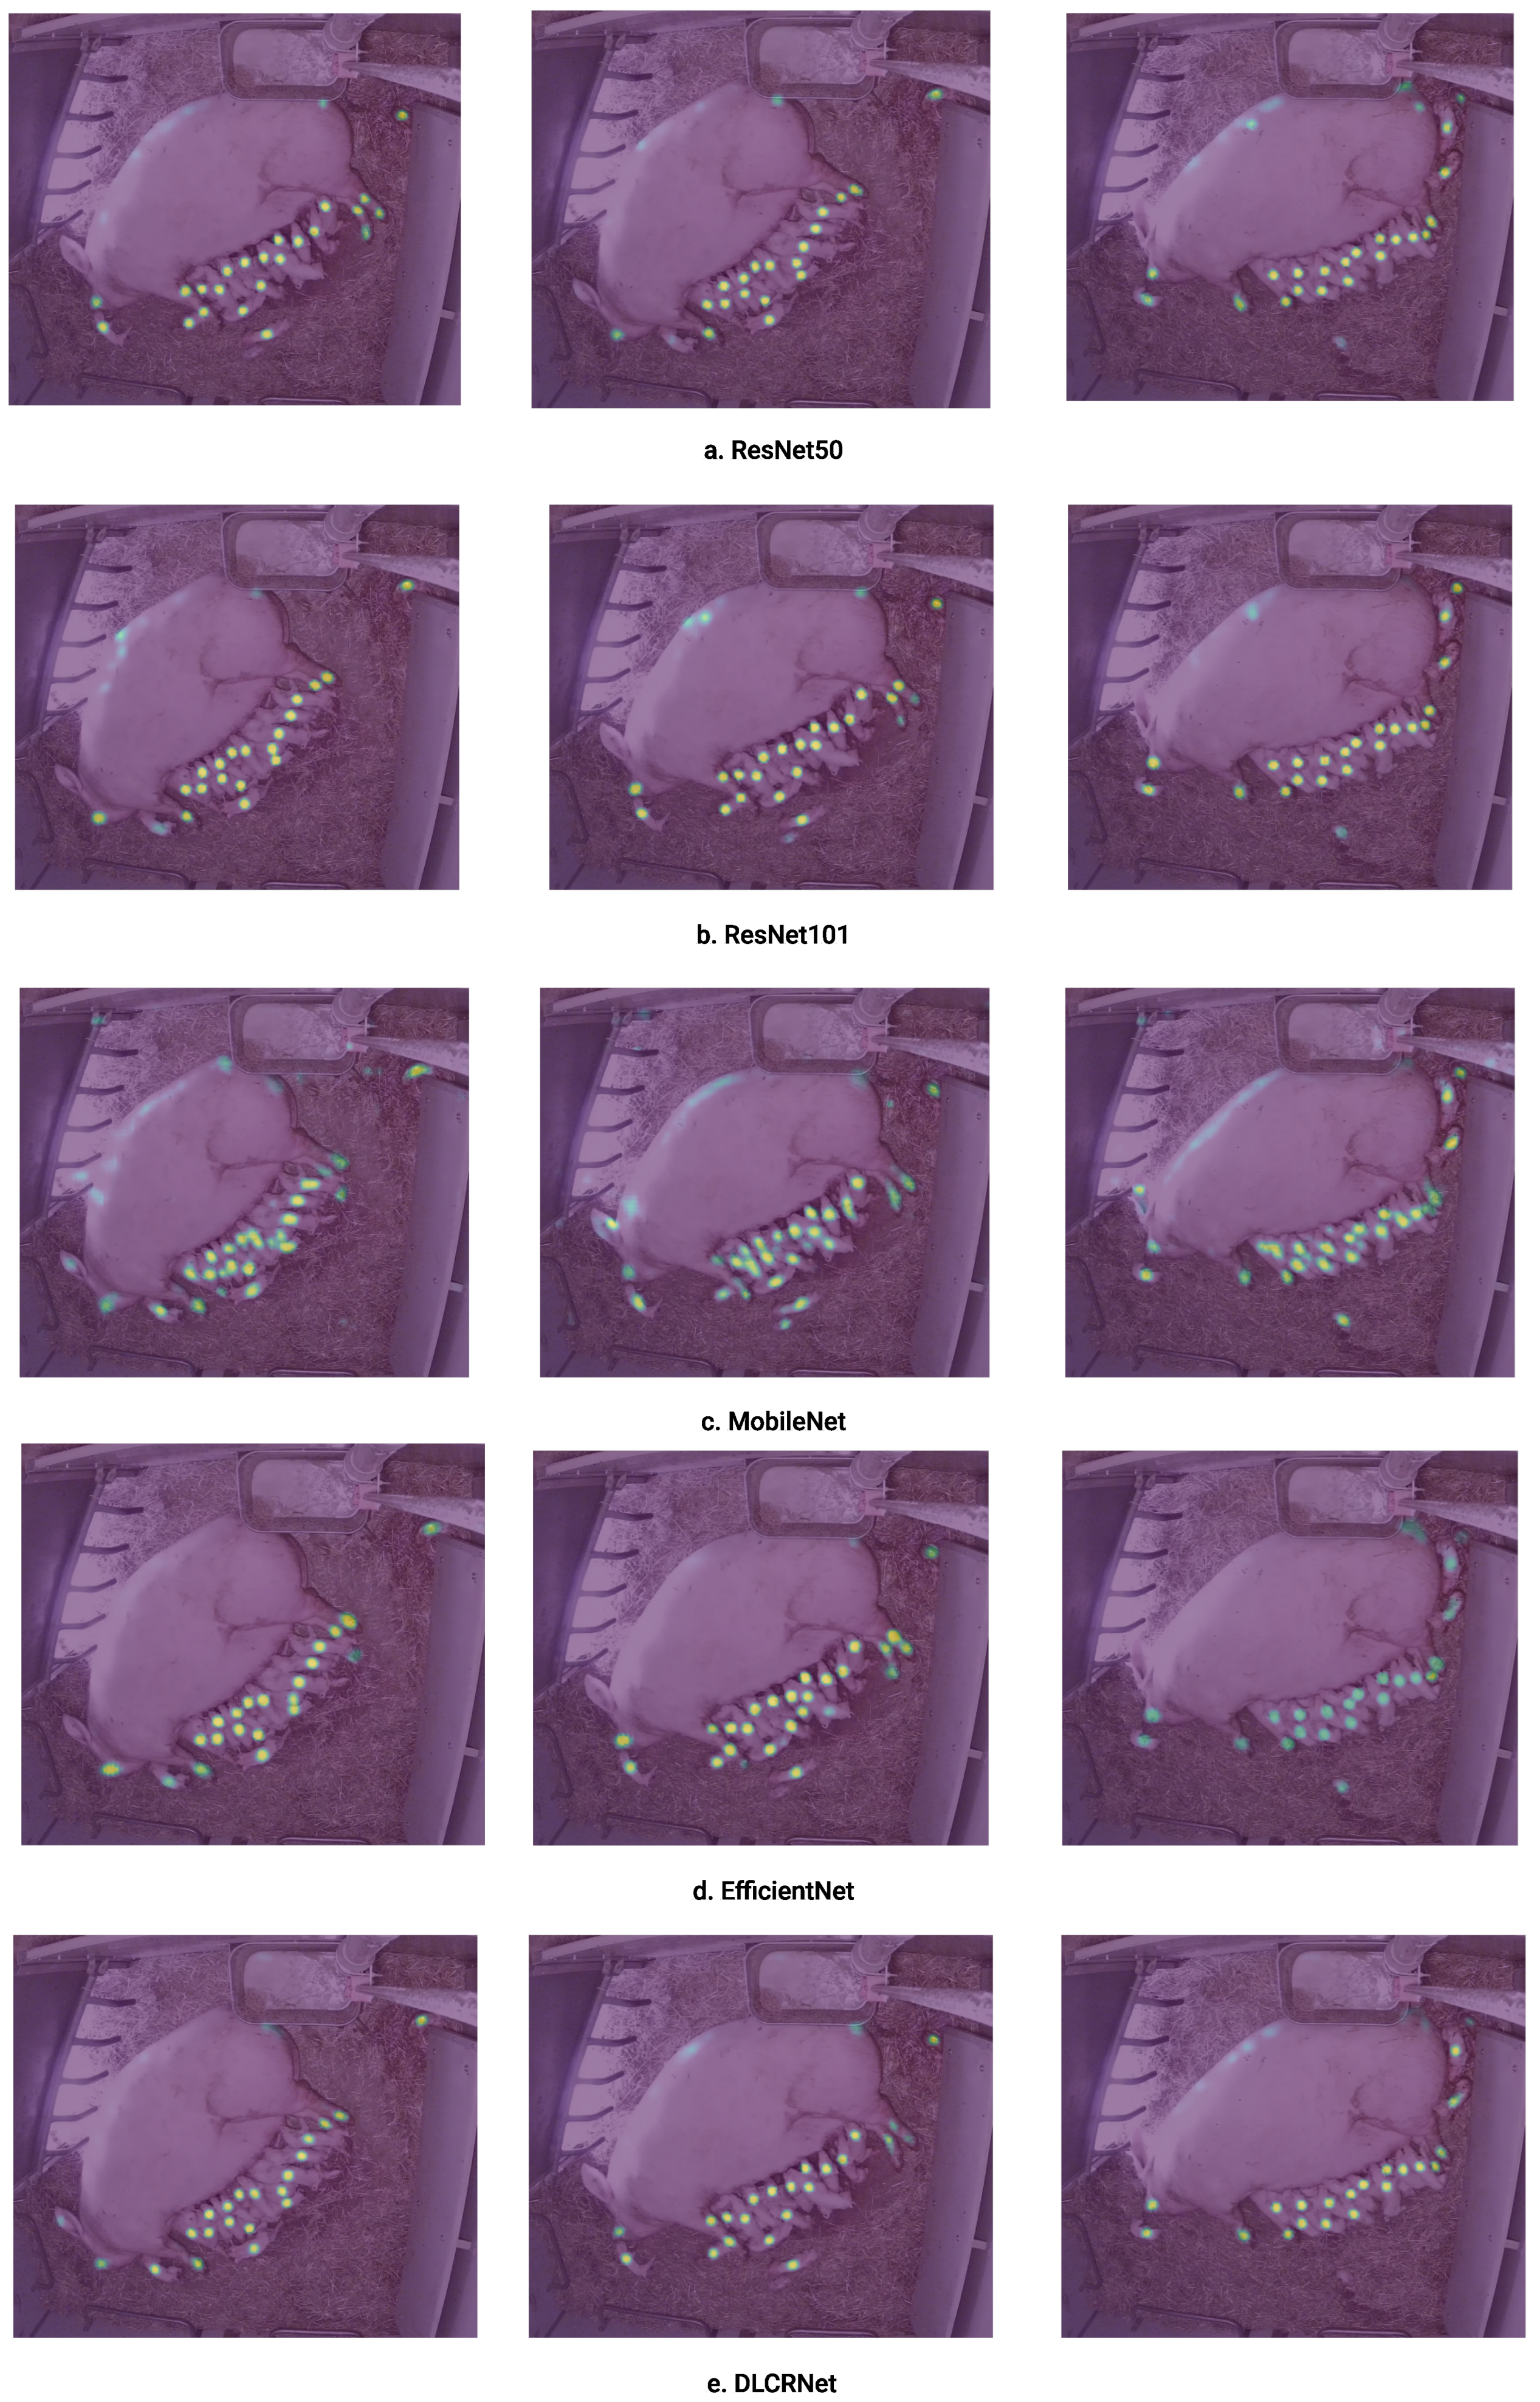
Figure 12.
The comparison of the location refinement maps of the proposed networks.
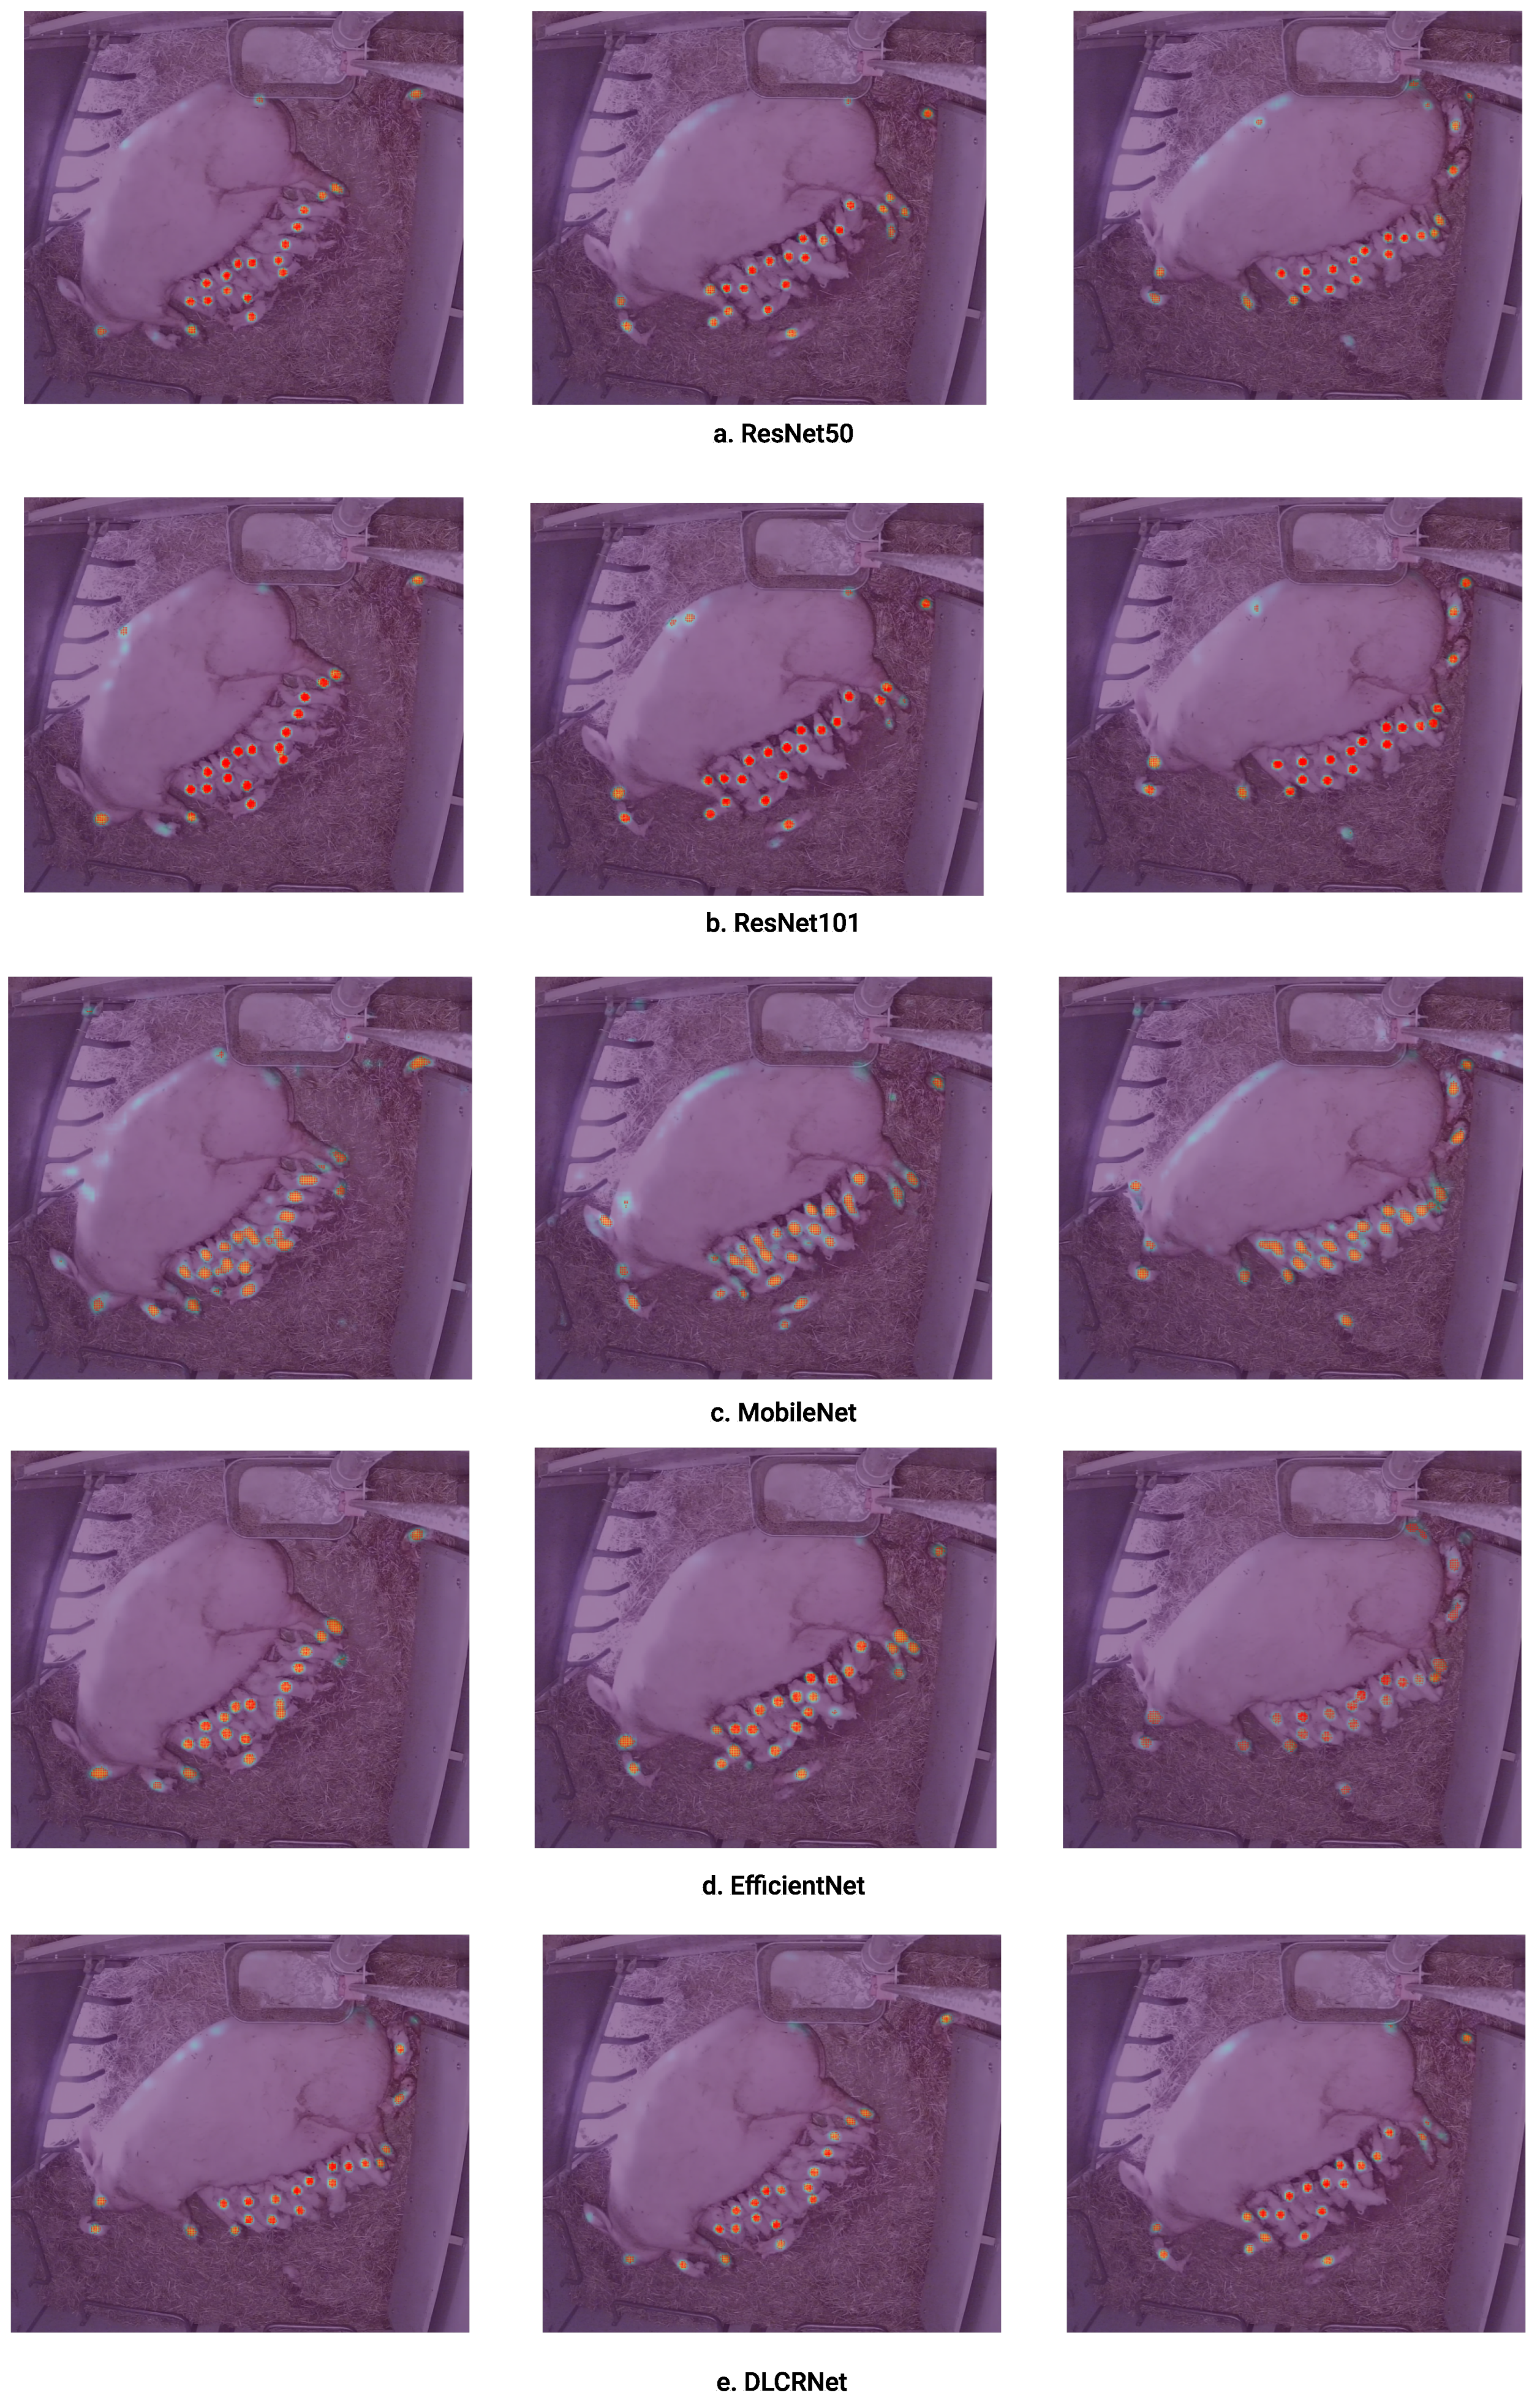
Figure 13.
Qualitative results of the proposed networks on three examples of test dataset. The human labels are plotted as a dot and framework’s predictions are plotted as a plus symbol (‘+’).
Figure 13.
Qualitative results of the proposed networks on three examples of test dataset. The human labels are plotted as a dot and framework’s predictions are plotted as a plus symbol (‘+’).
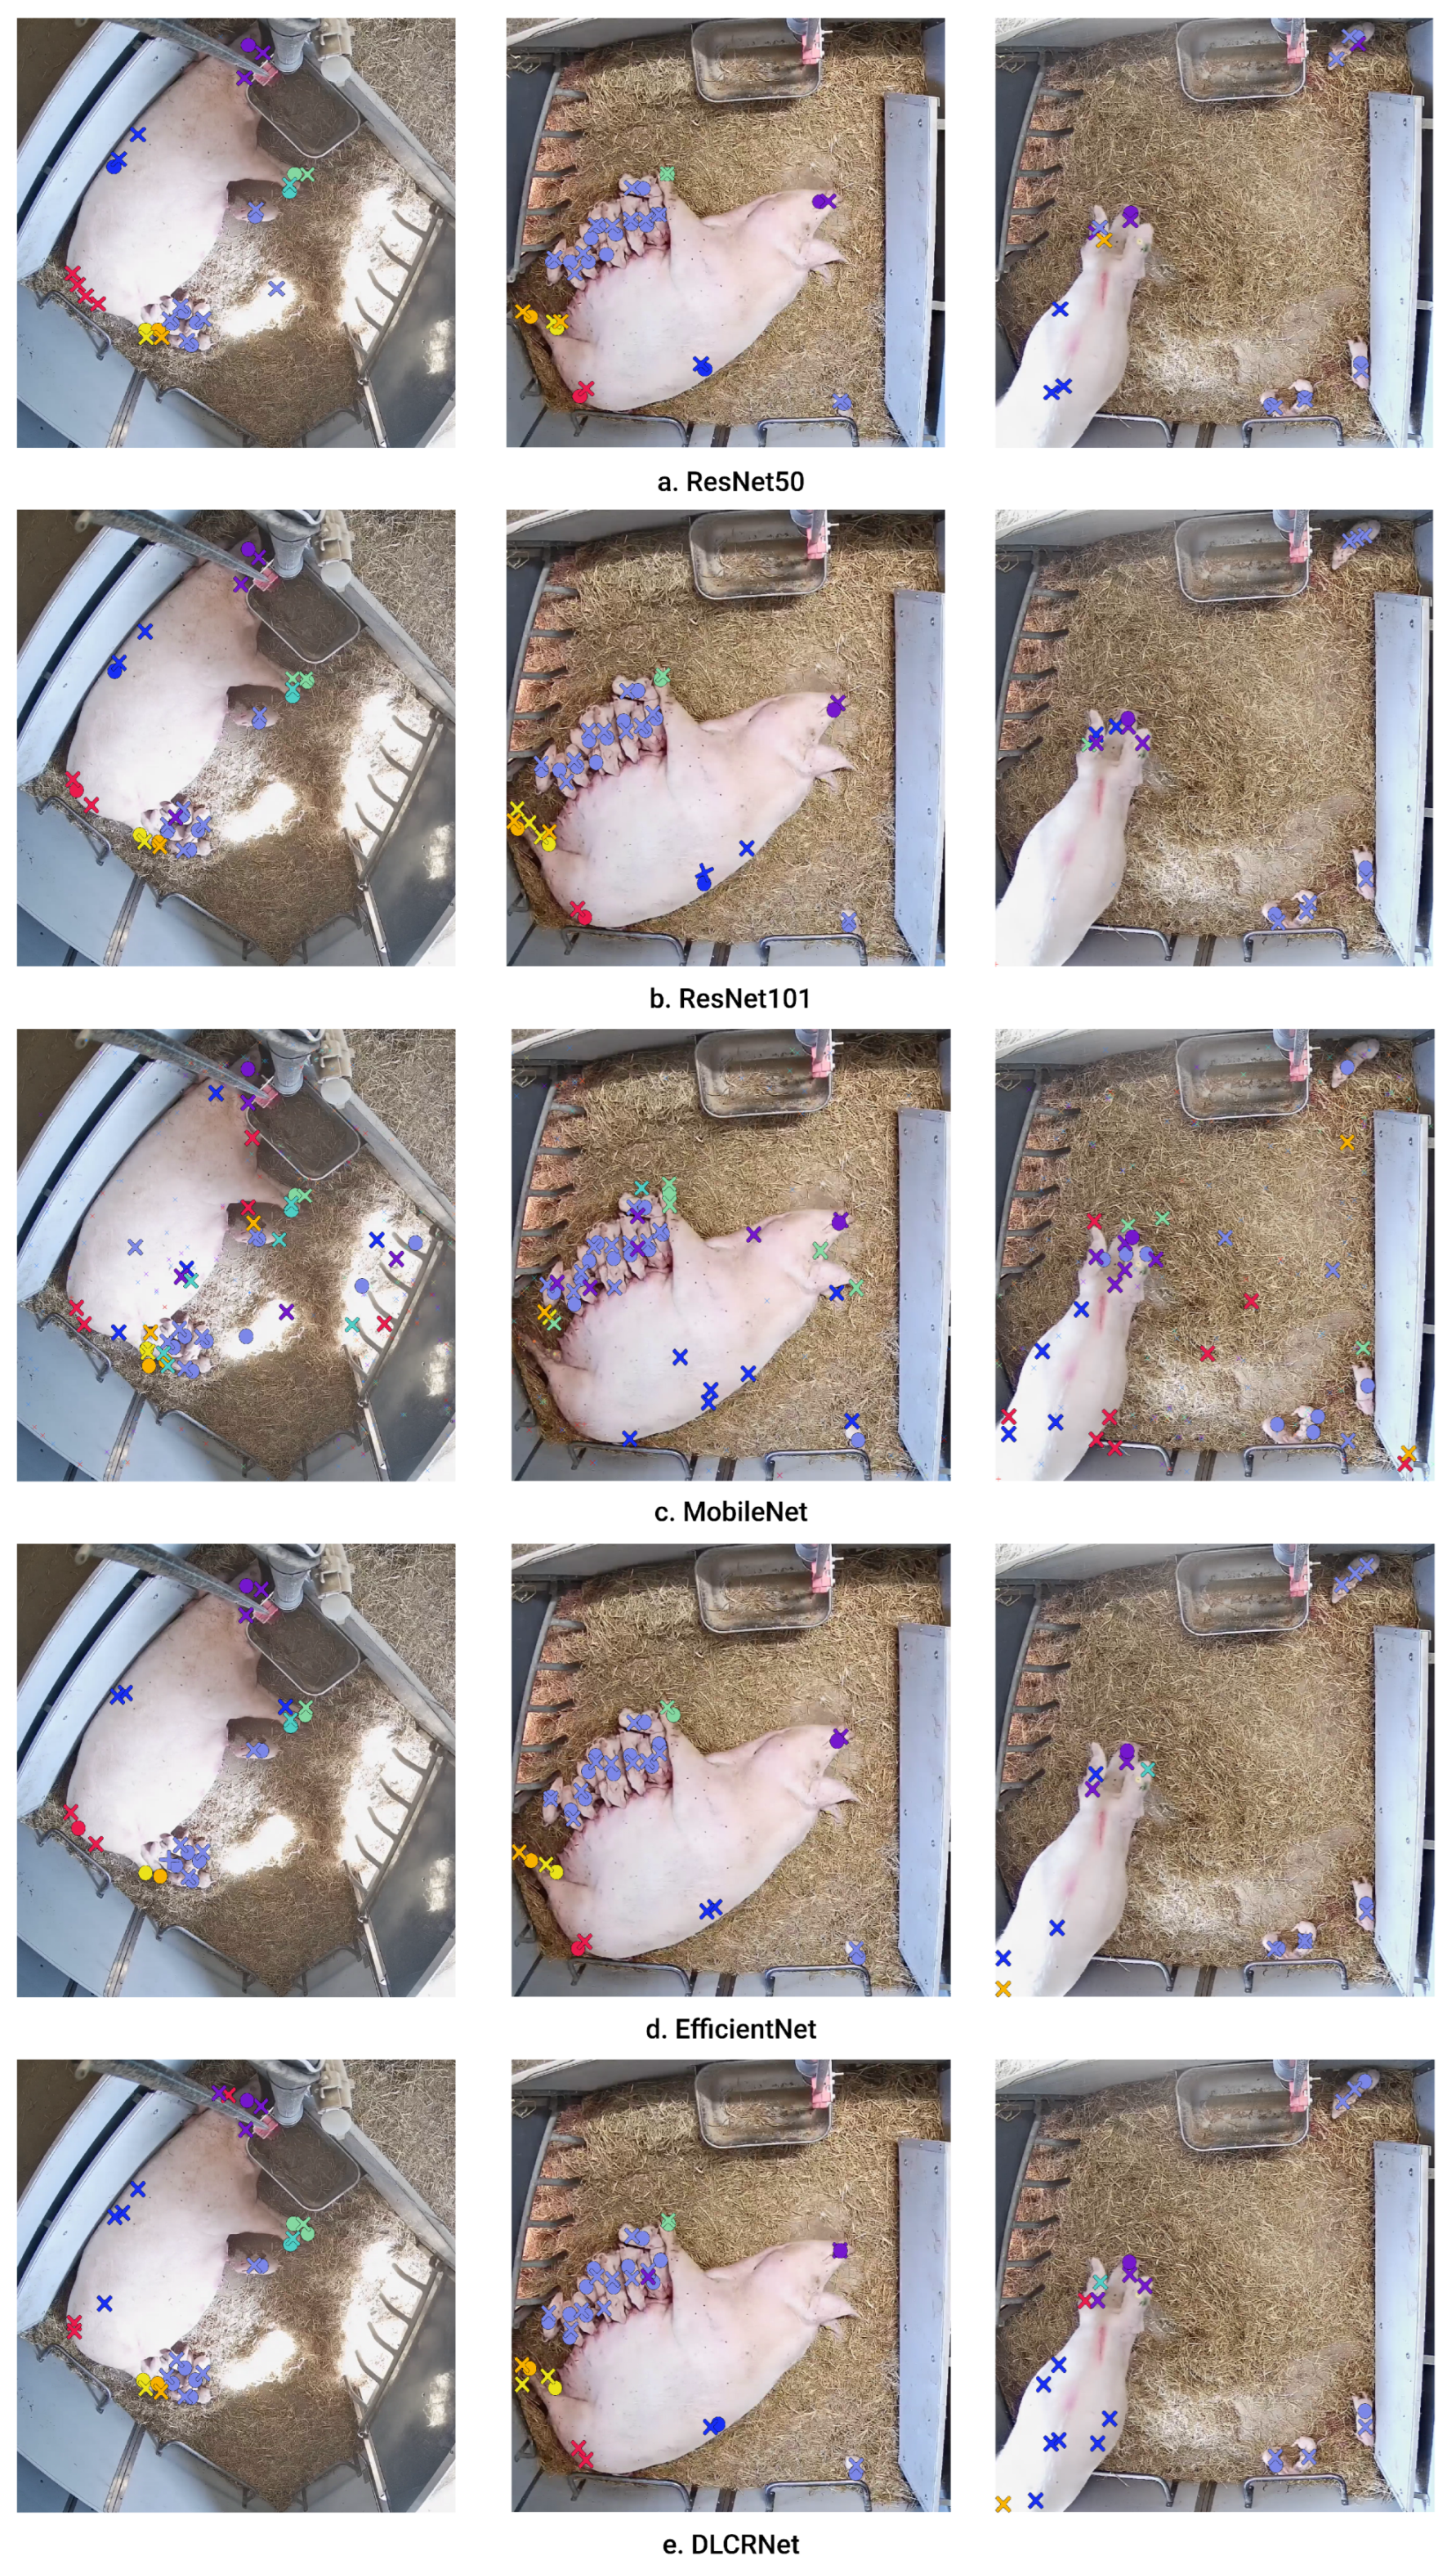

Table 1.
rain and test error (with p-cutoff ) of the proposed networks in pixels.
| EfficentNet | MobileNet | ResNet101 | ResNet50 | DLCRNet | |
|---|---|---|---|---|---|
| Train error | 12.71 | 16.28 | 5.92 | 6.97 | 8.12 |
| Test error | 34.98 | 24.12 | 28.71 | 37.21 | 33.48 |
| Train error with p-cutoff | 9.12 | 12.2 | 4.72 | 4.96 | 5.04 |
| Test error with p-cutoff | 19.95 | 16.72 | 18.6 | 19.12 | 21.66 |
Disclaimer/Publisher’s Note: The statements, opinions and data contained in all publications are solely those of the individual author(s) and contributor(s) and not of MDPI and/or the editor(s). MDPI and/or the editor(s) disclaim responsibility for any injury to people or property resulting from any ideas, methods, instructions or products referred to in the content. |
© 2023 by the authors. Licensee MDPI, Basel, Switzerland. This article is an open access article distributed under the terms and conditions of the Creative Commons Attribution (CC BY) license (http://creativecommons.org/licenses/by/4.0/).
Copyright: This open access article is published under a Creative Commons CC BY 4.0 license, which permit the free download, distribution, and reuse, provided that the author and preprint are cited in any reuse.


