
Submitted:
25 April 2023
Posted:
26 April 2023
You are already at the latest version
Abstract
Insulin-degrading enzyme (IDE) is a highly conserved metalloprotease mainly localized in the cytosol. Although IDE can degrade insulin and some other low molecular weight substrates efficiently, its ubiquitous expression suggests additional functions supported by experimental findings, such as a role in stress responses, cellular protein homeostasis. Translation of full-length (Met1) IDE transcripts has reported to result in targeting to mitochondria but the role of IDE in this compartment is unknown. To obtain initial leads on the function of IDE in mitochondria, here we used a proximity biotinylation approach to identify proteins interacting with wild-type and protease-dead IDE targeted to the mitochondrial matrix. We find that mitochondrial IDE interacts strongly with mitochondrial ribosomes as well as with proteins of the respiratory chain. The mitochondrial interactomes of wild type and mutant IDE are highly similar and do not reveal any proteolytic IDE substrates. We speculate that IDE could adopt similar functions in mitochondria as in the cytosol, acting as a chaperone and contributing to protein homeostasis and stress responses.
Keywords:
Mitochondrion
; respiratory chain
; mitochondrial translation
; chaperone
1. Introduction
IDE is a ubiquitous 110 kDa spherical protease with poorly understood functions that is found in both extra- and intracellular compartments, including the cytosol and also, to a lesser extent, in the plasma membrane, endosomes and peroxisomes [1,2,3,4,5]. The protein sequence of IDE is strikingly conserved amongst distantly related species, including those that do not produce insulin. Identity scores between sequences from human, chimpanzee, rat, and the mouse range between 95% and 99%. In other vertebrates, like the zebrafish, IDE still is 85% identical to the human sequence. These very high identity scores suggest important yet to be identified roles in the biology of the cell. IDE degrades insulin with high efficacy, but also several amyloidogenic peptides such as amyloid-beta, IGF-II, glucagon, amylin, as well as ubiquitin. Structural analysis by the Tang laboratory has revealed how IDE recognizes and cleaves conformationally metastable amyloidogenic peptides [6].
In humans and rodents, genetic data and deletion experiments suggest a role of IDE in glucose homeostasis: IDE gene knockout in mice results in glucose intolerance though the mice remain normoglycemic and are only slight hyperinsulinemic, if at all [7]. In addition, the IDE gene is linked to T2D and Alzheimer’s disease in humans. Acute treatment with two structurally different inhibitors designed independently by the teams of Deprez-Poulain in collaboration with us and Maianti produced only partially consistent effects on glucose tolerance in mice, underlining the complexity of the interaction between IDE and glucose and insulin homeostasis in vivo [8,9].
The reason underlying the high level of sequence conservation across species, and the ubiquitous expression of IDE, including in cells lacking identified IDE substrates remains unknown. However, over the last decades, experimental findings have established that IDE is also involved in a wide variety of biological processes. Tundo et al demonstrated that normal and malignant cells exposed to different stresses up-regulate IDE in a heat shock protein-like fashion and proposed that IDE binds proteins as a “dead end chaperone” [10]. Consistent with this, IDE was initially reported to function as receptor for VZV virus but then shown to bind to an intracellular VZV protein, most likely a misfolded fragment [11,12]. Literature reports also document that IDE co-immunoprecipitates with the proteasome and ubiquitin [13,14]. In line with a possible role in protein scavenging following ER stress, Schmitz et al reported an IDE-dependent clearance mechanism for ER-localized amyloid-b suggesting that IDE may be involved in a parallel ERAD pathway not dependent on the proteasome [15]. We have recently found that IDE deficiency induces triggers the unfolded protein response that is enhanced upon metabolic or pharmacologic stress and accompanied, at least in pancreatic islet cells, by cell proliferation (Zhu et al., manuscript submitted). Thus, available data suggest that IDE plays a role in protein homeostasis particularly in stress situations as well as in glucose metabolism. However, the mechanistic basis for these roles remains unclear.
Although wild-type IDE is predominantly located in the cytosol in all cell types studied so far, IDE is also found in mitochondria. The amino acid sequences of full-length human and mouse IDE features two alternative in-frame initiating methionines at the positions 1 and 42. Bioinformatics analysis of the full-length IDE protein sequence predicts the presence of a mitochondrial targeting sequence (MTS) downstream of Met1, a prediction confirmed by the mitochondrial localization of eGFP preceded by the N-terminal portion of Met1-IDE [16]. Importantly, although the presence of a more efficient Kozak sequence promotes dominant translation initiation at Met42 resulting in dominant cytosolic localization, a fraction of IDE can be detected in mitochondria from wild-type CHO and HEK cells, indicating physiologic relevance of translation initiation at Met1. Observing highly efficient in vitro cleavage of a synthetic MTS by IDE, possibly related to the frequent presence of arginine residues preferred by IDE in MTS, Leissring and colleagues speculated that IDE might contribute to physiologic cleavage of MTS assisting other critical enzymes [17,18]. However, mitochondrial IDE might also have more important roles. For example, IDE has been suggested to cooperate with the mitochondrial SIRT4 deacetylase to mediate lysosomal degradation of PTENα and promote survival in response to starvation stress [19]. Due to its capacity of cleaving amyloid-b, IDE might also help preventing accumulation of toxic Ab in mitochondria [20]. Considering the complete lack of information about the biological roles of IDE in mitochondria, we set out to identify interactions of IDE with mitochondrial proteins using a proximity biotinylation approach. We report that both wild-type and protease-dead mitochondrial IDE interact primarily with proteins involved in mitochondrial protein translation and in the citric acid cycle. While the functional impact of these interactions remains to be determined, we speculate that mitochondrial IDE, like the dominant cytosolic form, might be involved in mitochondrial protein homeostasis, particularly in stress situation.
2. Materials and Methods
2.1. Generation of TurboID (Biotin Ligase BirA Mutant) Fusion Constructs, Lentivirus Production and Transduction
Lentiviral constructs were built in the vector pLVX-tdTomato-N1 (Takara) which was first modified by the insertion between XhoI (5') and BamHI (3') in the multiple cloning site of a synthetic gene, containing (5' to 3') SmaI and MluI restriction sites, the sequence coding for P2A/T2A self-cleaving peptides (ATNFSLLKQAGDVEENPGP / EGRGSLLTCGDVEENPGP) and td-Tomato, resulting in the vector pLVX-tdTomato-P2A-T2A-tdTomato.
To generate the lentiviral expression constructs IDE-TurboID and IDEMut E111D-TurboID, full-length cDNA (complementary DNA) encoding wt or protease-dead human IDE was amplified from the previously published constructs IDE- or IDEMut E111D-pCRBlunt (Beuzelin, 2013) with primers adding XhoI at the 5' end and including an EcoRI site ahead of the stop codon. The PCR product was first cloned as XhoI-EcoRI fragment into the vector pMA-RQ previously modified by insertion of a synthetic sequence comprising 79 base pairs at 3’end of IDE including the EcoRI site but not the stop codon, and sequences encoding a GSAGSA linker, the V5 peptide, the TurboID enzyme and a MluI site at the 3’ end. The sequence encoding TurboID precded by the V5 peptide was taken from Branon et al. [21]. Finally, the complete constructs were transferred as XhoI-MluI fragments into pLVX-P2A-T2A-tdTomato.
The construct pLVX-MTS-OVA-V5-TurboID-td-Tomato was produced by amplifying a fragment comprising the GSAGSA linker, V5 and TurboID DNA sequences with primers containing SmaI (5’) and MluI (3’) restriction sites and inserting the PCR product into the plasmid pLVX-MTS-OVA-T2A-P2A-tdTomato previously generated in the laboratory. The latter plasmid carries the mitochondrial targeting sequence (MTS) from human cytochrome c oxidase (MSVLTPLLLRGLTGSARRLPVPRAKIHSL; NCBI, NM_205152.3) and SmaI and MluI sites between the T2A-P2A and tdTomato sequences. Synthetic genes were purchased from GeneArt (Thermo Fisher Scientific). The primers for PCR amplification are listed in TableS2.
Plasmid DNA was extracted and purified with the Nucleobond Xtra Midi EF kit (Macherey-Nagel) and used to produce lentiviruses with an average titer of 109 TU/ml. The HEK (human embryonic kidney) 293T cell line was transduced at a multiplicity of infection (MOI) of 5 for 6h. Cells were selected starting 48h after infection with puromycin at the concentration of 10 μg/ml. After 2-3 passages in selection media, the percentage of transduced cells was determined by quantifying td-Tomato positive cells by flow cytometry.
2.2. Confocal Microscopy
4 x 10⁴ cells were seeded onto glass coverslips pre-coated with Poly-D-Lysine overnight. The cells were fixed for 12min with a solution containing 4% paraformaldehyde, 0.2% glutaraldehyde, 60mM PIPES (piperazine-N,N′-bis(2-ethanesulfonic acid)), 25mM HEPES((4-(2-hydroxyethyl)-1-piperazineethanesulfonic acid), 10mM EGTA (ethylene glycol-bis(β-aminoethyl ether)-N,N,N′,N′-tetraacetic acid), 2mM Magnesium acetate and then permeabilized with 0.2%Triton X-100 in DPBS (Dulbecco's phosphate-buffered saline) for 10min. After blocking with 5% donkey serum in PBS-0.05% Tween-20 for 2h at RT (room temperature), the cells were incubated sequentially with primary antibodies overnight at 4°C (IDE, V5, T0M20 all at 1:100) and with the appropriate secondary antibodies (1:200) for 2h at RT (Table S1). Nuclear counterstaining was carried out using DAPI (4′,6-diamidino-2-phenylindole) at the concentration of 1 μg/ml. The slides were mounted with Vectashield Plus Antifade media. Image acquisitions were performed with a 63x oil immersion objective (NA 1.4) and a laser scanning confocal microscope (TCS SP8-3X STED; Leica Microsystems). Images were processed with Icy (https://icy.bioimageanalysis.org).
2.3. Western Blot
Standard denaturing SDS-PAGE analysis was performed using Mini Gel Tank equipment (Thermo Fisher Scientific). Proteins were transferred onto PVDF (polyvinylidene difluoride) membrane with the iBlot 2 Dry Blotting System (Thermo Fisher Scientific). The membranes were blocked with BSA (Bovine serum albumin) 5% in TBS (Tris-buffered saline)-Tween 0.1% 1h at RT and then incubated with the primary antibody overnight at 4°C and with the secondary antibody 2h at RT. Antibody binding was visualized by enhanced chemiluminescence with SuperSignalTM West Pico PLUS Chemiluminescent Substrate (Thermo Fisher Scientific) and the images were acquired on the ChemiDoc Imaging System (BioRad). Primary and secondary antibodies are listed in Supplemental Materials (Table S2)
2.4. TurboID-based Enzymatic Protein Labeling and Extraction of Biotinylated Proteins for Proteomic Analysis
Proximity labeling by the TurboID enzyme fused to IDE and MutIDE expressed in HEK cells was performed according to the method described by Cho and coworkers [22]. Briefly 20x106 HEK293T cells expressing the IDE-TurboID proteins were cultured at 37°C 5% CO2 in DMEM (Dulbecco’s Modified Eagle Medium) medium containing 10U/ml penicillin-streptomycin, 2 mM Glutamine (Sigma) and 10% dialyzed FCS (Fetal calf serum, Eurobio Scientific) for 24h. Then the cells were incubated with 50μM biotin (Sigma-Aldrich) for 15min. The labeling reaction was stopped by placing the cells on ice and washing out biotin excess with ice-cold DPBS (Thermo Fischer Scientific). The cells were detached via pipetting with 10 ml of ice-cold DPBS and centrifuged at 300g. The cell pellet was lysed in 2ml of RIPA (Radio immunoprecipitation assay) lysis buffer (Thermo Fisher Scientific) supplemented by 1x protease inhibitor cocktail (Complete EDTA (Ethylenediaminetetraacetic acid)-free protease inhibitors, Roche Diagnostic) and incubated on ice for 30min. The cell lysate was clarified by centrifugation at 13000xg at 4°C for 10min and transferred to a fresh tube. Protein concentration was measured by BCA (bicinchoninic acid) protein assay (Bio-Rad). For the enrichment of biotinylated proteins, 2.5mg proteins in 1.8ml RIPA buffer were incubated with 200 μl Streptavidin magnetic beads (Thermo Fisher Scientific) overnight at 4°C. Afterward the supernatant was removed using a magnetic rack to pellet the beads which were washed twice with RIPA buffer (1 ml, 2min), once with KCl 1M (1 ml, 2min), once with Na2CO3 0.1M (1 ml, 10s), once with urea 2M in 10mM Tris-HCl (pH 8.0) (1ml, 10s). After the final wash the beads were transferred in 1ml RIPA buffer to a fresh tube and washed again with RIPA buffer (1 ml, 2min). The enriched biotinylated proteins were eluted from the beads in 80 μl of 4X Laemmli buffer (Biorad) supplemented with 2mM biotin and 20mM DDT (dichloro-diphenyl-trichloroethane) at 95°C for 10min. The input, the flow-through and the enriched material from each sample were analyzed by Western blot before performing proteomic analysis.
2.5. Identification and Quantification of Proteins by NanoLC-MS/MS
Sample digestion was performed on S-TrapTM microcolumns (Protifi, Hutington, USA) according to the manufacturer's instructions. Samples (60µl, IP) were supplemented with 20% SDS to a final concentration of 5%, reduced with 20mM TCEP and alkylated with 50mM CAA (chloracetamide) for 15min at room temperature. Aqueous 27.5% phosphoric acid was then added to a final concentration of 2.5%, followed by the addition of binding buffer (90% methanol, 100mM TEAB, pH 8). The mixtures were then loaded onto S-Trap columns and centrifuged for 30sec at 3000g. The columns were washed 6 times (3000xg, 30sec) to ensure complete removal of SDS. Samples were digested with 1µg trypsin (Promega) at 47°C for 1.5h. After elution, the peptides were dried under vacuum and resuspended in 20µL of 2% ACN, 0.1% formic acid in HPLC grade water prior to MS analysis.
2µL of the tryptic peptides were injected onto a nanoElute HPLC system (Bruker Daltonics, Germany) coupled to a timsTOF Pro mass spectrometer (Bruker Daltonics, Germany). HPLC separation (Solvent A: 0.1% formic acid in water, 2% acetonitrile; Solvent B: 0.1% formic acid in acetonitrile) was performed at 250nL/min using a packed emitter column (C18, 25cm×75μm 1.6μm) (Ion Optics, Australia) using gradient elution (2-11% solvent B for 19min; 11-16% for 7min; 16%-25% for 4min; 25%-80% for 3min and finally 80% for 7min to wash the column). Data were acquired using the PASEF (parallel accumulation serial fragmentation) acquisition method. Measurements were performed over the m/z range from 100 to 1700 Th. The range of ion mobility values was from 0.85 to 1.3 V s/cm2(1/k0). The total cycle time was set at 1.2 s and the number of PASEF MS/MS scans was set at 6.
2.6. Data Processing after LC-MS/MS Acquisition
The raw file folders (.d) were processed with MaxQuant 2.0.1 software and searched with the Andromeda search engine in the UniProtKB/Swiss-Prot Homo Sapiens database (version 01-02-2021, 20396 entries). To search for parent and fragment mass ions, we set an initial mass deviation of 4.5 ppm and 20 ppm respectively. The minimum peptide length was set at 7 amino acids and strict specificity for trypsin cleavage was required, allowing up to two missed cleavage sites. Carbamidomethylation (Cys) was defined as a fixed modification, while oxidation (Met) and N-term acetylation were defined as variable modifications. Matching between the series was not allowed. The minimum number of LFQ (Label Free quantification) ratios was set at 2. False discovery rates (FDR) at the protein and peptide level were set at 1%. Scores were calculated in MaxQuant as described previously [23]. The reverse and common contaminants were removed from MaxQuant output. Proteins were quantified according to the MaxQuant label-free algorithm using LFQ intensities. Finally, match between runs was allowed during the analysis.
Four independent immunoprecipitations per group were analyzed with Perseus software (version 1.6.15.0) freely available at www.perseus-framework.org [24]. Protein intensities were log2 transformed, and proteins identified in at least 4 replicates in at least one group were statistically tested (volcano plot, FDR=0.05 and S0=0.1) after imputation of the missing value by a Gaussian random number distribution with a standard deviation of 30% from the standard deviation of the measured values and a downward shift of 1.8 standard deviations from the mean. In order to increase selectivity of the candidate, a double comparison was performed between IDE/mutIDE (with biotin) vs Negative control (with biotin), and IDE/mutIDE (with biotin) vs IDE/mutIDE (without biotin). For IDE and mutIDE, proteins significantly enriched in both comparisons were highlighted.
2.7. IDE Interactome Data Analysis
Functional protein networks of IDE and MutIDE interactome data were annotated with STRING Software (version 11.5) [25]. Lists of (i) all proteins significantly enriched in IDE or MutIDE samples incubated with biotin relative to both control samples (samples without biotin and OVA samples), and of proteins (ii) enriched in biotin samples relative to OVA controls only with fold change > 3.5 or (iii) enriched in biotin samples relative to samples without biotin only with fold change > 5.5, were input into the String database in the section multiple protein analysis. The organism was set as Homo Sapiens. The parameter chosen for network analysis was “full string network” with a minimum required interaction score of 0.04. Interactions were limited to protein query only. The PPI (Protein Protein interaction) enrichment p-value was ≤ 10e-16 and the average local clustering coefficient varied between 0.5-0.6 for the data sets analyzed.
Pathway enrichment analysis was analyzed with Metascape (https://metascape.org) [26]. The list of selected gene was submitted to Metascape (Version v3.5.20230101). Process enrichment analysis was carried out with the following ontology sources: KEGG Pathway, GO Biological Processes, Reactome Gene Sets, Canonical Pathways, CORUM, and WikiPathways. The complete human genome was used as enrichment background. Terms with a p-value < 0.01, a minimum count of 3, and an enrichment factor > 1.5 (i.e., the ratio between the counts observed and the counts expected by chance) were collected and grouped into clusters based on their membership similarities. p-values are calculated based on the cumulative hypergeometric distribution, and q-values are calculated using the Benjamini-Hochberg procedure to account for multiple testing. The most statistically significant term within a term cluster is chosen to represent the cluster. Top clusters with their representative enriched terms (one per cluster) are depicted as bar graphs with a discrete color scale indicating statistical significance expressed as -log10.
3. Results
3.1. Design and Verification of the Proximity Biotinylation System
3.1.1. Constructs and Protein Expression
To identify proteins interacting with mitochondrial IDE, we chose to use the TurboID proximity biotinylation system [22]. This system uses a fast biotin ligase so that incubations of a few minutes are usually sufficient for biotinylation of neighboring proteins. We constructed a fusion protein in which a full-length IDE sequence starting at Met1 was joined via a V5 tag to the ligase (Figure 1A). To allow for flow cytometric selection of cells expressing the construct, a cDNA encoding fluorescent tdTomato was joined to the ligase C-terminus, separated by a self-cleaving peptide. Considering that some functions of IDE may be independent of its proteolytic activity, notably in the response to proteotoxic stress [27], we also expressed mutant IDE with a Glu-Asp mutation at position 111 which decreases enzyme activity to <1% [28]. To produce a control TurboID fusion protein residing in mitochondria, we designed an analogous construct in which IDE was replaced by OVA preceded by an efficient mitochondrial targeting sequence from human cytochrome C oxidase. All fusion constructs were inserted into a lentiviral expression vector and used to transduce human embryonal kidney cells (HEK293) cells. After puromycin selection, >80 des cellules were tdTomato positive in flow cytometric analysis. TdTomato fluorescence was subsequently used routinely to confirm continued high-level expression of fusion constructs.
To verify fusion protein expression, we analyzed cell lysates by immunoblot (Figure 1B). Cells transduced with viruses encoding IDE displayed a band with the molecular weight expected for the fusion of IDE with TurboID (162 kDa) in addition to the endogenous IDE protein (118 kDa) and a minor band likely corresponding to the entire fusion protein including tdTomato (215 kDa). Consistent with this, major and minor bands corresponding to cleaved and uncleaved fusion proteins, respectively, were detected using an antibody to the V5 tag. An additional protein migrating just above the endogenous IDE protein and reacting with IDE and V5 antibodies may correspond to aberrant cleavage just downstream of the V5 tag. Analysis of cells expressing OVA revealed bands corresponding to the expected cleaved fusion protein (85 kDa) and a band (about 47 kDa) that may again correspond to cleavage just after the V5 tag.
3.1.2. Protein Localization
To verify the intracellular localization of the TurboID fusion protein, we analyzed HEK cells transduced with lentiviruses encoding the IDE and OVA fusion proteins by confocal microscopy, using antibodies to the two proteins and to the V5 tag as well as an antibody recognizing TOM20, a subunit of the Translocase of the mitochondrial Outer Membrane. As expected, TOM20 marked the contours of mitochondria in all cells (Figure 2A–D). IDE staining of control HEK cells revealed a diffuse cytosolic pattern consistent with the dominant expression of the Met42 IDE transcript that results in cytosolic IDE localization (Figure 2C). In contrast, staining of both wt and protease-dead IDE as well as mitochondrial targeted OVA revealed exclusive vesicular staining consistent with mitochondria. In merged images, IDE and OVA antibody-stained structures appeared encircled by TOM20 staining, suggesting that both proteins localized to the internal mitochondrial space and not to the outer membrane.
3.1.3. Biotinylation Setup
Next, we analyzed the efficacy of protein biotinylation by the TurboID fusion proteins, using immunoblot staining of bulk biotinylated proteins with streptavidin (Figure 1SA). Non-transduced control cells and IDE fusion protein-expressing cells were incubated for 10 min with 50 to 500 μM biotin in the presence of dialyzed or standard fetal calf serum. Immunoblot analysis revealed several background bands evident in control and transduced cells and unaffected by biotin addition. In transduced cells, biotin addition resulted in appearance of a major band likely corresponding to auto-biotinylation of the cleaved IDE fusion protein (162 kDa) as well as a series of faint bands migrating between markers of 15 to 70 kDa. FCS dialysis had little effect on background but reduced fusion protein auto-biotinylation, and there were no biotin dose effects, so that we used standard FCS and 50 μM biotin in all following experiments.
To perform preparative scale experiments, we then applied these conditions to batches of 20 x 106 cells. Following biotin incubation, cells were lysed in RIPA buffer, lysates applied to magnetic streptavidin-coated magnetic beads, and bound proteins were eluted with biotin. Immunoblot analysis of extracts and eluted proteins from cells expressing IDE or OVA fusion proteins not incubated with biotin revealed a dominant band around 70kDa that was moderately enriched in eluates (Figure 1SB). In contrast, addition of biotin resulted in appearance of multiple bands that were strongly enriched by affinity purification. Curiously and in contrast to preliminary analytical results, affinity purification enriched most strongly for auto-biotinylated OVA but not IDE. Thus, analysis of preparative scale experiments showed strong biotin-dependent enrichment of proteins binding to streptavidin, so that we proceeded to proteomic analysis.
3.2. Identification of Proteins Interacting with wt and Mutant Mitochondrial IDE
Proteomic analysis of samples from independent replicates of cells expressing IDE fusion proteins identified a total of almost 4000 proteins. To identify proteins enriched significantly, we performed a double comparison of proteins detected in biotin-incubated samples with OVA spatial compartmentalization samples and IDE samples incubated without biotin. Using a Fold Change (FC) threshold S0 of 0.1 and a FDR threshold of 0.05 (5%), this yielded 62 proteins significantly enriched for wt IDE, and 53 for MutIDE, respectively (Figure S2). Among these, the majority was shared between wt and mutant IDE (proteins underlined, or neither underlined nor boxed) although fold enrichment varied between the two forms, while some proteins (boxed) were enriched in wt IDE only (Figure 3A).
The molecular weight of the 62 proteins interacting with IDE ranged from 8 to 116 kDa (Figure 3A), with only a single protein of less than 10 kDa (NDUFA1). Thus, considering the length limits for proteins hydrolyzed by IDE [29], all but one protein were unlikely to be IDE substrates. Consistent with our immunoblot analyses showing strong IDE auto-biotinylation (Figure S1), IDE was most strongly enriched relative to controls. Among the 62 proteins identified, 47 are known to be localized in mitochondria. The 15 non-mitochondrial proteins include proteins involved in RNA metabolism (e.g. RQCD1, CARS, RAVER1), histone-modifying enzymes (e.g. TRMT112, CBX6, RBP4, PAF1) and various cytosolic proteins. Five of the 8 proteins unique to wt IDE samples were non-mitochondrial. Among the mitochondrial proteins, 13 were components of the small or large mitochondrial ribosome subunit. Another 9 proteins were subunits of the mitochondrial respiratory chain complex I (6), complex III (2) or complex V (1). Other mitochondrial proteins were involved in protein synthesis (GADD45GIP1), membrane potential (PPA2), protein folding and import (HSPE1).
To identify known physical or functional interactions among the proteins identified, we used the STRING database and algorithm [25]. This revealed 3 functionally associated mitochondrial protein networks (Figure 3B): mitochondrial protein translation with 17 members of which many are known to interact physically; citric acid cycle and respiratory electron transport with 15 members, again most known to interacting physically; and fatty acid metabolism (4 members). Additional non-mitochondrial networks included heterocycle metabolic process and networks related to RNA metabolism (tRNA metabolism, CCR4-NOT complex). Complementary functional enrichment analysis using Metascape [26] confirmed identification of the 3 mitochondrial networks, showing highly significant enrichment of mitochondrial gene expression i.e. ribosomal translation and of the TCA cycle and respiratory electron transport (Figure 3C).
Next, we analyzed proteins significantly enriched in samples from cells expressing MutIDE in the same manner (Figure 4A–C). Nineteen of 53 proteins (33%; including 6 of 9 proteins unique to MutIDE) were non-mitochondrial and included, like for wt IDE, proteins related to histones, tRNA metabolism and mRNA processing, but also 2 plasma membrane glucose transporters. Again, a single protein (LYRM5, a mitochondrial protein involved in electron transfer) had a Mr of <10 kDa. Thus, under the experimental conditions used, protease-dead IDE does not seem to co-purify with potential proteolytic substrates. Analysis of functional and/or physical protein networks using STRING identified the same 3 mitochondrial networks (protein translation, TCA cycle, and fatty acid metabolism), which was confirmed by functional enrichment analysis using Metascape. However, we noted a difference to wt IDE regarding non-mitochondrial networks, as "heterocycle metabolic process" with 9 members was present in wt IDE samples only, while "glucose transport" and "mRNA metabolic process" was detected in MutIDE samples only. Given that cytosolic protein networks may reflect interactions of cytosolic IDE rather than contaminants in our proteomic analyses (see below), these differences may be of interest with respect to the function of the dominant cytosolic IDE form.
3.3. Differential Control Analysis Corroborates Mitochondrial IDE Interactome and Reveals Potential cytosolic IDE Interactomes
The presence of a substantial percentage of significantly enriched cytosolic proteins in both wt and mutant IDE samples (24% and 33%, respectively) was unexpected. Although this could simply represent "background", this seemed unlikely considering fact that many of these cytosolic belonged to protein networks, for example related to RNA processing. An alternative explanation was a less than perfectly overlapping localization between IDE and our compartmentalization control OVA. Such a difference could result from distinct efficiencies of the MTS used. The MitoFates algorithm for prediction of mitochondrial presequences attributes an extremely high score of .987 to the cytochrome c oxidase MTS preceding OVA while the complete Met1 IDE sequence contains an MTS with the moderate score of .399 only [30]; both MTS are predicted to be cleaved by mitochondrial processing peptidase at positions 11 and 19, respectively. Thus, it was not unlikely that HEK cells transduced with Met1 full-length IDE harbored some IDE in the cytosol while OVA was localized exclusively in mitochondria. Much stronger expression in mitochondria could have prevented detection by microscopy (Figure 2A,B).
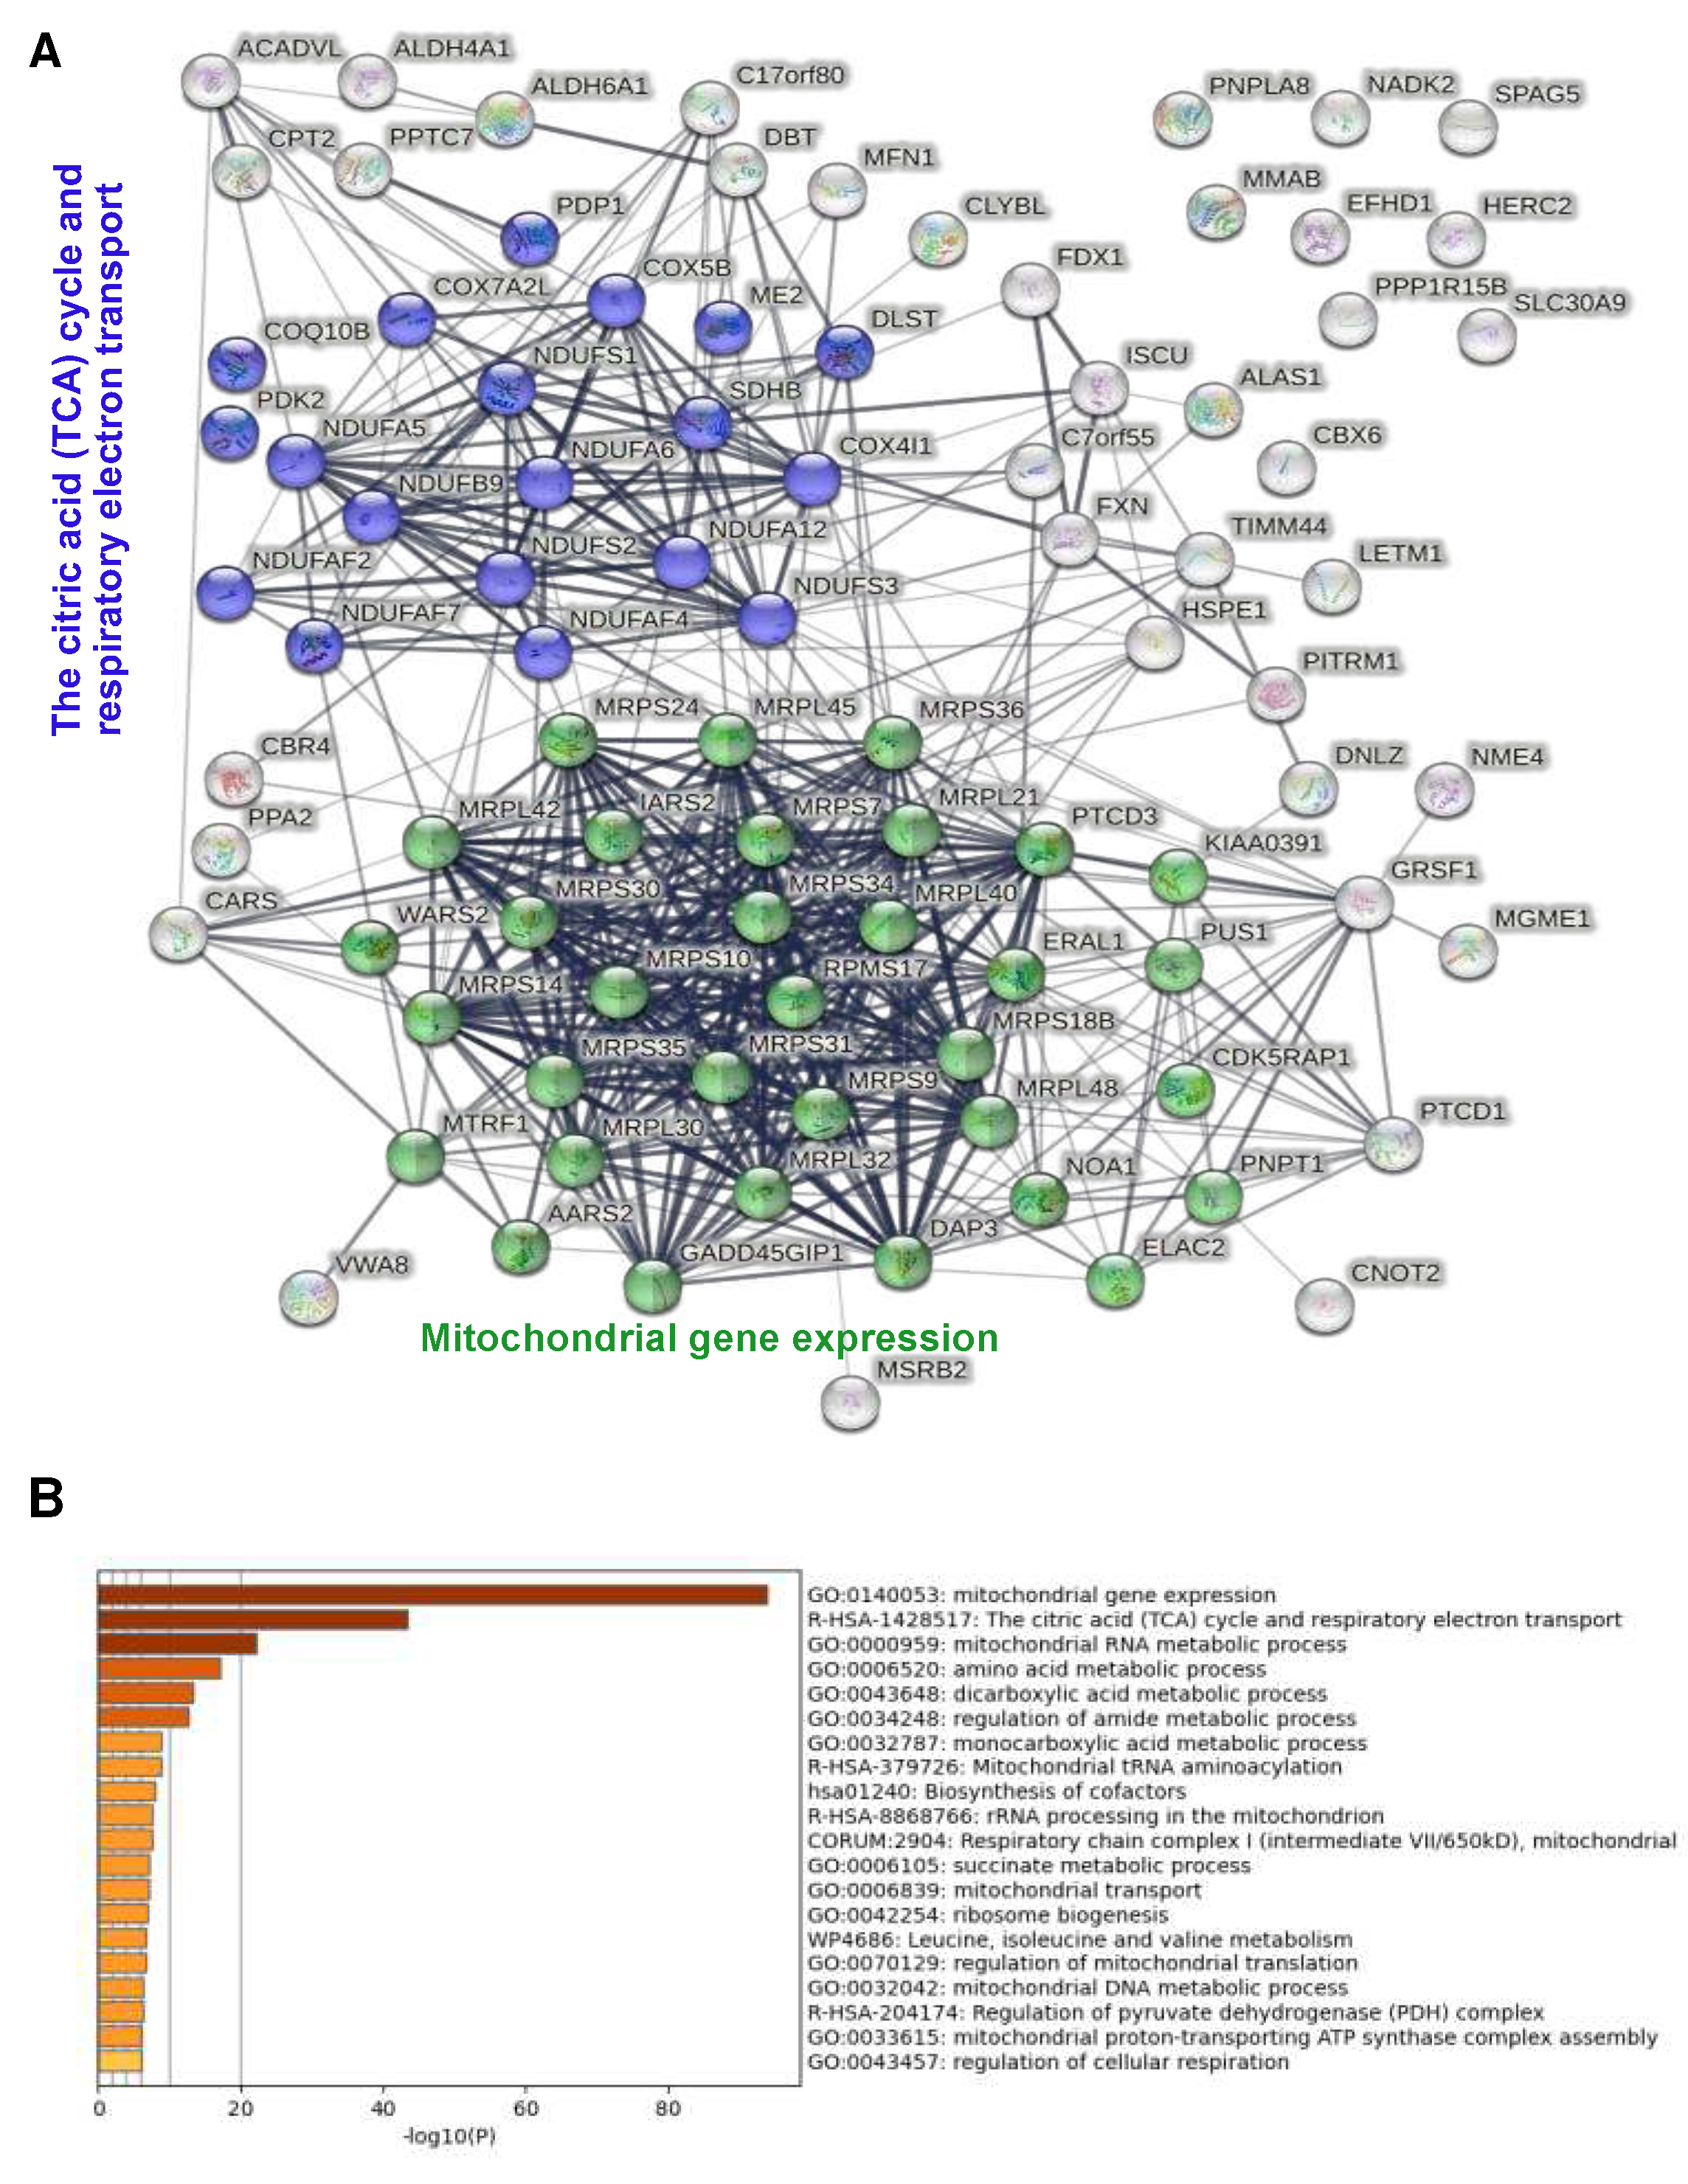
To verify this hypothesis, we examined proteins significantly enriched in cells expressing wt IDE comparing either to IDE samples without biotin only or to OVA samples only. This showed firstly that comparison with IDE samples without biotin resulted globally in stronger enrichment factors for significantly enriched proteins, a phenomenon likely due to background biotinylation of the IDE interactome in OVA cells upon addition of biotin (Figure S3). In a comparison of IDE samples incubated with versus without biotin, 89 proteins were significantly enriched upon biotin addition (Figure 5A). Only 5 of these were predicted or known not to reside in mitochondria. STRING analysis identified two mitochondrial protein networks among these, TCA cycle/respiratory electron transport and mitochondrial gene expression, each with numerous members (20 and 33, respectively (Figure 5A). Neither "Fatty acid metabolism" nor any of the three non-mitochondrial protein networks were significantly enriched. Functional enrichment analysis using Metascape again confirmed this analysis, showing highly significant enrichment of the 2 networks and of "mitochondrial RNA metabolic process" in the absence of any non-mitochondrial network (Figure 5B). Examination of the top 20 enriched proteins showed absence of non-mitochondrial proteins and strong enrichment of proteins related to mitochondrial translation in both wt and mutant IDE (9 and 11 ribosomal proteins, respectively) and to respiratory electron transport (Figure S4A).
We also performed the inverse analysis, comparing data obtained in biotin-incubated cells expressing wt IDE with cells expressing OVA in mitochondria (Figure S5). Among the 77 proteins significantly enriched in this comparison, only 5 were mitochondrial. This included 2 subunits of complex I of the respiratory chain (NDUFA5, NDUFB9) and a large ribosomal subunit (MRPL42) also strongly enriched in the biotin-no biotin comparison. STRING analysis suggested only 2 functionally interacting networks, one containing various molecules contained in granules, for example of neutrophiles and another one to Parkinson's disease. However, Metascape analysis identified a larger number of functional networks in addition to these 2 which were more strongly enriched, including stress response (15% of members enriched), translation (10% enriched) and RNA metabolism (14% enriched). Examination of the top 20 proteins enriched in the IDE-OVA comparison showed a variety of non-mitochondrial proteins, some of which were associated with the response to oxidative stress (lactoferrin, arginase, several E3 enzymes) and the strongest enrichment for a subunit of V-ATPase. Enrichment factors were lower than in the biotin-no biotin comparison, and only IDE itself reached 10-fold enrichment. Note that IDE was not among the strongly enriched proteins in the biotin-no biotin comparison, suggesting substantial auto-biotinylation in the absence of added biotin.
4. Discussion
In this study we had set out to obtain initial leads on the role of the fraction of IDE localizing to mitochondria, using a fast proximity biotinylation approach and HEK cells. Expression of a full-length human IDE cDNA starting at Met1 resulted in strongly dominant mitochondrial localization, consistent with previous reports. Short term incubation of fusion protein-expressing cells with biotin resulted in readily detectable biotinylation of client proteins, allowing for proteomic identification of candidate proteins interacting with IDE. Following standard recommendations, potentially interacting proteins were identified through comparison with a no-biotin and with a compartmentalization control.
Both confocal microscopy experiments and the results of the proteomics indicate that IDE localizes to the mitochondrial matrix, a conclusion also supported by analysis of the IDE MTS using the DeepMito algorithm [31]. Given the physiologic localization of cytochrome C oxidase, the same conclusion applied not surprisingly to the OVA control. Manual as well as bioinformatics analysis of proteomics results suggested strongly that mitochondrial IDE interacts with the mitochondrial protein translation machinery and with proteins of the respiratory chain. This was true when both controls were considered but even more evident when only the no-biotin control was taken into account. In the latter case, 6 (wt IDE) and 7 (MutIde) of the top ten enriched proteins were ribosomal subunits. Our data also suggest that wt and mutant IDE interact with the same mitochondrial proteins.
We were surprised to find a significant number of non-mitochondrial proteins, some of them linked to protein networks related to RNA processing and stress responses, in the IDE interactome. Given the absence of these proteins when only the no-biotin control was considered, this finding resulted almost certainly from partial localization of IDE but not OVA fusion proteins in the cytosol due to distinct efficiencies of the IDE and OVA MTS. The relevance of the non-mitochondrial proteins and protein networks as IDE interactants will only become clear upon appropriately controlled investigation of Met42-encoded cytosolic IDE. However, proteomic and genomic studies of tissues from IDE-deficient mice in our laboratory are consistent with a role of cytosolic IDE in stress responses and RNA processing (Zhu et al, manuscript submitted).
Non-mitochondrial proteins not only were present in significant numbers in the IDE interactome when both controls were considered but represented the vast majority of strongly enriched proteins when only the OVA control was considered, a finding requiring explanation. First, due to its strong MTS, OVA very likely was entirely absent from the cytosol, resulting in extremely low background biotinylation of cytosolic proteins in the OVA sample, with the consequence of relatively strong enrichment factors for proteins biotinylated by the cytosolic fusion protein fraction in IDE samples. Second and as a result of this, inspection of the complete list of enriched proteins relative to the OVA control (Table S2) shows that many ribosomal and other mitochondrial proteins are present but with lower enrichment factors. Third, the globally lower enrichment factors in the comparison of IDE to OVA controls only suggests that samples incubated with exogenous biotin may display higher background and therefore lower enrichment, a factor biasing detection to cellular compartments devoid of an exogenous biotin ligase (the cytosol in OVA samples).
What might be the role of mitochondrial IDE and its interactions? The fact that almost all proteins biotinylated by both wt and mutant IDE have molecular weights inconsistent with the selectivity of IDE suggests that IDE may have few or no proteolytic substrates in mitochondria. We speculate that IDE may play a role in mitochondrial protein homeostasis and stress responses, possibly as a chaperone-like protein, as has been suggested for the cytosolic protein [10], [33]. The impact of IDE on mitochondrial function at the steady state and in stress situation remains to be evaluated.
Supplementary Materials
The following supporting information can be downloaded at the website of this paper posted on Preprints.org, Figure S1: Characterization of biotinylation activity TurboID fusion proteins; Figure S2: Volcano plots of IDE and MutIDE proteomic data sets; Figure S3: Volcano plots of IDE and MutIDE proteomic data sets with comparison to single controls; Figure S4: Top 20 enriched proteins interacting with wt or mutant IDE applying either the OVA or the no-biotin control only; Figure S5: Functional enrichment analysis of the wt IDE interactome obtained by comparing cells expressing IDE and OVA incubated with biotin. Table S1: Primers and reagents used; Table S2: proteins enriched in wt and MutIDE samples applying single and double controls.
Author Contributions
Conceptualization, P.v.E.; methodology, B.B., P.v.E.; software, C.G., B.B.; validation, A.Y., B.B., P.v.E.; formal analysis, A.Y., C.G.; investigation, A.Y., E.W.-E., J.L., B.B.; writing, P.v.E.; editing, C.G., B.B., P.v.E.; visualization, A.Y., B.B.; supervision, B.B., P.v.E.; project administration, P.v.E.; funding acquisition, P.v.E. All authors have read and agreed to the published version of the manuscript.
Funding
This research was funded by Fondation pour la Recherche Médicale, grant number EQU201903007853 and by Agence Nationale de Recherche, grant ANR-18-CE92-0008-01.
Institutional Review Board Statement
Ethical review and approval were waived for this study due to the absence of any intervention on the mice used.
Data Availability Statement
The mass spectrometry proteomics data will be deposited to the ProteomeXchange Consortium.
Acknowledgments
We are grateful to Sylvie Fabrega and the platform Vecteurs Viraux et Transfert de Gènes, SFR Necker, for the production of lentivirus.
Conflicts of Interest
The authors declare no conflict of interest. The funders had no role in the design of the study; in the collection, analyses, or interpretation of data; in the writing of the manuscript; or in the decision to publish the results.
References
- I.A. Mirsky and R. H. Broh-Kahn, “The inactivation of insulin by tissue extracts; the distribution and properties of insulin inactivating extracts.,” Arch. Biochem., vol. 20, no. 1, pp. 1–9, Jan. 1949.
- K. Yokono, Y. Imamura, K. Shii, H. Sakai, and S. Baba, “Purification and characterization of insulin-degrading enzyme from pig skeletal muscle.,” Endocrinology, vol. 108, no. 4, pp. 1527–1532, Apr. 1981. [CrossRef]
- W. C. Duckworth, “Insulin Degradation: Progress and Potential,” Endocr. Rev., vol. 19, no. 5, pp. 608–624, Oct. 1998. [CrossRef]
- A. Fernández-Gamba, M. C. Leal, L. Morelli, and E. M. Castaño, “Insulin-degrading enzyme: structure-function relationship and its possible roles in health and disease.,” Curr. Pharm. Des., vol. 15, no. 31, pp. 3644–3655, 2009. [CrossRef]
- M. Morita et al., “Insulin-degrading enzyme exists inside of rat liver peroxisomes and degrades oxidized proteins.,” Cell Struct. Funct., vol. 25, no. 5, pp. 309–315, Oct. 2000.
- L. A. McCord et al., “Conformational states and recognition of amyloidogenic peptides of human insulin-degrading enzyme.,” Proc Natl Acad Sci USA, vol. 110, no. 34, pp. 13827–13832, Aug. 2013. [CrossRef]
- W. Farris et al., “Insulin-degrading enzyme regulates the levels of insulin, amyloid beta-protein, and the beta-amyloid precursor protein intracellular domain in vivo.,” Proc Natl Acad Sci USA, vol. 100, no. 7, pp. 4162–4167, Apr. 2003. [CrossRef]
- R. Deprez-Poulain et al., “Catalytic site inhibition of insulin-degrading enzyme by a small molecule induces glucose intolerance in mice.,” Nat. Commun., vol. 6, p. 8250, Sep. 2015. [CrossRef]
- J. P. Maianti et al., “Anti-diabetic activity of insulin-degrading enzyme inhibitors mediated by multiple hormones.,” Nature, vol. 511, no. 7507, pp. 94–98, Jul. 2014. [CrossRef]
- G. R. Tundo et al., “Insulin-degrading enzyme (IDE): a novel heat shock-like protein.,” J. Biol. Chem., vol. 288, no. 4, pp. 2281–2289, Jan. 2013. [CrossRef]
- J. E. Carpenter, W. Jackson, G. A. de Souza, L. Haarr, and C. Grose, “Insulin-degrading enzyme binds to the nonglycosylated precursor of varicella-zoster virus gE protein found in the endoplasmic reticulum.,” J. Virol., vol. 84, no. 2, pp. 847–855, Jan. 2010. [CrossRef]
- Q. Li, M. A. Ali, and J. I. Cohen, “Insulin degrading enzyme is a cellular receptor mediating varicella-zoster virus infection and cell-to-cell spread.,” Cell, vol. 127, no. 2, pp. 305–316, Oct. 2006. [CrossRef]
- D. Sbardella et al., “Proteasome Activity Is Affected by Fluctuations in Insulin-Degrading Enzyme Distribution.,” PLoS ONE, vol. 10, no. 7, p. e0132455, Jul. 2015. [CrossRef]
- D. Sbardella et al., “The insulin-degrading enzyme is an allosteric modulator of the 20S proteasome and a potential competitor of the 19S.,” Cell. Mol. Life Sci., vol. 75, no. 18, pp. 3441–3456, Sep. 2018. [CrossRef]
- A. Schmitz, A. Schneider, M. P. Kummer, and V. Herzog, “Endoplasmic reticulum-localized amyloid beta-peptide is degraded in the cytosol by two distinct degradation pathways.,” Traffic, vol. 5, no. 2, pp. 89–101, Feb. 2004.
- M. A. Leissring et al., “Alternative translation initiation generates a novel isoform of insulin-degrading enzyme targeted to mitochondria.,” Biochem. J., vol. 383, no. Pt. 3, pp. 439–446, Nov. 2004. [CrossRef]
- F. Zhao and M.-H. Zou, “Role of the mitochondrial protein import machinery and protein processing in heart disease.,” Front. Cardiovasc. Med., vol. 8, p. 749756, Sep. 2021. [CrossRef]
- W. G. Liang et al., “Structural basis for the mechanisms of human presequence protease conformational switch and substrate recognition.,” Nat. Commun., vol. 13, no. 1, p. 1833, Apr. 2022. [CrossRef]
- M. Liu et al., “SIRT4 regulates PTEN stability through IDE in response to cellular stresses.,” FASEB J., vol. 33, no. 4, pp. 5535–5547, Apr. 2019. [CrossRef]
- C. A. Hansson Petersen et al., “The amyloid beta-peptide is imported into mitochondria via the TOM import machinery and localized to mitochondrial cristae.,” Proc Natl Acad Sci USA, vol. 105, no. 35, pp. 13145–13150, Sep. 2008. [CrossRef]
- T. C. Branon et al., “Efficient proximity labeling in living cells and organisms with TurboID.,” Nat. Biotechnol., vol. 36, no. 9, pp. 880–887, Oct. 2018. [CrossRef]
- K. F. Cho, T. C. Branon, N. D. Udeshi, S. A. Myers, S. A. Carr, and A. Y. Ting, “Proximity labeling in mammalian cells with TurboID and split-TurboID.,” Nat. Protoc., vol. 15, no. 12, pp. 3971–3999, Dec. 2020. [CrossRef]
- J. Cox and M. Mann, “MaxQuant enables high peptide identification rates, individualized p.p.b.-range mass accuracies and proteome-wide protein quantification.,” Nat. Biotechnol., vol. 26, no. 12, pp. 1367–1372, Dec. 2008. [CrossRef]
- S. Tyanova et al., “The Perseus computational platform for comprehensive analysis of (prote)omics data.,” Nat. Methods, vol. 13, no. 9, pp. 731–740, Sep. 2016. [CrossRef]
- D. Szklarczyk et al., “STRING v11: protein-protein association networks with increased coverage, supporting functional discovery in genome-wide experimental datasets.,” Nucleic Acids Res., vol. 47, no. D1, pp. D607–D613, Jan. 2019. [CrossRef]
- Y. Zhou et al., “Metascape provides a biologist-oriented resource for the analysis of systems-level datasets.,” Nat. Commun., vol. 10, no. 1, p. 1523, Apr. 2019. [CrossRef]
- C. Beuzelin et al., “Deletion of the fission yeast homologue of human insulinase reveals a TORC1-dependent pathway mediating resistance to proteotoxic stress.,” PLoS ONE, vol. 8, no. 6, p. e67705, Jun. 2013. [CrossRef]
- E. S. Song, D. W. Rodgers, and L. B. Hersh, “Mixed dimers of insulin-degrading enzyme reveal a cis activation mechanism.,” J. Biol. Chem., vol. 286, no. 16, pp. 13852–13858, Apr. 2011. [CrossRef]
- M. Manolopoulou, Q. Guo, E. Malito, A. B. Schilling, and W.-J. Tang, “Molecular basis of catalytic chamber-assisted unfolding and cleavage of human insulin by human insulin-degrading enzyme.,” J. Biol. Chem., vol. 284, no. 21, pp. 14177–14188, May 2009. [CrossRef]
- Y. Fukasawa, J. Tsuji, S.-C. Fu, K. Tomii, P. Horton, and K. Imai, “MitoFates: improved prediction of mitochondrial targeting sequences and their cleavage sites.,” Mol. Cell. Proteomics, vol. 14, no. 4, pp. 1113–1126, Apr. 2015. [CrossRef]
- C. Savojardo, N. Bruciaferri, G. Tartari, P. L. Martelli, and R. Casadio, “DeepMito: accurate prediction of protein sub-mitochondrial localization using convolutional neural networks.,” Bioinformatics, vol. 36, no. 1, pp. 56–64, Jan. 2020. [CrossRef]
- N. Adames, K. Blundell, M. N. Ashby, and C. Boone, “Role of yeast insulin-degrading enzyme homologs in propheromone processing and bud site selection.,” Science, vol. 270, no. 5235, pp. 464–467, Oct. 1995. [CrossRef]
- G. R. Tundo et al., “Multiple functions of insulin-degrading enzyme: a metabolic crosslight?,” Crit. Rev. Biochem. Mol. Biol., vol. 52, no. 5, pp. 554–582, Oct. 2017. [CrossRef]
Figure 1.
Characterization of TurboID fusion proteins. (A) Schematic representation of mitochondria-targeted TurboID constructs for proteomic mapping. Human IDE cDNA or its mutated form (E111Q; MutIDE) starting from Met1, and an OVA cDNA were fused to sequences encoding a V5 epitope tags, the TurboID enzyme, a self-cleaving peptide T2AP2A and the fluorochrome tdTomato; MTS, mitochondrial targeting sequence. (B) Expression of TurboID fusion proteins in HEK293T cells. The expression of the IDE and OVA constructs in graded amounts of total protein extracts was analyzed by Western blot, using antibodies to IDE, OVA and the V5 tag.
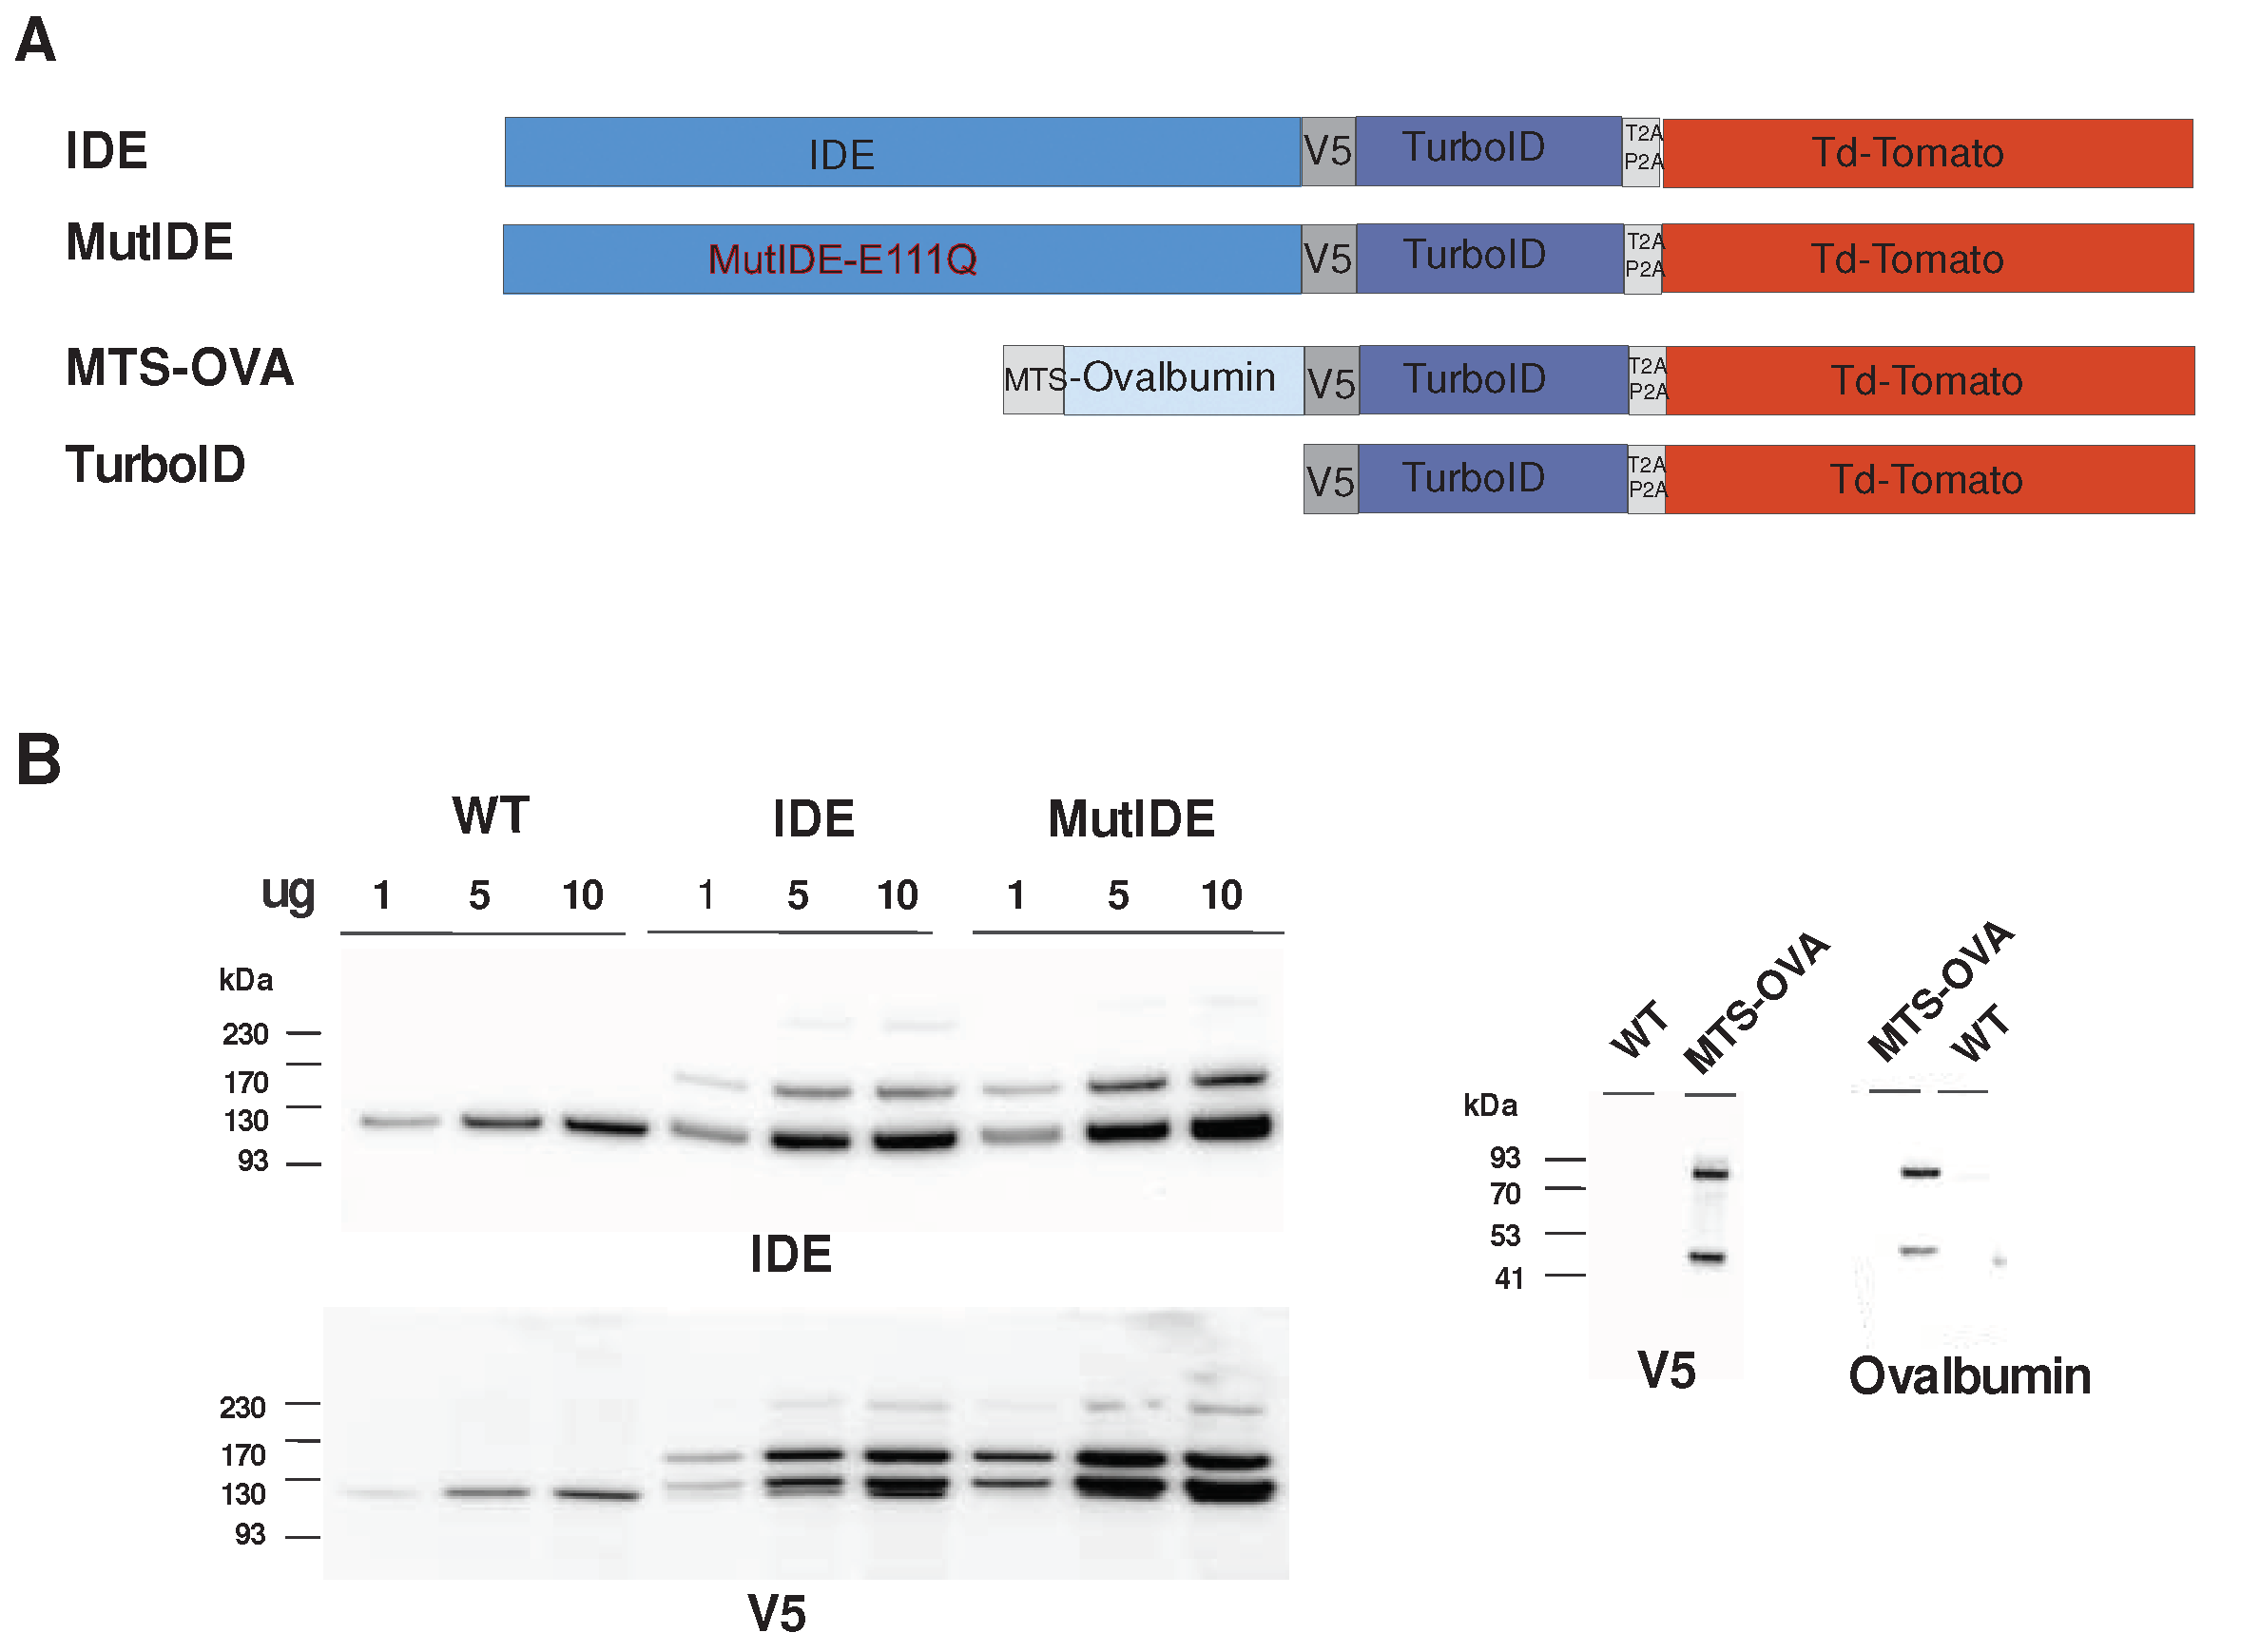
Figure 2.
Confocal fluorescent imaging of HEK293T expressing TurboID fusion proteins. Cells expressing IDE-TurboID (A), MutIDE-TurboID (B), endogenous IDE (C), and MTS-OVA-TurboID (D) were stained with antibodies to TOM20, IDE, OVA and V5 tag, as indicated. Merged images show the overlay of TOM20 with fusion protein staining. The nuclei are counterstained with DAPI. Scale bar 10 μm.
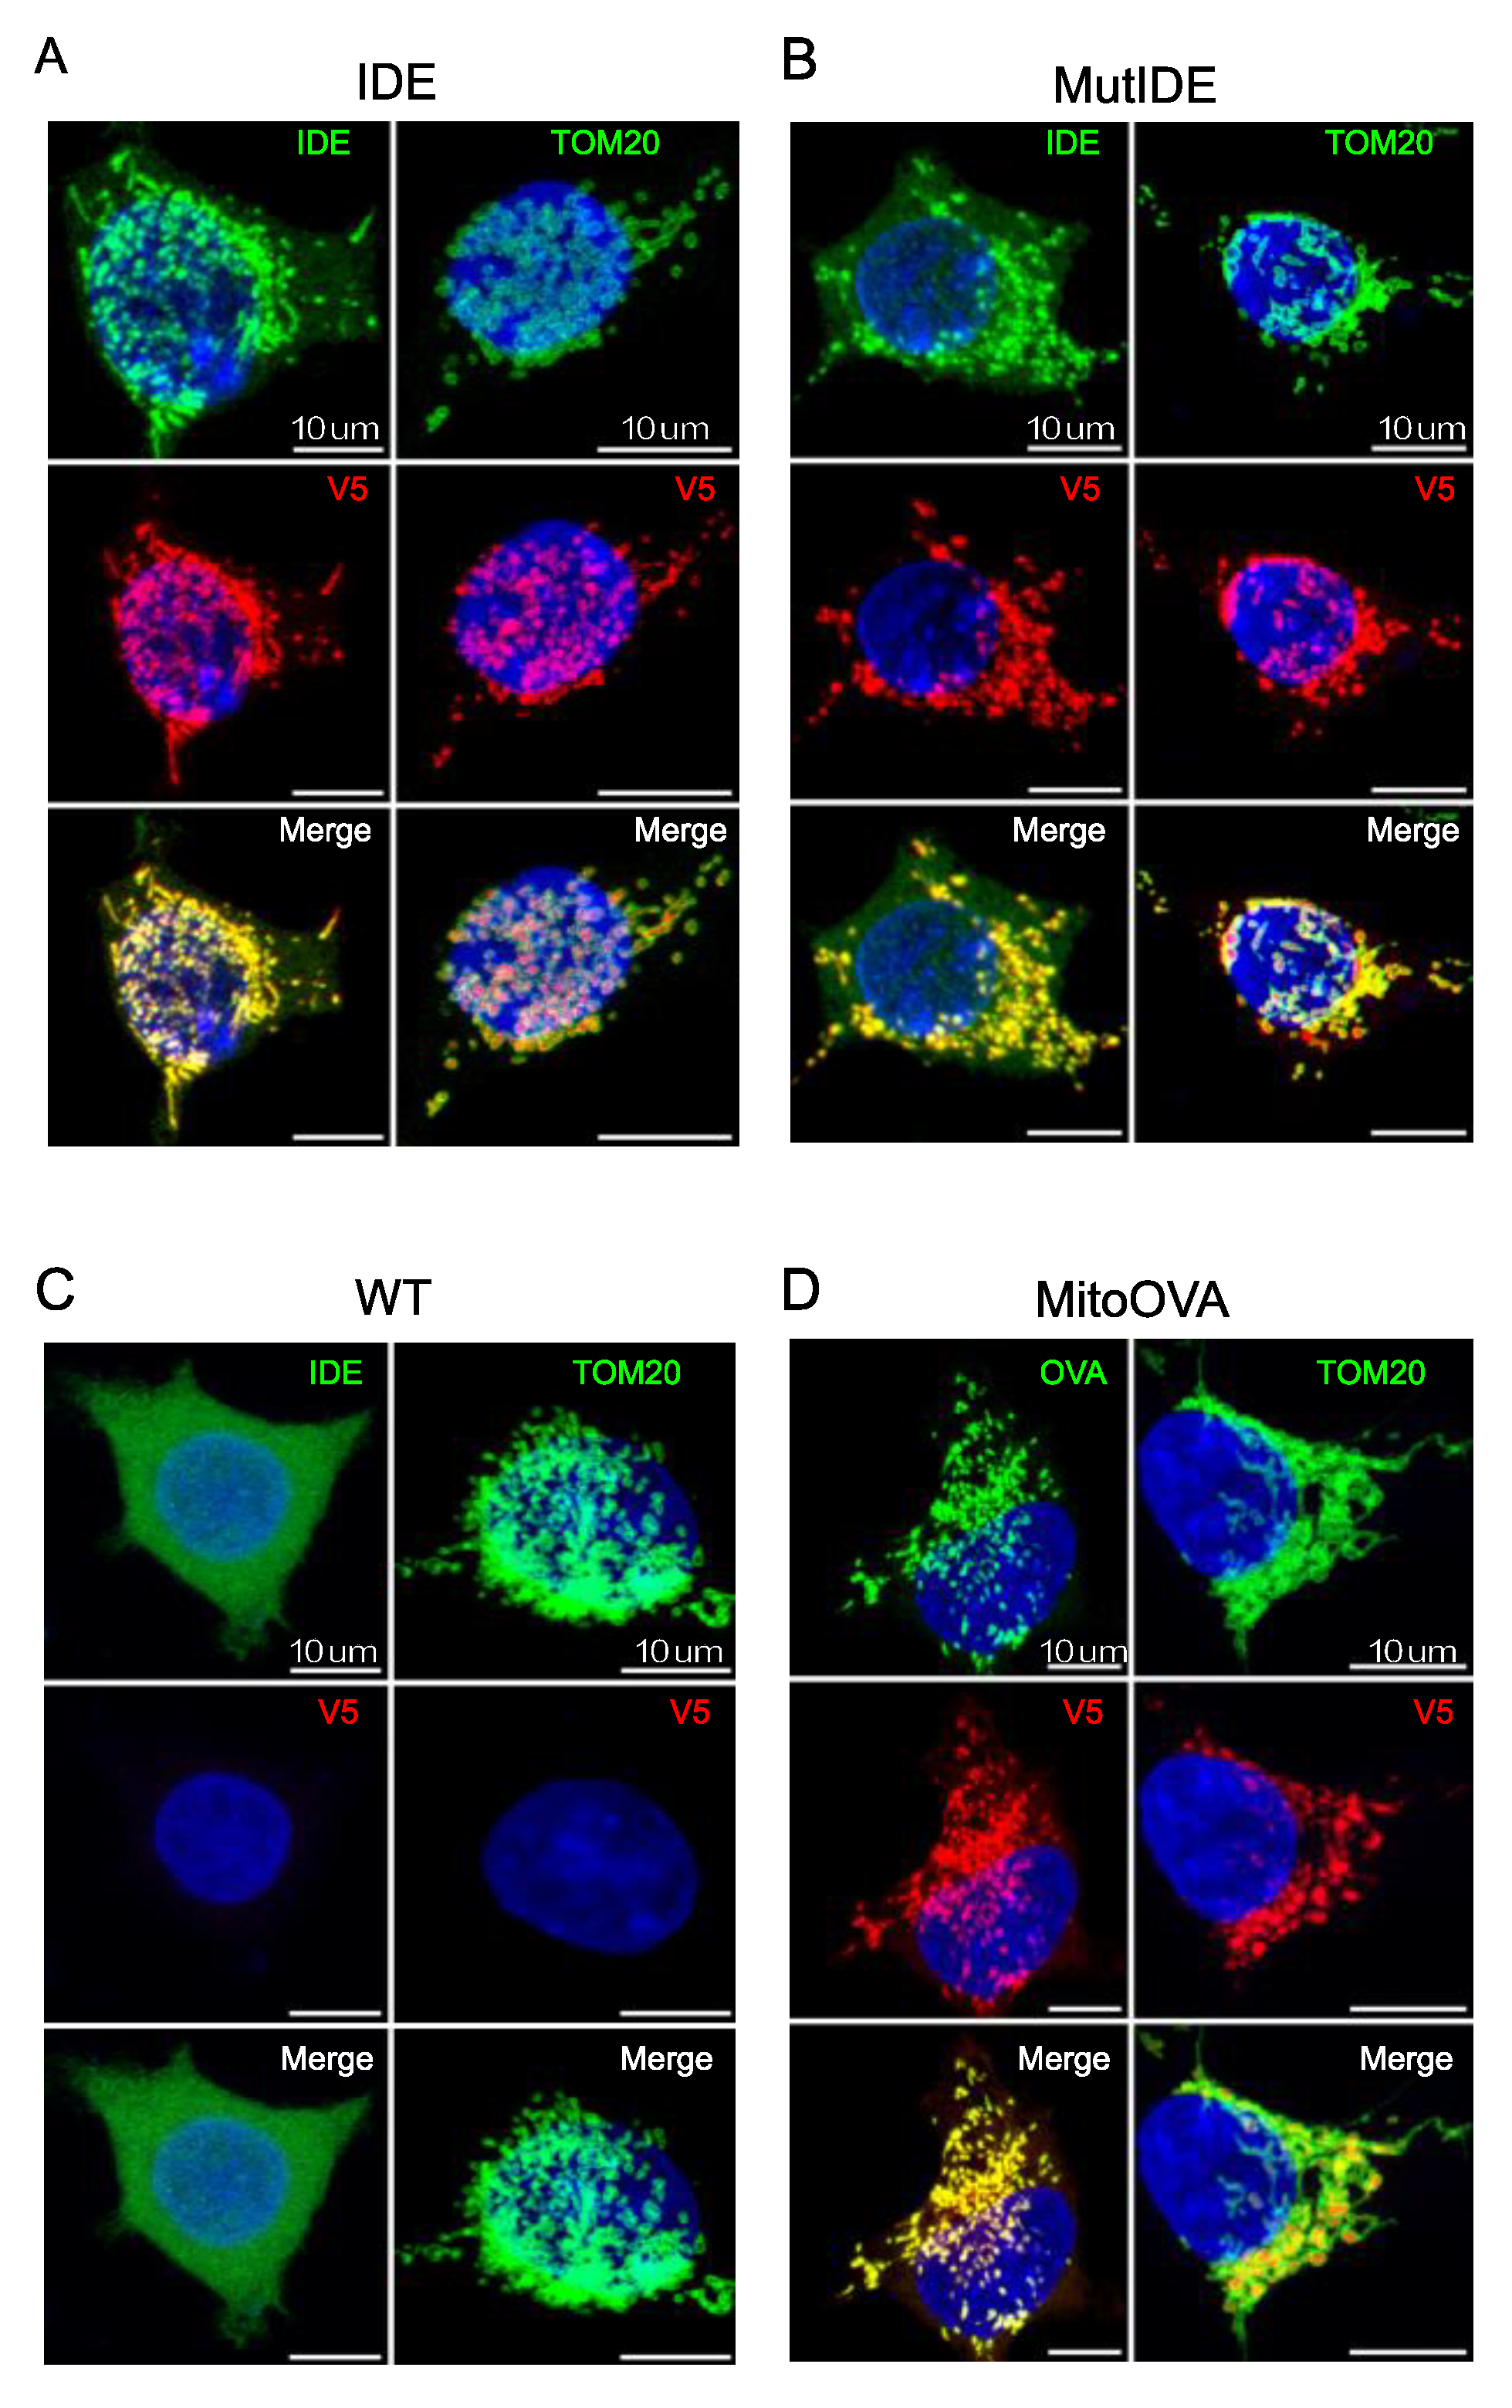
Figure 3.
Analysis of the wt IDE interactome. (A) Significantly enriched proteins are ranked according to molecular weight (circle colors) and fold change (circle diameter). Proteins shared between the wt IDE and MutIDE interactomes are underlined; proteins restricted to the wt IDE interactome are boxed; proteins neither underlined nor boxed are enriched in the wt IDE interactome relative to both controls and in the mutIDE interactome relative to one control only. (B) Functionally associated protein networks in the wt IDE interactome as identified by STRING analysis. Proteins belonging to the same biological system are labeled with identical color. (C) Top non-redundant enrichment clusters in the wt IDE interactome, as identified by Metascape. 32% of genes in GO:0140053 and 19% in R-HSA-1428517 were enriched. The color scale represents statistical significance levels expressed as -log10.
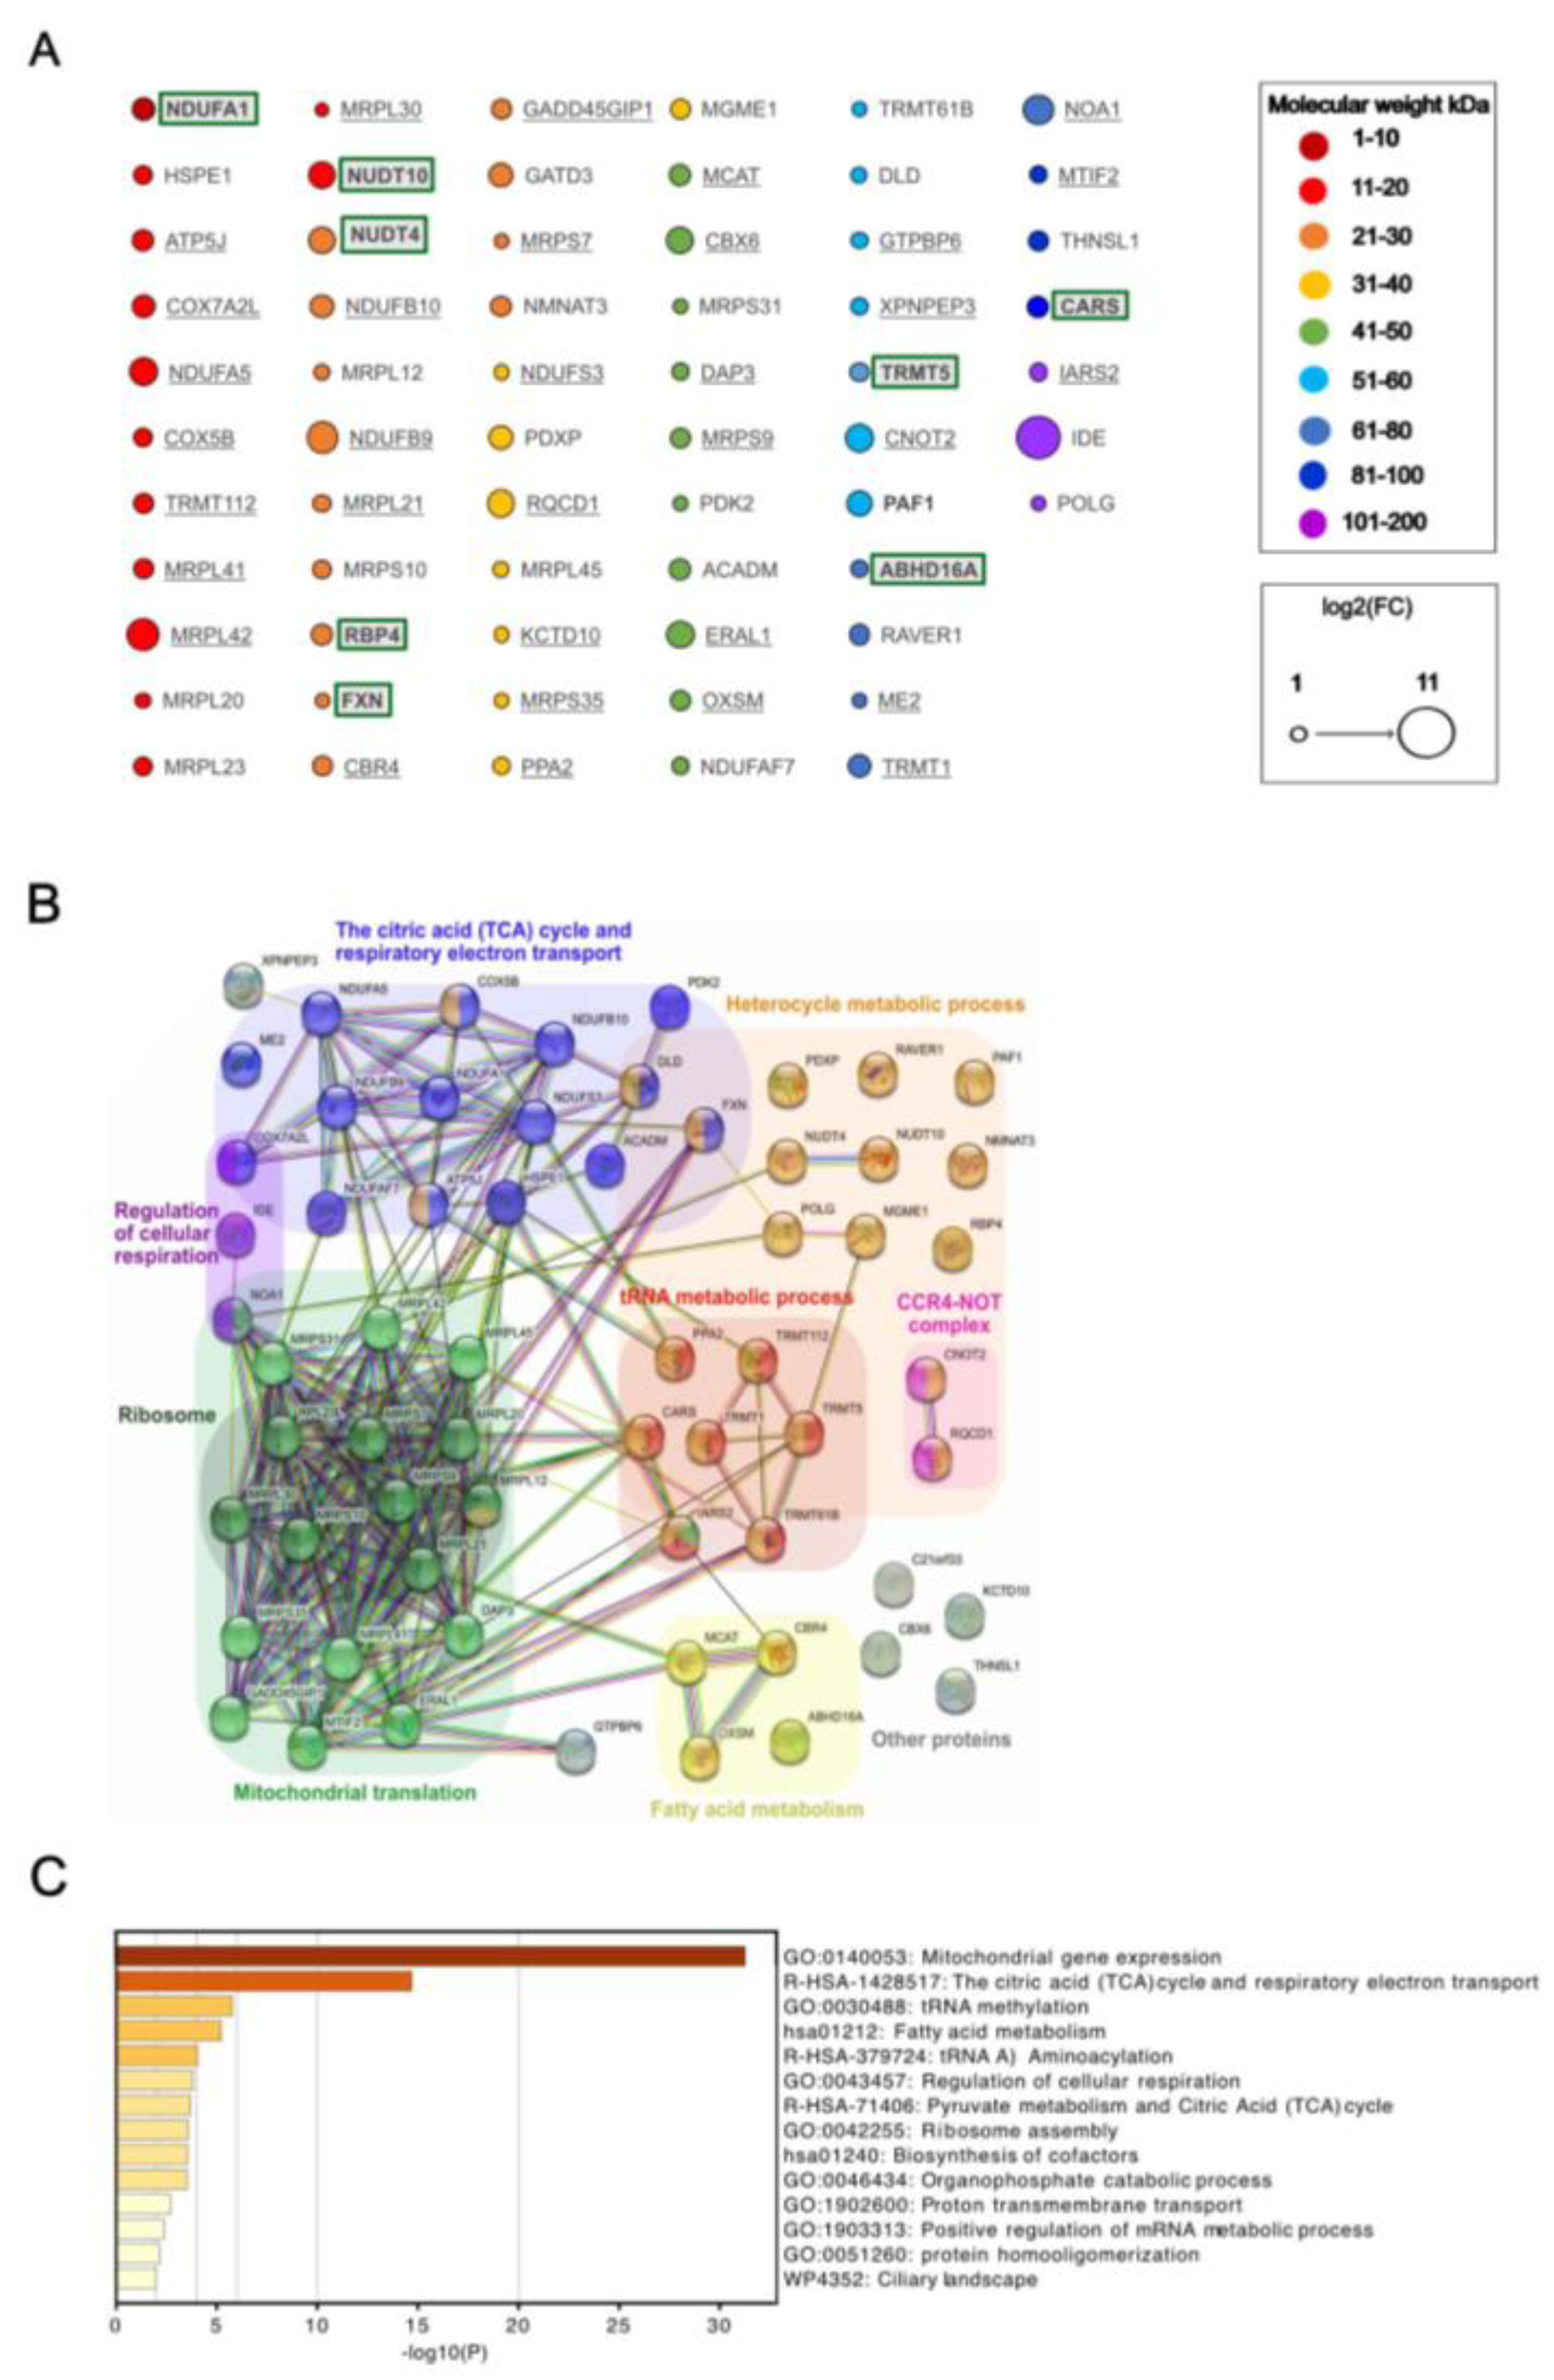
Figure 4.
Interactome and functional enrichment analysis of MutIDE. (A) 53 enriched proteins, annotated as in Figure 3, are classified according to molecular weight (circle colors) and fold change (circle diameter). (B) Functionally associated protein networks in the MutIDE interactome as identified by STRING analysis. (C) Top non-redundant enrichment clusters in the MutIDE interactome, as identified by Metascape. 24% of genes in GO:0032543vand 22% in R-HSA1428517 were enriched. The color scale represents statistical significance levels expressed as -log10.
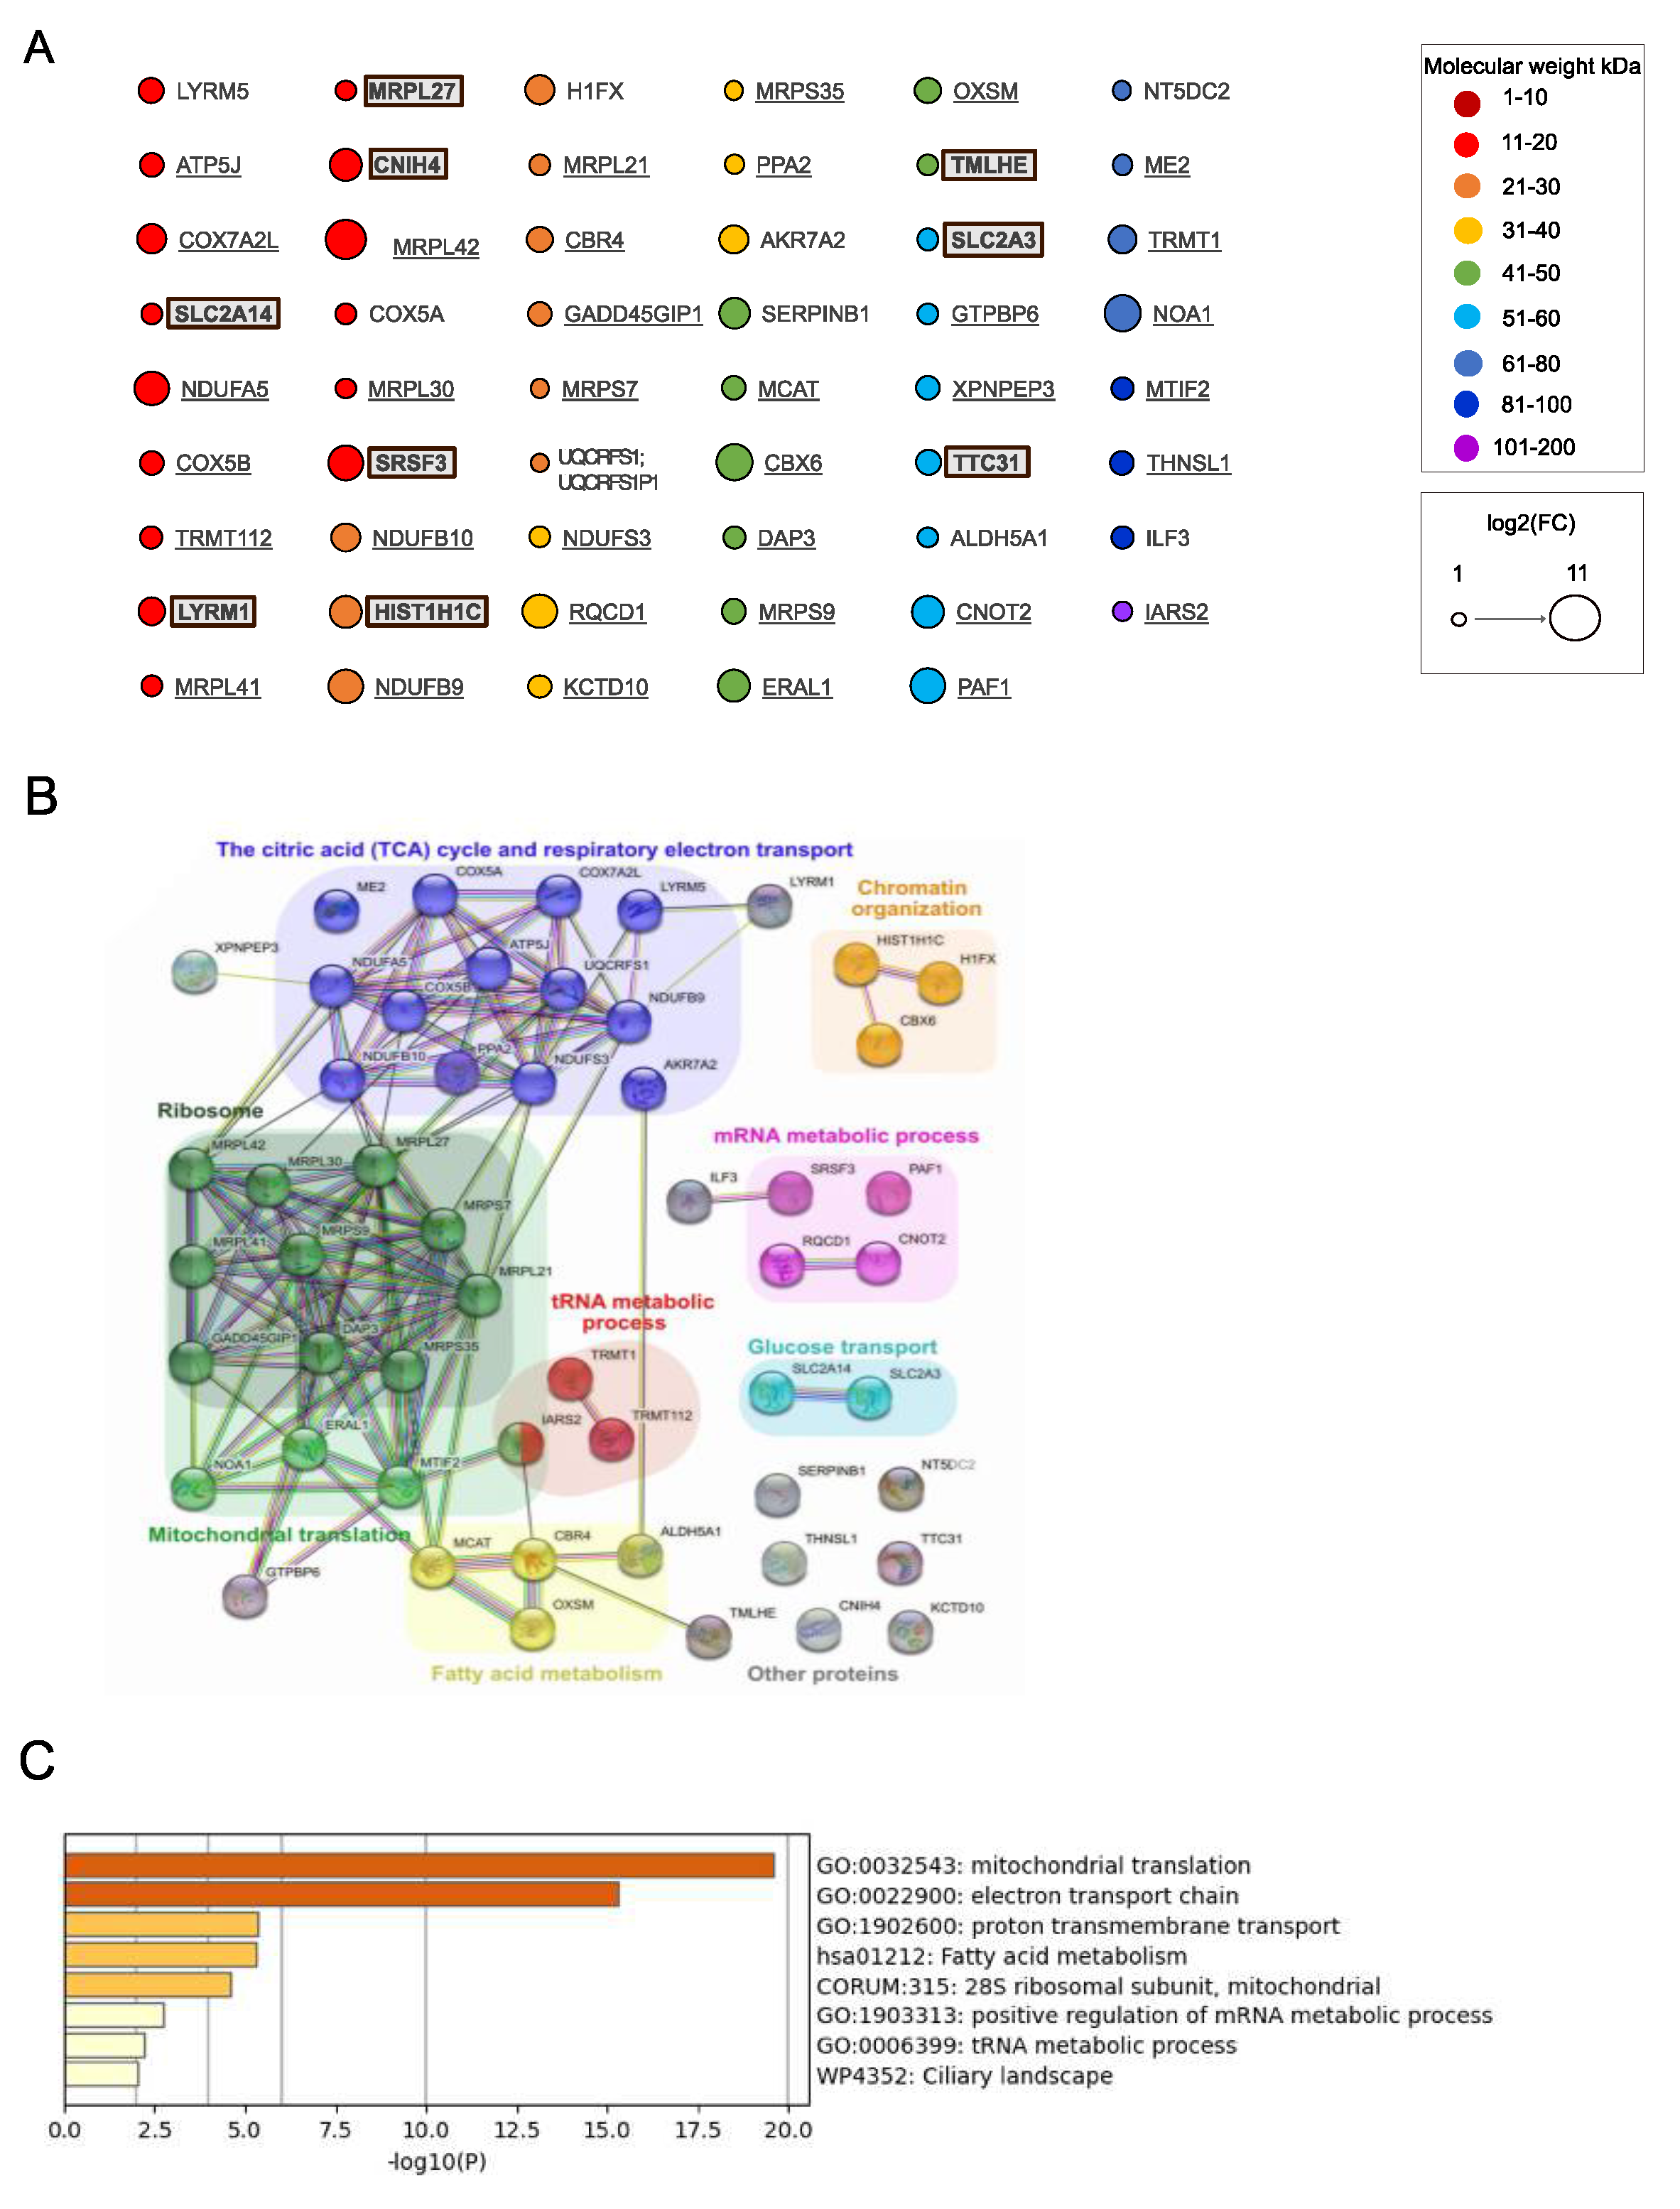
Figure 5.
Functional enrichment analysis of the wt IDE interactome obtained by comparing samples with and without biotin. (A) Functionally associated protein networks in the IDE interactome as identified by STRING analysis. Proteins belonging to the same biological system are labeled with identical color. (B) Top non-redundant enrichment clusters in the IDE interactome, as identified by Metascape. The color scale represents statistical significance levels expressed as -log10. 21% of genes in GO0140053 and 19% of genes in R-HSA1428517 were enriched.
Disclaimer/Publisher’s Note: The statements, opinions and data contained in all publications are solely those of the individual author(s) and contributor(s) and not of MDPI and/or the editor(s). MDPI and/or the editor(s) disclaim responsibility for any injury to people or property resulting from any ideas, methods, instructions or products referred to in the content. |
© 2023 by the authors. Licensee MDPI, Basel, Switzerland. This article is an open access article distributed under the terms and conditions of the Creative Commons Attribution (CC BY) license (http://creativecommons.org/licenses/by/4.0/).
Copyright: This open access article is published under a Creative Commons CC BY 4.0 license, which permit the free download, distribution, and reuse, provided that the author and preprint are cited in any reuse.


