Submitted:
23 April 2023
Posted:
24 April 2023
You are already at the latest version
Abstract
Environmental degradation is one of the most visible problems in Hargeisa. Currently, solid waste is disposed of at two dumping sites within the city limits causing nuisance and unsanitary conditions. Moreover, the existing dumpsites are on the verge of closure, therefore necessitating a dire need to be addressed. This research paper is aimed to integrate multicriteria decision analysis and GIS for evaluating the site suitability for the landfill in Hargeisa, Somaliland. For this purpose, eleven significant parameters were selected: proximity from built-up areas, surface water, groundwater well points, sensitive sites (Airports), land use/land cover, geology, soil type, elevation, slopes, roads, and distance to existing dumpsites. These were then integrated using an analytical hierarchy process (AHP). Subsequently, restriction buffer analysis was performed on the seven parameters to obtain better and more accurate results, and restricted zones were omitted. Furthermore, the pair-wise comparison used to obtain priorities between the selected criteria showed that the land uses land cover is the most significant criterion in the model with a relative weight of 0.1829, followed by the habitations, 0.1506. The overall result reveals that about 68.96% (21060.9 ha) of the study area is unsuitable, while 24.36% (7441.53 ha) and 6.68% accounted for the less and highly appropriate zone, respectively. Following the results of this study, Hargeisa City's municipal council must reconsider the waste management and landfill sites to solve the problems observed in the area before it is overdue. Furthermore, this systematic research approach will assist regional and global researchers, policymakers, and municipal governments.
Keywords:
Analytic hierarchy process
; GIS
; Landfill site
; multicriteria decision analysis
; Solid-waste
1. Introduction
Solid waste management is a global concern, particularly in developing nations, where the availability of sanitary landfills is unavoidable due to rapid population growth and urbanization [1]. Because of urbanization and rapid growth, the generation of solid waste has also increased dramatically [2]. Similarly, in the Hargeisa study region, the population and economic growth due to urbanization have increased the amount of municipal waste [3]. Nonetheless, the estimated number of people residing in Hargeisa is about one million, with an average annual population growth rate of 3.1% [4]. This means the city has doubled its inhabitants in the past ten years. Accordingly, the city has expanded remarkably in all directions, and many new areas are joining. Despite having the city's fastest rate of population increase, it lacks a landfill to handle the solid waste produced, and open dumping is widely used.
Recent studies [5,6], from various African nations, have found that the continent's solid waste management is frequently weak due to poor planning, poor governance, outdated technology, lack of enforcement of current laws, and a lack of financial and economic incentives to encourage environmentally sound development. And this situation makes it worse when it comes to low-income nations [7]. In a nutshell, both developed and developing countries have faced serious and inevitable problems related to solid waste generation [8]. The city's growing population and economic activities produced much solid waste in Somaliland. In addition, solid waste generation in the study area was observed at an increasing rate compared to management response.
Moreover, the city's per capita solid waste generation rate is 0.4kg/capita/day [9]. That figure is expected to rise because of population growth. In addition, only about half of the generated solid waste was collected and dumped at the open dump sites on the city's outskirts.
In contrast, good solid waste disposal design and siting practices can greatly reduce the danger of environmental pollution and public health issues posed by an inefficient system, which is common in poor countries [2,10,11]. Creating a secure place for solid waste disposal is not an easy task. It is time-consuming, costly, and necessitates numerous difficult steps. This, however, necessitates understanding from a variety of fields, including geology, environmental science, urban planning, soil science, and hydrology [12].
On the other hand, various techniques and approaches have been employed by numerous scholars to identify ideal locations for landfills, particularly in major cities around the globe. Among them, is the Ratio Scale Weighting (RSW) method [13]. The integration of the fuzzy MCDM method, i.e., fuzzy analytic hierarchy process (FAHP) [14]. The Decision making trial and evaluation laboratory (DEMATEL) method [11]. And fuzzy Technique for Order Preference by Similarity to an Ideal Solution (TOPSIS) method [15]. A recent study by [10], used a GIS-based analysis for sanitary landfill sites in Abuja, Nigeria. However, the aforementioned study did not consider multicriteria decision analysis when using a GIS technique. In addition, [16], studied landfill location by fuzzy TOPSIS for Istanbul city. In contrast, [17], has reported that the conventional TOPSIS model has several drawbacks, such as the inability to generate a strong correlation between criteria. Moreover, this may result in uncertainty in obtaining weights. Because of that, accurate results might be found through the integration of GIS with AHP techniques [18].
As a result, one of the most recently recommended multicriteria decision analysis (MCDA) methodologies; the Analytic hierarchy process (AHP), has been used in selecting potential landfill sites to offer the ideal location with low socioeconomic and environmental repercussions [19]. In the previous two decades, it has become increasingly popular for this purpose. Furthermore, the versatility of the GIS-based multicriteria evaluation (MCE) technique in managing large amounts of geographical data from many sources makes it an ideal tool for such studies [20]. However, the experts' opinions on the weighting scale might produce different results [21]. But so far, because of its simplicity in pair-wise comparisons, consistency in evaluation, and adaptability, the AHP is chosen as the best method from a selection of possible techniques and provides the decision-makers with an accurate solution [22]. Besides, its many advantages, recent studies have reported the usefulness of integrated AHP and GIS techniques [23,24].
In African countries, roughly 95% of solid waste produced from different sources is discarded at the peripheries of cities or in open dumpsites [25]. In the context of Hargeisa, the City Municipal Council (CMC) has not allotted any land for solid waste processing, and so far, no such facility has been created. Additionally, the city produces more solid waste than its current disposal sites can handle, underscoring the need for a new sanitary landfill. Besides, the existing dumpsite (South Dumping Site -one) is so close to the Airport (4.6 km) it harms aircraft visibility. Thus, the airport authorities are highly concerned about this threat and have complained to the municipal authority to close or shift this site. Therefore, to accommodate the generated solid waste from the municipal, it is compulsory to propose a new trustworthy solid waste landfill site for the city by considering ecological, environmental, and socio-economic considerations.
Various studies on solid waste management have been conducted throughout the country, including [3], on sustainable waste management in the construction industry and [26], on constraints for solid waste management in Somaliland. However, this current study is novel for the municipal area of Hargeisa, as this is the first of such kind using advanced GIS techniques with the integration of AHP, restriction analysis, and selection criteria. With this purpose, the current study aims to integrate multicriteria decision analysis and GIS for evaluating the site suitability for the landfill in Hargeisa City and its environs, Somaliland. As a result, it will reduce the cost, time, and no or less environmental and socio-economic impact, leading to the sustainable management of solid waste as part of the sustainable development goals (SDG).
2. Materials and Methods
2.1. Description of the study site
Hargeisa is situated in a valley in the Galgodon (Ogo) highlands and sits at an elevation of 1,334 meters above sea level (4,377 ft.). Figure 1 depicts the latitude and longitude of the city at 9°34′N and 44°4′E, respectively. The area of the city is 56 Sq. Km encompasses eight districts within its administrative boundaries. It represents the capital of Somaliland and its main gateways of trading centers to all regions in Somaliland and neighboring countries. Additionally, the climate of the study region is warm and dry in semiarid conditions. From the historical temperature records, the average maximum and minimum temperatures of the area are determined. Accordingly, the maximum and minimum annual average temperature of the study area is 25.9°C and 23.9°C, respectively. Moreover, Somaliland has a bimodal rainfall distribution with average annual rainfall levels of 400 to 500mm.
Furthermore, there are fewer weather-related hazards in Hargeisa City; there hasn't been any recent seismic activity. However, flooding happens practically every time it rains due to a shortage of storm drains brought on by inadequate urban infrastructure and blocked drains due to haphazardly dumped wastes. Therefore, it is crucial to find new landfill locations for the City of Hargeisa to properly dispose of municipal solid waste (MSW) while taking into account pertinent environmental, social, and economic considerations.
2.2. Current status of municipal solid waste management in Hargeisa
The effects of solid waste on the environment, human health, society, and the economy are becoming a global threat, particularly in low-income nations [6,27]. A similar problem was encountered in the study area, where medical waste is mixed with municipal waste, posing a serious threat to the health and environment of the workforce, rag pickers, and the general public.
Solid waste management is a principal function of the Municipal Council. However, municipal authority, primarily responsible for managing solid waste, lacks in-house capabilities and adequate finances for managing solid waste effectively. As a result, the citizens generally dispose of their solid waste on the streets and open spaces around them, creating unhygienic conditions. Moreover, plastic bags were seen littered all around and sticking on the trees and bushes. Likewise, street sweepers only occur around commercial areas and on main streets. However, municipal solid waste management by-laws [28], made it mandatory to have no solid waste on the streets and to separate solid waste at the source for biodegradable and non-biodegradable solid waste. So far, for various reasons, the municipal authority has not been able to implement these bye-laws. As a result, even the solid waste that has been collected and transferred officially is dumped at the unregulated open dump site. As a result of environmental pollution and other aesthetic effects, it is also unsuitable for achieving the minimum criteria set by environmental protection agencies.
On the other hand, existing dumpsites were not given a scientific appraisal when introduced. Also, the [9], feasibility study noted the imminent need for a sanitary landfill as well as the closure of current dumpsites. Thus, insufficient solid waste service is anticipated to impact this city's productivity and economic growth negatively. Therefore, it is essential to introduce new, appropriately evaluated alternative disposal sites to meet an exponentially growing population's solid waste disposal needs.
Inadequate storage of solid waste at the source, lack of separation of recyclable solid waste, lack of primary collection of solid waste from the doorstep, irregular street sweeping, inappropriate and unhygienic secondary storage of solid waste, irregular transport of solid waste in open vehicles, lack of treatment of solid waste, and unhygienic solid waste disposal are just a few of the obvious deficiencies in the city's solid waste management [9].
Therefore, in order to find sustainable solutions to these general problems in Hargeisa, it is vital to research and suggests the appropriate landfill locations. Thus, this study contributes to the provision of pertinent information necessary for choosing suitable solid waste management sites.
2.3. Current status of municipal solid waste disposal sites in the studied area
The entire solid waste of the city is disposed of at the dumping grounds untreated. The valuable resource is quite often burnt. The City Municipal Council has adopted crude dumping as a method of solid waste disposal. Municipal solid waste is disposed of in only two landfills within the city limits, resulting in nuisance and unsanitary conditions (Figure 2).
- South dumping site –one:
Generally, the solid waste disposal sites, including the roadways, are poorly managed. Solid waste is dumped in open spaces haphazardly anywhere. Additionally, the solid waste is neither spread nor covered. The site is full of birds and baboons. Smoke is seen emanating from the heaps of solid waste, posing a serious threat to the human health, environment, and safety of aircraft. Burning solid waste is done to reduce the solid waste volume, resulting in air pollution by releasing pollutants like dioxins. There is no segregation of solid waste. Solid waste contains a lot of plastic, tin, metals, and glass, which can be recycled [9].
The landfill is located just 4.6 km from the Airport, significantly impacting aircraft movement. The airport authorities are seriously concerned about this threat and have complained to the municipal authority to close or shift this site. Besides, the site is located on the hillside; the leachate/ contaminated water flows down the slope and contaminates the downstream. Furthermore, the strong winds are spreading plastic bags everywhere, significantly affecting the activities and health of the surrounding community [9].
- North dumping site – two:
It is the largest dumpsite in the city. Previously, it was far from the habitation, but today the plotting for housing has been done very much near the site. At both municipal solid waste disposal sites, there has been no digging of pits/holes. Solid waste is being directly dumped and burnt. The solid waste disposed of at the earlier site (old disposal site) near the present site has not been capped. It is understood to dispose of it off to the new disposal site, which is not far away. The same procedure of burning solid waste is adopted at the new location. Once the fire is extinguished, the ashes are moved aside so that new solid waste can be dumped and burned. Besides, since both the old and the new solid waste disposal sites are located on the hilltop, the flow of the contaminated water during rains goes down in the valley towards the streams and drinking water source/wells near the area [9].
Moreover, although some scavenging is done at the site by rag pickers, tin, glass, and plastic bags are still not picked up. In addition, during strong winds, plastic bags are transported over long distances and staked in the community. Therefore, the sustainability of the environment and public health was more seriously threatened by open burning, leachate leakage, and disturbance from the north open dumping site [9].
Keeping all the facts mentioned above, this study was designed to identify the best future solid waste landfills for the City of Hargeisa, using GIS-based Analytical Hierarchy Processes.
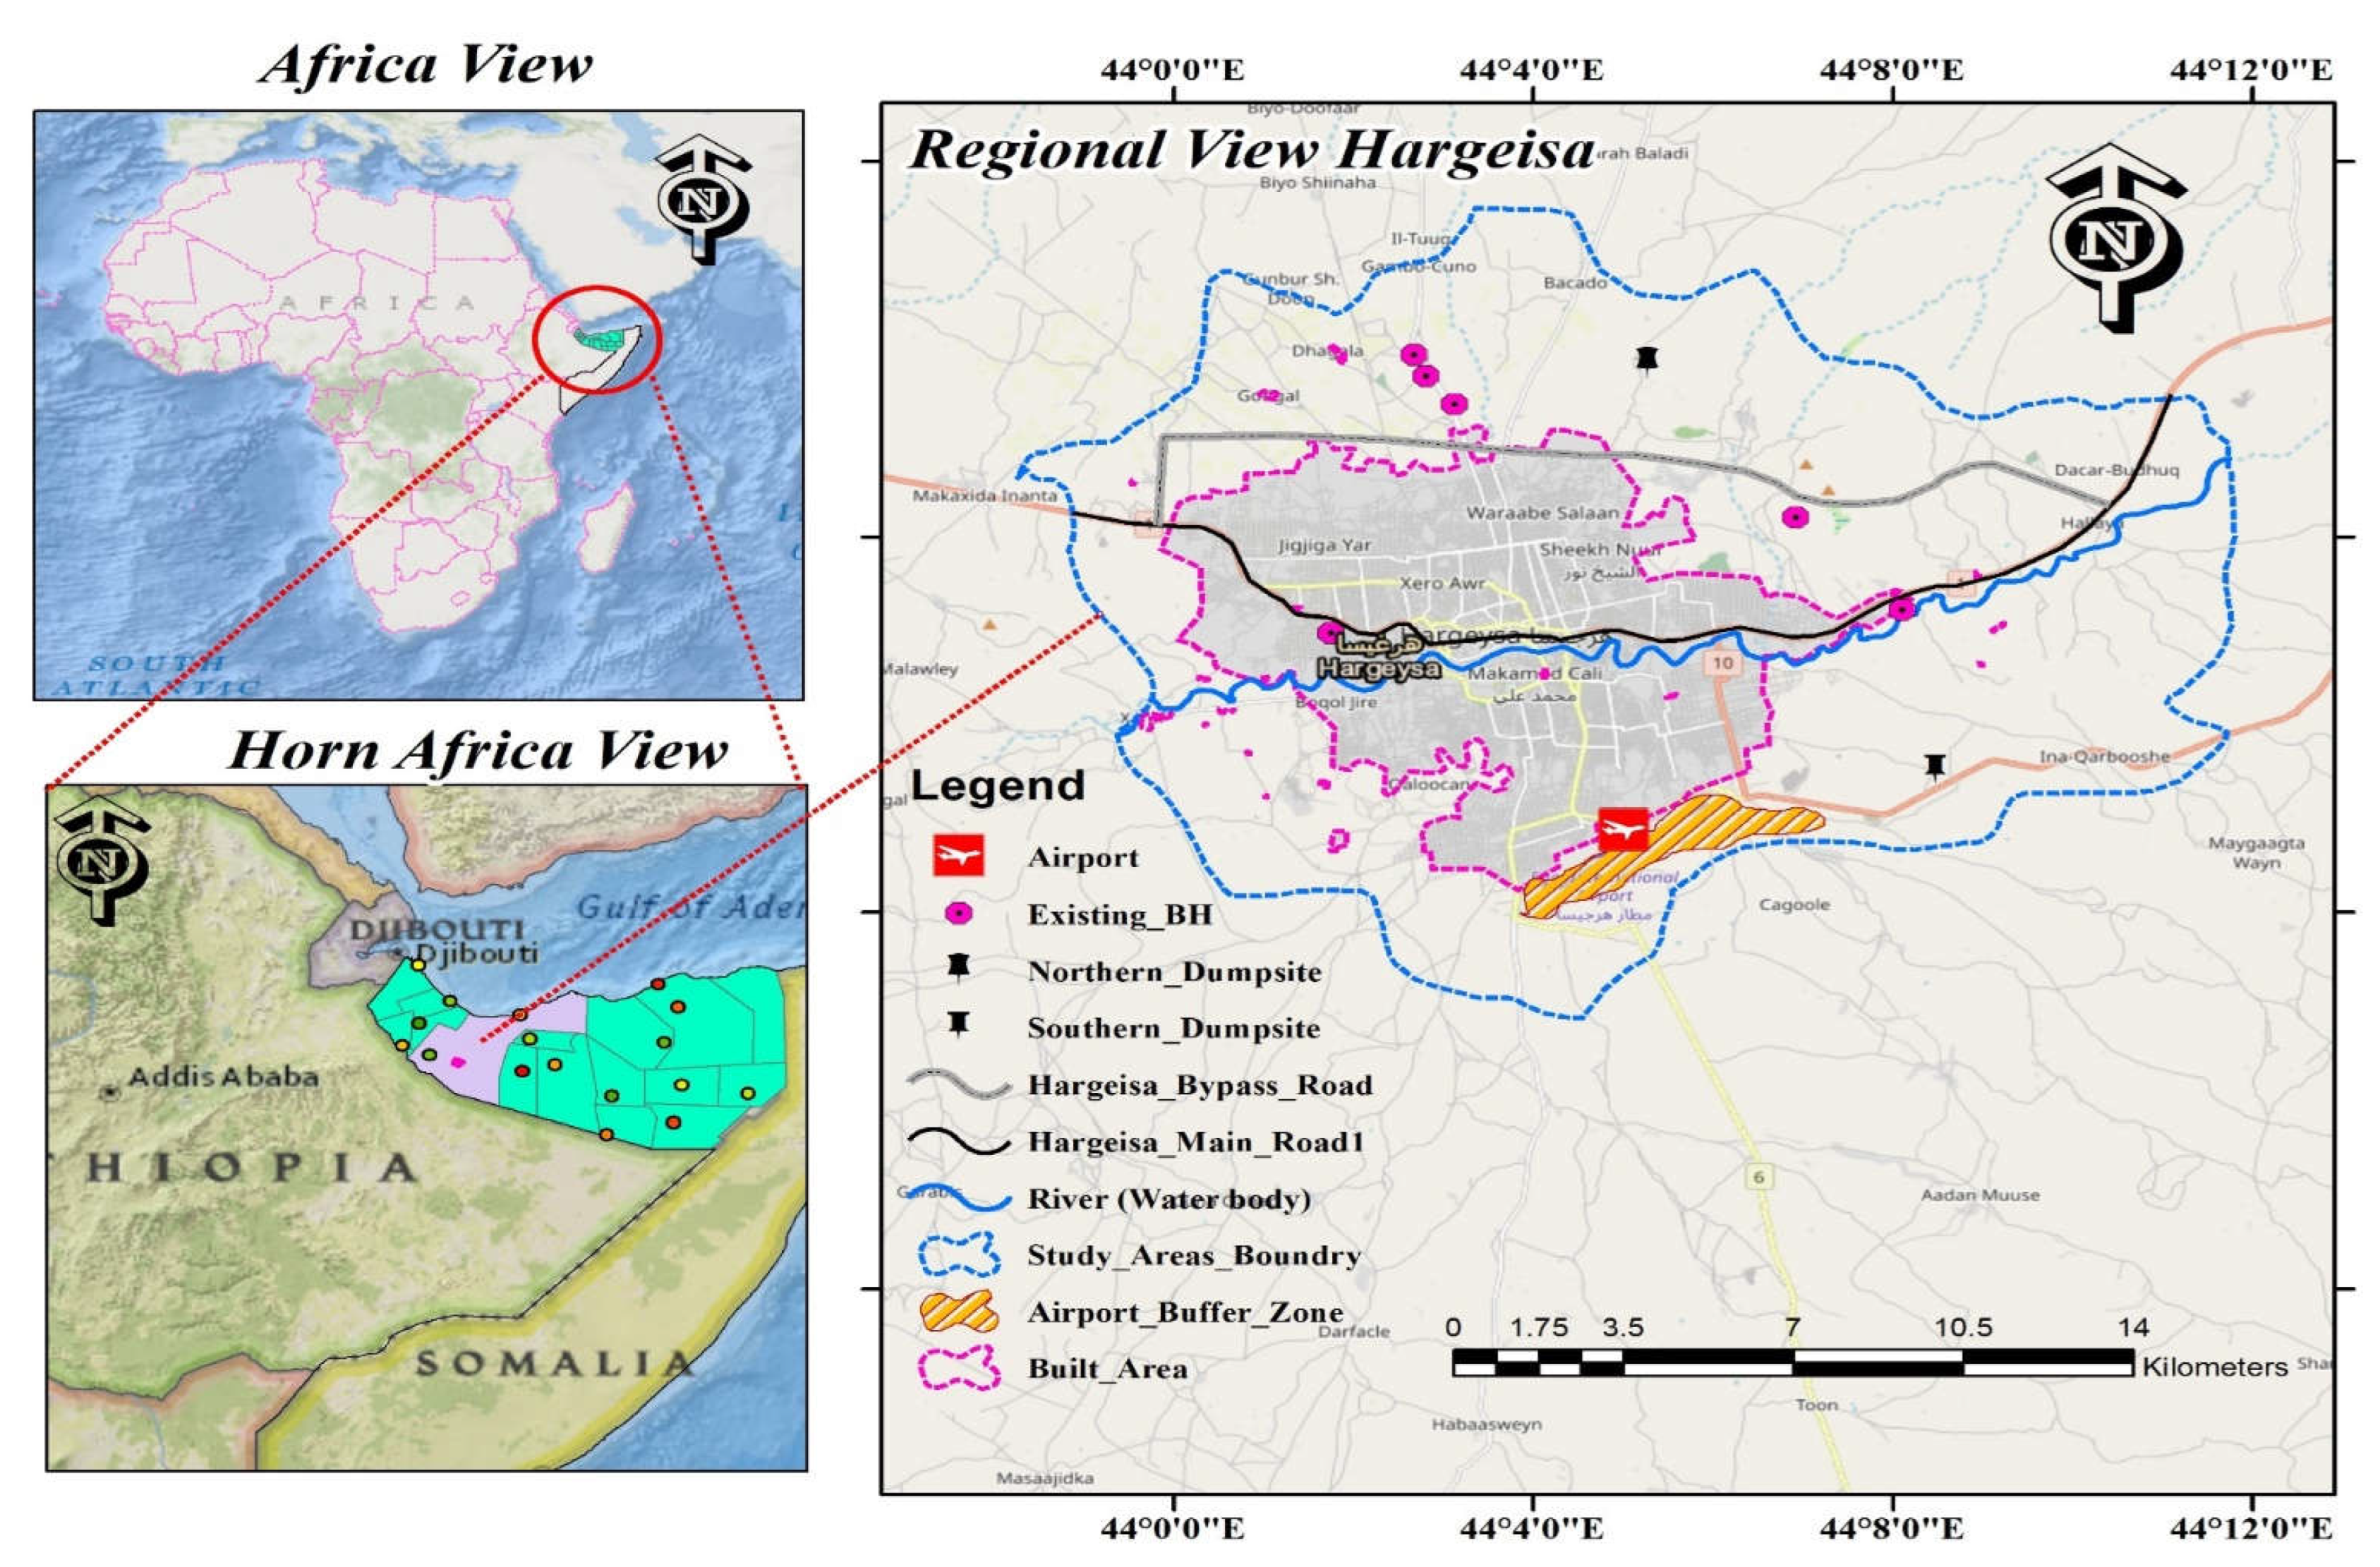
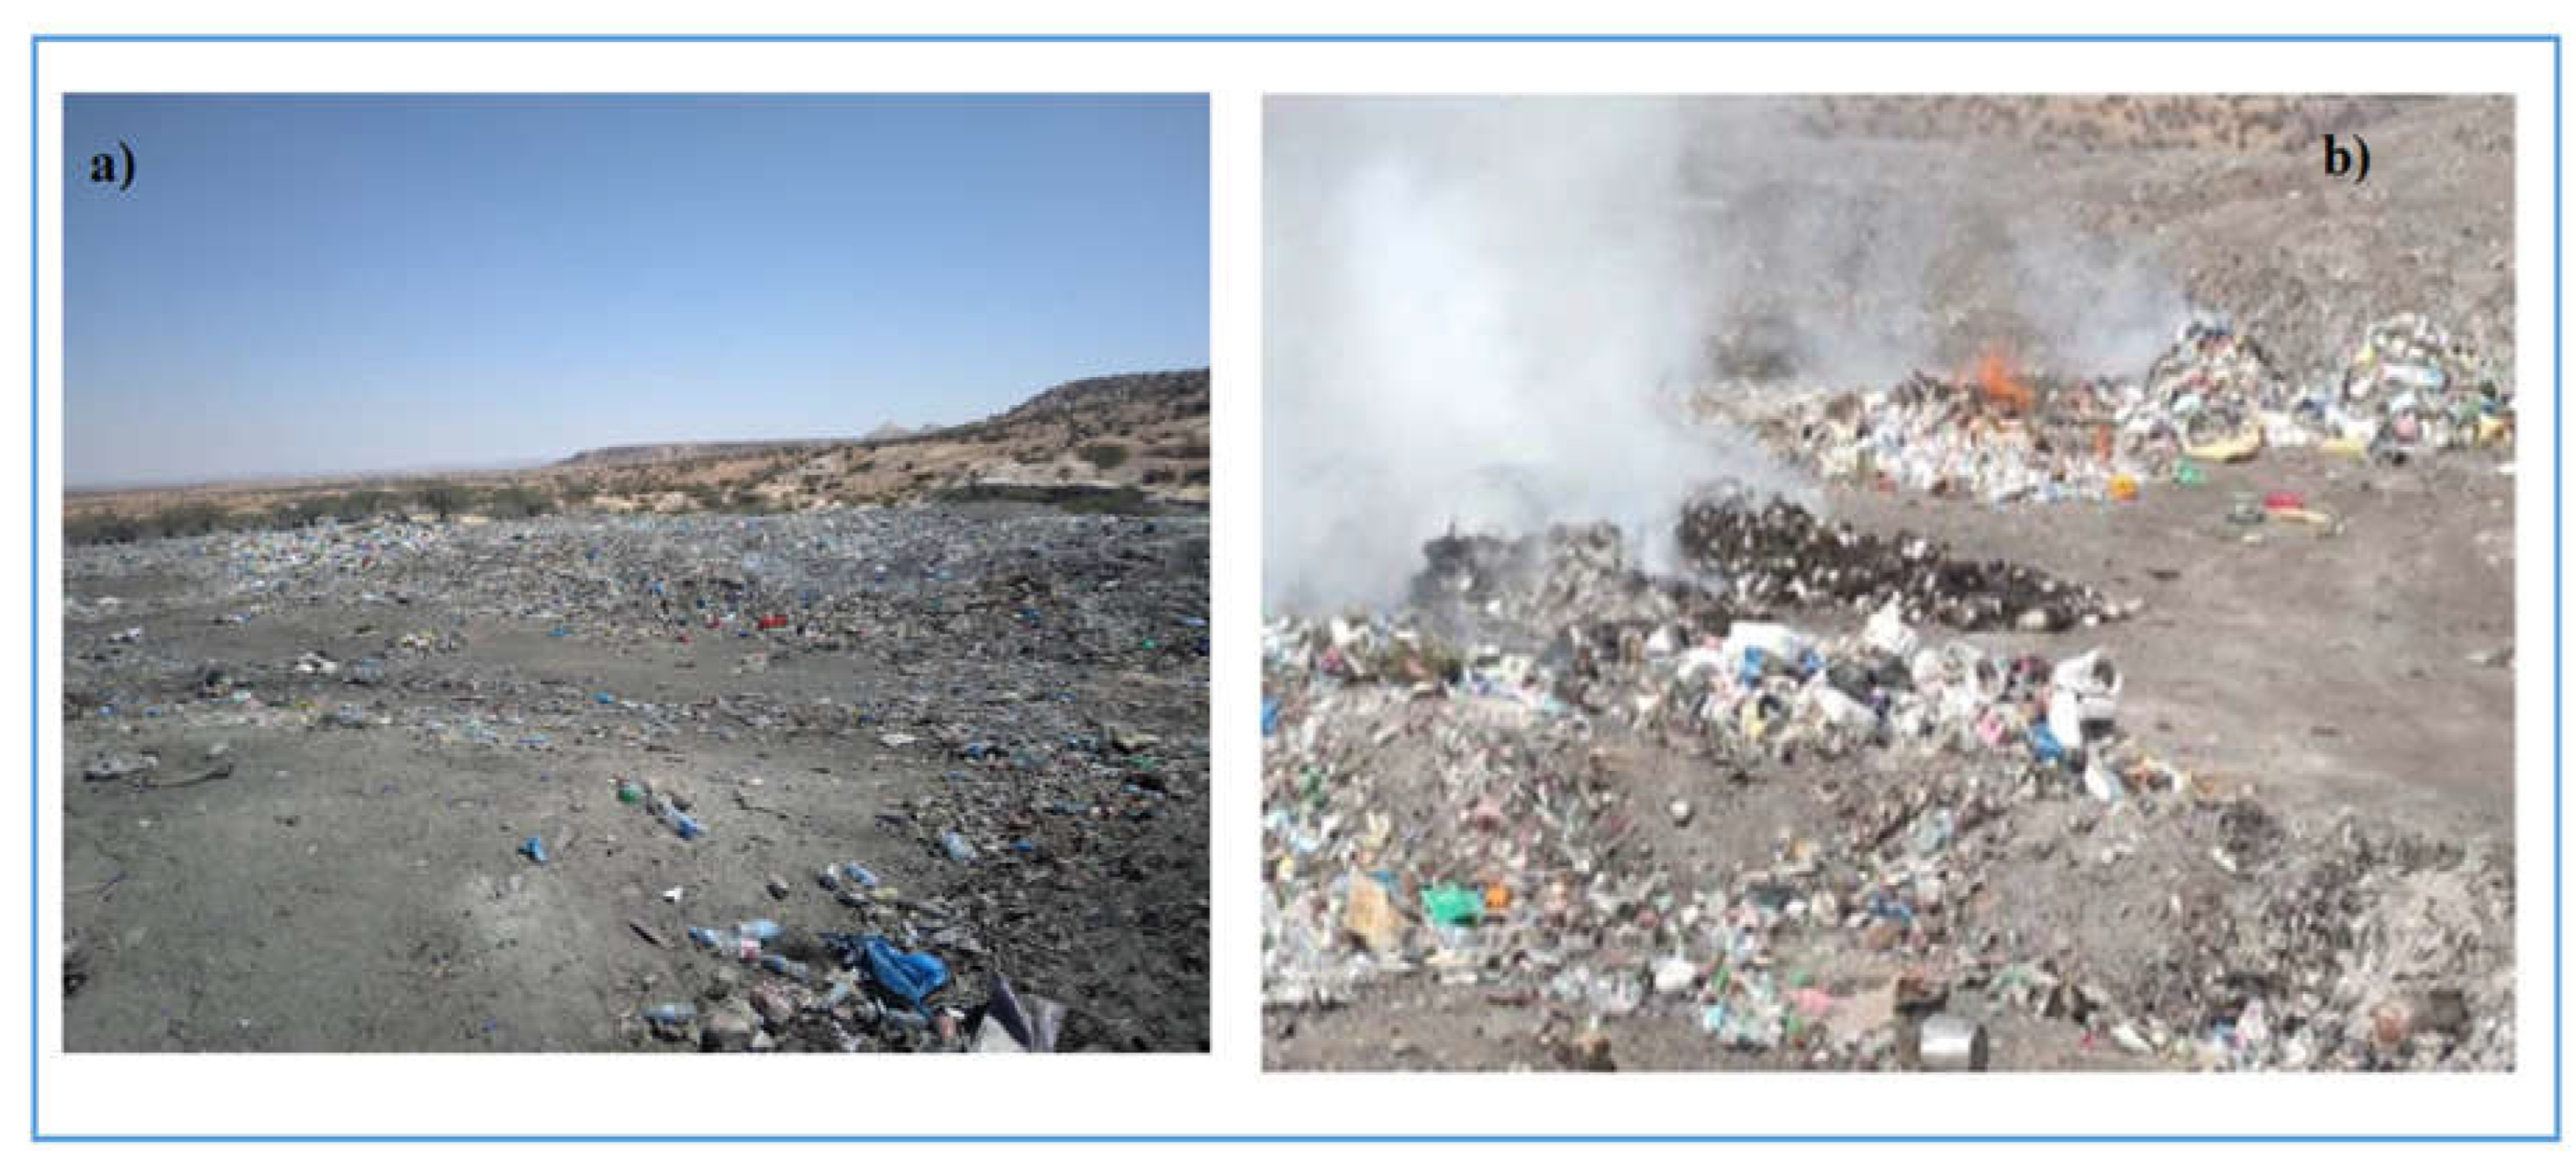
Figure 1.
Map of the study area.
Figure 2.
Open dumping and burning of solid waste, including medical waste, at the dumpsites a) North dumping site – two b) South dumping site –one.
Figure 2.
Open dumping and burning of solid waste, including medical waste, at the dumpsites a) North dumping site – two b) South dumping site –one.
2.4. Simulation model design
Figure 3 displays the developed methodology applied in this study. Eleven determinant factors were used in the current study, including proximity to existing dump sites, surface water, and river access, boreholes (distance to water wells), airport, and distance from main roads, land use and land cover (LULC), geology, soil type, elevation, and slope.
2.5. Data collection and processing
In order to successfully investigate the entire region and assess the level of suitability for the area, technical and social data were also collected using both primary and secondary data. Additionally, information was gathered from a variety of sources, including the most recent multispectral satellite pictures, cloudless Landsat geo-referenced data, DEM, and professional opinions (Table 1). Several softwares, including ERDAS Image 2015 and ArcGIS 10.3, were used to do this. According to [29], one of the most accurate elevation data that is currently freely available is derived from the Shuttle Radar Topographic Mission (SRTM), a Digital Elevation Model (DEM) dataset with 12.5 m spatial resolution. On the Open Street Map website (https://www.openstreetmap.org), road data were downloaded. A portable global positioning system (GPS) was used to gather data on airports and existing dumpsites in the research area. The geology and soil of the research region were retrieved from the geological, and soil datasets that were received from Somalia Water and Land Information Management (SWALIM) (https://faoswalim.org). First, using Arc-GIS 10.3 software, all criteria utilized in this study were geo-referenced and transformed into a raster format in order to be ready for categorization and standardization. All criteria were then geo-referenced to zone 38 N of the UTM Projection system. The spatial resolution of 12.5 m was achieved by rasterizing and resampling vector datasets. Secondly, using the spatial analyst tool in ArcGIS 10.3 software, all input datasets were reclassified, ranked, and then standardized into unsuitable, less-suitable, suitable, moderately suitable, and very high suitable zones with their given weights ranging from 1 to 5. By using the AHP technique, where the consistency ratio was assessed, weights were assigned to each thematic dataset. Following the integration of these datasets using the Weighted Linear Combination (WLC) method, a map of the suitability of solid waste landfill sites was created. Finally, using the predetermined eleven influencing parameters, very suitable sites in the study area were identified.
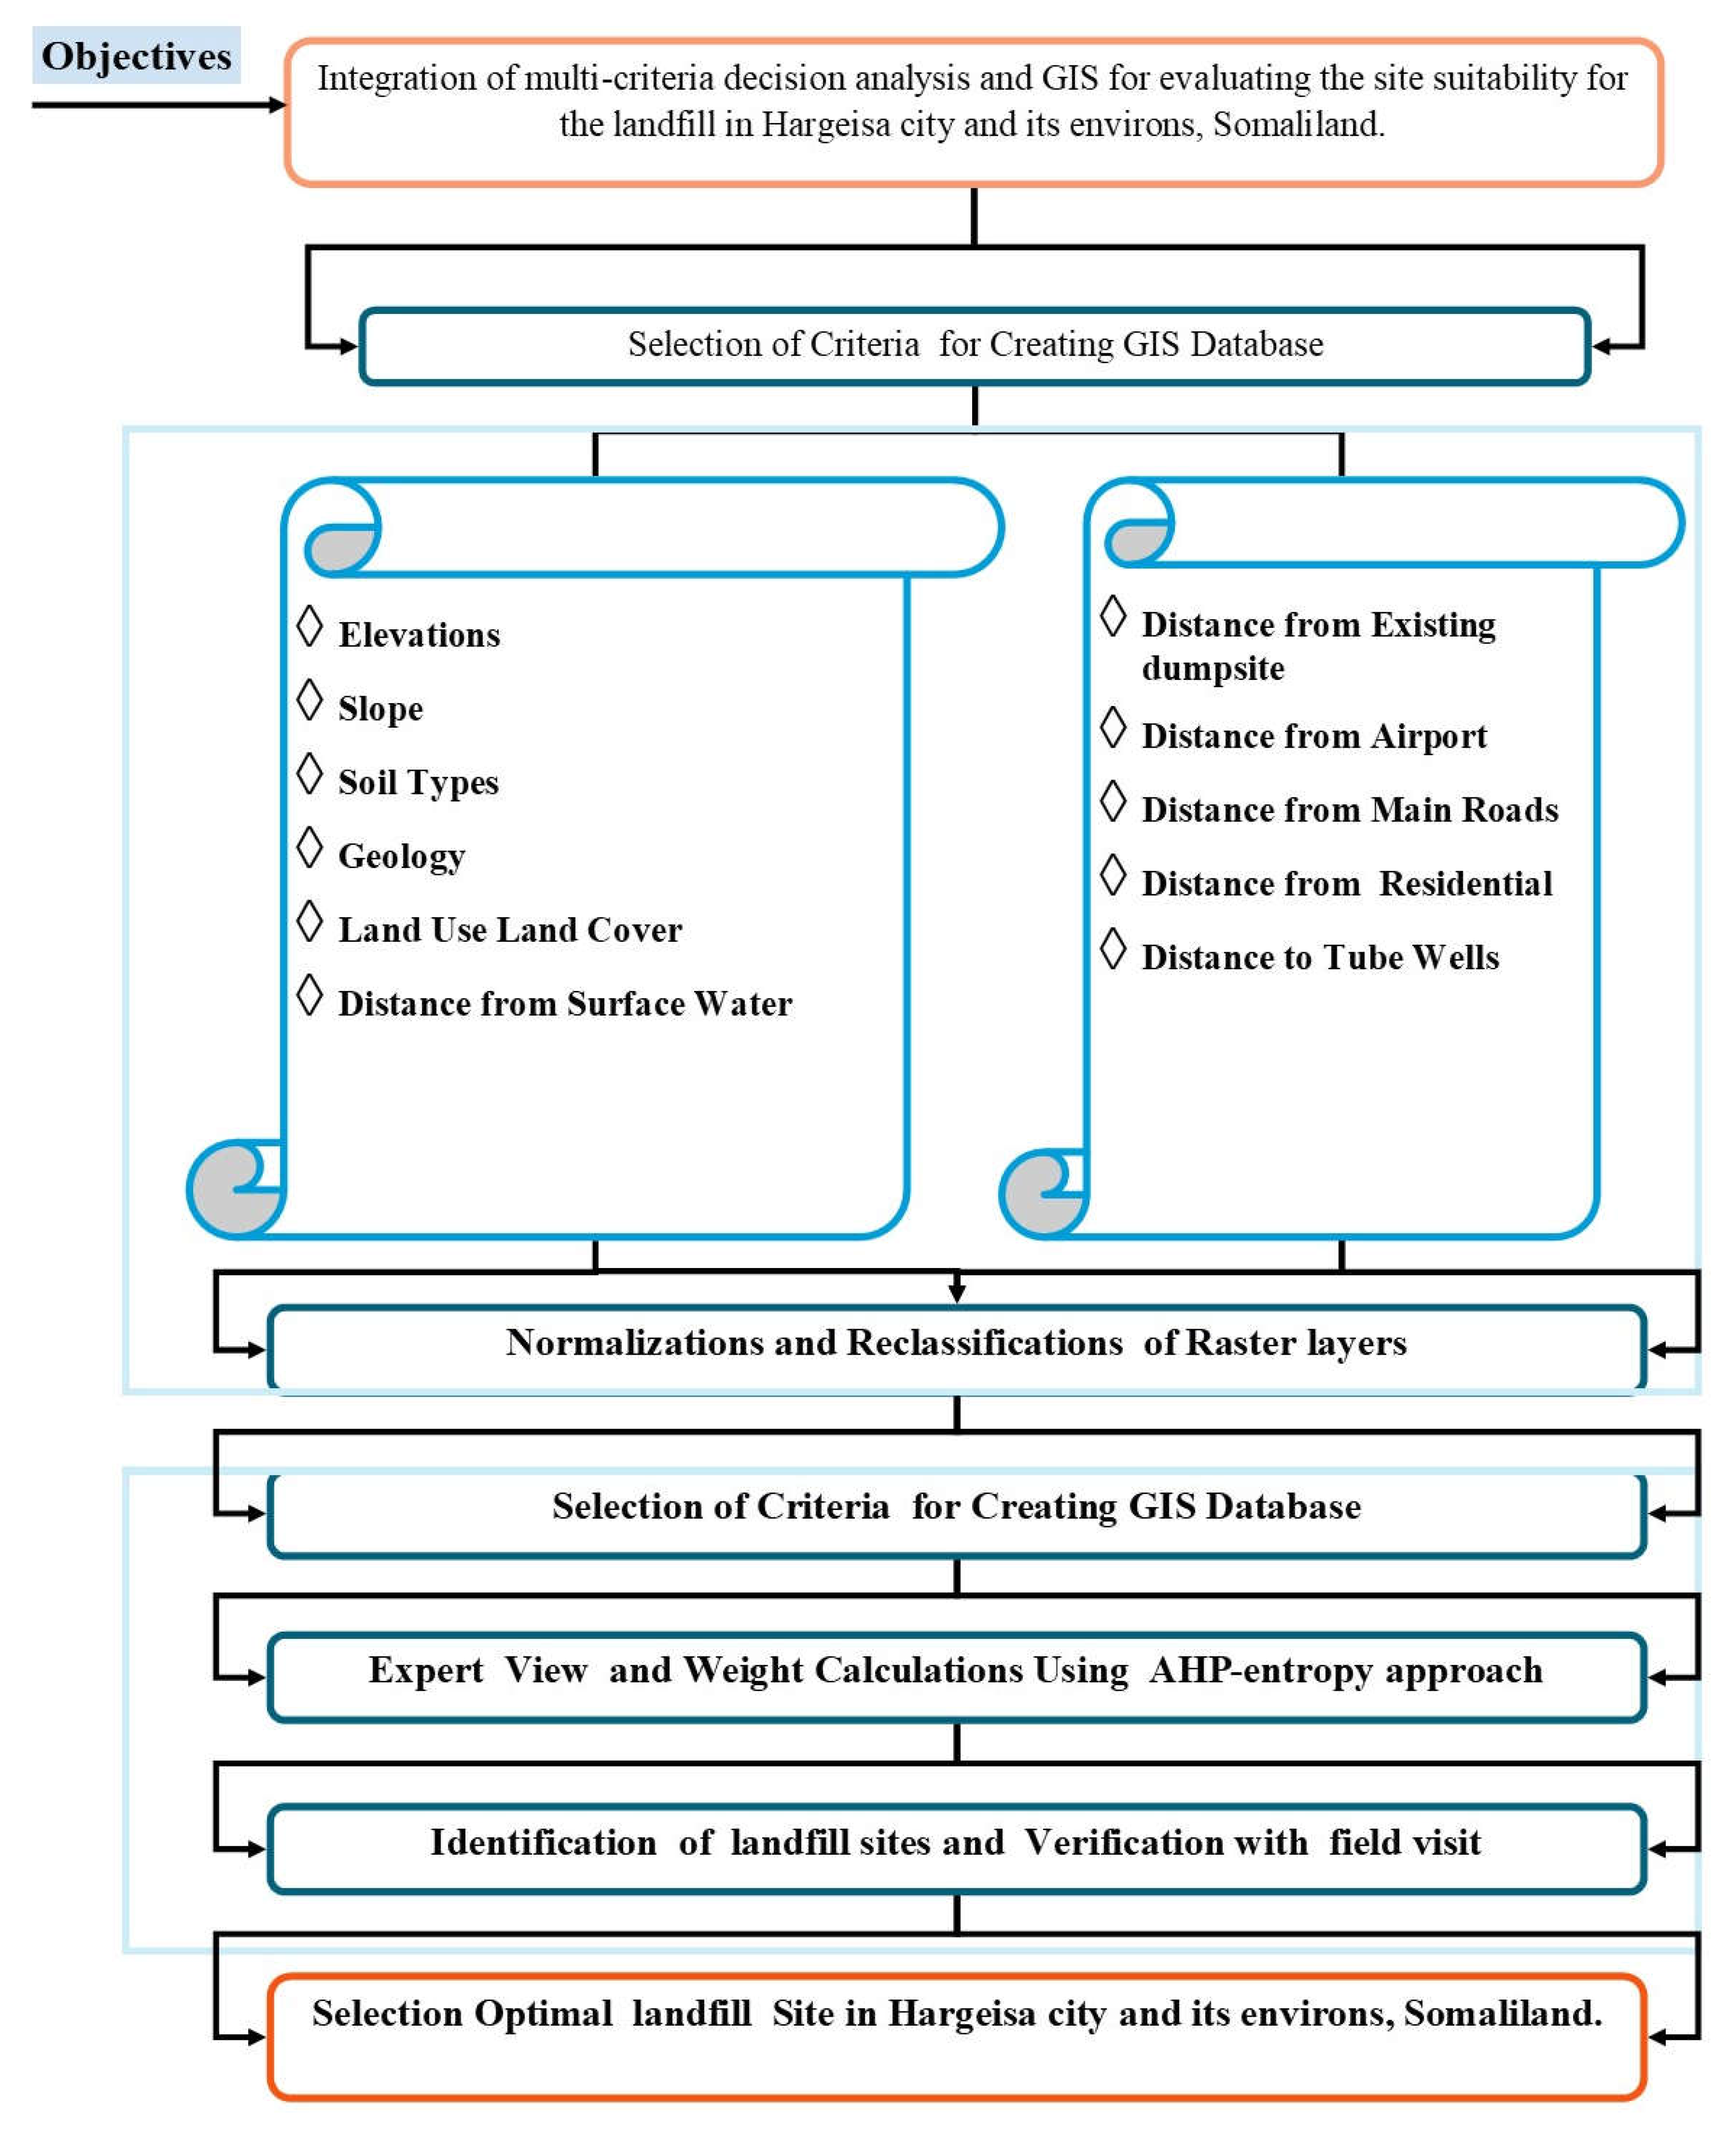

Table 1.
Dataset used in the study.
| No. | Map layer | Data source |
| 1 | Base Map | Map of the area (1:50,000) Satellite images from LANDSAT-8 (12.5 m) |
| 2 | Dumpsite locations | GPS handheld data collection with google earth verifications |
| 3 | Well data | SWALIM https://faoswalim.org |
| 4 | LULC | LANDSAT-8 satellite imagery (12.5) with google earth verifications |
| 5 | Road map | Open Street Map |
| 6 | Slope Map | ASTER-DEM (12.5) http://earthexplorer.usgs.gov/; |
| 7 | Elevation | ASTER-DEM (12.5) http://earthexplorer.usgs.gov/; |
| 8 | River | Google Earth pro |
| 9 | Airport | GPS handheld data collection with google earth verifications |
| 10 | Geological Structure | SWALIM https://faoswalim.org |
| 13 | Soil information | FAO-SWALIM Organization funded by EU https://faoswalim.org |
Figure 3.
The methodological framework in the study.
2.6. Application of GIS-based multicriteria decision analysis in landfill sites selection
2.6.1. Analytic hierarchy process
Using Eqs. 1 to 7, AHP has been determined. The multicriteria decision analysis (MCDA) technique known as AHP was developed by [30,31]. In this study, the AHP-entropy technique was employed to analyze data from a questionnaire survey. Therefore, specialists with in-depth knowledge and experience in choosing solid waste dump sites were invited to take part in the survey. Additionally, after normalizing the matrix value total and dividing it by numerous criteria, the weights for each criterion were determined. Due to the ability to statistically evaluate the judgment's accuracy, this technique becomes more dependable [29].
Moreover, the fundamental steps for applying the AHP approach are as follows [32].
Step 1 –Compare the factors: With nine levels of intensity scale in Table 3, the pair-wise matrix was constructed using the perspectives of the experts [16]. Which are shown in Table 4. In addition, the pair-wise comparison matrix calculation, as calculated by the following equation:
Where C11 represents the ith row's (first row) and jth column's (first column's) respective values in this comparison matrix.
Step-2: Complete the matrix: The matrix's values were added independently for each column [33]. Additionally, the column sums of the pair-wise matrices are given by the following equation:
Step-3: Matrix Normalization: The normalization for each column value can then be expressed using the following equations, as shown in Table 5.
Step-4: weight determination: After normalization, the row sum in the normalization matrix was divided by the total number of criteria [14]. The following is how the priority vector's criteria weights are calculated:
Step-5: Calculate the Consistency Ratio (C.R.) because only the consistency ratio (C.R.) value may be used to evaluate the judgment value's trustworthiness. As a result, when the C.R. value was less than 0.10 (10%), the comparison matrix was consistent, as indicated by [30].
Step- 5A: Lambda ( λ) max: The average value of each consistency vector was used to calculate the principal eigenvector (λmax). Following is the equation that was used to obtain the principal eigenvalue (λmax) [18].
Step 5B: The consistency Index (CI) was chosen to assess the degree of a matrix's departure from consistency. The value of 𝜆max was highlighted as being necessary for the discussion of the consistency ratio calculation [34]. The Consistency Index (CI) was calculated as follows:
Where 𝜆max is the maximum eigenvalue and n represents the number of criteria.
Step 5C: Random Index (R.I.) The only factor affecting the random index is how many elements were compared. Table 2 below displays the random index values for the consistency index.
Table 2.
values of random index values for the consistency index [30].
Table 2.
values of random index values for the consistency index [30].
| n | 1 | 2 | 3 | 4 | 5 | 6 | 7 | 8 | 9 | 10 | 11 | 12 | 13 | 14 | 15 |
| RI | 0.00 | 0.00 | 0.52 | 0.89 | 1.11 | 1.25 | 1.35 | 1.40 | 1.45 | 1.49 | 1.51 | 1.54 | 1.56 | 1.57 | 1.58 |
* n= order of the matrix.
Step-5D: Consistency Ratio (C.R): Comparing the CI with the Random Index resulted in the development of the final consistency ratio [30]. Shown in Table 6
The current study's C.R. is 0.05 and is less than 0.10. If the obtained C.R is higher than this threshold, the judicial response in the pair-wise comparison matrix is regarded as inconsistent, and the process needs to be redone [29]. It, therefore, suggests that the weights assigned were appropriate. Additionally, the model accurately reflected the degree of reality present in the research area, demonstrating the method's efficacy in locating and mapping landfill-prone locations.
Table 3.
the nine-point weighing scale for pair-wise comparisons [30].
Table 3.
the nine-point weighing scale for pair-wise comparisons [30].
| Intensity of importance | Description | Suitability class |
| 1 | Equal importance | Low suitability |
| 2 | Equal to moderate importance | Very low suitability |
| 3 | Moderate importance | Low suitability |
| 4 | Moderate to strong importance | Moderately low suitability |
| 5 | Strong importance | Moderately suitability |
| 6 | Strong to very strong importance | Moderate high suitability |
| 7 | Very strong importance | High suitability |
| 8 | Very to extremely strong importance | Very high suitability |
| 9 | Extreme importance | Highest suitability |
Table 4.
Pair-wise comparison matrix for selected landfill controlling factors.
| Factors | (C1) | (C2) | (C3) | (C4) | (C5) | (C6) | (C7) | (C8) | (C9) | (C10) | (C11) | |
| LULC (C1) | 1 | 2 | 2 | 2 | 3 | 3 | 3 | 2 | 3 | 4 | 4 | |
| Habitations (C2) | 0.50 | 1 | 1 | 3 | 2 | 3 | 3 | 1 | 4 | 5 | 5 | |
| Water bodies (C3) | 0.50 | 1.00 | 1 | 2 | 2 | 3 | 3 | 2 | 4 | 4 | 6 | |
| Airport (C4) | 0.50 | .33 | .50 | 1 | 2 | 2 | 3 | 2 | 3 | 4 | 5 | |
| Elevation (C5) | 0.33 | .50 | .50 | .50 | 1 | 2 | 3 | 3 | 4 | 4 | 4 | |
| Roads (C6) | 0.33 | .33 | .33 | .50 | .50 | 1 | 2 | 2 | 3 | 4 | 5 | |
| Slope (C7) | 0.33 | 0.33 | 0.33 | 0.33 | 0.33 | 0.50 | 1 | 1 | 2 | 3 | 4 | |
| Lithology (C8) | 0.50 | 1.00 | 0.50 | 0.50 | 0.33 | 0.50 | 1.00 | 1 | 2 | 3 | 4 | |
| Soil types (C9) | 0.33 | 0.25 | 0.25 | 0.33 | 0.25 | 0.33 | 0.50 | 0.50 | 1 | 2 | 3 | |
| Borehole (C10) | 0.25 | 0.20 | 0.25 | 0.25 | 0.25 | 0.25 | 0.33 | 0.33 | 0.5 | 1 | 2 | |
| Existing Dumpsites (C11) | 0.25 | 0.25 | 0.16 | 0.20 | 0.25 | 0.20 | 0.25 | 0.25 | .33 | 0.50 | 1 | |
| Sum | 4.83 | 7.15 | 6.83 | 10.6 | 11.9 | 15.8 | 20.1 | 15.1 | 27 | 34.5 | 43 | |
Table 5.
Normalized pair-wise comparison matrix and calculated criteria weight for each parameter.
| Factors | (C1) | (C2) | (C3) | (C4) | (C5) | (C6) | (C7) | (C8) | (C9) | (C10) | (C11) | Sum | CriteriaWeights | Criteria weight (%) |
| (C1) | 0.21 | 0.28 | 0.29 | 0.19 | 0.25 | 0.19 | 0.15 | 0.13 | 0.11 | 0.11 | 0.09 | 2.01 | 0.18 | 18 |
| (C2) | 0.10 | 0.14 | 0.15 | 0.28 | 0.17 | 0.19 | 0.15 | 0.07 | 0.15 | 0.14 | 0.12 | 1.66 | 0.15 | 15 |
| (C3) | 0.10 | 0.14 | 0.15 | 0.19 | 0.17 | 0.19 | 0.15 | 0.13 | 0.15 | 0.12 | 0.12 | 1.62 | 0.15 | 15 |
| (C4) | 0.10 | 0.05 | 0.07 | 0.09 | 0.17 | 0.13 | 0.15 | 0.13 | 0.15 | 0.12 | 0.12 | 1.24 | 0.11 | 11 |
| (C5) | 0.07 | 0.07 | 0.07 | 0.05 | 0.08 | 0.13 | 0.15 | 0.20 | 0.15 | 0.12 | 0.09 | 1.18 | 0.11 | 11 |
| (C6) | 0.07 | 0.05 | 0.05 | 0.05 | 0.04 | 0.06 | 0.10 | 0.13 | 0.11 | 0.12 | 0.12 | 0.89 | 0.08 | 8 |
| (C7) | 0.07 | 0.05 | 0.05 | 0.03 | 0.03 | 0.03 | 0.05 | 0.07 | 0.07 | 0.09 | 0.09 | 0.63 | 0.06 | 6 |
| (C8) | 0.10 | 0.14 | 0.07 | 0.05 | 0.03 | 0.03 | 0.05 | 0.07 | 0.07 | 0.09 | 0.09 | 0.79 | 0.07 | 7 |
| (C9) | 0.07 | 0.04 | 0.04 | 0.03 | 0.02 | 0.02 | 0.03 | 0.03 | 0.04 | 0.06 | 0.02 | 0.44 | 0.04 | 4 |
| (C10) | 0.05 | 0.03 | 0.04 | 0.02 | 0.02 | 0.02 | 0.02 | 0.02 | 0.02 | 0.03 | 0.05 | 0.31 | 0.03 | 3 |
| (C11) | 0.05 | 0.03 | 0.02 | 0.02 | 0.02 | 0.01 | 0.01 | 0.07 | 0.01 | 0.01 | 0.02 | 0.22 | 0.02 | 2 |
| 11 | 1 | 100 |
Table 6.
Calculating the consistency of pair-wise comparison (C.R = 0.05).
| Factors | (C1) | (C2) | (C3) | (C4) | (C5) | (C6) | (C7) | (C8) | (C9) | (C10) | (C11) |
| (C1) | 0.18 | 0.30 | 0.30 | 0.22 | 0.32 | 0.24 | 0.17 | 0.14 | 0.12 | 0.11 | 0.09 |
| (C2) | 0.09 | 0.15 | 0.15 | 0.34 | 0.21 | 0.24 | 0.17 | 0.07 | 0.12 | 0.14 | 0.11 |
| (C3) | 0.09 | 0.15 | 0.15 | 0.23 | 0.21 | 0.24 | 0.17 | 0.14 | 0.12 | 0.11 | 0.13 |
| (C4) | 0.09 | 0.05 | 0.07 | 0.11 | 0.21 | 0.16 | 0.17 | 0.14 | 0.12 | 0.11 | 0.11 |
| (C5) | 0.06 | 0.08 | 0.07 | 0.06 | 0.11 | 0.16 | 0.17 | 0.22 | 0.12 | 0.11 | 0.08 |
| (C6) | 0.06 | 0.05 | 0.04 | 0.06 | 0.05 | 0.08 | 0.11 | 0.14 | 0.12 | 0.11 | 0.11 |
| (C7) | 0.06 | 0.05 | 0.04 | 0.04 | 0.04 | 0.04 | 0.06 | 0.07 | 0.02 | 0.08 | 0.09 |
| (C8) | 0.09 | 0.15 | 0.07 | 0.06 | 0.04 | 0.04 | 0.06 | 0.07 | 0.02 | 0.08 | 0.09 |
| (C9) | 0.06 | 0.04 | 0.03 | 0.04 | 0.03 | 0.03 | 0.03 | 0.04 | 0.04 | 0.06 | 0.06 |
| (C10) | 0.05 | 0.03 | 0.03 | 0.03 | 0.03 | 0.02 | 0.02 | 0.02 | 0.02 | 0.03 | 0.04 |
| (C11) | 0.05 | 0.03 | 0.02 | 0.02 | 0.03 | 0.02 | 0.01 | 0.02 | 0.01 | 0.01 | 0.02 |
2.6.2. Applications in GIS
2.6.2.1. Normalization of selected criteria
The datasets have distinct categorization units and need to be rasterized before they can be combined into a single measuring unit for further analysis. Moreover, the weighted criteria were divided into sub-classes and listed on a common preference scale from 1 (least liked) to 5 (most favored) [35]. In order to normalize datasets, an integer value between 1 and 5 was assigned to each utilizing the reclassifying tool in the ArcGIS10.3 program. As a result, it is a helpful tool for spatial decision-making (Table 7).
Table 7.
suitability score [35].
Table 7.
suitability score [35].
| Score | Suitability |
| 1 | Unsuitable |
| 2 | Less Suitable |
| 3 | Suitable |
| 4 | Moderately Suitable |
| 5 | Highly Suitable |
However, solving landfill selection issues has been made easier with the incorporation of GIS and the AHP approach [36].
2.6.2.2. Criteria restriction mapping
In order to create a binary mask layer with the values 0 and 1, all gathered restricted layers were merged using a raster calculator tool in the spatial analysis [37]. As a result, a value of 0 for the unsuitable region and a value of 1 for the suitable area was assigned to the restricted and non-restricted areas, as illustrated in Figure 4. The exclusionary regions for waste disposal sites that were not included in the suitability mapping are shown in Table 8.
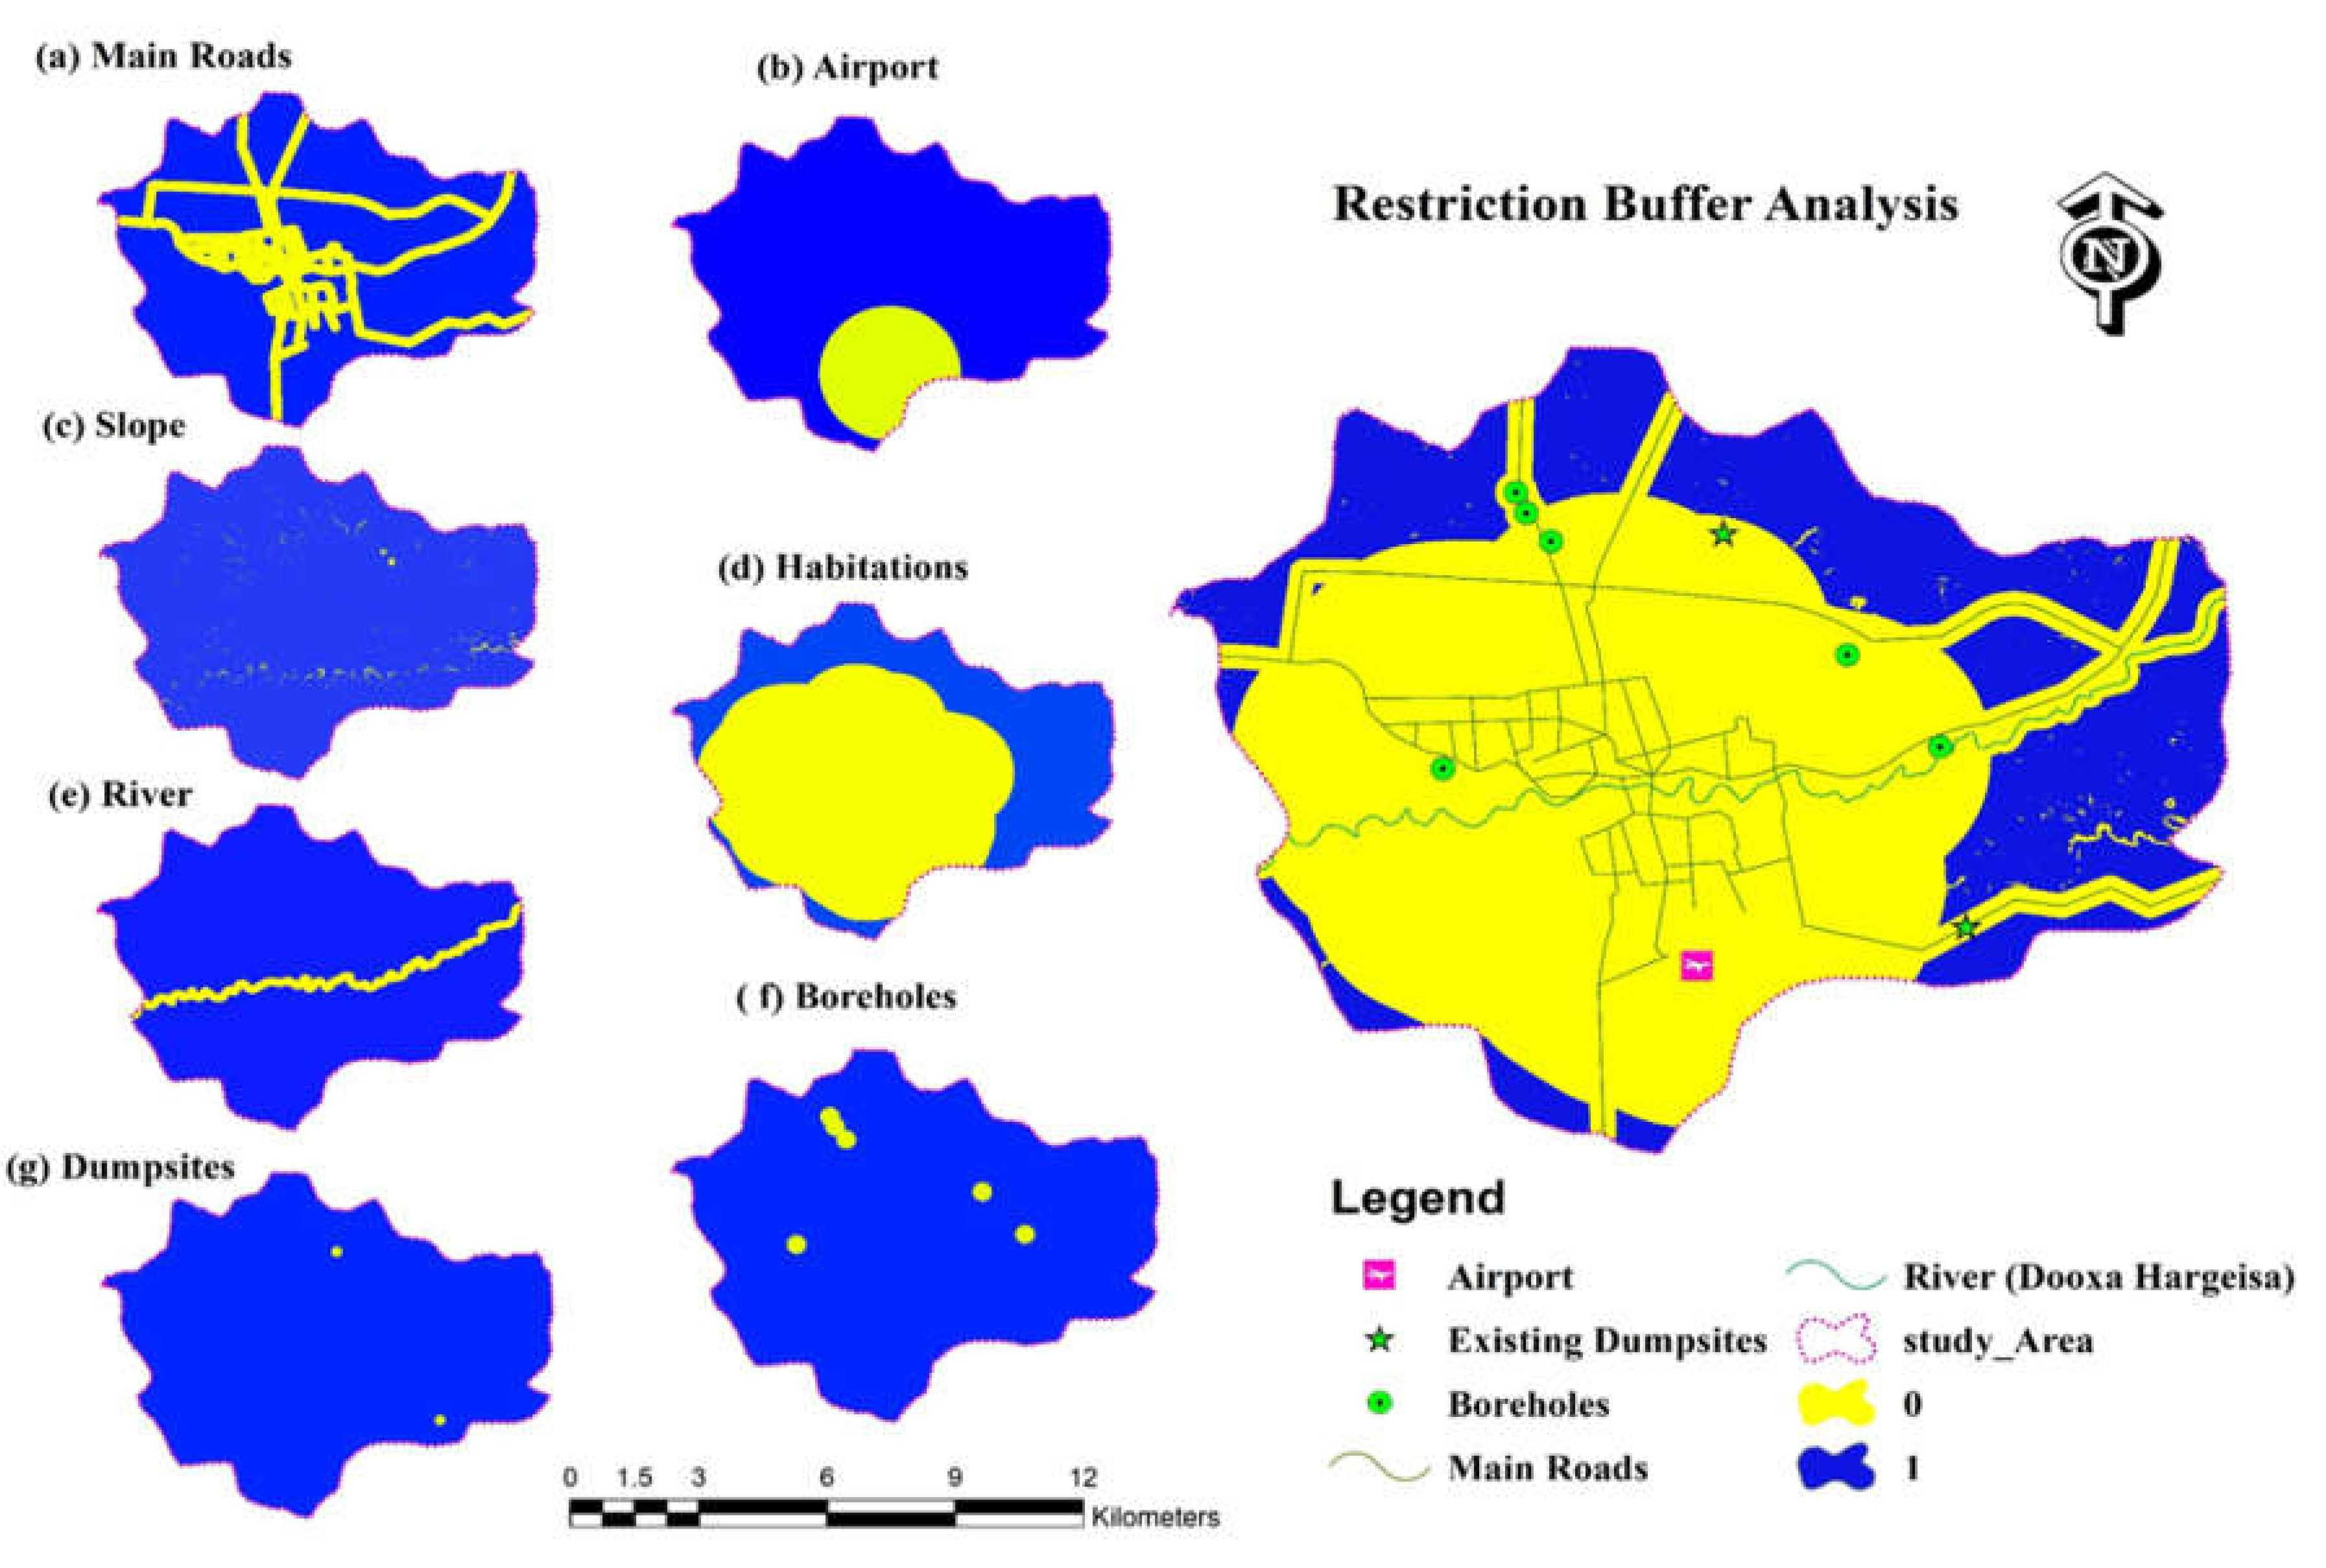
Table 8.
Exclusionary criteria for landfill sites of the study area.
| Criteria | Parameters* | Suitability Score | Ranks | Area in Hectors |
| Slope | 0-30% | Suitable | 1 | 30240.7 |
| >30% | Unsuitable | 0 | 301.547 | |
| habitations | 0-3000 | Unsuitable | 0 | 18824.8 |
| >3000 | Suitable | 1 | 11732 | |
| Water bodies | 0-250 | Unsuitable | 0 | 1530.23 |
| >250 | Suitable | 1 | 29026.6 | |
| Airport | 0-4000 | Unsuitable | 0 | 4226.44 |
| >4000 | Suitable | 1 | 26328.4 | |
| Existing dumpsites | 0-500 | Unsuitable | 0 | 56.0313 |
| >500 | Suitable | 1 | 30500.8 | |
| Road | 0-300 | Unsuitable | 0 | 7536.2 |
| >300 | Suitable | 1 | 23020.6 | |
| wells | 0-500 | Unsuitable | 0 | 444.469 |
| >500 | Suitable | 1 | 30112.3 |
*All parameters are in meters, except in slope %.
Figure 4.
Restriction buffer analysis used for (a) road, (b) Airport, (c) slope, (d) habitation, (e)river, (f) boreholes, and (g) dumpsite.
Figure 4.
Restriction buffer analysis used for (a) road, (b) Airport, (c) slope, (d) habitation, (e)river, (f) boreholes, and (g) dumpsite.
Table 9.
Description of criteria and sub-criteria of the input layer.
| Criteria | Sub-Criteria | Ranking | Area | Level Suitability | ||
|---|---|---|---|---|---|---|
| (hector) | Percentage (%) | |||||
| Elevation | < 1195 | 5 | 1728.94 | 5.65 | Highly Suitable | |
| 1195-1245 | 4 | 7152.09 | 23.40 | Moderately Suitable | ||
| 1245-1295 | 3 | 10336.80 | 33.82 | Suitable | ||
| 1295-1345 | 2 | 8537.31 | 27.93 | Less Suitable | ||
| >1345 | 1 | 2800.88 | 9.16 | Unsuitable | ||
| Distance from water bodies | <250 | 1 | 1530.23 | 5.0 | Unsuitable | |
| 250-550 | 2 | 1369.28 | 4.48 | Less Suitable | ||
| 550-750 | 3 | 1281.84 | 4.19 | Suitable | ||
| 750-1000 | 4 | 1242.2 | 4.06 | Moderately Suitable | ||
| >1000 | 5 | 25133.2 | 82.25 | Highly Suitable | ||
| Distance from the built-up area | <3000 | 1 | 18824.8 | 61.60 | Unsuitable | |
| 3000 - 4000 | 2 | 3735.34 | 12.22 | Less Suitable | ||
| 4000 - 5000 | 3 | 2917.48 | 9.54 | Suitable | ||
| 5000 - 6000 | 4 | 2185.16 | 7.15 | Moderately Suitable | ||
| >6000 | 5 | 2894.06 | 9.47 | Highly Suitable | ||
| Slope | <20 | 5 | 29077.1 | 95.20 | Highly Suitable | |
| 21-30 | 4 | 1163.59 | 3.80 | Moderately Suitable | ||
| 31-40 | 3 | 234.422 | 0.76 | Suitable | ||
| 41-51 | 2 | 56.5 | 0.18 | Less Suitable | ||
| >51 | 1 | 10.625 | 0.03 | Unsuitable | ||
| LULC | Water bodies | 1 | 6.09375 | 0.01 | Unsuitable | |
| Built-up areas | 2 | 4412.47 | 14.44 | Less Suitable | ||
| Agricultural areas | 3 | 324.34 | 1.21 | Suitable | ||
| Shrubs | 4 | 5349.94 | 17.51 | Moderately Suitable | ||
| bare land | 5 | 20432.5 | 66.89 | Highly Suitable | ||
| Geology | Auradu Limestone (Ea) | 1 | 273.797 | 0.89 | Unsuitable | |
| Sands, silt, and gravels (Q) | 5 | 19672 | 64.37 | Highly Suitable | ||
| Yesomma Sandstones (Ky) | 3 | 10611 | 34.72 | Suitable | ||
| Distance from an Existing Dumping ground | <500 | 1 | 157.03 | 0.51 | Unsuitable | |
| 500-1000 | 2 | 470.50 | 1.53 | Less Suitable | ||
| 1000-1500 | 3 | 779.23 | 2.55 | Suitable | ||
| 1500-2000 | 4 | 928.57 | 3.03 | Moderately Suitable | ||
| >2000 | 5 | 28221.5 | 92.35 | Highly Suitable | ||
| Distance from Main Road | <750 | 5 | 14456 | 47.30 | Highly Suitable | |
| 750-1500 | 4 | 7884.61 | 25.80 | Moderately Suitable | ||
| 1500-2250 | 3 | 4077.53 | 13.34 | Suitable | ||
| 2250-3000 | 2 | 2096.19 | 6.85 | Less Suitable | ||
| >3000 | 1 | 2042.5 | 6.68 | Unsuitable | ||
| Distance from wells (GW protections) | <500 | 1 | 444.46 | 1.45 | Unsuitable | |
| 500 – 1000 | 2 | 1099.91 | 3.59 | Less Suitable | ||
| 1000 – 1500 | 3 | 1723.19 | 5.63 | Suitable | ||
| 1500 – 4500 | 4 | 16640.1 | 54.45 | Moderately Suitable | ||
| >4500 | 5 | 10649.1 | 34.85 | Highly Suitable | ||
| Soil type | Calcaric Camisoles | 3 | 26746 | 87.52 | Suitable | |
| Chronic Cambisols | 3 | 107.047 | 0.35 | Suitable | ||
| Eutric Leptosols | 1 | 3703.78 | 12.12 | Unsuitable | ||
| Distance from Airport | <4000 | 1 | 4229.7 | 32.31 | Unsuitable | |
| 4000-5000 | 2 | 2030.78 | 15.51 | Less Suitable | ||
| 5000-6000 | 3 | 2080.31 | 15.89 | Suitable | ||
| 6000-7000 | 4 | 2234 | 17.07 | Moderately Suitable | ||
| >7000 | 5 | 2511.34 | 19.19 | Highly Suitable | ||
3. Results and Discussions
3.1. Criteria Description
3.1.1. Distance from rivers and surface water
Solid wastes dumped near rivers cause environmental, agricultural, and public health issues. Because of this, municipal solid waste disposal (MSWD) sites shouldn't be located close to surface waters [38]. The proximity map was reclassified. As a result, the region surrounding these water bodies is judged inappropriate for solid waste storage places because doing so could hurt humans and the environment [39]. A 250 m protective barrier was erected around rivers and surface waters in the study zone to ensure that the water bodies were not contaminated, and this area was omitted from the solid waste model. These scenarios were taken into account when creating the site map for the solid waste dump (Table 9 and Figure 5). Accordingly, 5.0% of the area was unsuitable, 4.48% was less suitable, 4.19% was suitable, 4.06% was moderately suitable, and 82.25% was highly suitable for solid waste disposal sites in Hargeisa.
3.1.2. Distance from groundwater discharge points (boreholes)
Numerous studies show landfill sites shouldn't be located within 500 meters of deep or shallow boreholes [17]. A closeness distance of less than 500 m was deemed undesirable in the current study, 500–1000 m was designated less suitable, 1000–1500 m was deemed suitable, 1500–4500 m was perceived suitable, and beyond 4500 m was voted highly suitable (Table 9 and Figure 6). According to the analysis, the overall research area has 34.85% ideally high suitable, 54.45% are suitable, 5.63% are moderately suitable, and 3.59% and 1.45% less suitable and unsuitable, respectively (Table 8 and Figure 5).
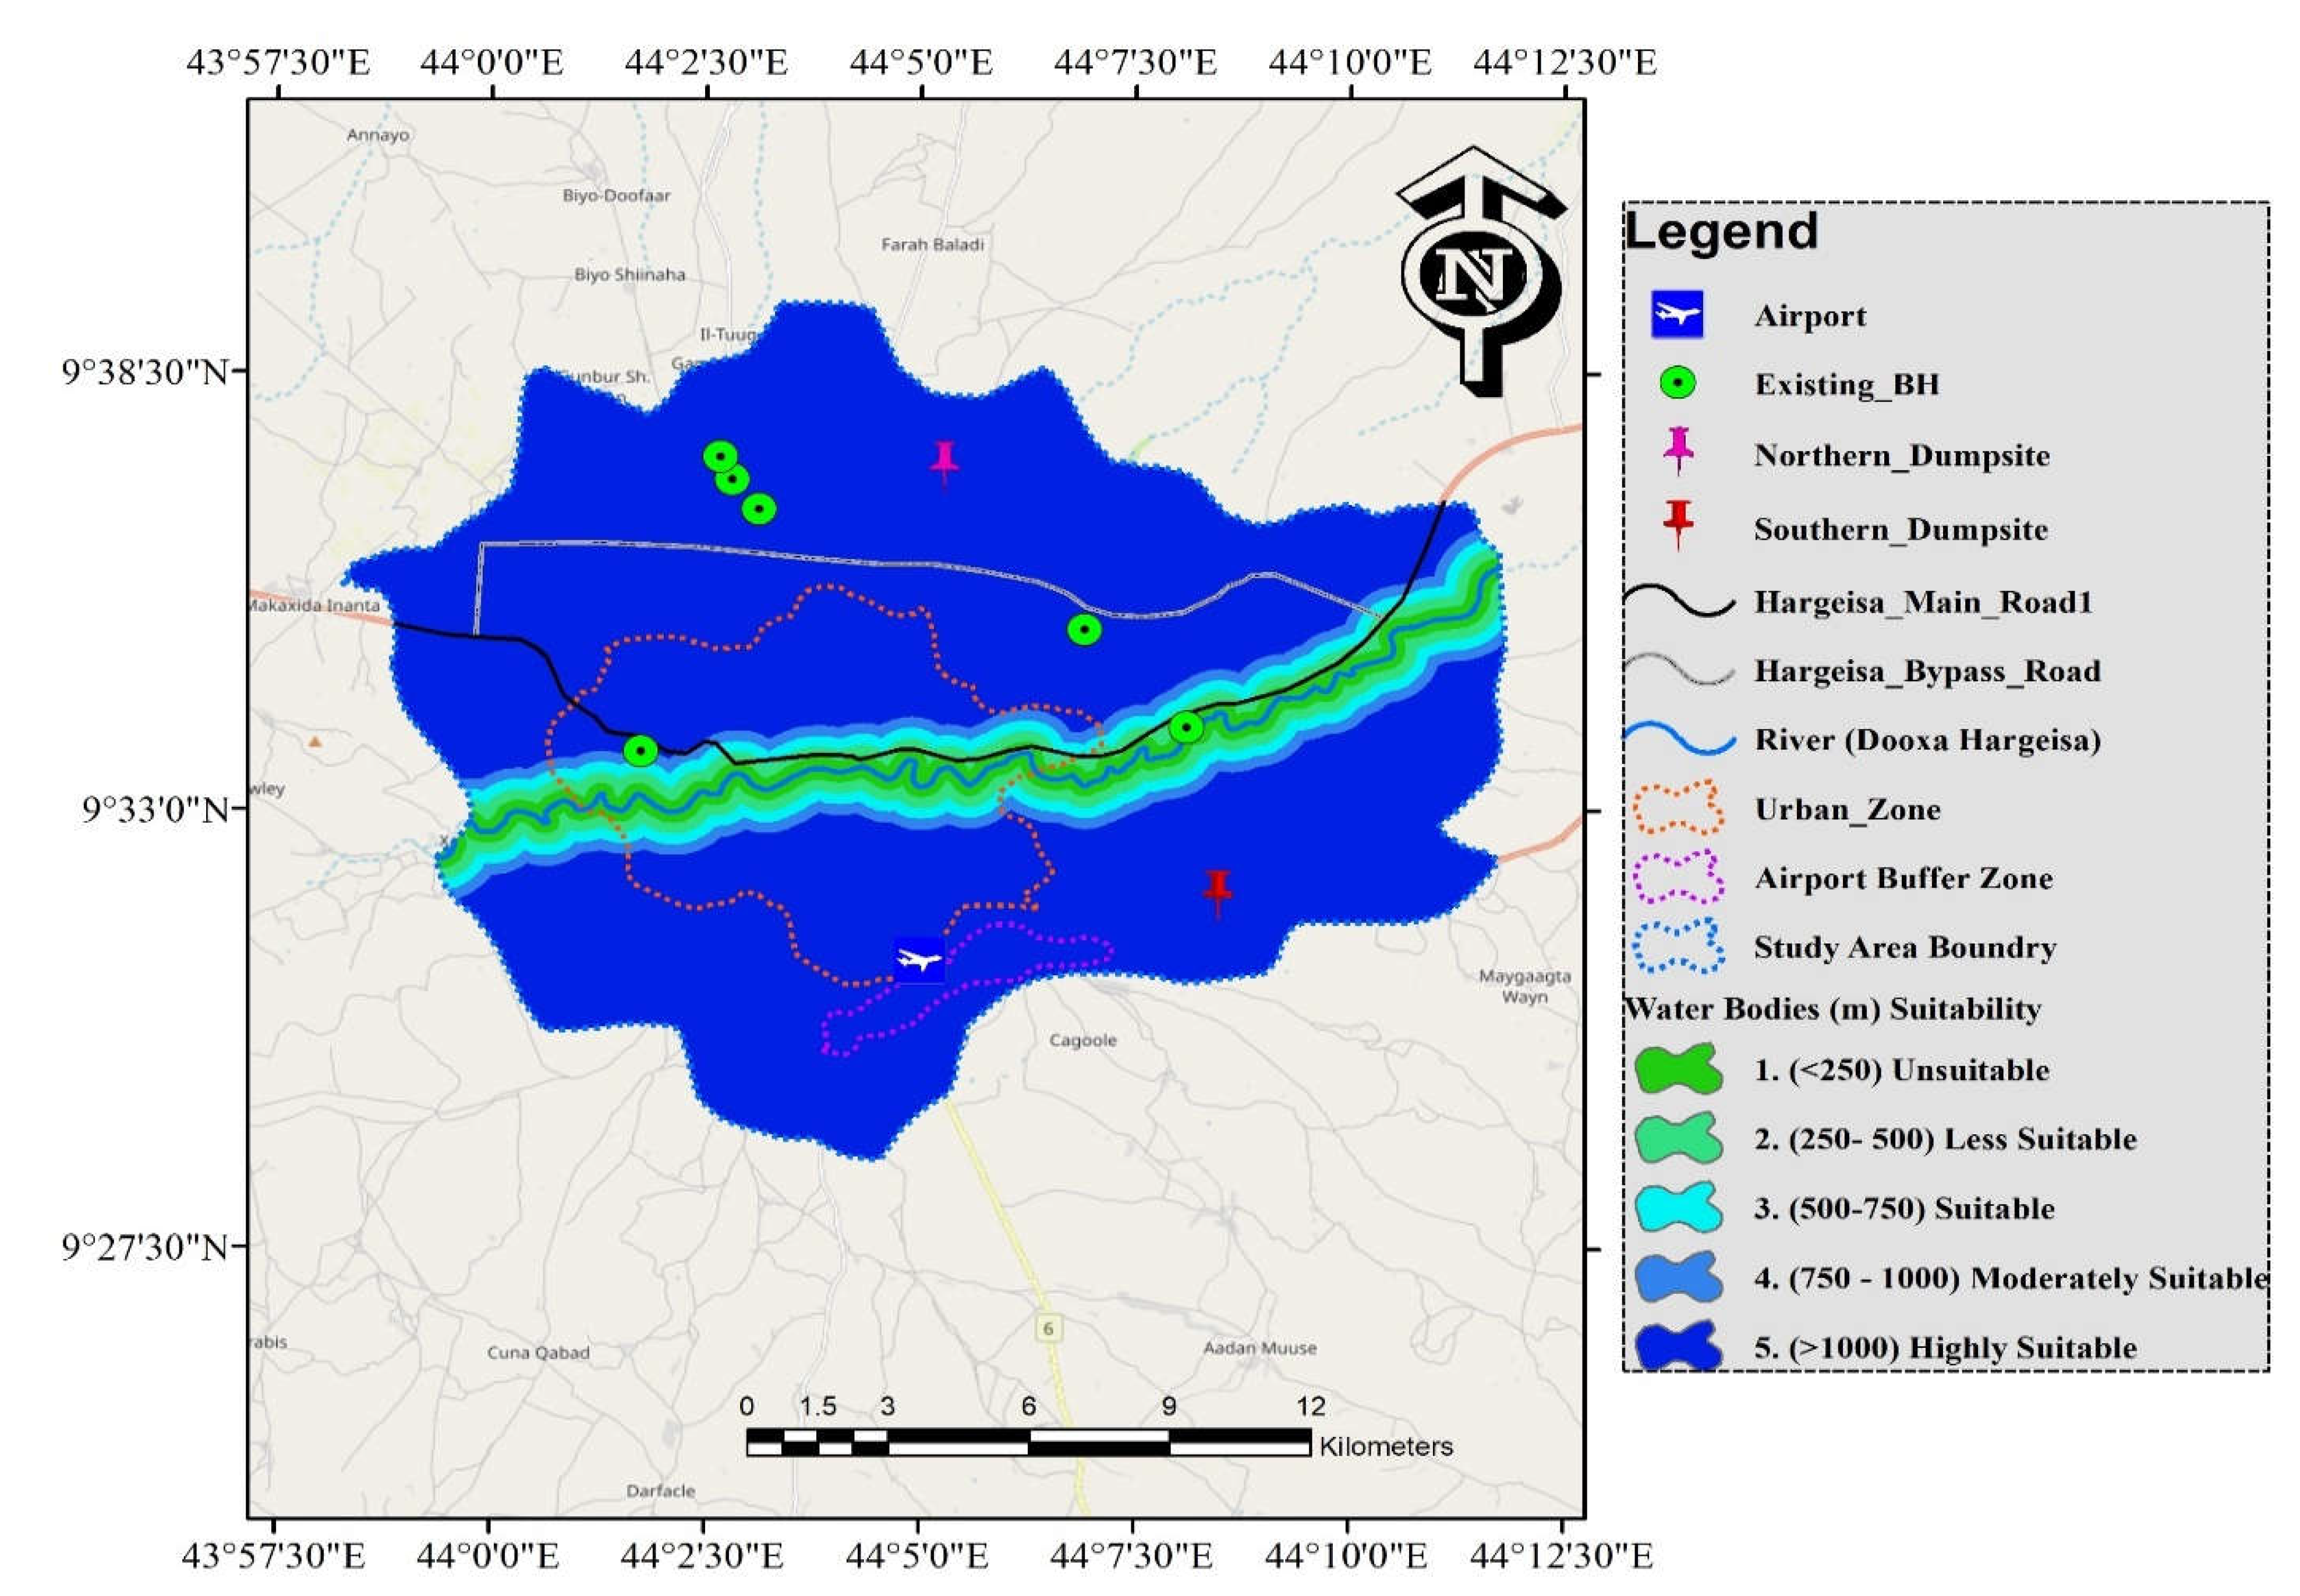
Figure 5.
Landfill site suitability criteria-rivers and water bodies.
3.1.3. Distance from urban areas
When municipal solid waste disposal facilities are constructed close to residential areas, many environmental problems may arise [18]. This is why in this study, regions within 3,000 meters of residential areas have been eliminated from the analysis, and the remaining areas were divided into five distinct groups by taking into account all the recommended safe distances in the literature and local data on the rate of city growth. Minimum distances from the settlement areas in the study area were determined as at least 3 km for urban centers was considered unsuitable, (3000–4000 m) less suitable, (4000–5000 m) moderately suitable, (5000–6000 m) suitable, and above 6000 m as highly suitable in (Table 9). As a result, (Figure 7) displays the spatial findings of the distance to urban regions. 61.60% and 12.22%, of the research area, are inappropriate and less suitable, respectively. 9.47%, 7.15%, and 9.54% of the region are, respectively, very, moderately, and suitably acceptable for disposal locations.
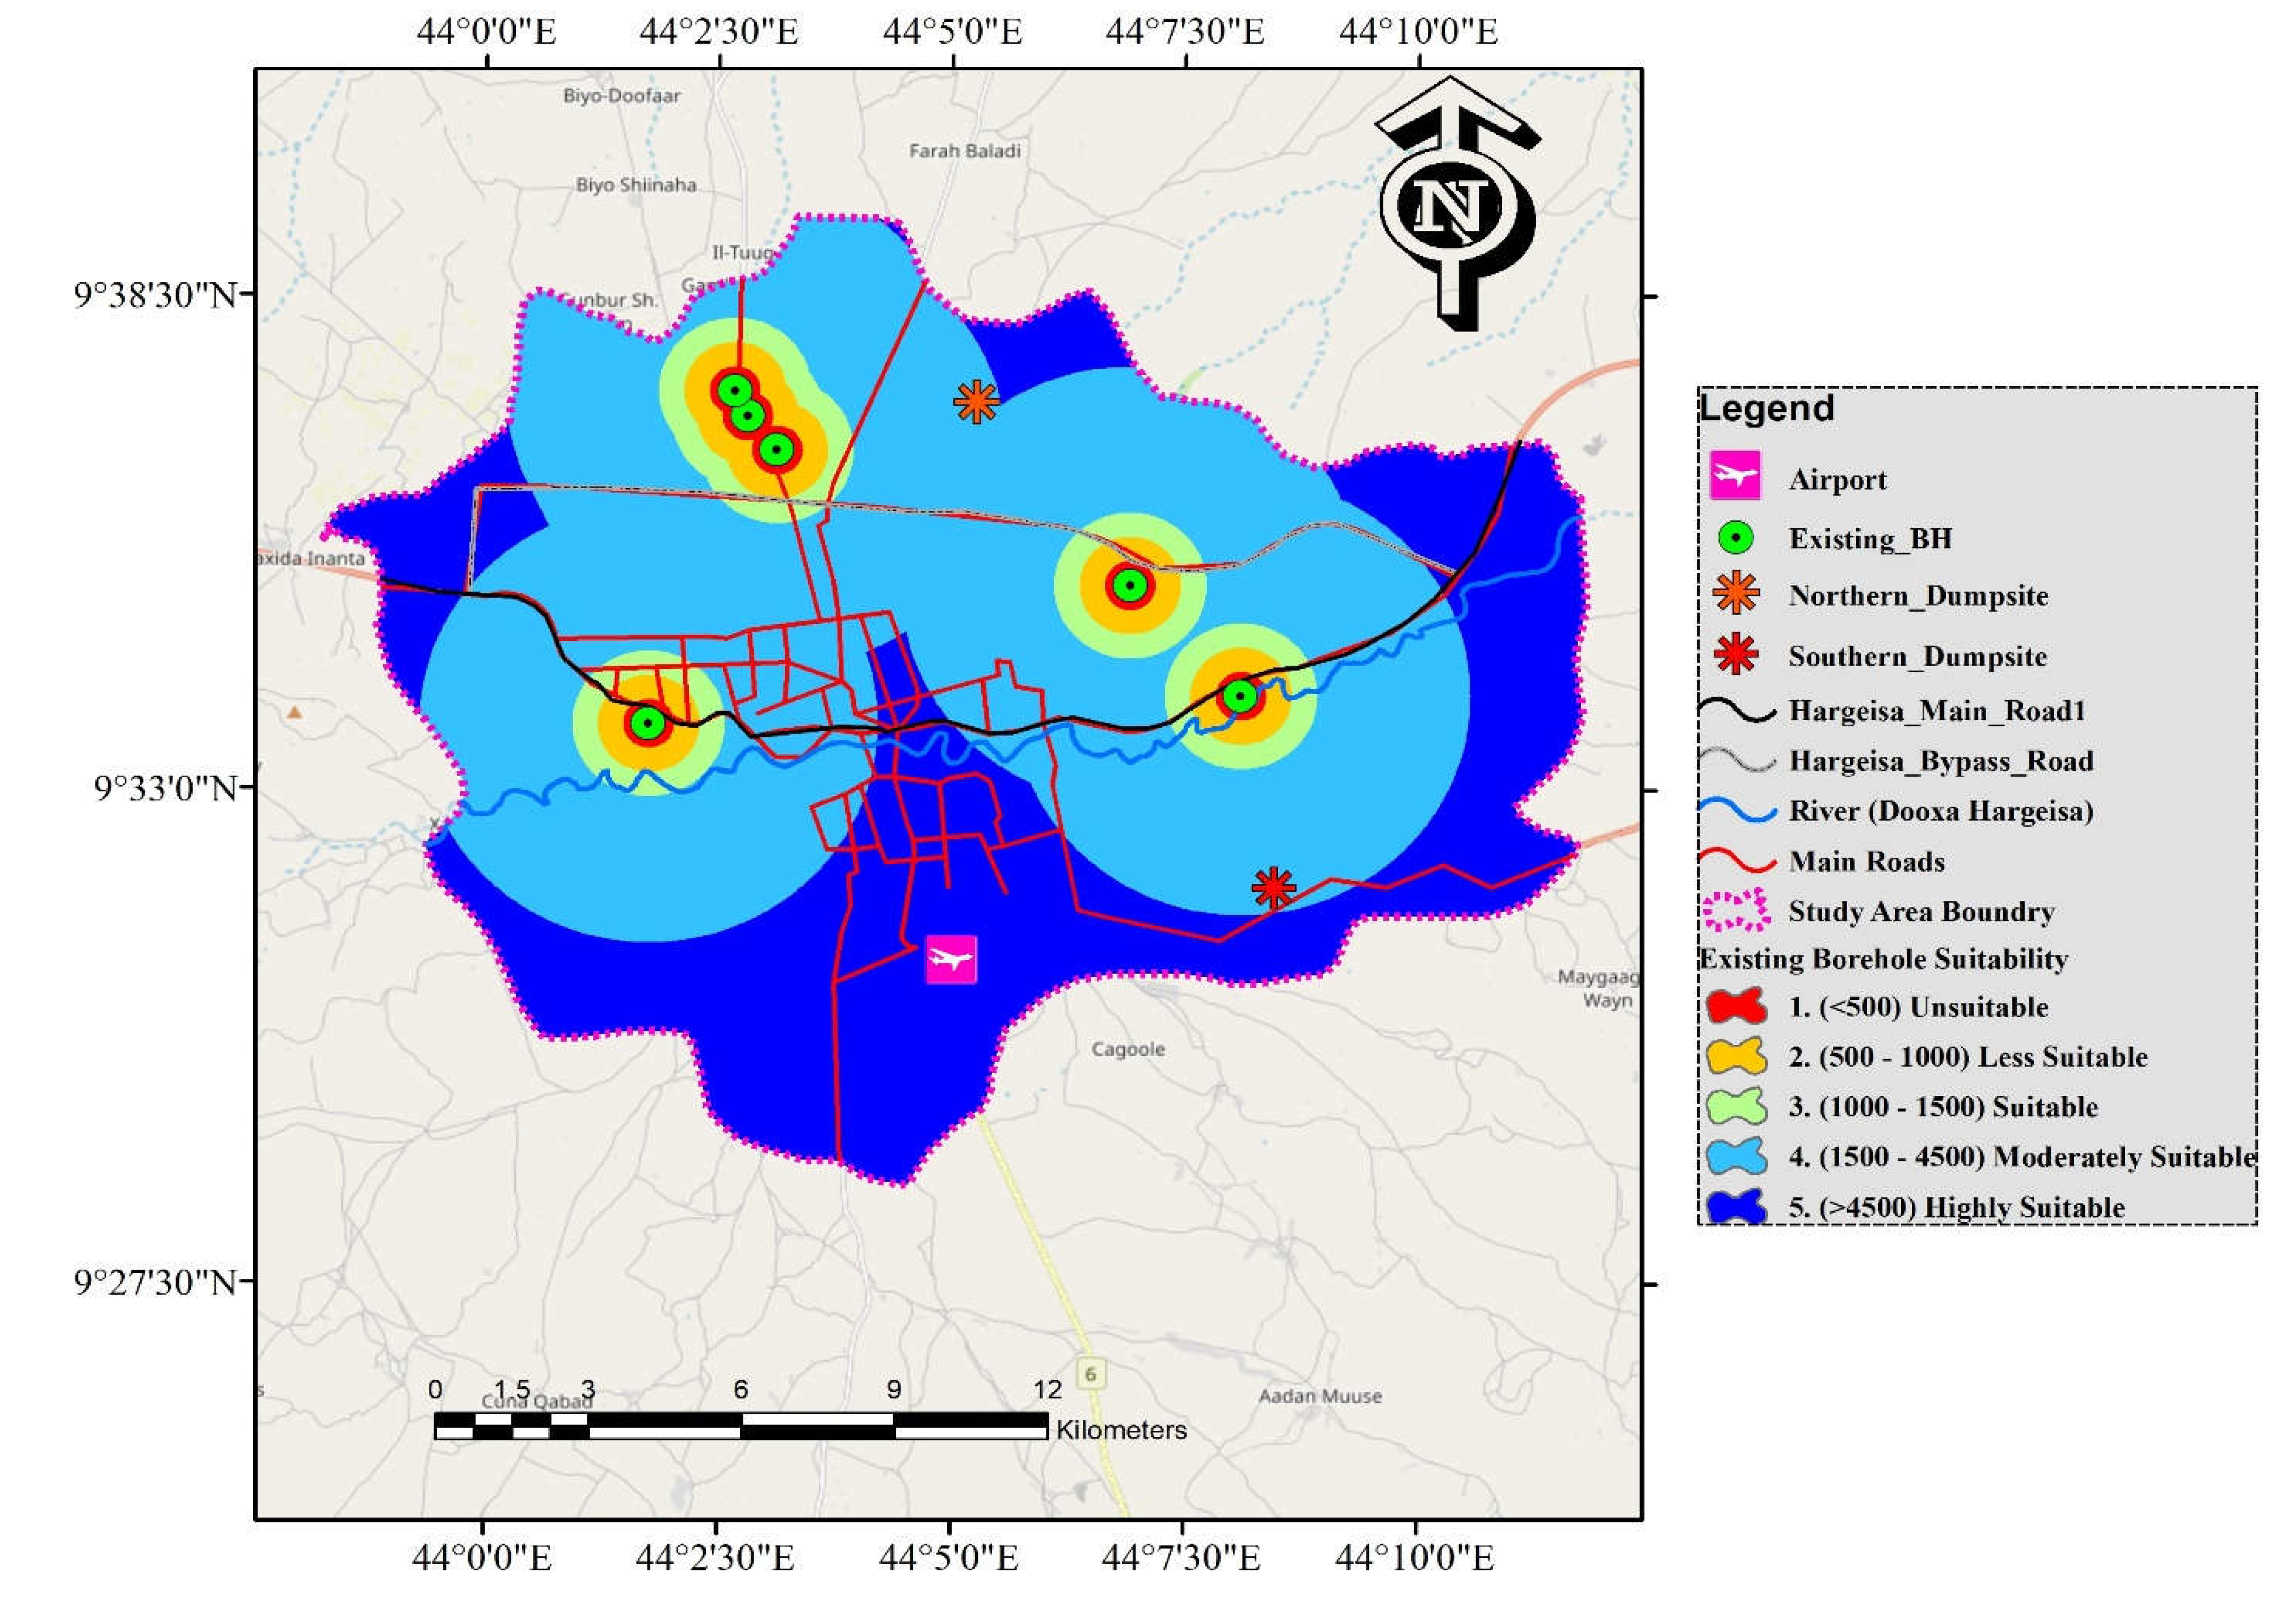
Figure 6.
Landfill site suitability criteria-existing boreholes.
3.1.4. Land use land cover
People seek out free space by moving to the city's periphery due to the high population increase. Based on this, LULC suggests where potential additional landfill sites might be placed [31]. As a result, on November 16, 2022, the research area's raw satellite data was obtained utilizing the website (https://scihub.copernicus.eu). To construct a mosaic raster of the research region, six bands of the raw data were joined; the pre-processed mosaicked image improved the raw data's image quality. Spectral signatures gathered from training samples (polygons that represent separate sample areas of the various land cover types to be categorized) were used to perform supervised classification on the satellite data. The Maximum Likelihood Classifier subsequently applied labels to every picture pixel in accordance with the training parameters to produce a land cover map of the research area after creating the signature file. The study area's land-use/land-cover map was then created using Google Earth verification. These methods of classification allowed for the division of a region's land use and land cover into five main groups: agricultural areas, bare land, water bodies, settlements, and shrubland. The distribution of land use is shown in Table 9, and it shows that about 1.21% of the study area is used for agricultural purposes. According to the land use and land cover map, (Bare land + shrubland) makes up around 84.4% of the total area. According to Figure 8, urban areas and aquatic bodies make up around 14.45% of the total area.
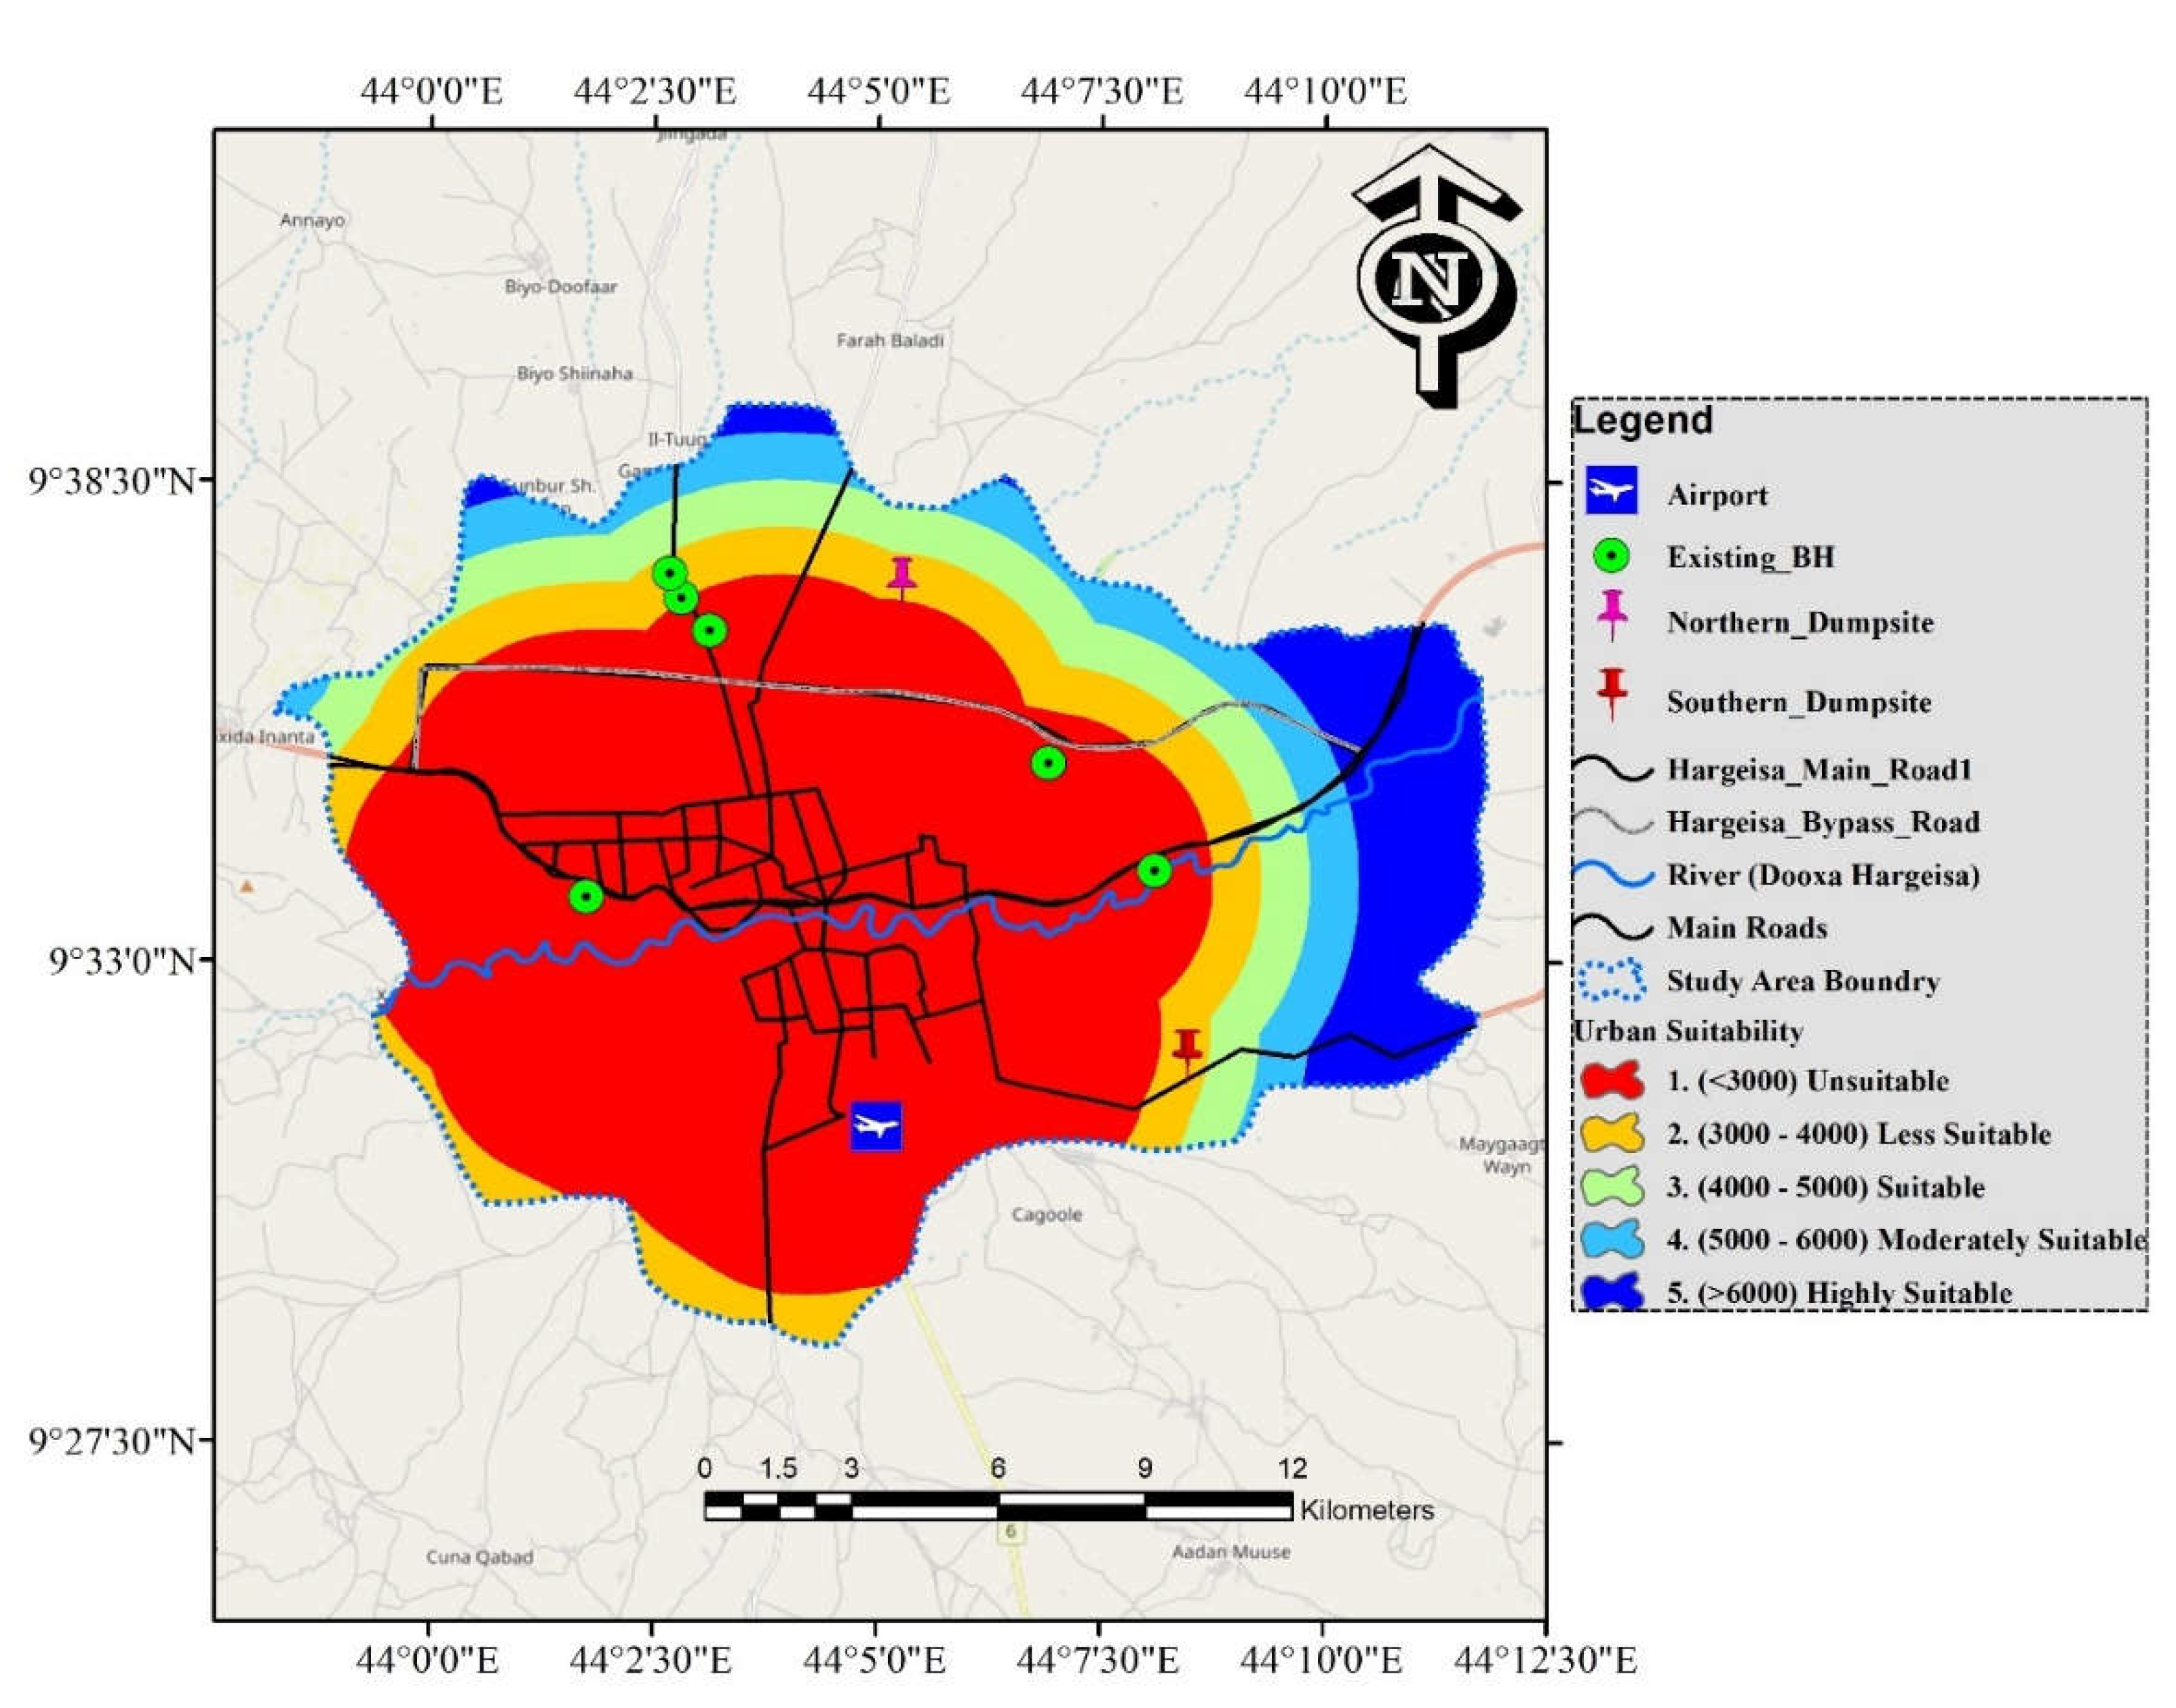
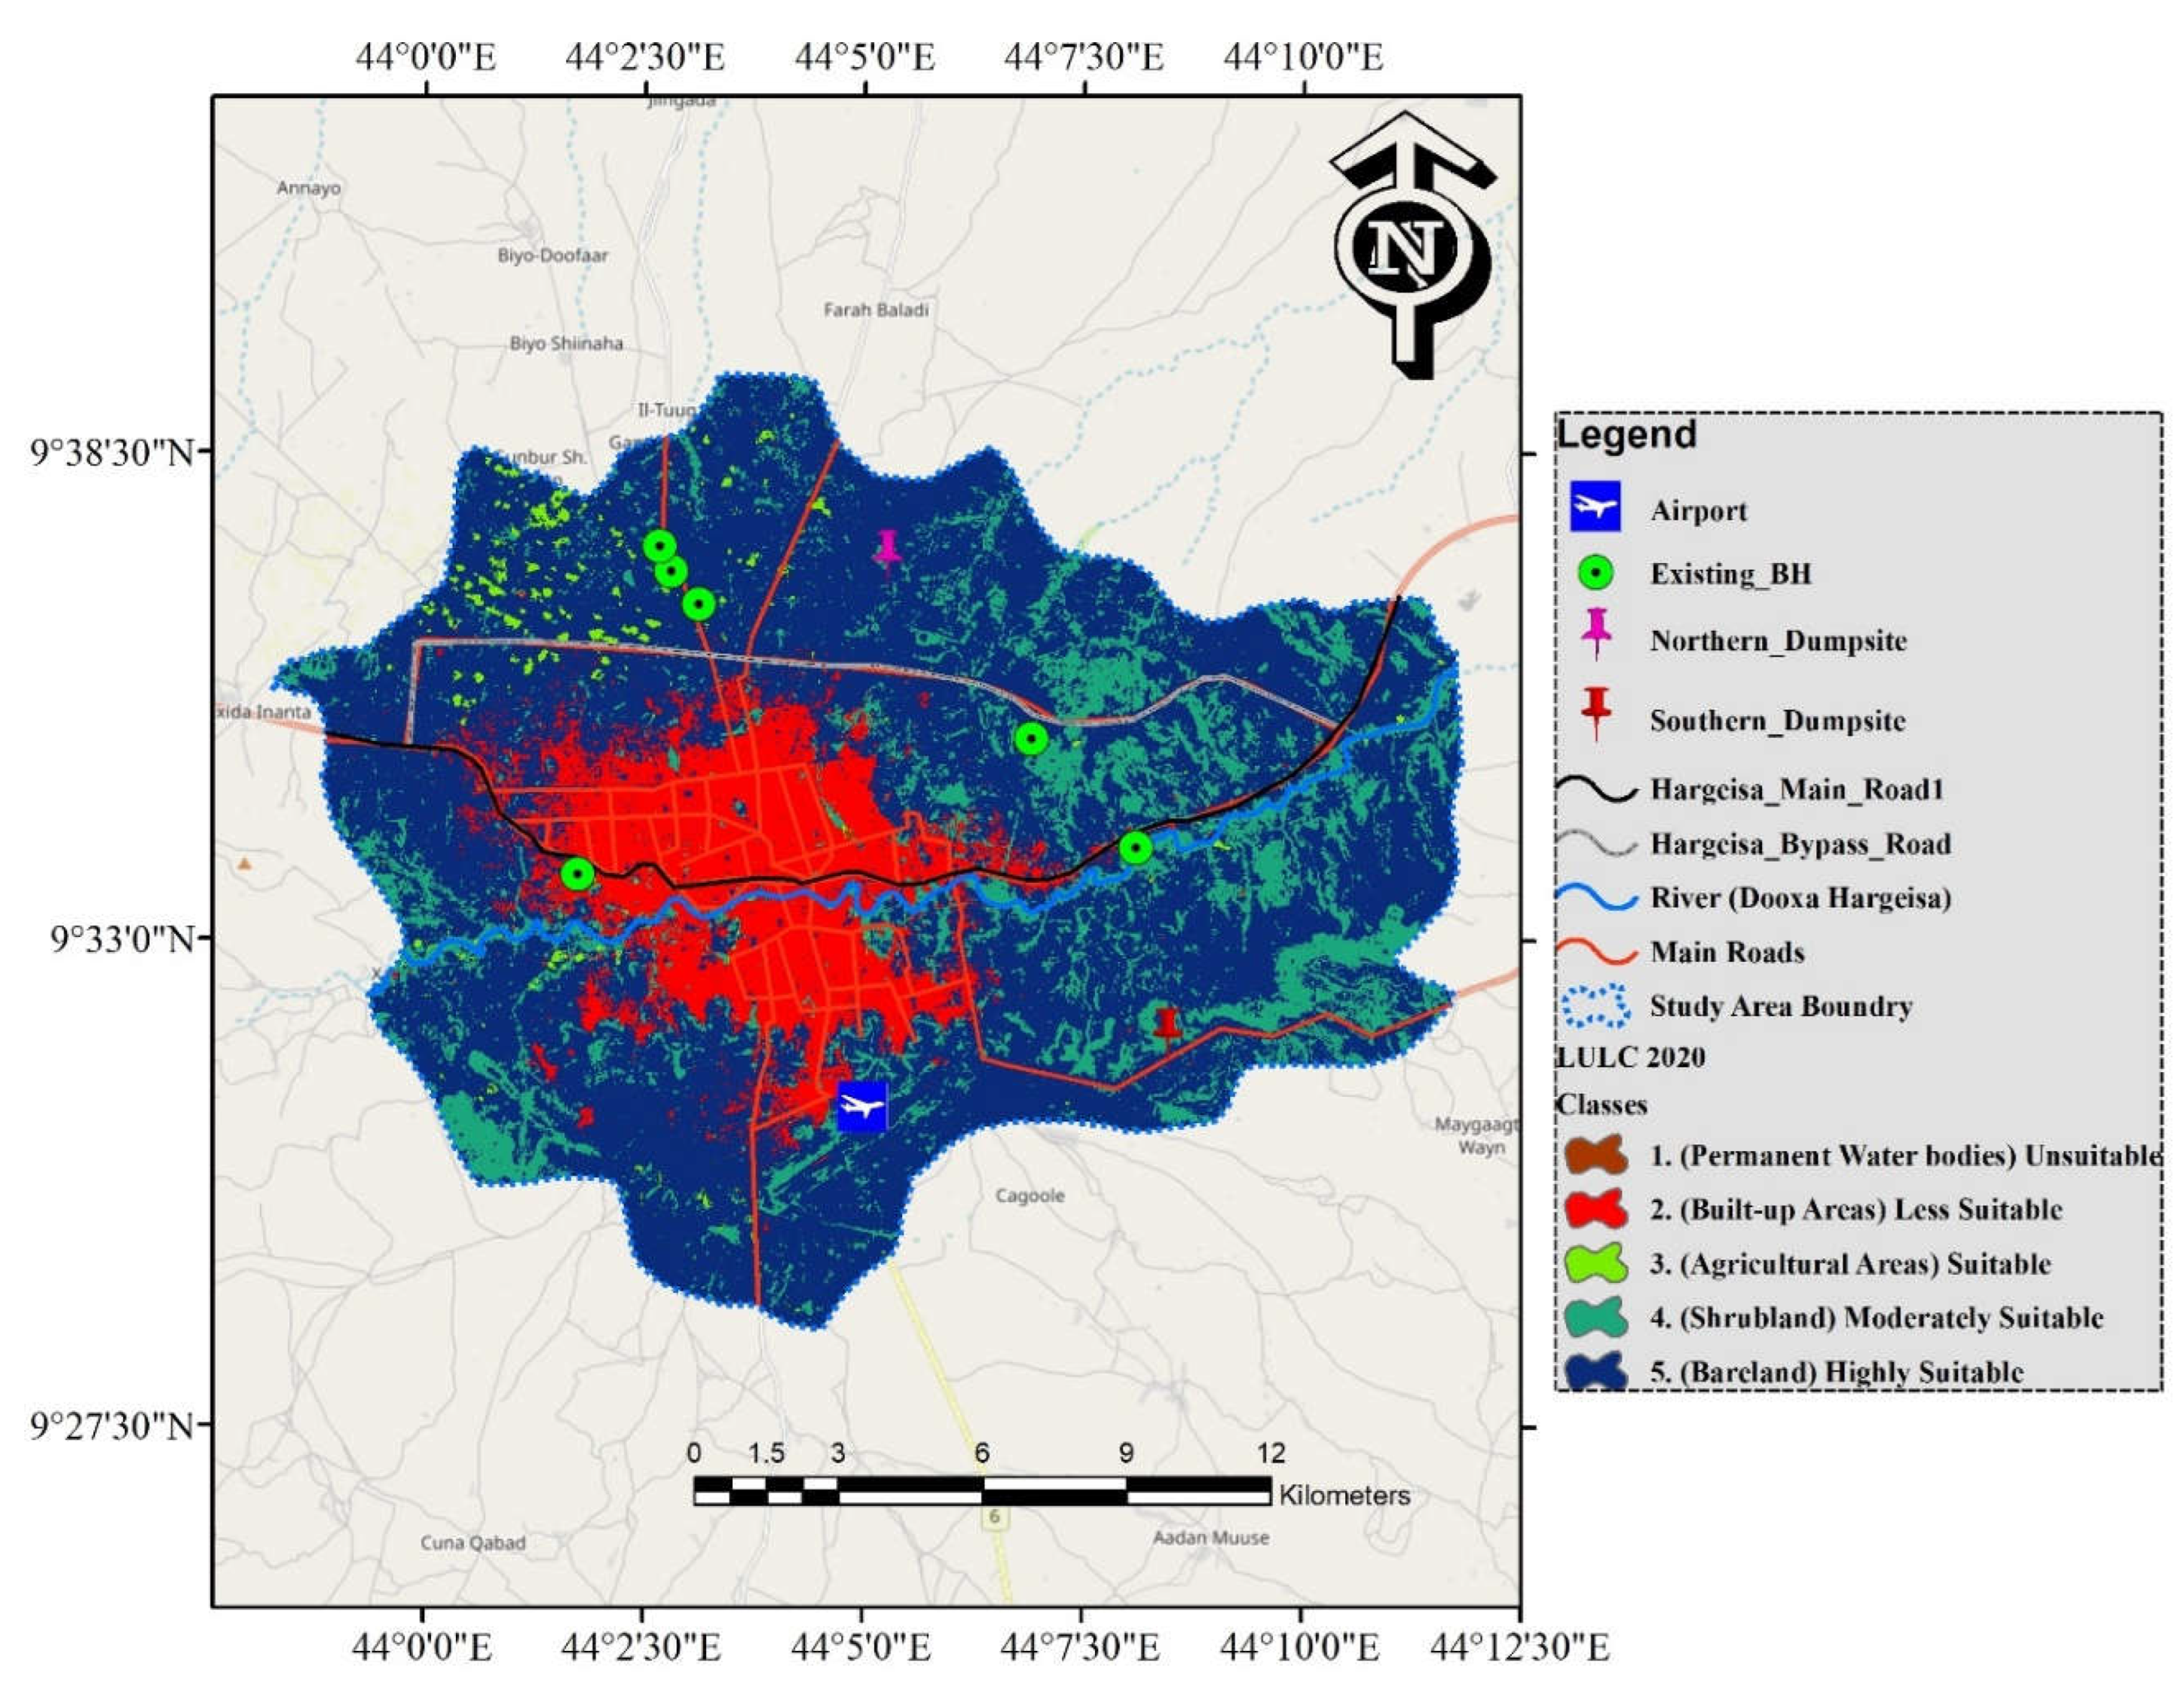
Figure 7.
Landfill Suitability Criteria-Urban Areas.
Figure 8.
Reclassification of landfill-controlling factor (LULC).
3.1.5. Geology (lithology) of the study area
The geomorphic map of the study region was received from FAO-SWALIM (https://faoswalim.org), and the geological map of the study area was created by digitizing, and converting it into a grid map (12.5 *12.5 m resolution). Thus, over a sufficiently thick impermeable basis, the landfill will be constructed [20]. Through preventing contaminant movement and landfill leaking that could pollute groundwater [40]. The produced map has been classified into three Rock-types: sand, silts with gravel, Auradu Limestone, and Yesomma sandstone.
As stated by [41], the following explanation for the variation in lithological units found in the examined area. Gravel, sand, and silts: A heterogeneous mixture of boulder, gravel, sand, and silt made up this unit. In comparison to gravel and sand, silt has a lower permeability and a higher rate of self-purification because of its small grain sizes, platy structure, and electrostatic forces. Therefore, it is advisable to establish a landfill where there are silty particles between sand and gravel particles. These deposits received the highest weight value because they are thought to be the most ideal location for the landfill [42]. The Auradu limestone rocks of the limestone formation exhibit significant karstic permeability and resistant qualities at the following level. These regions had lower weight values because they were determined to be more inappropriate units.
On the other hand, semipermeable rocks (such as the Yesomma sandstone) were given a moderate appropriateness rating. As a result, the map below displays the geospatial distribution and area coverage of this suitability modeling. About 64.370% (19672 ha) of the study area is highly susceptible to a landfill disposal site. While areas of suitable (10611 ha) and unsuitable areas (273.797 ha) landfill susceptibility cover about 34.72% and 0.897%, respectively (Table 9 and Figure 9).
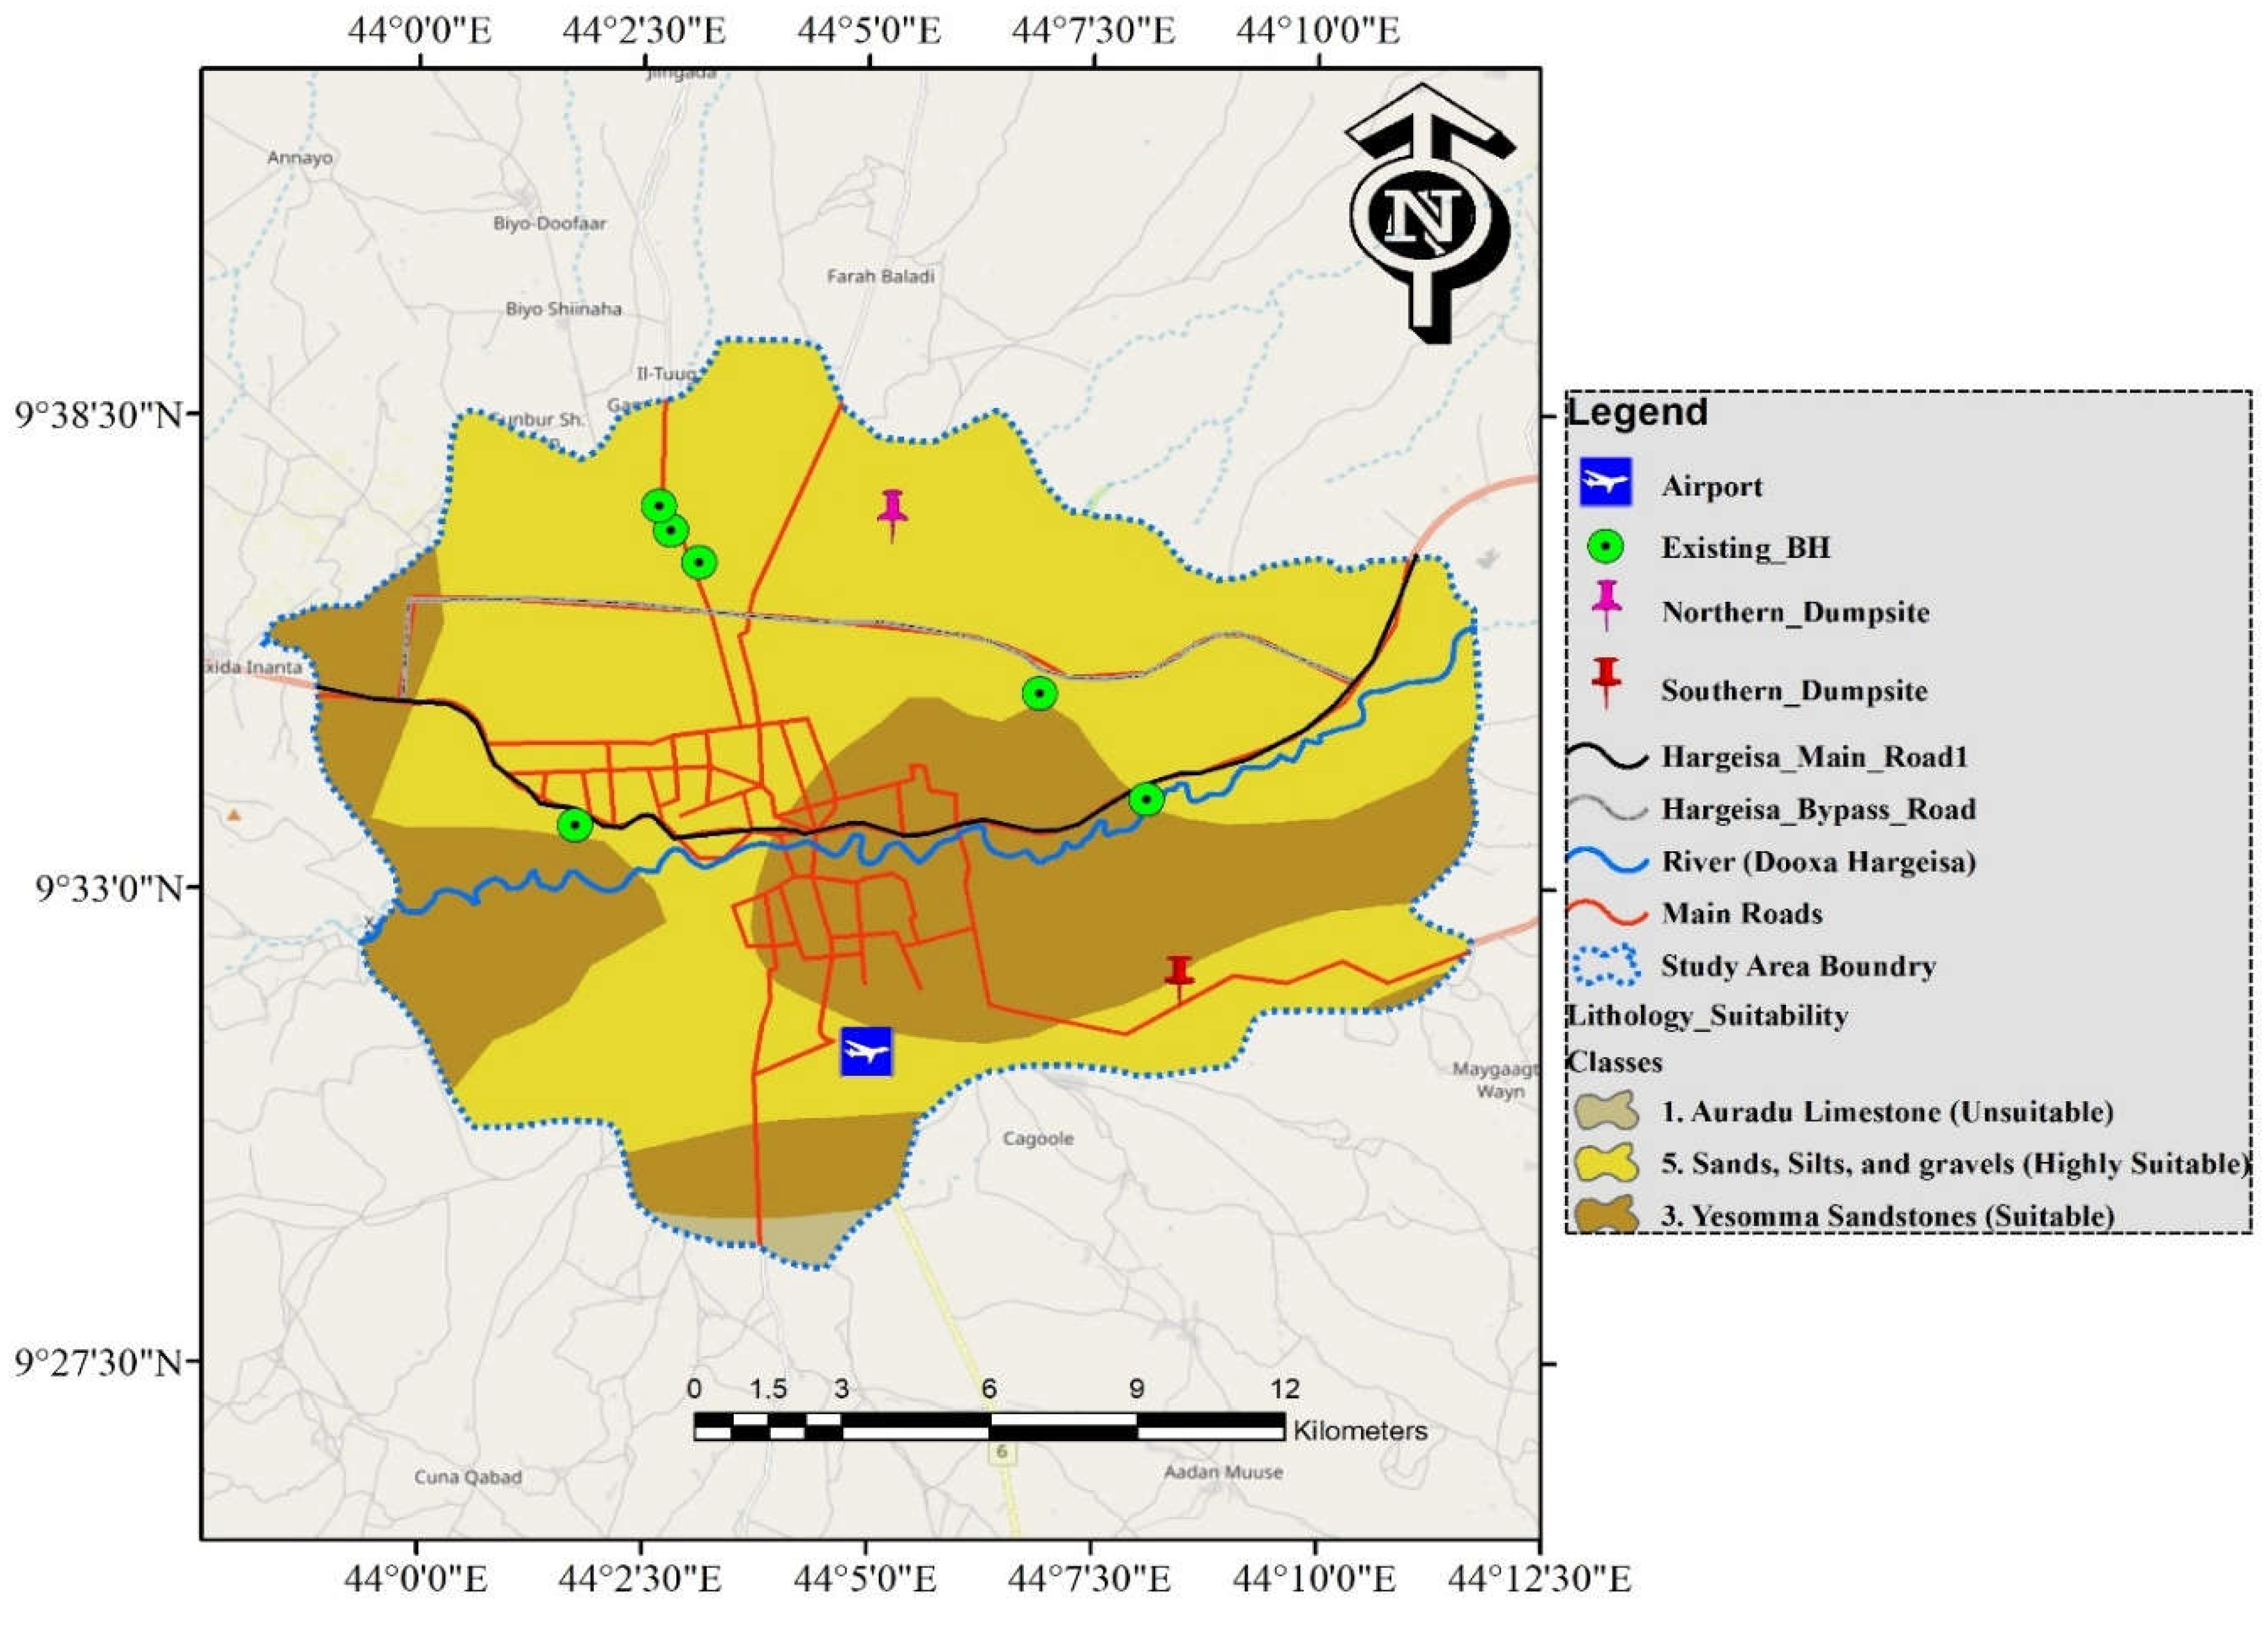
Figure 9.
Landfill site suitability criteria-main roads.
3.1.6. Distance from main roads
A municipal solid waste disposal site near the main roads may result in aesthetic concerns that impede the region's economic growth in tourism or residential regions [40]. On the other hand, it is not economically feasible to carry waste over longer distances [43]. Therefore, exclusion zones were chosen to be 300 meters away from roads. Municipal solid waste disposal facilities, however, should not be located too distant from the existing road system to reduce costs during the planning and construction phases. The remaining lands were classified into five classes after the exclusion zones were established. Greater than 3,000 m were given less weight since they would not be suitable in terms of transit time or cost. Areas less than 750 m were given the highest weight. Figure 10 displays the predicted distance for the adequacy of the road network. In the study area, 1.45% and 6.68% of the area are unsuitable and less suitable, respectively, based on the spatial map, the identified areas were located mainly on the outskirt of the city, where road networks were not advanced while 47.3%, 25.804% and 13.34.1% of the area are highly suitable, moderately suitable and suitable, respectively, for waste disposal sites.
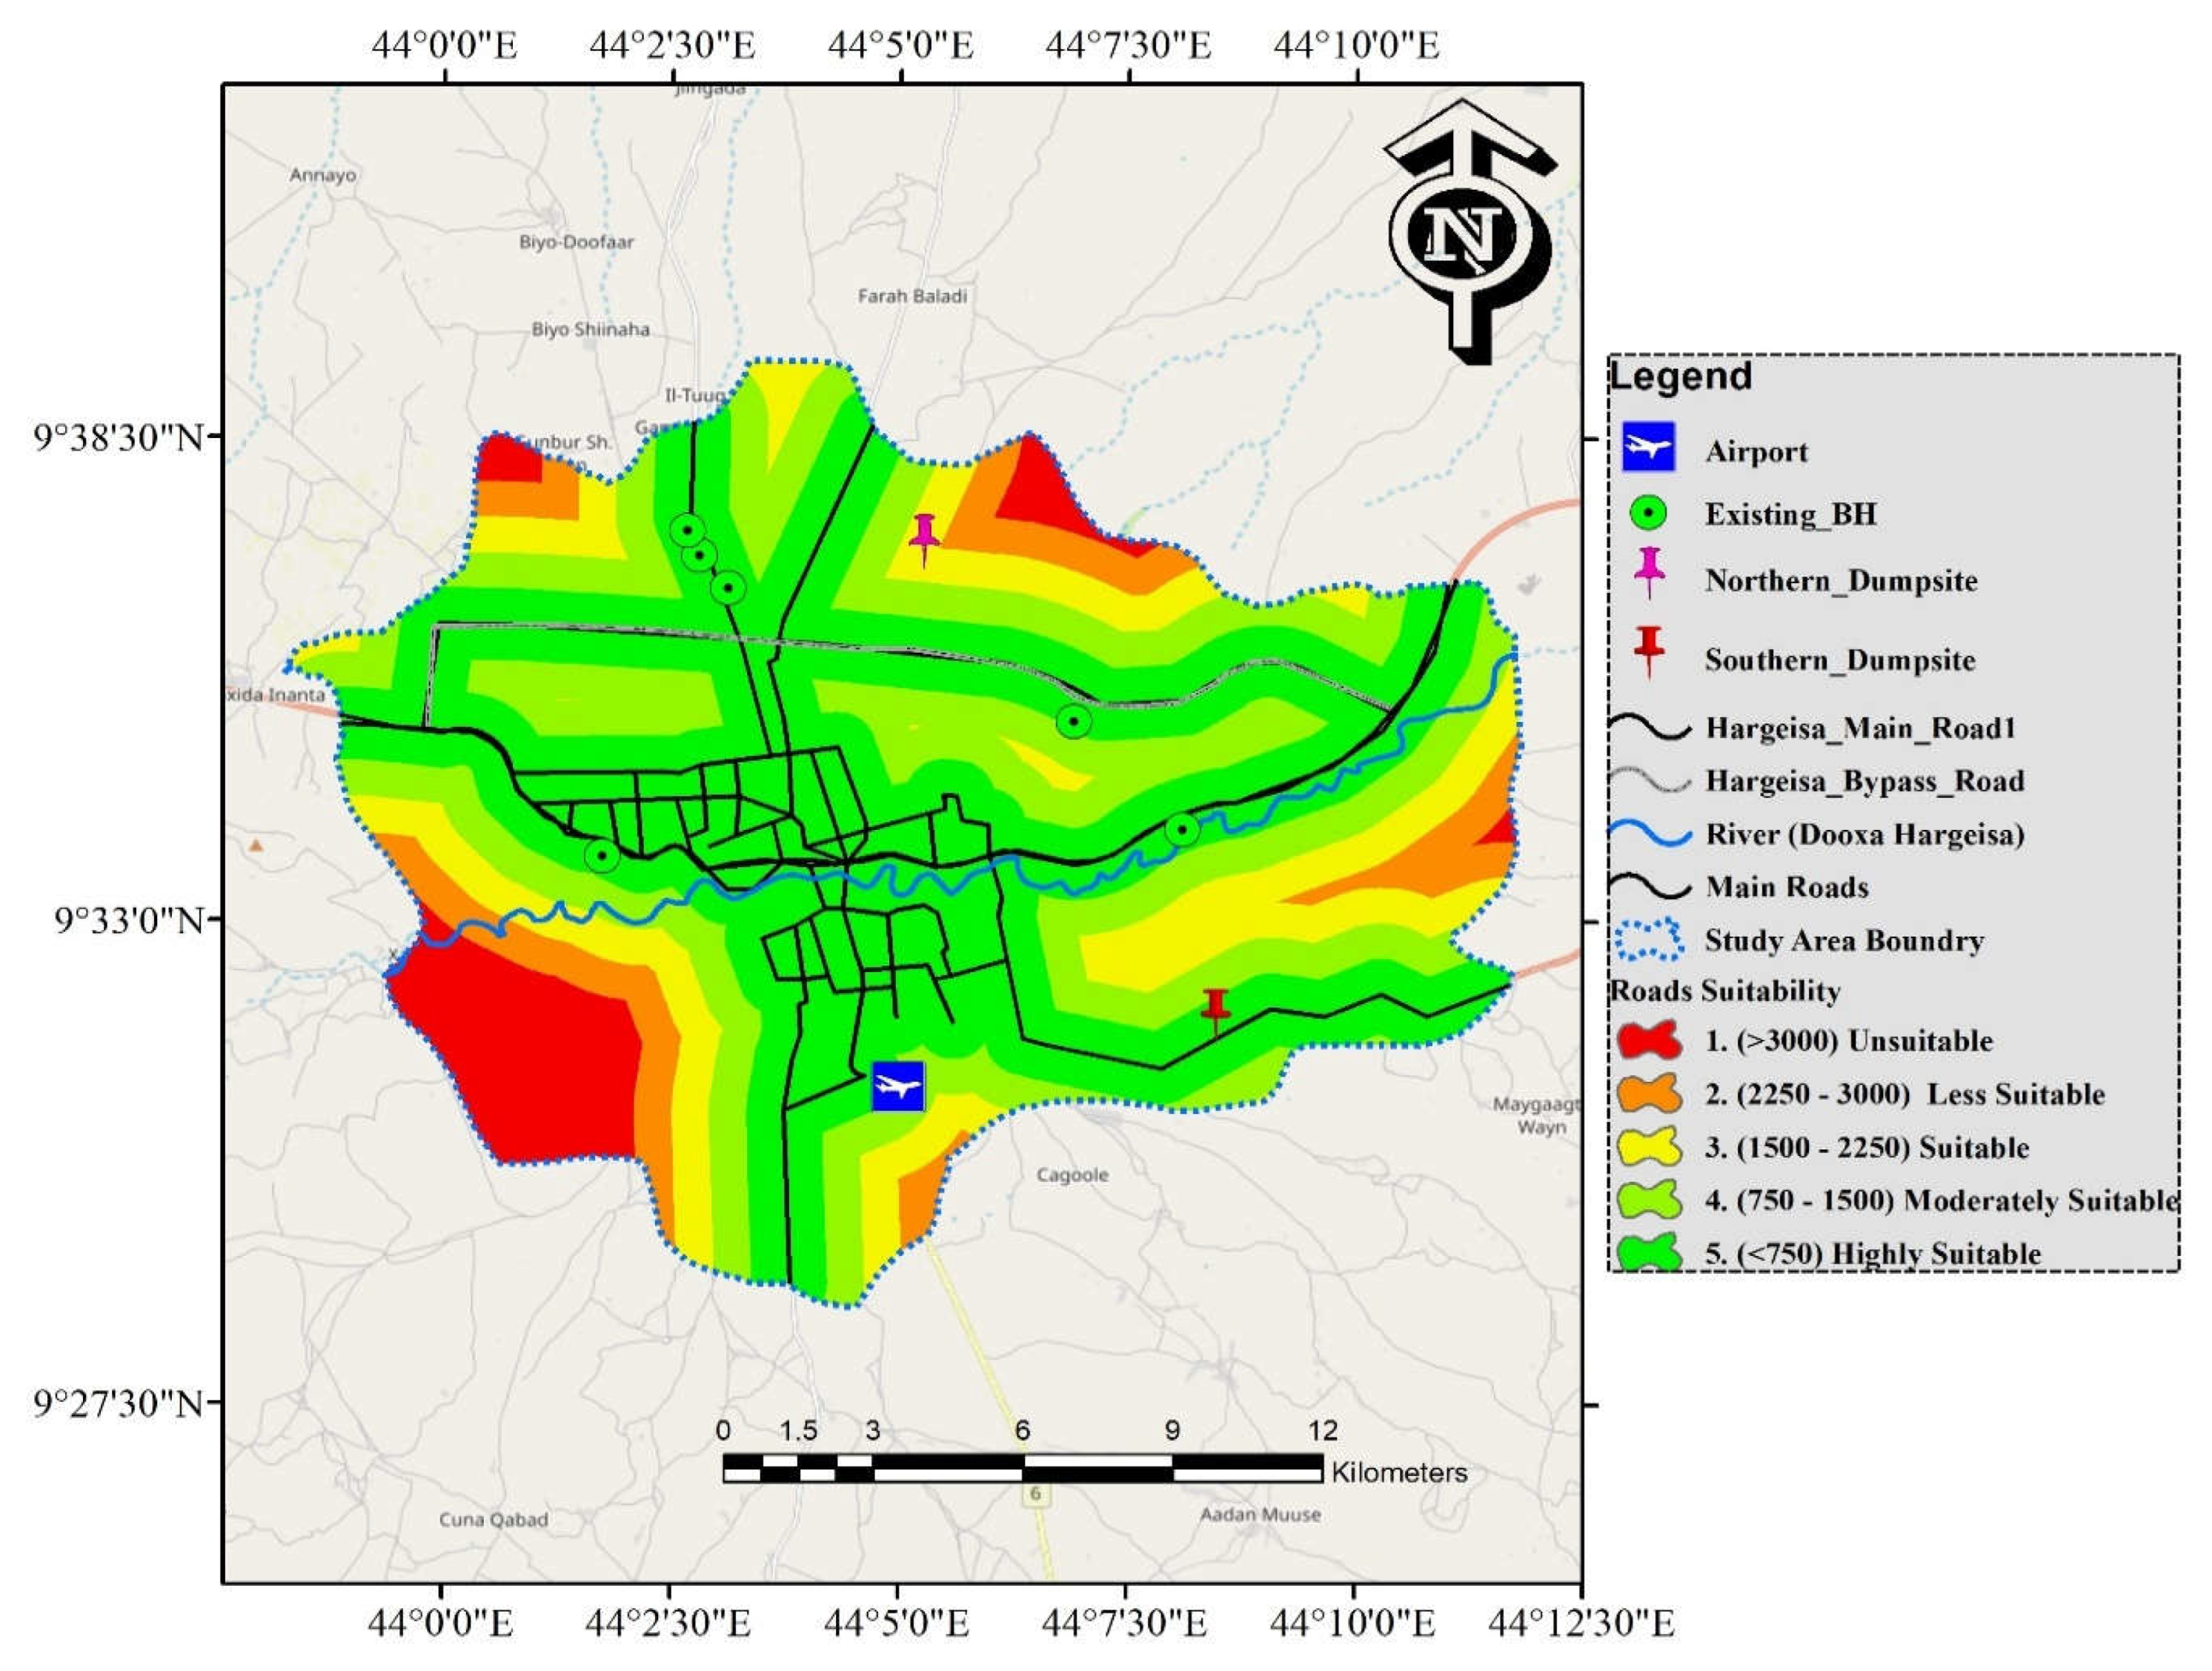
Figure 10.
Landfill site suitability criteria-main roads.
3.1.7. Distance from the Airport
The location of landfills is influenced by the distance between the Airport and the disposal site, as birds and dust flow through the air, posing a risk to air traffic [43]. As a result, to avoid aircraft crashes, different studies [23,39] have established varied minimum separation distances between airports and trash disposal sites. So, to choose a landfill site, a distance of less than 4000 m (32.31%) was deemed unsuitable, and distances of 4000-5000 m (15.51%), 5000-6000 m (15.89%), 6000-7000 m (17.07%), and greater than 7000 m (19.19%) were categorized as less suitable, moderately suitable, suitable, and extremely suitable, respectively (Figure 11).
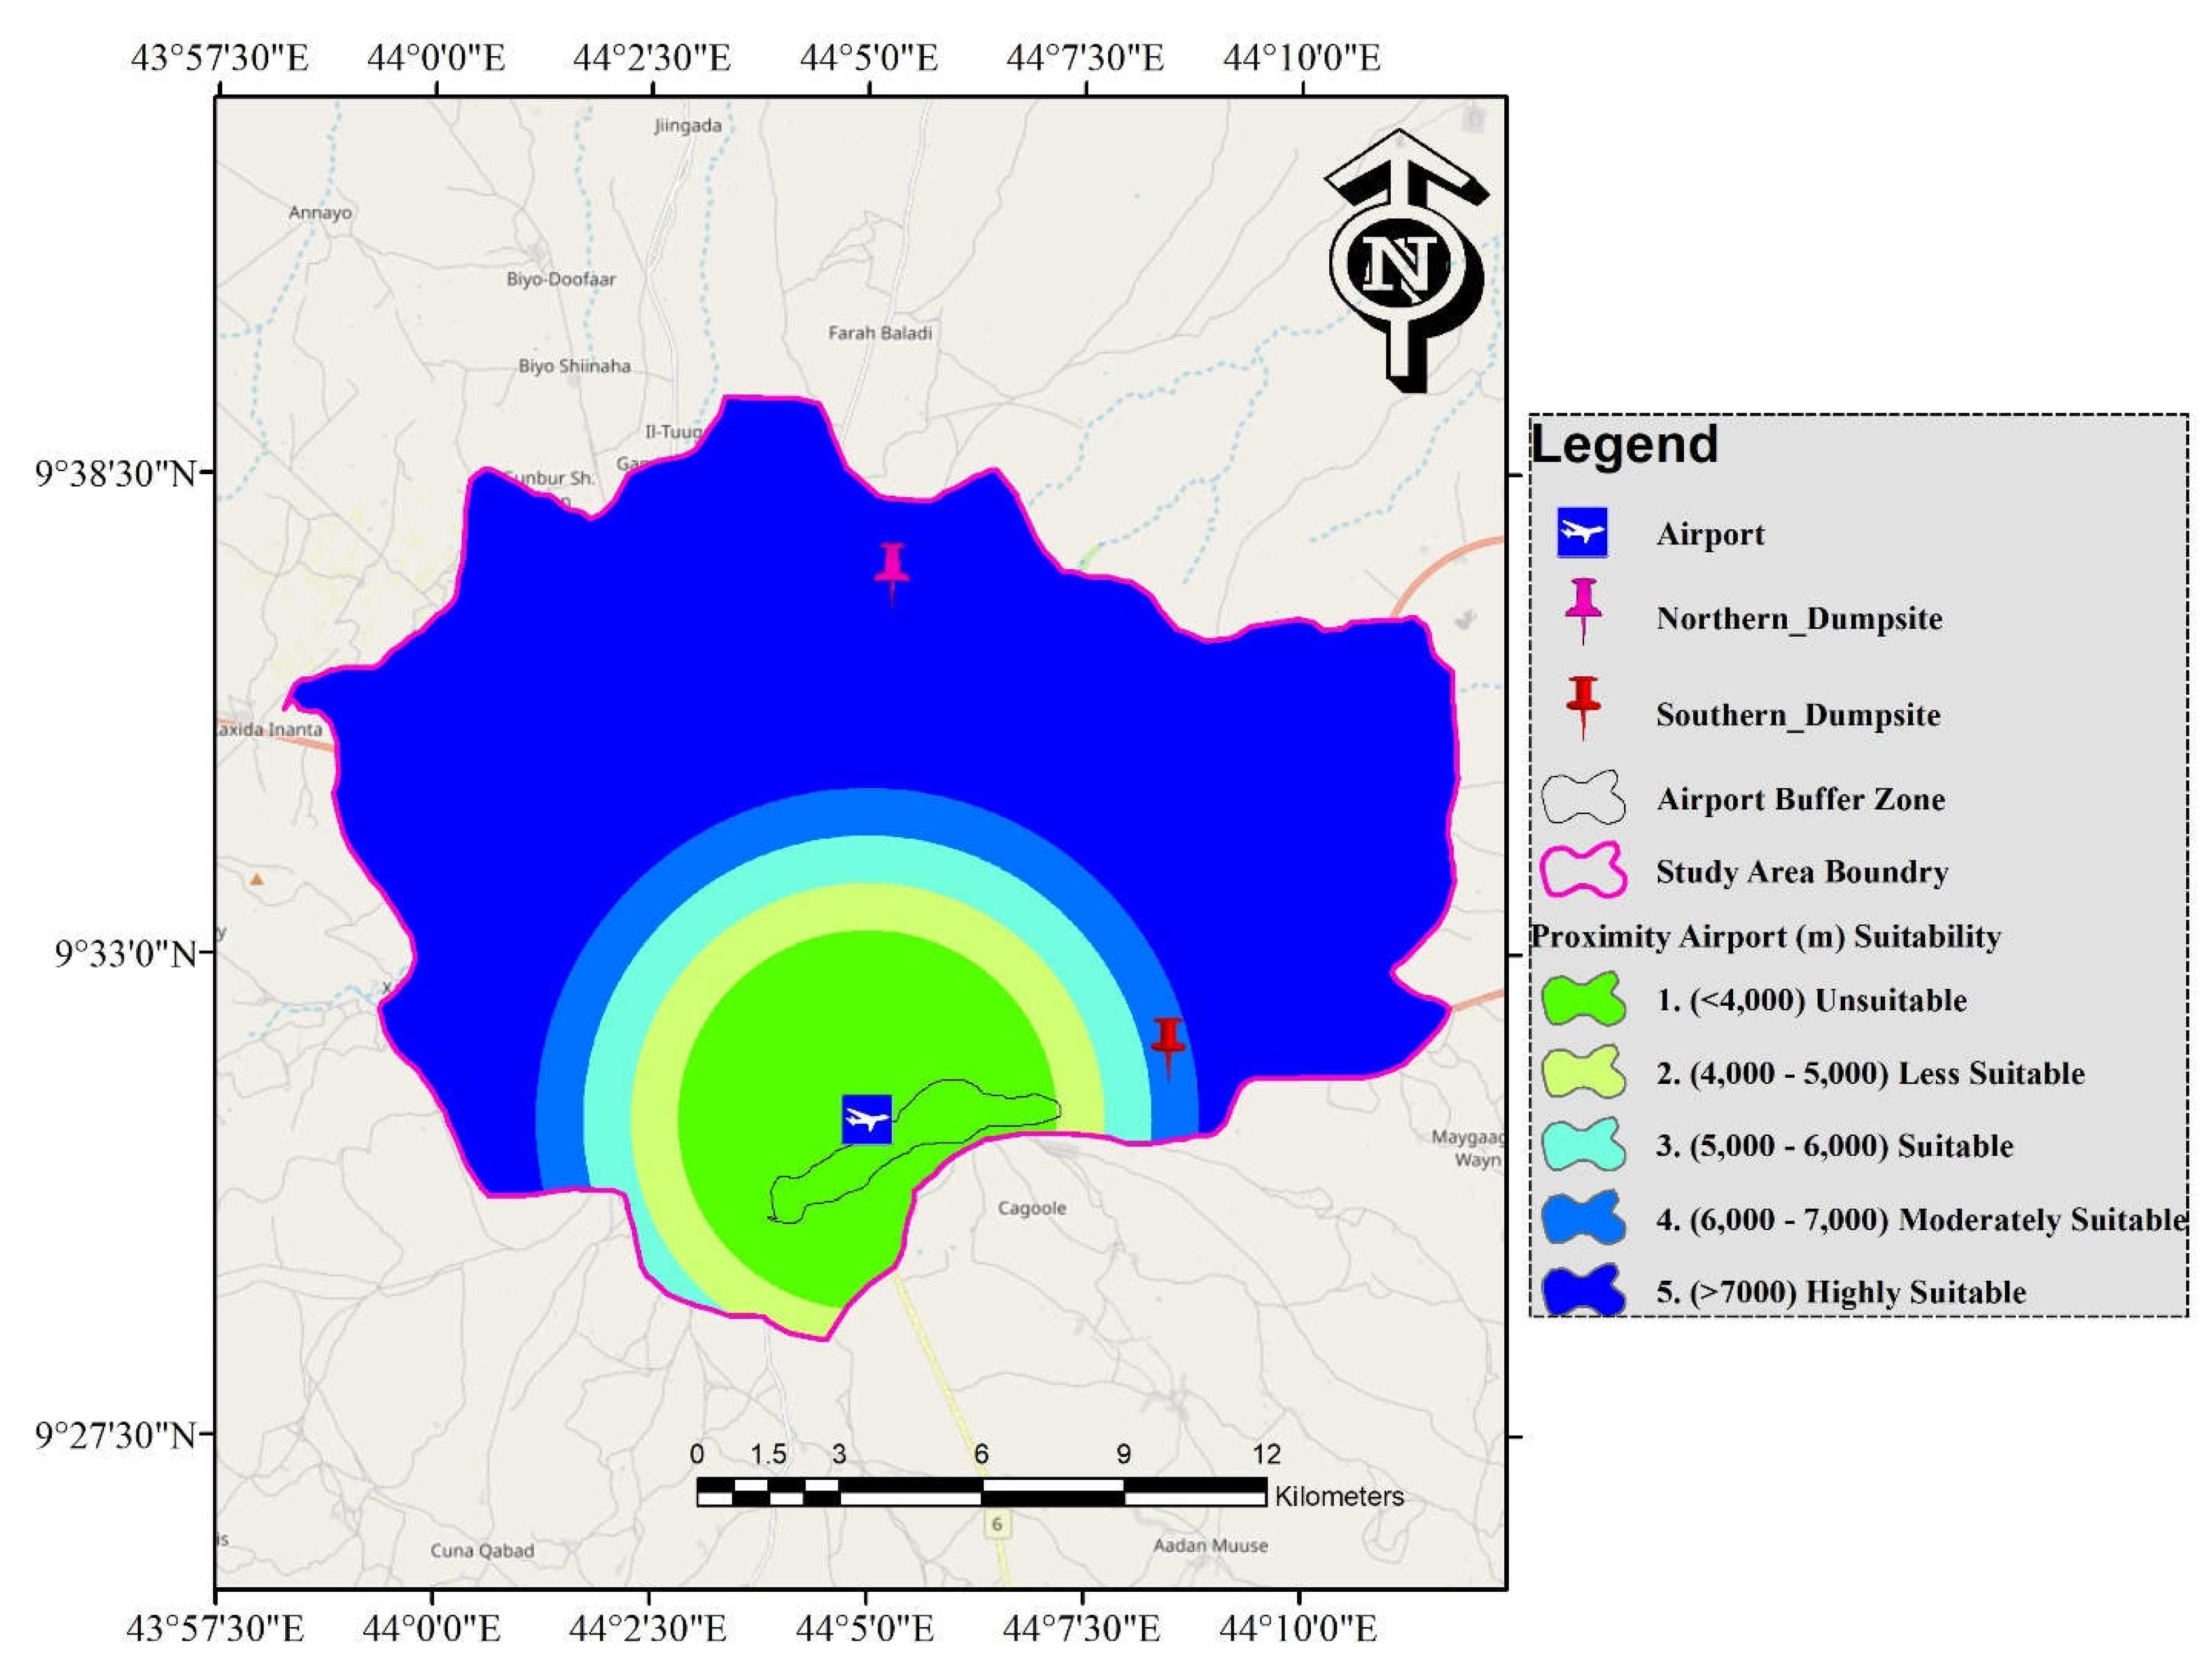
Figure 11.
Landfill site suitability criteria-airport.
3.1.8. Soil type
The process of infiltration is significantly influenced by the composition of the soil. Therefore, ideal candidates are soils with little permeability [29]. Thus, infiltration and leaching into the subsurface are less likely [44]. On the other hand, very permeable soils are inappropriate because they may cause landfills to release pollutants into the groundwater [8]. Hence, the soil type with a lower infiltration rate was given a greater AHP weight.
From FAO-SWALIM (https://faoswalim.org), the city's digital soil map was retrieved. Calcaric Cambisols, chronic Cambisols, and eutric Leptosols are the three sub-soil units that make up the two main soil formations that make up the research area.
Leptosols make up the majority of the soils of Somaliland, covering roughly 29% of the area (49014 km2). The mountains (Golis and Karkaar) and the distinct plateaus are where it is typically found [41]. However, as indicated in Table 9 and Figure 12, this soil class only makes up around 12.12% of the land (43703.78 ha) in Hargeisa (the research region). These soils are extremely shallow over continuous rocks, but they are also exceedingly gravelly or stony. As a result, these qualities render these soils unfit for disposal in landfills [44]. Contrarily, the soil texture of Cambisols belongs to the loamy groups. As a result, these soils, which make up about 87.88% of the total area (26853.047 ha), are moderately acceptable for dump sites.
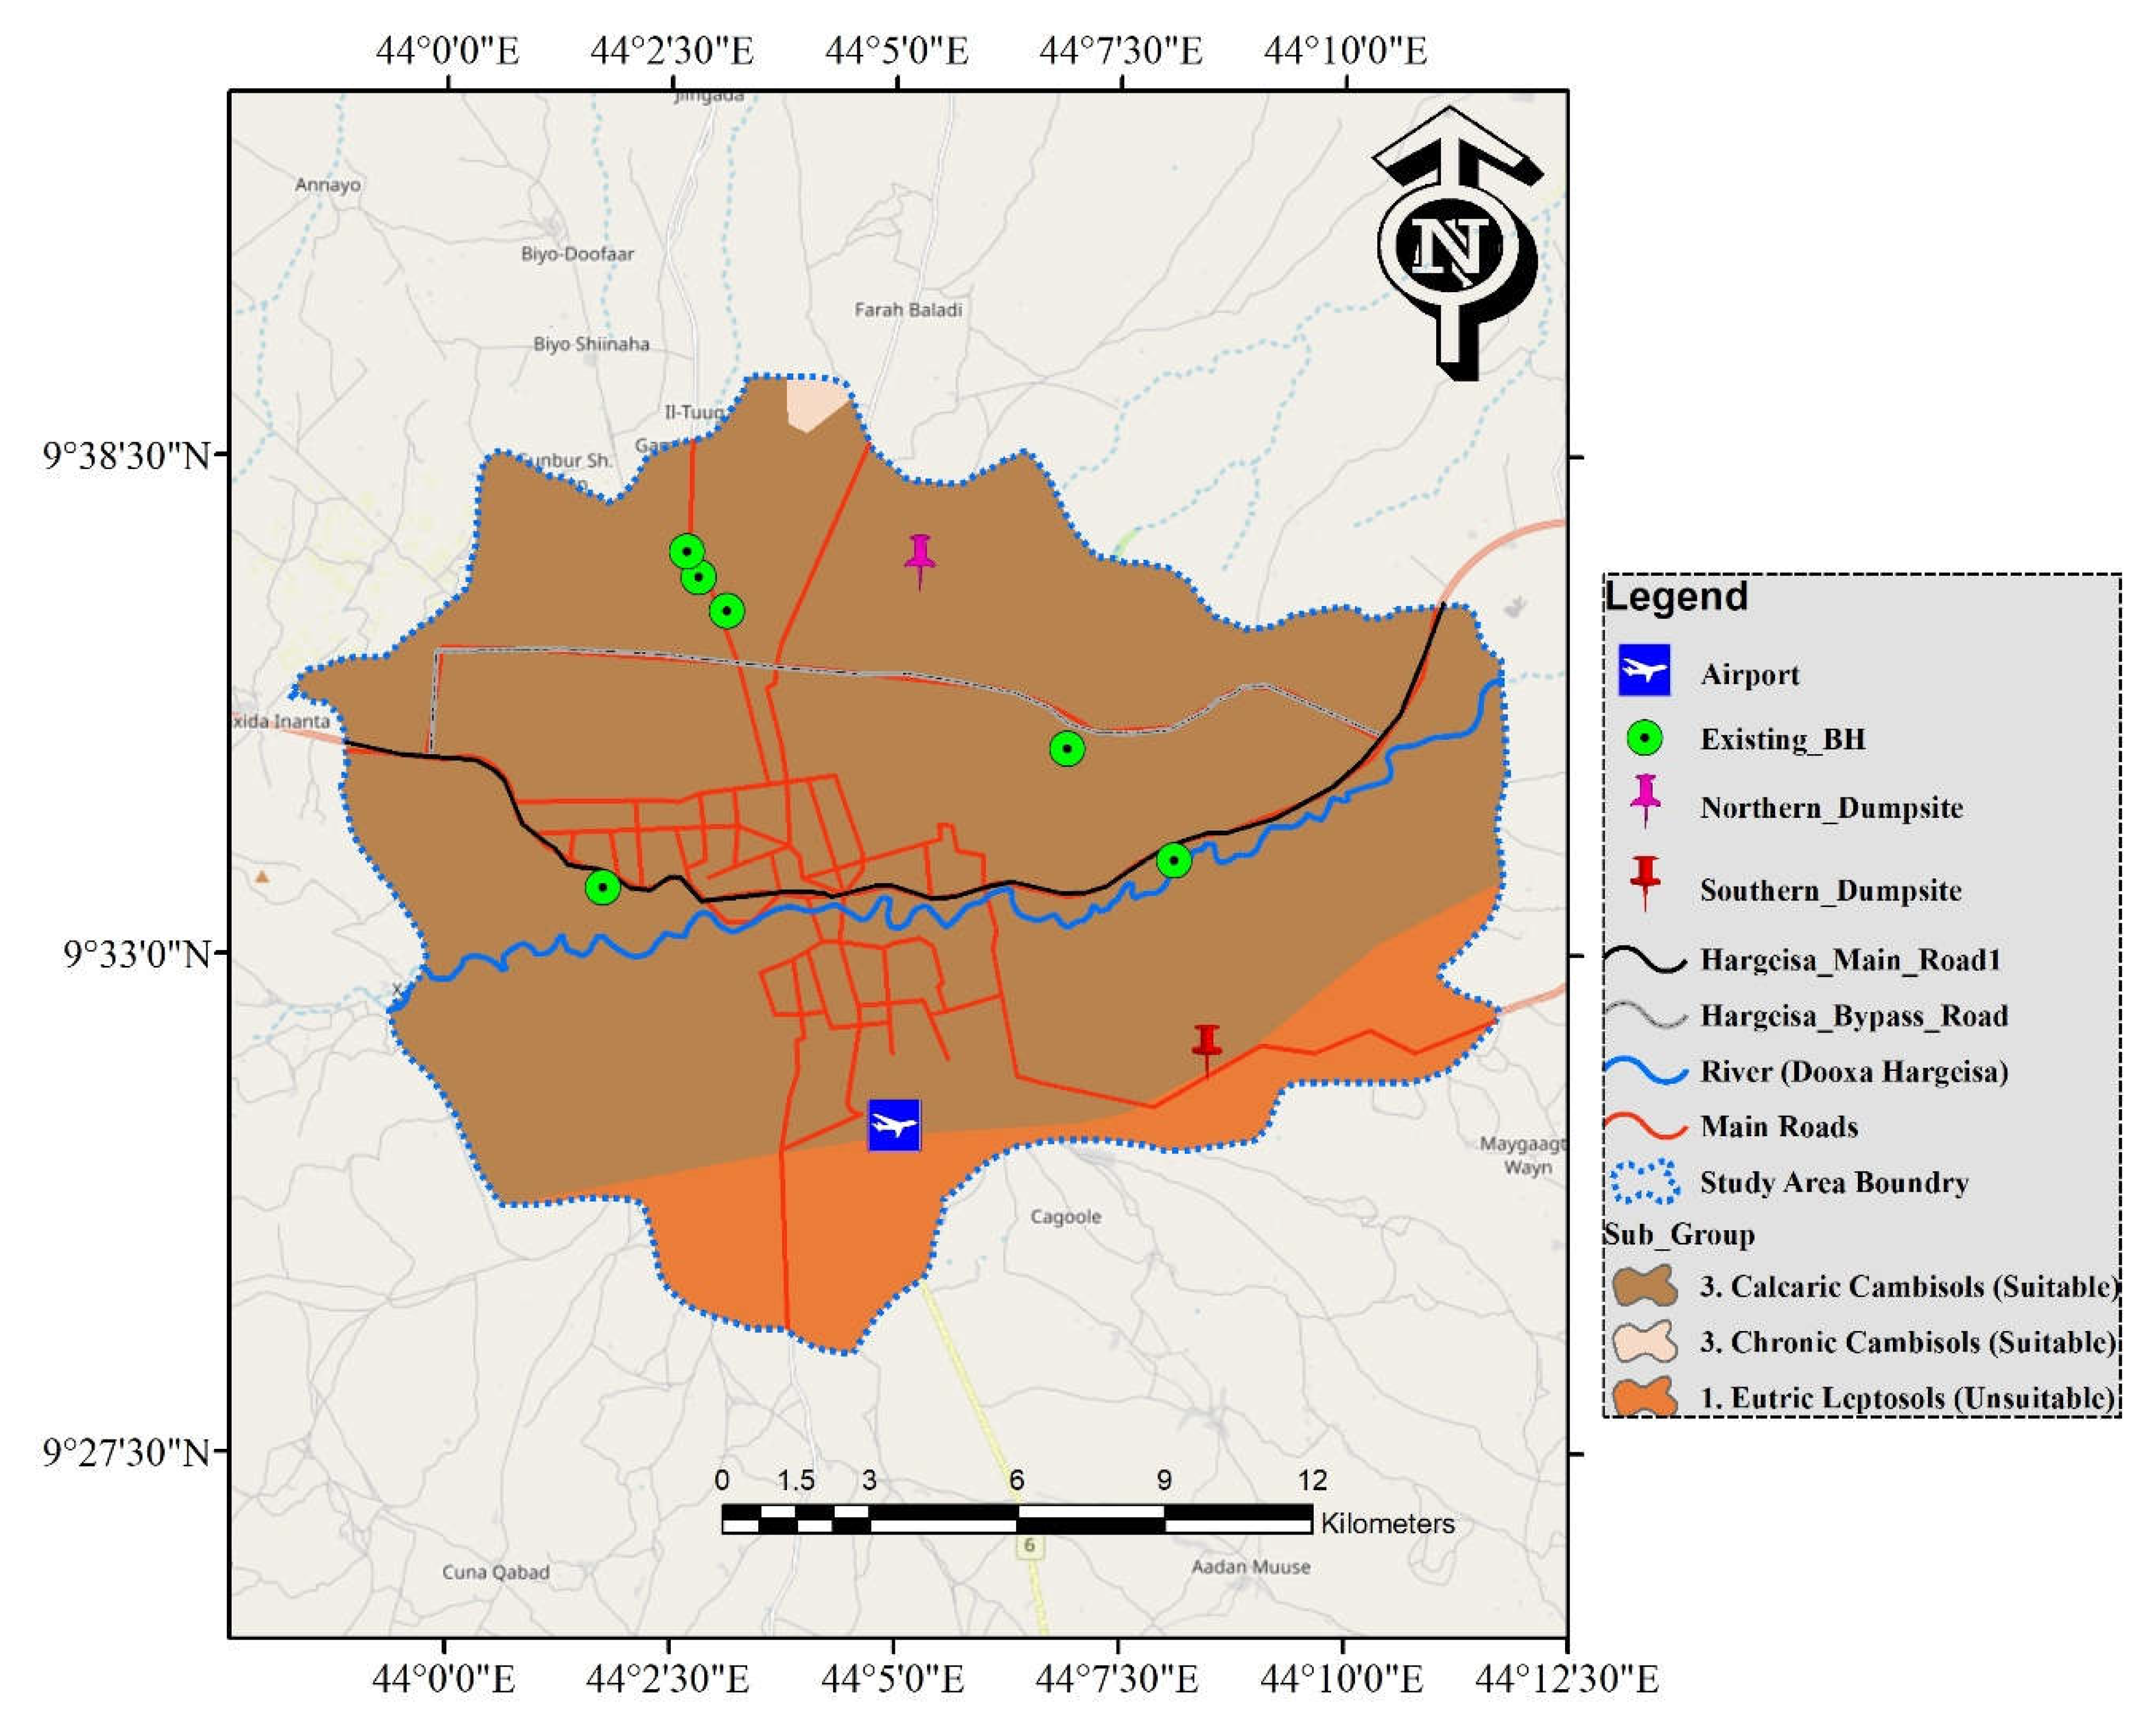
Figure 12.
Landfill site suitability criteria-soil type.
3.1.9. Elevation
The lower elevated ground is preferable for trash disposal based on appropriateness level preferences [29]. Therefore, higher elevated locations are not preferable for the placement of landfills to save on construction costs. Hence, this criterion has been utilized in several investigations all over the world [1,8]. The research area's elevation in this investigation spans from 1145 to 1399 meters above mean sea level (a.m.s.l). As shown in Table 9, the distances are separated into five classes (1145 m – 1195 m), (1195 m – 1245 m), (1245 m – 1295 m), (1295 m – 1345 m), and (1345 m – 1399 m), and are rated as extremely suitable, suitable, moderately suitable, less suitable, and unsuitable, respectively.
The research area's northern and northeastern regions with low elevations (altitudes below 1245 m above sea level) are the best locations for solid waste disposal sites, as indicated in Figure 13. In contrast, the central parts of the city, which are located between the southeast and northwestern and western regions (at a height between 1246 and 1399 meters above sea level), have less and are not suited as a dump site. While 27.93% and 9.16% of the study area are less suitable and unsuitable for analysis, respectively, 5.65%, 23.40%, and 33.82% are highly suitable, moderately suitable, and suitable, respectively.
3.1.10. Distance from an existing dumping ground
A landfill should be placed far enough away from another dump to ensure a secure gap between them [45]. In this study, weights were assigned in accordance with appropriateness, and buffer zones such as 0-500, 500-1000, 1000-1500, 1500-2000, and > 2000 m were established (Table 9). Additionally, (Figure 14)'s map includes a full examination of these criteria.
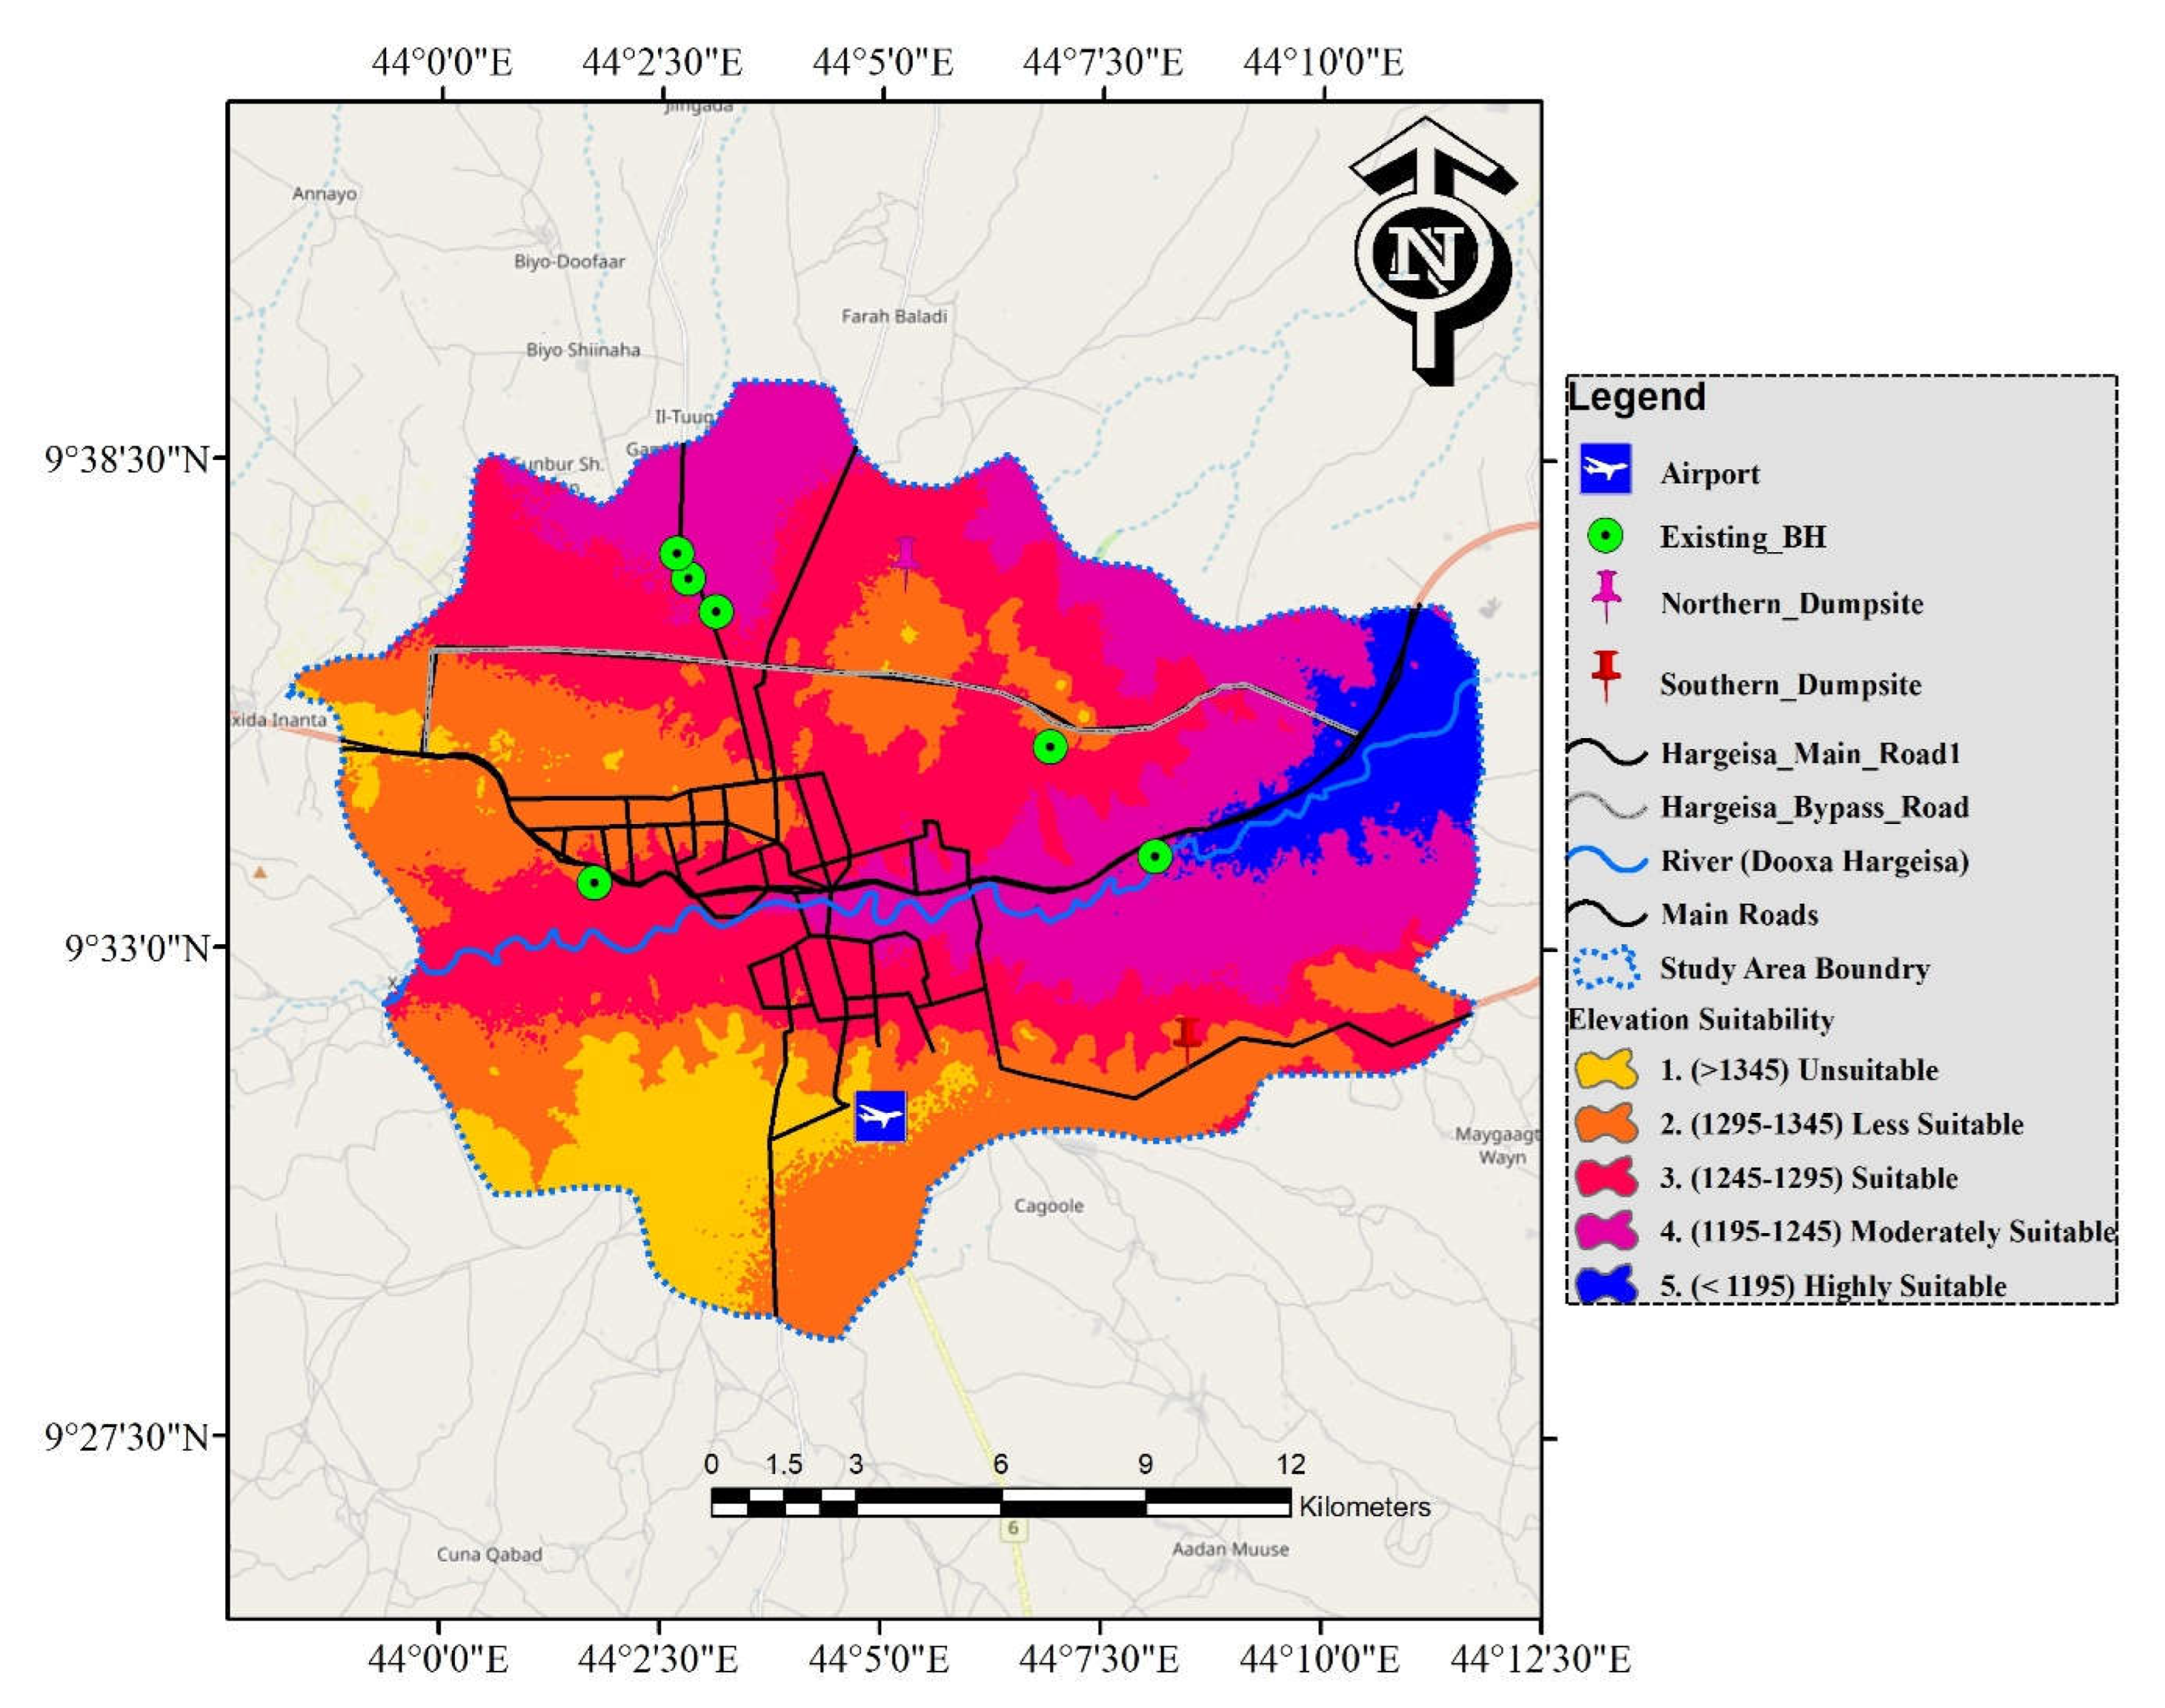
Figure 13.
Landfill site suitability criteria-elevation.
3.1.11. Slope
The study area's slope map was created using a 12.5 m resolution slope percentage. Areas with steep slopes run the risk of erosion and expensive construction. In addition, building landfills is economically unviable [18]. Thus, a higher degree slope is technically unfavorable for landfill establishment since the migration of leachate in a region with a steep slope is thought to contribute to water and soil contamination [40].
According to the reclassified slope map (Figure 15), the study area's slope values ranged from 0 to 81°. As a result, the slope was categorized into five classes. The study area has a slope of less than 20 degrees, which is extremely suitable for the landfill in the area under investigation. It is also dominated slope, which makes up 95.20 percent (29077.1 hectares) of the entire study area. Similarly, [43] deemed very high landfill dumping susceptibility for slopes under 20%. About 3.80% (1163.59 ha) and 0.76% (234.422 ha) of the study area are characterized by moderate suitable (21–30%) and suitable (31–41%) susceptibility to a landfill disposal site, respectively. Areas of low (41% - 51%) and very low (>51%) landfill susceptibility cover about 0.18% and 0.03%, respectively (Table 9). Thematic mapping revealed that the majority of the research area zone had flat terrain, making it ideal for dump sites. However, sections of the study area's middle region have gently sloping terrain along the main river, which runs from its east to west borders.
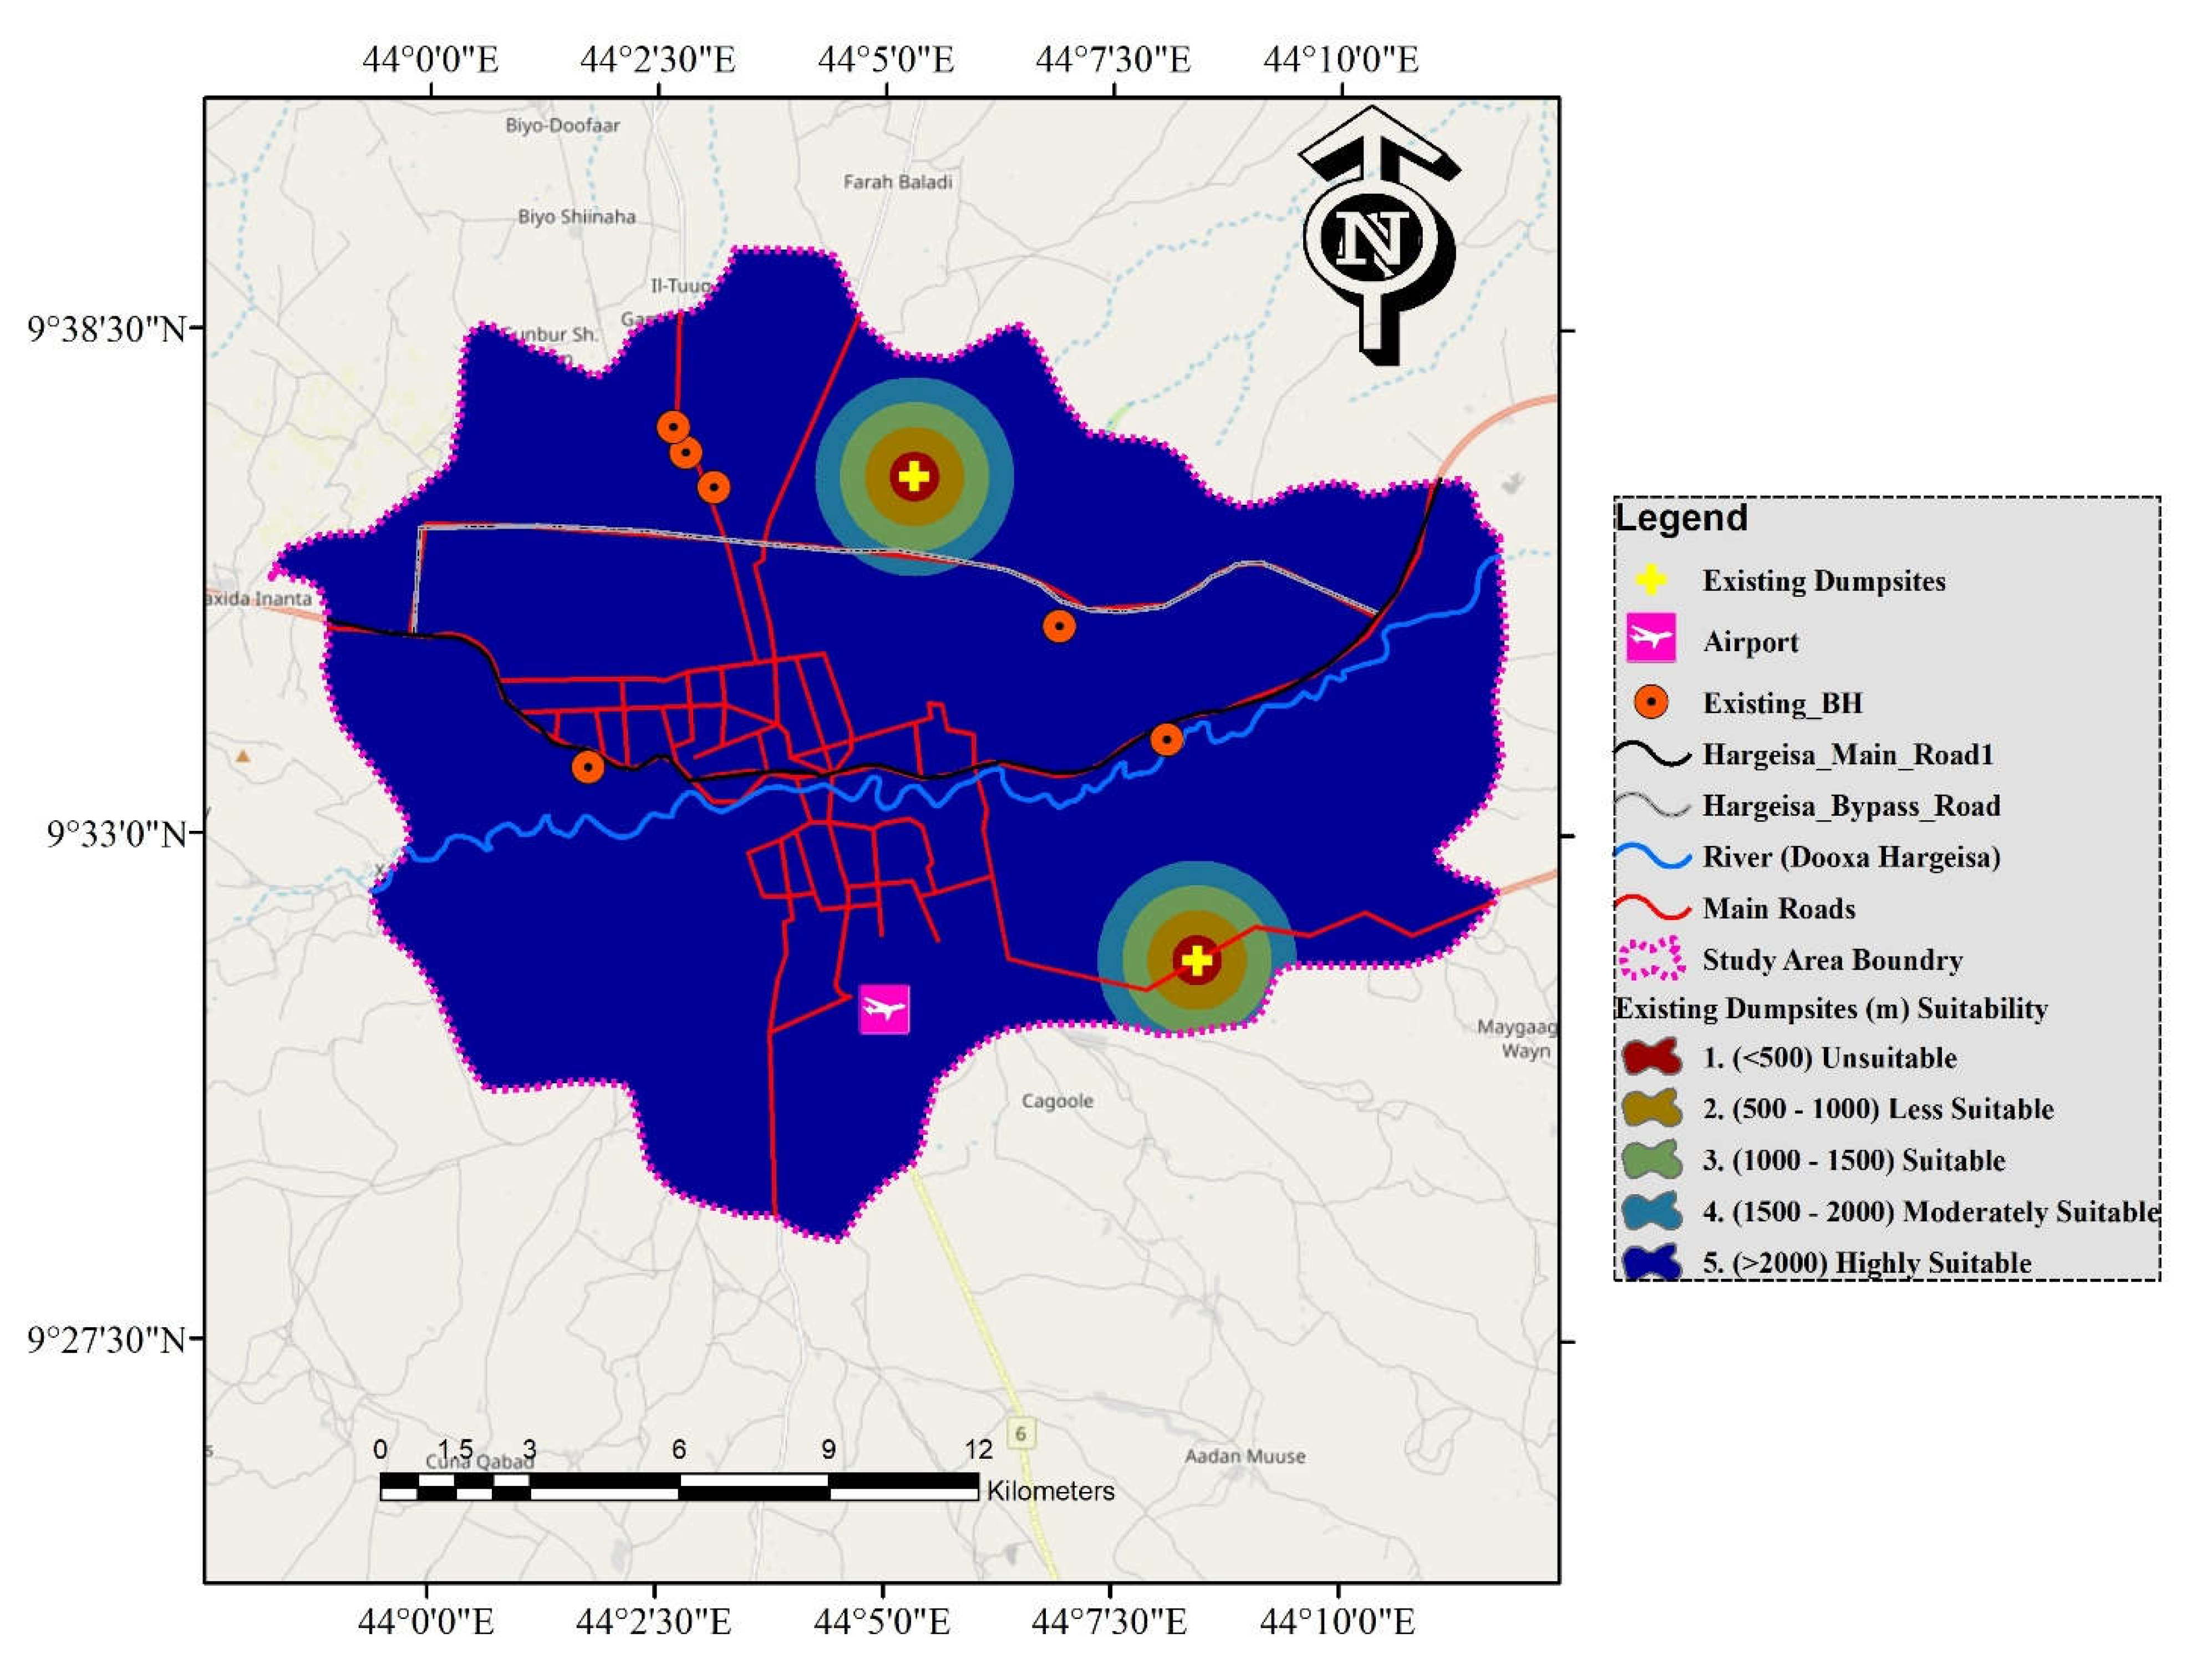
Figure 14.
Landfill site suitability criteria-existing dumpsites.
3.2. Evaluating candidate for landfill site
The selection of appropriate locations for the disposal of solid waste should be based on a number of factors that represent economic, social-cultural, and environmental [20]. As a result, various sources were used to determine the planned landfill (Table 1).
Using the defined eleven criteria—distance to residential areas, airport, geology (lithology), distance to major roads, distance to surface water, distance to groundwater, land use, land cover, distance to existing dumpsites, elevation, and slope—suitable landfill areas within the study area were first identified. The main justification for utilizing these standards is their regular and sufficient use in determining whether or not a location is suitable for landfilling [29]. According to the classification presented by [10], the buffers for each criterion were constructed.
Therefore, because of the detrimental effects of landfill on specific locations, the constraint map typically excludes those sites where dump sites cannot be created or are not allowed, as these locations are deemed undesirable for landfill sites. In this study, restricted regions that are undesirable for landfill sites, such as metropolitan areas, surface water, groundwater discharge points, existing dumpsites, key roadways, and airports, were avoided based on several criteria and sources [29]. In order to create a binary mask layer with the values 0 and 1, all of the resulting restricted maps were combined. A raster calculator was used to integrate it into the ArcGIS spatial analyst tool. The restricted and unrestricted zones each have a value that ranges from 0 to 1. To create the overall restriction map of Hargeisa city and surroundings, as shown in Figure 4, a restricted map of specific areas was incorporated into the ArcGIS environment.
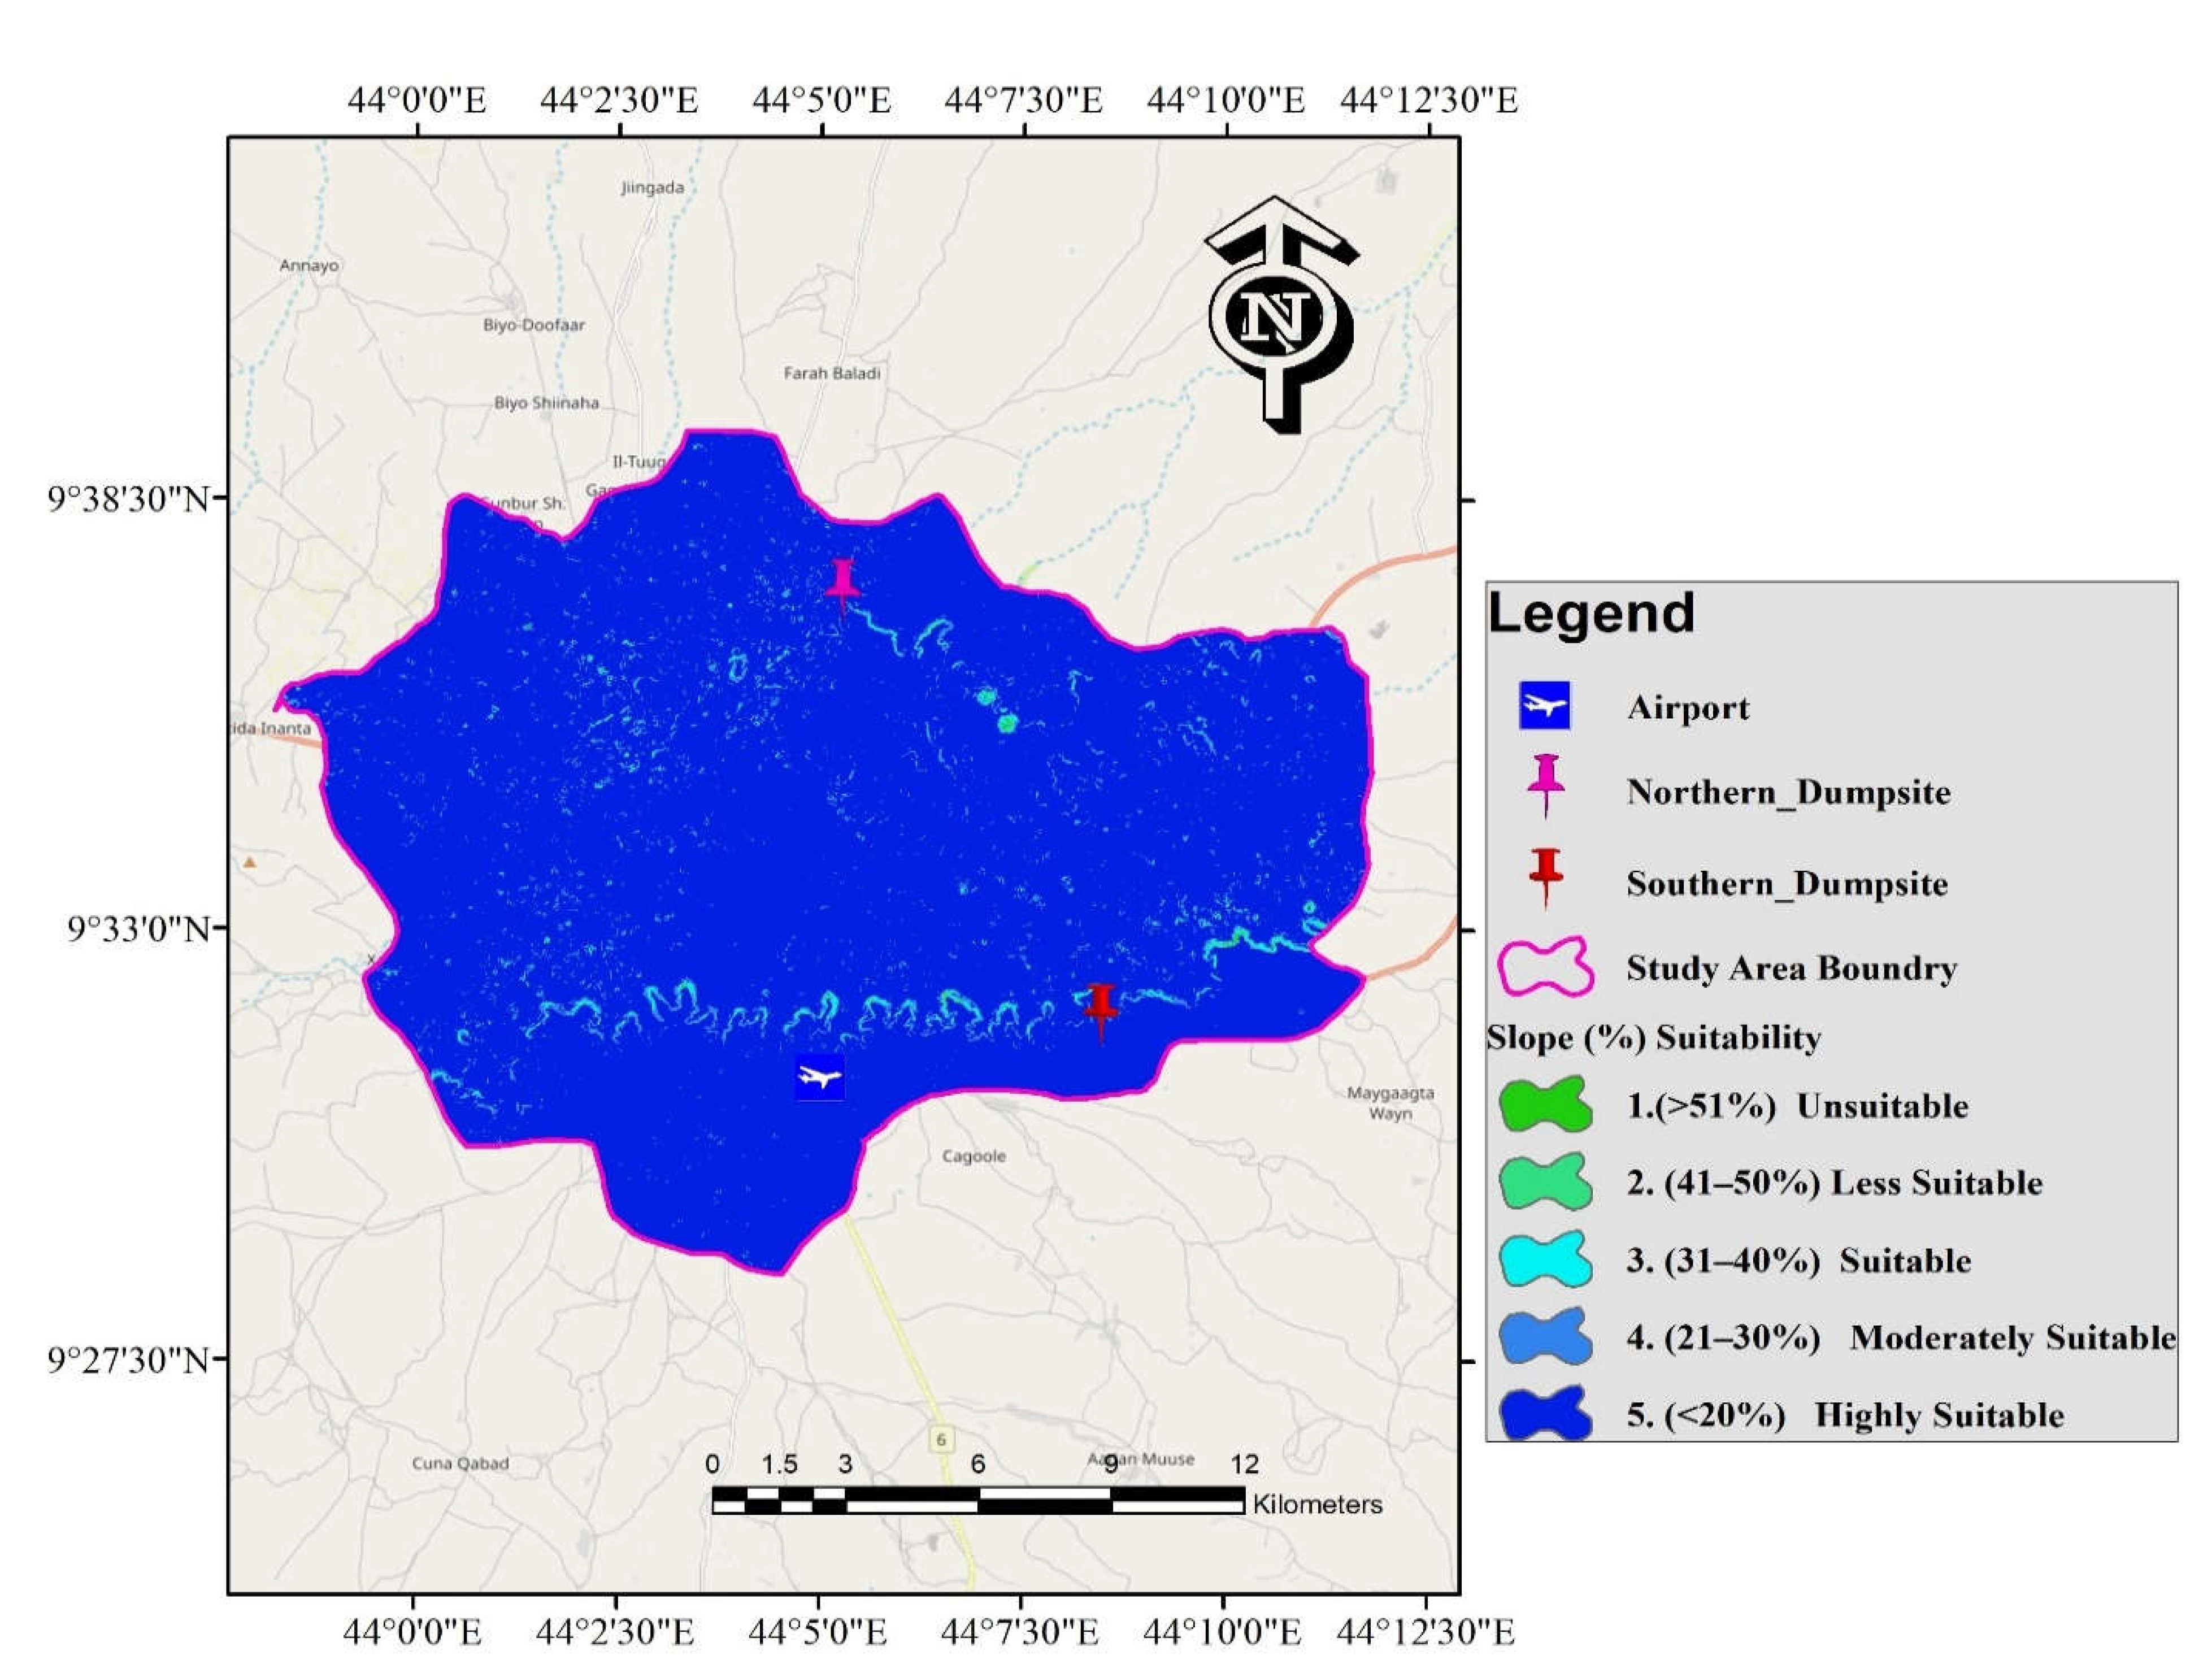
Figure 15.
Landfill suitability criteria slope (%).
Table 10 shows that 31.04% (9,479.66 ha) of the study area could be taken into consideration, whereas 68.96% (21,060.9 ha) of the study area is deemed unsuitable (restricted areas). The analysis demonstrates that the northern-eastern, northern, and majority of the western portions of the study area are excellent locations for landfills. As a result, the remaining components were excluded from further examination since they did not satisfy the environmental, social, economic, and technological requirements [46]. Indeed, with rapid population growth, people move towards the city's periphery for open space. Based on this, this suggests that the most significant constraints reducing the viability of dump sites are metropolitan areas and dispersed habitations.
In this second stage, after removing locations deemed inappropriate for landfilling by the restricted method to be unsuitable for landfilling, the analysis would only concern the remaining suitable zones to identify potential landfill sites. The weights and consistency ratio (C.R) produced from the AHP technique used to compare the weights of criteria at each main criterion and the weights of sub-criteria at each criterion are shown in Table 6. All comparisons' C.R values were 0.05, indicating that the weights found are reliable.
Table 11.
Landfill susceptibility, area coverage, and percentage of the study area.
| Suitability classes | AHP (Area) | |
| ha | Percentage | |
| Constrained area/zone | 21061 | 68.96 |
| Less Suitable | 7441.5 | 24.36 |
| Highly Suitable | 2038.1 | 6.68 |
The analysis of the pair-wise comparison (Table 4) used to determine the priorities between the criteria revealed that the LULC is the most significant one with a relative weight of 18%, subsequently followed by the criteria for habitations and water bodies, and then the airport criterion with weights of 15 and 11%, respectively (Table 4 and 5). On the other hand. For the soil type criterion, distance boreholes, and existing dumpsites, the lowest weights of 2, 3, and 4% respectively, were determined for environmental considerations.
The weighted overlay analysis in the Arc-GIS environment was used to overlay the thematic maps to produce the suitability map seen in Figure 16. Weighted overlay analysis was utilized in conjunction with the restricted layer to obtain the outcome as prospective landfill locations. Different sites that were suitable for landfilling were identified on the final suitability map (Figure 16). The research region was found to be unsuitable for landfill siting in about 68.96% (21060.9 ha), while approximately 24.36% (7441.53 ha) had less suitability, and about 6.68% had high suitability for landfill siting (Table 10). In actuality, fewer than 7% of total regions are ideally suited for landfill disposal. This shows that, despite the study area's enormous size, the number of areas suitable for landfills is still adequately small.
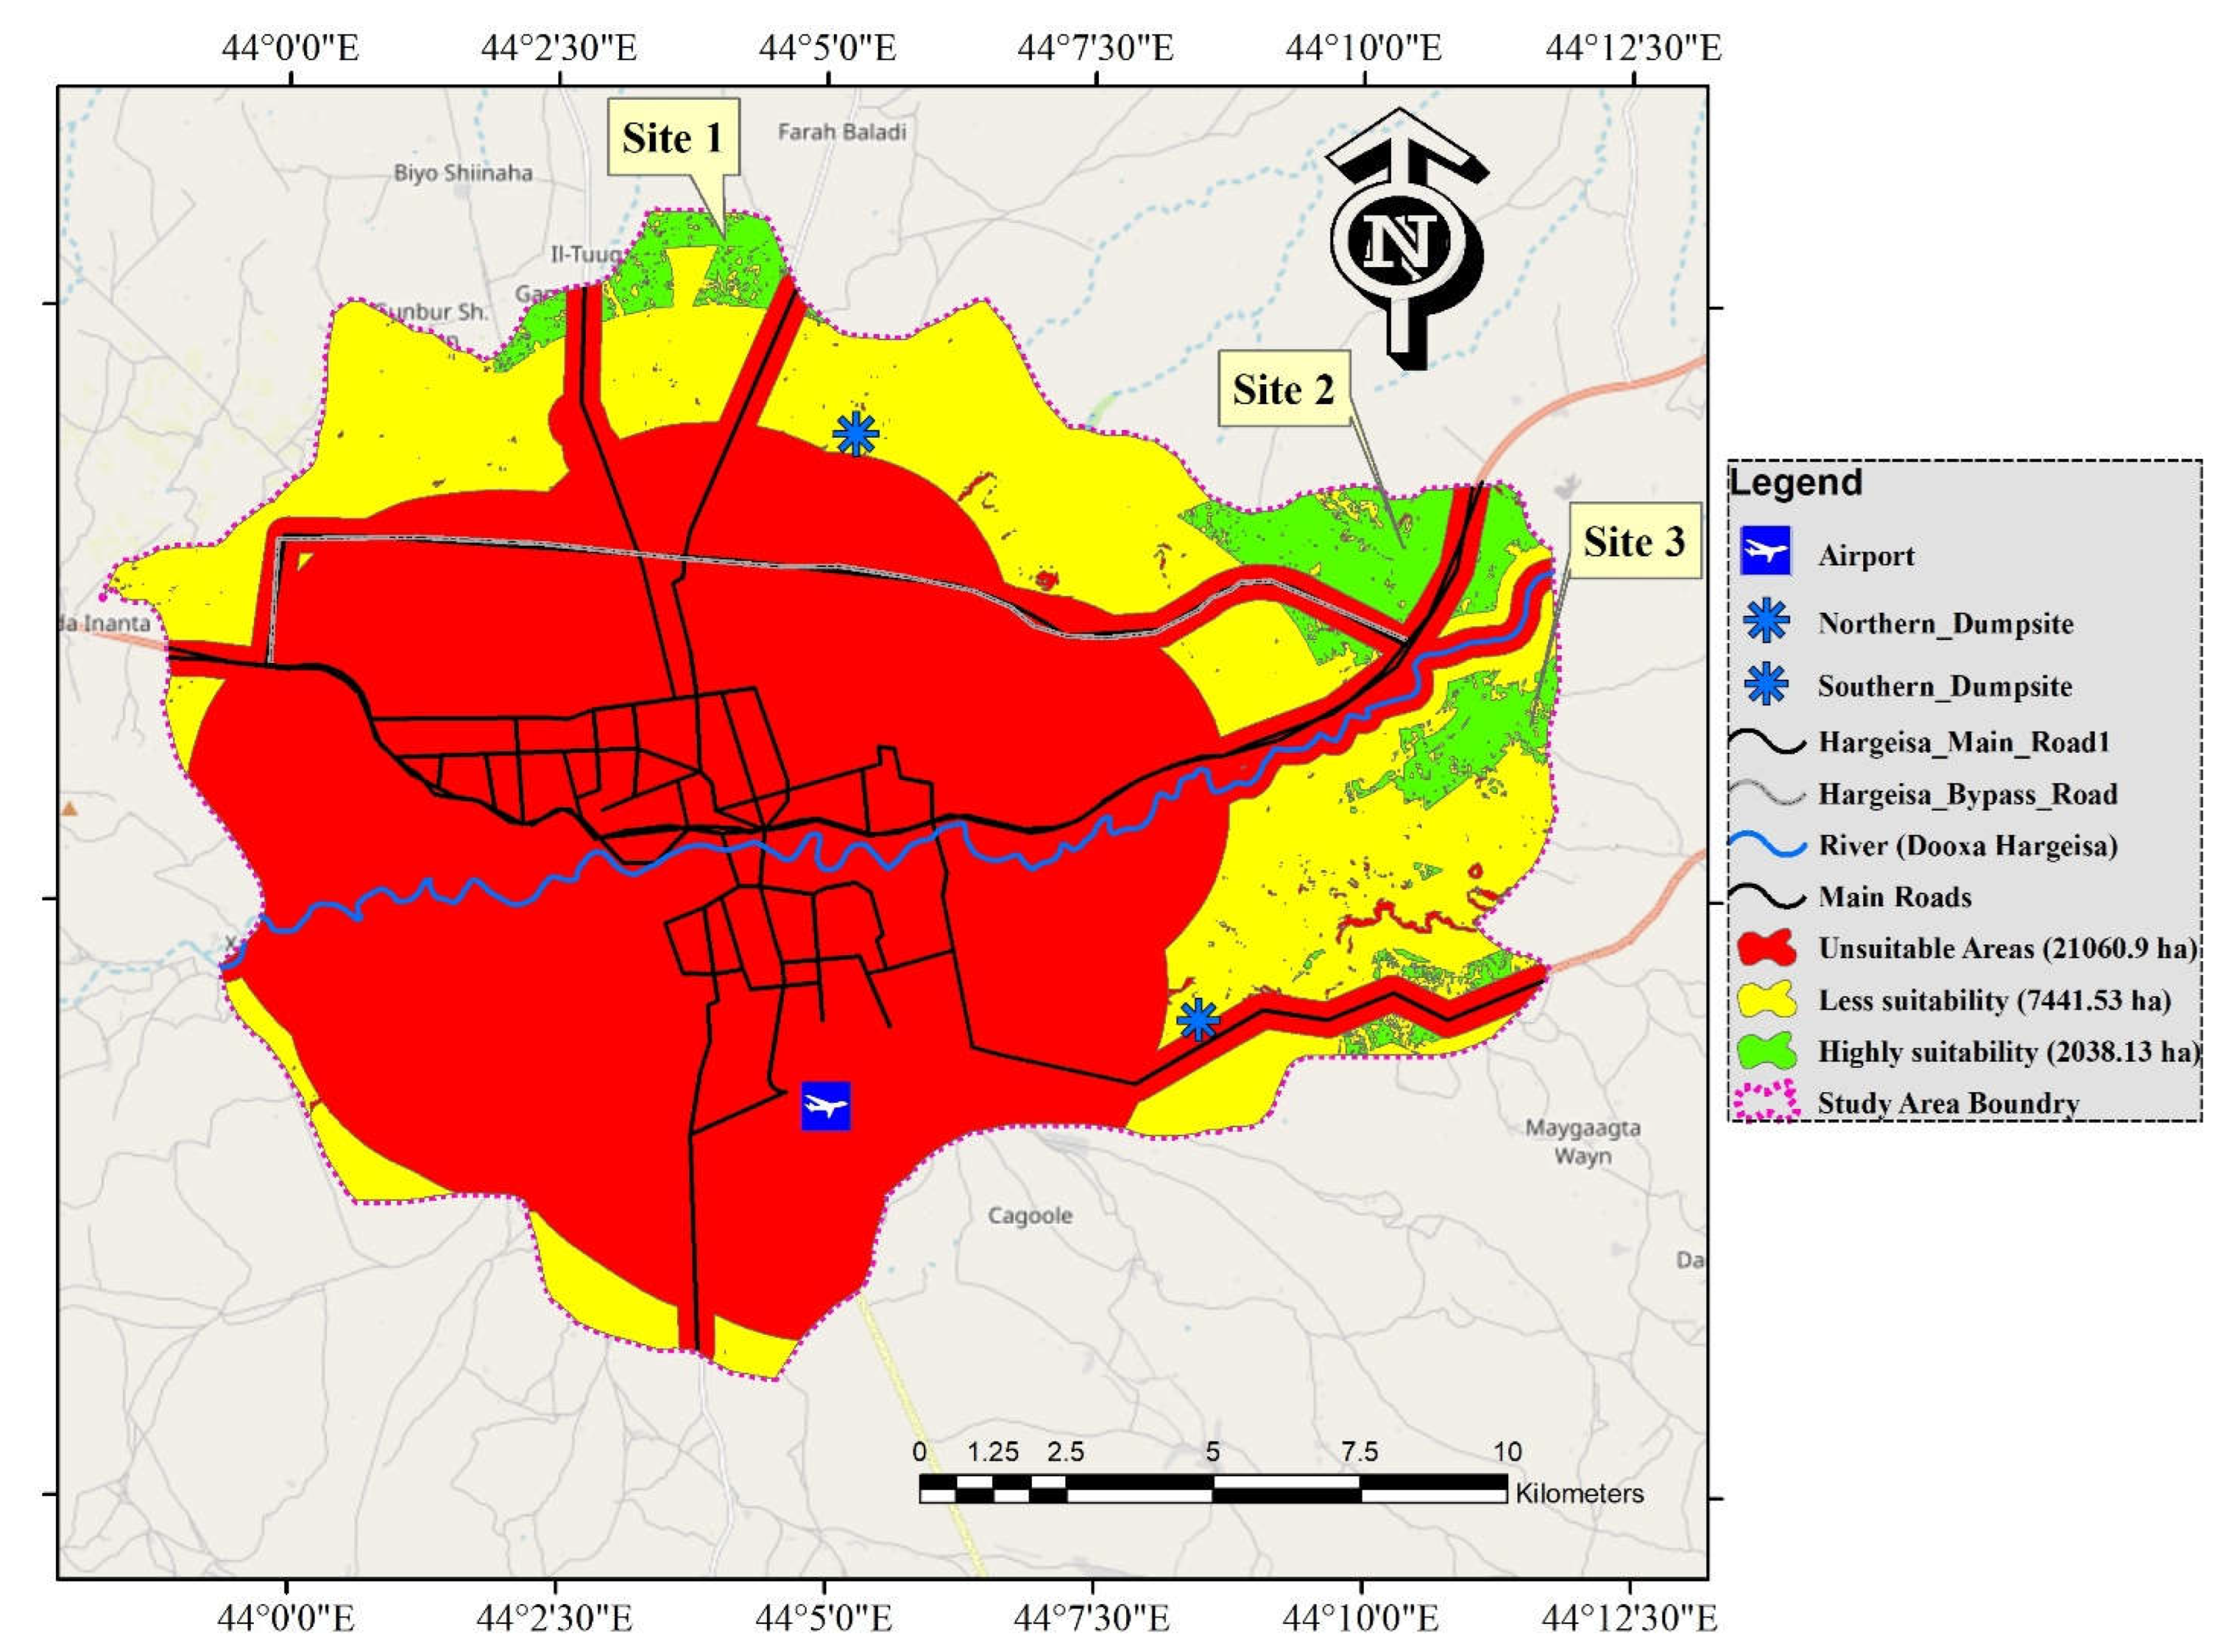
Table 12.
Location of the selected sites.
| Sites number | Rank* | Latitude | Longitude |
| 1 | 1 | 9°38'36.98"N | 44° 4'29.59"E |
| 2 | 2 | 9°36'35.18"N | 44° 8'28.65"E |
| 3 | 3 | 9°34'27.71"N | 44°11'36.74"E |
*Rank: 1-most suitable, 2-moderately suitable, 3-less suitable.
Figure 16.
Landfill site suitability (LSS) map along with the identified three most preferred candidate sites.
Figure 16.
Landfill site suitability (LSS) map along with the identified three most preferred candidate sites.
To lessen the risk to the environment and public health, potential landfill candidate sites are chosen based on their size and distance from residential areas [47]. Finally, based on the high suitability for landfill siting areas, three sites, namely site-one, two, and three, were proposed, of which the most suitable location for Hargeisa City and its environs (Table 11).
The first landfill site, which is north of the research area, is seen to be the most suited since it might minimize negative environmental and socio-environmental effects. In the current study, landfill sites three and two are located closer to major roads than disposal site one; as a result, they are economically very suitable concerning transportation costs for municipal solid waste. Nevertheless, to prevent harm to people and the environment, landfills shouldn't be located close to highways [2]. Thus, from the distance-based perspective of residential and road proximity, landfill site one is highly suitable compared to others as is far from the residential areas [27]. Also, before the building of the landfill, local communities should be consulted, and a thorough feasibility assessment should be conducted on the site to avoid disputes between land users and reduce potential contamination issues. As a result, the outcomes of the current approach helped decision-makers rank and find appropriate disposal locations.
4. Conclusions
The weighting of all criteria was assessed using a developed analytical hierarchy process (AHP) with a consistency ratio of 0.05. Additionally, the model accurately reflected the degree of reality present in the research area, demonstrating the method's efficacy in locating and mapping landfill-prone locations. The study determined the viability of three potential landfill locations in the wasteland.
Furthermore, the land uses and land cover (LULC) criterion is the most significant one, with a relative weight of 0.1829, followed by habitations, with a relative weight of 0.1506. This was shown by the pair-wise comparison used to determine the priority between the criteria that were chosen. The research region is unsuitable for landfill siting in around 68.96% (21060.9 ha), but only 24.36% (7441.53 ha) had low appropriateness and about 6.68% had high suitability. In this instance, the government, local authorities, and city planners might refer to and follow the findings of this site selection analysis for subsequent development. Moreover, the approaches used in this study can make an important contribution to the scientific community working on the study and design of solid waste disposal in Somaliland and elsewhere.
Author Contributions
Conceptualization, Nimcan Mohamed; Data curation, Nimcan Mohamed; Formal analysis, Nimcan Mohamed; Investigation, Nimcan Mohamed; Methodology, Nimcan Mohamed; Resources, Nimcan Mohamed; Software, Nimcan Mohamed; Validation, Nimcan Mohamed; Visualization, Nimcan Mohamed; Writing – original draft, Nimcan Mohamed; Writing – review & editing, Yemane Asfaha and Akiber Wachemo.
Funding
This research received no funding from any source.
Institutional Review Board Statement
Not applicable.
Informed Consent Statement
Not applicable.
Data Availability Statement
The data presented in this study are available on request from the corresponding author.
Acknowledgments
The authors are highly thankful to the Somalia Water and Land Information Management (SWALIM) (https://faoswalim.org ) for their genuine support in providing information, and relevant data (Geology, Well data, and soil). We also acknowledge experts with extensive knowledge and expertise in selecting solid waste landfill sites for sharing issues regarding new landfill site selection in the study area.
Conflicts of Interest
The authors declare no conflict of interests/ competing interests.
References
- Makonyo, M.; Msabi, M.M. Potential landfill sites selection using GIS-based multi-criteria decision analysis in Dodoma capital city, central Tanzania. GeoJournal 2021, 87, 2903–2933. [Google Scholar] [CrossRef]
- Hazarika, R.; Saikia, A. Landfill site suitability analysis using AHP for solid waste management in the Guwahati Metropolitan Area, India. Arab. J. Geosci. 2020, 13, 1–14. [Google Scholar] [CrossRef]
- Negash, Y.T.; Hassan, A.M.; Tseng, M.-L.; Wu, K.-J.; Ali, M.H. Sustainable construction and demolition waste management in Somaliland: Regulatory barriers lead to technical and environmental barriers. J. Clean. Prod. 2021, 297, 126717. [Google Scholar] [CrossRef]
- I. Awale, “Chapter 10 : Somaliland ’ s Major Environmental Challenges,” 2011.
- Demesouka, O.; Vavatsikos, A.; Anagnostopoulos, K. Suitability analysis for siting MSW landfills and its multicriteria spatial decision support system: Method, implementation and case study. Waste Manag. 2013, 33, 1190–1206. [Google Scholar] [CrossRef] [PubMed]
- Bui, T.D.; Tsai, F.M.; Tseng, M.-L.; Ali, M.H. Identifying sustainable solid waste management barriers in practice using the fuzzy Delphi method. Resour. Conserv. Recycl. 2019, 154, 104625. [Google Scholar] [CrossRef]
- Bilgilioglu, S.S.; Gezgin, C.; Orhan, O.; Karakus, P. A GIS-based multi-criteria decision-making method for the selection of potential municipal solid waste disposal sites in Mersin, Turkey. Environ. Sci. Pollut. Res. 2021, 29, 5313–5329. [Google Scholar] [CrossRef]
- Kazuva, E.; Zhang, J.; Tong, Z.; Liu, X.-P.; Memon, S.; Mhache, E. GIS- and MCD-based suitability assessment for optimized location of solid waste landfills in Dar es Salaam, Tanzania. Environ. Sci. Pollut. Res. 2020, 28, 11259–11278. [Google Scholar] [CrossRef]
- W. Bank, “Consulting Services for Engineering Feasibility Studies and Preliminary Designs for Urban Roads and Solid and Liquid Waste Management in Mogadishu, Garowe and Hargeisa Feasibility Report for Solid Waste Management and Disposal : Hargesia 16,” no. September, 2016.
- Aderoju, O.M.; Dias, G.A.; Gonçalves, A.J. A GIS-based analysis for sanitary landfill sites in Abuja, Nigeria. Environ. Dev. Sustain. 2018, 22, 551–574. [Google Scholar] [CrossRef]
- Eghtesadifard, M.; Afkhami, P.; Bazyar, A. An integrated approach to the selection of municipal solid waste landfills through GIS, K-Means and multi-criteria decision analysis. Environ. Res. 2020, 185, 109348. [Google Scholar] [CrossRef] [PubMed]
- Makonyo, M.; Msabi, M.M. Potential landfill sites selection using GIS-based multi-criteria decision analysis in Dodoma capital city, central Tanzania. GeoJournal 2021, 87, 2903–2933. [Google Scholar] [CrossRef]
- Alkaradaghi, K.; Ali, S.S.; Al-Ansari, N.; Laue, J.; Chabuk, A. Landfill Site Selection Using MCDM Methods and GIS in the Sulaimaniyah Governorate, Iraq. Sustainability 2019, 11, 4530. [Google Scholar] [CrossRef]
- Ali, S.A.; Ahmad, A. Suitability analysis for municipal landfill site selection using fuzzy analytic hierarchy process and geospatial technique. Environ. Earth Sci. 2020, 79, 1–27. [Google Scholar] [CrossRef]
- Manyoma-Velásquez, P.C.; Vidal-Holguín, C.J.; Torres-Lozada, P. Methodology for locating regional landfills using multi-criteria decision analysis techniques. Cogent Eng. 2020, 7. [Google Scholar] [CrossRef]
- Beskese, A.; Demir, H.H.; Ozcan, H.K.; Okten, H.E. Landfill site selection using fuzzy AHP and fuzzy TOPSIS: a case study for Istanbul. Environ. Earth Sci. 2014, 73, 3513–3521. [Google Scholar] [CrossRef]
- Ali, S.A.; Parvin, F.; Al-Ansari, N.; Pham, Q.B.; Ahmad, A.; Raj, M.S.; Anh, D.T.; Ba, L.H.; Thai, V.N. Sanitary landfill site selection by integrating AHP and FTOPSIS with GIS: a case study of Memari Municipality, India. Environ. Sci. Pollut. Res. 2020, 28, 7528–7550. [Google Scholar] [CrossRef] [PubMed]
- Ajibade, F.O.; Olajire, O.O.; Ajibade, T.F.; Nwogwu, N.A.; Lasisi, K.H.; Alo, A.B.; Owolabi, T.A.; Adewumi, J.R. Combining multicriteria decision analysis with GIS for suitably siting landfills in a Nigerian state. Environ. Sustain. Indic. 2019, 3-4, 100010. [Google Scholar] [CrossRef]
- Sharma, A.; Ganguly, R.; Gupta, A.K. Matrix method for evaluation of existing solid waste management system in Himachal Pradesh, India. J. Mater. Cycles Waste Manag. 2018, 20, 1813–1831. [Google Scholar] [CrossRef]
- Barakat, A.; Hilali, A.; El Baghdadi, M.; Touhami, F. Landfill site selection with GIS-based multi-criteria evaluation technique. A case study in Béni Mellal-Khouribga Region, Morocco. Environ. Earth Sci. 2017, 76, 413. [Google Scholar] [CrossRef]
- Wang, Y.; Li, J.; An, D.; Xi, B.; Tang, J.; Wang, Y.; Yang, Y. Site selection for municipal solid waste landfill considering environmental health risks. Resour. Conserv. Recycl. 2018, 138, 40–46. [Google Scholar] [CrossRef]
- Adewumi, J.R.; Ejeh, O.J.; Lasisi, K.H.; Ajibade, F.O. A GIS–AHP-based approach in siting MSW landfills in Lokoja, Nigeria. SN Appl. Sci. 2019, 1, 1528. [Google Scholar] [CrossRef]
- Barzehkar, M.; Dinan, N.M.; Mazaheri, S.; Tayebi, R.M.; Brodie, G.I. Landfill site selection using GIS-based multi-criteria evaluation (case study: SaharKhiz Region located in Gilan Province in Iran). SN Appl. Sci. 2019, 1, 1082. [Google Scholar] [CrossRef]
- Sk, M.; Ali, S.A.; Ahmad, A. Optimal Sanitary Landfill Site Selection for Solid Waste Disposal in Durgapur City Using Geographic Information System and Multi-criteria Evaluation Technique. KN - J. Cartogr. Geogr. Inf. 2020, 70, 163–180. [Google Scholar] [CrossRef]
- Weldeyohanis, Y.H.; Aneseyee, A.B.; Sodango, T.H. Evaluation of current solid waste disposal site based on socio-economic and geospatial data: a case study of Wolkite town, Ethiopia. GeoJournal 2020, 87, 585–601. [Google Scholar] [CrossRef]
- Di Bella, V.; Vaccari, M. Constraints for solid waste management in Somaliland. Proc. Inst. Civ. Eng. - Waste Resour. Manag. 2014, 167, 62–71. [Google Scholar] [CrossRef]
- Ikhlayel, M. Indicators for establishing and assessing waste management systems in developing countries: A holistic approach to sustainability and business opportunities. Bus. Strat. Dev. 2018, 1, 31–42. [Google Scholar] [CrossRef]
- Somaliland Government, “Somaliland Environmental Management Law No. 79/2019,” no. 79, pp. 1–4, 2019, [Online]. Available: http://www.ilo.org/dyn/natlex/natlex4.detail?p_lang=en&p_isn=108742.
- Dolui, S.; Sarkar, S. Identifying potential landfill sites using multicriteria evaluation modeling and GIS techniques for Kharagpur city of West Bengal, India. Environ. Challenges 2021, 5, 100243. [Google Scholar] [CrossRef]
- Saaty, R.W. The analytic hierarchy process—What it is and how it is used. Math. Model. 1987, 9, 161–176. [Google Scholar] [CrossRef]
- Singh, C.K.; Kumar, A.; Roy, S.S. Estimating Potential Methane Emission from Municipal Solid Waste and a Site Suitability Analysis of Existing Landfills in Delhi, India. Technologies 2017, 5, 62. [Google Scholar] [CrossRef]
- Zahedi, F. The Analytic Hierarchy Process—A Survey of the Method and its Applications. INFORMS J. Appl. Anal. 1986, 16, 96–108. [Google Scholar] [CrossRef]
- Shunmugapriya, K.; Panneerselvam, B.; Muniraj, K.; Ravichandran, N.; Prasath, P.; Thomas, M.; Duraisamy, K. Integration of multi criteria decision analysis and GIS for evaluating the site suitability for aquaculture in southern coastal region, India. Mar. Pollut. Bull. 2021, 172, 112907. [Google Scholar] [CrossRef] [PubMed]
- Paul, S.; Ghosh, S. Identification of solid waste dumping site suitability of Kolkata Metropolitan Area using Fuzzy-AHP model. Clean. Logist. Supply Chain 2022, 3, 100030. [Google Scholar] [CrossRef]
- Al-Anbari, M.A.; Thameer, M.Y.; Al-Ansari, N. Landfill Site Selection by Weighted Overlay Technique: Case Study of Al-Kufa, Iraq. Sustainability 2018, 10, 999. [Google Scholar] [CrossRef]
- Aksoy, E.; San, B.T. Geographical information systems (GIS) and Multi-Criteria Decision Analysis (MCDA) integration for sustainable landfill site selection considering dynamic data source. Bull. Eng. Geol. Environ. 2017, 78, 779–791. [Google Scholar] [CrossRef]
- Ahire, V.; Behera, D.K.; Saxena, M.R.; Patil, S.; Endait, M.; Poduri, H. Potential landfill site suitability study for environmental sustainability using GIS-based multi-criteria techniques for nashik and environs. Environ. Earth Sci. 2022, 81, 1–15. [Google Scholar] [CrossRef]
- Donevska, K.R.; Gorsevski, P.V.; Jovanovski, M.; Peševski, I. Regional non-hazardous landfill site selection by integrating fuzzy logic, AHP and geographic information systems. Environ. Earth Sci. 2011, 67, 121–131. [Google Scholar] [CrossRef]
- Rezaeisabzevar, Y.; Bazargan, A.; Zohourian, B. Landfill site selection using multi criteria decision making: Influential factors for comparing locations. J. Environ. Sci. 2020, 93, 170–184. [Google Scholar] [CrossRef]
- Zarin, R.; Azmat, M.; Naqvi, S.R.; Saddique, Q.; Ullah, S. Landfill site selection by integrating fuzzy logic, AHP, and WLC method based on multi-criteria decision analysis. Environ. Sci. Pollut. Res. 2021, 28, 19726–19741. [Google Scholar] [CrossRef]
- U. Saleem, “Territorial diagnostic report of the land resources of Somaliland,” no. L, 2016.
- Saatsaz, M.; Monsef, I.; Rahmani, M.; Ghods, A. Site suitability evaluation of an old operating landfill using AHP and GIS techniques and integrated hydrogeological and geophysical surveys. Environ. Monit. Assess. 2018, 190, 144. [Google Scholar] [CrossRef] [PubMed]
- Bahrani, S.; Ebadi, T.; Ehsani, H.; Yousefi, H.; Maknoon, R. Modeling landfill site selection by multi-criteria decision making and fuzzy functions in GIS, case study: Shabestar, Iran. Environ. Earth Sci. 2016, 75, 1–14. [Google Scholar] [CrossRef]
- Eskandari, M.; Homaee, M.; Mahmoodi, S.; Pazira, E.; Van Genuchten, M.T. Optimizing landfill site selection by using land classification maps. Environ. Sci. Pollut. Res. 2015, 22, 7754–7765. [Google Scholar] [CrossRef]
- El Baba, M.; Kayastha, P.; De Smedt, F. Landfill site selection using multi-criteria evaluation in the GIS interface: a case study from the Gaza Strip, Palestine. Arab. J. Geosci. 2014, 8, 7499–7513. [Google Scholar] [CrossRef]
- Khodaparast, M.; Rajabi, A.M.; Edalat, A. Municipal solid waste landfill siting by using GIS and analytical hierarchy process (AHP): a case study in Qom city, Iran. Environ. Earth Sci. 2018, 77, 52. [Google Scholar] [CrossRef]
- Karakuş, C.B.; Demiroğlu, D.; Çoban, A.; Ulutaş, A. Evaluation of GIS-based multi-criteria decision-making methods for sanitary landfill site selection: the case of Sivas city, Turkey. J. Mater. Cycles Waste Manag. 2019, 22, 254–272. [Google Scholar] [CrossRef]
Disclaimer/Publisher’s Note: The statements, opinions and data contained in all publications are solely those of the individual author(s) and contributor(s) and not of MDPI and/or the editor(s). MDPI and/or the editor(s) disclaim responsibility for any injury to people or property resulting from any ideas, methods, instructions or products referred to in the content. |
© 2023 by the authors. Licensee MDPI, Basel, Switzerland. This article is an open access article distributed under the terms and conditions of the Creative Commons Attribution (CC BY) license (http://creativecommons.org/licenses/by/4.0/).
Copyright: This open access article is published under a Creative Commons CC BY 4.0 license, which permit the free download, distribution, and reuse, provided that the author and preprint are cited in any reuse.


