Submitted:
22 April 2023
Posted:
23 April 2023
You are already at the latest version
Abstract
Keywords:
1. Introduction
2. Results
2.1. CYP3A catalytic activity
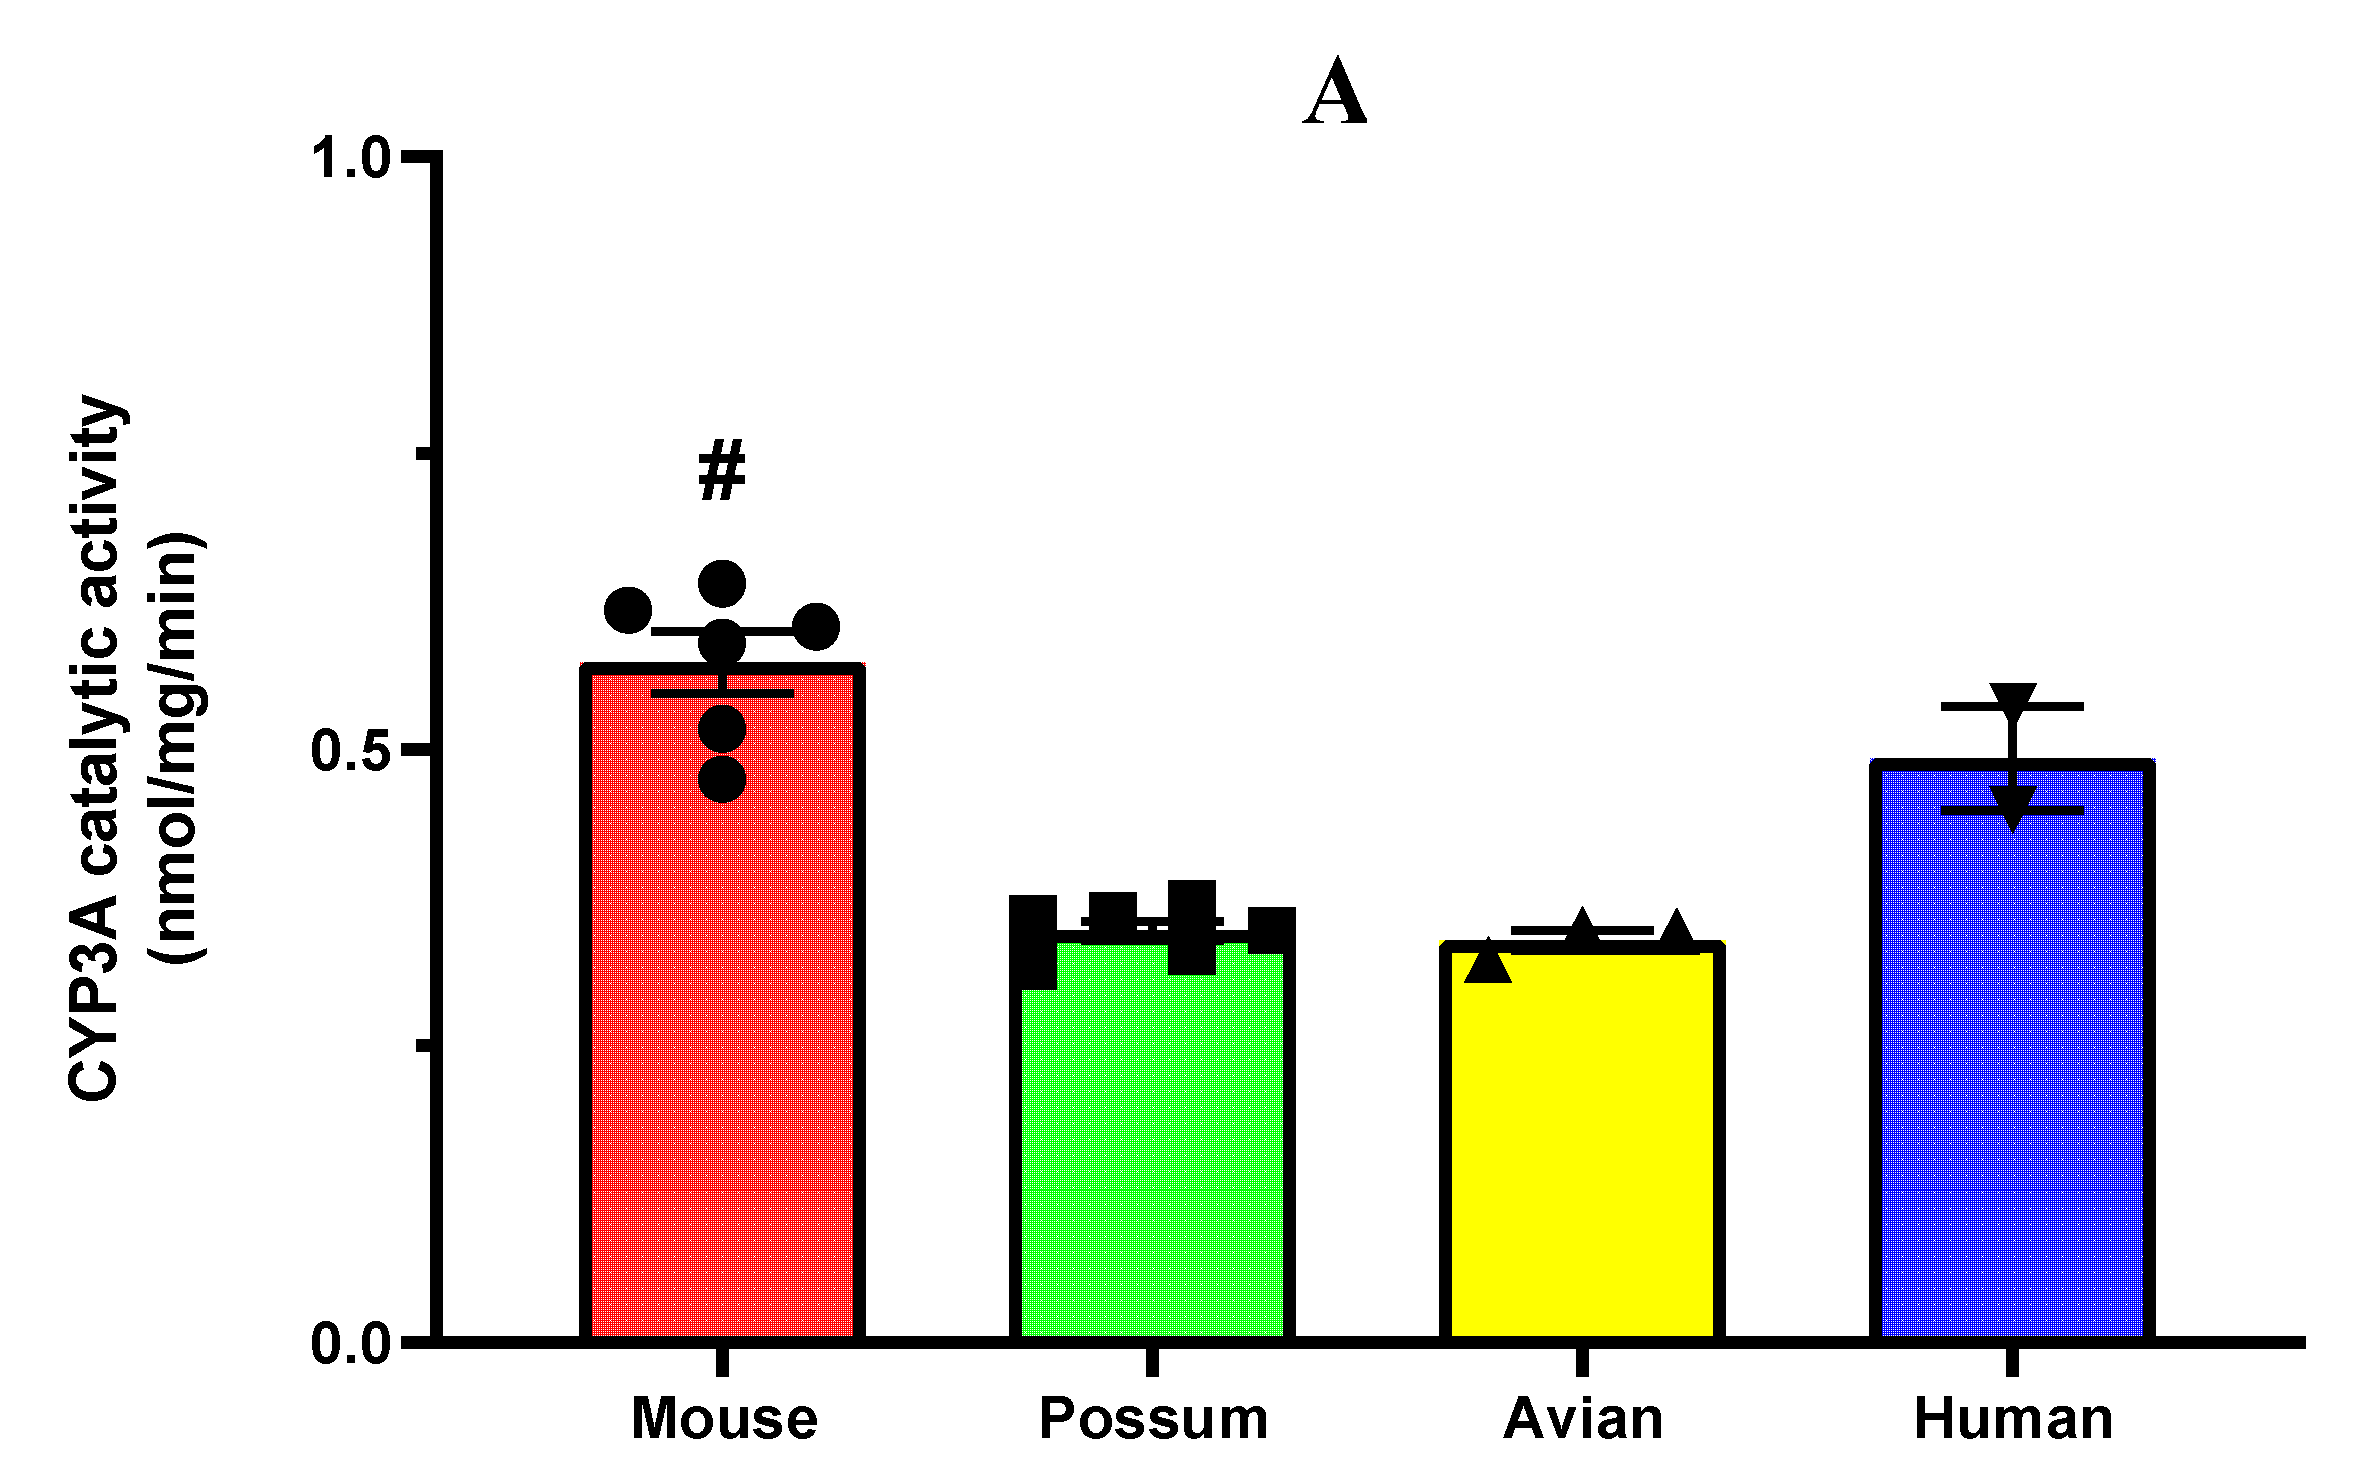
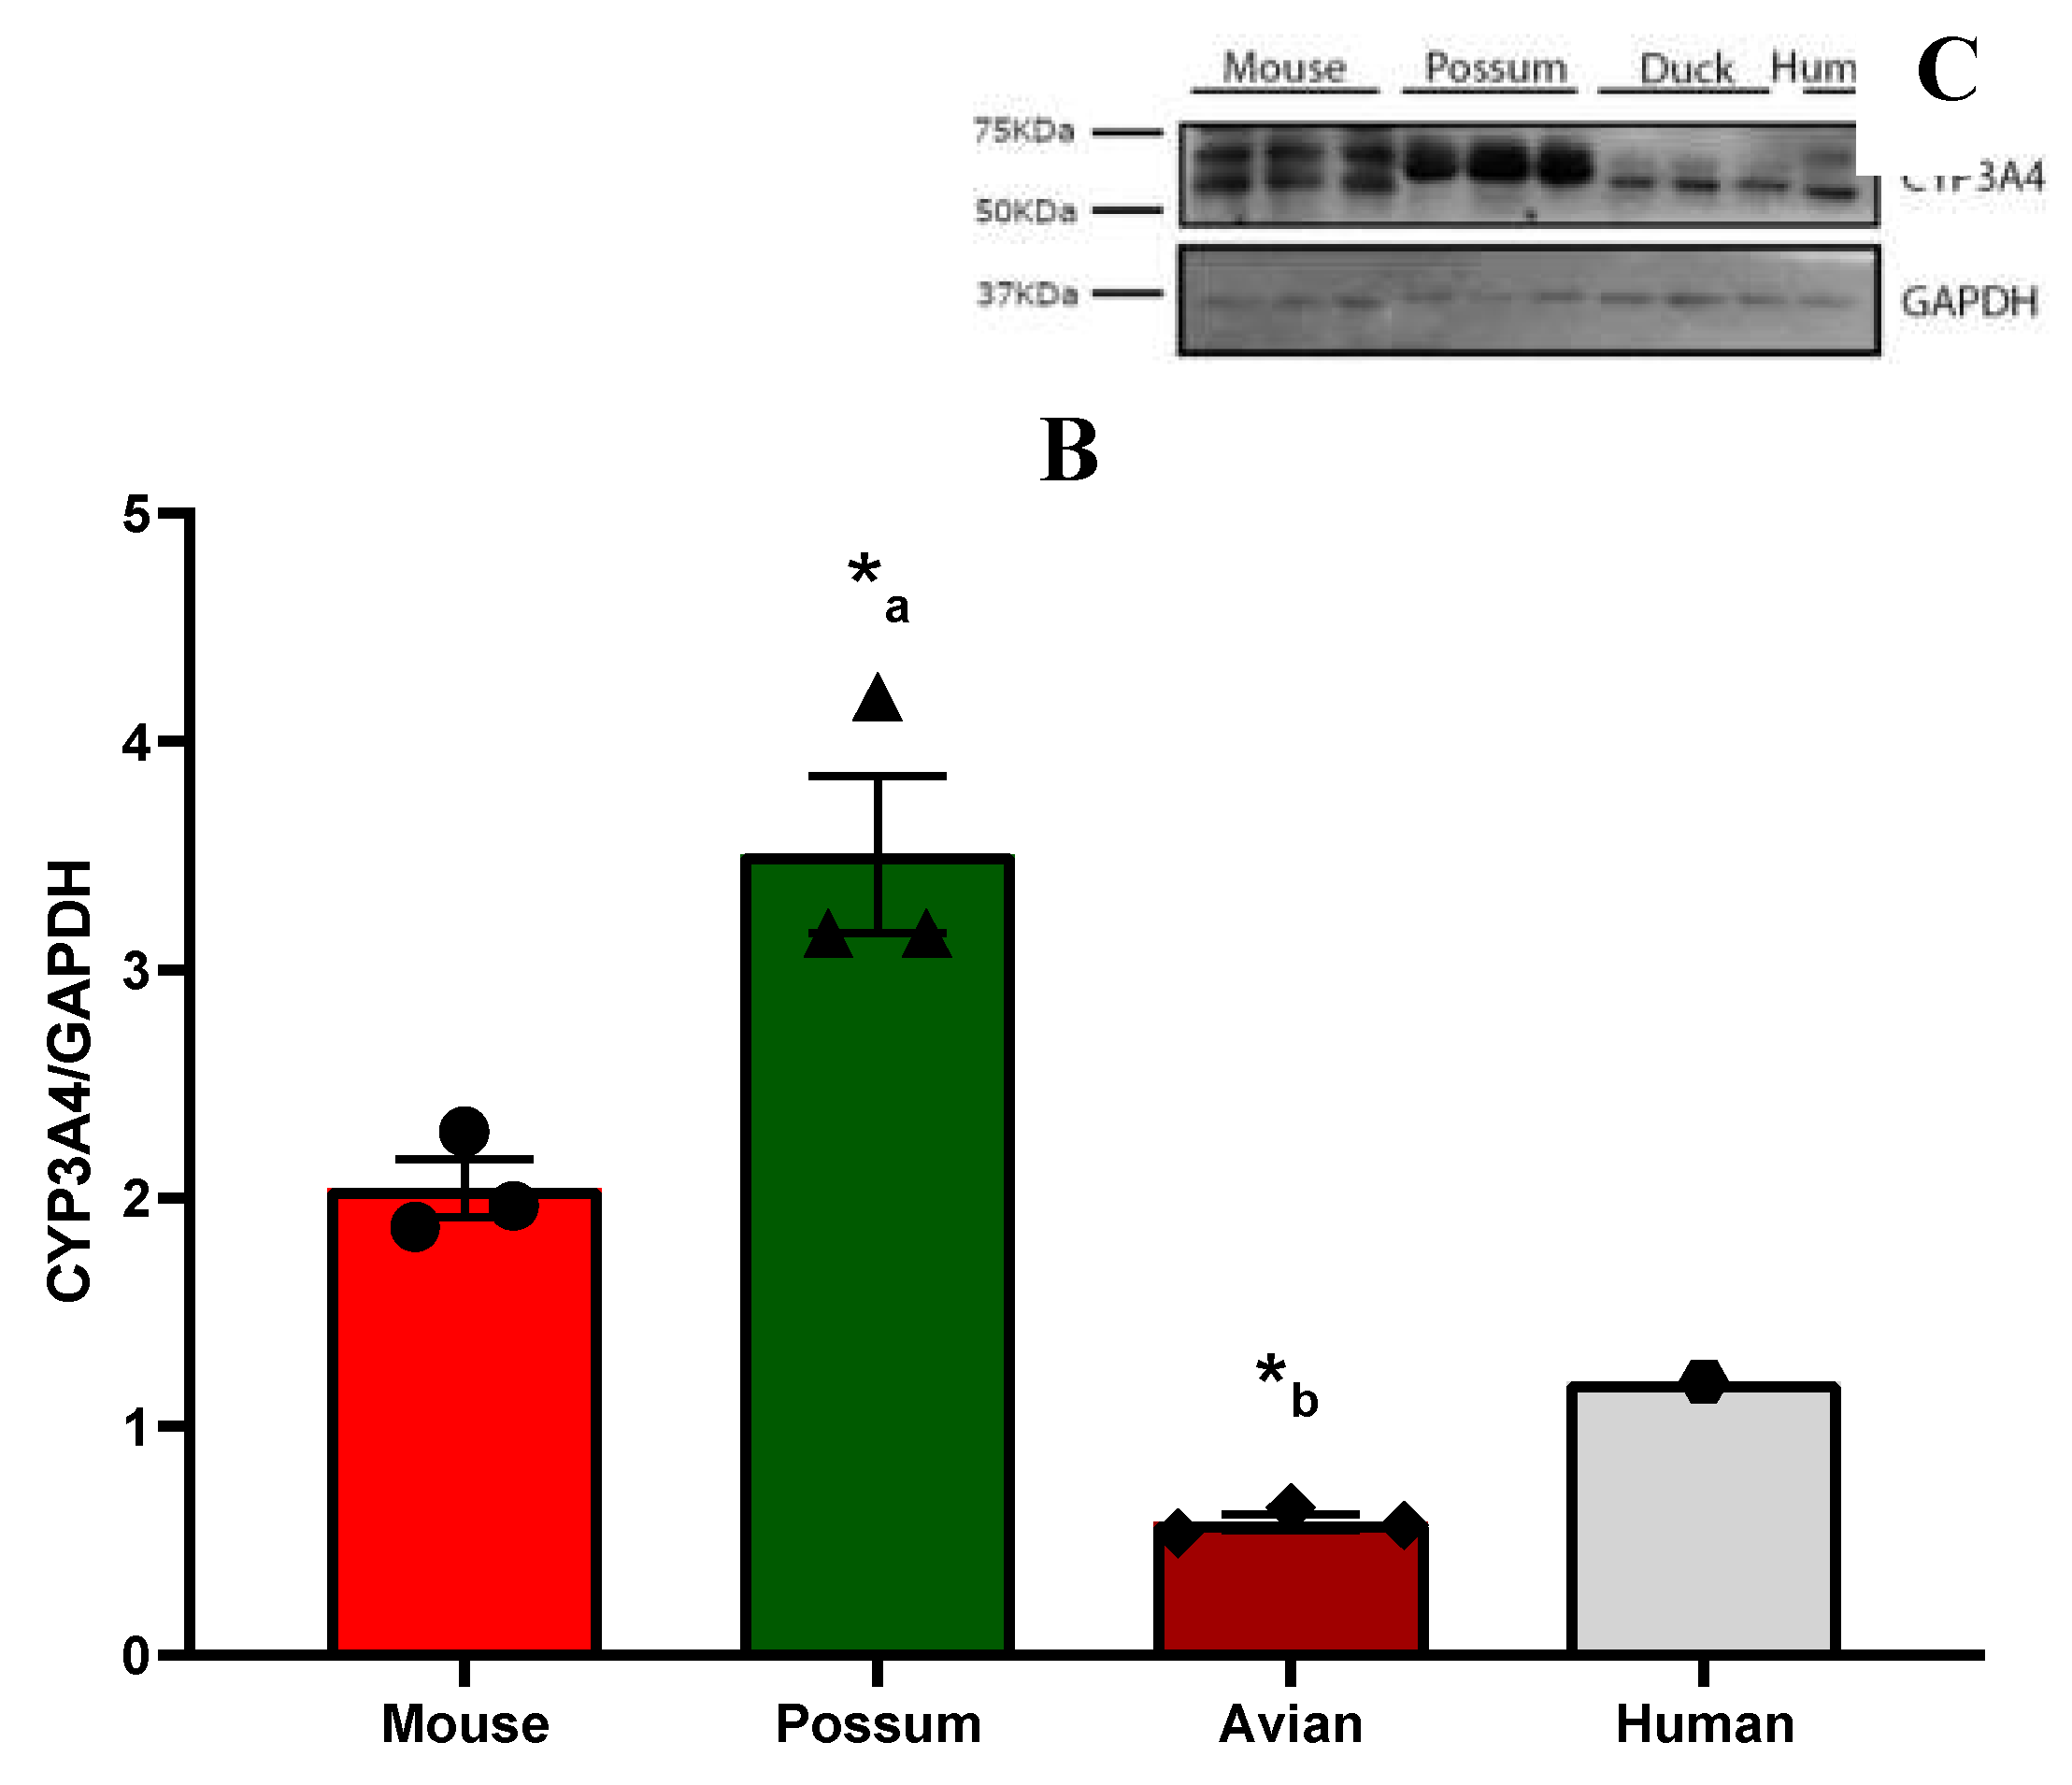
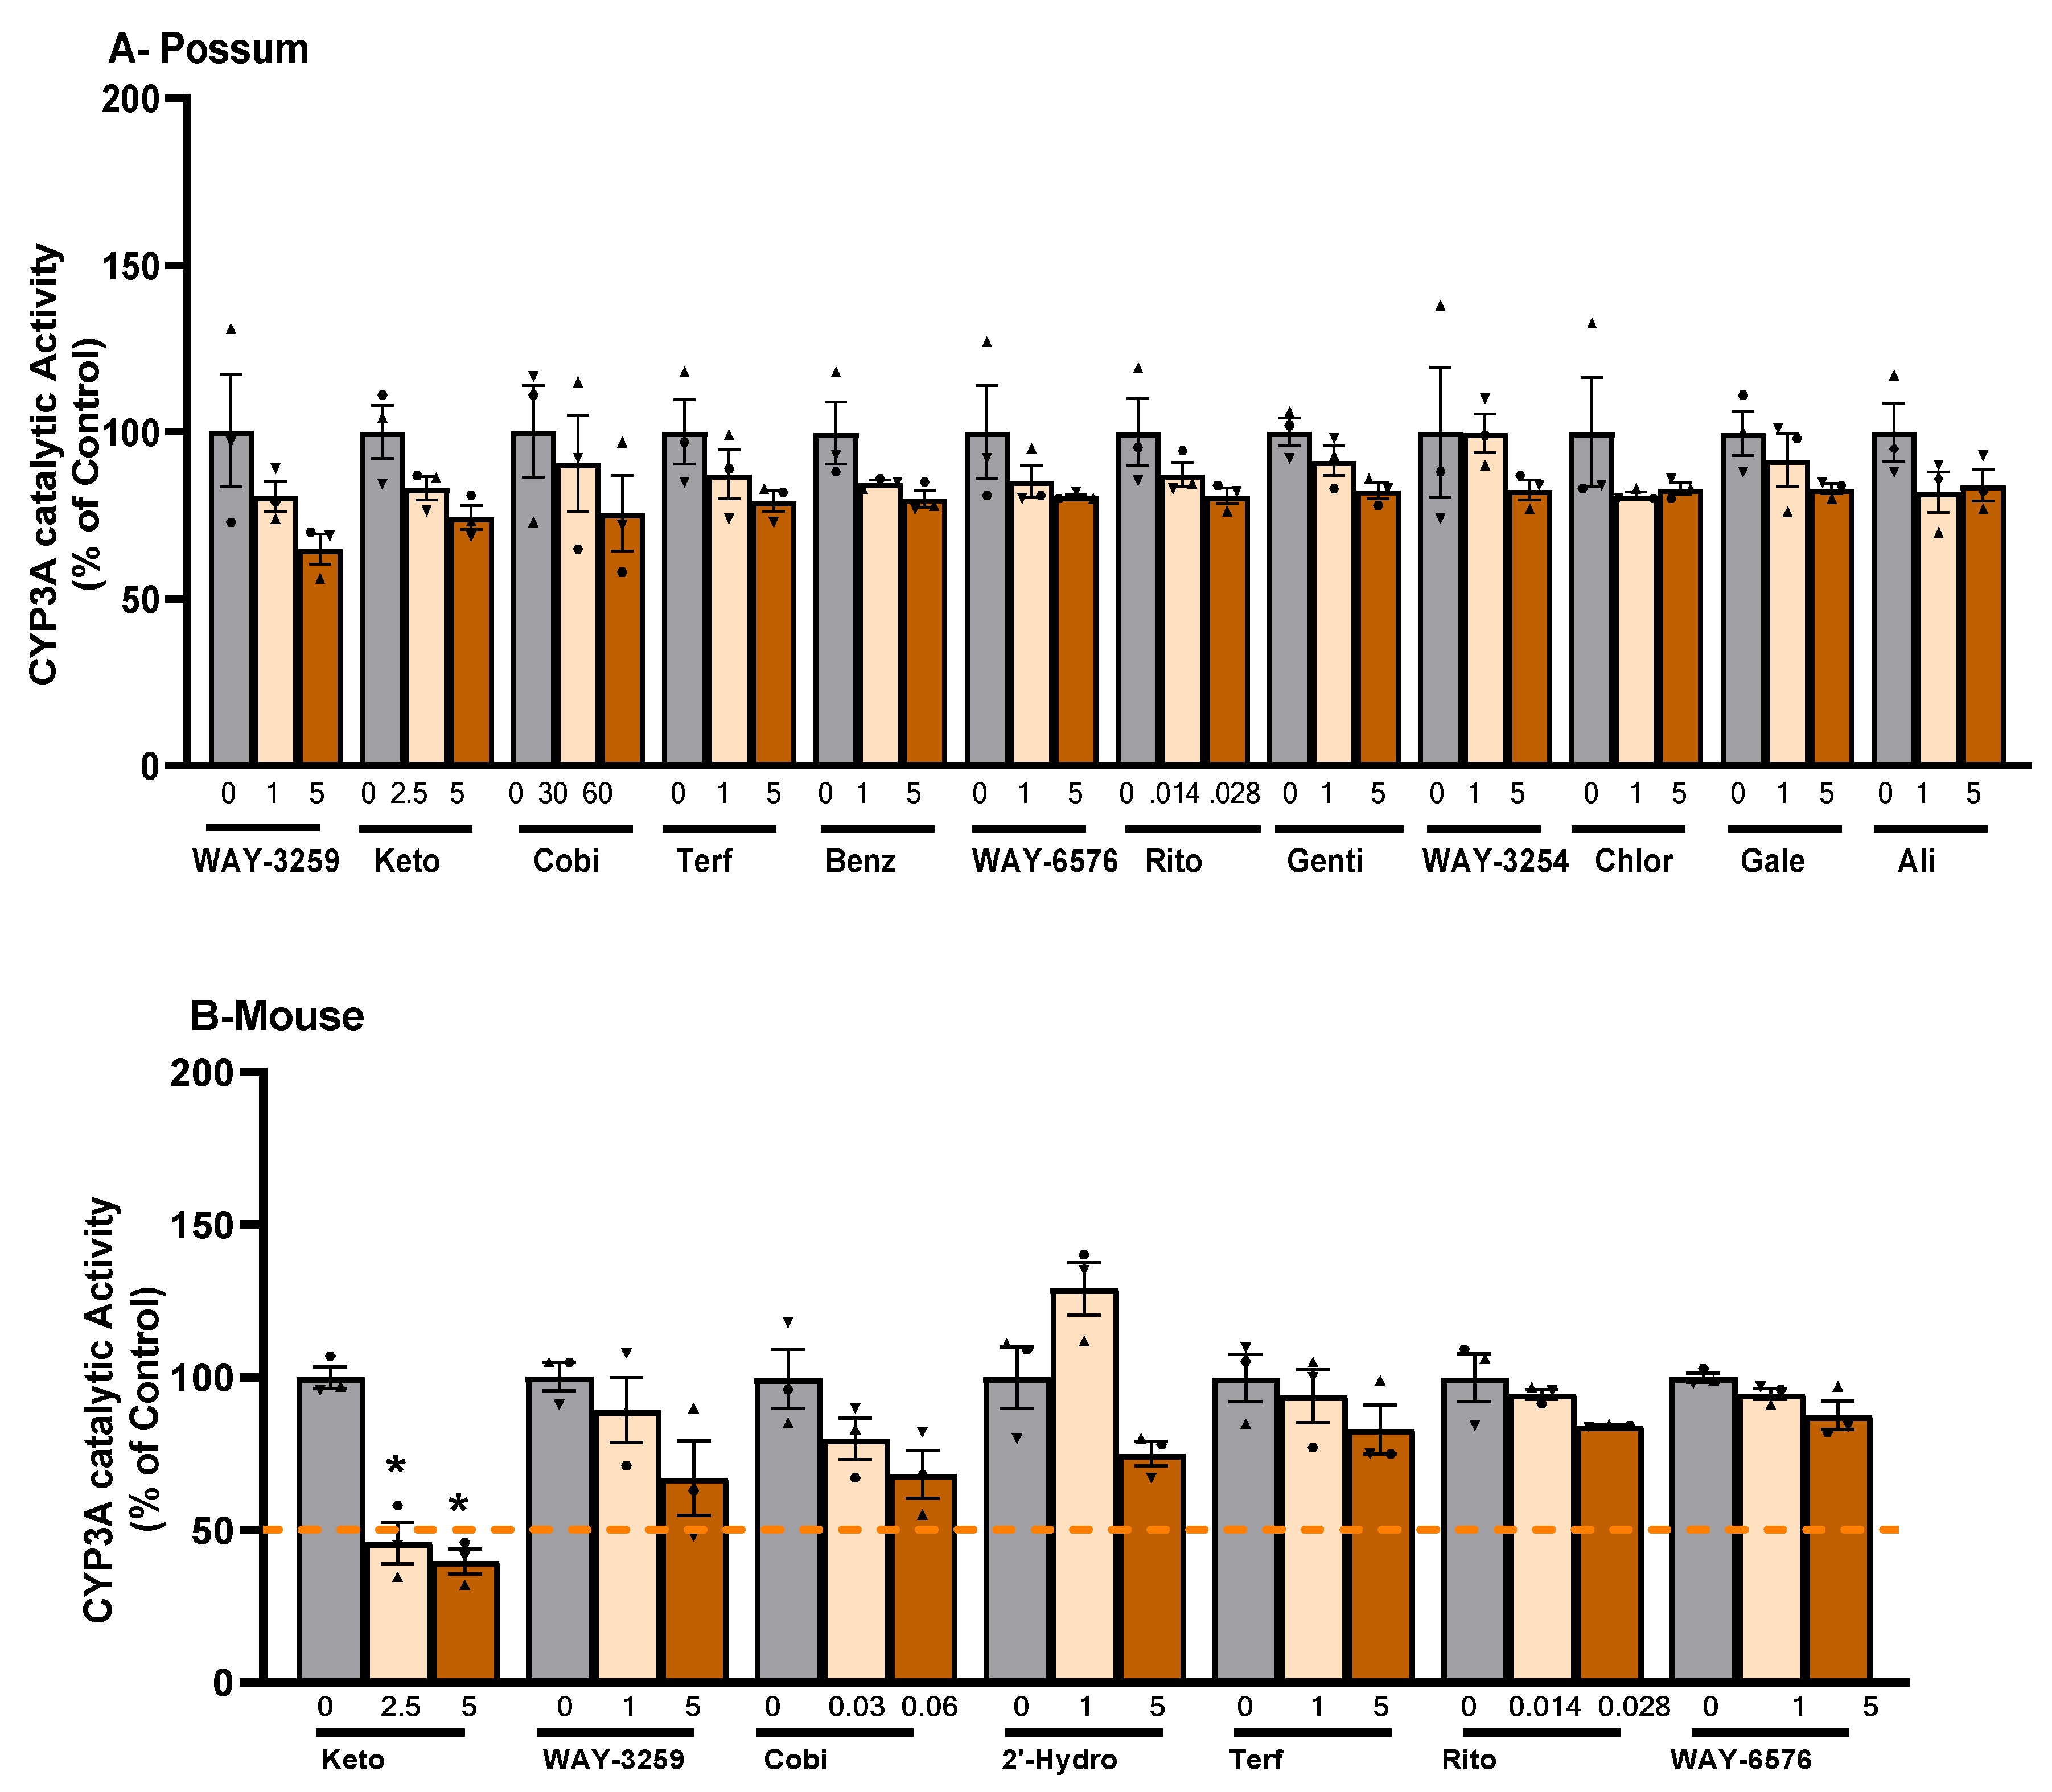
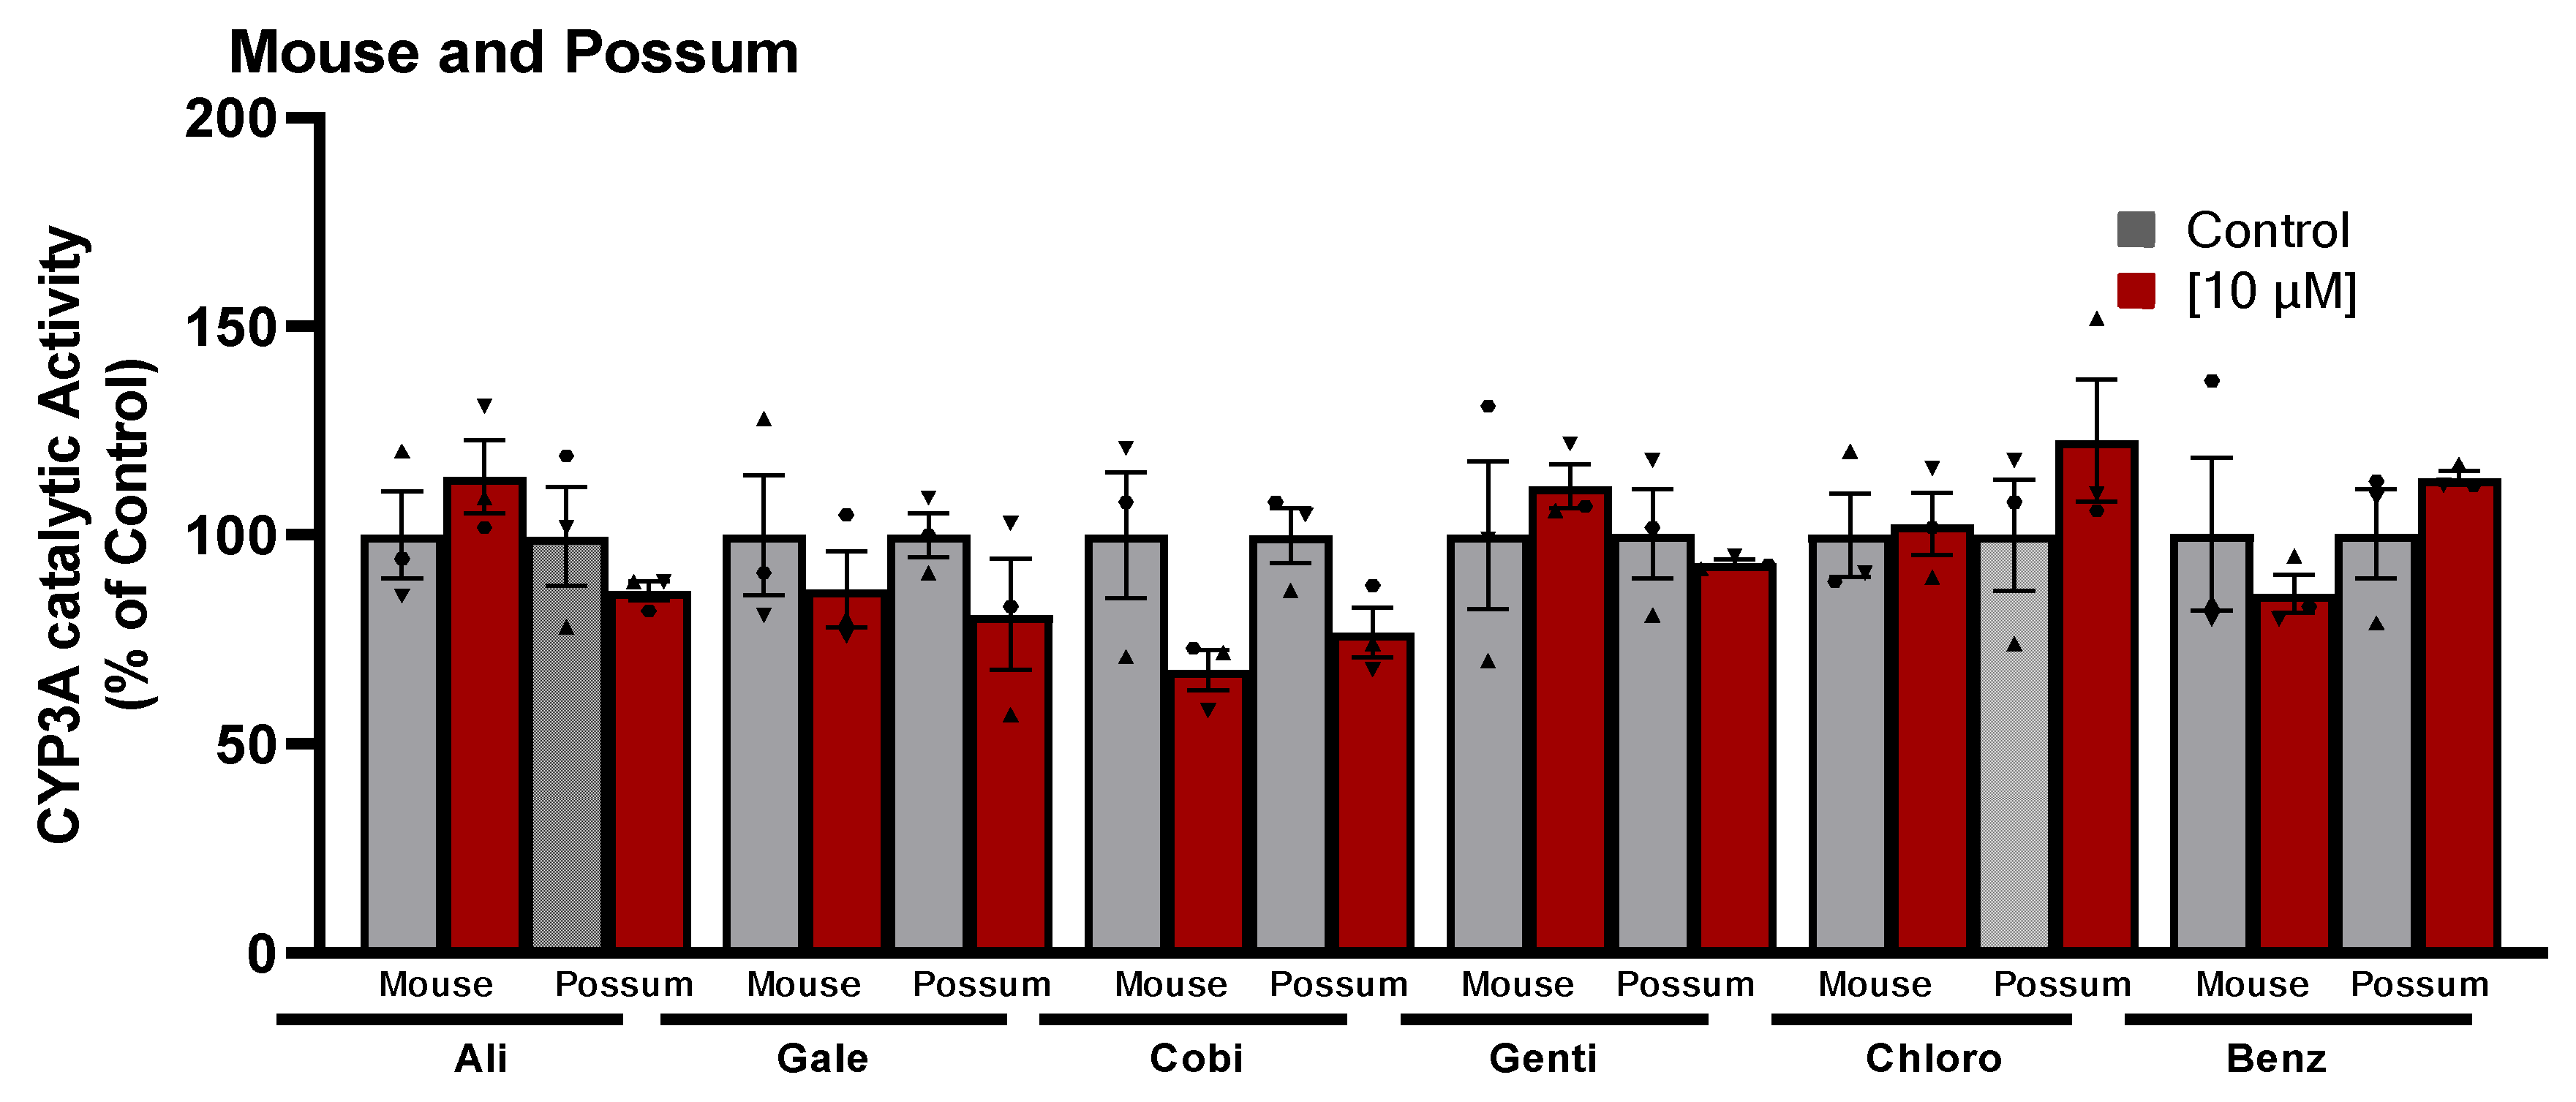
2.1. P-nitrophenol glucuronidation activity
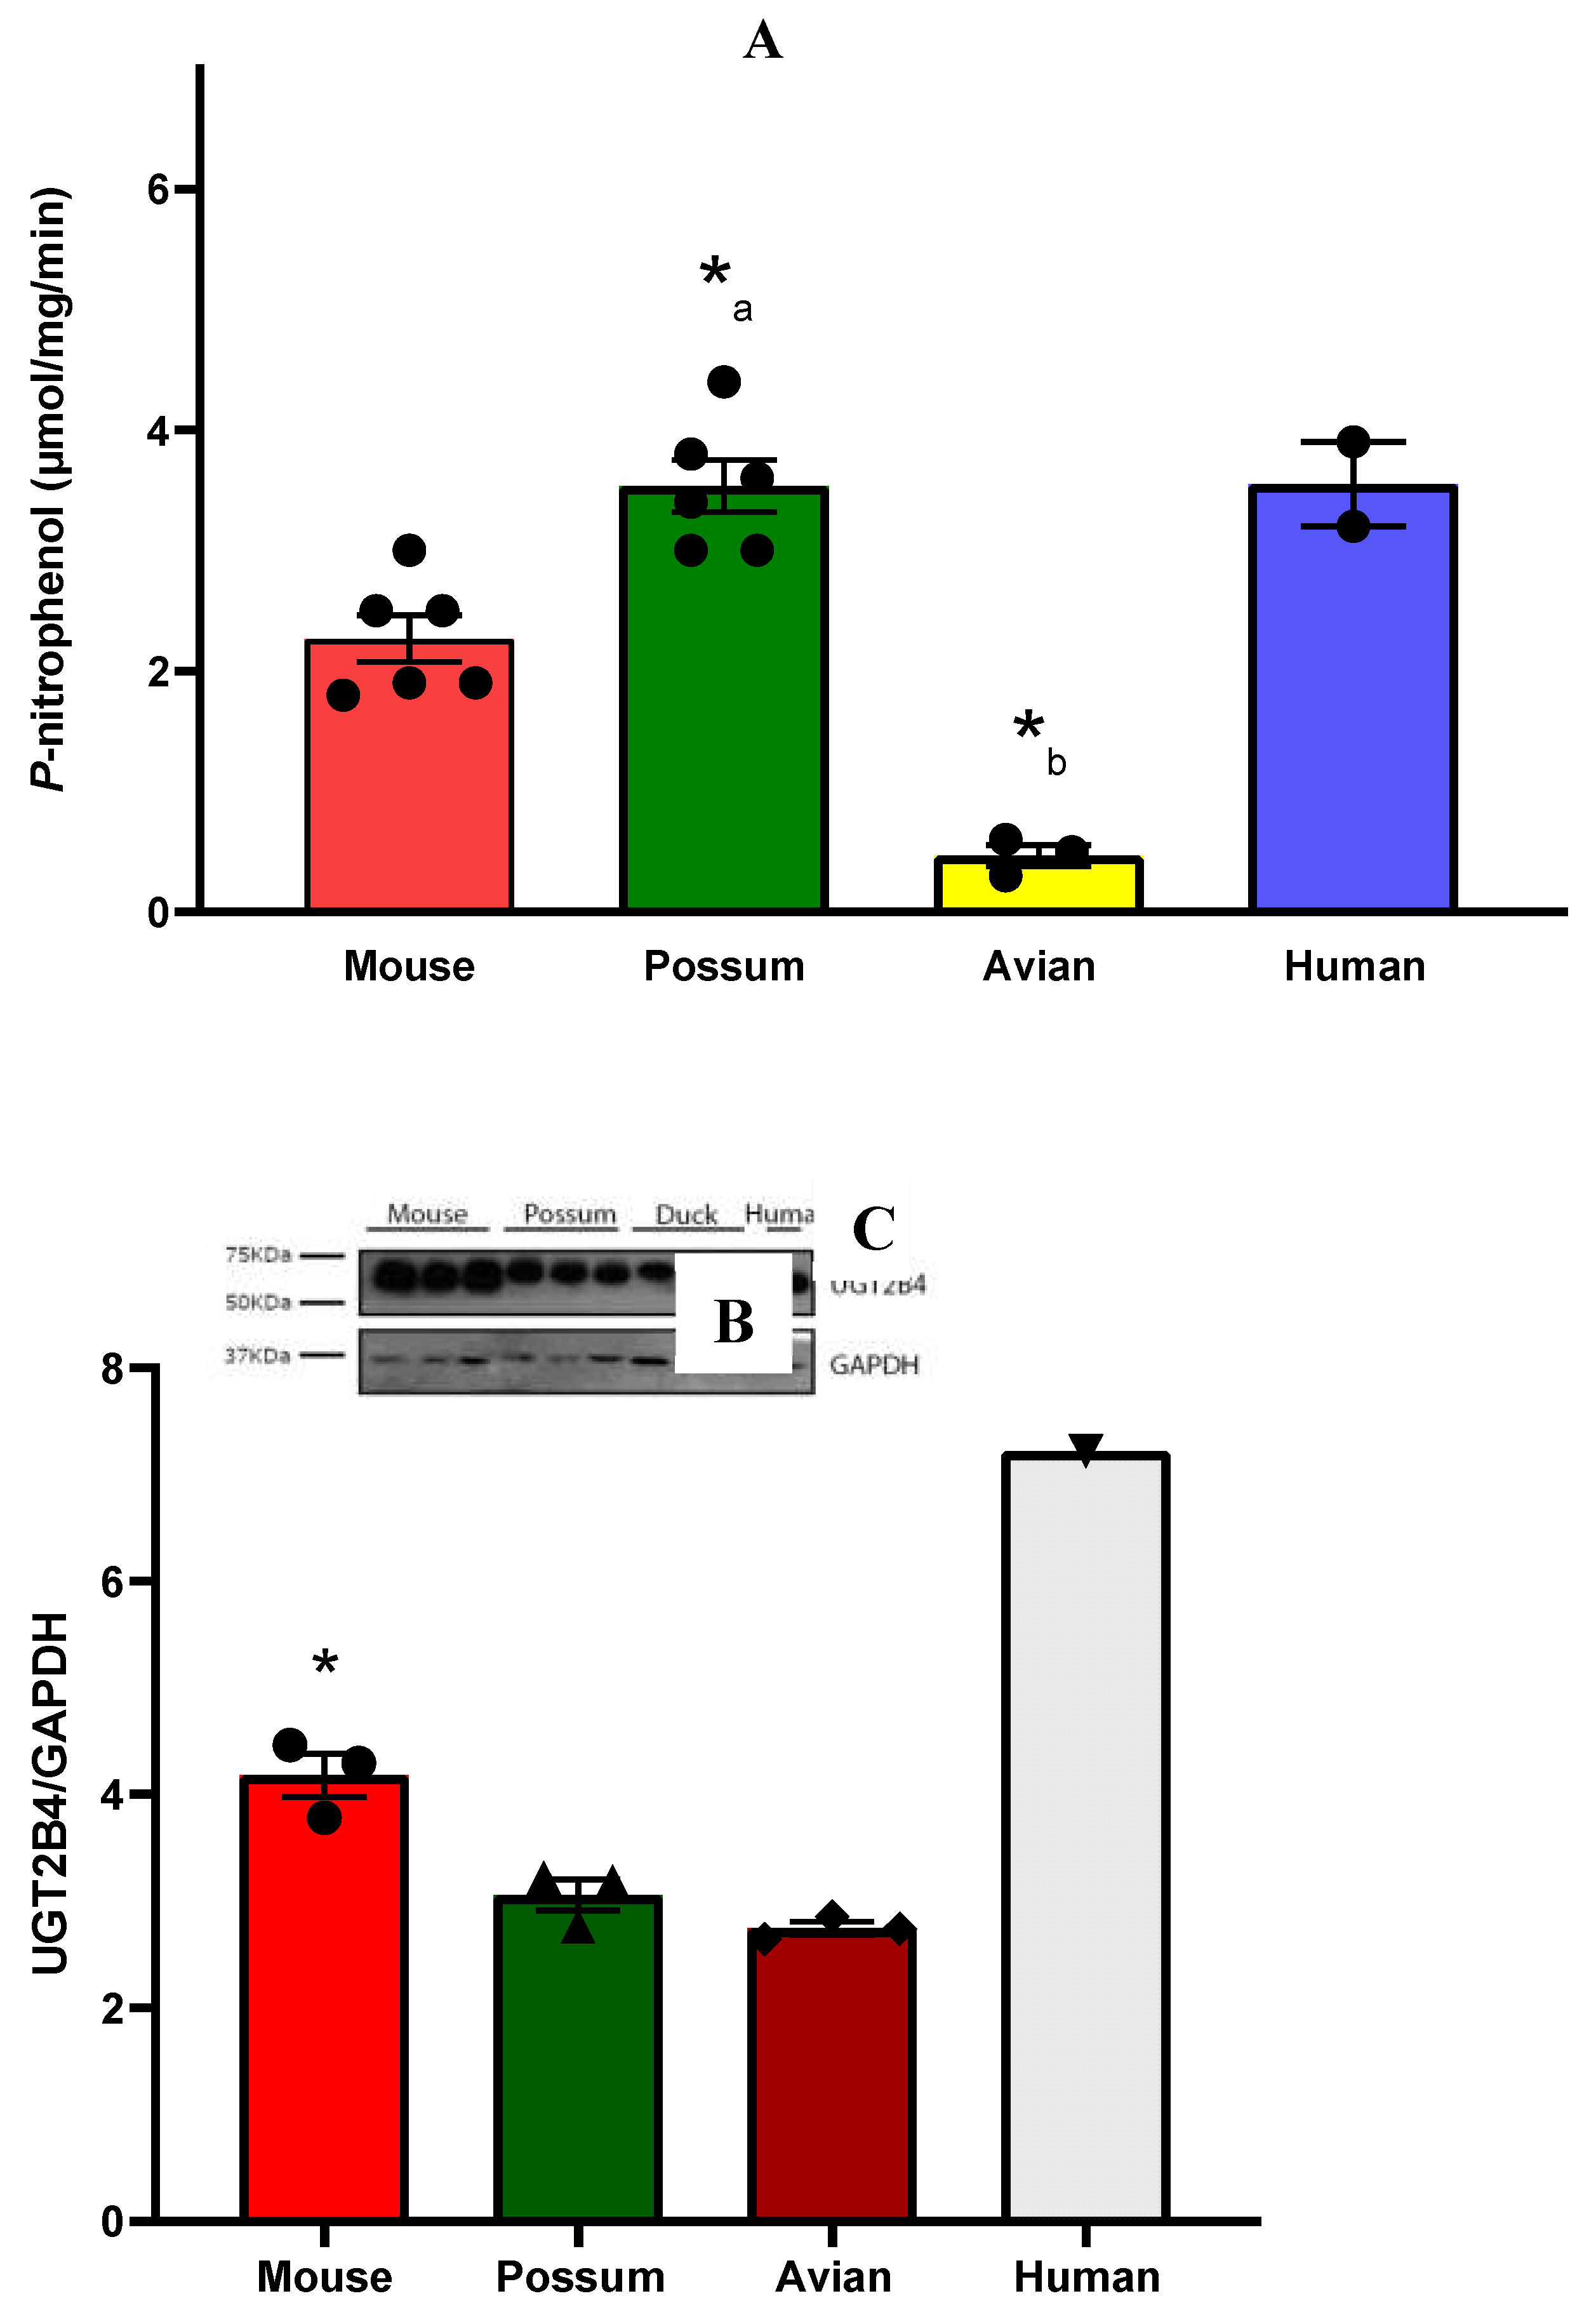

| Compound |
p-nitrophenol concentration |
Concentration (µM) | Glucuronidation activities+ | Percent of control |
|---|---|---|---|---|
| Isosilybin | 2.5 mM | 0 | 0.65±0.15 | 100 |
| 100 | 0.47±0.14 | 75 | ||
| 200 | 0.72±0.32 | 109 | ||
| Isosilybin | 1.25 mM | 0 | 0.30±0.07 | 100 |
| 100 | 0.15±0.01 | 56 | ||
| 200 | 0.17±0.02 | 70 | ||
| Isosilybin | 0.625 mM | 0 | 0.18±0.02 | 100 |
| 100 | 0.12±0.09 | 63 | ||
| 200 | 0.13±0.05 | 67 |
3. Discussion
3.1. CYP3A catalytic activity
3.2. P-nitrophenol glucuronidation activity
3.3. Understanding discrepancies in enzyme activity: Factors affecting CYP3A and UGT2B enzymes in species
4. Materials and Methods
4.1. Compound selection
4.2. Animals
4.3. Preparation of mouse, possum, and avian liver microsomes
4.4. CYP3A catalytic activity
4.5. Glucuronidation of p-nitrophenol
4.6. Western blotting
4.7. Statistical analysis
5. Conclusions
Supplementary Materials
Author Contributions
Funding
Institutional Review Board Statement
Informed Consent Statement
Data Availability Statement
Conflicts of Interest
References
- Owens, B. Behind New Zealand’s wild plan to purge all pests. Nature News 2017, 541, 148. [Google Scholar] [CrossRef]
- Chand, R.R.; Cridge, B.J. Upscaling Pest Management From Parks to Countries: A New Zealand Case Study. Journal of Integrated Pest Management 2020, 11, 1–12. [Google Scholar] [CrossRef]
- D’Arpe, S.; Di Feliciantonio, M.; Candelieri, M.; Franceschetti, S.; Piccioni, M.G.; Bastianelli, C. Ovarian function during hormonal contraception assessed by endocrine and sonographic markers: a systematic review. Reproductive Biomedicine Online 2016, 33, 436–448. [Google Scholar] [CrossRef] [PubMed]
- Liu, M.; Luo, R.; Wang, H.; Cao, G.; Wang, Y. Recovery of fertility in quinestrol-treated or diethylstilbestrol-treated mice: Implications for rodent management. Integrative Zoology 2017, 12, 250–259. [Google Scholar] [CrossRef] [PubMed]
- Christin-Maitre, S. History of oral contraceptive drugs and their use worldwide. Best Practice & Research Clinical Endocrinology & Metabolism 2013, 27, 3–12. [Google Scholar] [CrossRef]
- Hynes, E.F.; Handasyde, K.A.; Shaw, G.; Renfree, M.B. Levonorgestrel, not etonogestrel, provides contraception in free-ranging koalas. Reproduction, Fertility, and Development 2010, 22, 913–919. [Google Scholar] [CrossRef] [PubMed]
- Ballantyne, K.; Anderson, S.T.; Pyne, M.; Nicolson, V.; Mucci, A.; Lisle, A.; Johnston, S.D. The use of a synthetic progesterone, levonorgestrel (LNG), to control the oestrous cycle in the koala. Reproduction, Fertility, and Development 2015, 28, 1526–1532. [Google Scholar] [CrossRef] [PubMed]
- Kim, H.; Nakajima, T.; Hayashi, S.; Chambon, P.; Watanabe, H.; Iguchi, T.; Sato, T. Effects of diethylstilbestrol on programmed oocyte death and induction of polyovular follicles in neonatal mouse ovaries. Biology of Reproduction 2009, 81, 1002–1009. [Google Scholar] [CrossRef]
- Meyer, N.; Santamaria, C.G.; Müller, J.E.; Schumacher, A.; Rodriguez, H.A.; Zenclussen, A.C. Exposure to 17α-ethinyl estradiol during early pregnancy affects fetal growth and survival in mice. Environmental Pollution 2019, 251, 493–501. [Google Scholar] [CrossRef]
- Linhart, S.B.; Enders, R.K. Some effects of diethylstilbestrol on reproduction in captive red foxes. The Journal of Wildlife Management 1964, 358–363. [Google Scholar] [CrossRef]
- Harder, J.D.; Peterle, T.J. Effect of diethylstilbestrol on reproductive performance of white-tailed deer. The Journal of Wildlife Management 1974, 183–196. [Google Scholar] [CrossRef]
- Stegeman, B.H.; Vos, H.L.; Helmerhorst, F.M.; Rosendaal, F.R.; Reitsma, P.H.; van Hylckama Vlieg, A. Genetic variation in the first-pass metabolism of ethinylestradiol, sex hormone binding globulin levels and venous thrombosis risk. European Journal of Internal Medicine 2017, 42, 54–60. [Google Scholar] [CrossRef] [PubMed]
- Fotherby, K. Bioavailability of orally administered sex steroids used in oral contraception and hormone replacement therapy. Contraception 1996, 54, 59–69. [Google Scholar] [CrossRef] [PubMed]
- De Lignieres, B.; Basdevant, A.; Thomas, G.; Thalabard, J.C.; Mercier-Bodard, C.; Conard, J.; Guyene, T.T.; Mairon, N.; Corvol, P.; Guy-Grand, B.; et al. Biological effects of estradiol-17 beta in postmenopausal women: oral versus percutaneous administration. Journal of Clinical Endocrinology and Metabolism 1986, 62, 536–541. [Google Scholar] [CrossRef] [PubMed]
- Mahanur, V.; Rajge, R.; Tawar, M. A review on emerging oral dosage forms which helps to bypass the hepatic first pass metabolism. Asian Journal of Pharmacy Technology 2022, 12, 1–14. [Google Scholar] [CrossRef]
- Rhoda Lee, C. Drug interactions and hormonal contraception. Trends in Urology Gynacology and Sexual Health 2009, 14, 23–26. [Google Scholar] [CrossRef]
- Chand, R.R.; Nimick, M.; Cridge, B.; Rosengren, R.J. In vitro hepatic assessment of cineole and its derivatives in common brushtail possums (Trichosurus vulpecula) and rodents. Biology 2021, 10, 1326. [Google Scholar] [CrossRef]
- Hunt, C.M.; Westerkam, W.R.; Stave, G.M. Effect of age and gender on the activity of human hepatic CYP3A. Biochemical Pharmacology 1992, 44, 275–283. [Google Scholar] [CrossRef]
- Bland, A.R.; Shrestha, N.; Rosengren, R.J.; Ashton, J.C. Does Crizotinib Auto-Inhibit CYP3A in vivo? Pharmacology 2020, 105, 715–718. [Google Scholar] [CrossRef]
- Raynal, M.; Bailly, J.; Benard, G.; Guerre, P. Effects of fumonisin B1 present in Fusarium moniliforme culture material on drug metabolising enzyme activities in ducks. Toxicology letters 2001, 121, 179–190. [Google Scholar] [CrossRef]
- Sorensen, J.S.; Forbey, K.C.; Tanquay, R.L.; McLeod, B. Tissue distribution of cytochrome P450 3A (CYP3A) in brushtail possums (Trichosurus vulpecula) exposed to Eucalyptus terpenes. Comparative Biochemistry and Physiology Part C: Pharmacology, Toxicology and Endocrinology 2007, 145, 194–201. [Google Scholar] [CrossRef]
- Pass, G.J.; McLean, S. Inhibition of the microsomal metabolism of 1,8-cineole in the common brushtail possum (Trichosurus vulpecula) by terpenes and other chemicals. Xenobiotica 2002, 32, 1109–1126. [Google Scholar] [CrossRef] [PubMed]
- Iwata, H.; Tezuka, Y.; Kadota, S.; Hiratsuka, A.; Watabe, T. Identification and characterization of potent CYP3A4 inhibitors in Schisandra fruit extract. Drug Metabolism and Disposition 2004, 32, 1351–1358. [Google Scholar] [CrossRef]
- Hossain, M.A.; Tran, T.; Chen, T.; Mikus, G.; Greenblatt, D.J. Inhibition of human cytochromes P450 in vitro by ritonavir and cobicistat. Journal of Pharmacy and Pharmacology 2017, 69, 1786–1793. [Google Scholar] [CrossRef] [PubMed]
- Tsujimoto, M.; Horie, M.; Honda, H.; Takara, K.; Nishiguchi, K. The structure–activity correlation on the inhibitory effects of flavonoids on cytochrome P450 3A activity. Biological Pharmaceutical Bulletin 2009, 32, 671–676. [Google Scholar] [CrossRef]
- McLean, S.; Brandon, S.; Davies, N.W.; Boyle, R.; Foley, W.J.; Moore, B.; Pass, G.J. Glucuronuria in the Koala. Journal of Chemical Ecology 2003, 29, 1465–1477. [Google Scholar] [CrossRef] [PubMed]
- Lake, B.G.; Longland, R.C.; Harris, R.A.; Gangolli, S.D.; Rundle, A. The excretion of metabolites of the D-glucuronic acid pathway in human urine.: Effect of phenobarbitone administration. Xenobiotica 1982, 12, 241–247. [Google Scholar] [CrossRef]
- Valentine, S.P.; Le Nedelec, M.J.; Menzies, A.R.; Scandlyn, M.J.; Goodin, M.G.; Rosengren, R.J. Curcumin modulates drug metabolizing enzymes in the female Swiss Webster mouse. Life Sciences 2006, 78, 2391–2398. [Google Scholar] [CrossRef]
- Kuhn, U.D.; Rost, M.; Müller, D. Para-nitrophenol glucuronidation and sulfation in rat and human liver slices. Experimental and Toxicologic Pathology 2001, 53, 81–88. [Google Scholar] [CrossRef]
- Short, C.R.; Flory, W.; Hsieh, L.C.; Aranas, T.; Ou, S.P.; Weissinger, J. Comparison of hepatic drug metabolising enzyme activities in several agricultural species. Comparative Biochemistry and Physiology Part C: Comparative Pharmacology 1988, 91, 419–424. [Google Scholar] [CrossRef]
- Strassburg, C.; et al. Developmental aspects of human hepatic drug glucuronidation in young children and adults. Gut 2002, 50, 259–265. [Google Scholar] [CrossRef]
- Tanaka, E. Gender-related differences in pharmacokinetics and their clinical significance. Journal of Clinical Pharmacy and Therapeutics 1999, 24, 339–346. [Google Scholar] [CrossRef]
- Hu, D.G.; Mackenzie, P.I.; McKinnon, R.A.; Meech, R. Genetic polymorphisms of human UDP-glucuronosyltransferase (UGT) genes and cancer risk. Drug Metabolism Reviews 2016, 48, 47–69. [Google Scholar] [CrossRef] [PubMed]
- Zhao, W.; Meng, H. Effects of genetic polymorphism of drug-metabolizing enzymes on the plasma concentrations of antiepileptic drugs in Chinese population. Bioengineered 2022, 13, 7709–7745. [Google Scholar] [CrossRef] [PubMed]
- Toide, K.; et al. Hepatocyte nuclear factor-1alpha is a causal factor responsible for interindividual differences in the expression of UDP-glucuronosyltransferase 2B7 mRNA in human livers, (in eng). Drug Metabolism and Disposition 2002, 30, 613–615. [Google Scholar] [CrossRef]
- Abdullah, N.H.; Ismail, S. Inhibition of UGT2B7 enzyme activity in human and rat liver microsomes by herbal constituents. Molecules 2018, 23, 1–19. [Google Scholar] [CrossRef]
- Donato, M.T.; Montero, S.; Castell, J.V.; Gómez-Lechón, M.J.; Lahoz, A. Validated assay for studying activity profiles of human liver UGTs after drug exposure: inhibition and induction studies. Analytical and Bioanalytical Chemistry 2010, 396, 2251–2263. [Google Scholar] [CrossRef]
- Gufford, B.T.; Chen, G.; Lazarus, P.; Graf, T.N.; Oberlies, N.H.; Paine, M.F. Identification of diet-derived constituents as potent inhibitors of intestinal glucuronidation. Drug Metabolism and Disposition 2014, 42, 1675–1683. [Google Scholar] [CrossRef] [PubMed]
- Yerino, P.; Muranjan, S.; Ogilvie, B.W.; Buckley, D.B. The in vitro evaluation of ketoconazole and its alternative clinical CYP3a4/5 inhibitors (ritonavir, clarithromycin and itraconazole) as inhibitors of non-CYP enzymes. Available online: https://www.xenotech.com/wp-content/uploads/2020/05/ISSX_In-Vitro-Ketoconazole-Clinical-CYP3A45-Inhibitors-Ritonavir-Clarithromycin-Itraconazole-Non-CYP-Enzymes.pdf.
- Lamb, D.C.; Waterman, M.R.; Kelly, S.L.; Guengerich, F.P. Cytochromes P450 and drug discovery. Current Opinion in Biotechnology 2007, 18, 504–512. [Google Scholar] [CrossRef] [PubMed]
- Oda, S.; Fukami, T.; Yokoi, T.; Nakajima, M. A comprehensive review of UDP-glucuronosyltransferase and esterases for drug development. Drug Metabolism and Pharmacokinetics 2015, 30, 30–51. [Google Scholar] [CrossRef]
- Perloff, M.D.; von Moltke, L.L.; Kotegawa, T.; Shader, R.I.; Greenblatt, D.J. Midazolam and triazolam biotransformation in mouse and human liver microsomes: relative contribution of CYP3A and CYP2C isoforms. Journal of Pharmacology and Experimental Therapeutics 2000, 292, 618–628. [Google Scholar]
- Stresser, D.M.; Blanchard, A.P.; Turner, S.D.; Erve, J.C.; Dandeneau, A.A.; Miller, V.P.; Crespi, C.L. Substrate-dependent modulation of CYP3A4 catalytic activity: analysis of 27 test compounds with four fluorometric substrates. Drug Metabolism and Disposition 2000, 28, 1440–1448. [Google Scholar]
- Ueng, Y.F.; Kuwabara, T.; Chun, Y.J.; Guengerich, F.P. Cooperativity in oxidations catalyzed by cytochrome P450 3A4. Biochemistry 1997, 36, 370–381. [Google Scholar] [CrossRef]
- Tukey, R.H.; Strassburg, C.P. Human UDP-glucuronosyltransferases: metabolism, expression, and disease. Annual Review of Pharmacology Toxicology 2000, 40, 581–616. [Google Scholar] [CrossRef] [PubMed]
- Lv, X.; Zhang, J.-B.; Hou, J.; Dou, T.-Y.; Ge, G.-B.; Hu, W.-Z.; Yang, L. Chemical Probes for Human UDP-Glucuronosyltransferases: A Comprehensive Review. Biotechnology Journal 2019, 14, 1–47. [Google Scholar] [CrossRef]
- Izukawa, T.; Nakajima, M.; Fujiwara, R.; Yamanaka, H.; Fukami, T.; Takamiya, M.; Aoki, Y.; Ikushiro, S.-i.; Sakaki, T.; Yokoi, T. Quantitative analysis of UDP-glucuronosyltransferase (UGT) 1A and UGT2B expression levels in human livers. Drug Metabolism and Disposition 2009, 37, 1759–1768. [Google Scholar] [CrossRef] [PubMed]
- Court, M.H.; Zhang, X.; Ding, X.; Yee, K.K.; Hesse, L.M.; Finel, M. Quantitative distribution of mRNAs encoding the 19 human UDP-glucuronosyltransferase enzymes in 26 adult and 3 fetal tissues. Xenobiotica 2012, 42, 266–277. [Google Scholar] [CrossRef]
- Ohno, S.; Nakajin, S. Determination of mRNA expression of human UDP-glucuronosyltransferases and application for localization in various human tissues by real-time reverse transcriptase-polymerase chain reaction. Drug Metabolism and Disposition 2009, 37, 32–40. [Google Scholar] [CrossRef] [PubMed]
- Jiang, H.-M.; Fang, Z.-Z.; Cao, Y.-F.; Hu, C.-M.; Sun, X.-Y.; Hong, M.; Yang, L.; Ge, G.-B.; Liu, Y.; Zhang, Y.-Y. , et al. New insights for the risk of bisphenol A: Inhibition of UDP-glucuronosyltransferases (UGTs). Chemosphere 2013, 93, 1189–1193. [Google Scholar] [CrossRef]
- Wang, D.; Guo, Y.; Wrighton, S.A.; Cooke, G.E.; Sadee, W. Intronic polymorphism in CYP3A4 affects hepatic expression and response to statin drugs. The Pharmacogenomics Journal 2011, 11, 274–286. [Google Scholar] [CrossRef]
- Wang, D.; Sadee, W. CYP3A4 intronic snp rs35599367 (CYP3A4* 22) alters RNA splicing. Pharmacogenetics and Genomics 2016, 26, 1–7. [Google Scholar] [CrossRef] [PubMed]
- Özdemir, V.; Kalow, W.; Tang, B.-K.; Paterson, A.D.; Walker, S.E.; Endrenyi, L.; Kashuba, A.D.M. Evaluation of the genetic component of variability in CYP3A4 activity: a repeated drug administration method. Pharmacogenetics 2000, 10, 373–388. [Google Scholar] [CrossRef]
- Klein, K.; Zanger, U.M. Pharmacogenomics of Cytochrome P450 3A4: Recent Progress Toward the "Missing Heritability" Problem. Frontiers in Genetics 2013, 4, 1–15. [Google Scholar] [CrossRef] [PubMed]
- Rebbeck, T.R.; Jaffe, J.M.; Walker, A.H.; Wein, A.J.; Malkowicz, S.B. Modification of Clinical Presentation of Prostate Tumors by a Novel Genetic Variant in CYP3A4. Journal of the National Cancer Institute 1998, 90, 1225–1229. [Google Scholar] [CrossRef] [PubMed]
- Werk, A.N.; Cascorbi, I. Functional Gene Variants of CYP3A4. Clinical Pharmacology & Therapeutics 2014, 96, 340–348. [Google Scholar] [CrossRef]
- Kliewer, S.A.; Goodwin, B.; Willson, T.M. The Nuclear Pregnane X Receptor: A Key Regulator of Xenobiotic Metabolism. Endocrine Reviews 2002, 23, 687–702. [Google Scholar] [CrossRef]
- Riffel, A.K.; Schuenemann, E.; Vyhlidal, C.A. Regulation of the CYP3A4 and CYP3A7 promoters by members of the nuclear factor I transcription factor family. Molecular Pharmacology 2009, 76, 1104–1114. [Google Scholar] [CrossRef]
- Bolton, R.; Ahokas, J. Mixed function oxidases in an Australian marsupial, the brushtail possum (Trichosurus vulpecula). Archives of Environmental Contamination Toxicology 1997, 33, 83–89. [Google Scholar] [CrossRef]
- Lim, Y.-P.; Kuo, S.-C.; Lai, M.-L.; Huang, J.-D. Inhibition of CYP3A4 expression by ketoconazole is mediated by the disruption of pregnane X receptor, steroid receptor coactivator-1, and hepatocyte nuclear factor 4α interaction. Pharmacogenetics and Genomics 2009, 19, 11–24. [Google Scholar] [CrossRef]
- Kocarek, T.A.; Schuetz, E.G.; Strom, S.C.; Fisher, R.A.; Guzelian, P.S. Comparative analysis of cytochrome P4503A induction in primary cultures of rat, rabbit, and human hepatocytes. Drug Metabolism Disposition 1995, 23, 415–421. [Google Scholar]
- De Wildt, S.N.; Kearns, G.L.; Leeder, J.S.; van den Anker, J.N. Cytochrome P450 3A: ontogeny and drug disposition. Clinical Pharmacokinetics 1999, 37, 485–505. [Google Scholar] [CrossRef] [PubMed]
- Warrington, J.S.; Greenblatt, D.J.; von Moltke, L.L. Age-related differences in CYP3A expression and activity in the rat liver, intestine, and kidney. Journal of Pharmacology Experimental Therapeutics 2004, 309, 720–729. [Google Scholar] [CrossRef]
- Wolbold, R.; Klein, K.; Burk, O.; Nüssler, A.K.; Neuhaus, P.; Eichelbaum, M.; Schwab, M.; Zanger, U.M. Sex is a major determinant of CYP3A4 expression in human liver. Liver Failure and Liver Disease 2003, 38, 978–988. [Google Scholar] [CrossRef]
- El-Merhibi, A.; Ngo, S.N.; Crittenden, T.A.; Marchant, C.L.; Stupans, I.; McKinnon, R.A. Cytochrome P450 CYP3A in marsupials: cloning and characterisation of the second identified CYP3A subfamily member, isoform 3A78 from koala (Phascolarctos cinereus). Comparative Biochemistry and Physiology C 2011, 154, 367–376. [Google Scholar] [CrossRef] [PubMed]
- Stern, S.T.; Tallman, M.N.; Miles, K.K.; Ritter, J.K.; Dupuis, R.E.; Smith, P.C. Gender-related differences in mycophenolate mofetil-induced gastrointestinal toxicity in rats. Drug Metabolism and Disposition 2007, 35, 449–454. [Google Scholar] [CrossRef]
- Takeuchi, T.; Tsutsumi, O.; Nakamura, N.; Ikezuki, Y.; Takai, Y.; Yano, T.; Taketani, Y. Gender difference in serum bisphenol A levels may be caused by liver UDP-glucuronosyltransferase activity in rats. Biochemical and Biophysical Research Communications 2004, 325, 549–554. [Google Scholar] [CrossRef]
- Muraca, M.; Fevery, J. Influence of sex and sex steroids on bilirubin uridine diphosphate-glucuronosyltransferase activity of rat liver. Gastroenterology 1984, 87, 308–313. [Google Scholar] [CrossRef]
- Shu, Y.-Z.; Johnson, B.M.; Yang, T.J. Role of biotransformation studies in minimizing metabolism-related liabilities in drug discovery. The AAPS journal 2008, 10, 178–192. [Google Scholar] [CrossRef]
- Lake, B.G. Preparation and characterization of microsomal fractions for studies on xenobiotic metabolism. In Biochemical Toxicology: A Practical Approach, Snell, K., Mullock, B., Eds. IRL Press: Oxford, 1987; pp. 183–215.
- Smith, P.e.; Krohn, R.I.; Hermanson, G.T.; Mallia, A.K.; Gartner, F.H.; Provenzano, M.; Fujimoto, E.K.; Goeke, N.M.; Olson, B.J.; Klenk, D. Measurement of protein using bicinchoninic acid. Analytical biochemistry 1985, 150, 76–85. [Google Scholar] [CrossRef]
- Kitada, M.; Igoshi, N.; Kamataki, T.; Itahashi, K.; Imaoka, S.; Komori, M.; Funae, Y.; Rikihisa, T.; Kanakubo, Y. Immunochemical similarity of P-450 HFLa, a form of cytochrome P-450 in human fetal livers, to a form of rat liver cytochrome P-450 inducible by macrolide antibiotics. Archives of Biochemistry and Biophysics 1988, 264, 61–66. [Google Scholar] [CrossRef]
- Fowler, B.; Kleinow, K.; Squibb, K.; Lucier, G.; Hayes, A. Organelles as tools in toxicology. In Principles of Clinical Toxicology, A.W, H., Ed. CRC Press: New York, UK, 1994; pp. 1201–1230.
- Henderson, P.T.; Kersten, K.J. Metabolism of drugs during rat liver regeneration. Biochemical Pharmacology 1970, 19, 2343–2351. [Google Scholar] [CrossRef] [PubMed]
- Towbin, H. Electrophoretic transfer of proteins from sodium dodecyl sulfate-polyacrylamide gels to unmodified nitrocellulose and radiographic detection with antibody and radioiodinated protein. Analytical Biochemistry 1979, 112, 195–203. [Google Scholar]
Disclaimer/Publisher’s Note: The statements, opinions and data contained in all publications are solely those of the individual author(s) and contributor(s) and not of MDPI and/or the editor(s). MDPI and/or the editor(s) disclaim responsibility for any injury to people or property resulting from any ideas, methods, instructions or products referred to in the content. |
© 2023 by the authors. Licensee MDPI, Basel, Switzerland. This article is an open access article distributed under the terms and conditions of the Creative Commons Attribution (CC BY) license (http://creativecommons.org/licenses/by/4.0/).


