

Submitted:
12 June 2023
Posted:
15 June 2023
Read the latest preprint version here
Abstract
Purpose: This research, compared the dissociated phoria state at near and distance fixation in free space, using three different techniques; the Howell test, alternate Cover test and Thorington test. Methods: A total of 220 healthy Mexican children from Querétaro, 5.06 to 17.11 years of age, participated in this study. The magnitude of phorias at both distances was quantified using each of the tests, starting from the least to the most disruptive one. The degree of stereopsis, break, and recovery value of the near point of convergence were also analyzed to understand the interaction among them and their impact on the sensorimotor balance of the visual system. Results: Despite their different ways of dissociation, for patients with exophoria or esophoria at near, the alternate Cover test and Thorington provide similar values. If examining the exophoria state at distance, the alternate Cover and Howell test are similar, whereas for the esophoria, the alternate Cover and Thorington give similar results. The break value and the magnitude of exophoria at near can predict the stereopsis degree. The break value and the magnitude of exophoria are related to each other. Gender doesn´t relate to any variable, whereas age, is associated with the degree of stereopsis and the break of NPC. Conclusions: The statistical analysis showed that the alternate Cover and Thorington test, despite their different ways of dissociation, can substitute one another, whereas the Howell test, cannot be interchangeable with the other two. The different way of dissociation this test uses, can be related to the obtained results. By analyzing the crucial elements of the binocular visual system, can help professionals determine the interaction among them and their impact on its sensorimotor balance.
Keywords:
visual function
; Howell test
; alternate Cover test
; Thorington test
; dissociated phoria state
; break value of near point of convergence
; degree of stereopsis
1. Introduction
The phoria state describes the misalignment of the visual axes elicited when fusion is artificially disrupted, by using an occluder, the Maddox rod, or a vertical prism. Commonly, two visual conditions can be found during the evaluation of the phoria state of a patient: a high or a low tonic vergence, known as esophoria and exophoria [1,2]. The binocular state can be affected by the ability of the visual system to compensate the magnitude of exophoria, or esophoria measured during the evaluation, by interrupting the sensorimotor balance and its performance [3]. Our ability to perceive the three-dimensional space, ocular movements, vergence flexibility, relationship between the accommodation and vergence system, visual-motor integration skills etc., can be affected by the phoria state [4]. High magnitude of phorias can result in tropias (strabismus, such as exo or esotropia), being diplopia the first symptom of the decompensated phoria state [5,6]. Double vision occurs as the visual cortex cannot suppress the image of the deviated eye immediately, which results in constant suppression, as the best visual-cortical adaptation to avoid diplopia [7]. Research suggests that the phoria levels can change throughout the day, depending on the amount of effort on a sustained visual task and that cerebellar cortex mediates the phoria adaptation, and some aspects of learning [8]. Therefore, its assessments, becomes critical, even more in children, where the neural plasticity allows rapid visual-cortical adaptations, and their neurological development is influenced by the environment and the context they live in [9]. In the field of visual health professionals, different clinical techniques exist to quantify the magnitude of the phoria in free space at distance and near. This research, compared the dissociated phoria state at near and distance fixation in free space, using three different techniques: the Howell test, alternate Cover test, and Thorington test. Each of these techniques presents a different degree of dissociation, being Howell test, the least disruptive test [2]. To evaluate the horizontal phoria, for the Howell test, a vertical prism is used to disrupt binocularity, a translucent occluder is needed for the alternate Cover test and a red Maddox rod for the Thorington test. To find differences and similarities among them, the magnitude of phorias at near and distance were compared using parametric and non-parametric tests through the alternate Cover test, Howell test, and Thorington test. Previous studies on the comparison of near-dissociated phoria state in free space exist, being these evaluations mostly performed in adults [10,11,12]. It is the first time that the phoria state from a large sample of Mexican children (220 participants, mean age 8.3 ± 2.5 years), and their binocular state is examined and compared to other ethnicities, generating new scientific data.
The Thorington test which has been compared to the alternate Cover test, von Graefe technique, and Maddox test, is not interchangeable with any of them, and any relationships found, were from medium to low [11,12].
Additionally, in this research, a complete visual efficacy exam was performed and data about the degree of stereopsis, break, and recovery of the near point of convergence, visual acuity at distance and near, refractive status and flat fusion at both distances were also analyzed. A detailed statistical analysis on the visual performance of participants was carried out, and the interaction among variables allowed a better understanding of the binocular efficacy and the sensorimotor balance of the visual system during childhood.
2. Methodology
This research, compared the dissociated phoria state at near and distance fixation in free space, using three different techniques: the Howell test, alternate Cover test and Thorington test. A total of 220 healthy patients from Querétaro, México, participated in this study: 132 males (60%) and 88 females (40%), mean age 8.3 ± 2.5 years. Patients with strabismus, amblyopia, ocular pathologies, neurological conditions, Central Nervous System disorders (CNS), premature and under medication, were excluded from the study. The absence of strabismus was confirmed with the unilateral Cover test. The visual efficacy exam was performed at Brain Vision & Learning Center,a diagnostic center for visual problems, collaborating with the Autonomous University of Querétaro (UAQ), located at Boulevard Jurica la Campana, 1194, Juriquilla, Querétaro, México. Data were collected by Dr. Danjela Ibrahimi, professor-researcher of Faculty of Engineering, UAQ. The number of patients was calculated based on the number of participants who met the inclusion criteria and decided to participate. The study was conducted according to the guidelines of the Declaration of Helsinki and the informed consent form was signed from all parents before starting any procedure.
Inclusion criteria:
- i)
- age 5.06 to 17.11
- ii)
- VA ≥ 0.3 logMar
- iii)
- no previous visual treatments
- iv)
- no symptoms of visual distress
Children from 5.06 to 17.11 were included, to encompass all childhood (from the moment they start the reading and writing process, to the point they become adults), which provides a clearer image of their phoria state and binocularity during this period of life. Moreover, the collaboration of children that already read and follow instructions, is much better than that of younger children.
The visual efficacy evaluation was performed from 08:00 am to 12.00 am, after 8-10 hours of sleep based on the age of participants, which allows the visual system to be more effective and provides reliable data. Visual exams were performed in the morning hours, to avoid tiredness of the visual system.
The evaluation followed three steps (one step per day):
- Step one:
- detailed personal medical history of the patient and their family background.
- Step two:
- determine the best optical prescription under the cycloplegic effect of 1% tropicamide [13] , and subjective refraction afterwards.
- Step three:
-
Evaluate the visual efficacy with the new prescription using the following motor and sensorial tests:
- 1)
- Visual acuity at 40 cm and 3 m using Bailey-Lovely charts (logMar).
- 2)
- Stereopsis at 40 cm using the Random-Dot 2 test which goes from 500 (gross) to 12.5 (fine) seconds of arc.
- 3)
- Howell test at 33 cm and 3 m using the Howell test phoria card and a 6 base down prism in front of the right eye.
- 4)
- Alternate Cover Test using a translucid occluder: at near fixation (40 cm) using a 20/30 single letter on the Gulden fixation stick, and at distance (3 m), by isolating a 20/30 letter on the distance visual acuity chart.
- 5)
- Thorington test at 40 cm and 3 m holding a Maddox rod (with its horizontal axis) in front of the right eye and the penlight against the back of the card.
- 6)
- Worth dot test at 33 cm and 3 m respectively to evaluate flat fusion and suppression.
- 7)
- Near point of convergence test (NPC) and its recovery, using an accommodative target (four repetitions in total) and its mean value was recorded as the final one.
- 8)
- Monocular estimated method retinoscopy at 40 cm (MEM) using the appropriate card based on the age and grade level of the patient.
As stated above, the phoria state at distance and near fixation was determined using three different techniques in free space. All tests were performed by the same examiner, Dr. Danjela Ibrahimi, specialist in vision and child development. The phoria state is measured in prismatic diopters, where a higher value describes a worse phoria state.
Howell Test:
This is the least dissociative test. Two cards were used to measure the phoria state at distance and near fixation, under normal light conditions (purchased by Bernell corporation). The patient held a vertical prism of 6 dpt in front of the right eye, which provoked double vision. The participant reported the number aimed by the arrow, which represented its horizontal phoria. Direction and magnitude were recorded.
Alternate Cover Test:
Doctor and patient sited in front of each other. To avoid the influence of proprioception on the result, the near fixation stick was held by the doctor´s assistant, while the patient was asked to keep the 20/30 letter on the stick clear while the doctor performed the alternate Cover test. To avoid deep binocular dissociation, a translucent occluder was used. Neutralization of the eye movement was reached using a prism bar in front of the right eye of the patient. The prism value and the base direction were recorded. For the phoria state at distance fixation, a 20/30 letter was isolated on the distance acuity visual chart and the same procedure as at near fixation was followed.
Thorington Test:
This is the most dissociative test. To measure the phoria state at distance and near fixation, the Bernell muscle imbalance measure cards were used (for distance and near), under normal light conditions. Therefore, the obtained results correspond to the natural binocular state of participants. The participant held a Maddox rod (with its horizontal axis) in front of the right eye while the doctor placed the penlight to the central small hole of the card. The participant reported the number on the card through which the red streak appeared to pass, and these values represented the horizontal phoria in prism diopters. The direction and the magnitude of the phoria were then recorded for both distances.
The reason to evaluate phorias in a fixed and not randomized order was to not compromise our data, as the more dissociative a test, a more dissociation is provoked to the visual system. Therefore, starting with the Howell test and finishing with Thorington test, avoid this effect. The motor and sensorial test used in this research have already been standardized and accepted by the scientific community of optometry and ophthalmology and can be found described in detail in [2].
Statistical analysis
The magnitude of phorias at near and distance were compared using parametric and non-parametric tests through the alternate Cover test, Howell test, and Thorington test. The statistical analysis was performed using the SPSS Statistics Base 25.0 program. The normality of data distribution was checked with Shapiro-Wilk (S-W) test. The confidence level (CI) used in this study was 95%, with = 0.05. The Paired-Samples T-Test was used to compare the means of two variables for a single group in normally distributed data, whereas the Wilcoxon signed-rank test in non-normally distributed population. The independent Samples t-Test was carried out to analyze the means of two independent groups to determine their statistical differences when data was normally distributed, and the Mann-Whitney test for the non-normally distributed data. The regression analysis was performed when the relationship between one dependent and one or more independent variables was analyzed. The correlation power was analyzed using the Pearson and Spearman tests, as defined by the data distribution.
3. Results
From the total of 220 patients, 132 were males (60%) and 88 females (40%), where 181 had exophoria (82.3%) and 39 presented esophoria (17.7%). 91 patients were hyperopic (41.4%) and 21 myopic (9.6%) with or without astigmatism, 11 patients had pure astigmatism (5%), whereas 97 patients did not have any refractive error (44%). 214 participants had flat fusion (evaluated using the Worth dot test) at distance fixation (97.3%) and only 6 patients presented diplopia (2.7%), while at near fixation, flat fusion was presented in 199 participants (90.5%), 20 had diplopia (9%) and only 1 child showed suppression of one eye (0.5%).
1. Descriptive statistics and analysis based on gender.
Gender did not relate to the visual acuity or stereopsis. Nor the amount of phorias measured through the alternate Cover test, Howell test and Thorington test at near and distance fixation showed statistically significant differences between male and female participants. Differences on the refractive status of patients were only significant for the hyperopia, being girls more hyperopic than boys. The independent sample t-Test was used to analyze differences between groups based on gender, but for the esophoria state, myopia, and astigmatism, where the analysis was performed using the Mann-Whitney test considering the small sample and the non-normal data distribution analyzed by the Shapiro-Wilk test. Table 1 illustrates the mean value, standard deviation (Std), and p-value of the analyzed variables based on gender. The break and recovery of the NPC is not included in this table as it is analyzed separately.
2. Comparison of the magnitude of phorias at near and distance,
measured through the alternate Cover test, Howell test and Thorington test.
The Paired-Samples T-test was performed to analyze differences between the obtained measurements through the alternate Cover test, Howell test and Thorington test for XF, whereas, Wilcoxon for EF, considering the data distribution analyzed by Shapiro-Wilk. The alternate Cover test was compared to Howell test and posteriorly to Thorington test. On a second phase, the Howell test was compared to Thorington test. Table 2 presents the results of the statistical analysis. Statistically significant differences were obtained from each test used, as seen in Table 2, but for the esophoria state at far when measured through the Howell test and Thorington test. The highest phoria values were obtained by the alternate Cover test, whereas the lowest ones, by the Howell test, being these differences more noticeable at near fixation. The biggest difference was found on the magnitude of exophoria measured at near fixation by the alternate Cover test and Howell test. The minor difference, however, was seen on the magnitude of esophoria at distance fixation as defined by the alternate Cover test and Howell test.
3. Correlations among the phoria tests used to determine the most similar ones.
To find out, which tests have more similarities between them, and which one is the best to use at which distance or under which phoria conditions, the correlation analysis was performed. To statistically determine the correlations on the phoria values obtained at near and distance fixation through the alternate Cover test, Thorington test and Howell test, Pearson and Spearman correlation analysis was carried out, based on the normality of data distribution as confirmed by Shapiro-Wilk analysis. Refer to Table 3(a,b).
Despite their different way of dissociation to determine the phoria state at distance and near fixation, some important correlations were found between them. In patients with exophoria, at near, similar values can be obtained by Thorington test and alternate Cover test, whereas at far, by Howell test and alternate Cover test. Thorington test and Howell test, however, show bigger differences on the obtained values. The same pattern was found in patients with esophoria, where the alternate Cover test and Thorington test relate to each other more significantly than Howell test and Thorington test. However, Thorington test and Howell test, present a strong correlation when quantifying the magnitude of esophoria at near fixation. Scatterplots to represent these correlations were created only for the phoria state at near, being the most important one, as it relates to the stereopsis degree. See Figure 1,Figure 2,Figure 3 and Figure 4.
4. Regression analysis to determine variables that could predict the degree of
stereopsis.
The regression analysis was performed to determine which variables could predict the degree of stereopsis. A new variable was introduced in this phase, the break of NPC, being this one related to the vergence state of patients. From the performed analysis, only the exophoria state at near and the break of NPC were related to the stereopsis value. The esophoric state was not related to the degree of stereopsis. The predictive models for every phoria test used and the break of NPC are presented in Table 4.
Table 4 shows that the strongest predictive variable for the stereopsis degree is the break of NPC (higher standardized beta-value and F-value than the rest), followed by the near exophoria state measured through the Howell test, alternate Cover test and Thorington test as the last one.
Figure 5 depicts the correlation found between the stereopsis degree and the break of NPC, while Figure 6 illustrates the correlation found between the stereopsis and the exophoria at near when the Howell test was used.
The relationship between the break of NPC and its recovery was also analyzed, where the Pearson correlation coefficient was of .96 and R = .916. This means that break and recovery are proportional to each other, as it is expected to be. Figure 7 shows this correlation.
5. Statistical analysis of the stereopsis degree, phoria state and the break of NPC
based on age.
Considering that the visual system changes during childhood, age is considered an important variable related to its performance. Therefore, three age-groups were created to analyze the phoria state, stereopsis, and break of NPC, as follows: 1st group 5.06 to 8.00 (62 patients, 28.2%); 2nd group 8.01 to 11.00 (111 patients, 50.5%), and 3rd group 11.01 to 17.11 (47 patients, 21.4%). The One-Way Anova Test was used to analyze and compare the means among the three groups. The Levene test of homogeneity of variances showed p-values greater than .05, suggesting that variances among groups, were not significantly different. The Tuckey HSD was used for multiple comparison. Results from the analysis of stereopsis and break of NPC are presented in Table 5. Figure 8 and Figure 9, represent the mean value and Std for the stereopsis degree and the break value of NPC as a dependent variable of age.
When it comes to the phoria state, age was not related to its magnitude. More specifically, taking the alternate Cover test as a reference (the most used technique in the clinical practice of optometrists and ophthalmologists to evaluate the phoria state), p =.19 and .11 for the XF value at distance and near fixation, whereas for EF, p = .51 and .92 for distance and near respectively.
6. Statistical analysis of the stereopsis degree and phoria state based on the
break value of NPC.
The break of NPC is associated with the exophoria state and the vergence system of an individual. Likewise, the exophoria can have an impact on the binocular state of the participant, like the stereopsis degree. Consequently, the break of NPC was divided into three groups as follows: the 1st group included all participants with a break from 0-5 cm (122 patients, 55.5 %); the 2nd group was composed by participants with a break from 6-10 cm (55 patients, 25 %), and the 3rd one, had a break from 11-25 cm (43 patients, 19.5 %). The phoria state and stereopsis degree was analyzed based on the break value of the NPC. Break values within the 10 cm range, are considered the norm.
As it can be seen by Table 6, significant differences were found when the third group (break of NPC 11-25 cm), was compared to the first and second one. When the break value does not exceed the 10 cm range, is considered within normal limits. Therefore, patients with a break beyond it, present diminished degree of stereopsis. No statistically significant differences were found when group one and two were compared, as both have a break value withing normal ranges. Figure 10 illustrates the mean stereopsis degree as a dependent variable of the break value of NPC, where the third group (break of 11-25 cm) obtained the lowest value and the first one (break of 0-5 cm), the highest one.
A total of 181 participants presented exophoria at near and distance fixation. From the total, 91 participants (50.3%), formed the first group (break of 0-5 cm), 47 participants (26%) formed the second group (break of 6-10 cm), and 43 participants (23.7%), were included in the third group (break of 11-25 cm). Results from the One-Way Anova with Tuckey HSD for multiple comparisons analysis are illustrated at Table 7. Patients with esophoria could not be analyzed considering the small sample, which divided into groups, could not be representative. Figure 11 represents the mean value and Std of the exophoria state at near fixation only (as presenting stronger correlation), as a dependent variable of the break value of NPC. Higher break value (worse) is related to higher magnitude of exophoria (worse) at distance and near fixation.
4. Discussion
The visual system is the most important sensory modality for reading, and visual-guided motor movement are crucial for writing [14,15], therefore, its assessment becomes essential since early age, as brain networks are in constant development, and the cortical plasticity facilitates any new oculomotor and procedural learning [16]. The visual system is composed by fundamental elements such as the accommodation and vergence system, phoria state, flat fusion and depth perception, oculomotricity etc [2]. All these components are related to each other and have a direct influence on some aspects of the academic learning, as binocular dysfunction, have been found in children with learning difficulties [3]. The phoria state which describes the latent deviation of the visual axes, provoked when binocularity is disrupted, and both eyes are no longer collaborating [17], was analyzed in this research. Different areas of the brain are associated with the control of the phoria state and its adaptation levels [18,19]. Its frequent changes during the day as result of the sustained fixation and high visual-attention during near distance work [20], the introduction of electronic devices since an early age, and the near visual task increase, make the analysis of the phoria state necessary. Different techniques, from more to less disruptive, exist to quantify the magnitude of heterophorias in free space at distance and near fixation [10,11,12]. In this research, three different techniques were used for this purpose: the Howell test, alternate Cover test and Thorington test. It is the first time that the Howell technique is compared to the other two, on a sample of Mexican children. The Howell test is considered the least disruptive one, as it requires a vertical prism to provoke diplopia and quantify the horizontal phoria. For the Cover test, a translucent occluder was used instead to disrupt the binocular fusion and elicit the phoria response. Thorington test, is considered the most disruptive technique, as it uses a red Maddox rod to dissociate binocularity and provoke a response from the visual system. After analyzing and comparing the three techniques using the Paired-Sample T-test and Wilcoxon test, different results were obtained from each one. Literature shows that similar results have been found when the Thorington test and alternate Cover test has been compared, being these studies conducted in adults and other ethnicities [10,11,12]. However, in this research, the highest phoria values were obtained by the alternate Cover test, whereas the lowest ones, by the Howell test, being these differences more noticeable at near fixation. The biggest difference was found on the magnitude of exophoria at near fixation as defined by the alternate Cover test and Howell test, whereas, the minor difference, was seen on the amount of esophoria measured at distance fixation by the alternate Cover test and Howell test.
When assessing the phoria state of the participants, it was expected that the level of dissociation would affect the magnitude of the horizontal phoria measured at near and distance fixation. Therefore, data obtained by the Thorington technique (the most disruptive test), should have been higher than the ones measured using the alternate Cover test (where a translucent occluder was used to decrease its level of dissociation). Nonetheless, the magnitude of horizontal phorias quantified by the alternate Cover test were the highest in value. These results could be derived from their different ways of dissociation. Additionally, the alternate Cover test is a more objective technique, as the examiner determines the magnitude of the deviation without any verbal participation of the patients. The patient is instructed to look at an accommodative point, while the examiner neutralizes the movement of the eyes with the bar prism. What it is mostly required here is visual attention. On the contrary, the Thorington test and Howell tests, are more subjective techniques, where the verbal collaboration of the patient is essential. The patient needs to give a verbal answer, about what his visual system sees. Despite their differences, Pearson, and Spearman correlation analysis, showed some significant correlations among them, being those stronger at near than distance fixation. For patients with exophoria or esophoria at near, the alternate Cover test and Thorington test provide similar values, so the examiner could use only one of them to determine the magnitude of the heterophoria. If examining the exophoria state at distance, the alternate Cover test and Howell test are similar, whereas for the esophoria, the alternate Cover test and Thorington test provide similar results. The results show that the alternate Cover test and Thorington test, despite their different ways of dissociation, can substitute one another, whereas the Howell test, cannot be interchangeable with the other two. The different way of dissociation this test uses, can be related to the obtained results. The important question here would be which one is better than the other or on which one should the examiner rely on. To answer this question, it is crucial to review the medical history of the patient and relate the clinical findings with signs and symptoms he reports. As a clinician, the closer the used technique is to the natural binocular state of the patient, the most reliable the gathered data are. When we break fusion by using dissociative techniques to quantify the phoria state of the patient, the gathered data inform the examiner about the fragility of the visual system, its adaptability to the changes on the levels of sustained attention and its flexibility [4]. When the repeatability between measures is high and consistent under different levels of dissociation, the visual system is considered stable and balanced. An easily dissociable visual system is a fragile one, where a high magnitude of phoria, often followed by accommodative and vergence dysfunction cannot longer be compensated [21]. Visual health professionals should choose the used techniques for evaluation based on the best interest of the patient and its needs. All these different methods of phoria measurements are useful, and have their own scope, which could provide us with the best diagnosis, and the most adequate treatment when necessary. The second part of the statistical analysis focused on the interaction among variables such as the stereopsis degree, magnitude/direction of phorias, and break/recovery of the near point of convergence to predict the levels of binocularity of participants. The regression analysis showed that the break of NPC and the exophoria state at near fixation are the only predictors for the degree of stereopsis, being their predictive models similar between them. These results are due to the relationship between the break of NPC and magnitude of exophoria, where the One-Way Anova analysis showed that participants with higher break values (worse break values), presented higher magnitude of exophoria at near fixation (worse exophoria state). Same results were obtained for the degree of stereopsis. Worse stereopsis (lower values) was presented by patients with higher magnitude of exophoria. These results are in concordance with the neurophysiology of the visual system and its performance. Patients with binocular dysfunction such as convergence insufficiency (high break values and recovery of NPC), accommodative problems, vergence flexibility, etc., are followed by diminished degree of stereopsis and poorer visual performance [22]. When the magnitude of phorias was analyzed according to age, no statistically significant results were obtained. Therefore, the phoria state of children up to 5.06 years and older is expected to be similar. A previous study on adults and children showed that the obtained values for phorias at each viewing distance were similar in both groups [23], which make our results comparable to other research. Nevertheless, age affected the break value of NPC and stereopsis degree. Participant between 8.01 to 11.00 years (the 2nd group), had the best stereopsis degree and the lowest break value of NPC. Our hypothesis here is that younger children (participants of the 1st group), could have less control on their visual system, and older ones (3rd group), could have a more stressed visual system, as the levels of sustained visual attention and near work tasks increase with age, affecting posture, ocular movement control and components of the binocular system [24,25]. In this research, the stereopsis value was measured using the Random Dot 2 Stereoacuity Test as being validated and recognized by visual health professionals. Despite the fact that the test is easily understandable by children and its administration time is short, there is a need for verbal feedback or eye-hand coordination in case the child needs to touch the image that floats. Even though in this paper, participants were chosen so they could understand and collaborate during the evaluation process, clinicians and researchers should be familiarized with other ways to evaluate depth perception, especially in younger children. Recent research has discovered that reflexive eye movements can be sensitive to interocular stimulation, making them useful for subjective evaluation [26]. Likewise, it has been shown that reflexive Ocular Following is also present in children, which can be used for objective evaluation of one’s capability of stereoscopic vision without the need for verbal feedback [27]. Through this research, we aimed to prove that different way of dissociation when assessing the phoria state of a patient, could affect the obtained results. Indeed, the less dissociative and disruptive the used technique is, the lower the measured values are, as the quantification of the magnitude of phorias, is made under more natural condition. Additionally, by analyzing the crucial components of the visual system associated with the binocular state, visual health professionals could predict the interaction among them and the impact they could have on the sensorimotor balance of the visual sensory modality. This research provides information not only on the response of the phoria state of children under different conditions, but on their binocular state as well, and the interaction among analyzed variables. The break and recovery of the near point of convergence was added to this analysis, to broaden our knowledge on the variables that could affect each other.
5. Conclusions
This research, compared the dissociated phoria state at near and distance fixation in free space, using three different techniques: the Howell test, alternate Cover test and Thorington test. A total of 220 healthy Mexican children from Querétaro, 5.06 to 17.11 years of age, participated in this study. The magnitude of phorias at both distances was quantified using each of the tests, starting from least to most disruptive one. The degree of stereopsis, break, and recovery value of the near point of convergence were also analyzed to understand the interaction among them and their impact on the sensorimotor balance of the visual system. From the total, 82.3% presented exophoria against 17.7% with esophoria. Likewise, 41.4% were hyperopic, against 9.6% who had myopia. Parametric and non-parametric statistics using the SPSS Statistics Base 25.0, showed that for patients with exophoria or esophoria at near, the alternate Cover test and Thorington test provide similar values. If examining the exophoria state at distance, the alternate Cover test and Howell test are similar, whereas for the esophoria, the alternate Cover test and Thorington test give similar results. The biggest difference is found on the magnitude of exophoria measured at near fixation by the alternate Cover test and Howell test. The minor difference, however, is seen on the magnitude of esophoria at distance fixation as defined by the alternate Cover test and Howell test. The break value and the magnitude of exophoria at near can predict the stereopsis degree. The break value is related to the magnitude of exophoria and the degree of stereopsis; higher break value, worse exophoria state and lower stereopsis. Gender does not relate to any variable, whereas age, is associated with the degree of stereopsis and the break of NPC. Age does not relate to the magnitude of phorias. The statistical analysis showed that the alternate Cover test and Thorington test, despite their different ways of dissociation, can substitute one another, whereas the Howell test, cannot be interchangeable with the other two. The different way of dissociation this test uses, can be related to the obtained results. By analyzing the essential elements of the binocular visual system, can help professionals determine the interaction among them and their impact on its sensorimotor balance.
Author Contributions
Conceptualization, D.I., M.A. and J.R.-R.; Methodology, D.I., M.A. and J.R.-R.; Software, D.I.; Validation, D.I. and J.R.-R; Formal analysis, J.R.-R.; Investigation, D.I.; Resources, D.I. and J.R.-R..; Data curation, D.I. and J.R.-R.; Writing—original draft preparation, review, and editing, D.I., M.A. and J.R.-R.. All authors have read and agreed to the published version of the manuscript.
Funding
This paper did not receive any specific funding; it is a genuine and personal research initiative of the authors.
Institutional Review Board Statement
The study was conducted according to the guidelines of the Declaration of Helsinki and approved by the Institutional Review Board (CEAIFI-015-2023-TP).
Informed Consent Statement
Patients came to the Brain Vision and Learning Center accompanied by their parents to have a detailed evaluation of their visual efficacy and perceptual–motor skills. These evaluations were non-invasive and no experiments were conducted on patients. Each patient was identified by a code number, and no personal data were exposed. Parents were asked whether they were willing to help in data gathering and analysis to provide scientific knowledge about the visual system and visual processing information. Consent from parents was obtained before using the data from their child’s evaluation. The Consent Form is attached with the submission.
Data Availability Statement
The data presented in this study are available on request from the corresponding author. The data are not publicly available due to confidentiality.
Acknowledgments
The authors thank CONACYT for funding this work and Ruben García for the edition of the manuscript.
Conflicts of Interest
Authors declare no conflict of interest.
Abbreviations
The following abbreviations are used in this manuscript:
| CT | Cover test |
| CI | confidence interval |
| EF | esophoria |
| F | far |
| H | Howell test |
| N | near |
| U | upper |
| L | lower |
| NPC | near point of convergence |
| OD | oculus dexter |
| OS | oculus sinister |
| Std | standard deviation. |
| TH | Thorington test |
| t-value | t-value of Paired Samples T-test for XF |
| VA | visual acuity |
| XF | exophoria |
| z-value | z-value of Wilcoxon Test for EFk |
| p-value | p-value for parametric statistics |
| p-value | p-value for non-parametric statistics |
References
- Griffin, J.; Borsting, E.; Foundation, O.E.P. Binocular Anomalies: Theory, Testing & Therapy; OEP Foundation, 2010. [Google Scholar]
- Scheiman, M.; Wick, B. Clinical Management of Binocular Vision: Heterophoric, Accommodative, and Eye Movement Disorders; M - Medicine Series, Wolters Kluwer Health, 2020. [Google Scholar]
- Christian, L.W.; Nandakumar, K.; Hrynchak, P.K.; Irving, E.L. Visual and binocular status in elementary school children with a reading problem. Journal of Optometry 2018, 11, 160–166. [Google Scholar] [CrossRef] [PubMed]
- Press, L. Applied Concepts in Vision Therapy; Optometric Extension Program Foundation, 2008. [Google Scholar]
- Brautaset, R.L.; Jennings, J.A.M. Distance vergence adaptation is abnormal in subjects with convergence insufficiency. Ophthalmic and Physiological Optics 2005, 25, 211–214. Available online: [onlinelibrary.wiley.com/doi/pdf/10.1111/j.1475-1313.2005.00274.x]. [CrossRef] [PubMed]
- Nilsson, M.; Brautaset, R.L. Vergence Adaptation in Subjects with Convergence Excess. Strabismus 2011, 19, 5–11. [Google Scholar] [CrossRef] [PubMed]
- Zheng, X.; Xu, G.; Zhi, Y.; Wang, Y.; Han, C.; Wang, B.; Zhang, S.; Zhang, K.; Liang, R. Objective and quantitative assessment of interocular suppression in strabismic amblyopia based on steady-state motion visual evoked potentials. Vision Research 2019, 164, 44–52. [Google Scholar] [CrossRef]
- Morales, C.; Gohel, S.; Scheiman, M.; Li, X.; Santos, E.M.; Sangoi, A.; Alvarez, T.L. Test–retest of a phoria adaptation stimulus-induced functional MRI experiment. Journal of Vision 2020, 20, 17–17. [Google Scholar] [CrossRef]
- Fazzi, E.; Micheletti, S.; Calza, S.; Merabet, L.; Rossi, A.; Galli, J.; Group, E.V.I.S. Early visual training and environmental adaptation for infants with visual impairment. Developmental Medicine & Child Neurology 2021, 63, 1180–1193. Available online: [onlinelibrary.wiley.com/doi/pdf/10.1111/dmcn.14865]. [CrossRef]
- Lam, A.K.C.; Lam, A.; Charm, J.; Wong, K.m. Comparison of near heterophoria tests under varying conditions on an adult sample. Ophthalmic and Physiological Optics 2005, 25, 162–167. Available online: [onlinelibrary.wiley.com/doi/pdf/10.1111/j.1475-1313.2005.00270.x]. [CrossRef]
- Sanker, N.; Prabhu, A.; Ray, A. A comparison of near-dissociated heterophoria tests in free space. Clinical and Experimental Optometry 2012, 95, 638–642. Available online: [onlinelibrary.wiley.com/doi/pdf/10.1111/j.1444-0938.2012.00785.x]. [CrossRef]
- Facchin, A.; Maffioletti, S. Comparison, within-session repeatability and normative data of three phoria tests. Journal of Optometry 2021, 14, 263–274. [Google Scholar] [CrossRef]
- Yazdani, N.; Sadeghi, R.; Momeni-Moghaddam, H.; Zarifmahmoudi, L.; Ehsaei, A. Comparison of cyclopentolate versus tropicamide cycloplegia: A systematic review and meta-analysis. Journal of Optometry 2018, 11, 135–143. [Google Scholar] [CrossRef]
- Niechwiej-Szwedo, E.; Goltz, H.C.; Chandrakumar, M.; Wong, A.M.F. Effects of Strabismic Amblyopia on Visuomotor Behavior:Part II. Visually Guided Reaching. Investigative Ophthalmology & Visual Science 2014, 55, 3857–3865. [Google Scholar] [CrossRef]
- Niechwiej-Szwedo, E.; Goltz, H.C.; Colpa, L.; Chandrakumar, M.; Wong, A.M.F. Effects of Reduced Acuity and Stereo Acuity on Saccades and Reaching Movements in Adults With Amblyopia and Strabismus. Investigative Ophthalmology & Visual Science 2017, 58, 914–921. [Google Scholar] [CrossRef]
- Chéreau, R.; Williams, L.E.; Bawa, T.; Holtmaat, A. Circuit mechanisms for cortical plasticity and learning. Seminars in Cell & Developmental Biology 2022, 125, 68–75. [Google Scholar] [CrossRef]
- Evans, B.J. Chapter 1 - Nature of Binocular Vision Anomalies. In Pickwell’s Binocular Vision Anomalies (Sixth Edition), Sixth Edition ed.; Evans, B.J., Ed.; Elsevier: Philadelphia, 2022; pp. 2–10. [Google Scholar] [CrossRef]
- Bostan, A.C.; Strick, P.L. The basal ganglia and the cerebellum: nodes in an integrated network. Nature Reviews Neuroscience 2018, 19, 338–350. [Google Scholar] [CrossRef]
- Raymond, J.L.; Medina, J.F. Computational Principles of Supervised Learning in the Cerebellum. Annual Review of Neuroscience 2018, 41, 233–253. [Google Scholar] [CrossRef]
- Kim, E.H.; Granger-Donetti, B.; Vicci, V.R.; Alvarez, T.L. The Relationship between Phoria and the Ratio of Convergence Peak Velocity to Divergence Peak Velocity. Investigative Ophthalmology & Visual Science 2010, 51, 4017–4027. [Google Scholar] [CrossRef]
- Wajuihian, S.O. Characterizing Refractive Errors, Near Accommodative and Vergence Anomalies and Symptoms in an Optometry Clinic. British and Irish Orthoptic Journal 2022. [Google Scholar] [CrossRef]
- Birnbaum, M. Optometric Management of Nearpoint Vision Disorders; Optometric Extension Program Foundation, 2008. [Google Scholar]
- Troyer, M.E.; Sreenivasan, V.; Peper, T.J.; Candy, T.R. The heterophoria of 3–5 year old children as a function of viewing distance and target type. Ophthalmic and Physiological Optics 2017, 37, 7–15. [Google Scholar] [CrossRef]
- Anshel, J.R. Visual Ergonomics in the Workplace. AAOHN Journal 2007, 55, 414–420. [Google Scholar] [CrossRef]
- Carrasco, M. Visual attention: The past 25 years. Vision Research 2011, 51, 1484–1525. [Google Scholar] [CrossRef]
- Miladinović, A.; Quaia, C.; Ajčević, M.; Diplotti, L.; Cumming, B.G.; Pensiero, S.; Accardo, A. Ocular-following responses in school-age children. PLoS ONE 2022, 17. [Google Scholar] [CrossRef] [PubMed]
- Quaia, C.; Fitzgibbon, E.J.; Optican, L.M.; Cumming, B.G. Binocular summation for reflexive eye movements: A potential diagnostic tool for stereodeficiencies. Investigative Ophthalmology and Visual Science 2018, 59, 5816–5822. [Google Scholar] [CrossRef] [PubMed]
Figure 1.
Illustrates the correlations found between phoria tests used to measure the exophoria at near fixation. In bold is represented the correlation found for exophoria at near measured through the alternate Cover test and Howell test (R = .618), whereas in red, the one between the alternate Cover test and Thorington test (R = .715). The higher the R value, the strongest the correlation between them. This graphical representation shows a stronger correlation between the Cover test and Thorington test.
Figure 1.
Illustrates the correlations found between phoria tests used to measure the exophoria at near fixation. In bold is represented the correlation found for exophoria at near measured through the alternate Cover test and Howell test (R = .618), whereas in red, the one between the alternate Cover test and Thorington test (R = .715). The higher the R value, the strongest the correlation between them. This graphical representation shows a stronger correlation between the Cover test and Thorington test.
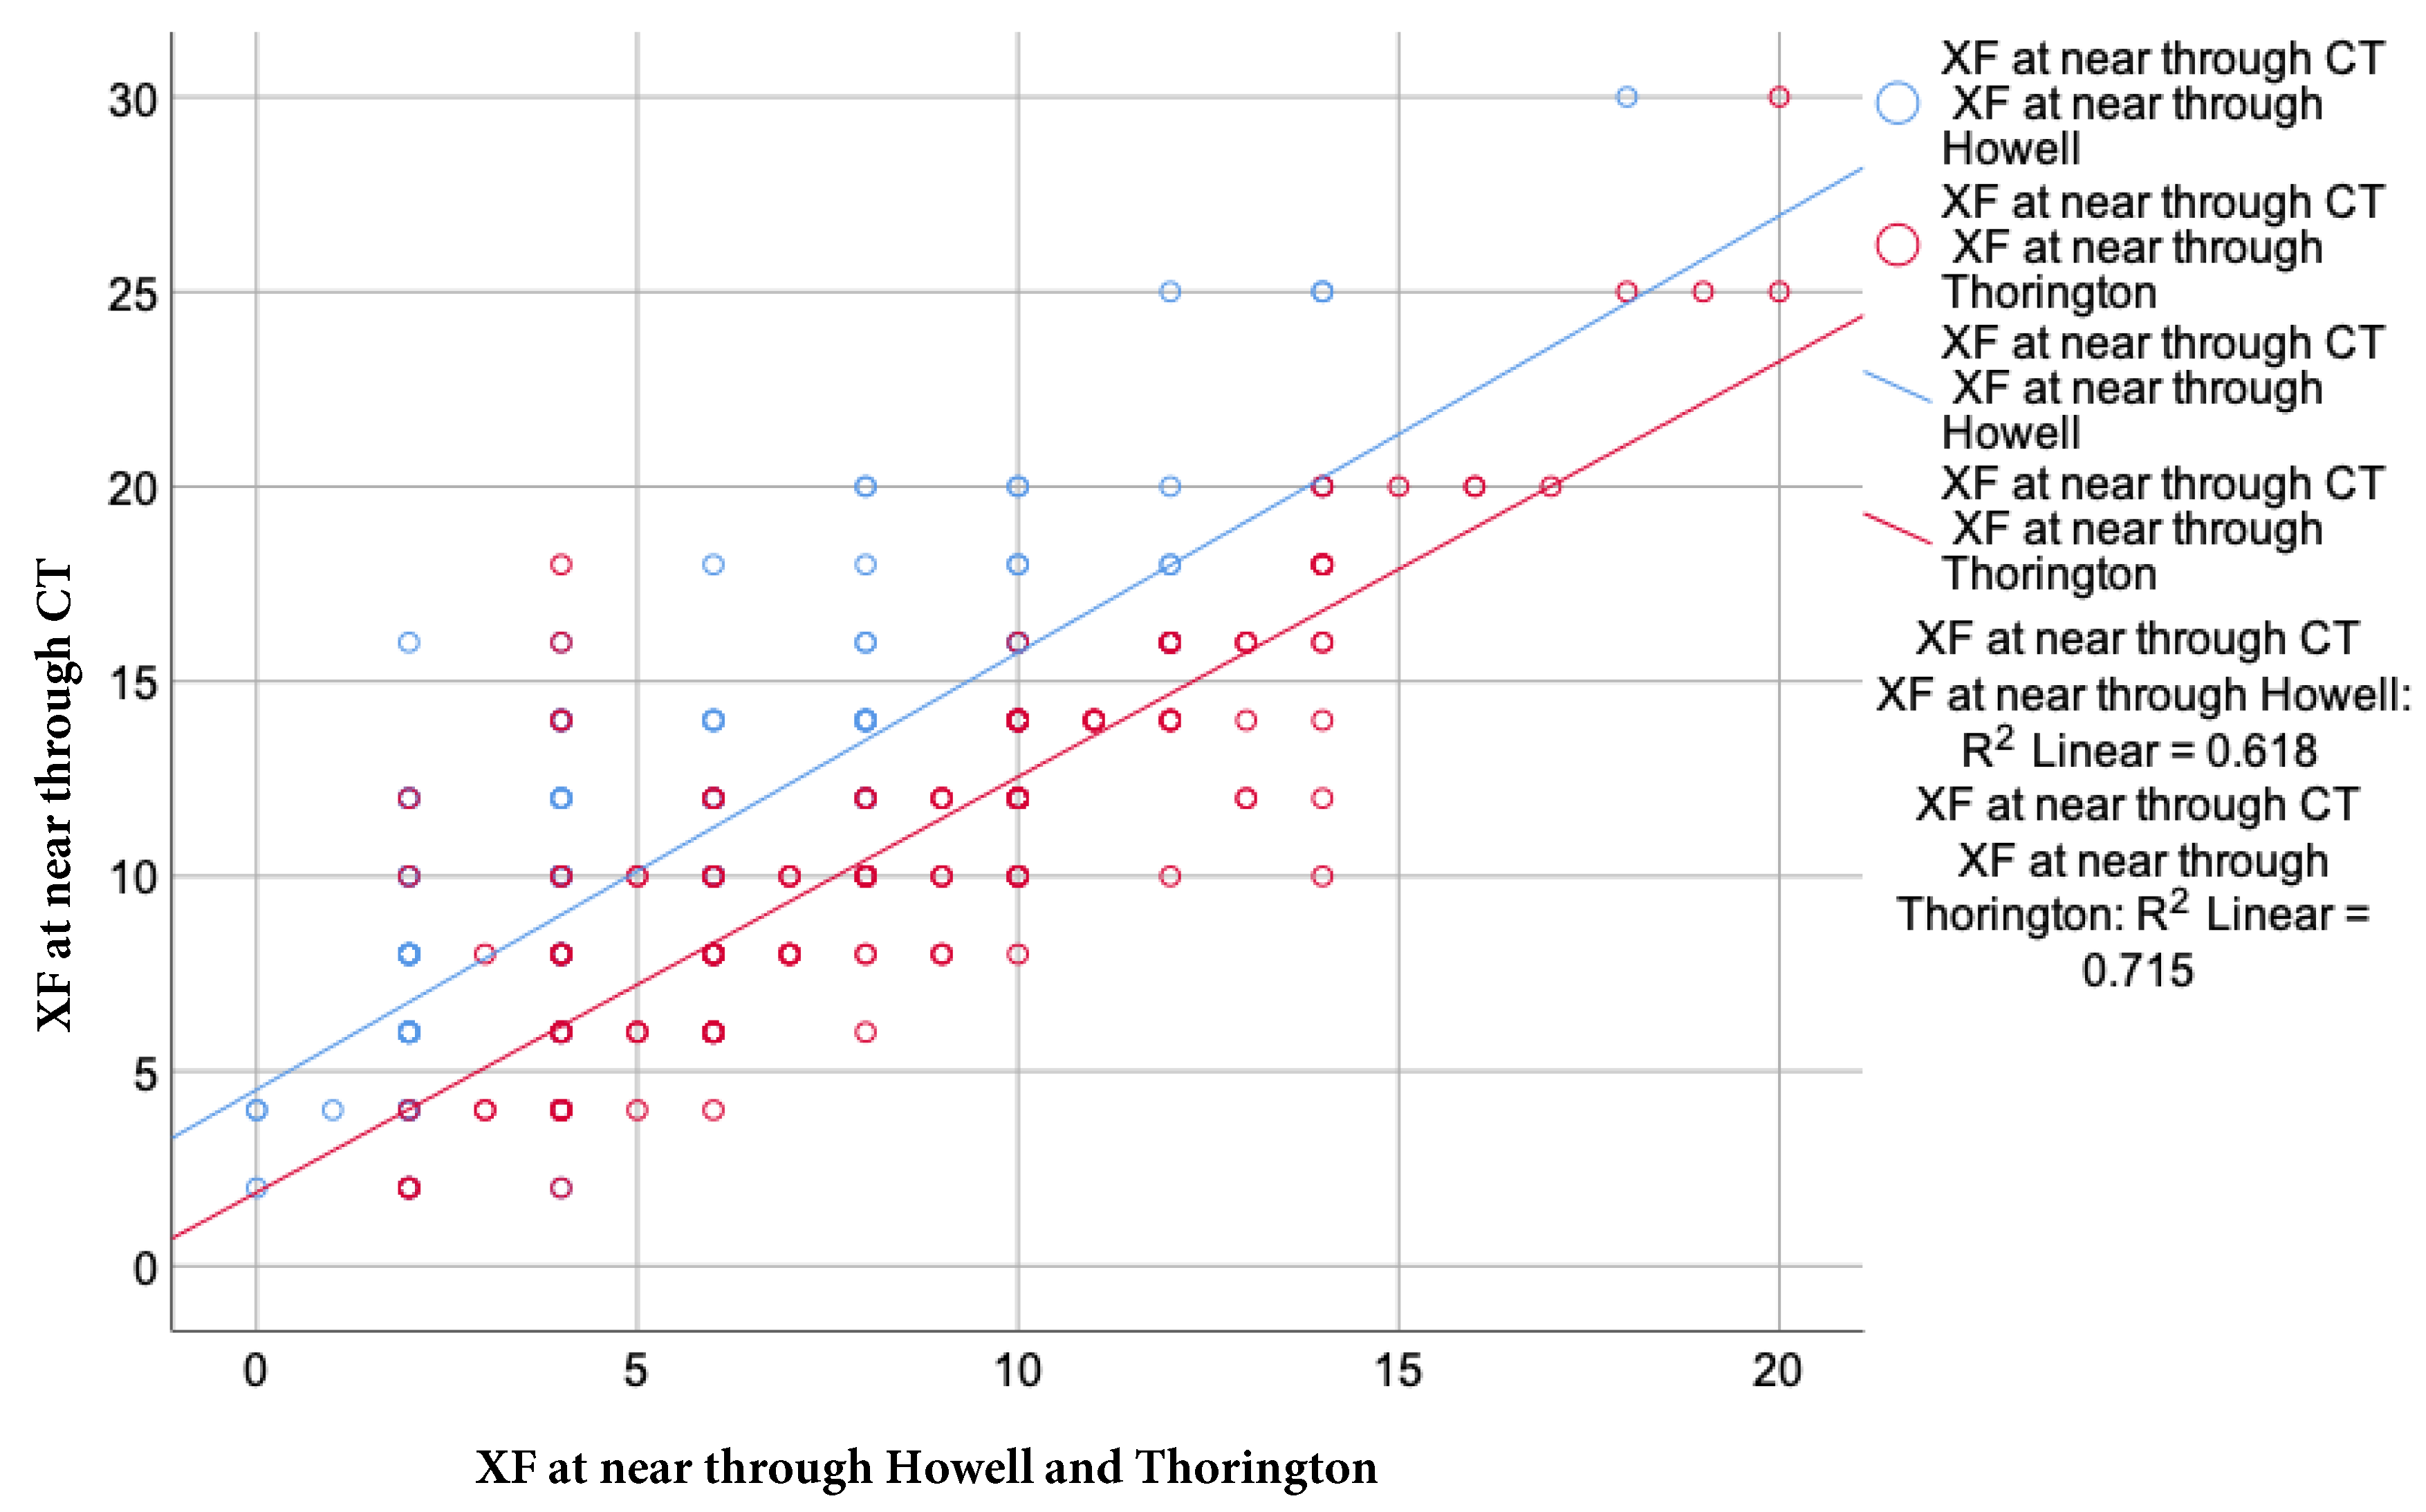
Figure 2.
Depicts the correlation found between phoria tests used to measure esophoria at near distance. The blue color shows the correlation found for esophoria at near measured through the alternate Cover test and Howell test (R = .850), whereas the red, the one between alternate Cover test and Thorington test (R = .902). The higher the R value, the strongest the correlation between them. By the graphical representation, it can be concluded that a stronger correlation is found between the alternate Cover test and Thorington test.
Figure 2.
Depicts the correlation found between phoria tests used to measure esophoria at near distance. The blue color shows the correlation found for esophoria at near measured through the alternate Cover test and Howell test (R = .850), whereas the red, the one between alternate Cover test and Thorington test (R = .902). The higher the R value, the strongest the correlation between them. By the graphical representation, it can be concluded that a stronger correlation is found between the alternate Cover test and Thorington test.
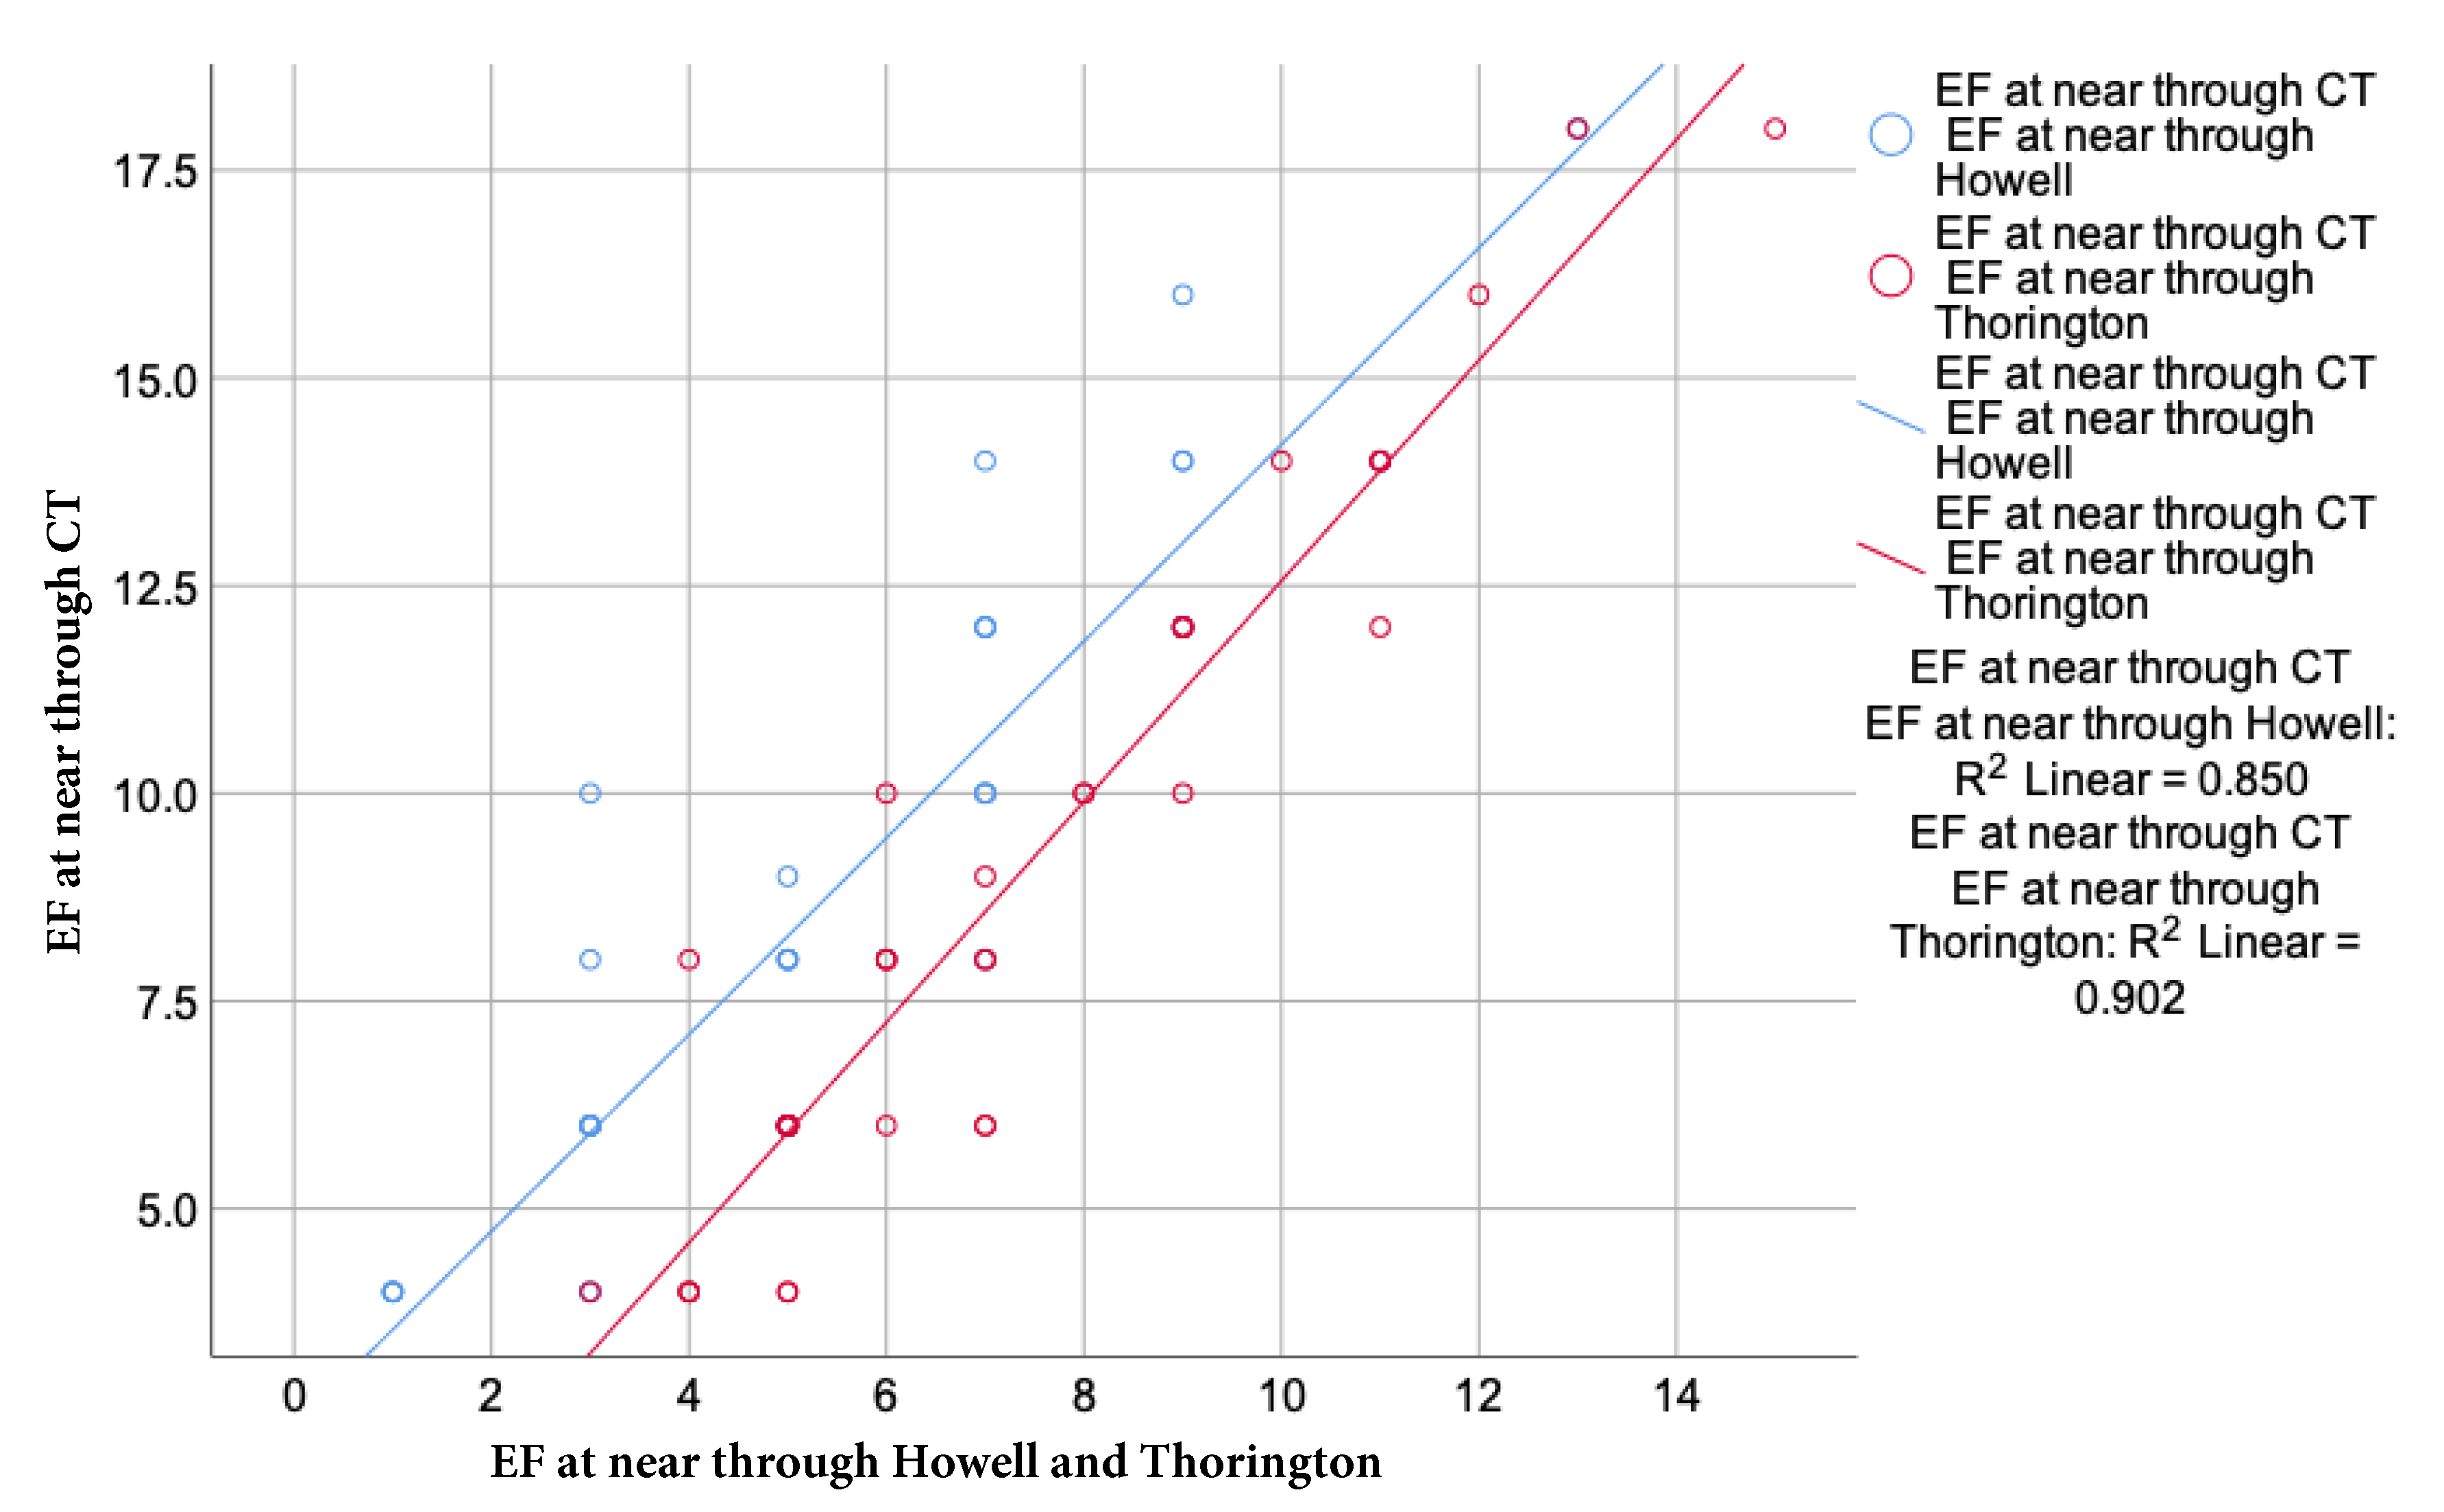
Figure 3.
Represents the correlation found between the Howell test and Thorington test for the esophoria measured at near fixation, where (R = .778). An important correlation is found between these tests for patients with esophoria. Therefore, the values we expect to obtain in these group of participants, should be similar.
Figure 3.
Represents the correlation found between the Howell test and Thorington test for the esophoria measured at near fixation, where (R = .778). An important correlation is found between these tests for patients with esophoria. Therefore, the values we expect to obtain in these group of participants, should be similar.
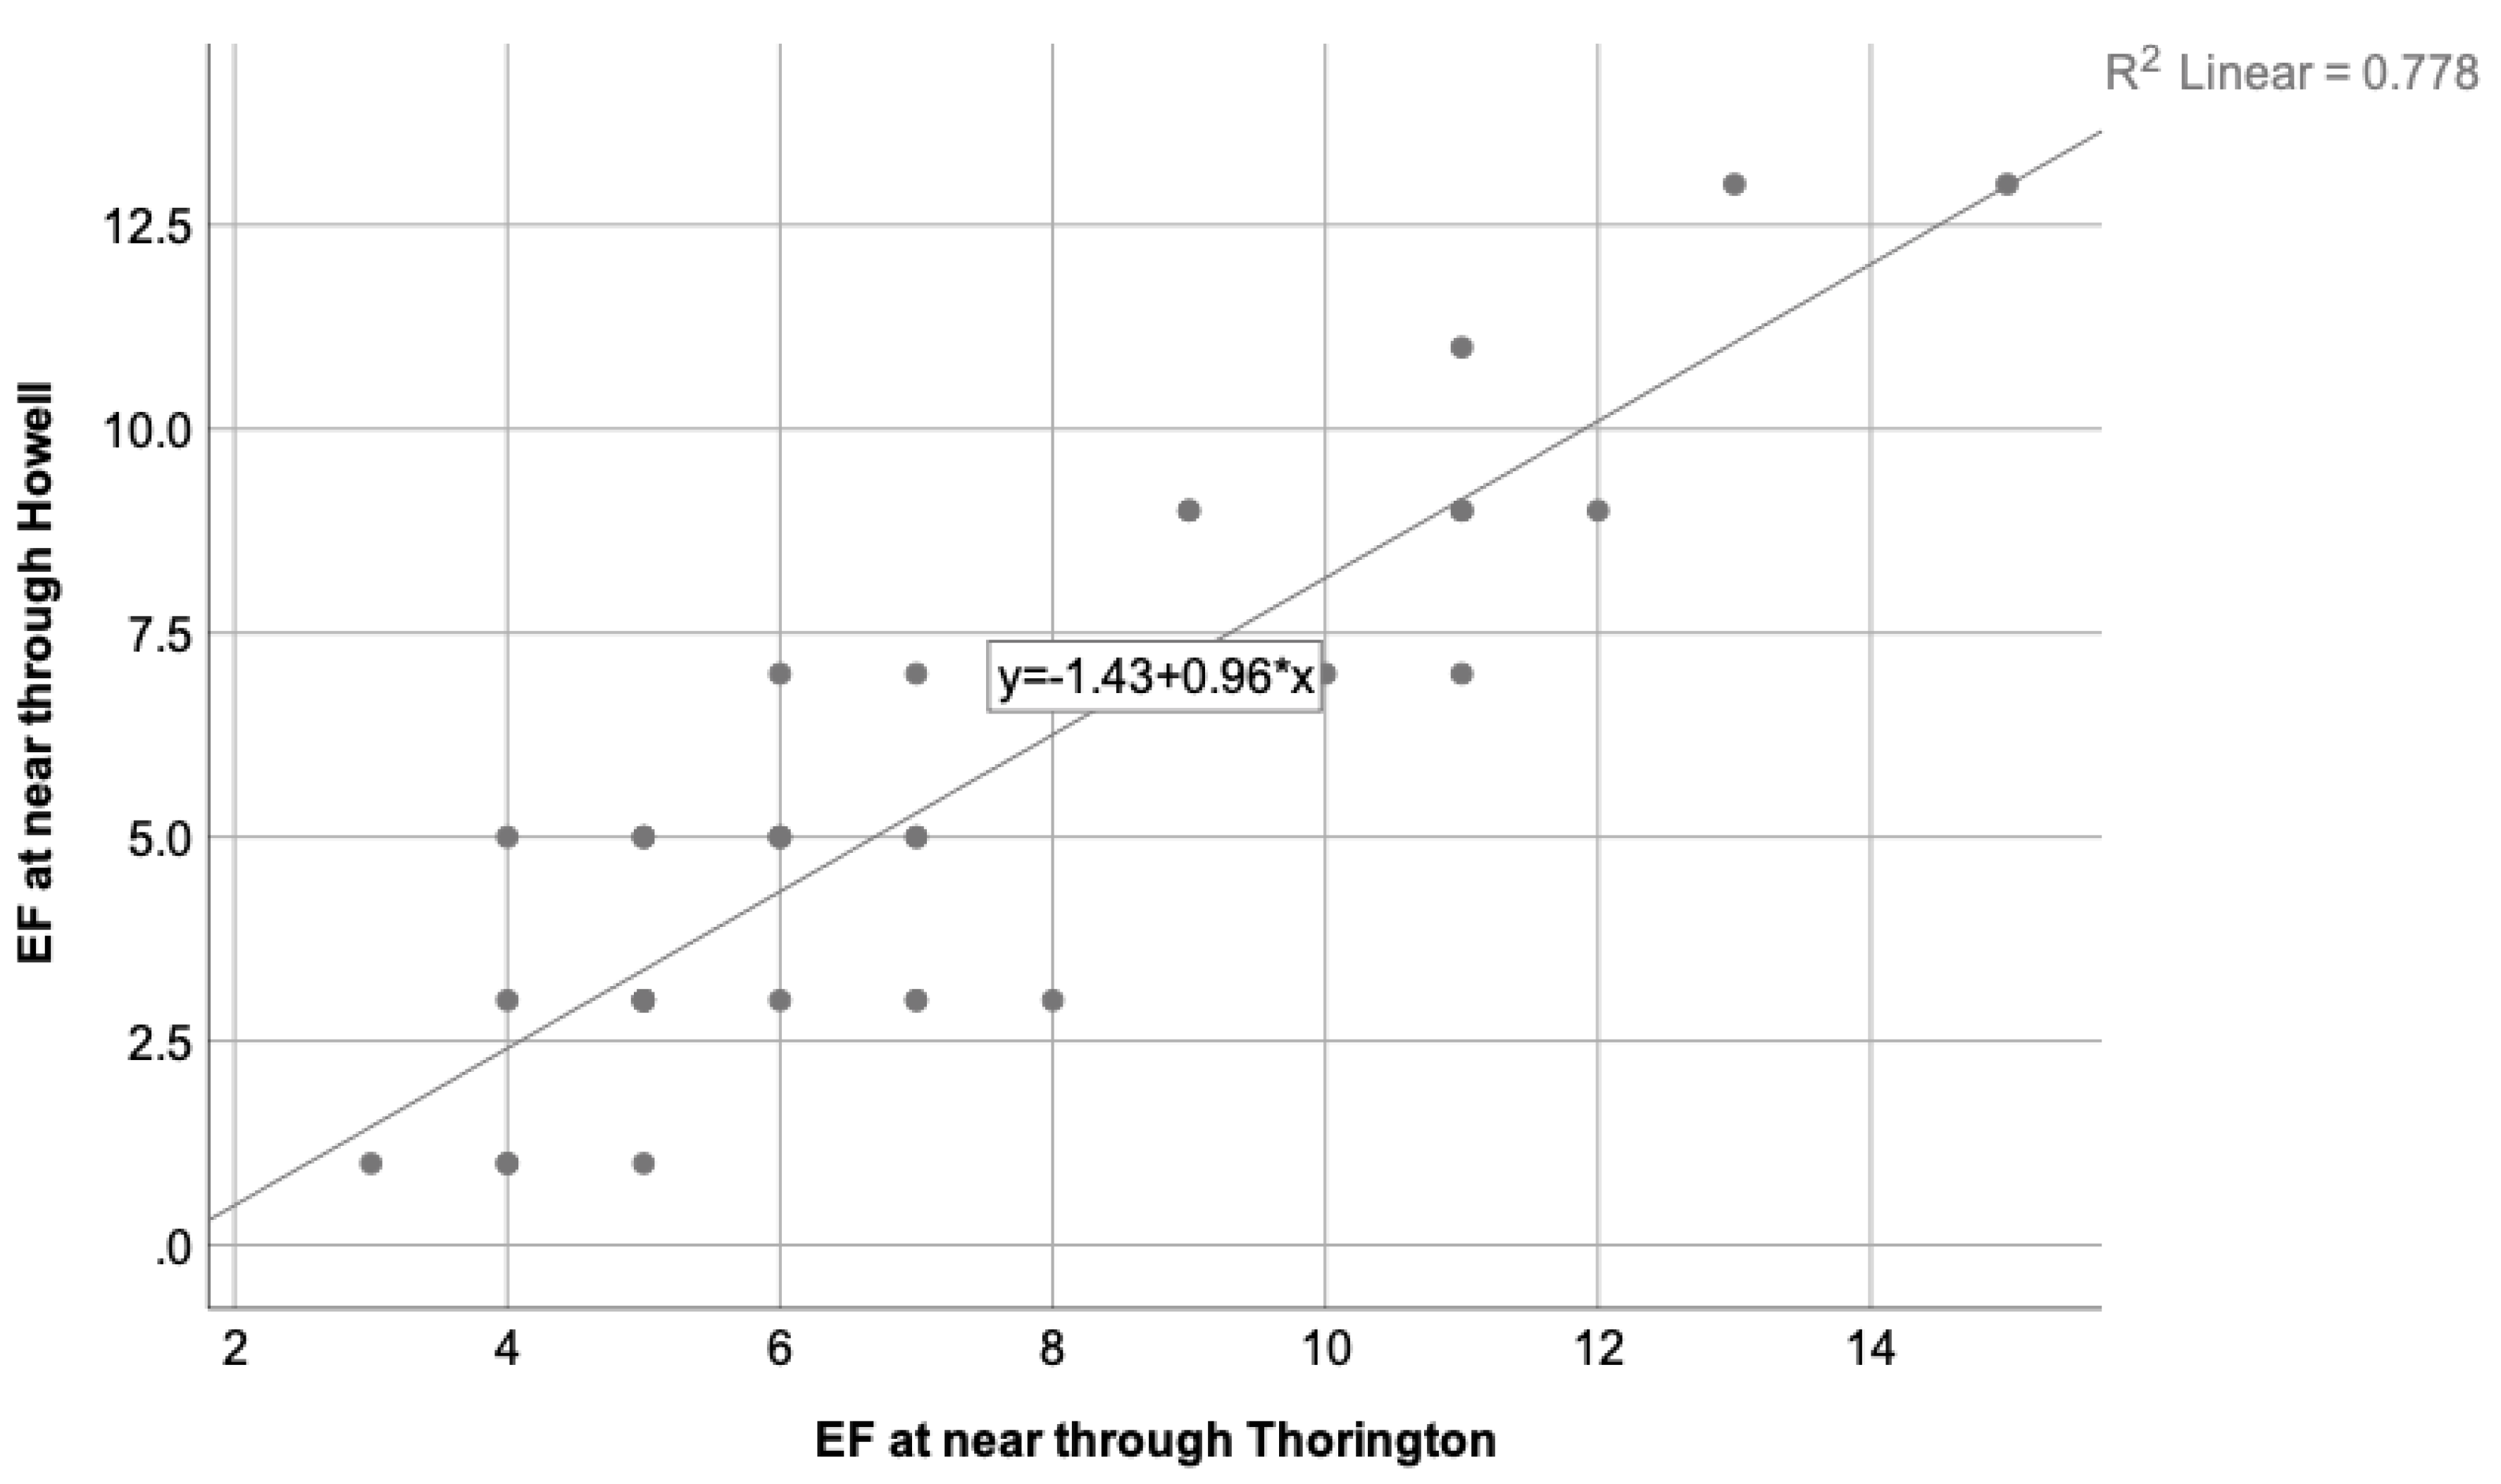
Figure 4.
Represent the correlation found between the Howell test and Thorington test for the exophoria measured at near distance, where (R = .462). A weak correlation is found between them for patients with exophoria. Consequently, the values we expect to obtain in this group of people, should be different.
Figure 4.
Represent the correlation found between the Howell test and Thorington test for the exophoria measured at near distance, where (R = .462). A weak correlation is found between them for patients with exophoria. Consequently, the values we expect to obtain in this group of people, should be different.
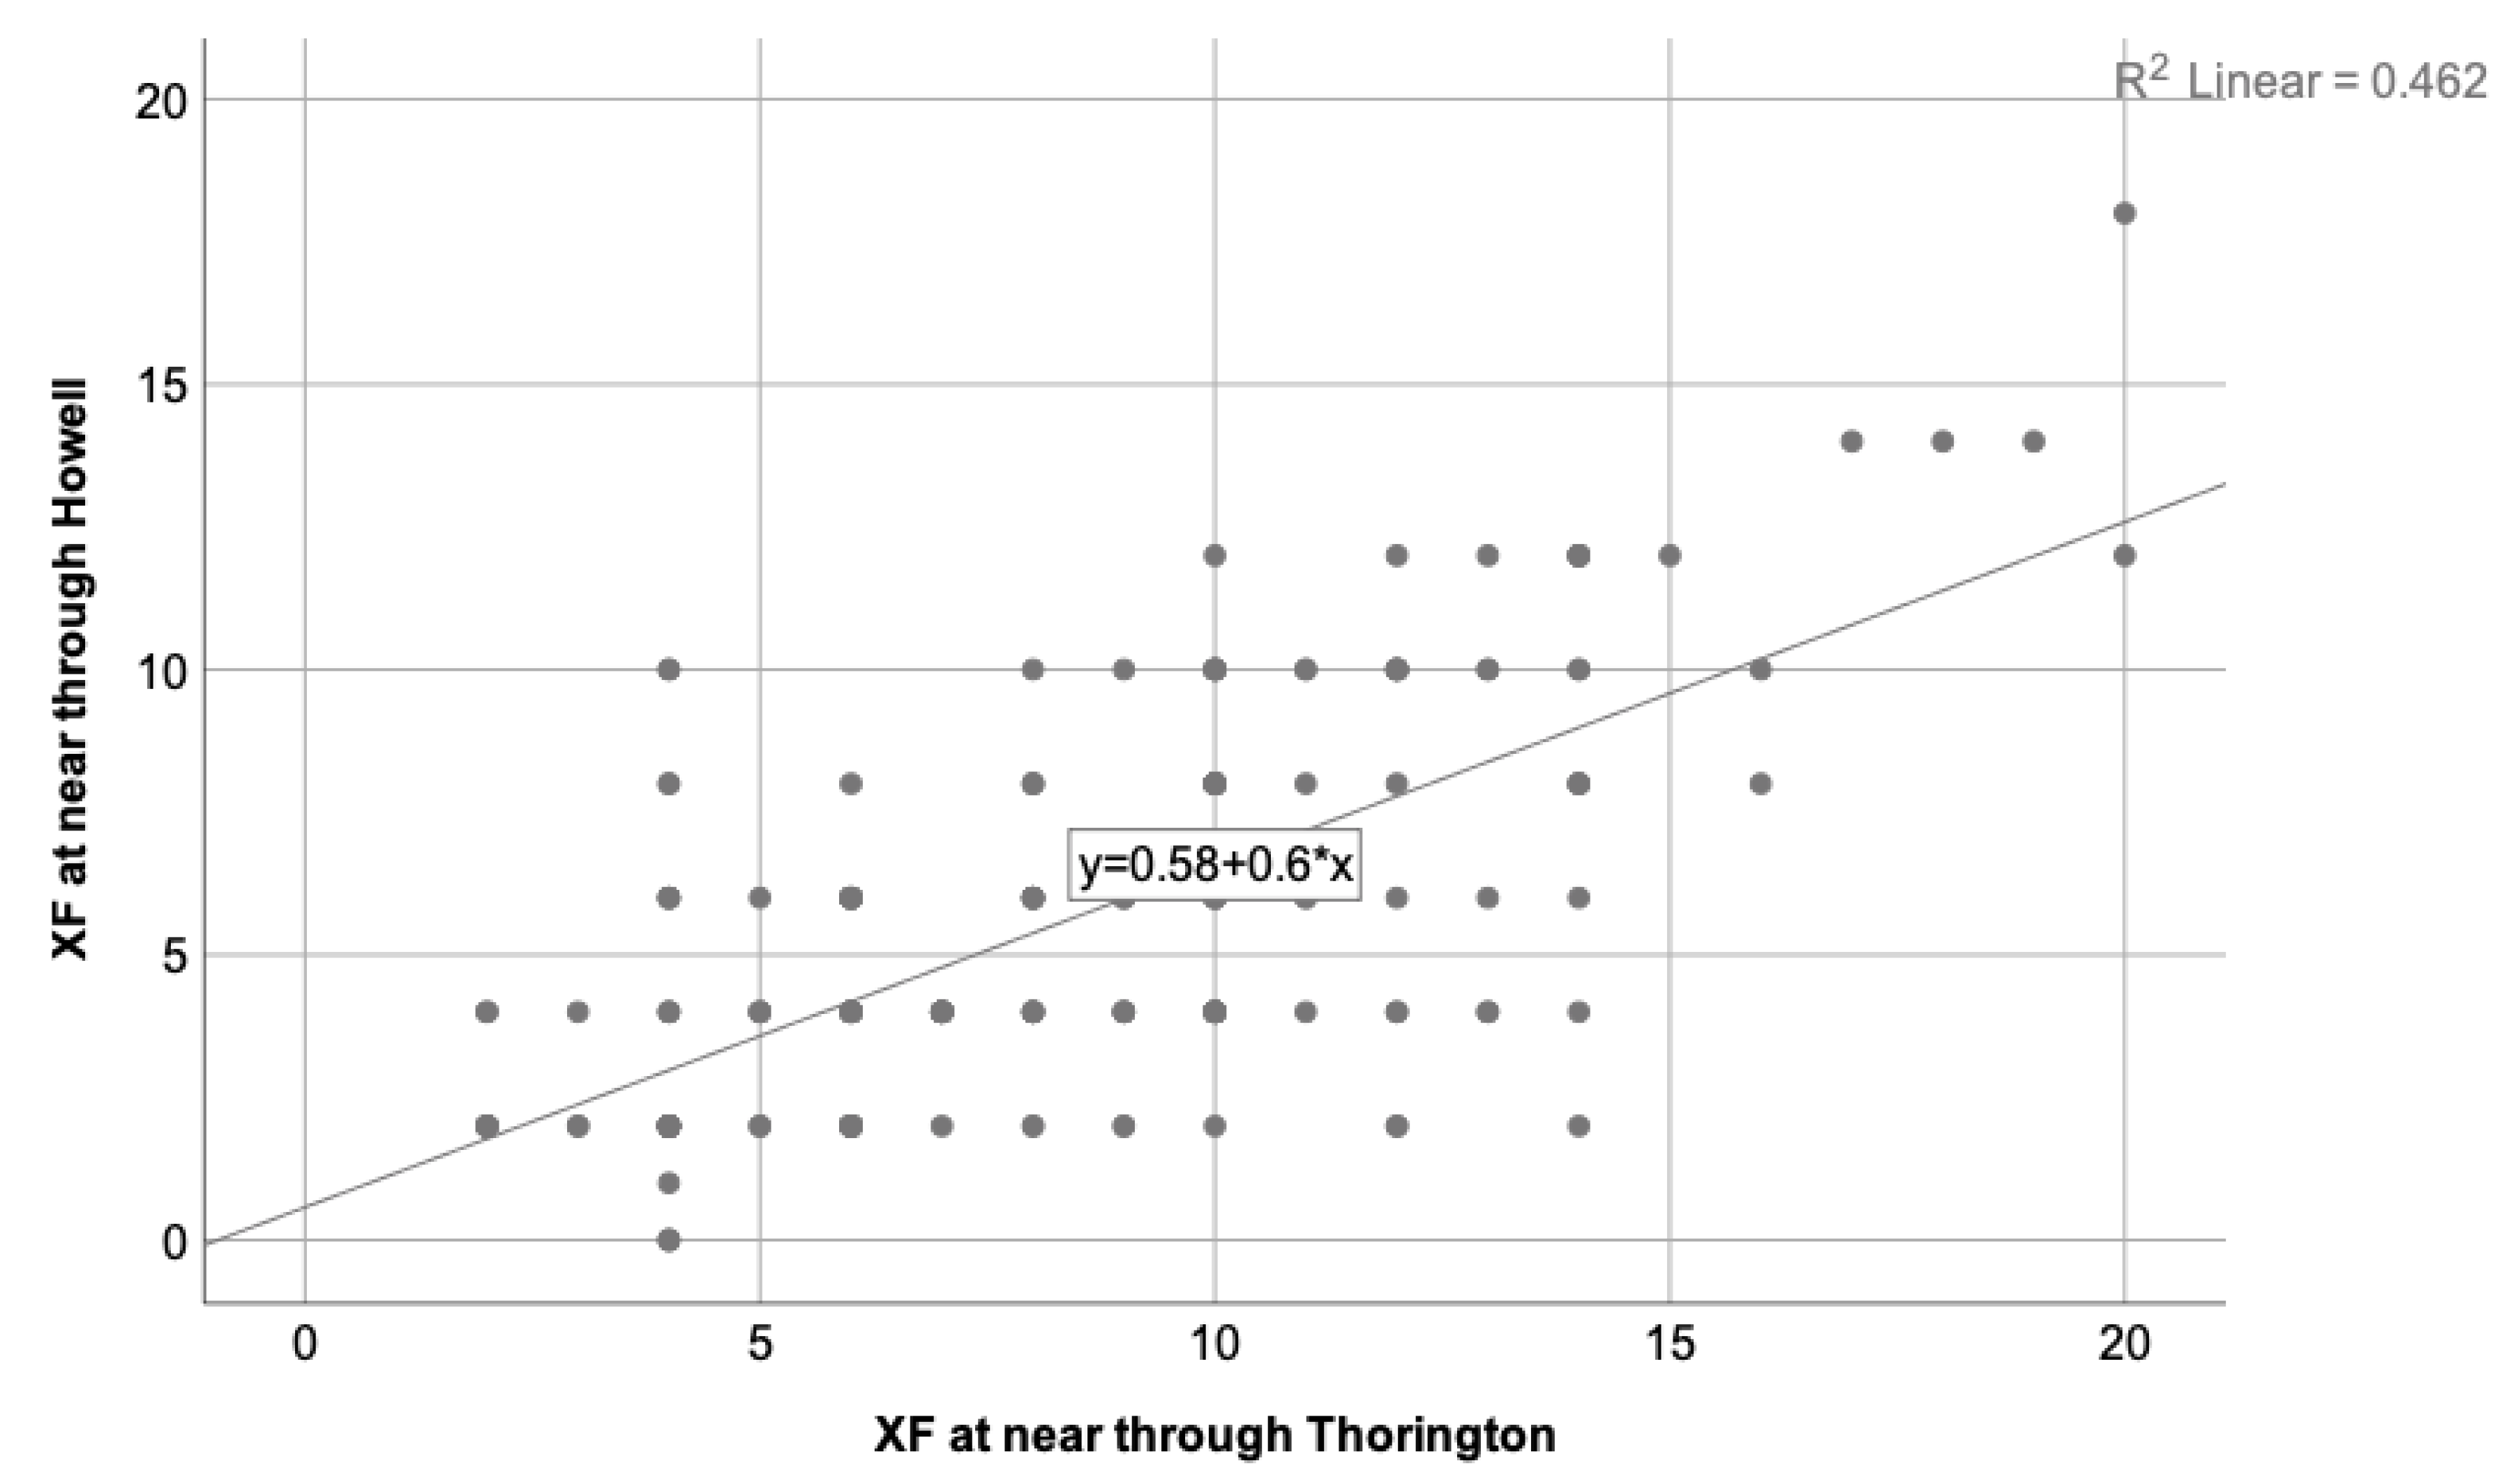
Figure 5.
Depicts the correlation found between the stereopsis degree and the break of NPC, where R = .208. A decreasing trend on the stereopsis degree is observed when the NPC value increases. Therefore, worse stereopsis is expected in patients with higher NPC value.
Figure 5.
Depicts the correlation found between the stereopsis degree and the break of NPC, where R = .208. A decreasing trend on the stereopsis degree is observed when the NPC value increases. Therefore, worse stereopsis is expected in patients with higher NPC value.
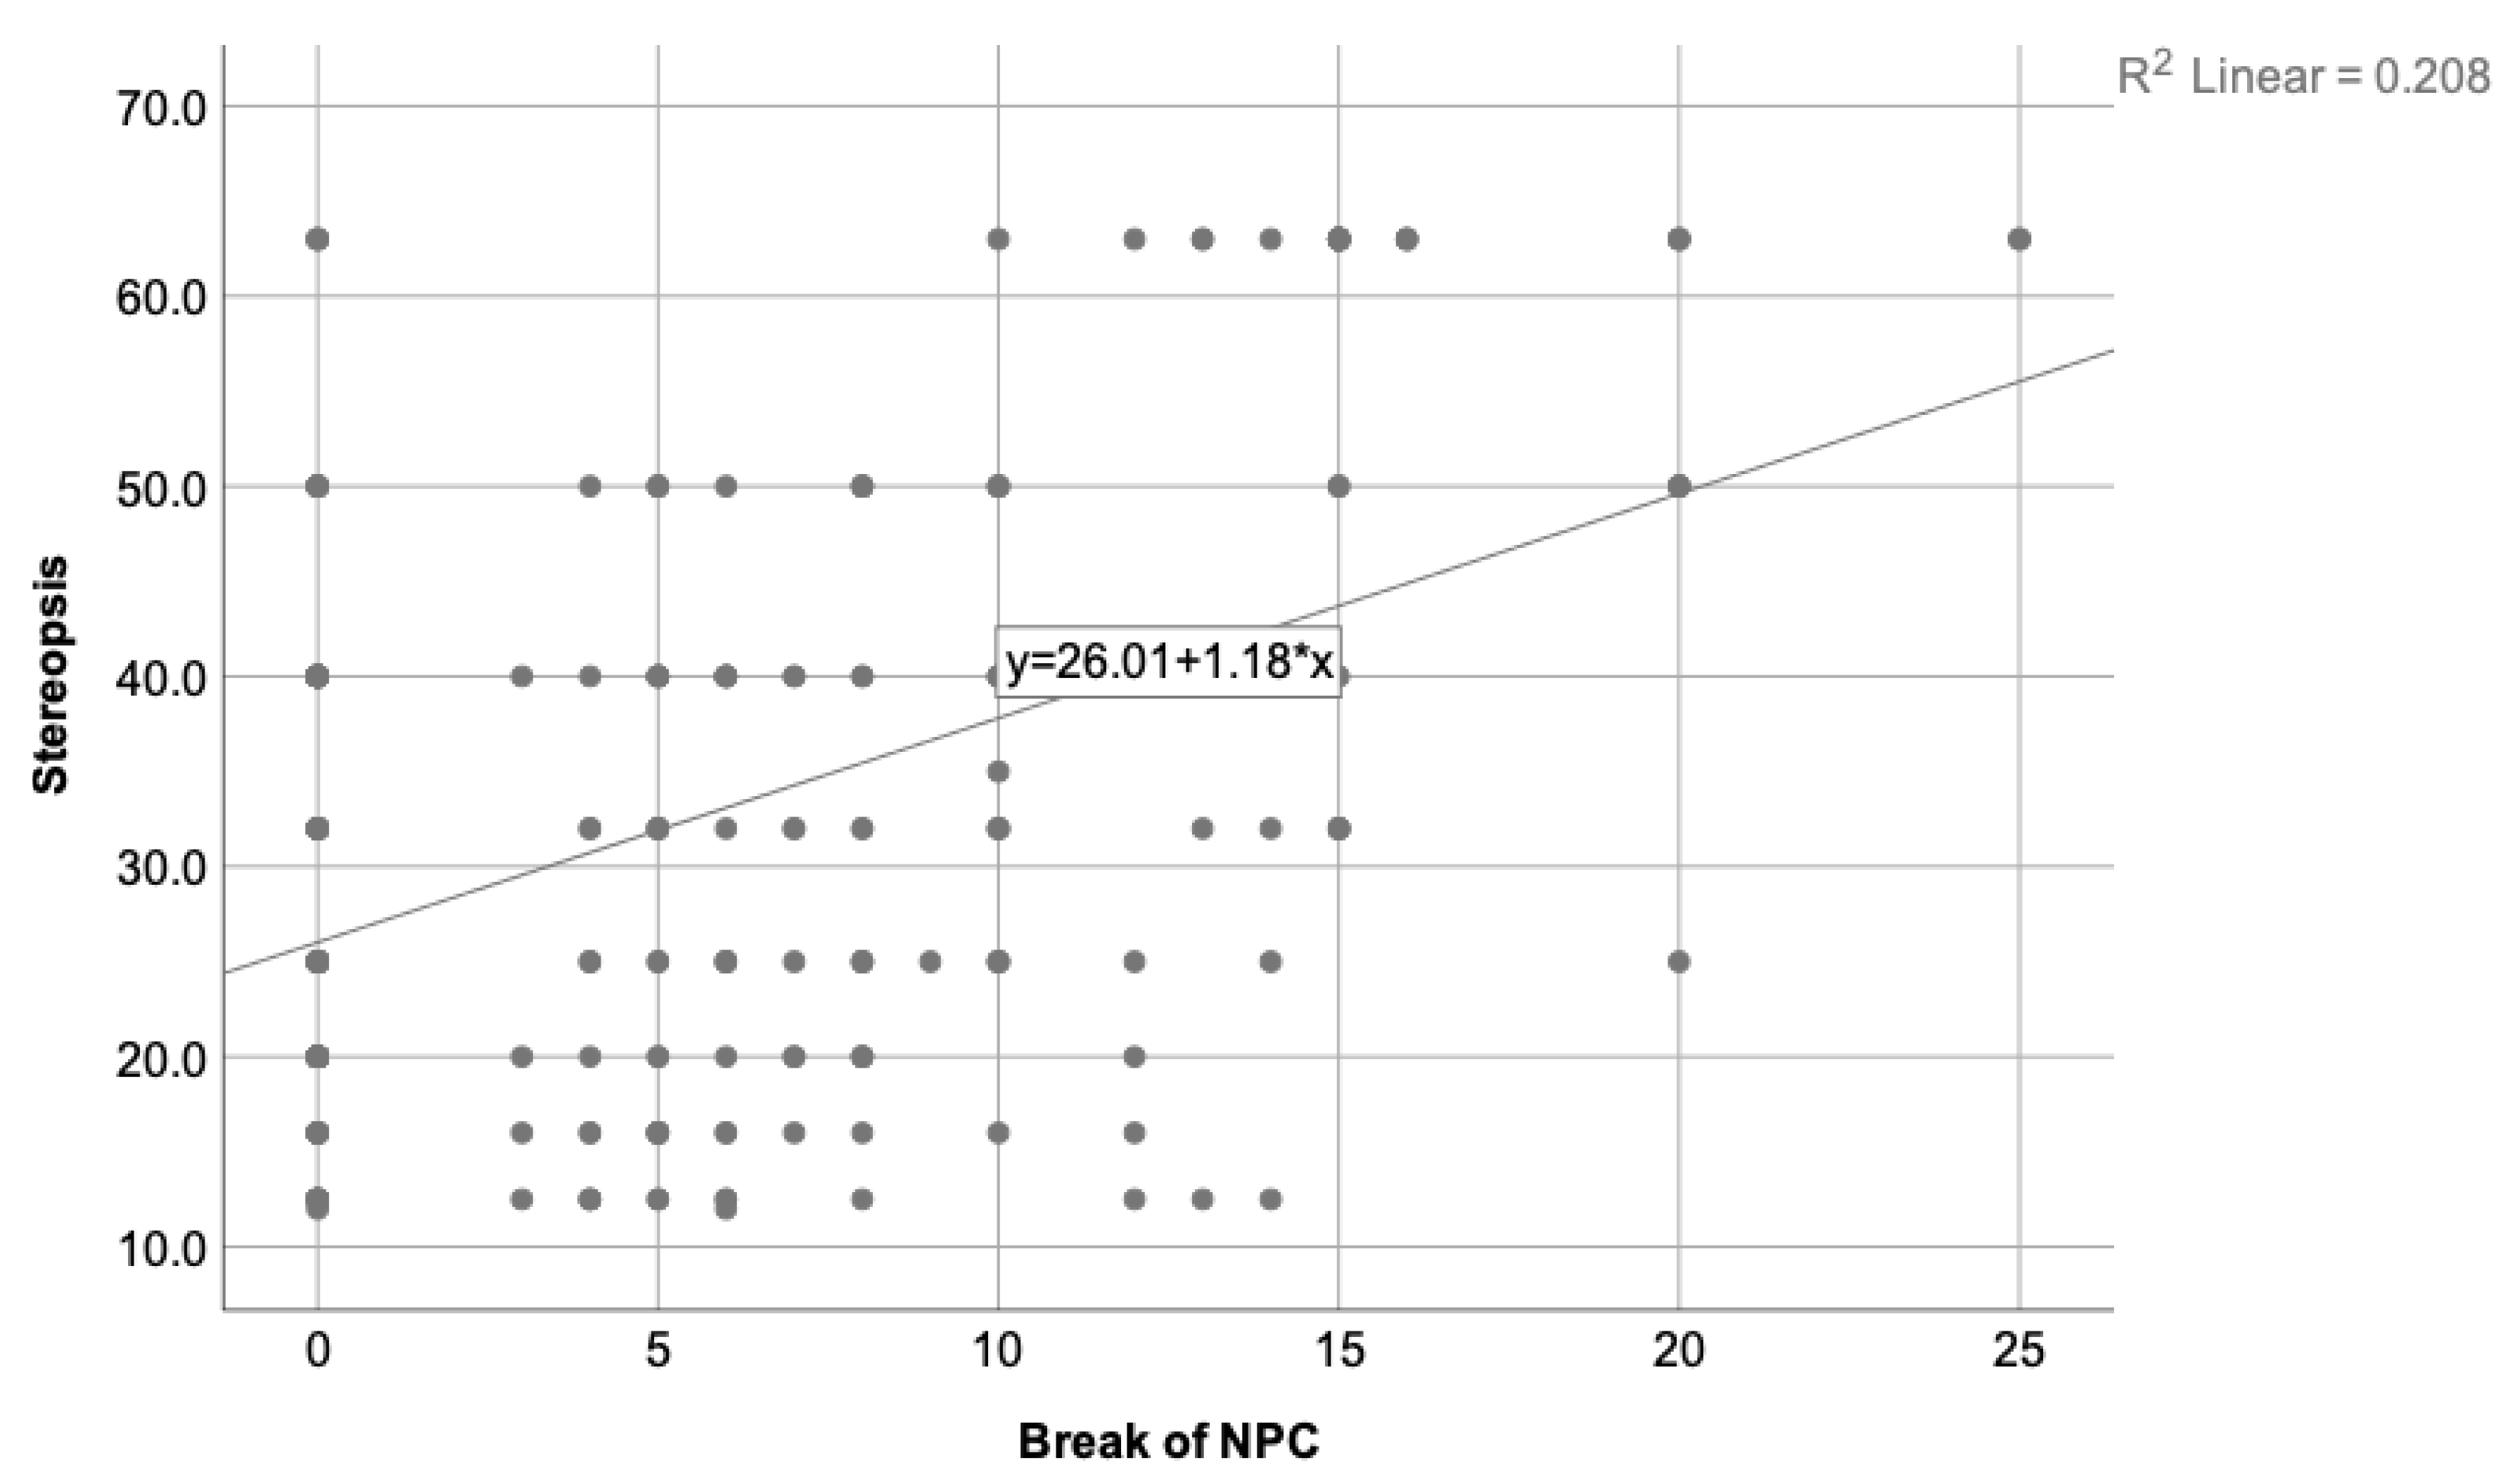
Figure 6.
Illustrates the correlation found between the stereopsis degree and the exophoria state at near measured using the Howell test, where R = .189. As the exophoria at near increases, the stereopsis decreases. Therefore, worse stereopsis is expected in patients with higher exophoria at near distance.
Figure 6.
Illustrates the correlation found between the stereopsis degree and the exophoria state at near measured using the Howell test, where R = .189. As the exophoria at near increases, the stereopsis decreases. Therefore, worse stereopsis is expected in patients with higher exophoria at near distance.
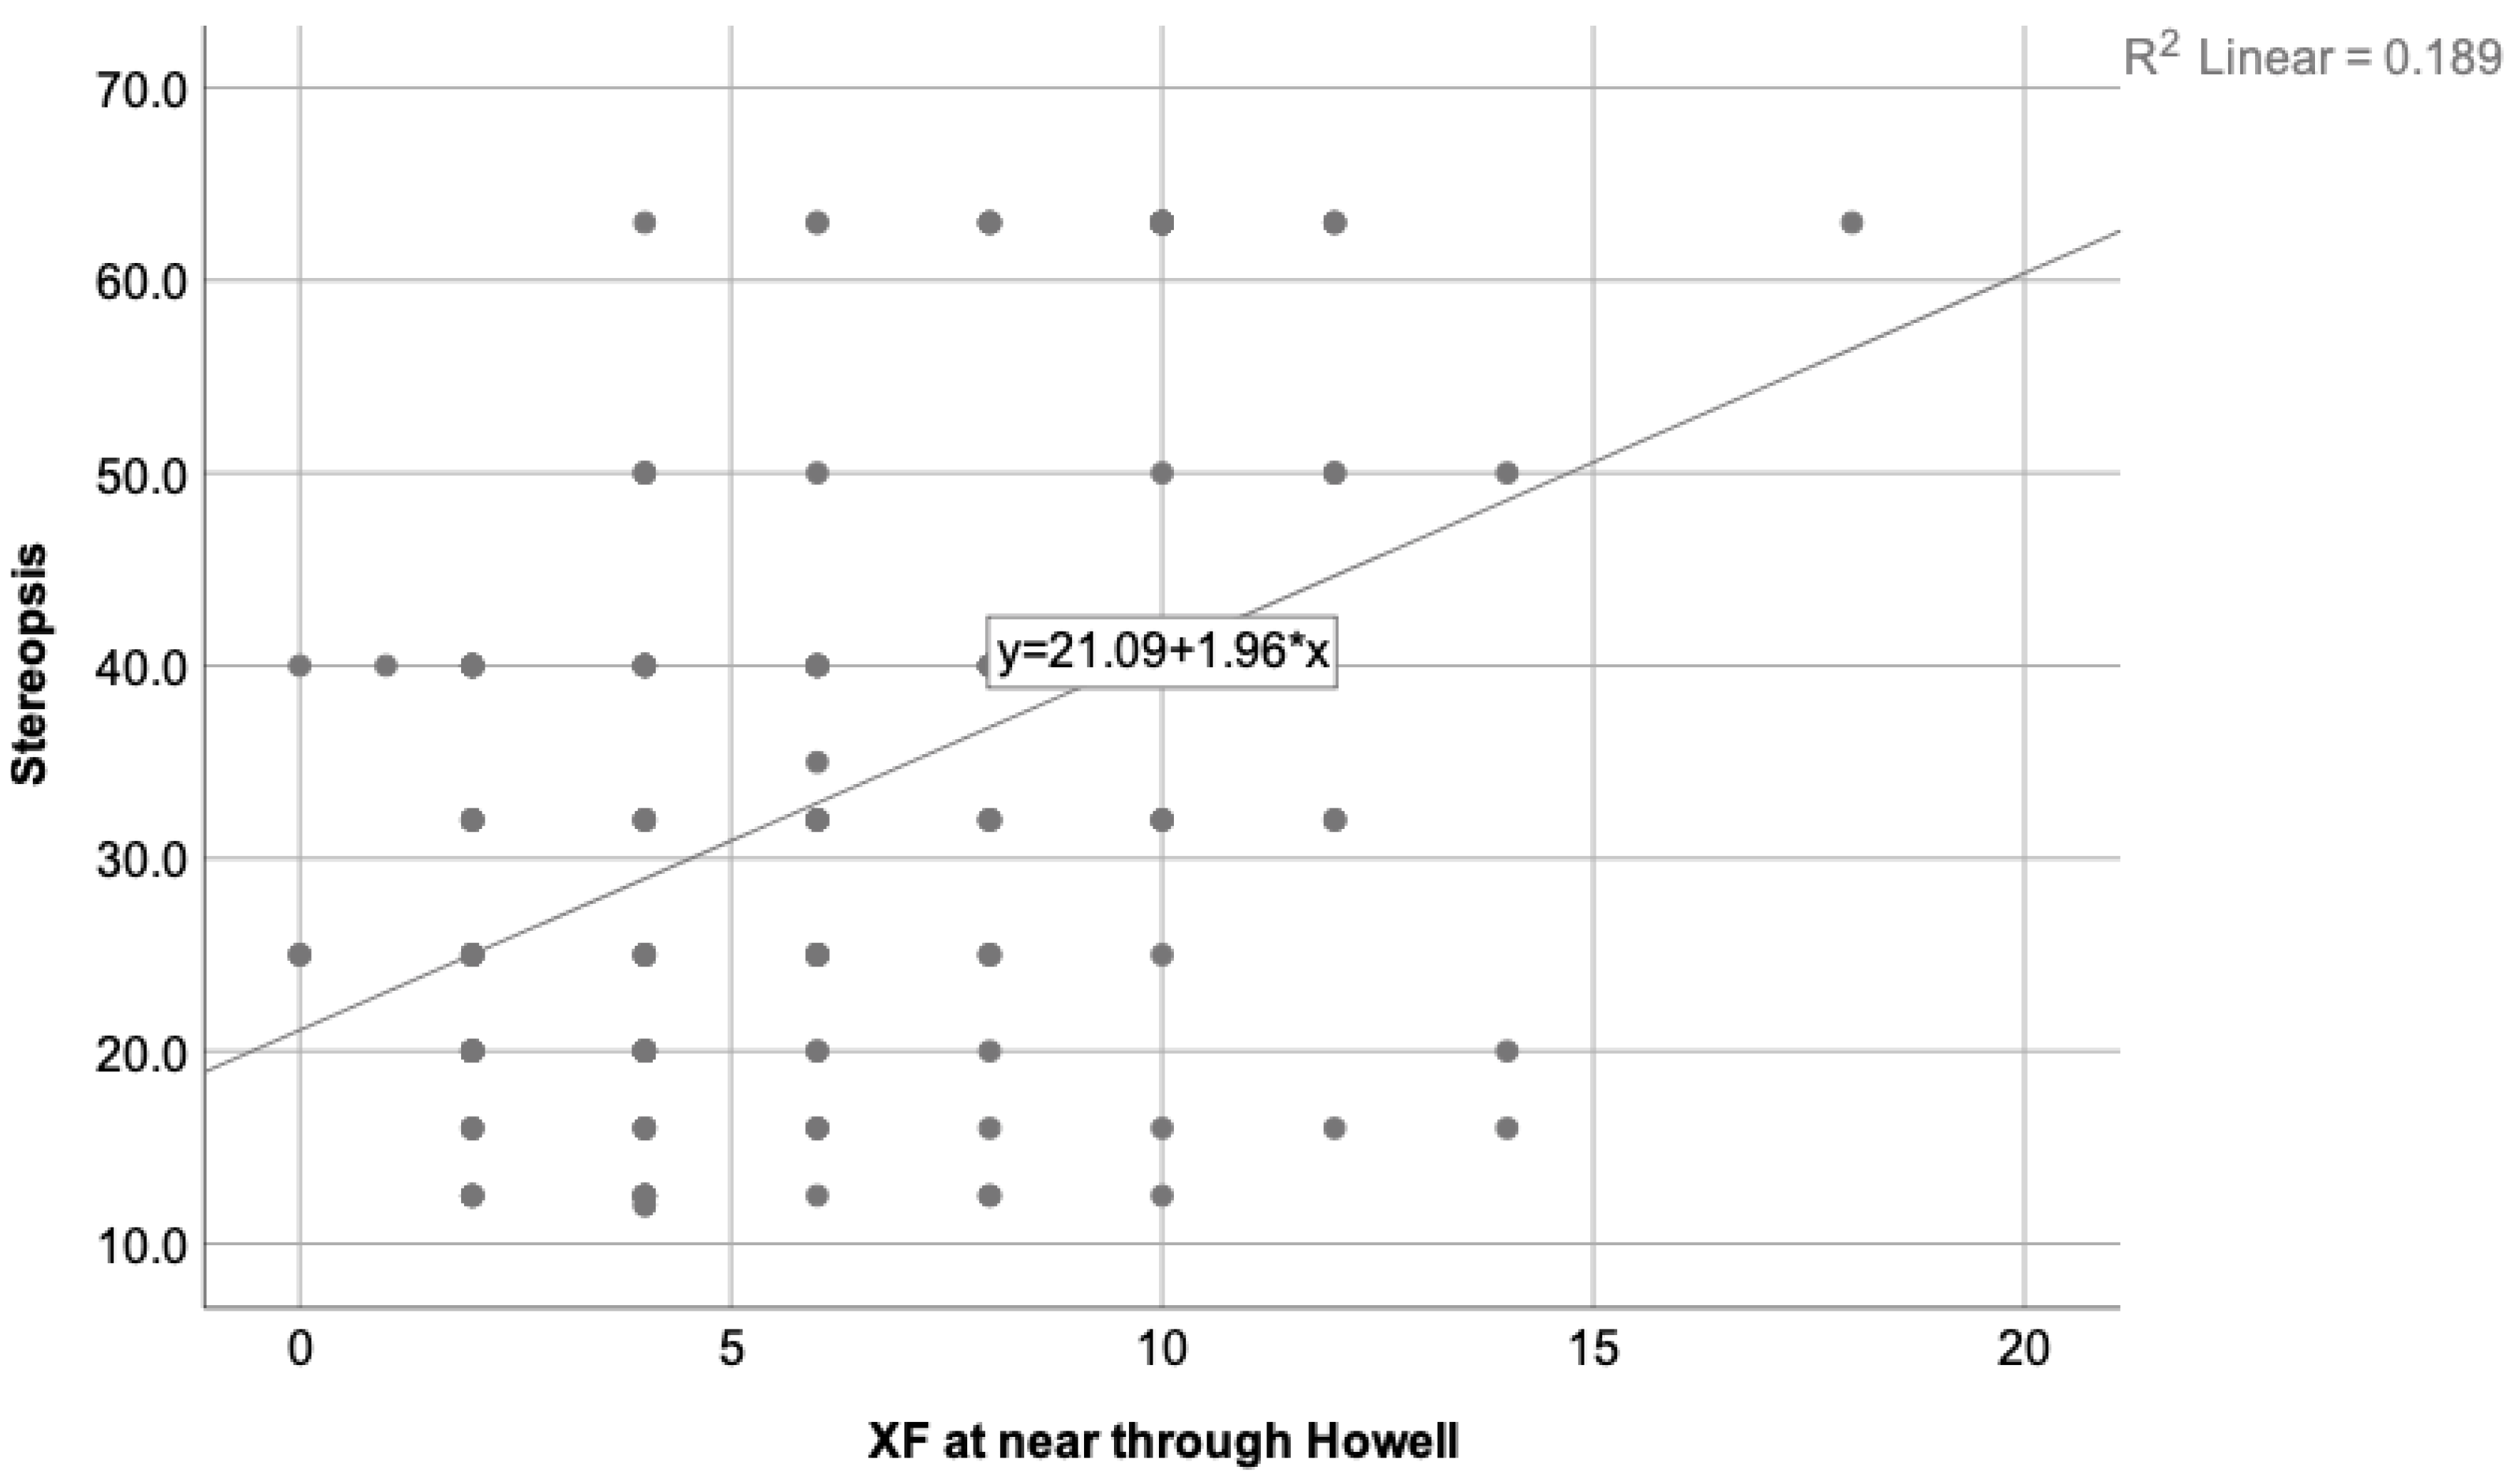
Figure 7.
Represents the correlation state between the break and recovery of NPC, where R = .916. As to be expected, participants with a high break of NPC, present higher recovery value as well, being their values proportional to each other.
Figure 7.
Represents the correlation state between the break and recovery of NPC, where R = .916. As to be expected, participants with a high break of NPC, present higher recovery value as well, being their values proportional to each other.
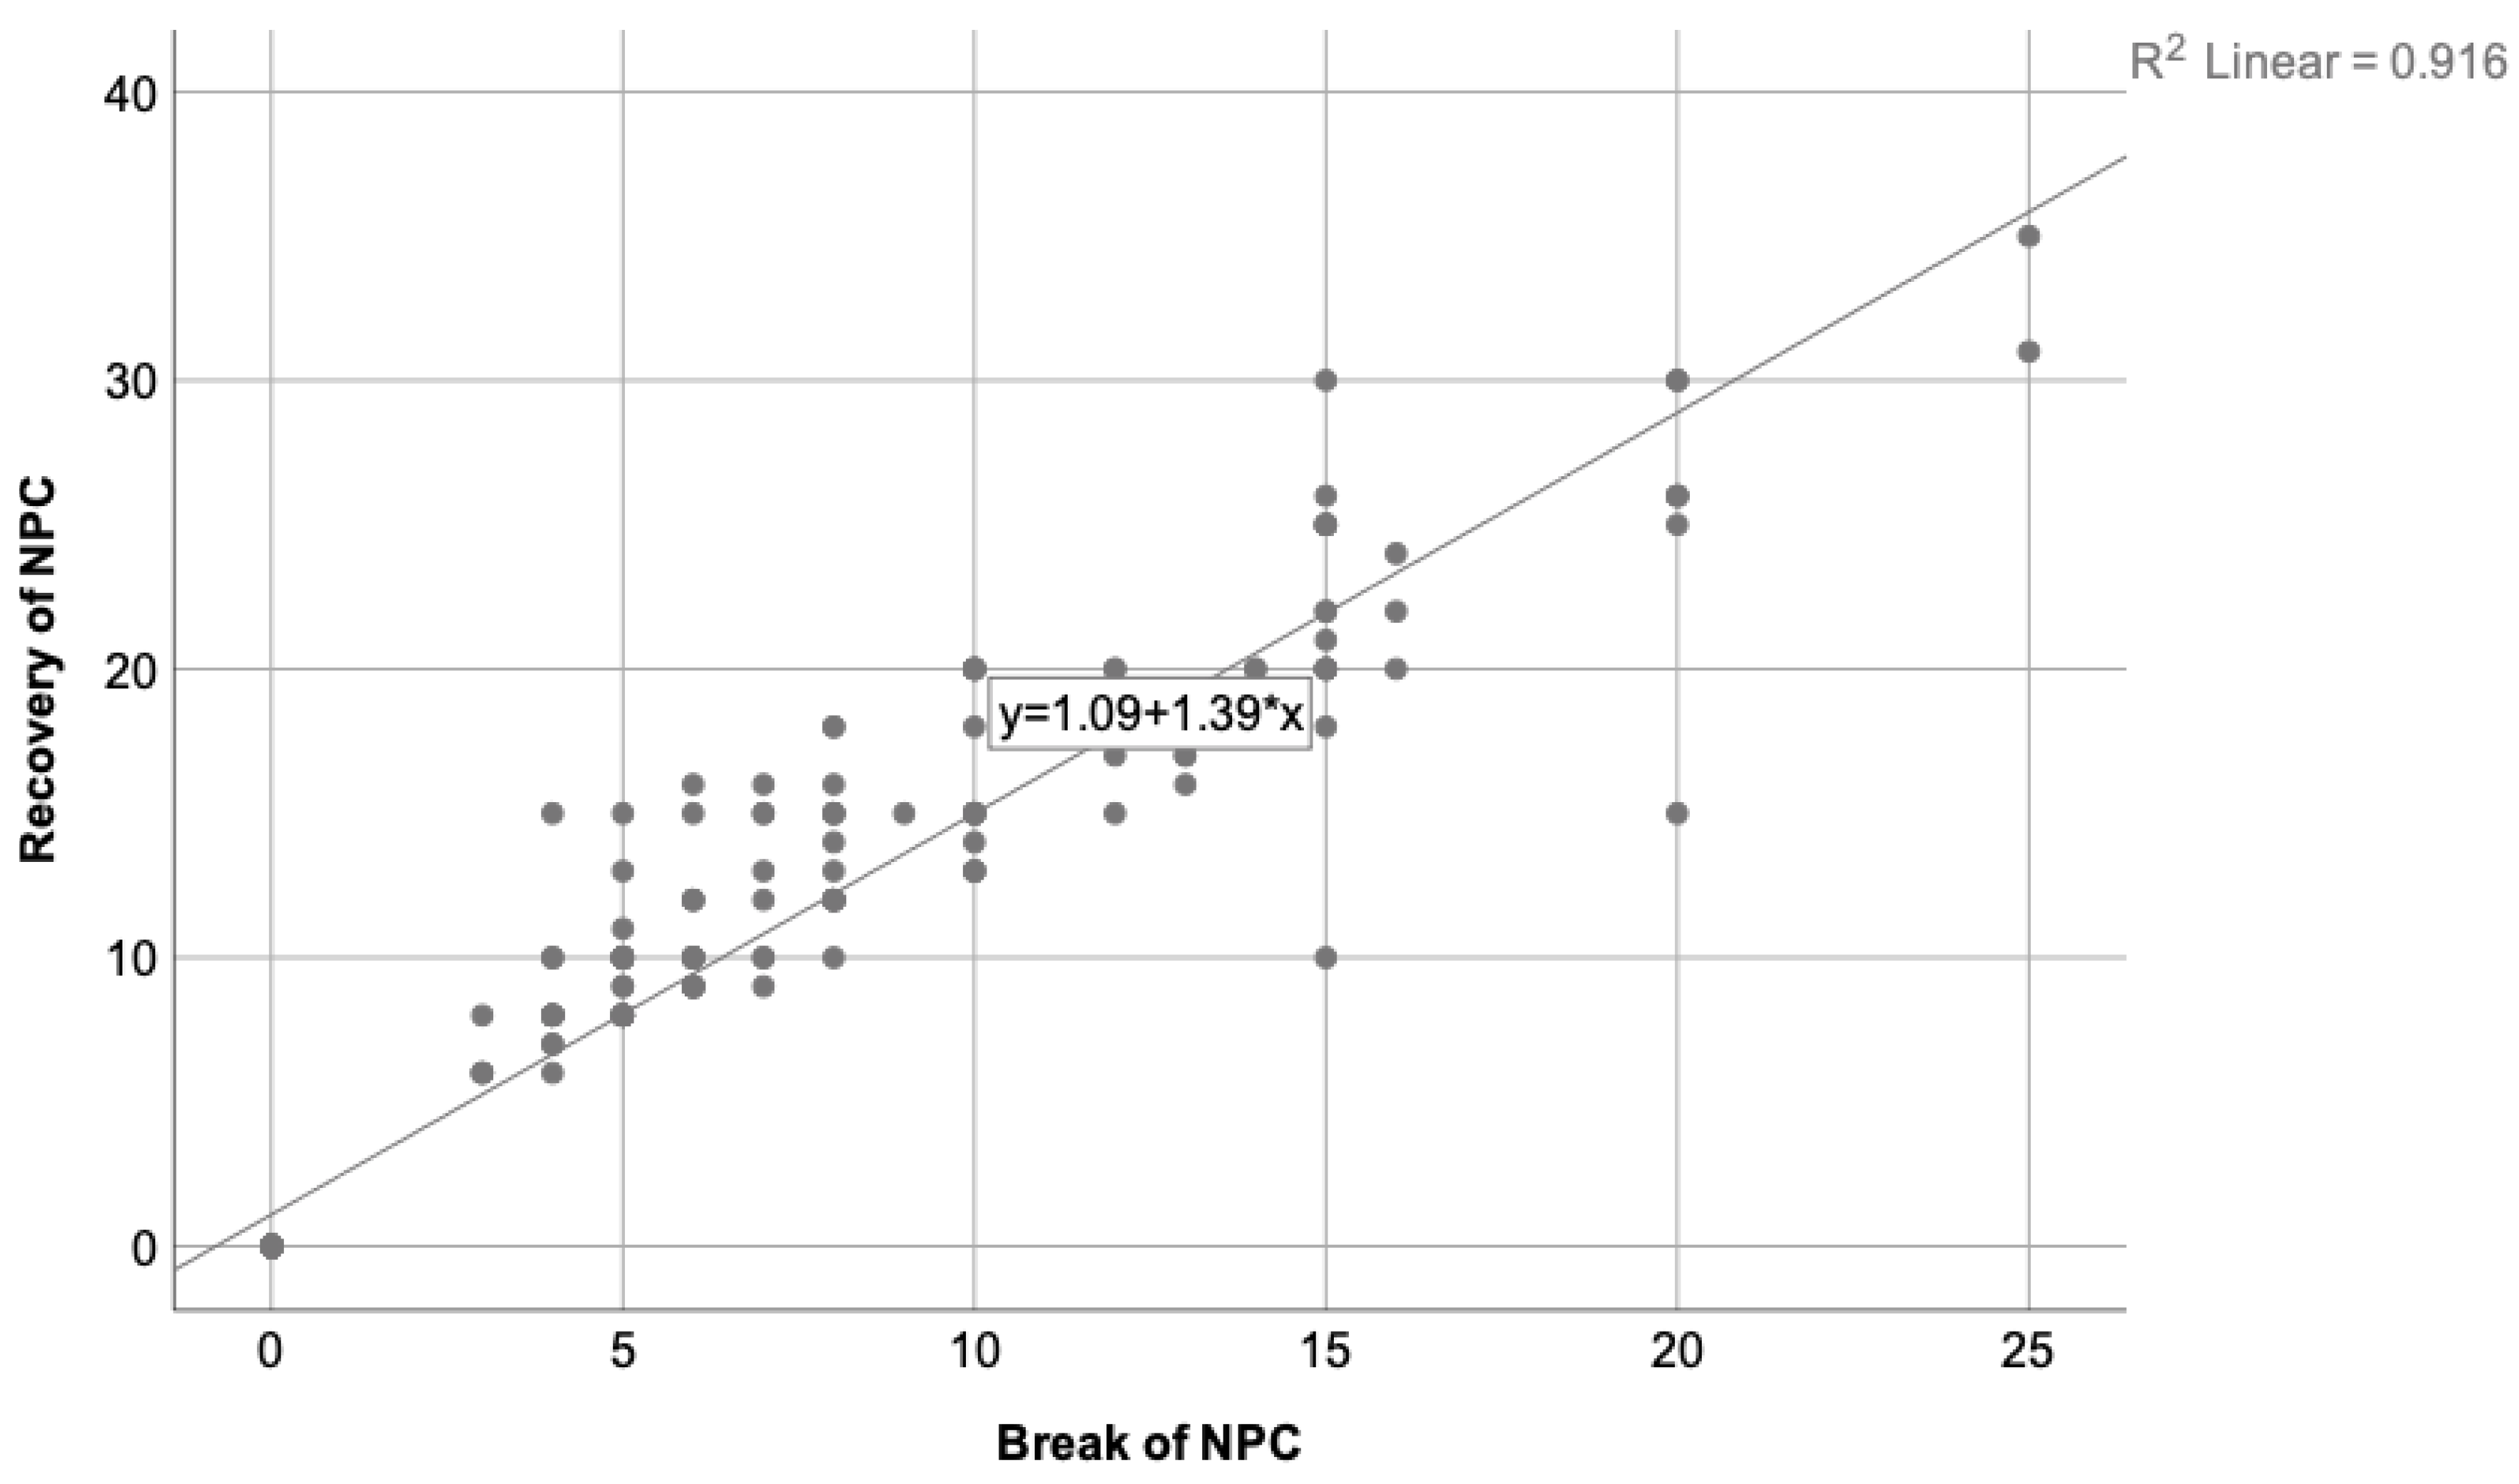
Figure 8.
Illustrates the mean stereopsis value as defined by age. Significant differences can be appreciated when the first group (5.06-8.00 years) is compared to the other two groups. The biggest difference was found between the first (5.06-8.00 years) and second group (8.01-11.00 years). No statistically differences were found between the second (8.01-11.00 years) and third group (11.01-17.11 years). Higher stereopsis degree is measured in the second group (8.01-11.00 years) and lower in the first one (5.06-8.00 years).
Figure 8.
Illustrates the mean stereopsis value as defined by age. Significant differences can be appreciated when the first group (5.06-8.00 years) is compared to the other two groups. The biggest difference was found between the first (5.06-8.00 years) and second group (8.01-11.00 years). No statistically differences were found between the second (8.01-11.00 years) and third group (11.01-17.11 years). Higher stereopsis degree is measured in the second group (8.01-11.00 years) and lower in the first one (5.06-8.00 years).
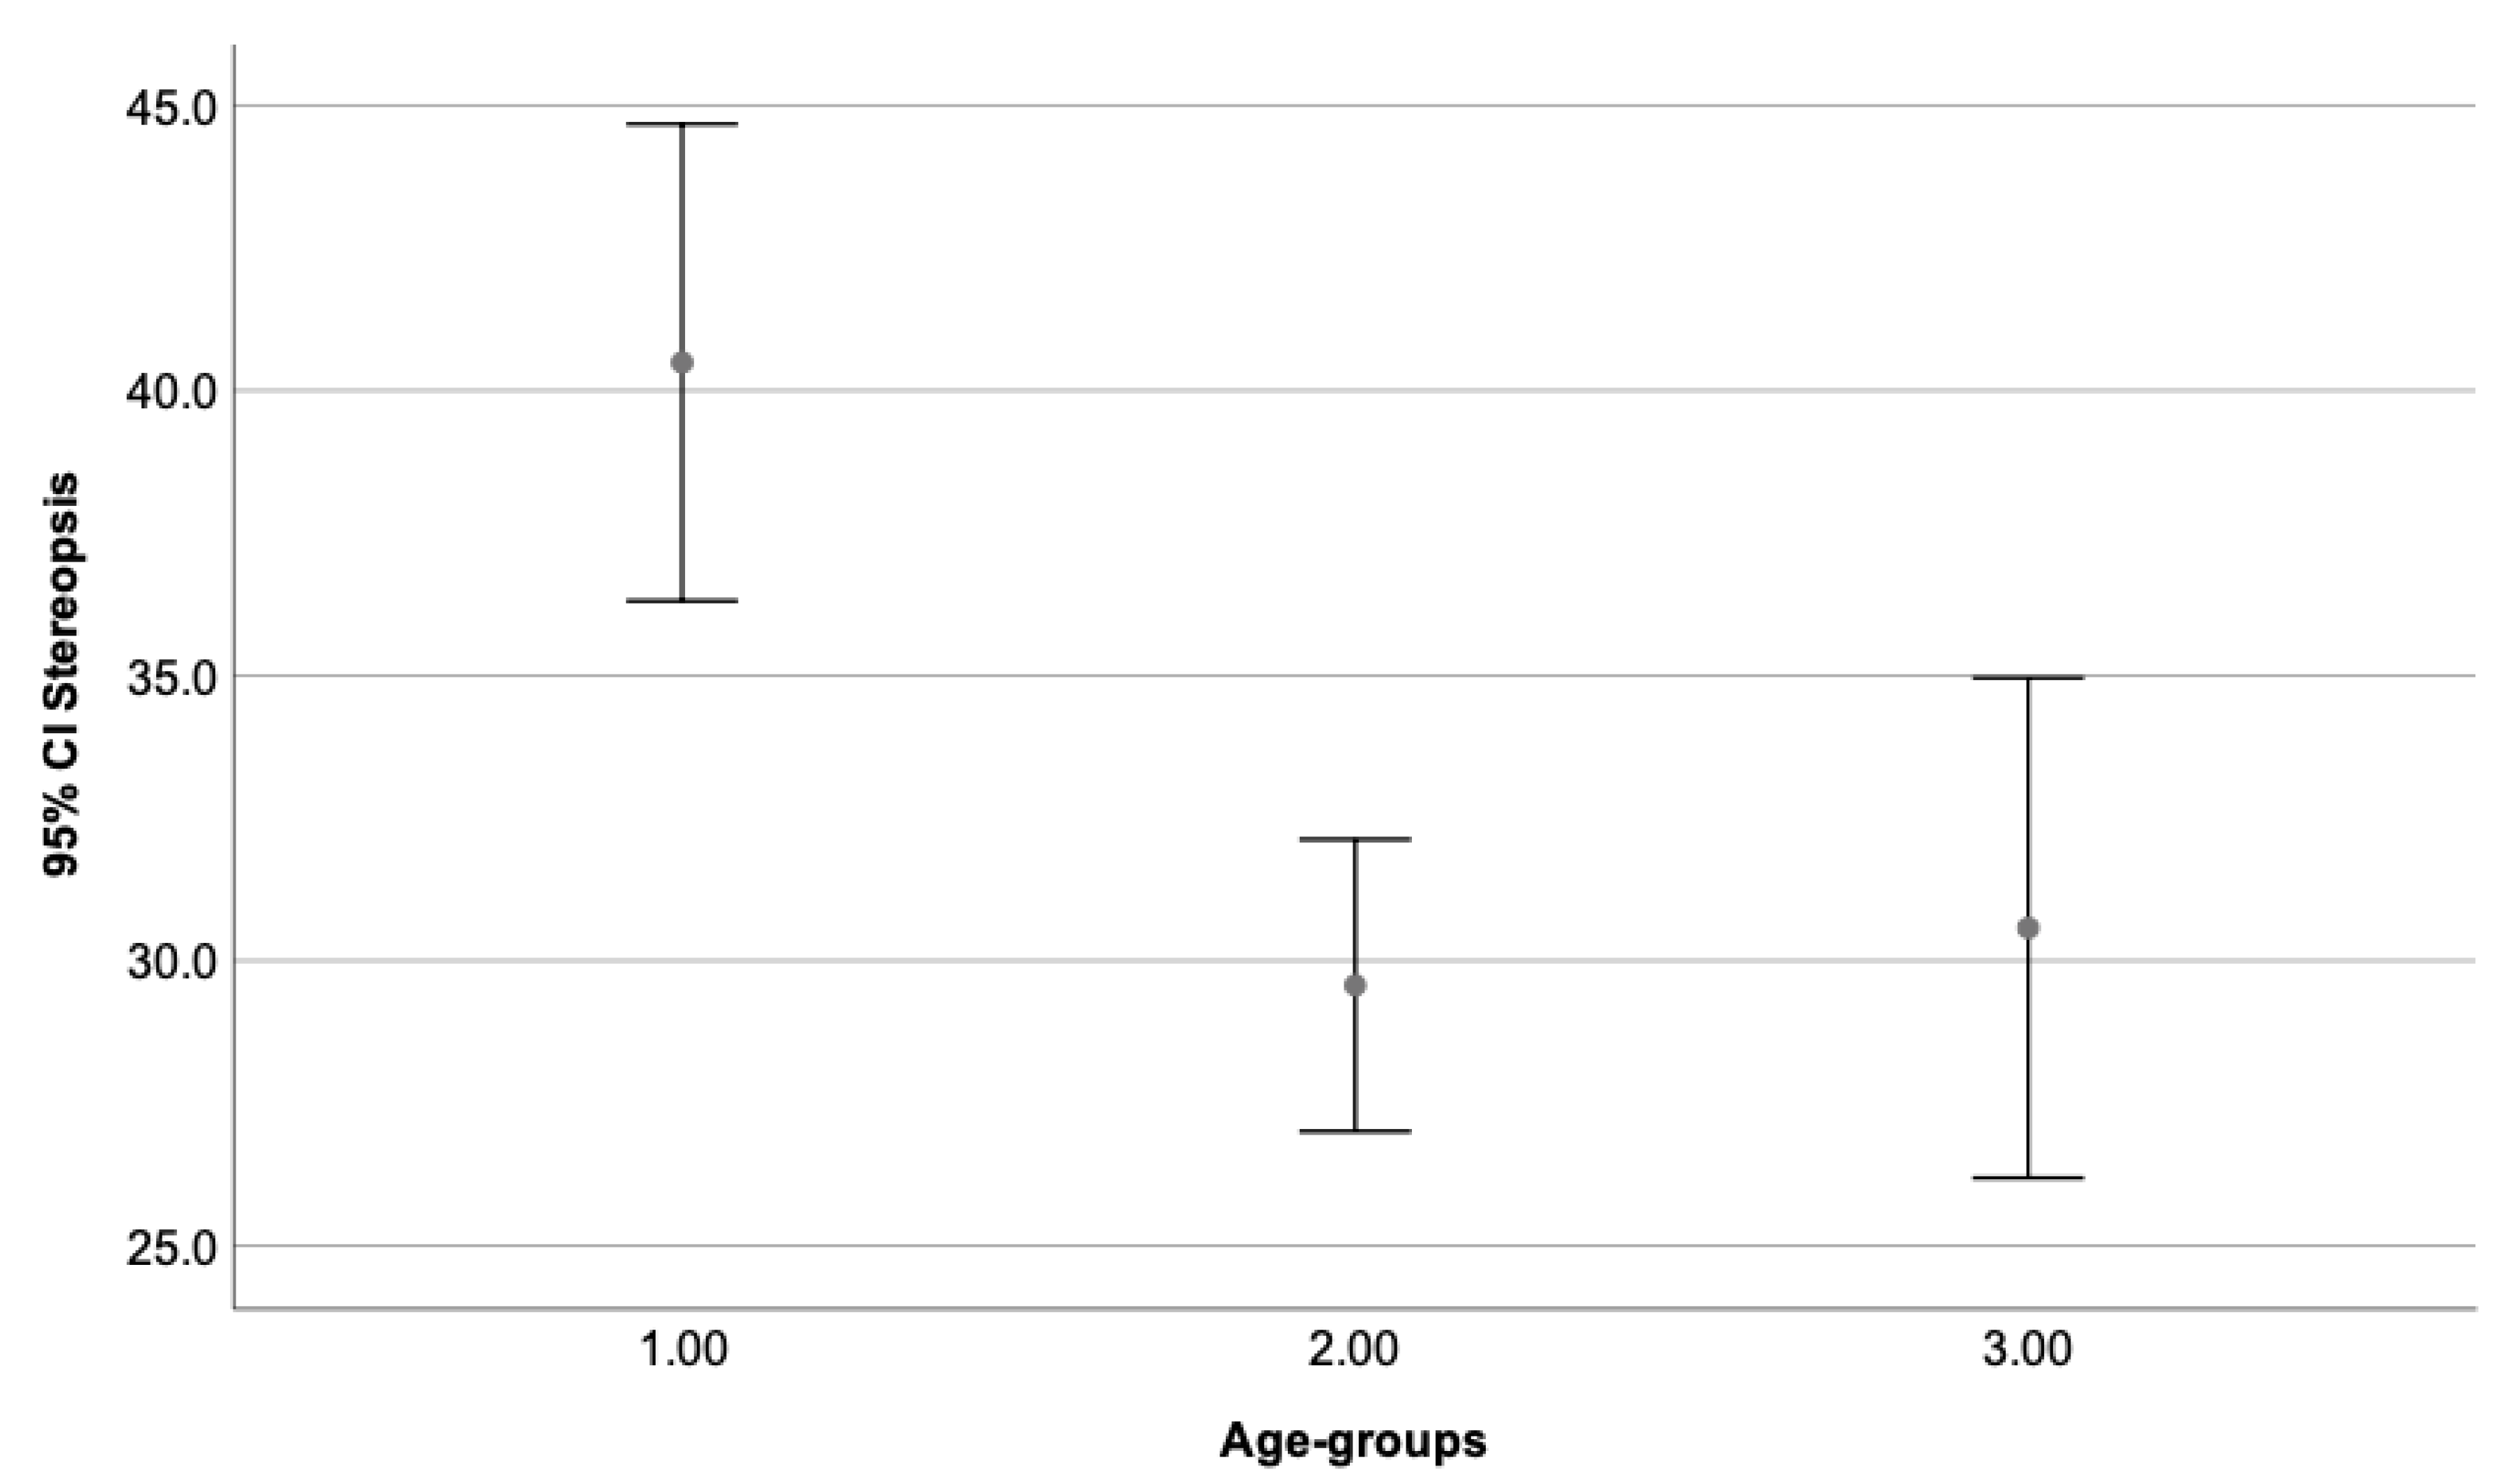
Figure 9.
Presents the mean break value of NPC as defined by age, where the second group obtained the lowest value and the third the highest one. Statistically significant differences can be appreciated when the second group (8.01-11.00 years) is compared to the first (5.06-8.00 years) and third one (11.01-17.11 years). The biggest difference was found between the mean break value of the second (8.01-11.00 years) and third group (11.01-17.11 years). No differences were presented between the first (5.06-8.00 years) and third group (11.01-17.11 years).
Figure 9.
Presents the mean break value of NPC as defined by age, where the second group obtained the lowest value and the third the highest one. Statistically significant differences can be appreciated when the second group (8.01-11.00 years) is compared to the first (5.06-8.00 years) and third one (11.01-17.11 years). The biggest difference was found between the mean break value of the second (8.01-11.00 years) and third group (11.01-17.11 years). No differences were presented between the first (5.06-8.00 years) and third group (11.01-17.11 years).
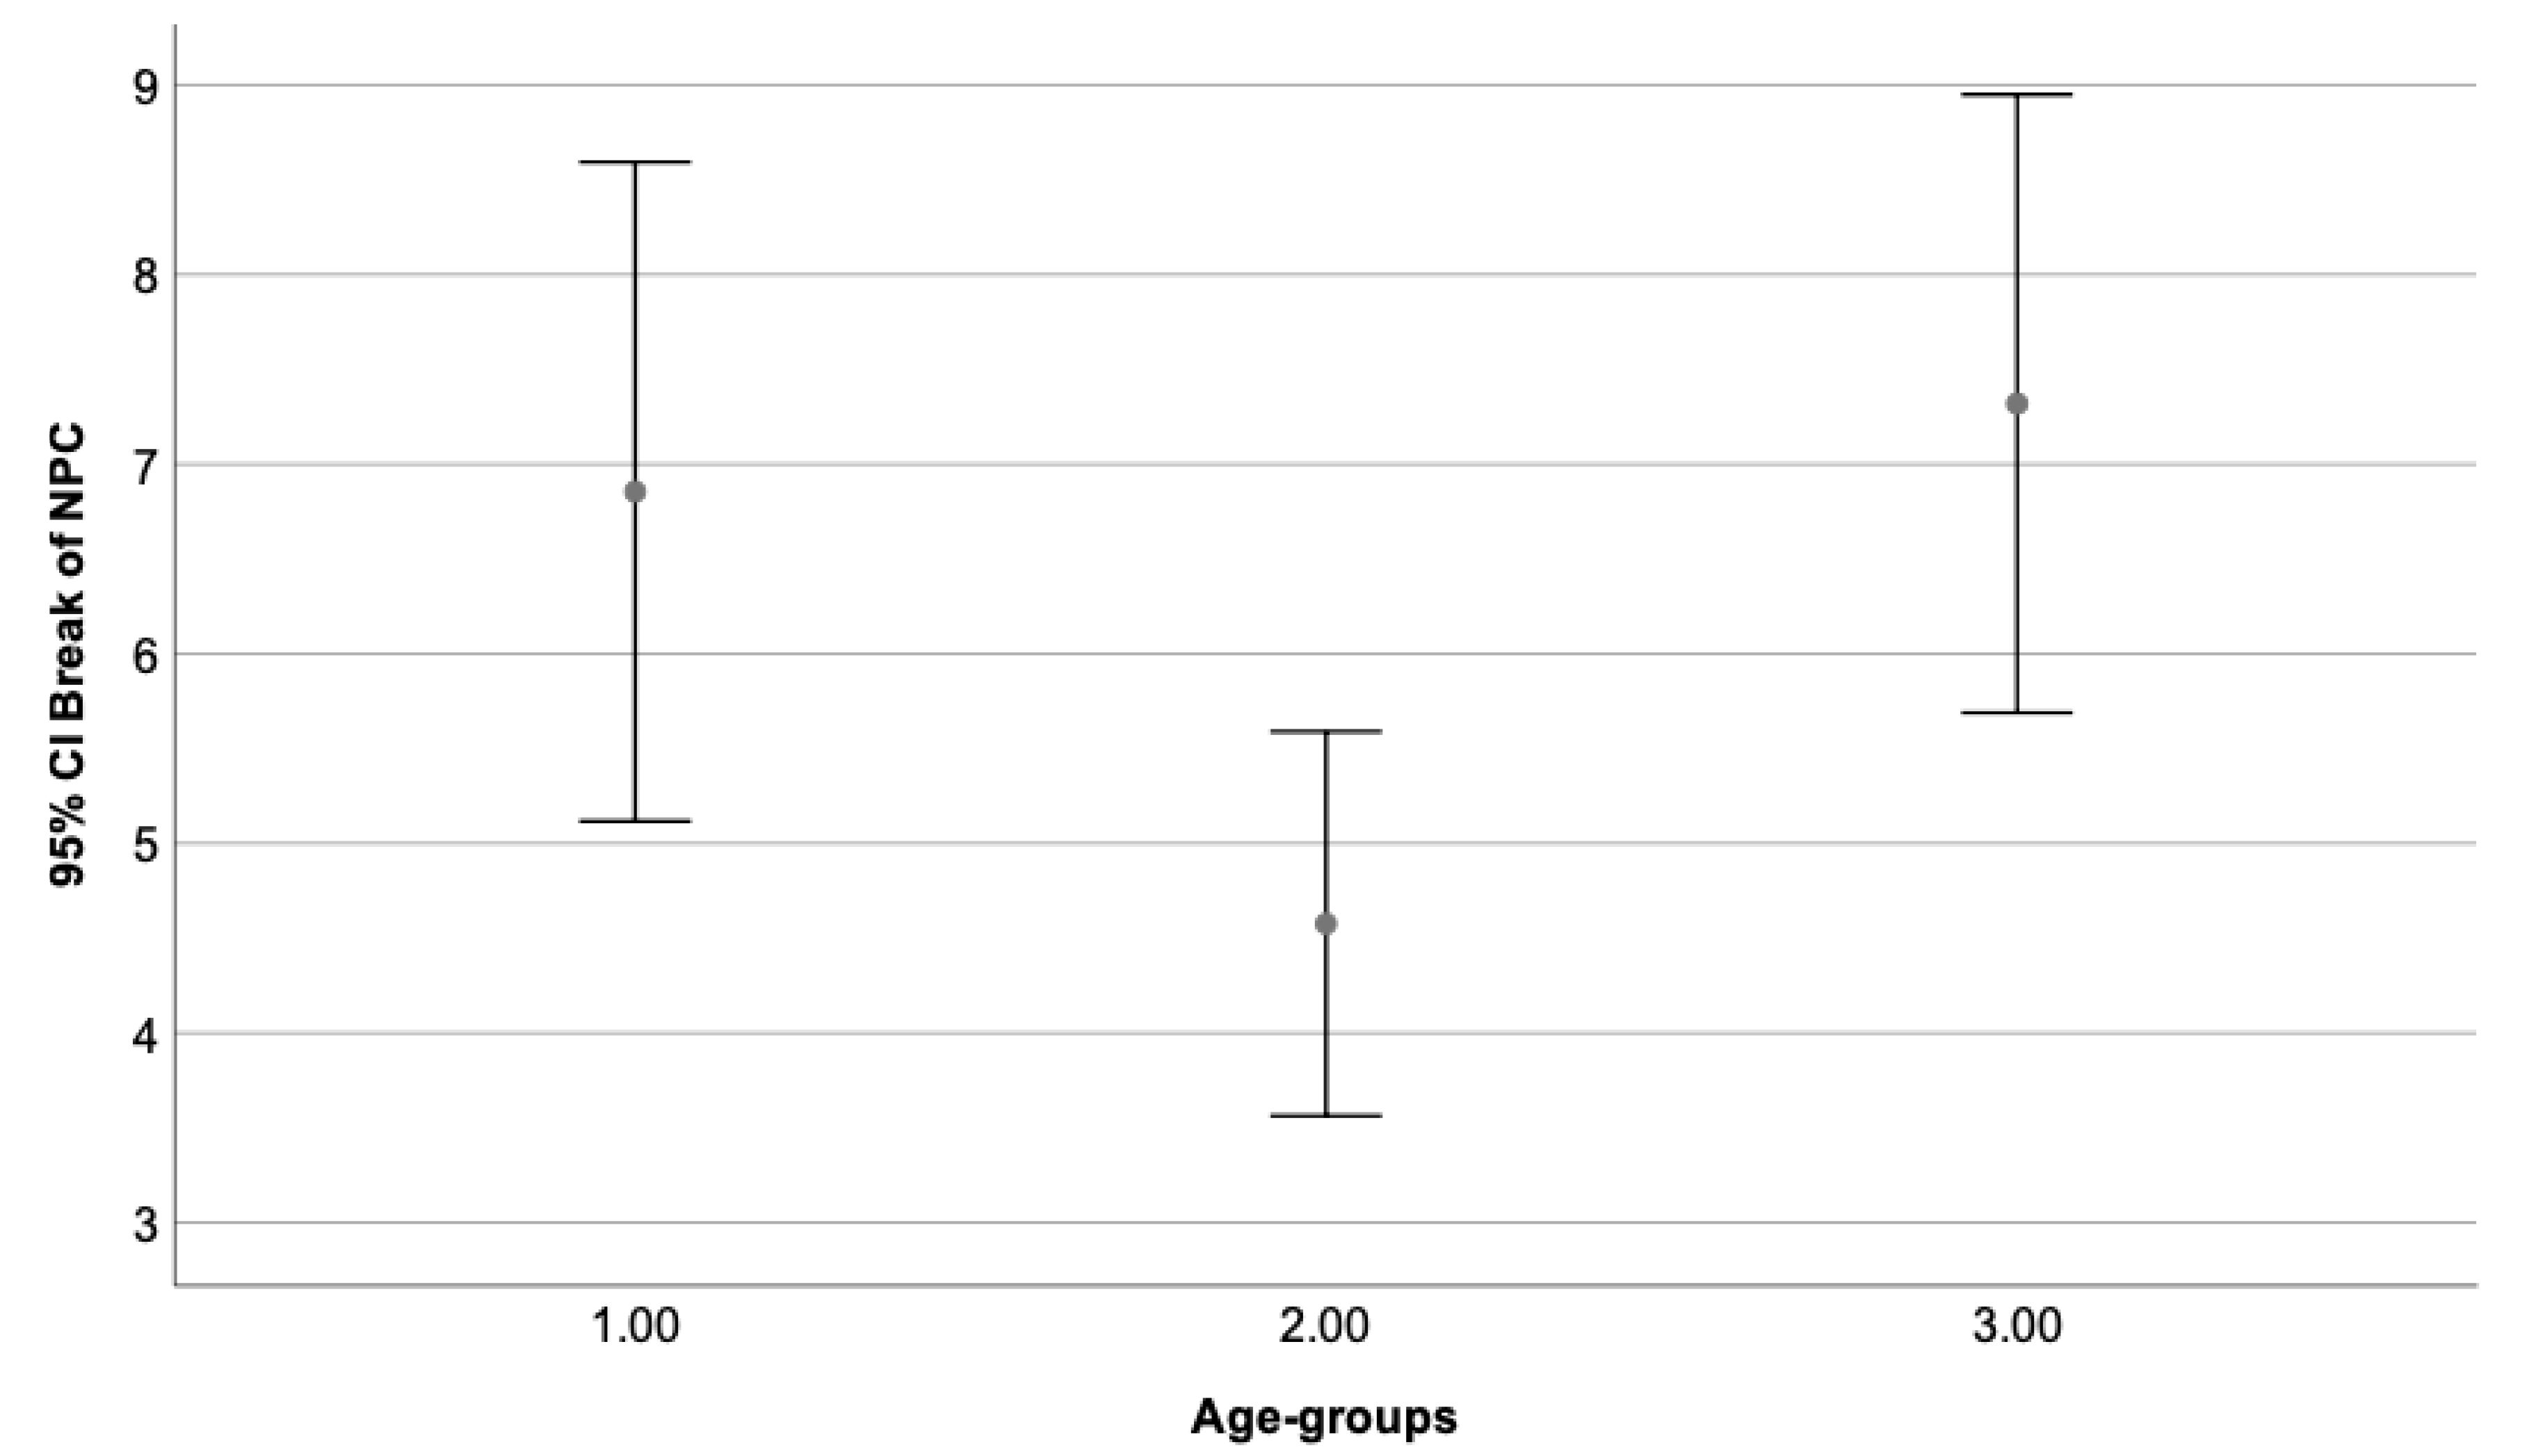
Figure 10.
Shows the mean stereopsis degree as a dependent variable of the break value of NPC, where the third group (break of 11-25 cm) obtained the lowest value and the first one (break of 0-5 cm), the highest one. Statistically significant differences can be appreciated when the third group (11-25 cm) is compared to the first (0-5 cm) and second one (6-10 cm). As to be expected, no differences were seen between the first (0-5 cm) and second group (6-10 cm), being values from 0-10 cm considered within normal limits.
Figure 10.
Shows the mean stereopsis degree as a dependent variable of the break value of NPC, where the third group (break of 11-25 cm) obtained the lowest value and the first one (break of 0-5 cm), the highest one. Statistically significant differences can be appreciated when the third group (11-25 cm) is compared to the first (0-5 cm) and second one (6-10 cm). As to be expected, no differences were seen between the first (0-5 cm) and second group (6-10 cm), being values from 0-10 cm considered within normal limits.
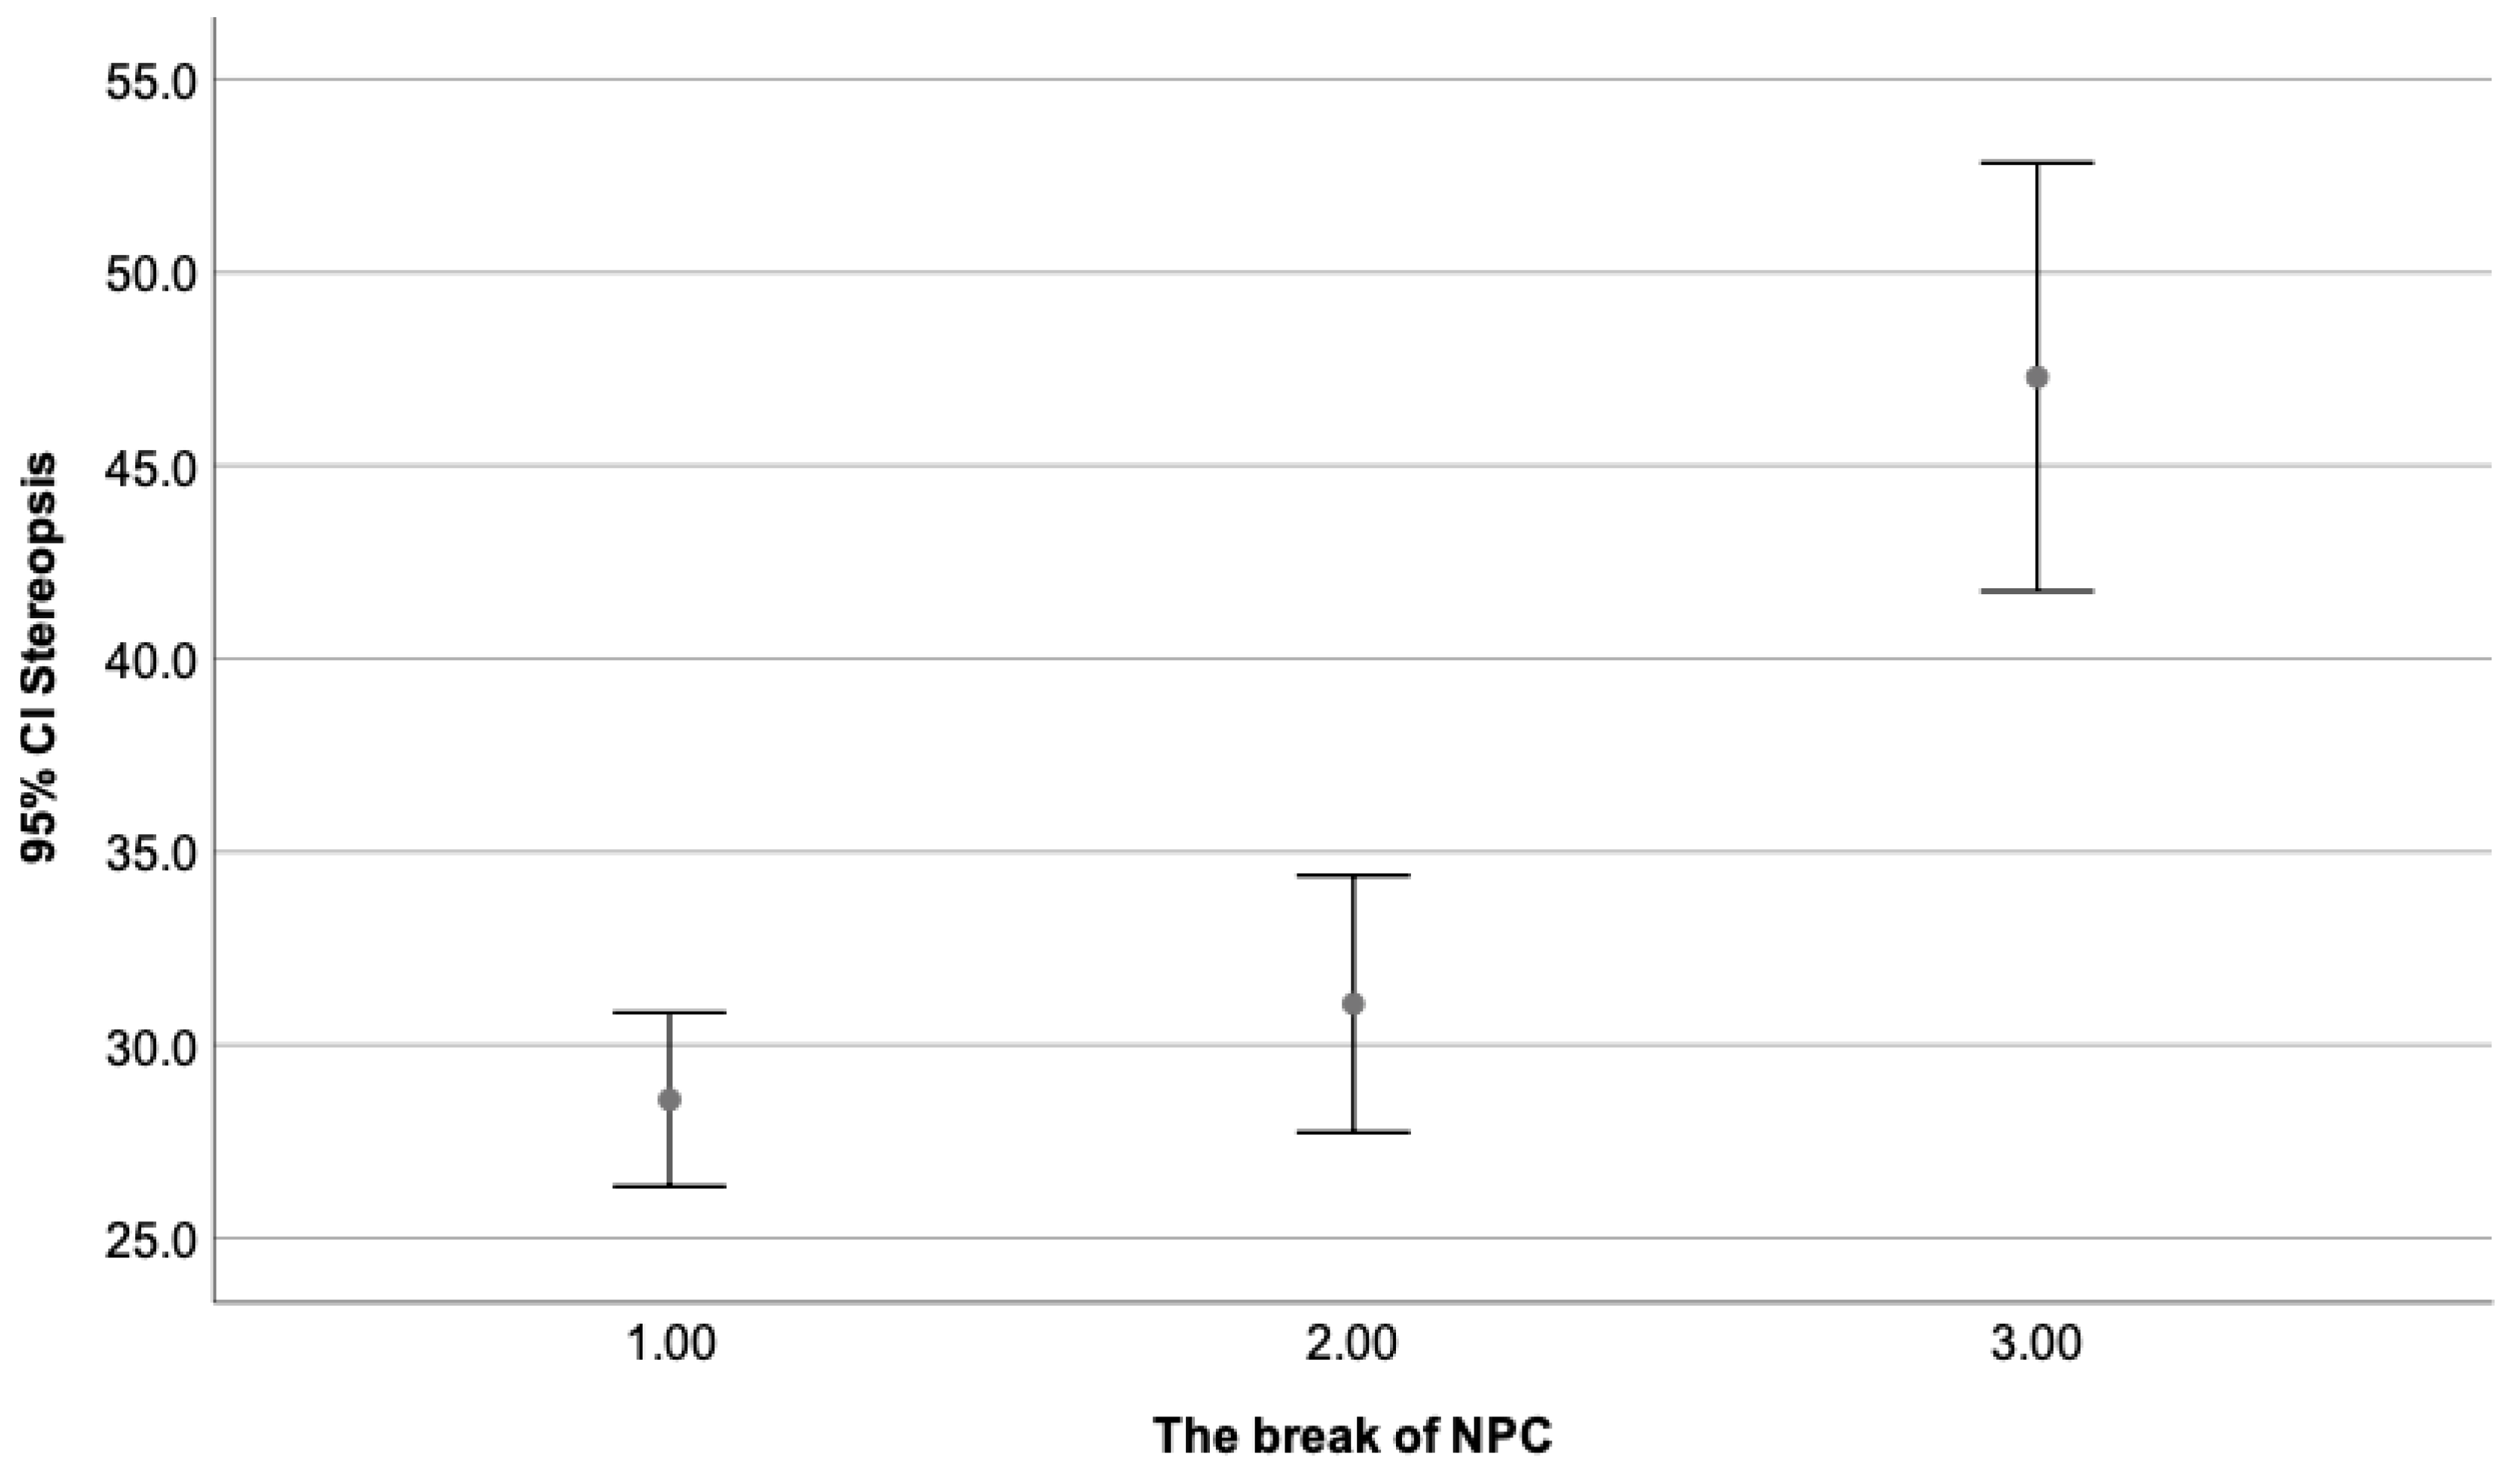
Figure 11.
Presents the exophoria state at near as a dependent variable of the break value of NPC, where the third group (break of 11-25 cm) obtained the highest value and the first one (break of 0-5 cm), the lowest one. Statistically significant differences can be appreciated when the third group (11-25 cm) is compared to the first (0-5 cm) and second one (6-10 cm). No differences were found between the first (0-5cm) and second group (6-10 cm), being these values considered within normal limits.
Figure 11.
Presents the exophoria state at near as a dependent variable of the break value of NPC, where the third group (break of 11-25 cm) obtained the highest value and the first one (break of 0-5 cm), the lowest one. Statistically significant differences can be appreciated when the third group (11-25 cm) is compared to the first (0-5 cm) and second one (6-10 cm). No differences were found between the first (0-5cm) and second group (6-10 cm), being these values considered within normal limits.
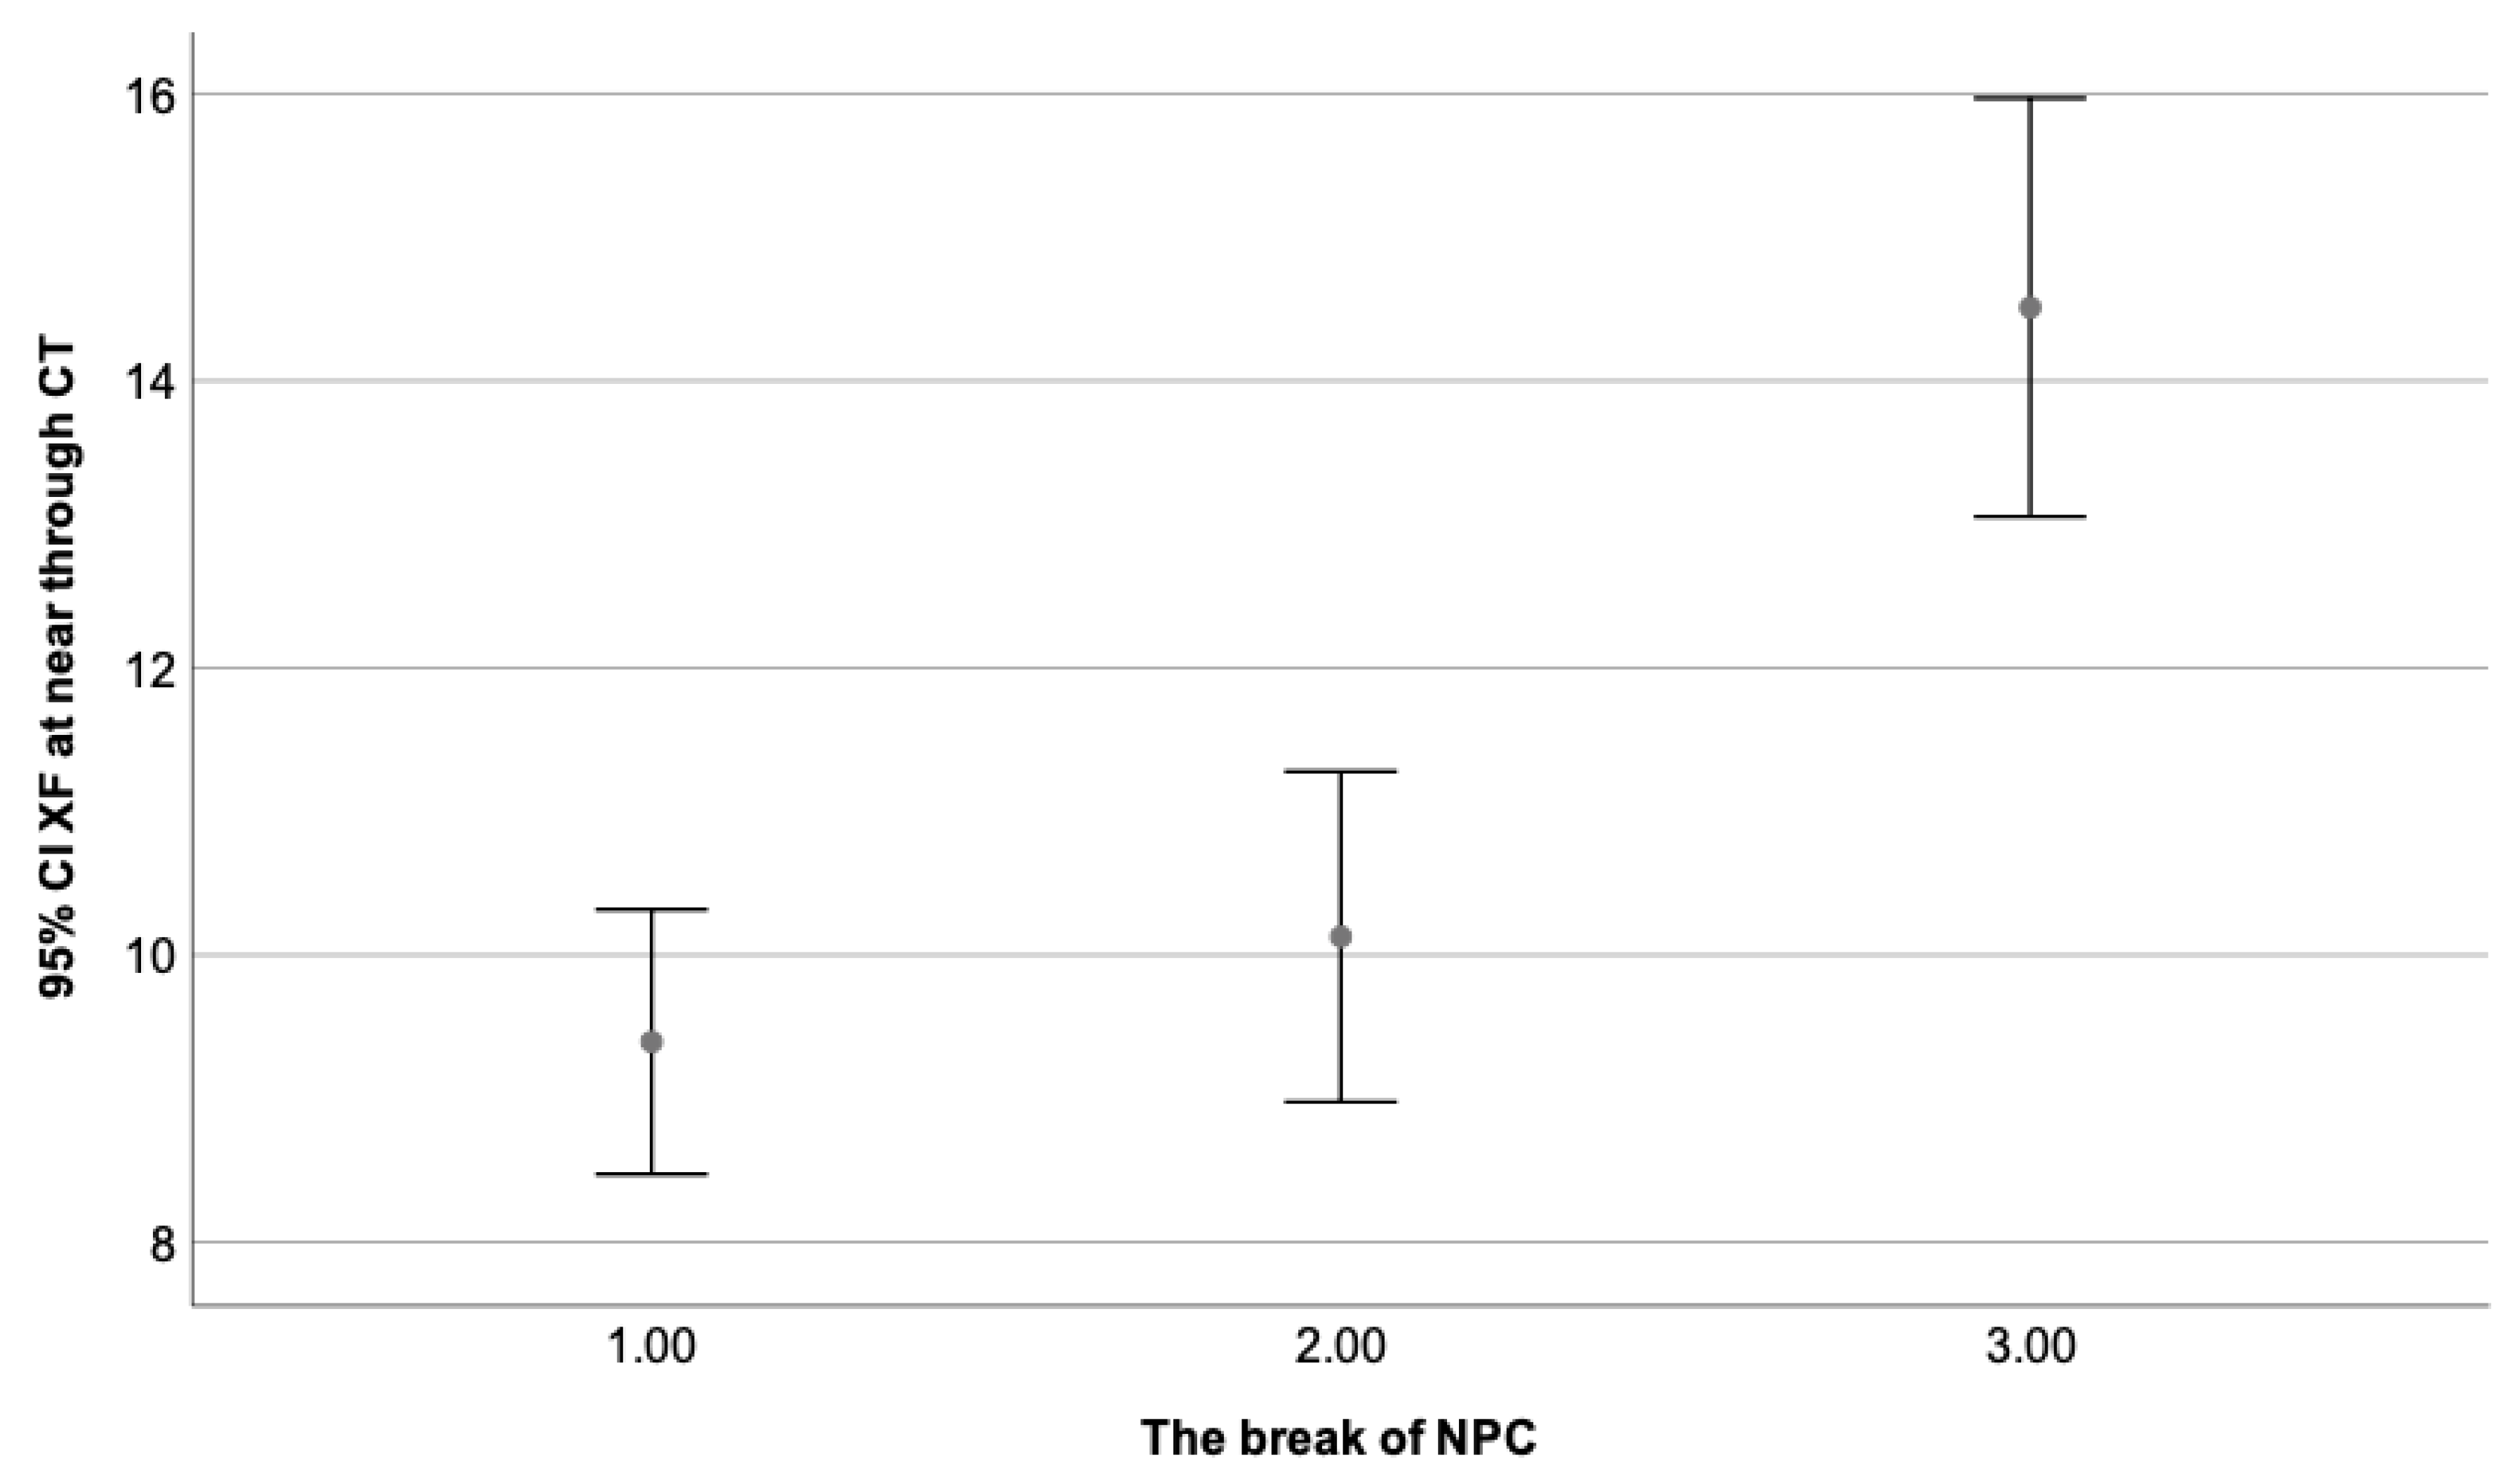

Table 1.
Descriptive statistics of the analyzed variables based on gender, where mean values, Std, and p-values are presented. The independent sample t-Test was used for most of them, but for the esophoria state, myopia, and astigmatism, where the analysis was performed using the Mann-Whitney test considering the small sample and the non-normal data distribution analyzed by the Shapiro-Wilk test.
Table 1.
Descriptive statistics of the analyzed variables based on gender, where mean values, Std, and p-values are presented. The independent sample t-Test was used for most of them, but for the esophoria state, myopia, and astigmatism, where the analysis was performed using the Mann-Whitney test considering the small sample and the non-normal data distribution analyzed by the Shapiro-Wilk test.
| Boys | Girls | p-value | Total | |
|---|---|---|---|---|
| Variables | Mean ± Std | Mean ± Std | Mean ± Std | |
| Age | 7.90 ± 2.03 | 8.90 ± 3.08 | .006 | 8.30 ± 2.48 |
| VA OD F | .04 ± .07 | .04 ± .08 | .941 | .04 ± .07 |
| VA OS F | .04 ± .08 | .03 ± .07 | .467 | .04 ± .07 |
| VA OD N | .05 ± .07 | .06 ± .08 | .281 | .05 ± .08 |
| VA OS N | .06 ± .09 | .05 ± .08 | .685 | .06 ± .09 |
| Stereopsis | 32.36 ± 14.82 | 33.61± 16.39 | .565 | 32.86 ± 15.45 |
| EF F CT/H/TH | 2.65±2.55 | 3.38 ± 3.07 | .135 | 2.95 ± 2.76 |
| 1.96 ± 1.64 | 2.13 ± 1.75 | .417 | 2.03 ± 1.64 | |
| 1.78 ± 1.23 | 1.88 ± 1.63 | .071 | 1.82 ± 1.37 | |
| EF N CT/H/TH | 8.74 ± 4.11 | 9.25 ± 3.92 | .637 | 8.95 ± 3.99 |
| 5.75 ± 3.17 | 5.38 ± 3.03 | .740 | 5.60 ± 3.08 | |
| 7.09 ± 2.95 | 7.56 ± 2.78 | .407 | 7.28 ± 2.86 | |
| XF F CT/H/TH | 2.11 ± 2.59 | 2.11 ± 2.62 | .523 | 2.11 ± 2.60 |
| 1.14 ± 1.47 | 1.01 ± 1.46 | .783 | 1.09 ± 1.46 | |
| 1.39 ± 1.44 | 1.26 ± 1.36 | .265 | 1.34 ± 1.41 | |
| XF N CT/H/TH | 10.81 ± 5.04 | 10.79 ± 4.54 | .571 | 10.80 ± 4.80 |
| 5.76 ± 3.44 | 5.49 ± 3.34 | .926 | 5.60 ± 3.39 | |
| 8.50 ± 3.97 | 8.08 ± 3.65 | .741 | 8.34 ± 3.84 | |
| Stereopsis | 32.36 ± 14.82 | 33.61 ± 16.4 | .557 | 32.86 ± 15.45 |
| Myopia OD | -1.48 ± .96 | -2.56 ± 2.12 | .226 | -1.89 ± 1.56 |
| Myopia OS | -1.52 ± .93 | -2.25 ± 1.76 | .378 | -1.80 ± 1.32 |
| Hyperopia OD | .88 ± .43 | 1.39 ± 1.61 | .035 | 1.12 ± 1.17 |
| Hyperopia OS | .84 ± .43 | 1.49 ± 1.77 | .017 | 1.15 ± 1.29 |
| Astigmatism OD | -.86 ± 1.44 | -1.45 ± 1.29 | .143 | -1.15 ± 1.39 |
| Astigmatism OS | -.98 ± 1.29 | -1.58 ± 1.41 | .204 | -1.29 ± 1.38 |
*VA, visual acuity; OD, oculus dexter; OS, oculus sinister; F, far; N, near; EF, esophoria; XF, exophoria; CT, Cover test; H, Howell test; TH, Thorington test; Std, standard deviation.
Table 2.
Phoria tests comparison using the Paired-Sample T-test (for XF) and Wilcoxon test (for EF), at distance (F) and near fixation (N), where t, z and p-value reflects the differences/similarities between them.
Table 2.
Phoria tests comparison using the Paired-Sample T-test (for XF) and Wilcoxon test (for EF), at distance (F) and near fixation (N), where t, z and p-value reflects the differences/similarities between them.
| Tests compared | t-Value | z-Value | p-Value | p-value |
|---|---|---|---|---|
| XF F CT/H versus EF F CT/H | 8.40 | 3.14 | <.001 | .002 |
| XF F CT/TH versus EF F CT/TH | 6.10 | 3.88 | <.001 | <.001 |
| XF F H/TH versus EF F H/TH | -2.93 | 1.16 | .004 | .252 |
| XF N CT/H versus EF N CT/H | 23.22 | 5.55 | <.001 | <.001 |
| XF N CT/TH versus EF N CT/TH | 12.68 | 4.67 | <.001 | <.001 |
| XF N H/TH versus EF N H/TH | -12.73 | -4.76 | <.001 | <.001 |
*F, far; N, near; EF, esophoria; XF, exophoria; CT, Cover Test; H, Howell test; TH, Thorington test; t-value of Paired Samples T-test for XF, z-value of Wilcoxon Test for EF; p-value for parametric statistics; p-value for non-parametric statistics.
Table 3.
(a,b). Illustrates the correlations found between the phoria tests used at near and distance fixation. Pearson correlations was used for XF and Spearman for EF, based on the normality of data distribution. Strongest correlations were found for values obtained through the alternate Cover test and Thorington test, but for XF at far as it can be seen at the Table 3(a). Thorington test and Howell test, showed stronger correlations for EF but not for XF as shown by the Table 3(b). The strongest correlations are presented in bold.
Table 3.
(a,b). Illustrates the correlations found between the phoria tests used at near and distance fixation. Pearson correlations was used for XF and Spearman for EF, based on the normality of data distribution. Strongest correlations were found for values obtained through the alternate Cover test and Thorington test, but for XF at far as it can be seen at the Table 3(a). Thorington test and Howell test, showed stronger correlations for EF but not for XF as shown by the Table 3(b). The strongest correlations are presented in bold.
| CORRELATIONS | |||||
|---|---|---|---|---|---|
| Pearson | XF at near Howell | p-value | XF at near Thorington | p-value | |
| XF at near CT | .79 | <.001 | .85 | <.001 | |
| XF at far CT | .82 | <.001 | .81 | <.001 | |
| Spearman | EF at near Howell | p-value | EF at near Thorington | p-value | |
| EF at near CT | .91 | <.001 | .92 | <.001 | |
| EF at far CT | .81 | <.001 | .88 | <.001 | |
| a) | |||||
| CORRELATIONS | |||||
| CORRELATIONS | |||||
| Pearson | XF at near Howell | p-value | XF at far Howell | p-value | |
| XF at near Thorington | .68 | .001 | - | ||
| XF at far Thorington | - | .65 | .001 | ||
| Spearman | EF at near Howell | p-value | EF at far Howell | p-value | |
| EF at near Thorington | .84 | <.001 | - | ||
| EF at far Thorington | - | .75 | <.001 | ||
| b) | |||||
*XF, exophoria; EF, esophoria; CT, Cover test. *Correlations are significant at the 0.01 level (2-tailed).
Table 4.
Predictive models for the degree of stereopsis for each phoria tests used at near fixation, and the break of NPC, using the regression analysis. Standardized -value, F-value, p-value, adjusted R-square, R-value, t-value and Confidence Intervals are presented for better understanding of the relationship between the analyzed variables.
Table 4.
Predictive models for the degree of stereopsis for each phoria tests used at near fixation, and the break of NPC, using the regression analysis. Standardized -value, F-value, p-value, adjusted R-square, R-value, t-value and Confidence Intervals are presented for better understanding of the relationship between the analyzed variables.
| STEREOPSIS | |||||||
|---|---|---|---|---|---|---|---|
| Standardized beta-value | t-value | p-value | R-value | Adjusted R Square | F- value | 95% L - U | |
| Break of NPC | .46 | 7.58 | <.001 | .46 | .208 | 57.39 | .87-1.48 |
| XF Near Cover Test | .39 | 5.87 | <.001 | .40 | .159 | 34.95 | .85-1.7 |
| XF Near Howell | .44 | 6.46 | <.001 | .43 | .189 | 41.78 | 1.36-2.56 |
| XF Near Thorington | .27 | 3.76 | <.001 | .27 | .071 | 14.12 | .52-1.65 |
* XF, exophoria; NPC, near point of convergence; CI (Confidence Interval); L(lower) and U (upper) bound.
Table 5.
Illustrates the Mean value and Std for the stereopsis degree and the break of NPC, based on age-groups. It depicts how age can affect the near point of convergence and the stereopsis level of our participants. The p and F-values are represented to show the differences among them and their statistical significance.
Table 5.
Illustrates the Mean value and Std for the stereopsis degree and the break of NPC, based on age-groups. It depicts how age can affect the near point of convergence and the stereopsis level of our participants. The p and F-values are represented to show the differences among them and their statistical significance.
| Group | Stereopsis Mean ± Std | Break Mean ± Std | Compared Groups | p-Value Stereo/ Break | F-Value Stereo/ Break | p-Value Stereo/ Break |
|---|---|---|---|---|---|---|
| 1 | 40.49 ± 16.46 | 6.85 ± 6.84 | 1/2 | <.001 / .040 | 11.63 / 4.99 | <.001 / .008 |
| 2 | 29.57 ± 13.62 | 4.58 ± 5.39 | 1/3 | .002 / .912 | ||
| 3 | 30.57 ± 14.94 | 7.32 ± 5.55 | 2/3 | .919 / .021 |
*Stereo; stereopsis degree; Break, break value of NPC. * 1st group (5.06 to 8.00); 2nd group (8.01 to 11.00); 3rd group (11.01 to 17.11).
Table 6.
Illustrates the Mean value and Std for the stereopsis degree, based on the break value. These results explain how the near point of convergence can impact the stereopsis level of our participants. The p and F-values are represented to show the differences among them and their statistical significance.
Table 6.
Illustrates the Mean value and Std for the stereopsis degree, based on the break value. These results explain how the near point of convergence can impact the stereopsis level of our participants. The p and F-values are represented to show the differences among them and their statistical significance.
| Group | Stereopsis Mean ± Std | Compared Groups | p-Value | F-Value | p-Value |
|---|---|---|---|---|---|
| 1 | 28.59 ± 12.56 | 1/2 | .509 | 30.14 | <.001 |
| 2 | 31.06 ± 12.31 | 1/3 | <.001 | ||
| 3 | 47.29 ± 18.01 | 2/3 | <.001 |
*1st group, break from 0-5 cm; 2nd group, break from 6-10 cm; 3rdd group, break from 11-25 cm.
Table 7.
Illustrates the Mean value and Std for the exophoria state at far and neardistance, as a dependent variable of the break value of NPC. The obtained data show how the near point of convergence can relate to the amount of exophoria at near fixation. The p and F-values are represented to show the differences among them and their statistical significance.
Table 7.
Illustrates the Mean value and Std for the exophoria state at far and neardistance, as a dependent variable of the break value of NPC. The obtained data show how the near point of convergence can relate to the amount of exophoria at near fixation. The p and F-values are represented to show the differences among them and their statistical significance.
| Group | XF at far Mean± Std | XF at near Mean ± Std | Compared Groups | p-Value XF F/N | F-Value XF F/N | p-Value XF F/N |
|---|---|---|---|---|---|---|
| 1 | 1.71 ± 2.41 | 9.40 ± 4.38 | 1/2 | .989/.618 | 7.99/20.68 | <.001 |
| 2 | 1.66 ± 2.28 | 10.10 ± 3.88 | 1/3 | .001/<.001 | ||
| 3 | 3.44 ± 2.89 | 14.50 ± 4.67 | 2/3 | .003/<.001 |
*XF, exophoria; F (far); N (near). *1st group, break from 0-5 cm; 2nd group, break from 6-10 cm; 3rdd group, break from 11-25 cm.
Disclaimer/Publisher’s Note: The statements, opinions and data contained in all publications are solely those of the individual author(s) and contributor(s) and not of MDPI and/or the editor(s). MDPI and/or the editor(s) disclaim responsibility for any injury to people or property resulting from any ideas, methods, instructions or products referred to in the content. |
© 2023 by the authors. Licensee MDPI, Basel, Switzerland. This article is an open access article distributed under the terms and conditions of the Creative Commons Attribution (CC BY) license (http://creativecommons.org/licenses/by/4.0/).
Copyright: This open access article is published under a Creative Commons CC BY 4.0 license, which permit the free download, distribution, and reuse, provided that the author and preprint are cited in any reuse.


