Submitted:
20 April 2023
Posted:
21 April 2023
Read the latest preprint version here
Abstract
The synthesis and characteristics of the novel ONS-type vanadium(V) complexes with thioanilidine derivatives of aminoacids have been described. They showed inhibition of human protein tyrosine phosphatases (PTP1B, LAR, SHP1 and SHP2) in the submicromolar range and as well as inhibition of non-tyrosine phosphatases (CDC25A and PPA2) similar to bis(maltolato)oxovanadium(IV)(BMOV). The ONS complexes increased [14C]-deoxy-D-glucose transport into C2C12 myocytes, and one of them, VC070 also enhanced this transport in 3T3-L1 adipocytes. These complexes inhibited gluconeogenesis in hepatocytes HepG2, but none of them decreased lipid accumulation in the non-alcoholic fatty liver disease model using the same cells. Compared to the tested ONO-type vanadium complexes with 5-bromosalicylaldehyde and substituted benzhydrazides as components of Schiff base ligand, the ONS complexes revealed stronger inhibition of protein tyrosine phosphatases, but the ONO complexes showed greater activity in the cell models, in general. Moreover, the most of the active complexes from both groups showed better effects than VOSO4 and BMOV. Complexes from both groups activated AKT and ERK signaling pathway in hepatocytes to a comparable extent. One of the ONO complexes, VC068, showed activity in all above models, including also glucose utilization in the myocytes and glucose transport in insulin-resistant hepatocytes. The discussion has put forward explications for the results within the wider scope of the knowledge about vanadium complexes.
Keywords:
vanadium complexes
; phosphatases
; in vitro
; cells models
; metabolic disorders
; diabetes
; insulin resistance
; gluconeogenesis
; NAFLD
1. Introduction
Invariably, for years, type 2 diabetes (T2D) has been mentioned as a global, social health problem. About 10% of the population suffer from diabetes and the trend is still increasing. It is predicted that in 2035 the number of diabetics will amount to approximately 600 million worldwide [1]. A much broader and still growing health problem on a global scale are disorders of glucose and lipid metabolism with accompanying insulin resistance, which may predispose to overweight, obesity, dyslipidemia, impaired fasting glucose (IFG) and impaired glucose tolerance (IGT). All of these can lead to the development of full-blown T2D and are associated with an increased risk of cardiovascular disease and other serious health consequences [2,3,4].
Altered glucose and lipid metabolism are also key factors associated with the development of nonalcoholic fatty liver disease (NAFLD), defined according to the recently proposed nomenclature as metabolic dysfunction-associated fatty liver disease. NAFLD is the most common liver disorder and is present in approximately 25% of the population and it is estimated that NAFLD shall be the most common indication for liver transplantation by 2030 [5]. Currently no therapies are registered for the treatment of NAFLD, and new tested agents targeted many of the fundamental pathophysiological processes related to glucose and lipid metabolism that drive NAFLD [6].
In T2D pharmacotherapy, there are 56 antihyperglycemic drugs approved as monotherapies and combination therapies currently registered by the FDA. These drugs belong to several groups and affect various biological systems and mechanisms related to this disease. Despite the wide spectrum of pharmacotherapy options, a large proportion of patients have difficulties in achieving sufficient clinical improvement and reducing the risk of T2D complications. This explains the presence of almost 100 additional antihyperglycemic drugs currently being evaluated in clinical trials [7,8]. And although vanadium compounds are not mentioned among the main pharmacotherapeutic groups of metabolic disorders, their more than 100-year history of clinical trials and a wide range of studies indicate the potential for anti-diabetic activity [9,10,11,12].
Many mechanisms of action of vanadium compounds are common with the mechanisms of action of registered antidiabetic drugs, as well as with potential pharmacotherapeutic targets in glucose and lipid metabolism disorders [13,14,15]. These common pharmacological mechanisms of vanadium's effects include increasing glucose uptake into cells, improving insulin sensitivity and enhancing insulin action and involve target tissues and organs: adipose tissue, muscle and liver [16].
Skeletal muscle is the largest metabolic organ responsible for glucose homeostasis in the body. Muscle insulin resistance manifested by, among others, impaired glucose transport may account for more than 85–90% of the impairment of total body glucose disposal in patients with type 2 diabetes [17,18]. Like skeletal muscle, adipose tissue and the liver play key roles in lipid and glucose metabolism, and metabolic impairment of adipocytes and hepatocytes is associated with metabolic disorders [19]. Currently available glucose-lowering therapies target skeletal muscle as key pathways for impaired or diminished glucose uptake [20]. Similarly, pharmacological interventions in metabolic diseases are at least partly related to their effects on adipocytes or hepatocytes [19].
The main and best-studied intracellular target for vanadium compounds is the protein tyrosine phosphatase 1B (PTP1B), which regulates the phosphorylation process between the insulin receptor (IR) and its substrate (IRS). Inhibition of PTP1B activity allows the insulin receptor to remain activated, thereby potentiating the effect of endogenous insulin [21]. Phosphorylation of the insulin receptor leads to the activation of the intracellular signal pathway the AKT and PI3K kinases (phosphatidylinositol 3-kinase), which is one of the most important regulator of metabolism. It has been shown that vanadium compounds also can activate PI3K via a pathway that does not involve the insulin receptor signaling [22]. Inhibition of PTP1B and triggering the PI3K-AKT pathway are considered a potential therapeutic target in diabetes and other conditions associated with insulin resistance [13,23]. The molecular mechanism responsible for the insulin-like effects of vanadium compounds have been shown to involve the activation of several key components intracellular signaling pathways that include among others the mitogen-activated-protein kinases (MAPKs) and extracellular signal-regulated kinase 1/2 (ERK1/2) [22,24,25]. These pathways are essential for controlling energy homeostasis and are related to insulin sensitivity, glucose tolerance, hepatic steatosis, obesity and diabetes.
Vanadium compounds are also inhibitors of phosphatases other than PTP1B fundamental for the function of many metabolic pathways and transcription factors with wide implications for many metabolic disorders [16,21,26,27,28]. An example is the Src homology-2 domain-containing phosphatases type 1 and 2 (SHP1 and SHP2) and leukocyte common antigen-related (LAR) [29]. Also the receptor protein tyrosine phosphatase alpha (RPTPA) has described implications in insulin action [30]. Vanadium compounds have been shown to inhibit not only protein tyrosine phosphatases, but also serine/threonine phosphatase activity, e.g. protein phosphatase 2A (PP2A) [31,32]. These phosphatases are also promising targets for drug development in diabetes treatment [33,34]. In addition, vanadium compounds are inhibitors of dual-specific phosphatases including cell division cycle 25 A phosphatase (CDC25A), which is one of the most crucial cell cycle regulators [35,36].
The above-discussed targets and molecular mechanisms of action of vanadium may result in non-specific and multidirectional biological and pharmacological effects. Difficulties in the development of pharmaceuticals based on vanadium also result from its complex chemical nature and interactions with the microenvironment of the organism. Vanadium is characterized by high chemical reactivity in body fluids as well as speciation and the lack of stable metabolites [15]. The chemical affinity of vanadium to oxygen, nitrogen or sulfur atoms, as well as its flexibility in coordination geometry, allows it to form stable complexes or transition state complexes with many biological molecules, including proteins, amino acids and other low molecular compounds. The presence of vanadium in the body in such forms enables the adsorption and distribution of this element and significantly affects the biological activity [37,38]. These properties make the search for pharmacologically active, new vanadium compounds in the form of its complexes the promising and main direction of research on the use of vanadium in diabetes and other diseases. Of particular importance here is the advantage of complexes over organic compounds resulting from the variability of coordination numbers, geometry, redox states, ligand substitutions and structural diversity [9,39]. The aim of modern research in the development of pharmaceuticals based on vanadium compounds is the design, synthesis and biological testing of organic ligands or chelators with improved properties [40,41]. The difficulty and challenge behind which great benefits may lie is the development of vanadium complexes with greater specificity for biological and therapeutic targets.
Previous research by our team on vanadium complexes with potential application in metabolic disorders involved the synthesis of one hundred dozen new vanadium complexes from different structural groups, described in publications e.g., [42,43,44,45,46,47,48,49,50,51,52] and patented in part [52,53]. For mentioned 110 vanadium complexes screening tests for antidiabetic activity in in vitro and three cell-based models were conducted making our research unique and outstanding [54]. This allowed the selection of the most active new vanadium complexes as potential compounds for metabolic disorders. Among these complexes were five, first time synthesized and described vanadium complexes with thioanilide amino acid derivatives (ONS complexes), which are the subject of this publication.
The aim of this study was to evaluate the pharmacological activity of the newly synthesized complexes of the ONS type and their effects on the metabolic processes associated with various disturbances of glucose and lipid metabolism.
In this paper, the synthesis, physical and chemical characteristics of novel vanadium complexes with ONS ligands were described. For these complexes the inhibition of human PTPs and non-tyrosine phosphatases was studied. In myocytes and adipocytes the uptake of radiolabeled glucose analog was evaluated. Additionally, the effect of vanadium complexes on glucose metabolism was also investigated by assessing glucose consumption in the skeletal muscle cell model. Moreover, the accumulation of lipids in the cell model of non-alcoholic fatty liver disease (NAFLD) and the inhibition of gluconeogenesis in hepatocytes were studied. Experiments were conducted to assess the effect of vanadium complexes on radiolabeled glucose uptake to hepatocytes, in which insulin resistance was induced by the pro-inflammatory factor TNF and hyperlipidemia. Finally, the effect on radiolabeled glucose transport in the conditions of hyperinsulinemia was also tested and the influence of vanadium complexes on the activity of cellular kinases AKT and ERK in hepatocytes were carried out.
To compare the biological activity of the ONS complexes we also conducted the assays mentioned above for the vanadium ONO complexes described previously [45,46,47,55]. Compared to previously published results for this ONO complexes, the scope of research has been extended. Such an approach to the subject allowed for a broader conclusions regarding the influence of the structure of vanadium complexes on biological activity.
2. Results
2.1. Synthesis and characteristics of the ONS and ONO complexes
The synthesis and characterization of the ONS complexes is presented for the first time (Scheme 1, Scheme 2 and Scheme 3 and Table 1). The 3-hydroxytiocrotonic acid anilide (III), as the starting compound for the preparation of ONS ligands was obtained in two steps synthesis according to Scheme 1. In the first stage the acetylacetone in the reaction with phenyl isothiocyanate gave intermediate 2-acetyl-3-hydroxythiocrotonic acid anilide (II) which was then deacetylated to desire 3-hydroxytiocrotonic acid anilide (III). In the next stage the condensation reaction of (III) with appropriate L-aminoacids sodium salts took place yielded the ONS Schiff base ligands (IV) (Scheme 2). Finally, the vanadium complexes with the ONS ligands (IV) were synthetized in the reaction with vanadium(V) oxychloride (VOCl3) (Scheme 3).
For the obtained ONS vanadium complexes (VC054, VC059, VC070, VC073 and VC0109) the formulas are presented in the Table 1. These formulas based on the results of the elemental analysis and infrared spectra (see also in the Supplementary Materials). Moreover, the NMR spectra of L1-L5 confirm the formation of ONS-type ligands (see the Supplementary Materials). We could not obtain a crystal suitable for single crystal X-ray measurement as too small crystals were formed. All complexes are diamagnetic, which confirms the presence of vanadium(V). To the metal center two chlorido ligand, one oxido, and ONS organic ligand are coordinated.
The ONS complexes are soluble in water and organic solvents. This may be related to the presence of chloro ligands that, when detached, can lead to the formation of an ionic complex that will be more soluble. Moreover, an increase in the ionic radius of the sulfur atom, in comparison to that of the oxygen atom, and the presence of two chloro ligands can cause stress in the coordination sphere of vanadium, leading to deformation of the structure and easier detachment of ligands, which leads to the formation of cationic complexes. The stability of the ONS complexes was tested in DMSO/H2O (20 μL+3 mL) due DMSO was solvent for preparing stock solution in pharmacological tests. Beside pH=7, the stability was tested at pH=2 condition. These complexes shown stability in this condition and in the time of incubation. Their UV-Vis spectra in solution were attached in the Supplementary Materials. The positions of the bands is very similar to the spectra in the DMSO itself.
In our previous studies, we described the ONO vanadium complexes. The series of the ONO vanadium complexes were characterized in references [45,46,47]. Only the complex denoted as VC055 was not described, therefore, we present the synthesis and physicochemical characterization in the Methods section. The formulas of the vanadium complexes, the components of Schiff base ligands (used in syntheses) and the literature references are given in Figure 1 and Table 2. We selected complexes with 5-bromosalicylaldehyde and substituted benzhydrazides as components of Schiff base ligand. For VC013, VC046, VC048 and VC050 complexes, 1,10-phenantroline (phen), as a co-ligand, stabilizes V(IV). For V(III) complexes (VC029, VC032, VC055, VC067 and VC068) two Schiff base ligands compensate the charge of the metal center. These complexes were stored under argon, but after a longer time they were oxidized to V(IV) without changing the composition of the compound, as described in our previous publications [46].
2.2. The ONS complexes inhibit the activity of human tyrosine phosphatases stronger than the ONO complexes
At first, in our screening tests we showed that ONS complexes as well as ONO ones at concentration of 1 µM, inhibited human tyrosine phosphatases PTP1B, LAR, SHP1 and SHP2, however ONS complexes exhibited higher activity than ONO-ones (Table 3). ONS complexes inhibited LAR phosphatase activity in the range of 56 to 69% relative to controls (100% activity), and the percentage inhibition of the other phosphatases was similar and ranged from 70 to 88%. Most of ONO complexes showed weaker inhibitory potency than ONS complexes and comparators.
The ONO complexes exhibited significantly greater diversity in the strength of inhibition of protein tyrosine phosphatases than the ONS complexes. For instance, the highest values of PTP1B inhibition was shown by the VC013 complex, which inhibited the activity of this phosphatase by 60%, and the VC032 by 9% as the weakest complex in the ONO group (Table 3). Except for VC013, the other ONO complexes demonstrated lower inhibitory potency than VOSO4 and BMOV. The last two were used as a comparator compounds for evaluate the relative activity of the tested complexes.
In the next step, we confirmed the effects observed in the screening tests by determining the IC50 for selected complexes from both groups (Table 4). To determine the IC50, the ONO complexes were selected, which have shown significant biological activity in our previous studies [46], despite not demonstrating the highest inhibition in screening assays. For all tested phosphatases, the IC50 values obtained for ONS complexes were similar to IC50 values for VOSO4 and BMOV. However, ONO complexes showed approximately 30-40 times weaker inhibition than ONS complexes and comparators (Table 4).
2.3. The ONS and ONO complexes are inhibitors of non-tyrosine phosphatases
The ONS and ONO complexes also showed inhibition of non-tyrosine phosphatases: CDC25A dual specificity phosphatase and PPA2 serine-threonine phosphatase in the range similar to that of VOSO4 and BMOV (Table 5). The exception was VC050 which at the concentration of 1 µM showed weaker inhibition than the other complexes and comparators. VC050 also showed less activity on inhibition tyrosine phosphatases as shown above.
2.4. The ONS complexes enhance glucose transport into myocytes and adipocytes to a lesser extent than ONO complexes
At the concentration of 50 µM, ONS complexes caused an increase in the transport of [14C]-deoxy-D-glucose into C2C12 myocytes in the range of 119-158% of the control. VOSO4 and BMOV showed an enhancement of transport to 110% and 125% of the control, respectively, with statistical significance only for BMOV (Figure 2).
On the other hand, the observed effect of ONO complexes on [14C]-deoxy-D-glucose transport was significantly greater than that of ONS complexes. ONO complexes significantly enhanced transport, from 199% to 267% of the control with statistical significance between p≤0.001 and p<0.05. VC032, the most active complex at the concentration of 50 µM also showed significant effects at concentrations of 10 and 1 µM, indicating a concentration-dependent response.
At the highest tested concentration, the ONS complexes increased glucose consumption by myocytes C2C12 in the range 104 to 134% of the control value (Figure 3).
ONO complexes at the concentration of 50 µM increased glucose consumption within a range of 122 to 150% compared to the control (p≤0.001 to 0.05). No statistically significant effect was observed only for VC032 and VC055.
Simultaneously with glucose consumption tests, viability of myocytes C2C12 was examined due to their prolonged, 24-hour incubation with vanadium complexes. Cell viability was not lower than 80% of the vehicle control for all tested complexes, which is recognized as a lack of cytotoxic effect [56]. After incubation with tested complexes at the concentration of 50 µM, the lowest viability was observed for VC054 (84±8%) and VC059 (86±6%), while it was 90±4% for BMOV. For some complexes as well as rosiglitazone used as a reference compound, an increase in the signal was observed (e.g. VC055 127±5% and rosiglitazone 120±7%) [47].
Among the ONS complexes, only VC070 enhanced the transport of [14C]-deoxy-D-glucose into 3T3-L1 adipocytes (159% of control at 50 µM, p≤0.001; Figure 4). This complex also exhibited the strongest effect on radiolabeled deoxy-D-glucose transport into C2C12 myocytes. The remaining ONS complexes did not significantly affect this transport (92-107% of control at 50 µM, p>0.05). Similarly, the comparators BMOV and VOSO4 showed low activity in comparison to the control.
For the ONO complexes, two of them did not affect the transport of [14C]-deoxy-D-glucose into 3T3-L1 adipocytes: VC032 and VC067 (Figure 4). The rest of complexes in this group intensified this transport in the range from 134 to 183% of control, with statistically significant activity at a concentration of 50 µM observed for complexes VC013, VC029, and VC068 (p≤0.001).
It is noteworthy that both groups of complexes exhibited the differential effects on the transport of [14C]-deoxy-D-glucose in above cellular models (myocytes vs. adipocytes). Among ONS complexes, only VC070 showed activity in both models (myocytes C2C12 158±10% and adipocytes 3T3-L1 159±14% of control). The rest of complexes in this group did not demonstrate significant activity in adipocytes 3T3-L1 (92%-107% of control, p>0.05). The ONO complexes, VC032 and VC067 enhanced the transport of [14C]-deoxy-D-glucose only in myocytes C2C12, without exhibiting similar activity in adipocytes 3T3L-1. VC032 caused an increase of this transport into myocytes (266±36% of control) and no effects in adipocytes (97±14%; t-test, p=0.04). For VC067, these values were 199±3% and 94±14% for myocytes and adipocytes, respectively (t-test, p=0.0002). The differences in activity of the other tested ONO complexes did not show statistically significant differences (t-test, p>0.05).
2.5. The ONO complexes but not the ONS complexes reduce hepatocyte steatosis in the cellular model of non-alcoholic fatty liver disease (NAFLD)
In the cellular model of hepatic steatosis, the ONS complexes showed no effect on the amount of lipid accumulation after induction of hepatocytes steatosis with oleic acid (90-116% of controls, p>0.05; Figure 5). Similarly, the comparators VOSO4 and BMOV did not have any significant effect in comparison to the control.
Two ONO complexes showed very distinct effects. The accumulation of lipids in hepatocytes was 52% and 36% lower for VC067 and VC068, respectively, compared to the control (p≤0.001) (Figure 5). The ONO complexes, VC029, VC032 and V050, caused a large and statistically significant increase in lipid accumulation in hepatocytes (from 128% to 151% of control, p≤0.001 for VC050 and p≤0.01 for the other two complexes). This may be due to an undesirable effect on metabolic mechanisms or a hepatotoxic effect resulting in hepatocyte steatosis, without damage or reducing the number of hepatocytes [57].
We conducted cytotoxicity studies on the same hepatocytes used to measure lipid accumulation after incubation with tested complexes. Simultaneous analysis of cell membrane integrity we conducted. Assays showed no significant differences from controls for any tested ONS and ONO complexes, therefore the effect of reducing intracellular lipids should not be attributed to a reduction in cell number due to a cytotoxic effect.
2.6. The ONS and the ONO complexes inhibit gluconeogenesis in hepatocytes
Continuing the research on the effects on the hepatic mechanisms of metabolic disorders, studies were conducted on the effect of selected ONS and ONO complexes on gluconeogenesis in HepG2. Among them were the ONO complexes VC067 and VC068, which showed inhibition of lipid accumulation in the same cells.
All tested complexes of both types and BMOV at the concentration of 50 µM showed potent and statistically significant inhibition of glucose synthesis in hepatocytes, ranging from 46 to 81% of control (Figure 6). Known inhibitors of gluconeogenesis, metformin (a first-line treatment for type 2 diabetes), insulin, and AICAR (5-aminoimidazole-4-carboxamide riboside) as AMPK activator inhibiting transcription of the gluconeogenesis genes was used as the experimental control. All the control compounds showed inhibition of glucose synthesis by hepatocytes.
2.7. The ONO complexes reverse the impairment of glucose transport to hepatocytes under conditions of insulin resistance and hyperinsulinemia
Insulin resistance of HepG2 hepatocytes was induced in two ways: by preincubating them with the proinflammatory cytokine TNF and with oleic acid, which in both cases resulted in a decrease in [14C]-deoxy-D-glucose transport (Figure 7). Then, these hepatocytes were incubated with the ONO complexes, VC067 and VC068, which most effectively among the tested complexes reduced lipid accumulation and inhibited gluconeogenesis in the same cells.
At the concentration of 10 µM, the VC067 complex reversed the decrease in [14C]-deoxy-D-glucose transport in hepatocytes in which insulin resistance was induced by oleic acid, and the VC068 complex reversed the decrease in transport induced by TNF (p≤0.05). The observed effects were greater than those for 1 mM metformin.
The complexes did not potentiate the transport of [14C]-deoxy-D-glucose to hyperinsulinemia-induced insulin-resistant hepatocytes at 10 µM, nor did metformin at 1 mM (Figure 8). Insulin resistance of hepatocytes was only reversed by very high concentrations of insulin (10 µg/mL).
2.8. The ONS and ONO complexes activate ERK and Akt signaling pathways
For the selected ONS and ONO complexes, studies on the effect on the phosphorylation of AKT and ERK kinases as molecular targets of insulin and vanadium compounds were performed. Under the influence of the tested complexes at a concentration of 50 µM, an increase in the level of AKT phosphorylation in HepG2 hepatocytes was observed, in the range of 117-168% of the control after 1 hour and in the range of 112-138% of the control after 3 hours after the end of cell exposure (Figure 9). Human insulin was used as experiment control for AKT activation. Wortmannin, PI3K inhibitor and triciribine, highly selective AKT inhibitor were used for inhibition of insulin effects on AKT.
All tested complexes also enhanced ERK phosphorylation. Human insulin was used as positive control for ERK fosforylation. FR180204, selective ERK inhibitor and PD98053, MEK inhibitor were used as control compounds for inhibition of the insulin effects (Figure 10).
3. Discussion
The antidiabetic effects of vanadium complexes in most studies is analyzed in a narrow and limited scope, despite the complex mechanisms underlying this activity. Only a wide range of studies can reveal the full potential of the therapeutic possibilities of vanadium complexes, and this is the approach we used in our work. We conducted in vitro studies of human phosphatases inhibition and we used various cell models of organs and tissues connected with the pathogenesis of metabolic disorders: myocytes, adipocytes and hepatocytes. In these models, we studied numerous processes related to the pharmacotherapy of metabolic disorders: glucose transport and its utilization, as well as lipid accumulation, gluconeogenesis and insulin resistance in hepatocytes. Importantly, we studied the effects of vanadium targeting not only diabetes itself, but also other metabolic disorders associated with or leading to diabetes.
Searching for new vanadium complexes with better properties and biological effectiveness, we synthesized new complexes with thioanilide amino acid derivatives. We decided to use the ONS type ligands to compare them with the ONO ones to check whether the change of one oxygen into sulphur atom in first coordination sphere has influence on biological activity. To have very similar complexes, five and six-membered rings should be formed. Therefore, we used thioanilide as a six-membered component and as an analogue of salicylaldehyde used in ONO-type complexes. Amino acids were used due to the presence of the NH2 group that can form an imine bond with the carbonyl group of the thioanilide. Additional COO- group of amino acid has a donor oxygen atom in the appropriate position to form a five-membered ring with a central vanadium atom. Moreover, the presence of sodium salts of amino acids increased the solubility of the obtained vanadium complexes, which is important from the point of view of bioavailability of the compound. When comparing the biological activity of complexes with ONO- and ONS-type ligands, in the presence of a sulfur atom, electron polarization is easier, which leads to stabilization of the 5th oxidation state of vanadium. The influence of the substituents in the ONS Schiff base ligand on the biological activity is not as significant as in the case of the ONO-donor ligands. The results of pharmacological tests for the ONS complexes type are more comparable within this group, in contrast to the ONO complexes.
Orthovanadate (VO43−) as a biologically active part of complexes of vanadium and other organovanadium compounds are considered non-selective, competitive, reversible inhibitors of tyrosine phosphatases [16,21,28,58,59]. Some vanadium compounds, for example peroxyvanadium complexes, are capable of oxidizing cysteine residues in the critical active site of phosphatases, which results in irreversible inhibition of enzymatic activity [21]. In this way, vanadium exhibits a broad inhibitory capacity on the entire superfamily of tyrosine phosphatases, which has been experimentally demonstrated using panels of various tyrosine phosphatases, such as PTP1B, SHP1 SHP2, TCPTP, PTP-MEG2, HePTP, HCPTPA and HPTPb [58,60,61,62,63].
Despite initially being considered a non-selective inhibitor of tyrosine phosphatases, various studies indicate the possibility of more selective action of vanadium complexes. A review containing a compilation of results for the inhibition of different tyrosine phosphatases by several vanadium complexes indicated that they may exhibit varying degrees of inhibition [28]. In this compilation, some complexes showed 3 to 50 times stronger inhibition of PTP1B than other tyrosine phosphatases, while others showed no or little difference in inhibiting phosphatases other than PTP1B [60].
The main attention is paid to the importance of PTP1B phosphatase in diabetes and metabolic disturbances. However, ample evidence points to the important role of other tyrosine phosphatases in these disorders. Results suggest that SHP1 may be a potential target for muscle insulin resistance, insulin signalling during obesity, and may be involved in the development of non-alcoholic fatty liver disease caused by diet-induced obesity [64,65,66]. Similarly, inhibition of SHP2 has been implicated in various signalling pathways, including those involved in potential anti-diabetic actions. The effect of inhibition caused changes in decrease in insulin resistance, decreased liver steatosis, enhanced insulin-induced suppression of hepatic glucose production, and impeded the development of insulin resistance after high-fat feeding [67,68,69]. Regarding LAR, the results indicate its involvement in the pathogenesis of metabolic disorders and suggest this phosphatase as a potential therapeutic target [70,71,72].
We conducted studies on the inhibition of human recombinant PTP1B, the most extensively described biological target for vanadium activity, as well as on highly homologous human tyrosine phosphatases, such as LAR, SHP1, and SHP2, which may have potential relevance in metabolic diseases [27,29].
Screening tests and determination of IC50 confirmed that all ONS complexes are inhibitors of all tested phosphatases at the level similar to VOSO4 and BMOV. The rationale for employing these two last compounds as comparators of biological activity is grounded on their extensive research history, and their established effectiveness in metabolic disorders. The absence of a comparator in most published studies poses challenges in comparing the relative activity of the studied vanadium compounds. The more so that the published results of inhibition tests cover a wide range of results, for example IC50 for PTP1B for VOSO4 ranges from 18 nM [73] to 380 nM [74]. This can be explained by differences in the substrate used (e.g. DiFMUP vs. p-NPP) or other analytical conditions. Our results for BMOV are consistent with previously published results of other authors (IC50 for PTP1B was 0.15 µM) [58]. Similarly, ONS complexes exhibit a comparable level of potency in inhibitory activity (IC50 was 0.14 and 0.11 µM for VC054 and VC059, respectively). The obtained results for the inhibition of other tested phosphatases align with the values reported in the literature, which commonly fall within the IC50 range of 0.1-0.9 µM [28].
The ONO complexes exhibited approximately 15-30 times weaker inhibition of PTP1B compared to BMOV and the ONS complexes. Similarly, the inhibition of other tested tyrosine phosphatases was even several dozen times weaker for the ONO complexes. The comparators, BMOV and VOSO4, commonly used in published studies, exhibit a greater inhibitory effect on PTP1B than on SHP1 and SHP2. However, conflicting results have been reported by certain authors [75]. The differences in the activity of these comparators are small enough that VOSO4 and BMOV are reported to be non-selective for these tyrosine phosphatases. Referring to these data, our results for comparators as well as studied complexes suggest that the differences in the tyrosine phosphatase inhibition strength may rather result from analytical conditions, such as different specific activity of the recombinant enzyme used for the analyses. Moreover, the presence of EDTA or a thiol-containing reducing agent (e.g. DDT), which modulates the catalytic activities of PTP1B and SHPs, may play a crucial role in modifying the complexes present in the reaction environment and determine the result [75].
The tested ONS and ONO complexes showed inhibition of human non-tyrosine phosphatases: dual specificity phosphatase CDC25A and serine-threonine phosphatase PPA2. Very few publications on the biological activity of vanadium include the study of phosphatases from other classes and groups with different substrate specificity, such as CDC25A, which is the oncoprotein regulating the cell cycle [76,77,78]. Orthovanadate can inhibit the activity of calcineurin, which is a serine/threonine protein phosphatase and plays a crucial role in numerous signal transduction pathways [31,79]. Our results for PP2A are consistent with these findings and confirm that vanadium complexes inhibit not only protein tyrosine phosphatases, but also serine/threonine phosphatases. Although few studies on the activity of vanadium compounds include these phosphatases, this direction seems important because over 98% of protein phosphorylation occurs on serine and threonine residues, and specific serine/threonine phosphatases are important and promising targets for drug development, including in diabetes treatment [33]. On the other hand, the non-specific effect of vanadium on phosphatases involved in cell cycle regulation may be a limitation of the clinical use of vanadium compounds in non-malignant diseases.
The ONS complexes showed higher activity in inhibit human tyrosine phosphatases than the ONO complexes, however, it is interesting that their biological activity in cellular models of skeletal muscle and adipose tissue is lower than that of the ONO complexes. Similar results were observed, for example, for the ((CH3)2NO)2V(O)OH complex, which was not as good a PTPs inhibitor as vanadate, but was much more effective in inducing biological effects in cells by the increasing glucose transport and glycogen synthesis [80].
We used the cell models of the main organs responsible for glucose metabolism, which are also target organs for diabetes pharmacotherapy. C2C12 myoblasts are a well-documented model with key characteristics of human muscle cells. This model is widely used in preclinical and pharmacological studies in the development of new drugs [81,82,83], including vanadium compounds [85,86,87]. Adipocytes of the 3T3-L1 line, also used in research on vanadium compounds, are similarly useful for the same reasons [87,88]. Impairment of insulin signaling and post-receptor intracellular mechanisms in insulin resistance is manifested by reduced glucose transport to myocytes and adipocytes, and its improvement is one of the main pharmacotherapeutic mechanisms in diabetes [89,90]. In our study we used radioactively labeled deoxy-D-glucose, a synthetic glucose analogue, which is transported to cells but it does not undergo further metabolism in glycolysis process. The product of the first stage of the glycolysis inhibits this process non-competitively.
Different vanadium compounds, including its complexes, have an effect on basal and insulin stimulated glucose uptake in adipocytes [91,92] as well as in myocytes [84,85,86]. Our ONS and ONO complexes also increased transport of [14C]-deoxy-D-glucose into myocytes C2C12. Compared to the ONO complexes, the activity of the ONS complexes was lower, but despite this, they showed greater efficiency than VOSO4 and BMOV.
We extended the study of the transport of radiolabeled glucose analog to C2C12 myocytes with the study of glucose utilization (consumption) during a 24-hour incubation with vanadium complexes. The study of glucose consumption gives a more complete picture of the pharmacological activity of the tested complexes, because it depends on its consumption in cells, e.g. in the process of glycogenesis. In patients with type 2 diabetes, increased glycogen synthesis after administration of VOSO4 accounted for more than 80% of the increased glucose disposal in muscles [93]. In this case, the stimulation of glucose uptake by myocytes is independent of the effect of vanadium on the insulin receptor signal through the inhibition of tyrosine phosphatases [94]. We did not find any studies in which both glucose transport and glucose utilization were studied in the same cell model.
As in the study of the transport of [14C]-deoxy-D-glucose in myocytes C2C12, the ONS complexes also showed a lower effect on glucose utilization than the ONO complexes. These effects were greater than those of VOSO4 and BMOV. In the experiment investigating glucose consumption by myocytes, no differences in activity were observed between the ONS and ONO complexes, in contrast to differences in the increase of [14C]-deoxy-D-glucose transport in the same cells.
Biotransformation of the complexes and vanadium speciation may be a possible cause. These processes can be critical to the observed activity and depend on the experimental condition and the time of incubation with the complexes, which in the study of the glucose analog transport to C2C12 myocytes was 6 hours in total, and in the study of glucose consumption by these cells was 24 hours. Biological activity depending on the incubation time has been demonstrated, among others, in the case of vanadium complexes with 1,10-phenanthroline ligands. After 3 and 24 hours, the cytotoxicity was different for the tested complexes, but after 72 hours of incubation, all compounds showed equal activity. This supports the postulate that biological activity may depend more on the total concentration of vanadium than on the form in which it was used [95]. It was also shown that, regardless of the oxidation state in model vanadium (V), (IV) and (III) compounds, including vanadate and BMOV, after 24-hour incubation in cell culture medium, approximately 75% of the total vanadium was vanadium(V). Similarly, vanadium speciation in HepG2 hepatocytes also varied with incubation time, with vanadium(IV) accounting from ∼20% to ∼70% of the total vanadium pool, largely independent of the vanadium complex used or the dominant vanadium oxidation state in the medium [96].
Prolonged incubation of the cells with vanadium complexes as during the study of the effect on glucose consumption, more closely corresponds to the actual conditions of clinical use, also allowing for the identification of possible cytotoxic effects. These effects were not observed, as cell viability was not lower than 80% of the vehicle control for all tested complexes. This level is interpreted as a lack of cytotoxic effect according to the ISO rules for in vitro cytotoxicity tests [56]. For some complexes, an increase in the signal in the viability assay was observed, which may be due to the metabolic activation of the cells. Resazurin-based reagent is reduced proportionally to metabolic activity of cells as a result of the transference of electrons from NADPH+H+, the amount of which strictly depends on glucose metabolism [98]. Similar results for vanadium complexes have already been observed using C2C12 myocytes and the MTT test based on the same mechanism [98].
In this study, among the ONS complexes, only VC070 showed enhanced the transport of [14C]-deoxy-D-glucose in both models. The rest of complexes in this group did not demonstrate significant activity in 3T3-L1 adipocytes, however their activity on myocytes was significant. This activity was higher than the activity of BMOV and VOSO4, although clearly lower than the activity of ONO complexes.
VC070 differed from the other complexes of this group only in its starting amino acid, which was leucine. It can be assumed that this complex interacts with the amino acid transporter SLC7A5 (LAT1), which is the main leucine transporter in the body. It is also a transporter with broad substrate specificity, capable of transporting large hydrophobic neutral amino acids as well as many drugs [99,100]. Also structural analogues of leucine and leucine-related compounds can be transported by SLC7A5. The involvement of this transporter in the cellular transport of ruthenium complexes has also been suggested [101]. On the other hand, other amino acids that were the starting amino acids in our ONS complexes can also be transported using this transporter. These complexes showed activity in myocytes where SLC7A5 has the highest expression and significantly lower activity in adipocytes where only VC070 with leucine as the starting amino acid was active. Differences in effect on adipocytes may be due to varying degrees of cellular amino acid uptake. The concentration of leucine in adipocytes is almost twice as high as, for example, phenylalanine or methionine, starting amino acids in other ONS complexes that did not show such a strong effect [102].
The possible synergistic effect of vanadium and the lysine derivative formed after the possible breakdown of the complex on the observed increase in glucose transport should also be considered. Leucine may enhance the transport of deoxy-D-glucose to myocytes by an insulin-independent mechanism as well as by promotion of glucose transporters translocation to the plasma membrane [103,104].
The assumed involvement of the SLC7A5 transporter in the transport of ONS complexes to the cells could explain the lack of effect of ONS complexes on lipid accumulation in the model of non-alcoholic fatty liver disease. Oleic acid, used to induce hepatocyte steatosis, as a cis-unsaturated long-chain fatty acid, inhibits the transport of amino acids to cells [105,106]. The concentration of BSA in the medium (0.1%) may have been insufficient to bind free oleic acid and eliminate the effect on transport inhibition. This could explain why all tested ONS complexes showed high activity against the same hepatocytes in the gluconeogenesis inhibition experiment in which the cell medium did not contain oleic acid.
We undertook research on the hepatic effects of the ONS and ONO complexes because systemic metabolic disorders such as diabetes and obesity are closely related to the dysfunction of the liver as the central organ that maintains metabolic homeostasis. We conducted research in the model of non-alcoholic fatty liver disease (NAFLD), which is a continuum of liver dysfunction caused largely by dietary and lifestyle factors. Hepatocyte steatosis is often observed in insulin resistance and diabetes, and NAFLD itself often leads in its progression to cirrhosis and hepatocellular carcinoma [107]. NAFLD is characterized by excessive storage of lipids in the cytosol of hepatocytes with impaired function, which is accompanied by a number of changes in the course of glucose and lipid metabolism and insulin resistance. These processes are of systemic importance in diabetes and obesity.
As mentioned above, the ONS complexes showed no reduction in lipid accumulation, while the two ONO complexes, VC067 and VC068, were found to be very active in inhibiting intracellular lipid accumulation. The lack of cytotoxic effects with reduction in cell number indicates that the observed effect was not due to reduction in cell number.
In the studies of other authors, similar effects were shown for vanadium(IV)-chlorodipicolinate in primary rat hepatocytes and hepatocytes HepG2 treated with palmitate. Significantly decreased the intracellular lipid contents in a dose-dependent manner in range 50-200 µM was observed. An analogous effect for this complex was also observed in liver tissue from mice fed a high-fat diet [108]. Most of few studies on the effect of vanadium complexes on liver lipid disturbances used in vivo models and demonstrated the effectiveness against the mechanisms responsible for fatty liver [109,110].
For some ONO complexes, we observed an increase in lipid accumulation in hepatocytes. Several possible causes must be considered in explaining this effect. This may indicate hepatotoxicity consistent with drug-induced steatohepatitis (DISH), which is a form of drug-induced liver injury (DILI) caused by various drugs [57]. In cell models, this can manifest as lipid accumulation without significant damage of cell membranes and cell death. The observed effects may be related to the presence of phenanthroline as a colligand, which may increase the cytotoxicity of vanadium complexes [111]. In the studies, the oxidation of V(IV) to V(V) was observed with the release of phenanthroline ligand, which in free form was responsible for most of the observed cytotoxic effects [112]. Free phenanthroline is able to complex iron, facilitating its transport into the cell. This may intensify oxidative stress, which is an important mechanism of hepatocyte steatosis. Vanadium compounds may have a pro-oxidative effect, depending on the degree of oxidation or the presence of other ligands, which may lead to lipid peroxidation in the liver [113,114]. The accumulation of lipids observed under the influence of some ONO complexes may also result from the stimulation of glucose transport and the intensification of lipid synthesis in the hepatocytes.
All tested ONS and ONO complexes showed an effect on the gluconeogenesis process in the form of inhibition of glucose synthesis in hepatocytes. Most of the studies on the effect of vanadium on gluconeogenesis come from earlier studies in animal models, and only a few studies deal with vanadium in the form of complexes [115,116,117,118]. All these studies confirm that the antidiabetic effect of vanadium is also manifested in the inhibition of hepatic gluconeogenesis, which is an important mechanism of glucose metabolism disorders and an effective therapeutic target [119]. Vanadium inhibits gluconeogenesis by inhibiting the expression of key genes that control this process: phosphoenolpyruvate carboxykinase (PEPCK) and glucose 6-phosphatase (G-6-Pase). This is done through activation of AKT kinases with an enhanced phosphorylation of GSK-3 and FOXO, the main transcription factor of these genes [120].
Phosphorylation of AKT kinases has also been implicated as the primary mechanism of the antidiabetic action of vanadium compounds [121]. In this study, we demonstrated that both ONS and ONO complexes potentiate the phosphorylation of AKT in hepatocytes. This indicates that they act through the same, common mechanism, which is also the effector mechanism of insulin action. Abnormalities in the phosphorylation of AKT kinases are associated with the occurrence of insulin resistance of cells, and restoring their sensitivity to insulin is a key aspect of the pharmacotherapy of metabolic disorders. Insulin resistance of hepatocytes is caused, among others, by exposure to increased concentration of free fatty acids and hyperinsulinemia, and pro-inflammatory cytokines such as TNF intensify this process [122]. These factors were used to induce insulin resistance in the models used in this study.
The ONO complexes VC067 and VC068, which showed effects in both inhibiting lipid accumulation in the NAFLD model and inhibiting gluconeogenesis, can also reversed the effects of insulin resistance in hepatocytes. The few studies conducted in cellular models of hepatocytes have shown similar effects. Vanadium effectively reversed hepatocyte insulin resistance, also induced by TNF [123] and the mechanism of reversal of insulin resistance by VO-OHpic vanadium complex was related to the inhibition of the dual specificity phosphatase PTEN. Vanadium is an inhibitor of this phosphatase that regulates the activity of the AKT pathway [124].
Normal insulin signaling networks employs not only AKT but also extracellular signal-regulated kinase (ERK). ERK has been implicated in the development of insulin resistance associated with obesity and type 2 diabetes mellitus. ERK is also the final effector of the pathway regulating the cell cycle and cell differentiation, and abnormal, uncontrolled activation is associated with neoplastic processes. In our study, all tested ONS and ONO complexes showed enhanced ERK phosphorylation. Dose- and time-dependent activation of the ERK signaling pathway through its phosphorylation was also found for vanadium compounds, which was associated with their anticancer effect. ERK activation through the PI3-K and ras pathway is also hypothesized to play an essential role in mediating the insulin-mimetic effects of vanadium compounds [22].
The observed differences in the effectiveness of ONS and ONO complexes in the different cell models and mechanisms may be due to the specific or selective effects of these complexes. Differences in the activity of vanadium complexes against on the various cell type have already been observed for bis-coordinated oxidovanadium(IV) complexes with the imidazolyl-carboxylate moiety which improved glucose uptake in cell cultures of myocytes C2C12, adipocytes 3T3-L1 and Chang cells [73]. For example, [VO(Im2COO)2] showed efficacy on 3T3-L1 adipocytes with no activity on C2C12 myocytes. [VO(Im4COO)2] showed the opposite effect and even decreased basal glucose utilization for 3T3-L1. Similar differences have also been observed for hepatocytes. Explaining the differences in the observed effects, the authors of this paper point to the potential possibility of structural rearrangement or decomposition of complexes, which were incubated with cells in two different media (DMEM or RPMI-1640, 10% FBS). On the other hand, two different cell models (myocytes C2C12 and Chang cells) were maintained in the same medium (RPMI-1640), yet differences in the effects of the complexes were observed. This indicates their selective action resulting from the structure of the complexes [73].
The selectivity of the effects of vanadium complexes against different cell lines cultured and incubated under the same experimental conditions has already been observed, among others for vanadium complexes with orotic and glutamic acids [125]. Similarly, structural modifications of ligands of other complexes resulted the selectivity between cancer cell lines [101].
Among the possible reasons for the different intensity of the effects of vanadium complexes in different cell types is the interaction of the properties of the cells themselves and the physicochemical properties of the complexes. Preferential uptake of vanadium(V) complexes with hydrophobic organic ligands by cancer cells has been observed [126]. Such interactions may result from the different composition, structure and properties of cell membranes in different tissues and specific changes in membranes in cancer cells [127]. Differences in these properties naturally also concern normal cells from various tissues. An example illustrating the influence of cell properties on interactions with vanadium complexes may be the degree of cell differentiation of 3T3-L1 adipocytes. The differentiation of these cells from preadipocytes to adipocytes is accompanied by changes in the amount and composition of intracellular lipids. 3T3-L1 mature adipocytes compared to preadipocytes of this cell line, showed a greater tendency to form IV vanadium, despite the predominance of V form in the medium [96]. Similarly, steatotic hepatocytes are characterized by altered biochemical processes and structural differences from normal hepatocytes, which include, among others, modifications of cell membranes. This may determine the specific effects and activity of the ONS and ONO complexes.
4. Conclusions
In this study, we confirmed that the novel synthetized and characterized ONS-type vanadium(V) complexes with thioanilidine derivatives of aminoacids show pharmacological activity in the cell models of metabolic disturbances.
Our research approach with a wide range of models and investigated mechanisms, adequate to the wide range of activity of vanadium complexes, allowed for the identification of complexes that specifically act on myocytes, adipocytes and hepatocytes as well as pathogenetic processes of metabolic disorders, including NAFLD.
The simultaneous testing of ONO-type complexes made possible a direct comparison of the potential and strength of action between the two groups of complexes. In addition to the differences in the pharmacological effects of the ONS and ONO group complexes, within each of these groups, we identified complexes with effects that distinguished them from other complexes in the same group. VC070 as the only one the ONS type complex enhanced transport of [14C]-deoxy-D-glucose in 3T3-L1 adipocytes, and VC068 form the ONO group complexes showed high activity in all employed models.
Our study serve the basis for further research on the selective or specific effects of vanadium complexes, which may help develop vanadium complexes with improved pharmacological properties.
6. Materials and Methods
4.1. Complexes synthesis and characterization
4.1.1. Materials and analytical methods
All reagents were of analytical grade (Aldrich) and were used as supplied. Ethanol (98%) was of pharmaceutical grade and all other solvents were of analytical grade and were used as supplied.
Microanalysis of carbon, hydrogen and nitrogen and sulfur were performed using Elementar Vario MICRO Cube elemental analyzer. IR spectra were recorded on a Bruker EQUINOX 55 FT-IR spectrophotometer in KBr pellets. The electronic absorption spectra were recorded with Shimadzu UV-3600 UV-Vis-NIR spectrophotometer equipped with a CPS-240 temperature controller. The magnetic susceptibility measurements were performed on a SHERWOOD SCIENTIFIC magnetic susceptibility balance. NMR spectra were determined on a Bruker Avance II 300 MHz spectrometer (using TMS as an internal standard).
4.1.2. The synthesis of vanadium complexes with ONS Schiff base ligands
4.1.2.1. Synthesis of 3-hydroxytiocrotonic acid anilide
Stage 1 (Scheme 1 in the section Results): A solution of acetylacetone (acac) (40.1 g; 41.2 mL, 0.4 mol) in anhydrous DMF (150 mL) was cooled to 0 °C by immersing the reaction flask in ice water. Separately, sodium hydride NaH, without of paraffin oil, was prepared according to the following procedure: commercial NaH dispersed in paraffin oil (55%-60%) was placed in a column with a glass filter, connected to a water pump, and washed with small portions of anhydrous diethyl ether (3 × 10 mL) thus removing the paraffin oil. Pure 100% NaH was dried by passing a stream of argon through the column, still connected to the water pump. Oil free NaH (9.6 g; 0.4 mol) was added gradually to a cooled acac solution in DMF. During the addition of NaH, hydrogen was rapidly evolved and then the contents of the flask solidified to a white mass, which was broken with a baguette. After 1 hour phenyl isothiocyanate PhNCS (54.1 g; 51.2 mL; 0.4 mol) was added dropwise while stirring the contents of the flask with a magnetic or mechanical stirrer. The reaction mixture turned brown red color. After one hour of stirring, the solution was poured onto 500 g of ice and acidified with HCl (1:1) to pH = 6. A brown oil precipitated solidified over time and turned yellow. It was a 2-acetyl derivative of 3-hydroxythiocrotonic acid anilide.
Stage 2 (Scheme 1 in the section Results): 3.41 g of sodium hydroxide and 65 mL of distilled water were introduced into a 250 mL beaker. The beaker was placed on a magnetic stirrer and its content was heated to 60 oC, then 20 g of 2-acetyl-3-hydroxytiocrotonic acid anilide were dissolved in the contents of the beaker with vigorous stirring. The resulting solution was left in an ice bath for several hours. The resulting light yellow precipitate of 3-hydroxythiocrotonic acid anilide was filtered off. The precipitate was crystallized from benzene, giving the product in the form of yellow flakes, m.p. 63-65 °C (lit. 64-66 °C). The yield after crystallization is 11.97 g (73%) of product III (Scheme 1). The product can also be crystallized from ethanol, but the crystallization efficiency is lower and does not exceed 55%.
4.1.2.2. Condensation reaction of 3-hydroxythiocrotonic acid anilide with an amino acid salt
Condensation reaction is illustrated in Scheme 2 in the section Results. 3-Hydroxythiocrotonic acid anilide (5.336 g; 27.61 mmol) was added to a 100 mL round bottom flask, which was dissolved in benzene (65 mL). Then a small amount of DMF (1 mL) and the sodium salt of the amino acid (26.77 mmol) were triturated in a mortar. As amino acid we used L-tryptophan, L-phenylalanine, L-leucine, L-methionine, D/L-isoleucine. The flask was placed on a magnetic stirrer in an oil bath and an azeotropic head and reflux condenser were attached. The reaction mixture was heated 4-14 hours to reflux - the oil bath temperature was 120 °C, until no more water separation was obtained. The formed yellowish precipitate IV (Scheme 2) was filtered after cooling, washed with toluene, then with petroleum ether and dried. In formulas of vanadium complexes with ONS ligands, the compound IV is marking as L1 to L5 (for R = L-tryptophan, L-phenylalanine, L-leucine or L-methionine, D/L-isoleucine, respectively).
4.1.2.3. Syntheses of complexes with ONS ligands (VC054, VC059, VC070, VC073, VC109)
The synthesis of complexes with the ONS ligands is illustrated in Scheme 3 in the Results section. For a suspension of IV (3 mmol) in anhydrous THF (25 mL) 2 M HCl in diethyl ether (Et2O) (3 mmol; 1.5 mL) was added dropwise. The mixture was practically clarified during the addition of HCl in Et2O. 30 min after the end of the addition of HCl in Et2O, VOCl3 (3 mmol; 0.52 g; 0.28 mL) was added dropwise. The color of the mixture changed from yellow to dark green during the addition of VOCl3. 30 min after the end of the VOCl3 addition, the contents were centrifuged (4000 min-1, 4 min) and the supernatant was evaporated on a rotary evaporator (60 °C). The green-brown (olive) residue was dried in a vacuum oven (60 °C, 4 h). In the Table 1 in the section Results the formulas of ligand and complexes with the elemental analysis and IR spectra results are given.
4.1.3. The synthesis of vanadium complexes with ONO Schiff base ligands
4.1.3.1. Synthesis of ONO complex [V(L13)(HL13)] (VC055)
The 5-bromosalicylaldehyde (0.603 g, 3.0 mmol), 4-methoxybenzhydrazide (0.496 g, 3.0 mmol) and EtOH (20 mL) were refluxed under Ar for 15 minutes. Then [V(acac)3] (0.528 g, 1.5 mmol) was added and reflux was continued for 20 minutes. Almost immediately formation of brown precipitation was observed and solution started to be light yellow. The mixture was cooled and filtered and the complex was washed three times with excess of EtOH and dried in air. Yield: 0.936 g, 84%. MW = 746.27. Anal. Calcd. for C30H23Br2N4O6V: C, 48.28; H, 3.11; N, 7.51 %. Found: C, 48.03; H, 3.71; N, 6.94 %. The complex is paramagnetic, µ = 1.50 µB. IR-ATR (cm-1): 3456 (w), 2956 (w), 1607 (s), 1509 (m), 1489 (w), 1456 (w), 1412 (w), 1365 (m), 1338 (w), 1308 (w), 1258 (m), 1177 (m), 1137 (w), 1087 (w), 1030 (m), 936 (w), 902 (w), 872 (w), 845 (w), 822 (w), 756 (w), 701 (w), 657 (w), 620 (w), 579 (w), 469 (w).
4.2. Methods of biological assays
4.2.1. Materials
Molecular biology grade or pure for analyzes reagents were used for biochemical assays. Media and consumables of appropriate quality and purpose were used for cell cultures were obtained from American Type Culture Collection (ATCC), Lonza, Thermo Fisher Scientific and Sigma-Aldrich.
4.2.2. Inhibition of human recombinant tyrosine phosphatases
To determine the ability of tested compounds to inhibition tyrosine phosphatases [46,128], human recombinant proteins were used (Sigma-Aldrich, USA). The reactions were performed in black opaque 384-well microplates (PerkinElmer, USA). An equal volume of phosphatase solution in a reaction buffer (25 mM of 3-(N-morpholino)propanesulfonic acid (MOPS), 50 mM NaCl, 1 mM dithiothreitol (DTT) and 0.05% Tween-20, pH 7.0) was added to the solution of the tested compound on microplate. These solutions were dispensed using automated injector. The following final concentrations of the tested phosphatases were used: PTP1B 50 ng/mL, SHP1 400 ng/mL, SHP2 50 ng/mL, LAR 5 ng/mL and PTPRA 100 ng/mL. After 10 min, a solution of phosphate 6,8-difluoro-4-methyl (DiFMUP; Thermo Fisher Scientific, USA) was added until its final concentration was 0.1 mM. Samples were incubated for 20 minutes at 23 °C and then the measurements of fluorescence intensity (excitation 355 and emission 560 nm) were performed on a multifunctional plate reader POLARstar Omega (BMG Labtech, Germany). Assays were performed in triplicates. For the screening assays the final concentration of tested compounds was 1 µM. The results were expressed as per cent of inhibition of untreated control (enzyme with vehicle only) for the screening tests. For determination of the half maximal inhibitory concentration (IC50) nine concentrations of tested compound in the range 10 nM to 10 µM was assayed in triplicates. IC50 were calculated using GraphPad Prism version 6.0 software (GraphPad Software, USA).
4.2.3. Inhibition of human recombinant non-tyrosine phosphatases
For inhibition assay of non-tyrosine phosphatases [129], human recombinant protein were used (Sigma-Aldrich, USA). The reactions were performed in black opaque 384-well microplates (PerkinElmer, USA). To the solution of the tested complexes an equal volume of a test solution of phosphatase was added. CDC25A were diluted in reaction buffer to the final concentration 400 ng/mL as for tyrosine phosphatases (described in the section above), and PPA2 (final 0.5 U/mL) was diluted in 50 mM Tris-HCl, 0.05% Tween-20, 125 µg/mL protease free bovine serum albumin, pH 7.0. These solutions were dispensed using autom ated injector. After 10 minutes, a solution of phosphate 6,8-difluoro-4-methyl (DiFMUP; Thermo Fisher Scientific, USA) was added for PPA2 sample until for the final concentration 0.1 mM. For CDC25A samples 3-O-methylfluorescein phosphate for the final concentration 0.2 mM was added. Samples were incubated for 180 minutes at 23 °C and then the measurements of fluorescence intensity (excitation 355 and emission 560 nm) were performed on a multifunctional plate reader POLARstar Omega (BMG Labtech, Germany). Assays were performed in triplicates. The results were expressed as per cent of inhibition of untreated control (enzyme with vehicle solvent only).
4.2.4. Cell models and culture conditions
All cell lines were obtained directly from ATCC (American Type Culture Collection). The passage number of cells used in the experiments was between 4 and 10. The evaluation of the functional stability of the cell lines was conducted based on the results for control compounds, which were tested in each experimental series and compared with the results obtained in the process of validation and optimization of experimental models.
Myocytes C2C12 cell line (ATCC CRL-1772), subclone of myoblasts from mouse muscles were cultured according to standard protocol in DMEM supplemented with 10% fetal calf serum, 100 IU/ml penicillin and 100 mg/ml streptomycin at 37 °C in 5% CO2. Cells were pleated on 96-well microplate and after reach confluence were differentiated in medium with 2% horse serum. Differentiation medium was changed every 72 h.
Adipocytes 3T3-L1 cell line (ATCC CRL-11605) derived from fibroblasts from mouse embryo tissue were cultured according to standard protocol in DMEM medium supplemented with 10% bovine calf serum, 100 IU/mL penicillin and 100 mg/mL streptomycin at 37 °C in 5% CO2. Cells were seeded in 96-well poly-D-lysine coated plates and cultured to reach confluency. The culture medium was then replaced for differentiation medium I (DMEM, 10% foetal bovine serum, 25 nM 3-isobutyl-1-methylxanthine (IBMX), 500 µM dexamethasone, and 670 nM/10 µg/mL human recombinant insulin). After 48 hours of incubation (differentiation day 2), the medium was changed to differentiation medium II (DMEM, 10% foetal bovine serum, and 670 nM/10 µg/ml human recombinant insulin).
Human hepatocytes HepG2 cell line (ATCC HB-8065) were cultured according to standard protocol in DMEM supplemented with 10% fetal bovine serum, 100 IU/mL penicillin and 100 mg/mL streptomycin at 37 °C in 5% CO2. Cells were pleated on 96-well microplate and use 18-24 h after seeding.
4.2.5. Scintillation proximity assay for uptake of radiolabeled 2-deoxy-D-[U-14C]-glucose
Scintillation proximity assay (SPA) is a method to measure real time accumulation of radiolabeled substrates by adherent cells with no filtration needed. Radioactivity concentrated closer to the scintillator embedded in the plastic bottom of each well provides a stronger signal than the radiolabeled substrate in the culture medium [130]. Uptake of radiolabeled 2-deoxy-D-[U-14C]-glucose was conducted based on previously descriptions [131,132,133].
Hepatocytes HepG2, myocytes C2C12 (after 8 days differentiation) and adipocytes 3T3-L1 (after 11 days of differentiation) was cultured and maintained as described in section above but pleated on ScintiPlate TC 96-well microplate coated with solid phase scintillator (PerkinElmer, USA). Hepatocytes and myocytes were washed and culture medium was changed for medium with 0.5% BSA instead serum. After 24 h incubation tested complexes were added. After 2 h incubation at 37 °C in 5% CO2 medium was changed for low glucose medium (1000 mg/l), tested complexes were added again and further incubation for 4 h was conducted. Next, cells were washed three times with Krebs-Ringer buffer (KRB) without glucose (1 mM MgSO4, 1 mM CaCl2, 136 mM NaCl, 4,7 mM KCl and 10 mM HEPES; pH 7.4) and KRB with human recombinant insulin at final concentration 100 nM (Sigma-Aldrich) was added for 15 min. Wortmannin at final concentration 200 nM (Sigma-Aldrich) was used as negative control. After that, cells were washed three times with cold KRB and cytochalasin B (10 mM final) was added for several wells as ‘‘no uptake” control and proceeded as shown below.
Adipocytes were washed and medium was changed for basal medium. After 24 h incubation tested complexes were added. After 2 h incubation at 37 °C in 5% CO2 medium was changed for DMEM medium without glucose, with 0.1% BSA free from fatty acid, 200 mM L-glutamine and 100 mM pyruvate. Tested complexes were added again and further incubation for 4 h was conducted. Next, cells were washed three times with Krebs-Ringer buffer (KRB) without glucose and KRB with human recombinant insulin at final concentration 100 nM (Sigma-Aldrich) was added for 15 min. Wortmannin at final concentration 200 nM (Sigma-Aldrich) was used as negative control. After that, cells were washed three times with cold KRB and cytochalasin B (10 mM final) was added for several wells as ‘‘no uptake”.
For cells proceeded as above 2-deoxy-D-[U-14C]-glucose (250-350 mCi/mmol, NEC720A, PerkinElmer, USA) solution in KRB with total activity 0.03 mCi was added to each well. After 1 h incubation at 37 °C and 5% CO2 uptake was blocked by adding cytochalasin B (10 mM final). Radioactivity of samples was measured in scintillation counter MicroBeta Trilux 1450 (PerkinElmer, USA). Non-specific radioactivity was subtracted from each result (cpm). Two independent experiments with triplicates were conducted. Final results were expressed as per cent of control contained solvent only instead tested compound.
4.2.6. Glucose utilization in myocytes
Differentiated myocytes C2C12 was used after 8 days differentiation. The culture medium was changed for medium with 0.2% bovine serum albumin, 100 IU/mL penicillin, 100 µg/mL streptomycin and after 2 hours incubation the medium was changed for fresh medium containing tested compounds. After 24 hours incubation, supernatants were collected.
Glucose concentration was determined based on enzymatic reaction with glucose oxidase and fluorometrically detection reaction end product using AmplexRed Glucose/Glucose Oxidase Kit (Invitrogen) according to manufacturer protocol. 10 mL supernatant diluted 50x in 50 mM PBS pH 7.4 and 10 mL reagents containing 4 U/mL glucose oxidase, 0.4 U/mL horseradish peroxidase and 200 mM 10-acetyl-3,7-dihydroxyphenoxazine in 50 mM PBS pH 7.4 was added to a black opaque 384-well OptiPlate and incubated for 30 minutes at 37 °C. All assays were conducted in triplicates. Fluorescence signal was measured at excitation of 530 nm and emission of 580 nm using a multimodal microplate reader POLARStar Omega (BMG Labtech, Germany) and glucose concentration in samples was calculated in MARS Data Analysis Software based on glucose standards. Glucose utilization was calculated as the differences between incubation medium without cells and medium with cells after incubation with the tested compound. Final results were expressed as the per cent of controls containing cells and solvent only.
4.2.7. Inhibition of lipid accumulation in cell model of NAFLD
Induction of hepatic lipid accumulation and studies on the effect of vanadium complexes on this process were carried out based on previous descriptions [134,135]. Hepatocytes HepG2 in culture medium (as indicated above) were seeded on collagen-I coated 96 well microplate in amount of 20,000 per well. After 16-24 hour standard medium was changed for DMEM with 0.1% BSA fatty acid free and 0.5 mM oleic acid as sodium salt and tested compounds were added. Cells were incubated for 24 h and the intracellular lipid content was evaluated using AdipoRed Adipogenesis Assay Reagent (Lonza, Switzerland) according to the manufacturer’s protocol. Hepatocytes were washed with PBS with calcium and magnesium and 5 µL AdipoRed Reagent in 200 µL PBS was added and incubated for 10 minutes in 22 °C. Fluorescence signal proportional to lipids content in cells was measured at excitation in 530 nm and emission in 550 nm using multimodal microplate reader POLARStar Omega (BMG Labtech, Germany). The results were normalized to the untreated control (cells with solvent only), wherein the intensity of fluorescence was taken as 100%.
4.2.8. Inhibition of hepatic gluconeogenesis
Experiments on inhibition of hepatic gluconeogenesis in HepG2 hepatocytes by the vanadium complexes were carried out based on previous description with some modifications [136]. Hepatocytes HepG2 in culture medium (as indicated above) were seeded on half-area 96 microplate in amount of 50,000 per well. After 16-24 h cells were washed with PBS three times and one time with experimental medium (DMEM without glucose with 0.1% BSA, 2 µM L-glutamine, 15 mM HEPES, 1 mM sodium pyruvate, 10 mM calcium lactate, 100 IU/mL penicillin and 100 mg/mL streptomycin). Cells were incubated in this medium for 3 h at 37 °C in 5% CO2 and next medium was changed for experimental medium with additional gluconeogenesis inductors: 10 µM dexamethasone, 100 µM 8-bromoadenosine 3′,5′-cyclic monophosphate sodium salt (8-Br-cAMP) and 500 µM 3-isobutyl-1-methylxanthine (IBMX). After adding test compounds the cells were incubated for 3 h at 37 °C in 5% CO2 microplate and supernatant was collected for glucose assay (as described in section “Glucose utilization in myocytes”). Glucose synthesis was calculated as glucose concentration differences between experimental medium without cells and medium with cells after incubation with the tested compound. Final results were expressed as per cent of inhibition of glucose synthesis by cells incubated with solvent only.
4.2.9. Hyperinsulinemia condition and induction of insulin resistant hepatocytes
Induction of insulin resistant hepatocytes HepG2 were carried out based on previous descriptions [137,138]. Hepatocytes HepG2 in culture medium (as described in section above) were pleated on ScintiPlate TC 96-well microplate coated with solid phase scintillator (PerkinElmer, USA). After 16-24 h medium was changed for medium with addition of human recombinant insulin at concentration 10 µg/mL or with insulin resistant inductors: 10 ng/mL TNF-α or oleic acid as sodium salt and cells were incubated for next 48 h at 37 °C in 5% CO2. Next, compounds in fresh medium were added and further incubation was carried out for 24 h and scintillation proximity assay for uptake of radiolabeled 2-deoxy-D-[U-14C]-glucose was conducted as described in section above.
4.2.10. Cytotoxicity assay (cell membrane damage)
The bioluminescent ToxiLight assay (Lonza) was used as a highly sensitive cytotoxicity assay designed to measure cell membrane damage [139]. After incubation of cells with the tested compounds, 10 μL of cell supernatant was deposited in a new 96-well plate. Then, 40 μL of the Adenylate Kinase Detection Reagent (AKDR) was added per well. After 5 minutes of incubation at 22 °C, the luminescence intensity was measured in a multifunction plate reader (POLARstar Omega, BMG Labtech). The results were expressed as per cent of signal of untreated control (cells with solvent only).
4.2.11. Homogeneous proximity-based assay for AKT and MAPK/ERK phosphorylation
Hepatocytes HepG2 were seeded on 96-well microplate and incubated in culture medium without serum for 3 h and next were washed three times with Krebs-Ringer buffer (KRB) (NaCl 115 mM NaCl, 4.7 mM KCl, 1.28 mM CaCl2, 1.2 mM MgSO4, 1.2 mM KH2PO4, 10 mM NaHCO3 25 mM HEPES, pH 7.4). Tested compounds were added in serum-free culture medium and cells were incubated for 30 minutes for AKT and 20 minutes for ERK assay at 37 °C in 5% CO2 medium. Next, cells were washed, incubated for further 1 and 3 h and washed again before assay.
Protein phosphorylation was assayed using homogenous proximity-assay [140] with AlphaScreen SureFire Akt 1/2/3 (p-Ser473) Assay Kit and AlphaScreen SureFire ERK 1/2 (p-Thr202/Tyr204) Assay Kit (PerkinElmer, USA) according to manufacturer’s manual. Cells were lysed with Lysis Buffer with shaking for 10 minutes (350 rpm). 30 μL of the lysate was transferred to the white opaque 96 well half-area assay plate and 10 μl Acceptor Mix was added. Microplate was agitated on plate shaker for 2 minutes (350 rpm), and then incubated for 2 hours at 23 °C. 10 μL of Donor Mix was added to the wells under subdued light and microplate was agitated on plate shaker for 2 minutes (350 rpm), and then incubate for 1 hour (Akt) or 3 h (ERK) at 23 °C in darkness. Alpha signal was measured in standard mode using multimodal microplate reader POLARStar Omega (BMG Labtech, Germany). The results were expressed as ratio of phosphorylated protein to total protein and normalized to the untreated control (cells with solvent only), wherein the intensity of signal was taken as 100%.
4.3. Statistical methods
Unless otherwise indicated in the text, all results statistical analysis was performed by analysis of variance followed by the Dunnett test for post hoc comparisons with p<0.05. All tests were performed using GraphPad Prism version 6.0 for Windows, (GraphPad Software, USA).
Supplementary Materials
The following supporting information can be downloaded at the website of this paper posted on Preprints.org, Figure S1: 1H-NMR spectrum of L1; Figure S2: 1H-NMR spectrum of L2; Figure S3: 1H-NMR spectrum of L3; Figure S4: 1H-NMR spectrum of L4; Figure S5: 1H-NMR spectrum of L5; Figure S6: IR-ATR spectrum of VC054; Figure S7: IR-ATR spectrum of VC059; Figure S8: IR-ATR spectrum of VC070; Figure S9: IR-ATR spectrum of VC073; Figure S10: IR-ATR spectrum of VC109; Figure S1: IR-ATR spectrum of VC055; Figure S12: UV–Vis spectra of complex VC054 in DMSO-H2O mixture; Figure S13: UV–Vis spectra of complex VC059 in DMSO-H2O mixture; Figure S14: UV–Vis spectra of complex VC070 in DMSO-H2O mixture; Figure S15: UV–Vis spectra of complex VC073 in DMSO-H2O mixture; Figure S16: UV–Vis spectra of complex VC055 in DMSO-H2O mixture; Figure S17: Qualitative UV–Vis spectra of complex VC054 in different solvents; Figure S18: Qualitative UV–Vis spectra of complex VC059 in different solvents; Figure S19: Qualitative UV–Vis spectra of complex VC070 in different solvents; Figure S20: Qualitative UV–Vis spectra of complex VC073 in different solvents; Figure S21: Qualitative UV–Vis spectra of complex VC109 in different solvents; Figure S22: Qualitative UV–Vis spectra of complex VC055 in different solvents.
Author Contributions
Conceptualization, G.K.; methodology, G.K. and D.C.; validation, G.K., M.G.-L. and B.M.; formal analysis, G.K.; investigation G.K., M.G-L., B.M., E.M., A.J., B.T. and D.C.; resources, G.K., M.G-L., B.M., E.M., B.T. and D.C.; data curation G.K, B.M., M.G-L., B.T., D.C. and A.J.; writing—original draft preparation, G.K. and A.J.; writing—review and editing, M.K., M.P. and J.S.; visualization, G.K. and A.J; supervision, G.K. and M.P; project administration G.K.; funding acquisition G.K. and M.K. All authors have read and agreed to the published version of the manuscript.
Funding
This research was funded by the European Union Funds via European Regional Development Fund under the Innovative Economy Program 2007–2013, grant number WND POIG.01.03.01-174/09 and by Jagiellonian University Medical College, grant number N42/BDS/000287.
Institutional Review Board Statement
Not applicable.
Informed Consent Statement
Not applicable.
Data Availability Statement
The data presented in this study are available on reasonable request from the corresponding author.
Acknowledgments
We would like to thank Doctor Ryszard Gryboś and Professor Barbara Filipek for their invaluable contribution and support throughout the entire project. Many thanks to the late Professor Marek Stępniewski (1939-2023), without whom this research would never have been possible.
Conflicts of Interest
The authors declare no conflict of interest.
References
- Saeedi, P.; Petersohn, I.; Salpea, P.; Malanda, B.; Karuranga, S.; Unwin, N.; Colagiuri, S.; Guariguata, L.; Motala, A.A.; Ogurtsova, K.; Shaw, J.E.; Bright, D.; Williams, R. IDF Diabetes Atlas Committee. Global and regional diabetes prevalence estimates for 2019 and projections for 2030 and 2045: Results from the International Diabetes Federation Diabetes Atlas, 9th edition. Diabetes Res. Clin. Pract. 2019, 157, 107843.
- Grundy, S.M. Pre-diabetes, metabolic syndrome, and cardiovascular risk. J. Am. Coll. Cardiol. 2012, 59, 635-43. [CrossRef]
- Lima, L.M. Prediabetes definitions and clinical outcomes. Lancet Diabetes Endocrinol. 2017, 5, 92-93. [CrossRef]
- Yip, W.C.Y.; Sequeira, I.R.; Plank, L.D.; Poppitt, S.D. Prevalence of pre-diabetes across ethnicities: a review of impaired fasting glucose (ifg) and impaired glucose tolerance (igt) for classification of dysglycaemia. Nutrients 2017, 9, 1273. [CrossRef]
- Araújo, A.R.; Rosso, N.; Bedogni, G.; Tiribelli, C.; Bellentani, S. Global epidemiology of non-alcoholic fatty liver disease/non-alcoholic steatohepatitis: What we need in the future. Liver Int. 2018, 38, 47-5. [CrossRef]
- Marjot, T.; Moolla, A.; Cobbold, J.F.; Hodson, L.; Tomlinson, J.W. Nonalcoholic fatty liver disease in adults: current concepts in etiology, outcomes, and management. Endocr. Rev. 2020, 41, bnz009. [CrossRef]
- Dahlén, A.D.; Dashi, G.; Maslov, I.; Attwood, M.M.; Jonsson, J.; Trukhan, V.; Schiöth, H.B. Trends in antidiabetic drug discovery: FDA approved drugs, new drugs in clinical trials and global sales. Front. Pharmacol. 2022, 12, 807548. [CrossRef]
- Artasensi, A.; Pedretti, A.; Vistoli, G.; Fumagalli, L. Type 2 diabetes mellitus: A review of multi-target drugs. Molecules. 2020, 25, 1987. [CrossRef]
- Thompson, K.H.; Orvig, C. Vanadium in diabetes: 100 years from Phase 0 to Phase I. J. Inorg. Biochem. 2006, 100, 1925-35. [CrossRef]
- Crans, D.C.; Henry, L.; Cardiff, G.; Posner, B.I. Developing vanadium as an antidiabetic or anticancer drug: A clinical and historical perspective. in: essential metals in medicine: therapeutic use and toxicity of metal ions in the clinic, Edited by Peggy L. Carver, Berlin, Boston: De Gruyter, 2019; 8, pp. 203-230. [CrossRef]
- Thompson, K.H.; Lichter, J.; LeBel, C.; Scaife, M.C.; McNeill, J.H.; Orvig, C. Vanadium treatment of type 2 diabetes: a view to the future. J. Inorg. Biochem. 2009, 103, 554-558. [CrossRef]
- Soveid, M.; Dehghani, G.A.; Omrani, G.R. Long- term efficacy and safety of vanadium in the treatment of type 1 diabetes. Arch. Iran Med. 2013, 16, 408-411.
- Kahn, S.E.; Cooper, M.E.; Del Prato, S. Pathophysiology and treatment of type 2 diabetes: perspectives on the past, present, and future. Lancet 2014, 383, 1068-83. [CrossRef]
- Kanwal, A.; Kanwar, N.; Bharati, S.; Srivastava, P.; Singh, S.P.; Amar, S. Exploring new drug targets for type 2 diabetes: success, challenges and opportunities. Biomedicines 2022, 10, 331. [CrossRef]
- Treviño, S.; Díaz, A.; Sánchez-Lara, E.; Sanchez-Gaytan, B.L.; Perez-Aguilar, J.M.; González-Vergara, E. Vanadium in biological action: chemical, pharmacological aspects, and metabolic implications in diabetes mellitus. Biol. Trace Elem. Res. 2019, 188, 68-98. [CrossRef]
- Crans, D.C.; Smee, J.J.; Gaidamauskas, E.; Yang, L. The chemistry and biochemistry of vanadium and the biological activities exerted by vanadium compounds. Chem. Rev. 2004, 104, 849-902. [CrossRef]
- Pendergrass, M.; Bertoldo, A.; Bonadonna, R.; Nucci, G.; Mandarino, L.; Cobelli, C.; Defronzo, R.A. Muscle glucose transport and phosphorylation in type 2 diabetic, obese nondiabetic, and genetically predisposed individuals. Am. J. Physiol. Endocrinol. Metab. 2007, 292, E92-E100. [CrossRef]
- DeFronzo, R.A.; Gunnarsson, R.; Björkman, O.; Olsson, M.; Wahren, J. Effects of insulin on peripheral and splanchnic glucose metabolism in noninsulin-dependent (type II) diabetes mellitus. J. Clin. Invest. 1985, 76, 149-155. [CrossRef]
- Chait, A.; den Hartigh, L.J. Adipose tissue distribution, inflammation and its metabolic consequences, including diabetes and cardiovascular disease. Front. Cardiovasc. Med. 2020, 7, 22. [CrossRef]
- Chaudhury, A.; Duvoor, C.; Reddy Dendi, V.S.; Kraleti, S.; Chada, A.; Ravilla, R.; Marco, A.; Shekhawat, N.S.; Montales, M. T.; Kuriakose, K.; Sasapu, A.; Beebe, A.; Patil, N.; Musham, C.K;, Lohani, G.P.; Mirza, W. Clinical review of antidiabetic drugs: implications for type 2 diabetes mellitus management. Front. Endocrinol. (Lausanne). 2017, 8, 6. [CrossRef]
- Irving, E.; Stoker, A.W. Vanadium compounds as PTP Inhibitors. Molecules 2017, 22, 2269. [CrossRef]
- Pandey, S.K.; Théberge, J.F.; Bernier, M.; Srivastava, A.K. Phosphatidylinositol 3-kinase requirement in activation of the ras/C-raf-1/MEK/ERK and p70(s6k) signaling cascade by the insulinomimetic agent vanadyl sulfate. Biochemistry 1999, 38, 14667-75. [CrossRef]
- Eleftheriou, P.; Geronikaki, A.; Petrou, A. PTP1b inhibition, a promising approach for the treatment of diabetes type II. Curr. Top. Med. Chem. 2019, 19, 246-263. [CrossRef]
- Mehdi, M.Z.; Pandey, S.K.; Théberge, J.F.; Srivastava, A.K. Insulin signal mimicry as a mechanism for the insulin-like effects of vanadium. Cell Biochem. Biophys. 2006, 44, 73-81. [CrossRef]
- Pandey, S.K.; Chiasson, J.L.; Srivastava, A.K. Vanadium salts stimulate mitogen-activated protein (MAP) kinases and ribosomal S6 kinases. Mol. Cell Biochem. 1995, 153, 69-78. [CrossRef]
- Neel, B.G.; Tonks, N.K. Protein tyrosine phosphatases in signal transduction. Curr. Opin. Cell Biol. 1997, 9, 193-204. [CrossRef]
- Xu, E.; Schwab, M.; Marette, A. Role of protein tyrosine phosphatases in the modulation of insulin signaling and their implication in the pathogenesis of obesity-linked insulin resistance. Rev. Endocr. Metab. Disord. 2014, 15, 79-97. [CrossRef]
- Lu, L.; Zhu, M. Protein tyrosine phosphatase inhibition by metals and metal complexes. Antioxid. Redox Signal 2014, 20, 2210-24. [CrossRef]
- Krüger, J.; Wellnhofer, E.; Meyborg, H.; Stawowy, P.; Östman, A.; Kintscher, U.; Kappert, K. Inhibition of Src homology 2 domain-containing phosphatase 1 increases insulin sensitivity in high-fat diet-induced insulin-resistant mice. FEBS Open Bio. 2016, 6, 179-89. [CrossRef]
- Sevillano, J.; Sánchez-Alonso, M.G.; Pizarro-Delgado, J.; Ramos-Álvarez, M.D.P. Role of receptor protein tyrosine phosphatases (RPTPs) in insulin signaling and secretion. Int. J. Mol. Sci. 2021, 22, 5812. [CrossRef]
- Morioka, M.; Fukunaga, K.; Kawano, T.; Hasegawa, S.; Korematsu, K.; Kai, Y.; Hamada, J.; Miyamoto, E.; Ushio, Y. Serine/threonine phosphatase activity of calcineurin is inhibited by sodium orthovanadate and dithiothreitol reverses the inhibitory effect. Biochem. Biophys. Res. Commun. 1998, 253, 342-5. [CrossRef]
- Semiz, S.; McNeill, J.H. Oral treatment with vanadium of Zucker fatty rats activates muscle glycogen synthesis and insulin-stimulated protein phosphatase-1 activity. Mol. Cell Biochem. 2002, 236, 123-31. [CrossRef]
- Honkanen, R.E.; Golden, T. Regulators of serine/threonine protein phosphatases at the dawn of a clinical era?. Curr. Med. Chem. 2002, 9, 2055-2075. [CrossRef]
- Copps, K.D.; White, M.F. Regulation of insulin sensitivity by serine/threonine phosphorylation of insulin receptor substrate proteins IRS1 and IRS2. Diabetologia 2012, 55, 2565-2582. [CrossRef]
- Scrivens, P.J.; Alaoui-Jamali, M.A.; Giannini, G.; Wang, T.; Loignon, M.; Batist, G.; Sandor, V.A. Cdc25A-inhibitory properties and antineoplastic activity of bisperoxovanadium analogues. Mol. Cancer Ther. 2003, 2, 1053-9. PMID: 14578470.
- Liu, K.; Zheng, M.; Lu, R.; Du, J.; Zhao, Q.; Li, Z.; Li, Y.; Zhang, S. The role of CDC25C in cell cycle regulation and clinical cancer therapy: a systematic review. Cancer Cell Int. 2020, 20, 213. [CrossRef]
- Pessoa, J.C.; Etcheverry, S.; Gambino, D. Vanadium compounds in medicine. Coord. Chem. Rev. 2015, 301, 24-48. [CrossRef]
- Crans, D.C.; Yang, L.; Haase, A.; Yang, X. "Health benefits of vanadium and its potential as an anticancer agent". In: Metallo-drugs: Development and action of anticancer agents, Edited by Astrid Sigel, Helmut Sigel, Eva Freisinger and Roland K.O. Sigel, Berlin, Boston: De Gruyter, 2018; 9, pp. 251-280. [CrossRef]
- Crans, D.C.; Meade, T.J. Preface for the forum on metals in medicine and health: new opportunities and approaches to improving health. Inorg. Chem. 2013, 52, 12181-12183. [CrossRef]
- Scior, T.; Guevara-García, A.; Bernard, P.; Do, Q.T.; Domeyer, D.; Laufer, S. Are vanadium compounds drugable? Structures and effects of antidiabetic vanadium compounds: a critical review. Mini Rev. Med. Chem. 2005, 5, 995-1008. [CrossRef]
- Scior, T.; Guevara-Garcia, J.A.; Do, Q.T.; Bernard, P.; Laufer, S. Why antidiabetic vanadium complexes are not in the pipeline of "Big Pharma" drug research? A critical review. Curr. Med. Chem. 2016, 23, 2874-2891. [CrossRef]
- Gryboś, R.; Paciorek, P.; Szklarzewicz, J.; Matoga, D.; Zabierowski, P.; Kazek, G. Novel vanadyl complexes of acetoacetanilide: Synthesis, characterization and inhibition of protein tyrosine phosphatase. Polyhedron 2013, 49, 100–104.
- Zabierowski, P.; Szklarzewicz, J.; Gryboś, R.; Mordyl, B.; Nitek, W. Assemblies of salen-type oxidovanadium(IV) complexes: substituent effects and in vitro protein tyrosine phosphatase inhibition. Dalton Trans. 2014, 43, 17044-17053. [CrossRef]
- Szklarzewicz, J.; Jurowska, A.; Hodorowicz, M.; Gryboś, R.; Matoga, D. Role of co-ligand and solvent on properties of V(IV) oxido complexes with ONO Schiff bases. J. Mol. Struct. 2019, 1180, 839–848.
- Gryboś, R.; Szklarzewicz, J.; Jurowska, A.; Hodorowicz, M. Properties, structure and stability of V(IV) hydrazide Schiff base ligand complex. J. Mol. Struct. 2018; 1171: 880–887.
- Szklarzewicz, J.; Jurowska, A.; Matoga, D.; Kruczała, K.; Kazek, G.; Mordyl, B.; Sapa, J.; Papież, M. Synthesis, coordination properties and biological activity of vanadium complexes with hydrazone Schiff base ligands. Polyhedron 2020, 185, 1-13. [CrossRef]
- Szklarzewicz, A.; Jurowska, M.; Hodorowicz, M.; Gryboś, R.; Kruczała, K.; Głuch-Lutwin, M.; Kazek, G. Vanadium complexes with salicylaldehyde-based Schiff base ligands-structure, properties and biological activity. J. Coord. Chem. 2020, 73, 986-1008. [CrossRef]
- Szklarzewicz, J.; Jurowska, A.; Hodorowicz, M.; Kazek, G.; Głuch-Lutwin, M.; Sapa, J. Ligand role on insulin-mimetic properties of vanadium complexes. Structural and biological studies. Inorg. Chim. Acta 2021, 516, 120135. [CrossRef]
- Szklarzewicz, J.; Jurowska, A.; Hodorowicz, M.; Kazek, G.; Mordyl, B.; Menaszek, E.; Sapa, J. Characterization and antidiabetic activity of salicylhydrazone Schiff base vanadium(IV) and (V) complexes. Transit. Met. Chem. 2021, 46, 201–217. [CrossRef]
- Jurowska, A.; Serafin, W.; Hodorowicz, M.; Kruczała, K.; Szklarzewicz, J. Vanadium precursors and the type of complexes formed with Schiff base ligand composed of 5-bromosalicylaldehyde and 2-hydroxybenzhydrazide—Structure and characterization. Polyhedron 2022, 222, 115903.
- Jasińska, A.; Szklarzewicz, J.; Jurowska, A.; Hodorowicz, M.; Kazek, G.; Mordyl, B.; Głuch-Lutwin, M. V(III) and V(IV) Schiff base complexes as potential insulin-mimetic compounds—Comparison, characterization and biological activity. Polyhedron 2022, 215, 115682.
- Gryboś, R.; Szklarzewicz, J.; Matoga, D.; Kazek, G.; Stępniewski, M.; Krośniak, M.; Nowak, G.; Paciorek, P.; Zabierowski, P. Vanadium complexes with hydrazide-hydrazones, process for their preparation, pharmaceutical formulations and the use of thereof. World Patent No. WO2014073992A1. May 15, 2014.
- Gryboś, R.; Szklarzewicz, J.; Matoga, D.; Kazek, G.; Stępniewski, M.; Krośniak, M.; Nowak, G.; Paciorek, P.; Zabierowski, P. Vanadium complexes with hydrazide-hydrazones, process for their preparation, pharmaceutical formulations and their use. PL Patent No. PL231079B1. November 07, 2012.
- Kazek, G.; Głuch-Lutwin, M.; Mordyl, B.; Menaszek, E.; Szklarzewicz, J.; Gryboś, R.; Papież, M. Cell-based screening for identification of novel vanadium complexes with multidirectional activity relative to cells associated with metabolic disorders. ST&I 2019, 4, 47–54. [CrossRef]
- Kazek, G.; Głuch-Lutwin, M.; Mordyl, B.; Menaszek, E.; Sapa, J.; Szklarzewicz, J.; Gryboś, R.; Papież, M. Potentiation of adipogenesis and insulinomimetic effects of novel vanadium complex (N'-[(E)-(5-bromo-2-oxophenyl)methylidene]-4-methoxybenzohydrazide)oxido(1,10-phenanthroline)vanadium(IV) in 3T3-L1 cells. ST&I 2019, 1, 55-62. [CrossRef]
- ISO 10993-5:2009 Biological evaluation of medical devices. Part 5: Tests for in vitro cytotoxicity. International Organization for Standardization; Geneva, Switzerland: 2009.
- Dash, A.; Figler, R.A.; Sanyal, A.J.; Wamhoff, B.R. Drug-induced steatohepatitis. Expert. Opin. Drug Metab. Toxicol. 2017, 13, 193-204. [CrossRef]
- Peters, K.G.; Davis, M.G.; Howard, B.W.; Pokross, M.; Rastogi, V.; Diven, C.; Greis, K.D.; Eby-Wilkens, E.; Maier, M.; Evdokimov, A.; Soper, S.; Genbauffe, F. Mechanism of insulin sensitization by BMOV (bis maltolato oxo vanadium); unliganded vanadium (VO4) as the active component. J. Inorg. Biochem. 2003, 96, 321-30. [CrossRef]
- Cuncic, C.; Detich, N.; Ethier, D.; Tracey, A.S.; Gresser, M.J.; Ramachandran, C. Vanadate inhibition of protein tyrosine phosphatases in Jurkat cells: modulation by redox state. J. Biol. Inorg. Chem. 1999, 4, 354-359. [CrossRef]
- Han, H.; Lu, L.; Wang, Q.; Zhu, M.; Yuan, C.; Xing, S.; Fu, X. Synthesis and evaluation of oxovanadium(IV) complexes of Schiff-base condensates from 5-substituted-2-hydroxybenzaldehyde and 2-substituted-benzenamine as selective inhibitors of protein tyrosine phosphatase 1B. Dalton Trans. 2012, 41, 11116-11124. [CrossRef]
- Lu, L.; Gao, X.; Zhu, M.; Wang, S.; Wu, Q.; Xing, S.; Fu, X.; Liu, Z.; Guo, M. Exploration of biguanido-oxovanadium complexes as potent and selective inhibitors of protein tyrosine phosphatases. Biometals 2012, 25, 599-610. [CrossRef]
- Lu, L.; Wang, S.; Zhu, M.; Liu, Z.; Guo, M.; Xing, S.; Fu, X. Inhibition protein tyrosine phosphatases by an oxovanadium glutamate complex, Na2[VO(Glu)2(CH3OH)](Glu = glutamate). Biometals 2010, 23, 1139-1147. [CrossRef]
- Yuan, C.; Lu, L.; Gao, X.; Wu, Y.; Guo, M.; Li, Y.; Fu, X.; Zhu, M. Ternary oxovanadium(IV) complexes of ONO-donor Schiff base and polypyridyl derivatives as protein tyrosine phosphatase inhibitors: synthesis, characterization, and biological activities. J. Biol. Inorg. Chem. 2009, 14, 841-851. [CrossRef]
- Dubois, M.J.; Bergeron, S.; Kim, H.J.; Dombrowski, L.; Perreault, M.; Fournès, B.; Faure, R.; Olivier, M.; Beauchemin, N.; Shulman, G.I.; Siminovitch, K.A.; Kim, J.K.; Marette, A. The SHP-1 protein tyrosine phosphatase negatively modulates glucose homeostasis. Nat. Med. 2006, 12, 549-56. [CrossRef]
- Bergeron, S.; Dubois, M.J.; Bellmann, K.; Schwab, M.; Larochelle, N.; Nalbantoglu, J.; Marette, A. Inhibition of the protein tyrosine phosphatase SHP-1 increases glucose uptake in skeletal muscle cells by augmenting insulin receptor signaling and GLUT4 expression. Endocrinology 2011, 152, 4581-8. [CrossRef]
- Xu, E.; Charbonneau, A.; Rolland, Y.; Bellmann, K.; Pao, L.; Siminovitch, K. A.; Neel, B.G.; Beauchemin, N.; Marette, A. Hepatocyte-specific Ptpn6 deletion protects from obesity-linked hepatic insulin resistance. Diabetes 2012, 61, 1949-1958. [CrossRef]
- Qu, C.K. The SHP-2 tyrosine phosphatase: signaling mechanisms and biological functions. Cell. Res. 2000, 10, 279-88. [CrossRef]
- Yue, X.; Han, T.; Hao, W.; Wang, M.; Fu, Y. SHP2 knockdown ameliorates liver insulin resistance by activating IRS-2 phosphorylation through the AKT and ERK1/2 signaling pathways. FEBS Open Bio 2020, 10, 2578-2587. [CrossRef]
- Nagata, N.; Matsuo, K.; Bettaieb, A.; Bakke, J.; Matsuo, I.; Graham, J.; Xi, Y.; Liu, S.; Tomilov, A.; Tomilova, N.; Gray, S.; Jung, D.Y.; Ramsey, J.J.; Kim, J.K.; Cortopassi, G.; Havel, P.J.; Haj, F.G. Hepatic Src homology phosphatase 2 regulates energy balance in mice. Endocrinology 2012, 153, 3158-3169. [CrossRef]
- Kulas, D.T.; Zhang, W.R.; Goldstein, B.J.; Furlanetto, R.W.; Mooney, R.A. Insulin receptor signaling is augmented by antisense inhibition of the protein tyrosine phosphatase LAR. J. Biol. Chem. 1995, 270, 2435-8.
- Zabolotny, J.M.; Kim, Y.B.; Peroni, O.D.; Kim, J.K.; Pani, M.A.; Boss, O.; Klaman, L.D.; Kamatkar, S.; Shulman, G.I.; Kahn, B.B.; Neel, B.G. Overexpression of the LAR (leukocyte antigen-related) protein-tyrosine phosphatase in muscle causes insulin resistance. Proc. Natl. Acad. Sci. USA 2001, 98, 5187-92. [CrossRef]
- Mooney, R.A.; LeVea, C.M. The leukocyte common antigen-related protein LAR: candidate PTP for inhibitory targeting. Curr. Top. Med. Chem. 2003, 3, 809-19. [CrossRef]
- Gundhla, I.Z.; Walmsley, R.S.; Ugirinema, V.; Mnonopi, N. O.; Hosten, E.; Betz, R.; Frost, C. L.; Tshentu, Z. R.pH-metric chemical speciation modeling and studies of in vitro antidiabetic effects of bis[(imidazolyl)carboxylato]oxidovanadium(IV) complexes. J. Inorg. Biochem. 2015, 145, 11-18. [CrossRef]
- Huyer, G.; Liu, S.; Kelly, J.; Moffat, J.; Payette, P.; Kennedy, B.; Tsaprailis, G.; Gresser, M.J.; Ramachandran, C. Mechanism of inhibition of protein-tyrosine phosphatases by vanadate and pervanadate. J. Biol. Chem. 1997, 272, 843-51. [CrossRef]
- Heo, Y.S.; Ryu, J.M.; Park, S.M.; Park, J.H.; Lee, H.C.; Hwang, K.Y.; Kim, J. Structural basis for inhibition of protein tyrosine phosphatases by Keggin compounds phosphomolybdate and phosphotungstate. Exp. Mol. Med. 2002, 34, 211-23. [CrossRef]
- Zhang, Z.; Chen, F.; Huang, C.; Shi, X. Vanadate induces G2/M phase arrest in p53-deficient mouse embryo fibroblasts. J. Environ. Pathol. Toxicol. Oncol. 2002, 21, 223-231.
- Liu, T.T.; Liu, Y.J.; Wang, Q.; Yang, X.G.; Wang, K. Reactive-oxygen-species-mediated Cdc25C degradation results in differential antiproliferative activities of vanadate, tungstate, and molybdate in the PC-3 human prostate cancer cell line. J. Biol. Inorg. Chem. 2012, 17, 311-20. [CrossRef]
- Ajeawung, N.F.; Faure, R.; Jones, C.; Kamnasaran, D. Preclinical evaluation of dipotassium bisperoxo (picolinato) oxovanadate V for the treatment of pediatric low-grade gliomas. Future Oncol. 2013, 9, 1215-29. [CrossRef]
- Saikia, G.; Gogoi, S.R.; Boruah, J.; Ram, B.; Begum, P.; Ahmed, K.; Sharma, M.; Ramakrishna, G.; Ramasarma, T.; Islam, N.S. Peroxo compounds of Vanadium(V) and Niobium(V) as potent inhibitors of calcineurin activity towards RII-Phosphopeptide. ChemistrySelect 2017, 2, 5838-5848. [CrossRef]
- Bhattacharyya, S.; Tracey, A.S. Vanadium(V) complexes in enzyme systems: aqueous chemistry, inhibition and molecular modeling in inhibitor design. J. Inorg. Biochem. 2001, 85, 9-13. [CrossRef]
- Blau, H.M.; Chiu, C.P.; Webster, C. Cytoplasmic activation of human nuclear genes in stable heterocaryons. Cell 1983, 32, 1171-1180. [CrossRef]
- Mangnall, D.; Bruce, C.; Fraser, R.B. Insulin-stimulated glucose uptake in C2C12 myoblasts. Biochem. Soc. Trans. 1993, 21, 438S. [CrossRef]
- Wong, C.Y.; Al-Salami, H.; Dass, C.R. C2C12 cell model: its role in understanding of insulin resistance at the molecular level and pharmaceutical development at the preclinical stage. J. Pharm. Pharmacol. 2020, 72, 1667-1693. [CrossRef]
- Shinde, U.A.; Sharma, G.; Goyal, R.K. In vitro insulin mimicking action of Bis(Maltolato) Oxovanadium (IV). Indian J. Pharm. Sci. 2004, 66, 392-395.
- Lei, J.X.; Wang, J.; Huo, Y.; You, Z. 4-Fluoro-N'-(2-hydroxy-3-methoxybenzylidene) benzohydrazide and its Oxidovanadium(V) complex: Syntheses, crystal structures and insulin-enhancing activity. Acta Chim. Slov. 2016, 63, 670-677. [CrossRef]
- Sun, Y.B.; Xie, Q.; Li, W.; Ding, Y.; Ye, Y.T. Synthesis, Crystal structures, and insulin enhancement of Vanadium(V) complexes derived from 2-Bromo-N’-(2-hydroxybenzylidene)benzohydrazide. Synth. React. Inorg. Met. Org. Chem. 2016, 46, 1613-1617. [CrossRef]
- Green, H.; Kehinde, O. Sublines of mouse 3T3 cells that accumulate lipid. Cell 1974, 3, 113-116. [CrossRef]
- Dufau, J.; Shen, J.X.; Couchet, M.; De Castro Barbosa, T.; Mejhert, N.; Massier, L.; Griseti, E.; Mouisel, E.; Amri, E.Z.; Lauschke, V.M.; Rydén, M.; Langin, D. In vitro and ex vivo models of adipocytes. Am. J. Physiol. Cell Physiol. 2021, 320, C822-C841. [CrossRef]
- DeFronzo, R.A. The triumvirate: beta-cell, muscle, liver. A collusion responsible for NIDDM. Diabetes 1988, 37, 667-687. [CrossRef]
- Abdul-Ghani, M.A.; DeFronzo, R.A. Pathogenesis of insulin resistance in skeletal muscle. J. Biomed. Biotechnol. 2010, 2010, 476279. [CrossRef]
- Pereira, M.J.; Carvalho, E.; Eriksson, J.W.; Crans, D.C.; Aureliano, M. Effects of decavanadate and insulin enhancing vanadium compounds on glucose uptake in isolated rat adipocytes. J. Inorg. Biochem. 2009, 103, 1687-1692. [CrossRef]
- Mueller, W.M.; Stanhope, K.L.; Gregoire, F.; Evans, J.L.; Havel, P.J. Effects of metformin and vanadium on leptin secretion from cultured rat adipocytes. Obes. Res. 2000, 8, 530-539. [CrossRef]
- Cohen, N.; Halberstam, M.; Shlimovich, P.; Chang, C.J.; Shamoon, H.; Rossetti, L. Oral vanadyl sulfate improves hepatic and peripheral insulin sensitivity in patients with non-insulin-dependent diabetes mellitus. J. Clin. Invest. 1995, 95, 2501-2509. [CrossRef]
- Tsiani, E.; Bogdanovic, E.; Sorisky, A.; Nagy, L.; Fantus, I.G. Tyrosine phosphatase inhibitors, vanadate and pervanadate, stimulate glucose transport and GLUT translocation in muscle cells by a mechanism independent of phosphatidylinositol 3-kinase and protein kinase C. Diabetes 1998, 47, 1676-1686. [CrossRef]
- Nunes, P.; Correia, I.; Cavaco, I.; Marques, F.; Pinheiro, T.; Avecilla, F.; Pessoa, J.C. Therapeutic potential of vanadium complexes with 1,10-phenanthroline ligands, quo vadis? Fate of complexes in cell media and cancer cells. J. Inorg. Biochem. 2021, 217, 111350. [CrossRef]
- Levina, A.; McLeod, A.I.; Pulte, A.; Aitken, J.B.; Lay, P.A. Biotransformations of antidiabetic vanadium prodrugs in mammalian cells and cell culture media: A XANES spectroscopic study. Inorg. Chem. 2015, 54, 6707-6718.
- Rampersad, S.N. Multiple applications of Alamar Blue as an indicator of metabolic function and cellular health in cell viability bioassays. Sensors (Basel) 2012, 12, 12347-12360. [CrossRef]
- Mbatha, B., Khathi, A., Sibiya, N., Booysen, I., Ngubane, P. A Dioxidovanadium complex cis-[VO2 (obz) py] attenuates hyperglycemia in streptozotocin (STZ)-induced diabetic male sprague-dawley rats via increased GLUT4 and glycogen synthase expression in the skeletal muscle. Evid. Based Complement. Alternat. Med. 2022, 2022, 5372103. Published 2022 Jan 31. [CrossRef]
- Scalise, M.; Galluccio, M.; Console, L.; Pochini, L.; Indiveri, C. The human SLC7A5 (LAT1): The intriguing histidine/large neutral amino acid transporter and its relevance to human health. Front. Chem. 2018, 6, 243. [CrossRef]
- Singh, N.; Ecker, G.F. Insights into the structure, function, and ligand discovery of the large neutral amino acid transporter 1, LAT1. Int. J. Mol. Sci. 2018, 19, 1278. [CrossRef]
- Klajner, M.; Licona, C.; Fetzer, L.; Hebraud, P.; Mellitzer, G.; Pfeffer, M.; Harlepp, S.; Gaiddon, C. Subcellular localization and transport kinetics of ruthenium organometallic anticancer compounds in living cells: a dose-dependent role for amino acid and iron transporters. Inorg. Chem. 2014, 53, 5150-5158. [CrossRef]
- Minemura, T.; Lacy, W.W.; Crofford, O.B. Regulation of the transport and metabolism of amino acids in isolated fat cells. Effect of insulin and a possible role for adenosine 3',5'-monophosphate. J. Biol. Chem. 1970, 245, 3872-3881.
- Nishitani, S.; Matsumura, T.; Fujitani, S.; Sonaka, I.; Miura, Y.; Yagasaki, K. Leucine promotes glucose uptake in skeletal muscles of rats. Biochem. Biophys. Res. Commun. 2002, 299, 693-696. [CrossRef]
- Iwai, S.; Hasegawa, T.; Ikeda, H.O.; Tsujikawa, A. Branched chain amino acids promote ATP production via translocation of glucose transporters. Invest. Ophthalmol. Vis. Sci. 2022, 63, 7. [CrossRef]
- Rhoads, D.E.; Ockner, R.K.; Peterson, N.A.; Raghupathy, E. Modulation of membrane transport by free fatty acids: inhibition of synaptosomal sodium-dependent amino acid uptake. Biochemistry 1983, 22, 1965-1970. [CrossRef]
- Rhoads, D.E.; Kaplan, M.A.; Peterson, N.A.; Raghupathy, E. Effects of free fatty acids on synaptosomal amino acid uptake systems. J. Neurochem. 1982, 38, 1255-1260. [CrossRef]
- Byrne, C.D.; Targher, G. NAFLD: a multisystem disease. J. Hepatol. 2015, 62, S47-S64. [CrossRef]
- Huang, Y.; Liu, F.; Zhang, F.; Liu, P.; Xu, T.; Ding, W. Vanadium(IV)-chlorodipicolinate alleviates hepatic lipid accumulation by inducing autophagy via the LKB1/AMPK signaling pathway in vitro and in vivo. J. Inorg. Biochem. 2018, 183, 66-76. [CrossRef]
- Wang, Y.; Chen, R.; Li, J.; Zeng, G.; Yuan, J.; Su, J.; Wu, C.; Lu, Z.; Zhang, F.; Ding, W. Vanadium(IV)-chlorodipicolinate protects against hepatic steatosis by ameliorating lipid peroxidation, endoplasmic reticulum stress, and inflammation. Antioxidants (Basel) 2022, 11, 1093. [CrossRef]
- Liu, Q.; Li, L.; Gao, L.; Li, C.; Huan, Y.; Lei, L.; Cao, H.; Li, L.; Gao, A.; Liu, S.; Shen, Z. Combination of bis (α-furancarboxylato) oxovanadium (IV) and metformin improves hepatic steatosis through down-regulating inflammatory pathways in high-fat diet-induced obese C57BL/6J mice. Basic Clin. Pharmacol. Toxicol. 2021, 128, 747-757. [CrossRef]
- Le, M.; Rathje, O.; Levina, A.; Lay, P.A. High cytotoxicity of vanadium(IV) complexes with 1,10-phenanthroline and related ligands is due to decomposition in cell culture medium. J. Biol. Inorg. Chem. 2017, 22, 663-672. [CrossRef]
- Levina, A.; Crans, D.C.; Lay, P.A. Speciation of metal drugs, supplements and toxins in media and bodily fluids controls in vitro activities. Coord. Chem. Rev. 2017, 352, 473–498. [CrossRef]
- Ścibior, A.; Zaporowska, H.; Ostrowski, J.; Banach, A. Combined effect of vanadium(V) and chromium(III) on lipid peroxidation in liver and kidney of rats. Chem. Biol. Interact. 2006, 159, 213-222. [CrossRef]
- Aureliano, M.; De Sousa-Coelho, A.L.; Dolan, C.C.; Roess, D.A.; Crans, D.C. Biological consequences of Vanadium effects on formation of reactive oxygen species and lipid peroxidation. Int. J. Mol. Sciences 2023, 24, 5382. [CrossRef]
- Marzban, L.; Rahimian, R.; Brownsey, R.W.; McNeill, J.H. Mechanisms by which bis(maltolato)oxovanadium(IV) normalizes phosphoenolpyruvate carboxykinase and glucose-6-phosphatase expression in streptozotocin-diabetic rats in vivo. Endocrinology 2002, 143, 4636-4645. [CrossRef]
- Valera, A.; Rodriguez-Gil, J.E.; Bosch, F. Vanadate treatment restores the expression of genes for key enzymes in the glucose and ketone bodies metabolism in the liver of diabetic rats. J. Clin. Invest. 1993, 92, 4-11. [CrossRef]
- Ferber, S.; Meyerovitch, J.; Kriauciunas, K.M.; Kahn, C.R. Vanadate normalizes hyperglycemia and phosphoenolpyruvate carboxykinase mRNA levels in ob/ob mice. Metabolism 1994, 43, 1346-1354. [CrossRef]
- Mosseri, R.; Waner, T.; Shefi, M.; Shafrir, E.; Meyerovitch, J. Gluconeogenesis in non-obese diabetic (NOD) mice: in vivo effects of vandadate treatment on hepatic glucose-6-phoshatase and phosphoenolpyruvate carboxykinase. Metabolism 2000, 49, 321-325. [CrossRef]
- Rines, A.K.; Sharabi, K.; Tavares, C.D.; Puigserver, P. Targeting hepatic glucose metabolism in the treatment of type 2 diabetes. Nat. Rev. Drug Discov. 2016, 15, 786-804. [CrossRef]
- Vardatsikos, G.; Mehdi, M.Z.; Srivastava, A.K. Bis(maltolato)-oxovanadium (IV)-induced phosphorylation of PKB, GSK-3 and FOXO1 contributes to its glucoregulatory responses (review). Int. J. Mol. Med. 2009, 24, 303-309. [CrossRef]
- Mehdi, M.Z.; Srivastava, A.K. Organo-vanadium compounds are potent activators of the protein kinase B signaling pathway and protein tyrosine phosphorylation: mechanism of insulinomimesis. Arch. Biochem. Biophys. 2005, 440, 158-164. [CrossRef]
- Leclercq, I.A.; Da Silva Morais, A.; Schroyen, B.; Van Hul, N.; Geerts, A. Insulin resistance in hepatocytes and sinusoidal liver cells: mechanisms and consequences. J. Hepatol. 2007, 47, 142-156. [CrossRef]
- Coulibaly, S.; McPherson, K.; Nair, S.; Ruff, D.; Stapleton, S.R. Evaluation of the effectiveness of the insulin-mimetics, selenium and vanadium, in insulin-resistance in primary hepatocytes. FASEB J. 2011, 25, 530.5-530.5. [CrossRef]
- Bulger, D.A.; Conley, J.; Conner, S.H.; Majumdar, G.; Solomon, S.S. Role of PTEN in TNFα induced insulin resistance. Biochem. Biophys. Res. Commun. 2015, 461, 533-536. [CrossRef]
- Boccato Payolla, F.; Andrade Aleixo N.; Resende Nogueira, F.A.; Massabni, A.C. Estudos in vitro da Atividade Antitumoral de Complexos de Vanádio com Ácidos Órotico e Glutâmico. Rev. Bras. Cancerol. [Internet]. 2020 Jan. 29 [cited 2023 Apr. 14];66(1):e-04649. [CrossRef]
- Levina, A.; Crans, D.C.; Lay, P.A. Advantageous reactivity of unstable metal complexes: Potential applications of metal-based anticancer drugs for intratumoral injections. Pharmaceutics 2022, 14, 790. [CrossRef]
- Szlasa, W.; Zendran, I.; Zalesińska, A.; Tarek, M.; Kulbacka, J. Lipid composition of the cancer cell membrane. J. Bioenerg. Biomembr. 2020, 52, 321-342. [CrossRef]
- Welte, S.; Baringhaus, K.H.; Schmider, W.; Müller, G.; Petry, S.; Tennagels, N. 6,8-Difluoro-4-methylumbiliferyl phosphate: a fluorogenic substrate for protein tyrosine phosphatases. Anal. Biochem. 2005, 338, 32-8. [CrossRef]
- Pastula, C.; Johnson, I.; Beechem, J.M.; Patton, W.F. Development of fluorescence-based selective assays for serine/threonine and tyrosine phosphatases. Comb. Chem. High Throughput Screen. 2003, 6, 341-6. [CrossRef]
- Wensaas, A.J.; Rustan, A.C.; Lövstedt, K.; Kull, B.; Wikström, S.; Drevon, C.A.; Hallén, S. Cell-based multiwell assays for the detection of substrate accumulation and oxidation. J. Lipid Res. 2007, 48, 961-7. [CrossRef]
- Yamamoto, N.; Ueda-Wakagi, M.; Sato, T.; Kawasaki, K.; Sawada, K.; Kawabata, K.; Akagawa, M.; Ashida, H. Measurement of glucose uptake in cultured cells. Curr. Protoc. Pharmacol. 2015, 71, 12.14.1-12.14.26. [CrossRef]
- Pither, R.; Game, S.; Davis, J.; Katz, M.; McLane, J. The use of Cytostar-T™ scintillating microplates to monitor insulin-dependent glucose uptake by 3T3-L1 adipocytes. Exp. Clin. Endocrinol. Diabetes 1996, 104, 115-116. [CrossRef]
- Tanti, J.F.; Cormont, M.; Grémeaux, T.; Le Marchand-Brustel, Y. Assays of glucose entry, glucose transporter amount, and translocation. Methods Mol. Biol. 2001, 155, 157-65. [CrossRef]
- Gómez-Lechón, M.J.; Donato, M.T.; Martínez-Romero, A.; Jiménez, N.; Castell, J.V.; O'Connor, J.E. A human hepatocellular in vitro model to investigate steatosis. Chem. Biol. Interact. 2007, 165, 106-16. [CrossRef]
- Ricchi, M.; Odoardi, M.R.; Carulli, L.; Anzivino, C.; Ballestri, S.; Pinetti, A.; Fantoni, L.I.; Marra, F.; Bertolotti, M.; Banni, S.; Lonardo, A.; Carulli, N.; Loria, P. Differential effect of oleic and palmitic acid on lipid accumulation and apoptosis in cultured hepatocytes. J. Gastroenterol. Hepatol. 2009, 24, 830-40. [CrossRef]
- Okamoto, T.; Kanemoto, N.; Ban, T.; Sudo, T.; Nagano, K.; Niki, I. Establishment and characterization of a novel method for evaluating gluconeogenesis using hepatic cell lines, H4IIE and HepG2. Arch. Biochem. Biophys. 2009, 491, 46-52. [CrossRef]
- García-Ruiz, I.; Solís-Muñoz, P.; Gómez-Izquierdo, E.; Muñoz-Yagüe, M.T.; Valverde, A.M.; Solís-Herruzo, J.A. Protein-tyrosine phosphatases are involved in interferon resistance associated with insulin resistance in HepG2 cells and obese mice. J. Biol. Chem. 2012, 287, 19564-73. [CrossRef]
- Li, M.; Han, Z.; Bei, W.; Rong, X.; Guo, J.; Hu, X. Oleanolic acid attenuates insulin resistance via NF-κB to regulate the IRS1-GLUT4 pathway in HepG2 cells. Evid. Based Complement. Alternat. Med. 2015, 2015, 643102. [CrossRef]
- Olsson, T.; Gulliksson, H.; Palmeborn, M.; Bergström, K.; Thore, A. Leakage of adenylate kinase from stored blood cells. J. Appl. Biochem. 1983, 5, 437-45.
- Eglen, R.M.; Reisine, T.; Roby, P.; Rouleau, N.; Illy, C.; Bossé, R.; Bielefeld, M. The use of AlphaScreen technology in HTS: current status. Curr .Chem. Genomics. 2008, 1, 2-10. [CrossRef]
Scheme 1.
Two-step synthesis of 3-hydroxytiocrotonic acid anilide (III) as the starting compound for the preparation of ONS ligands.
Scheme 1.
Two-step synthesis of 3-hydroxytiocrotonic acid anilide (III) as the starting compound for the preparation of ONS ligands.
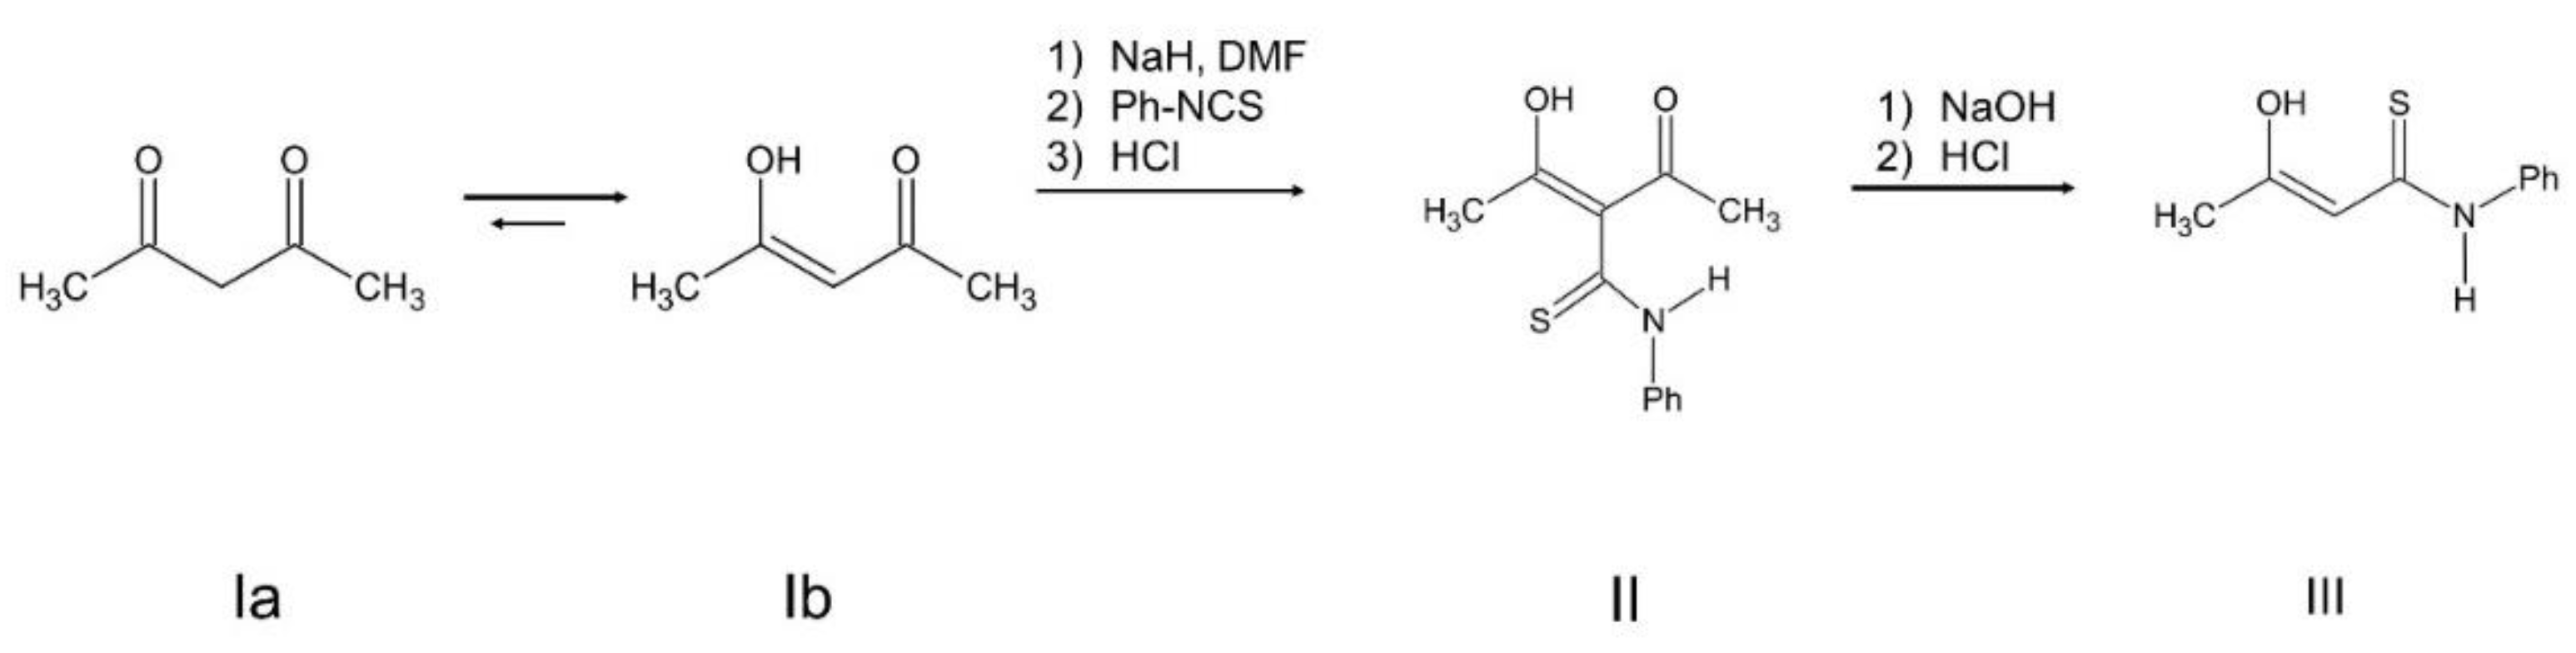
Scheme 2.
Condensation reaction of a thioanilide with the sodium salt of an amino acid, leading to obtaining a ligand IV with an imine structure (possible imine-enamine tautomerism). R = L-tryptophan, L-phenylalanine, L-leucine, L-methionine or D/L-isoleucine.
Scheme 2.
Condensation reaction of a thioanilide with the sodium salt of an amino acid, leading to obtaining a ligand IV with an imine structure (possible imine-enamine tautomerism). R = L-tryptophan, L-phenylalanine, L-leucine, L-methionine or D/L-isoleucine.
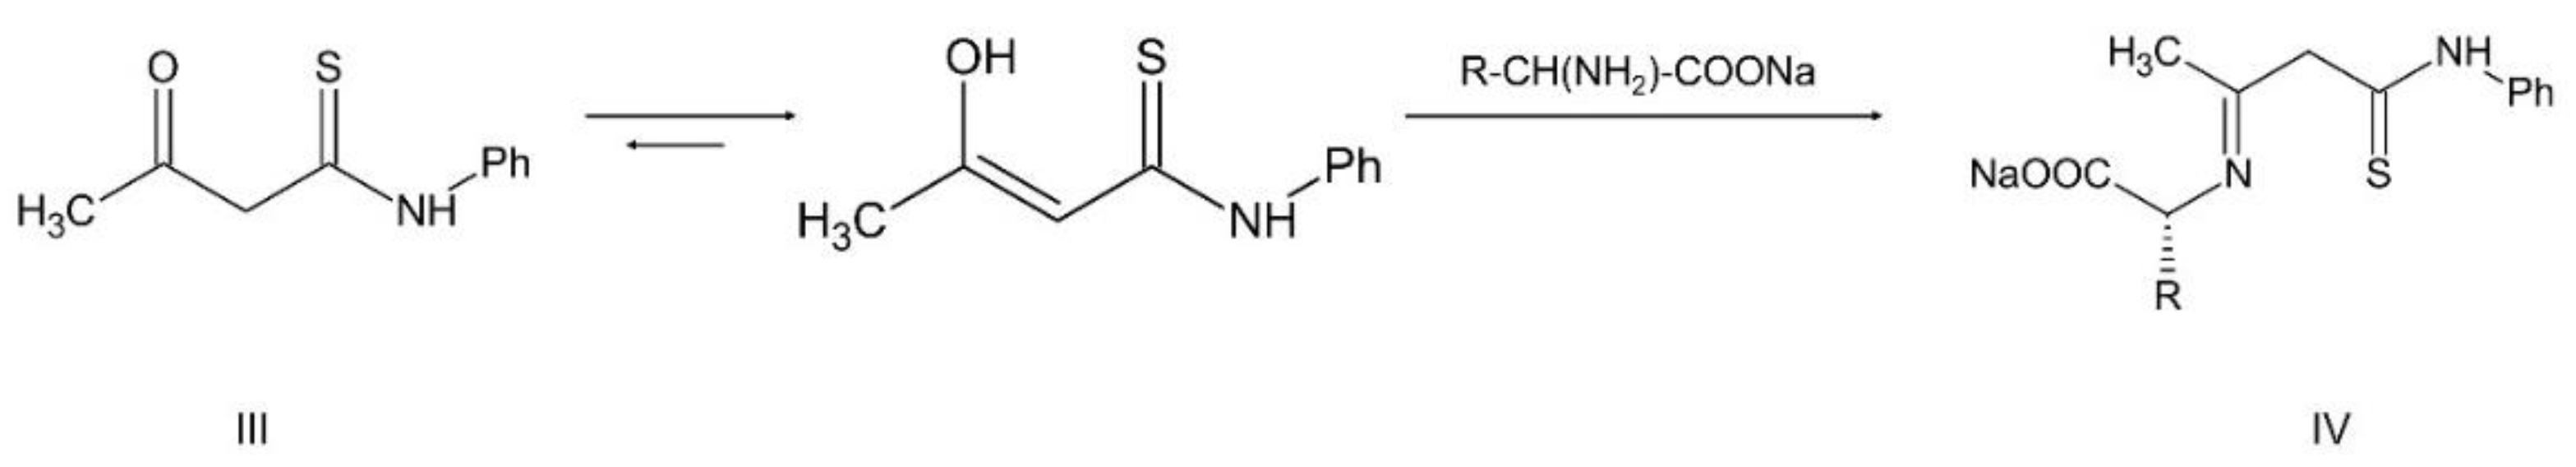
Scheme 3.
Synthesis of the complexes with the ONS ligands. R = L-tryptophan, L-phenylalanine, L-leucine, L-methionine or D/L-isoleucine.
Scheme 3.
Synthesis of the complexes with the ONS ligands. R = L-tryptophan, L-phenylalanine, L-leucine, L-methionine or D/L-isoleucine.
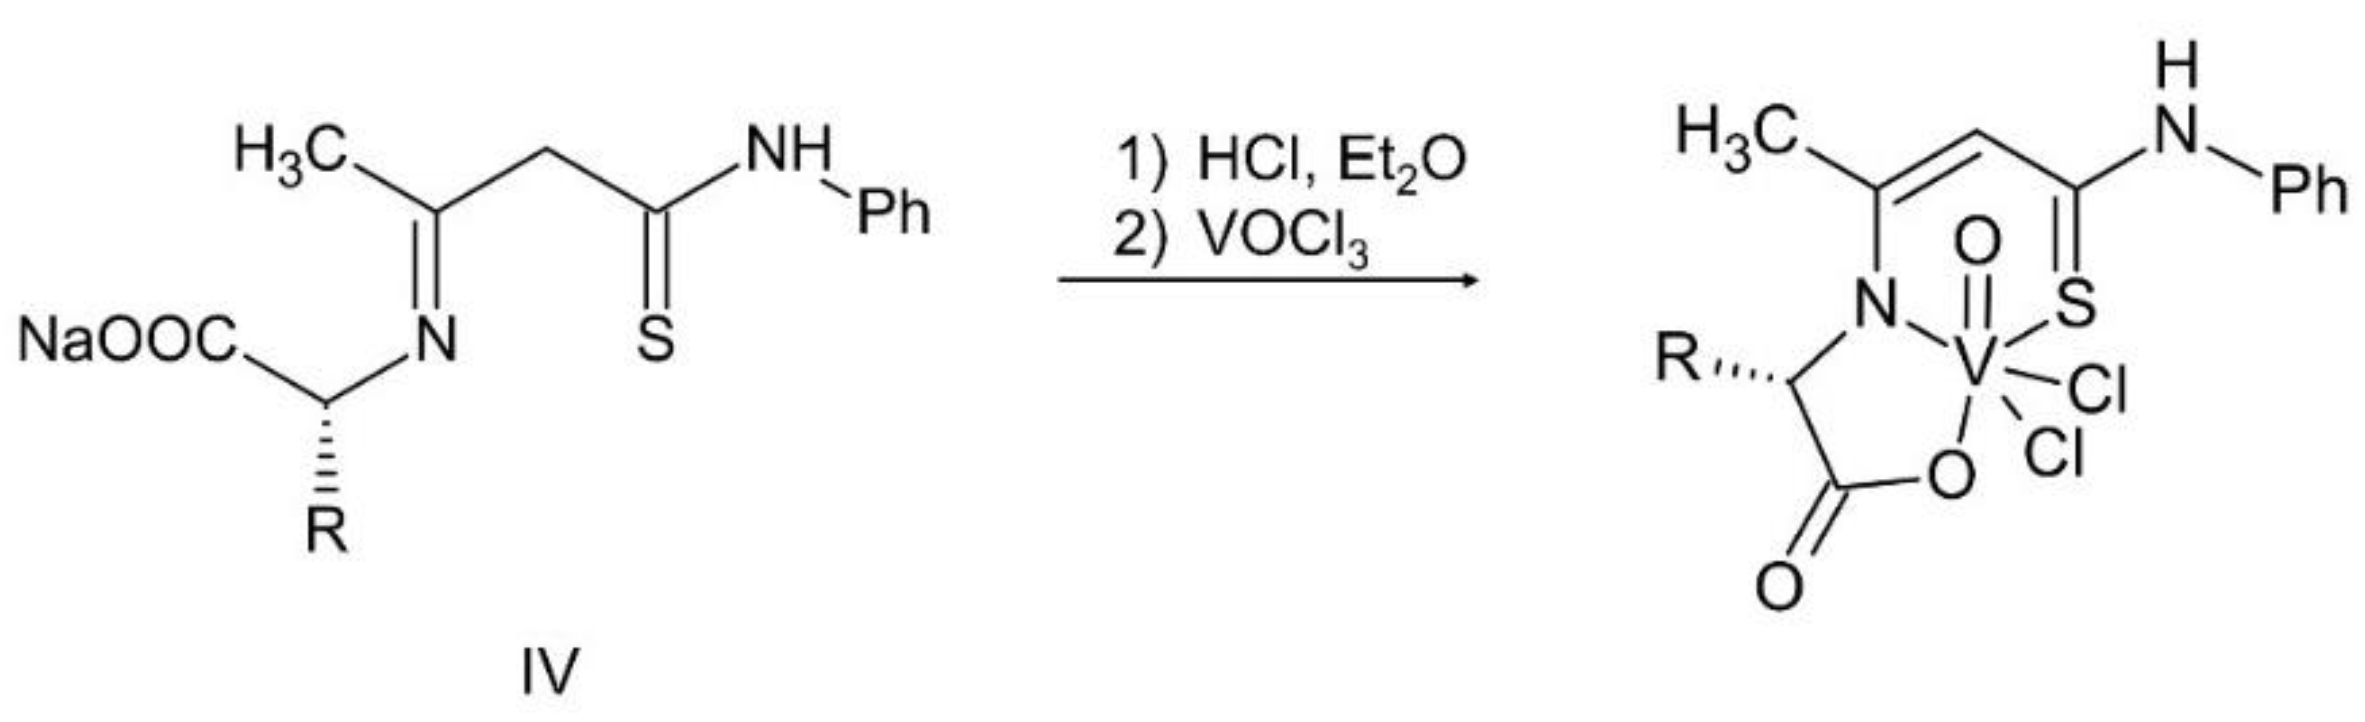
Figure 1.
The structural formulas of the ONO complexes.
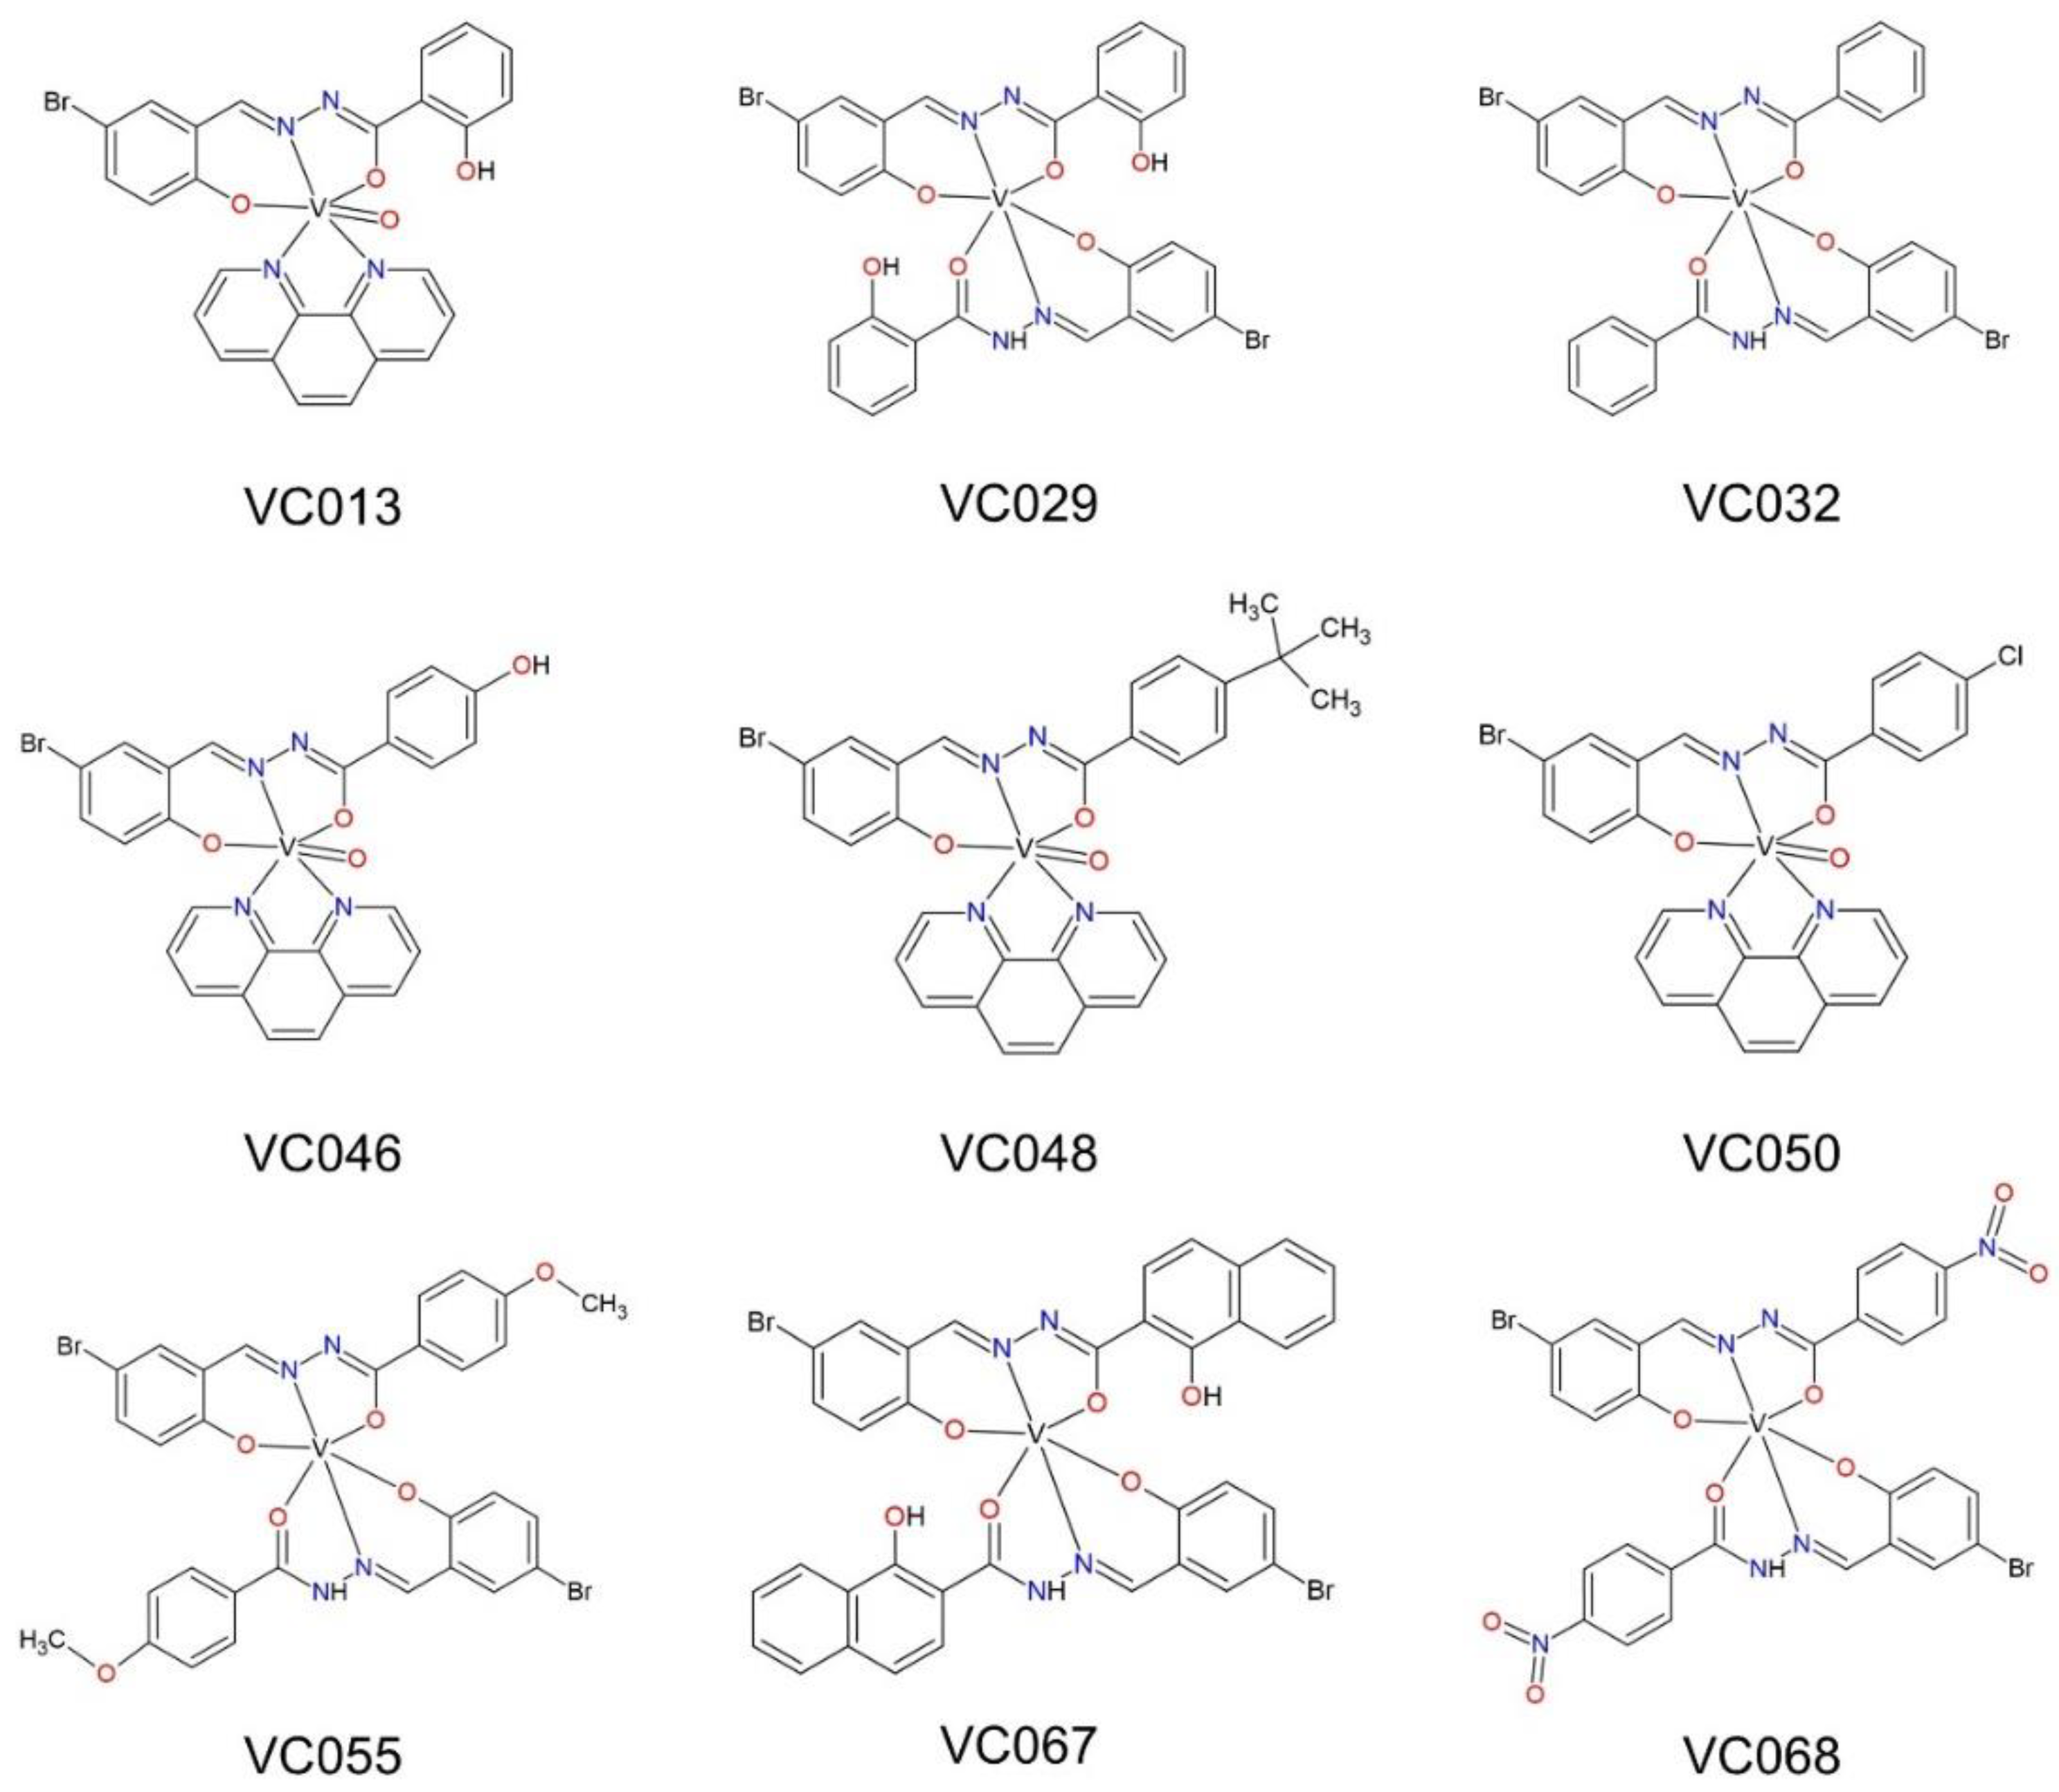
Figure 2.
The effect of vanadium complexes on the transport of [14C]-deoxy-D-glucose into myocytes C2C12. The results are presented as a percentage of the control cells treated with the solvent only (mean ± SD). Statistical significance vs. control is denoted as *p≤0.05, **p≤0.01, ***p≤0.001. Results for VC029, VC046, VC050, VC067 and VC068 were previously published by us in [46].
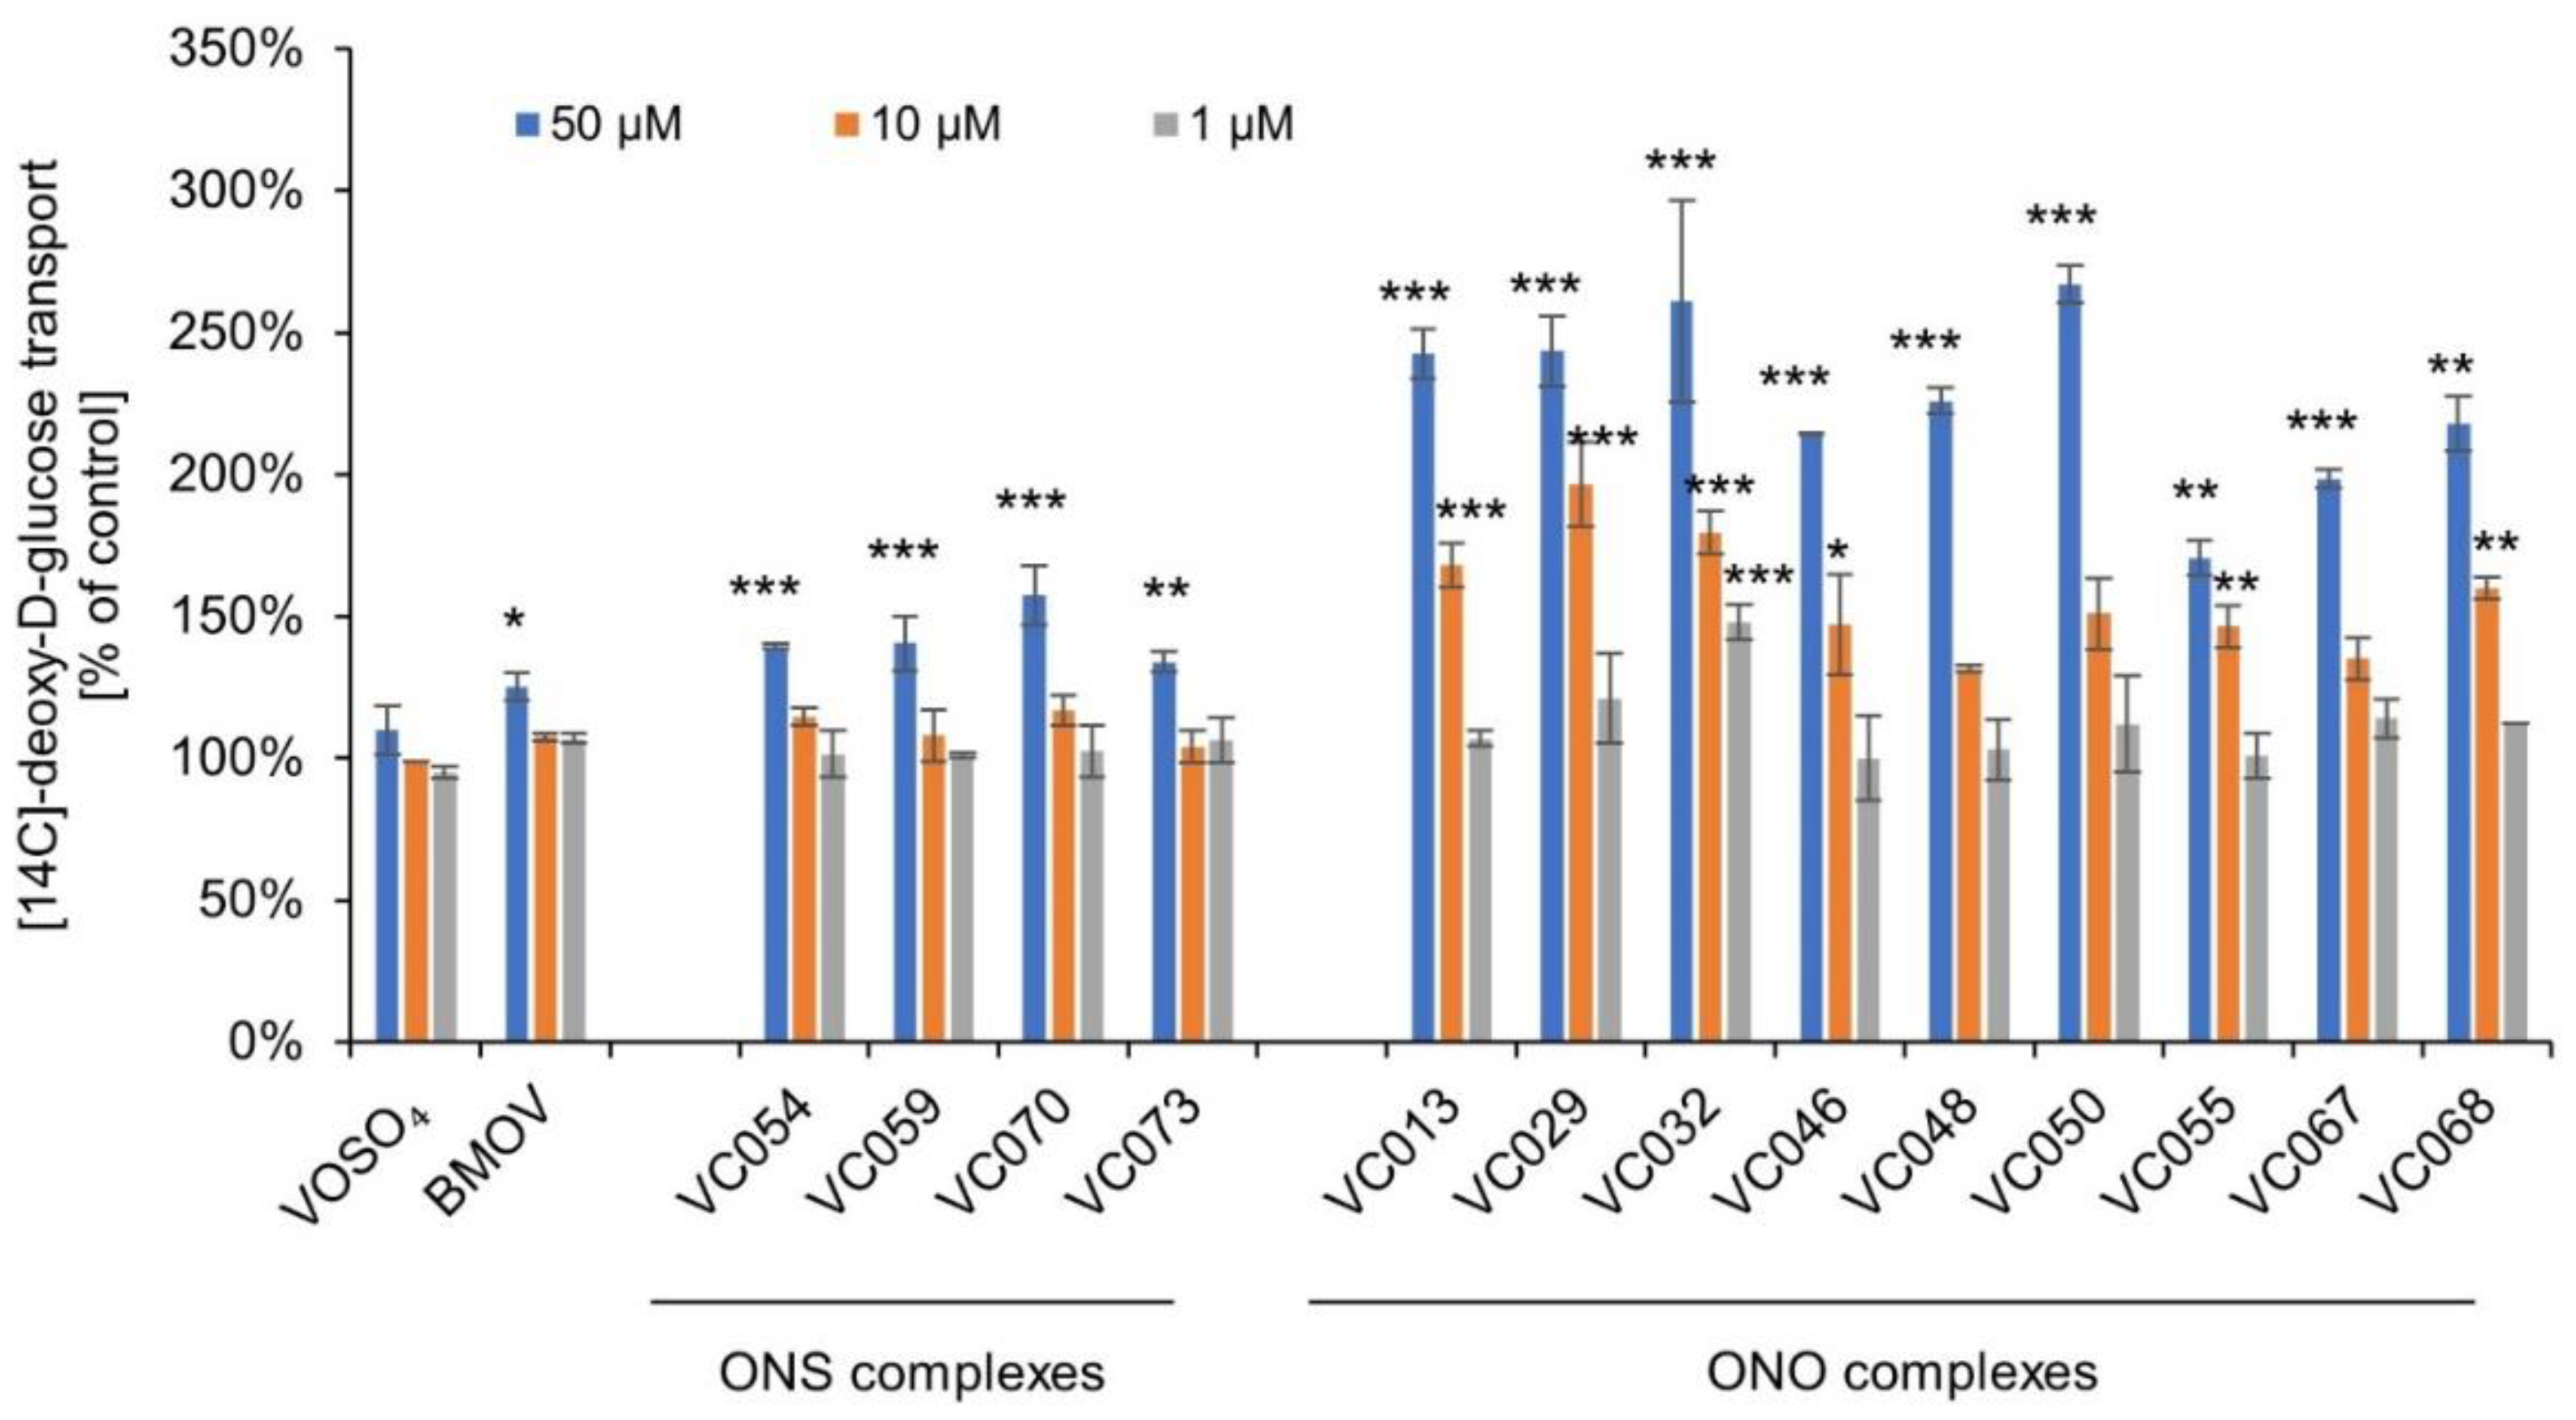
Figure 3.
The effect of vanadium complexes on glucose consumption by myocytes C2C12. The results are presented as a percentage of the control cells treated with the solvent only (mean ± SD). Statistical significance vs. control is denoted as *p≤0.05, **p≤ 0.01, ***p≤0.001.
Figure 3.
The effect of vanadium complexes on glucose consumption by myocytes C2C12. The results are presented as a percentage of the control cells treated with the solvent only (mean ± SD). Statistical significance vs. control is denoted as *p≤0.05, **p≤ 0.01, ***p≤0.001.
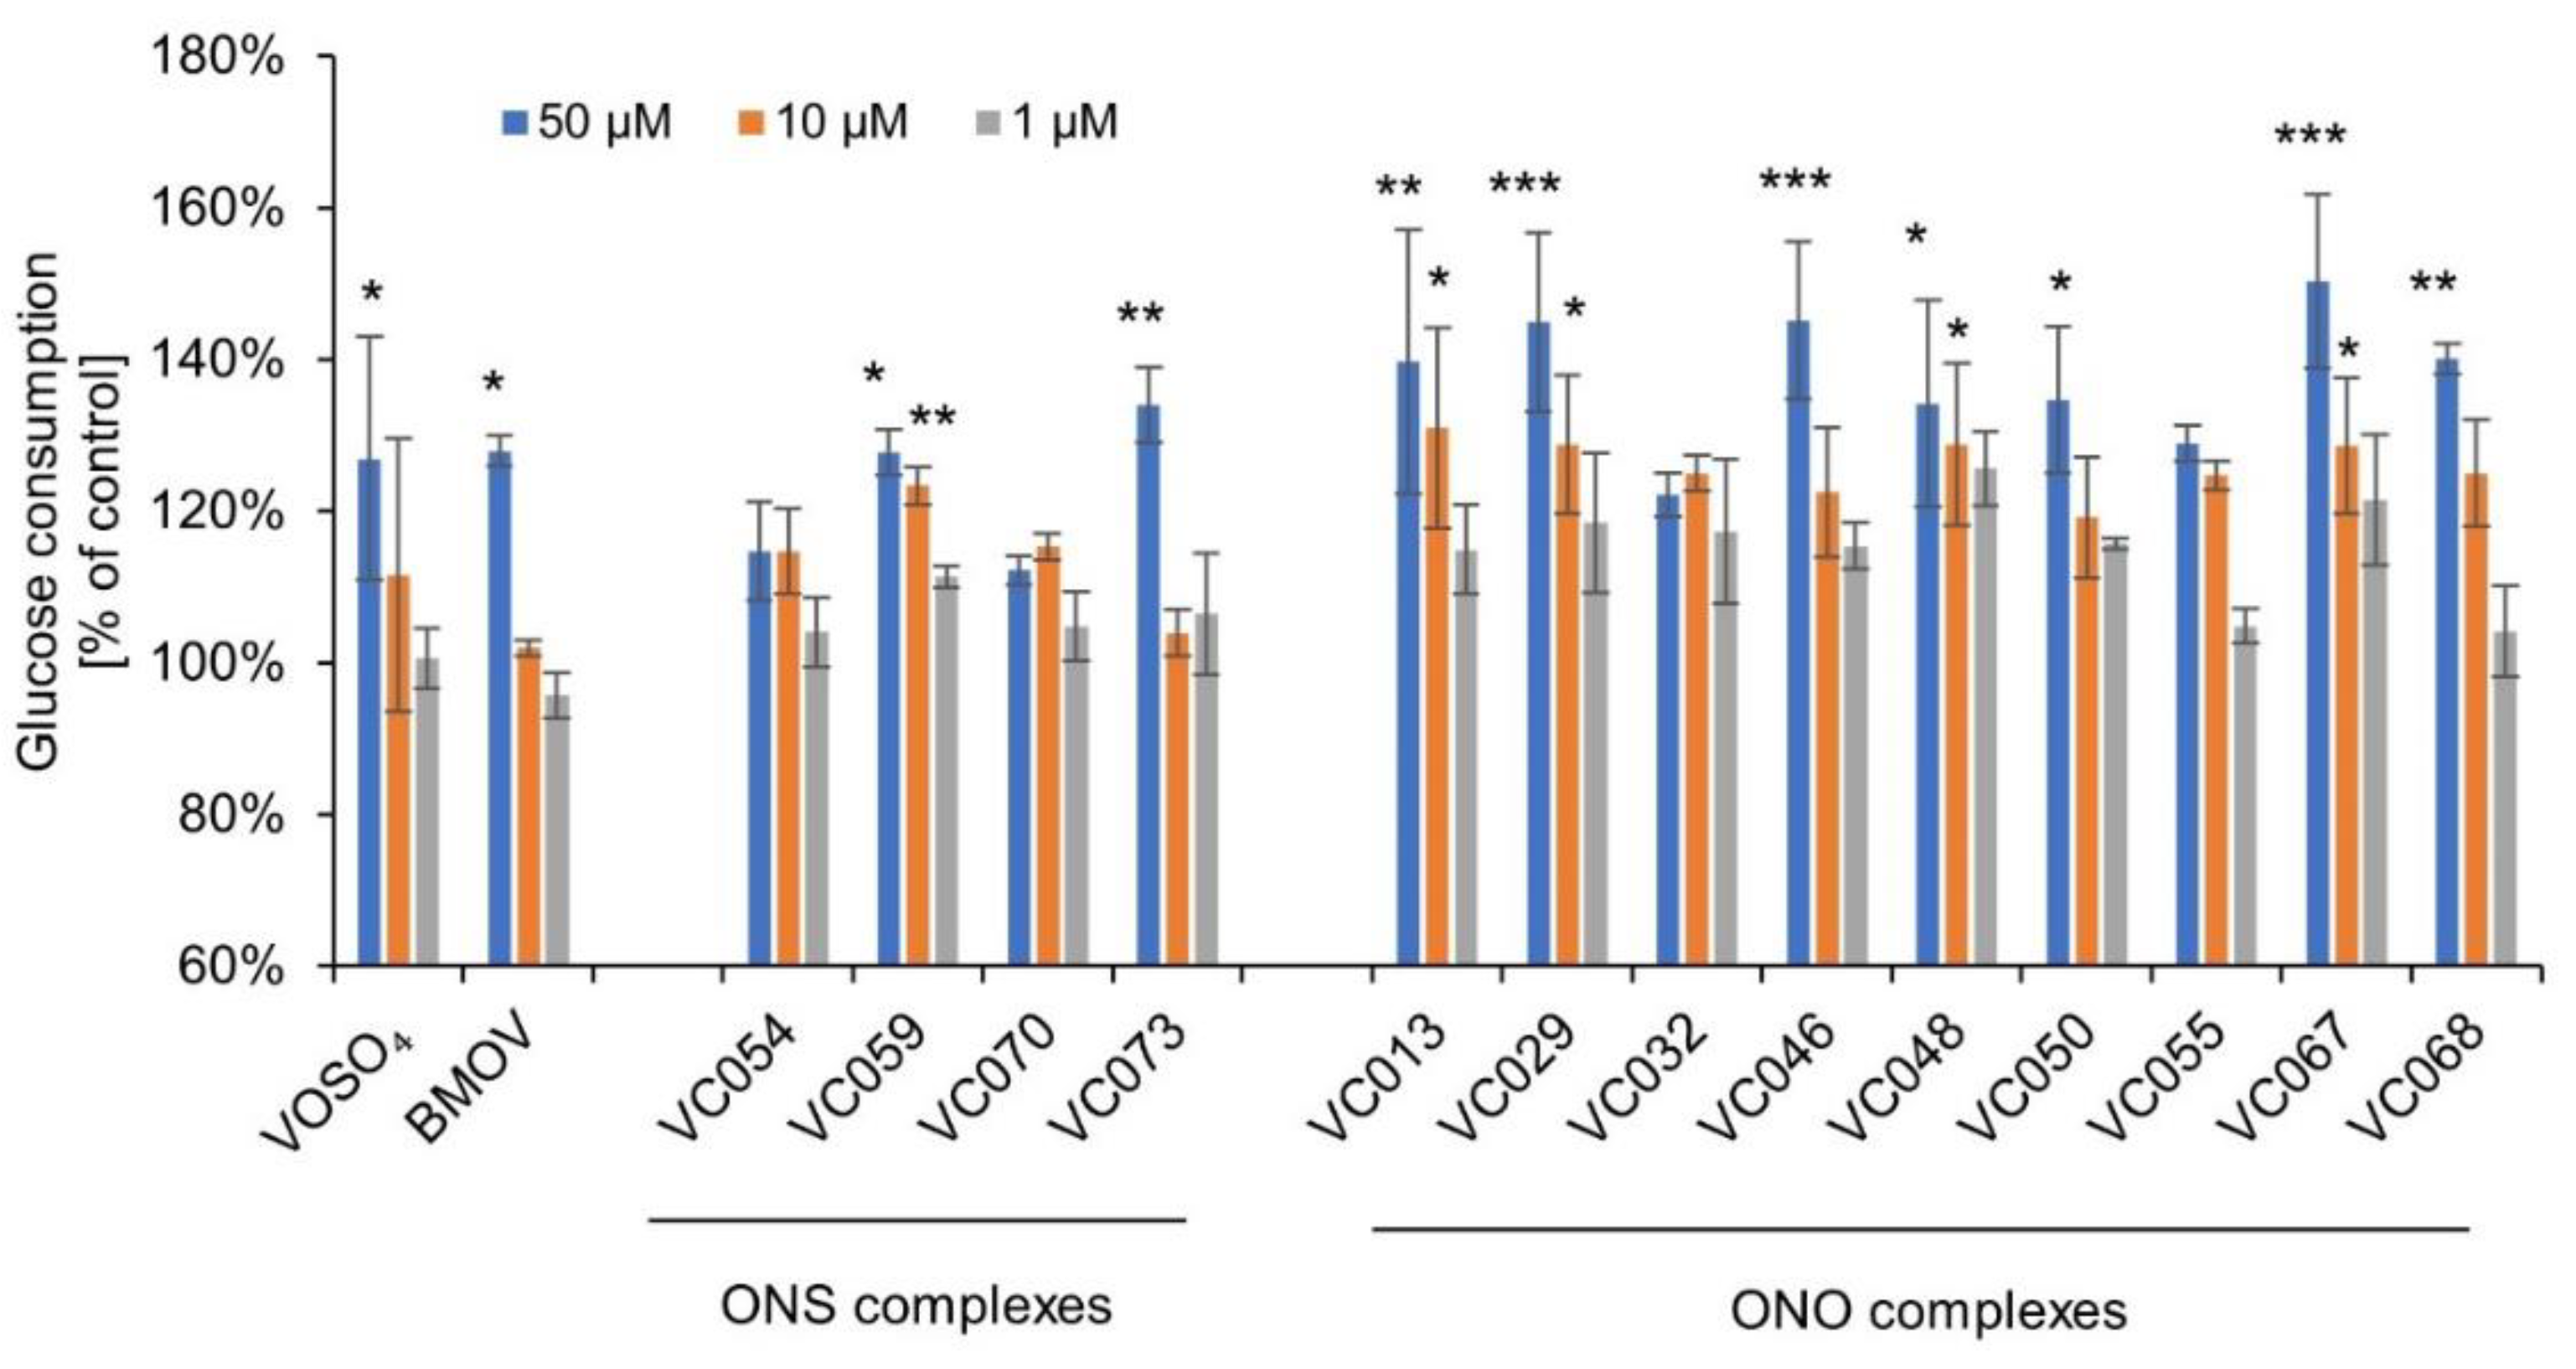
Figure 4.
The effect of vanadium complexes on the transport of [14C]-deoxy-D-glucose into adipocytes 3T3-L1. The results are presented as a percentage of the control cells treated with the solvent only (mean ± SD). Statistical significance vs. control is denoted as *p≤0.05, **p≤ 0.01, ***p≤ 0.001. Results for VC029, VC046, VC050, VC067 and VC068 were previously published by us in [46].
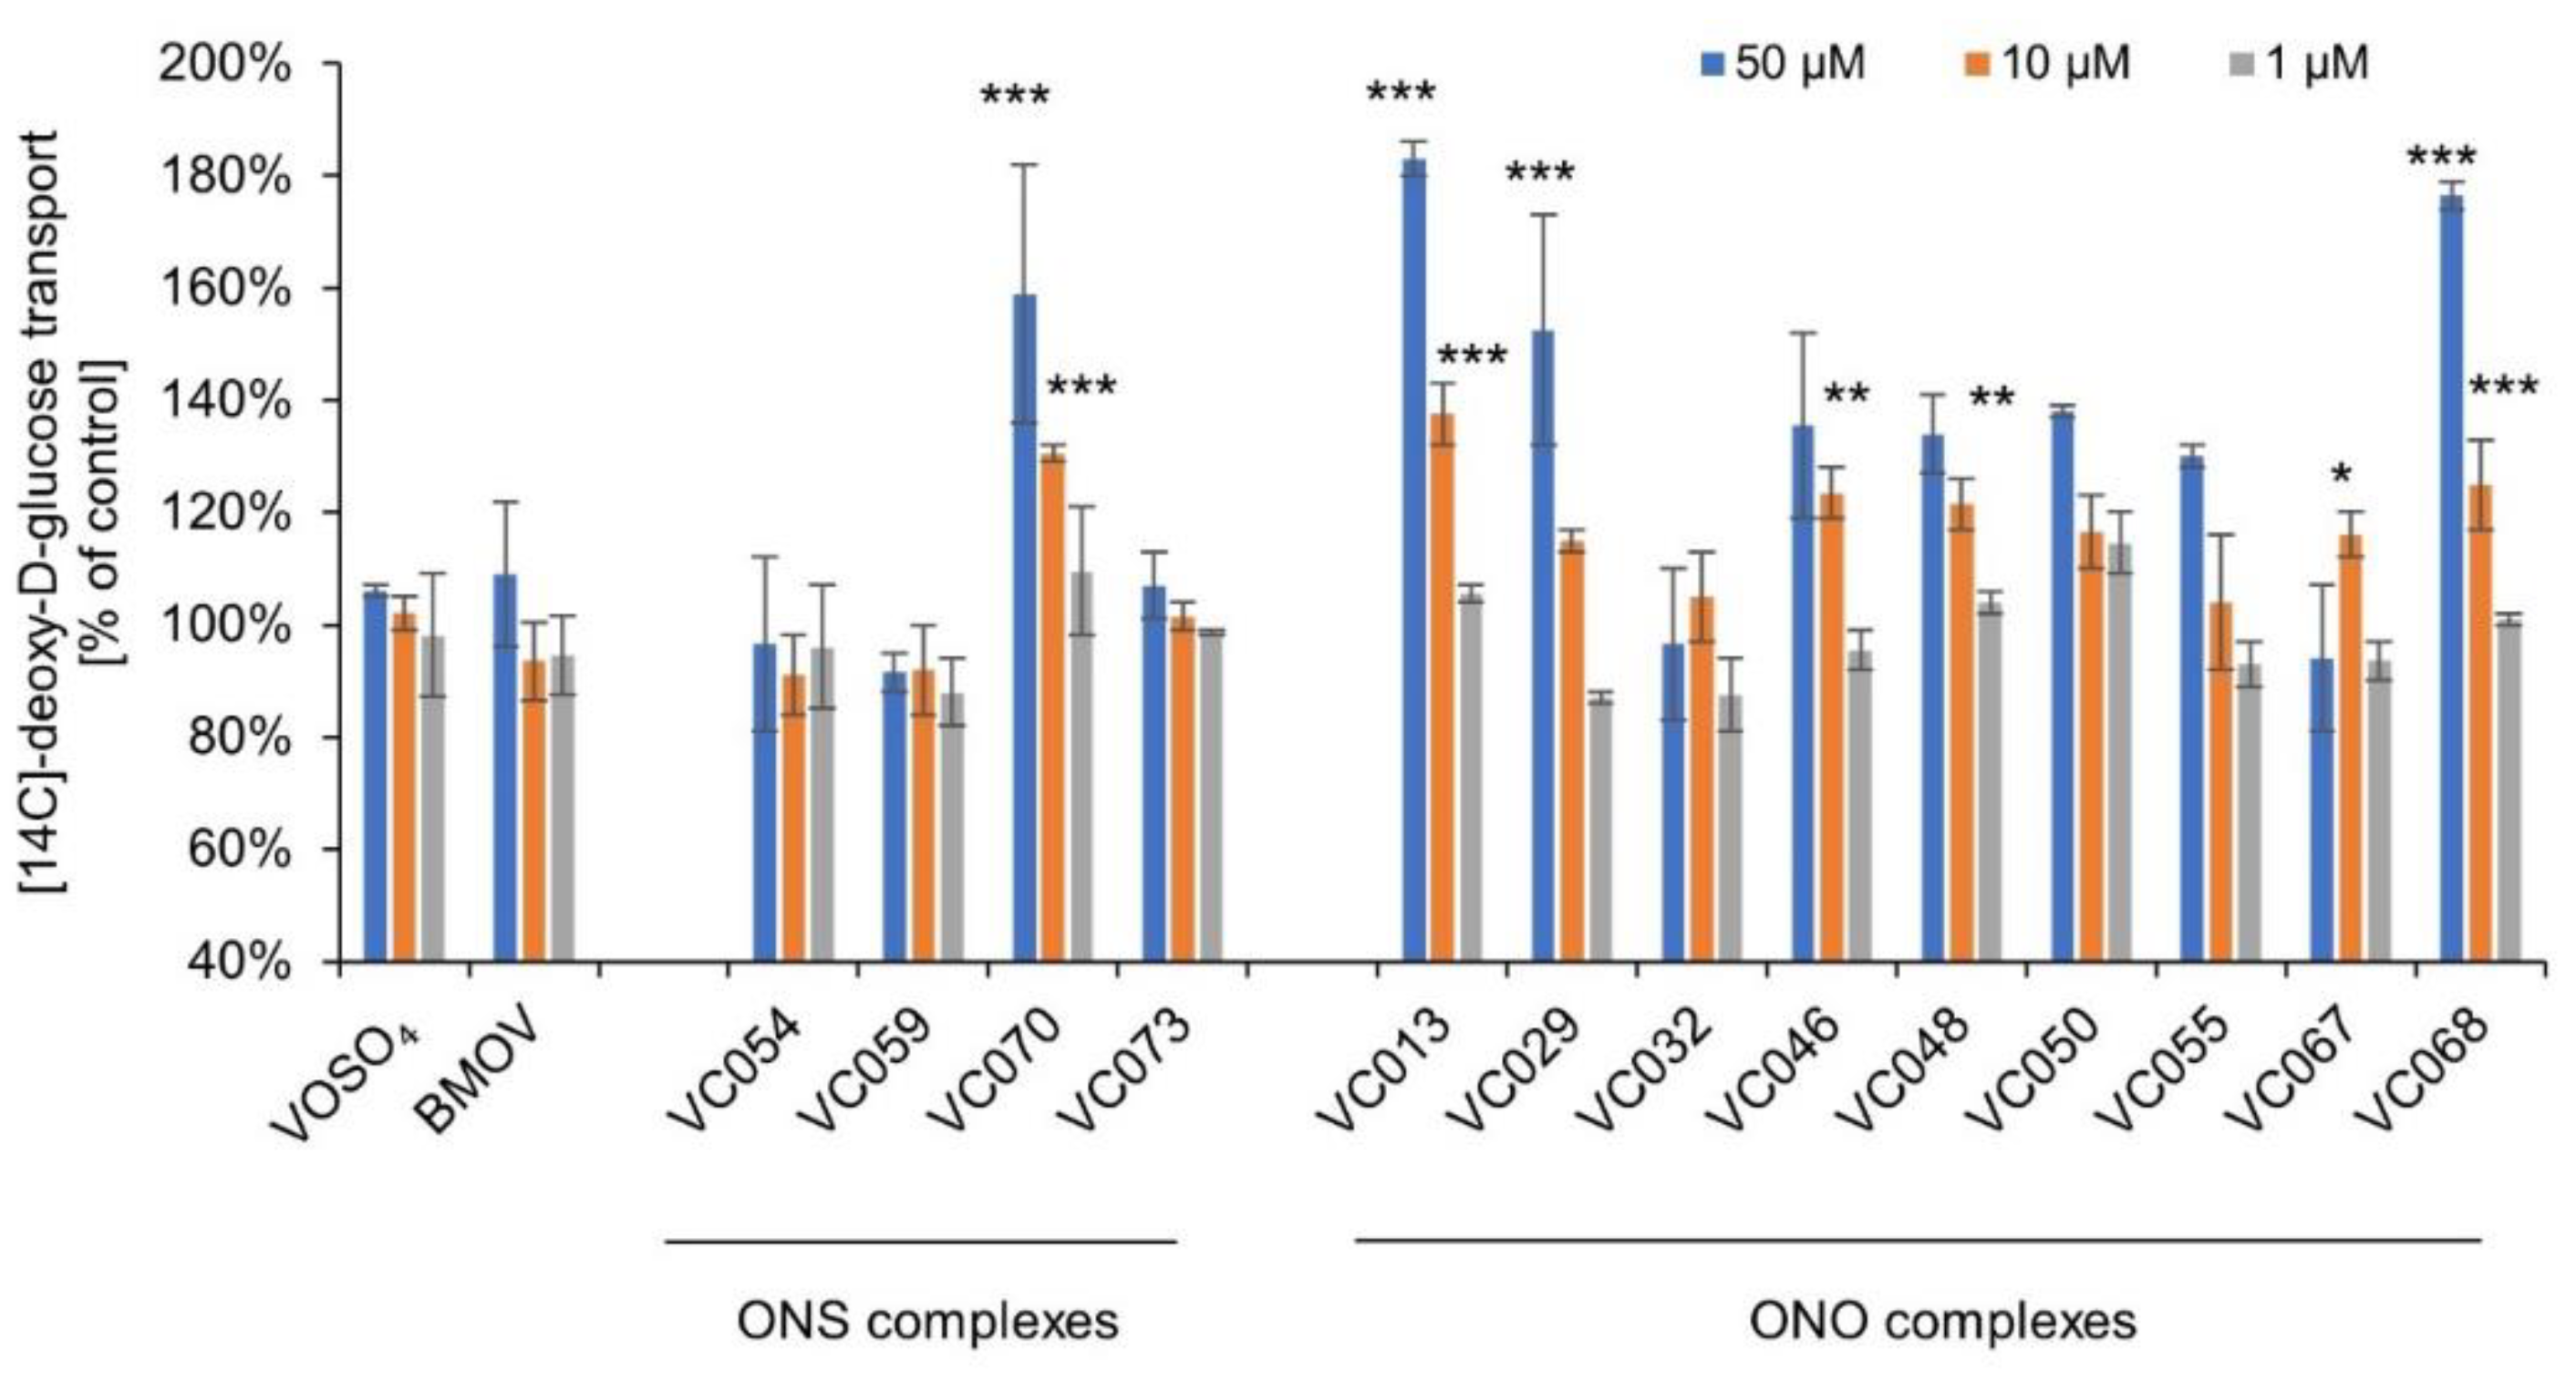
Figure 5.
The effect of incubation of the vanadium complexes (10 µM) during induction steatosis on the accumulation of intracellular lipid and cytotoxicity in hepatocytes HepG2. The results are presented as a percentage of the control cells treated with the solvent only (mean ± SD). Statistical significance vs. control is denoted as *p≤ 0.05, **p≤ 0.01, ***p≤ 0.001.
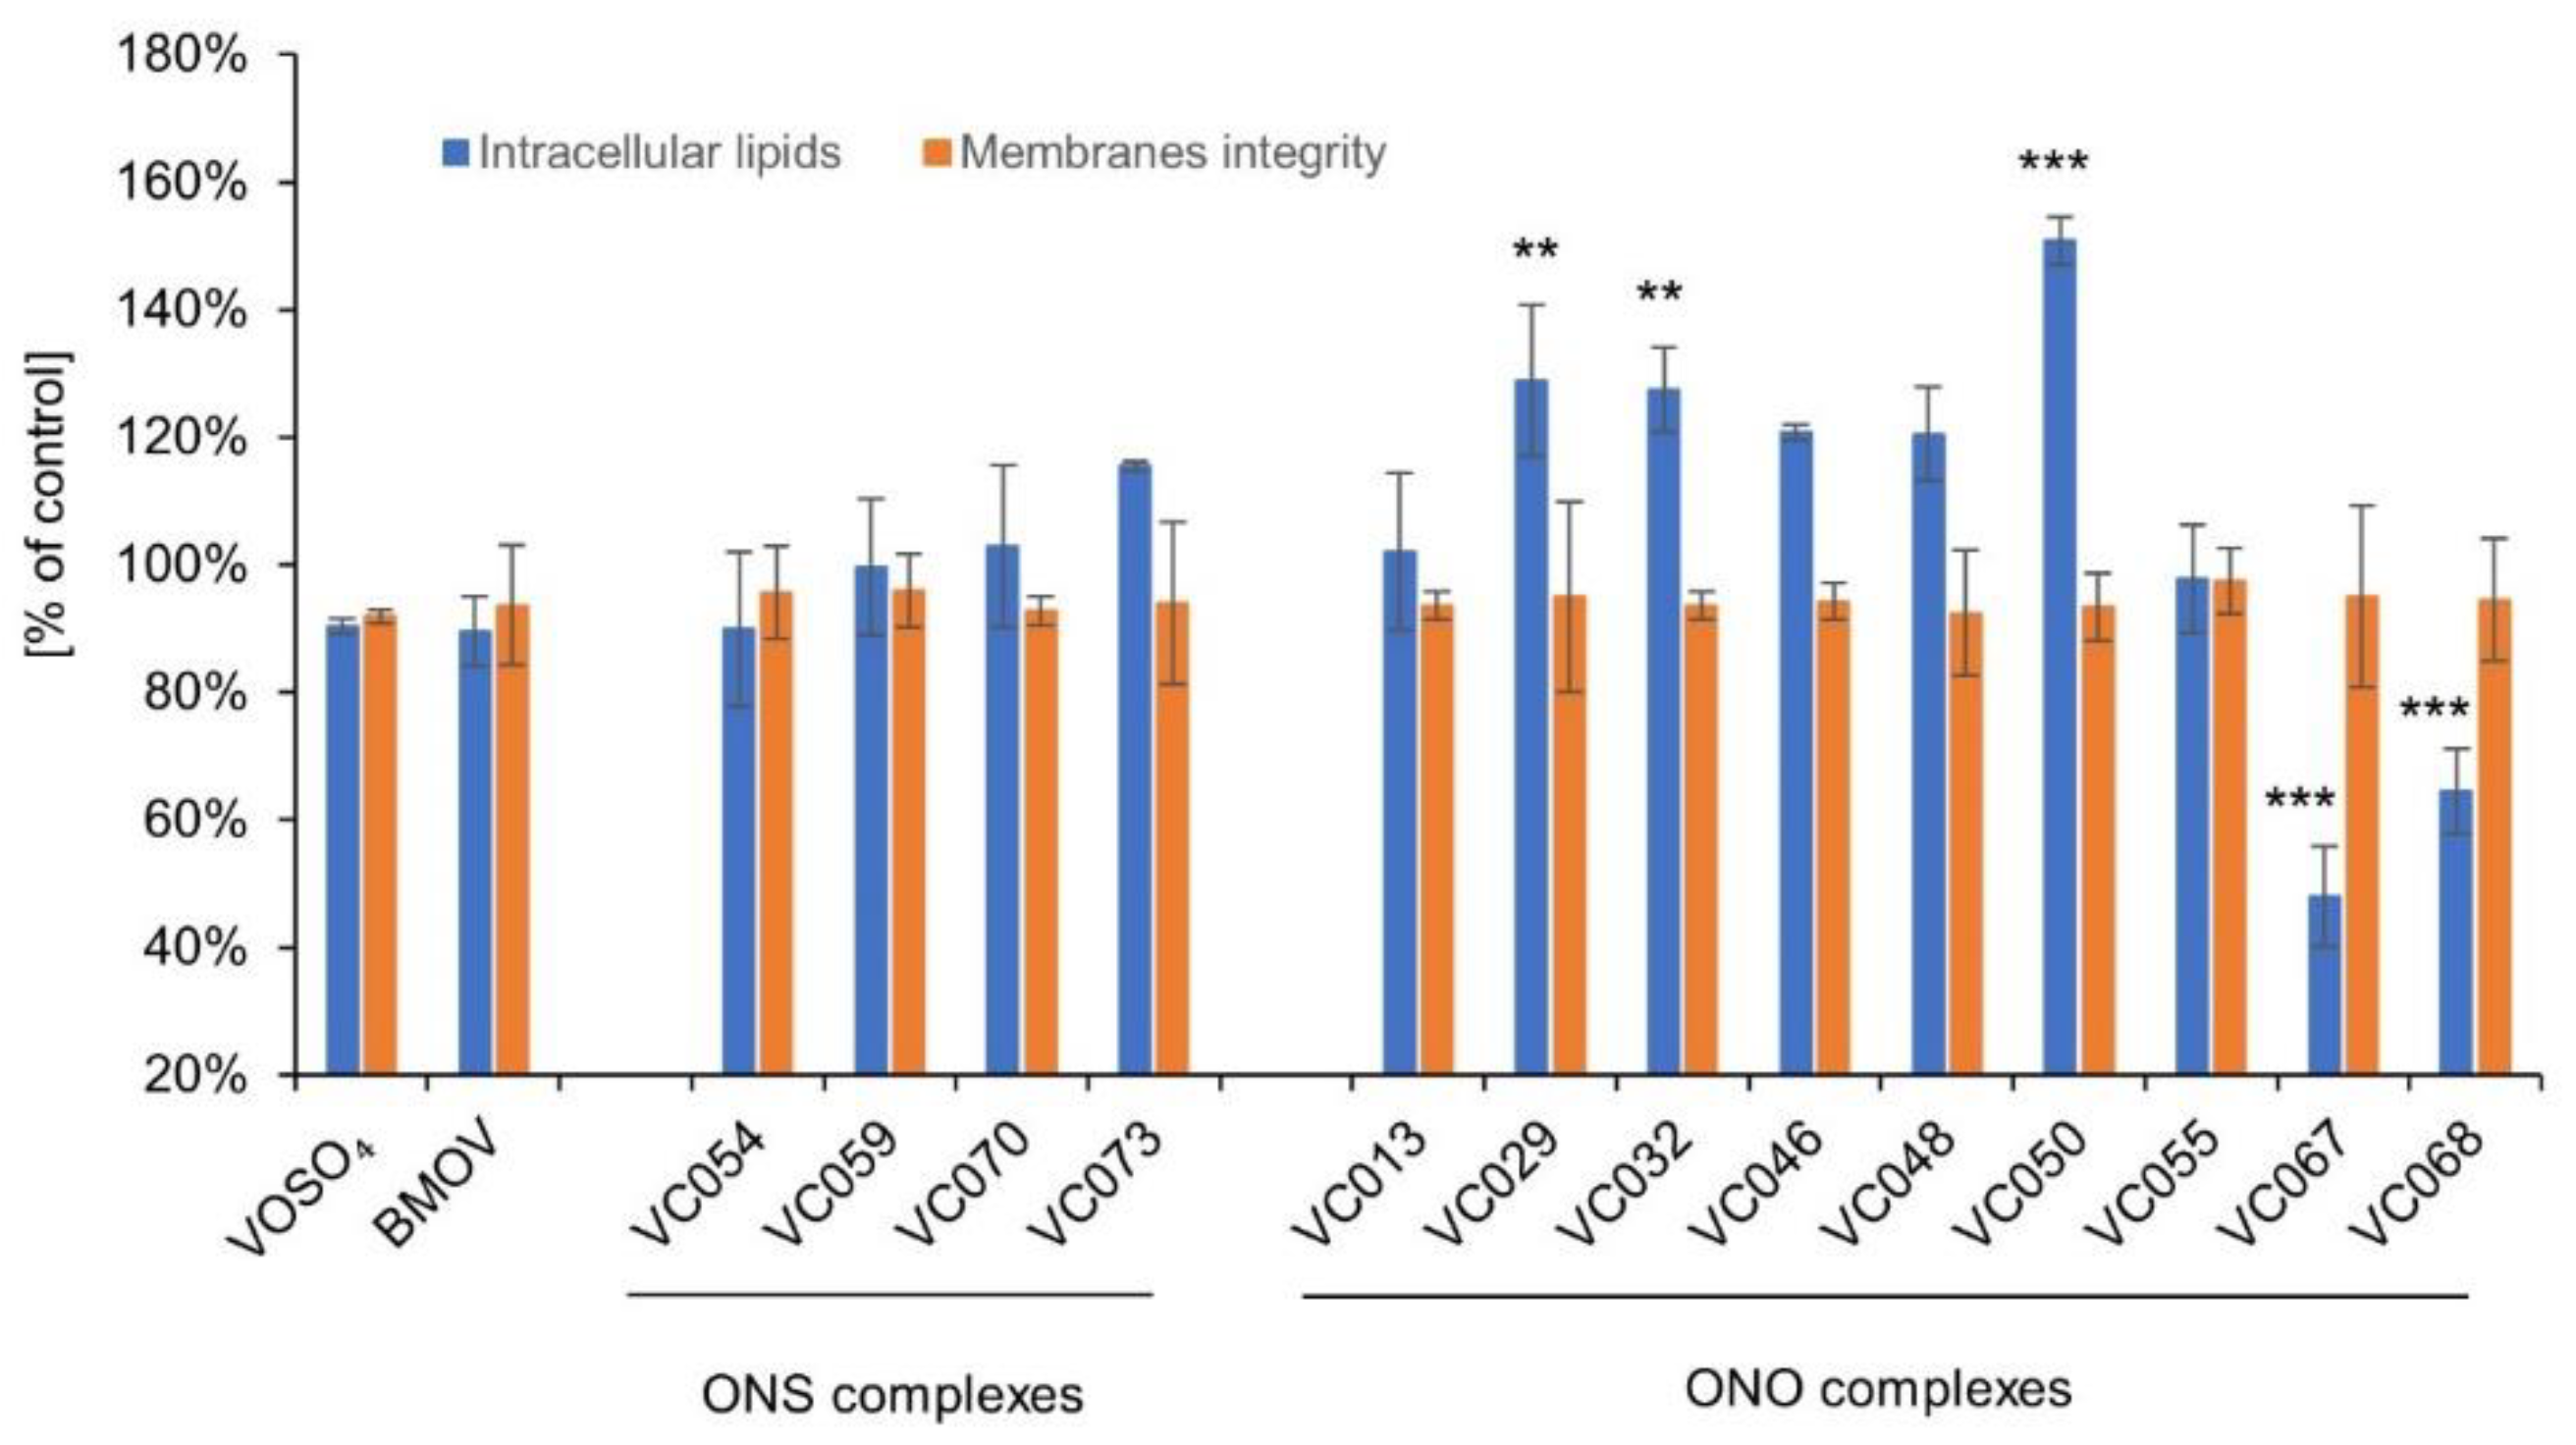
Figure 6.
The effect of the vanadium complexes on gluconeogenesis in hepatocytes HepG2. The results are presented as a percentage of the control cells treated with the solvent only (mean ± SD). Statistical significance vs. control is denoted as *p≤ 0.05, **p≤ 0.01, ***p≤ 0.001.
Figure 6.
The effect of the vanadium complexes on gluconeogenesis in hepatocytes HepG2. The results are presented as a percentage of the control cells treated with the solvent only (mean ± SD). Statistical significance vs. control is denoted as *p≤ 0.05, **p≤ 0.01, ***p≤ 0.001.
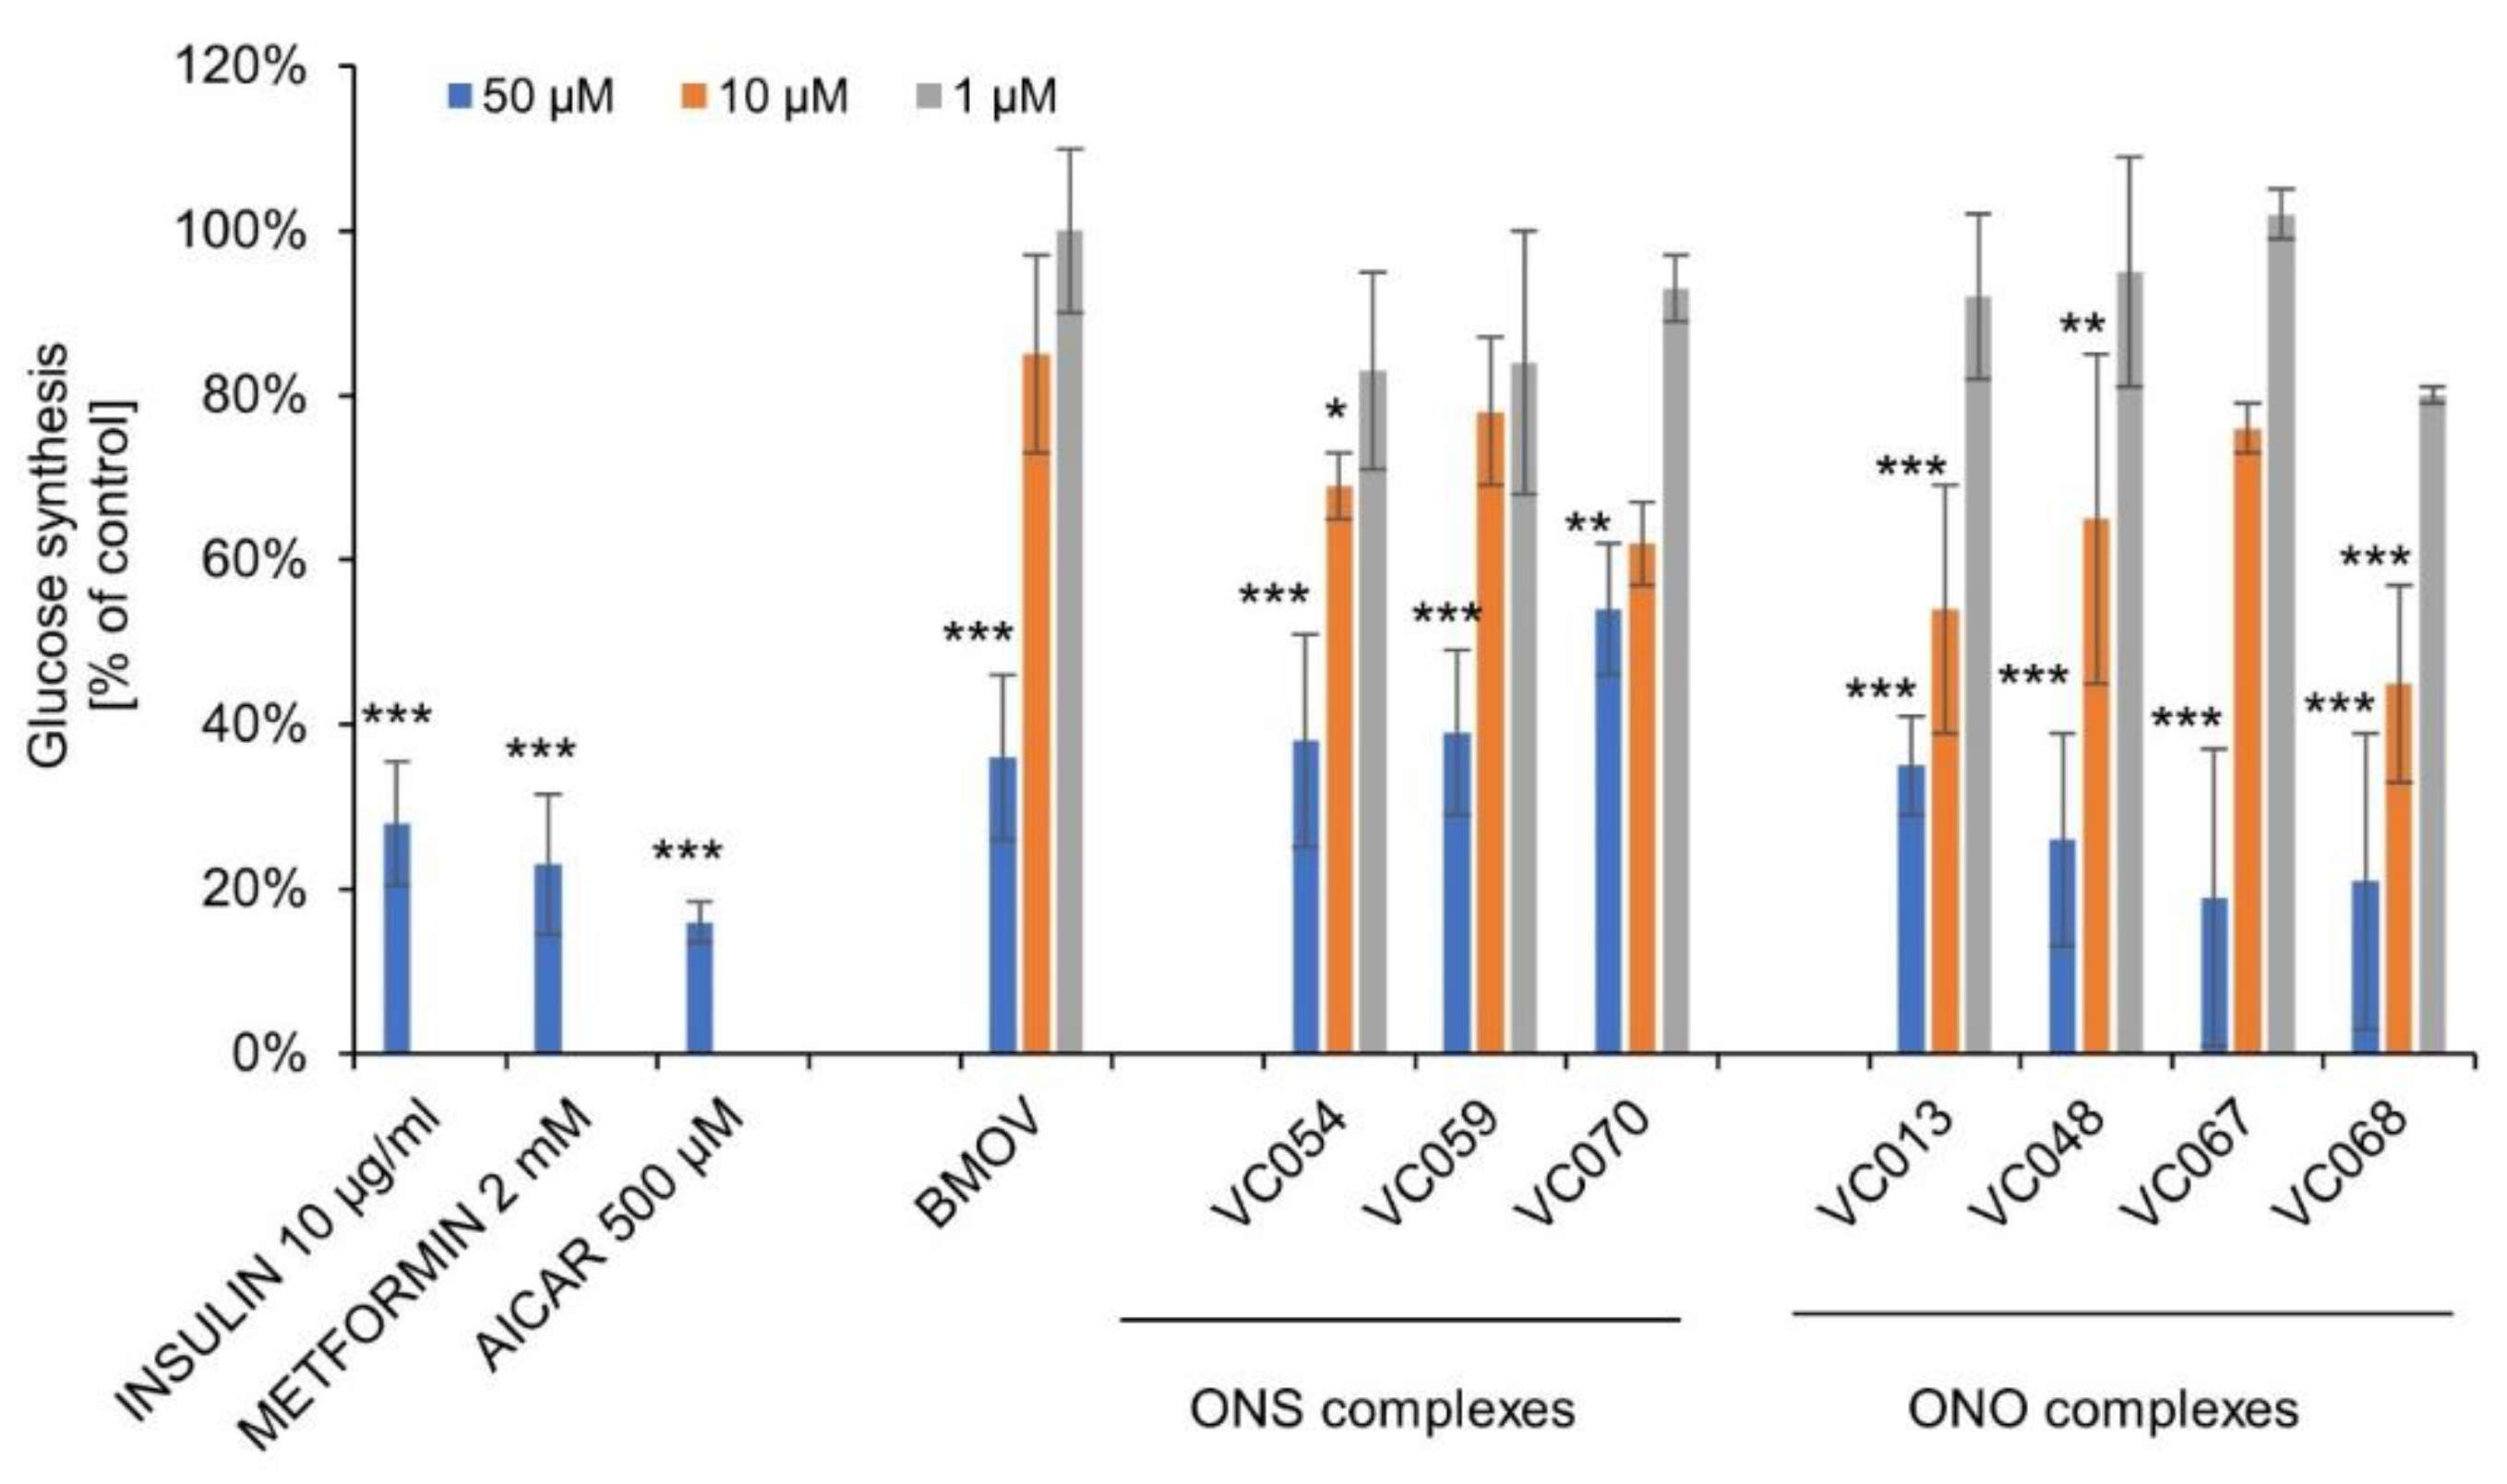
Figure 7.
The effect of vanadium complexes on the transport of [14C]-deoxy-D-glucose into hepatocytes HepG2, in which insulin resistance was induced by preincubation with TNF and oleic acid (OLE). MET – metformin. The results are presented as a percentage of the control cells treated with the solvent only (mean ± SD). Statistical significance is denoted as *p≤ 0.05, **p≤ 0.01, ***p≤ 0.001. For TNF and OLE statistical significance vs. control cells.
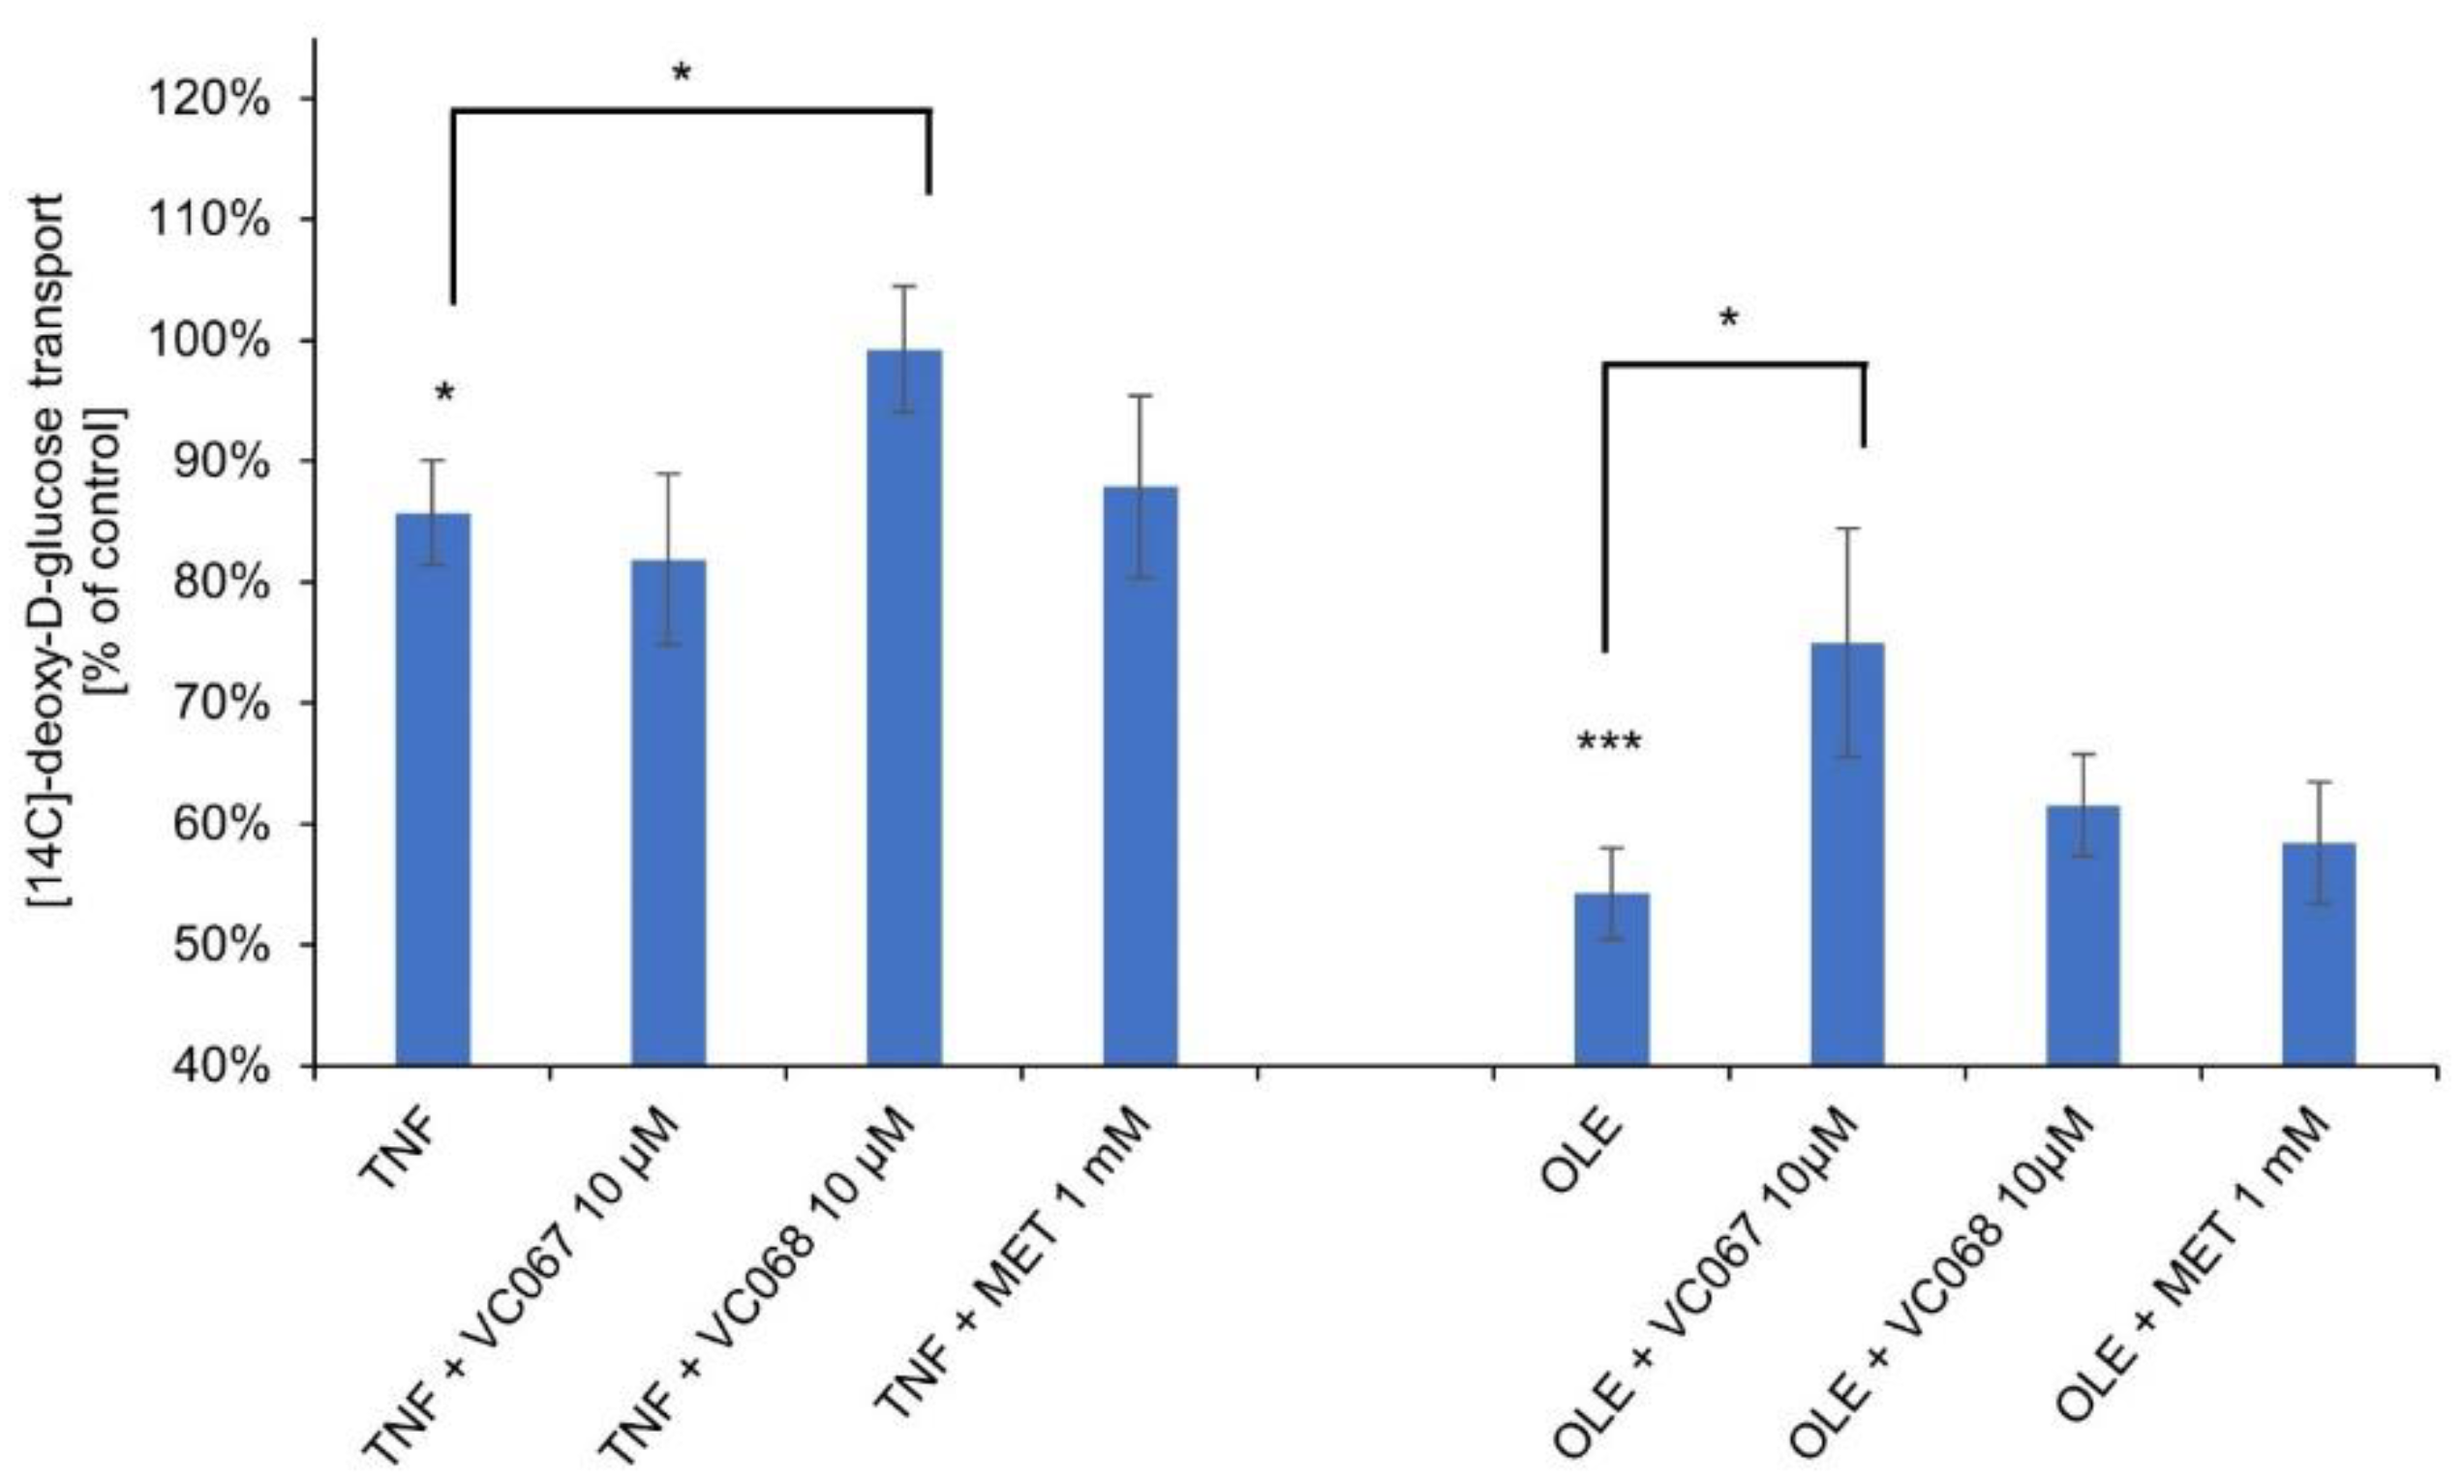
Figure 8.
The effect of vanadium complexes on the transport of [14C]-deoxy-D-glucose into hepatocytes HepG2, in which insulin resistance was induced by preincubation with insulin (INS). CON – control, MET – metformin. The results are presented as a percentage of the control cells treated with the solvent only (mean ± SD). Statistical significance vs. control is denoted as *p≤ 0.05, **p≤ 0.01, ***p≤ 0.001. For insulin statistical significance vs. control insulin resistant cells.
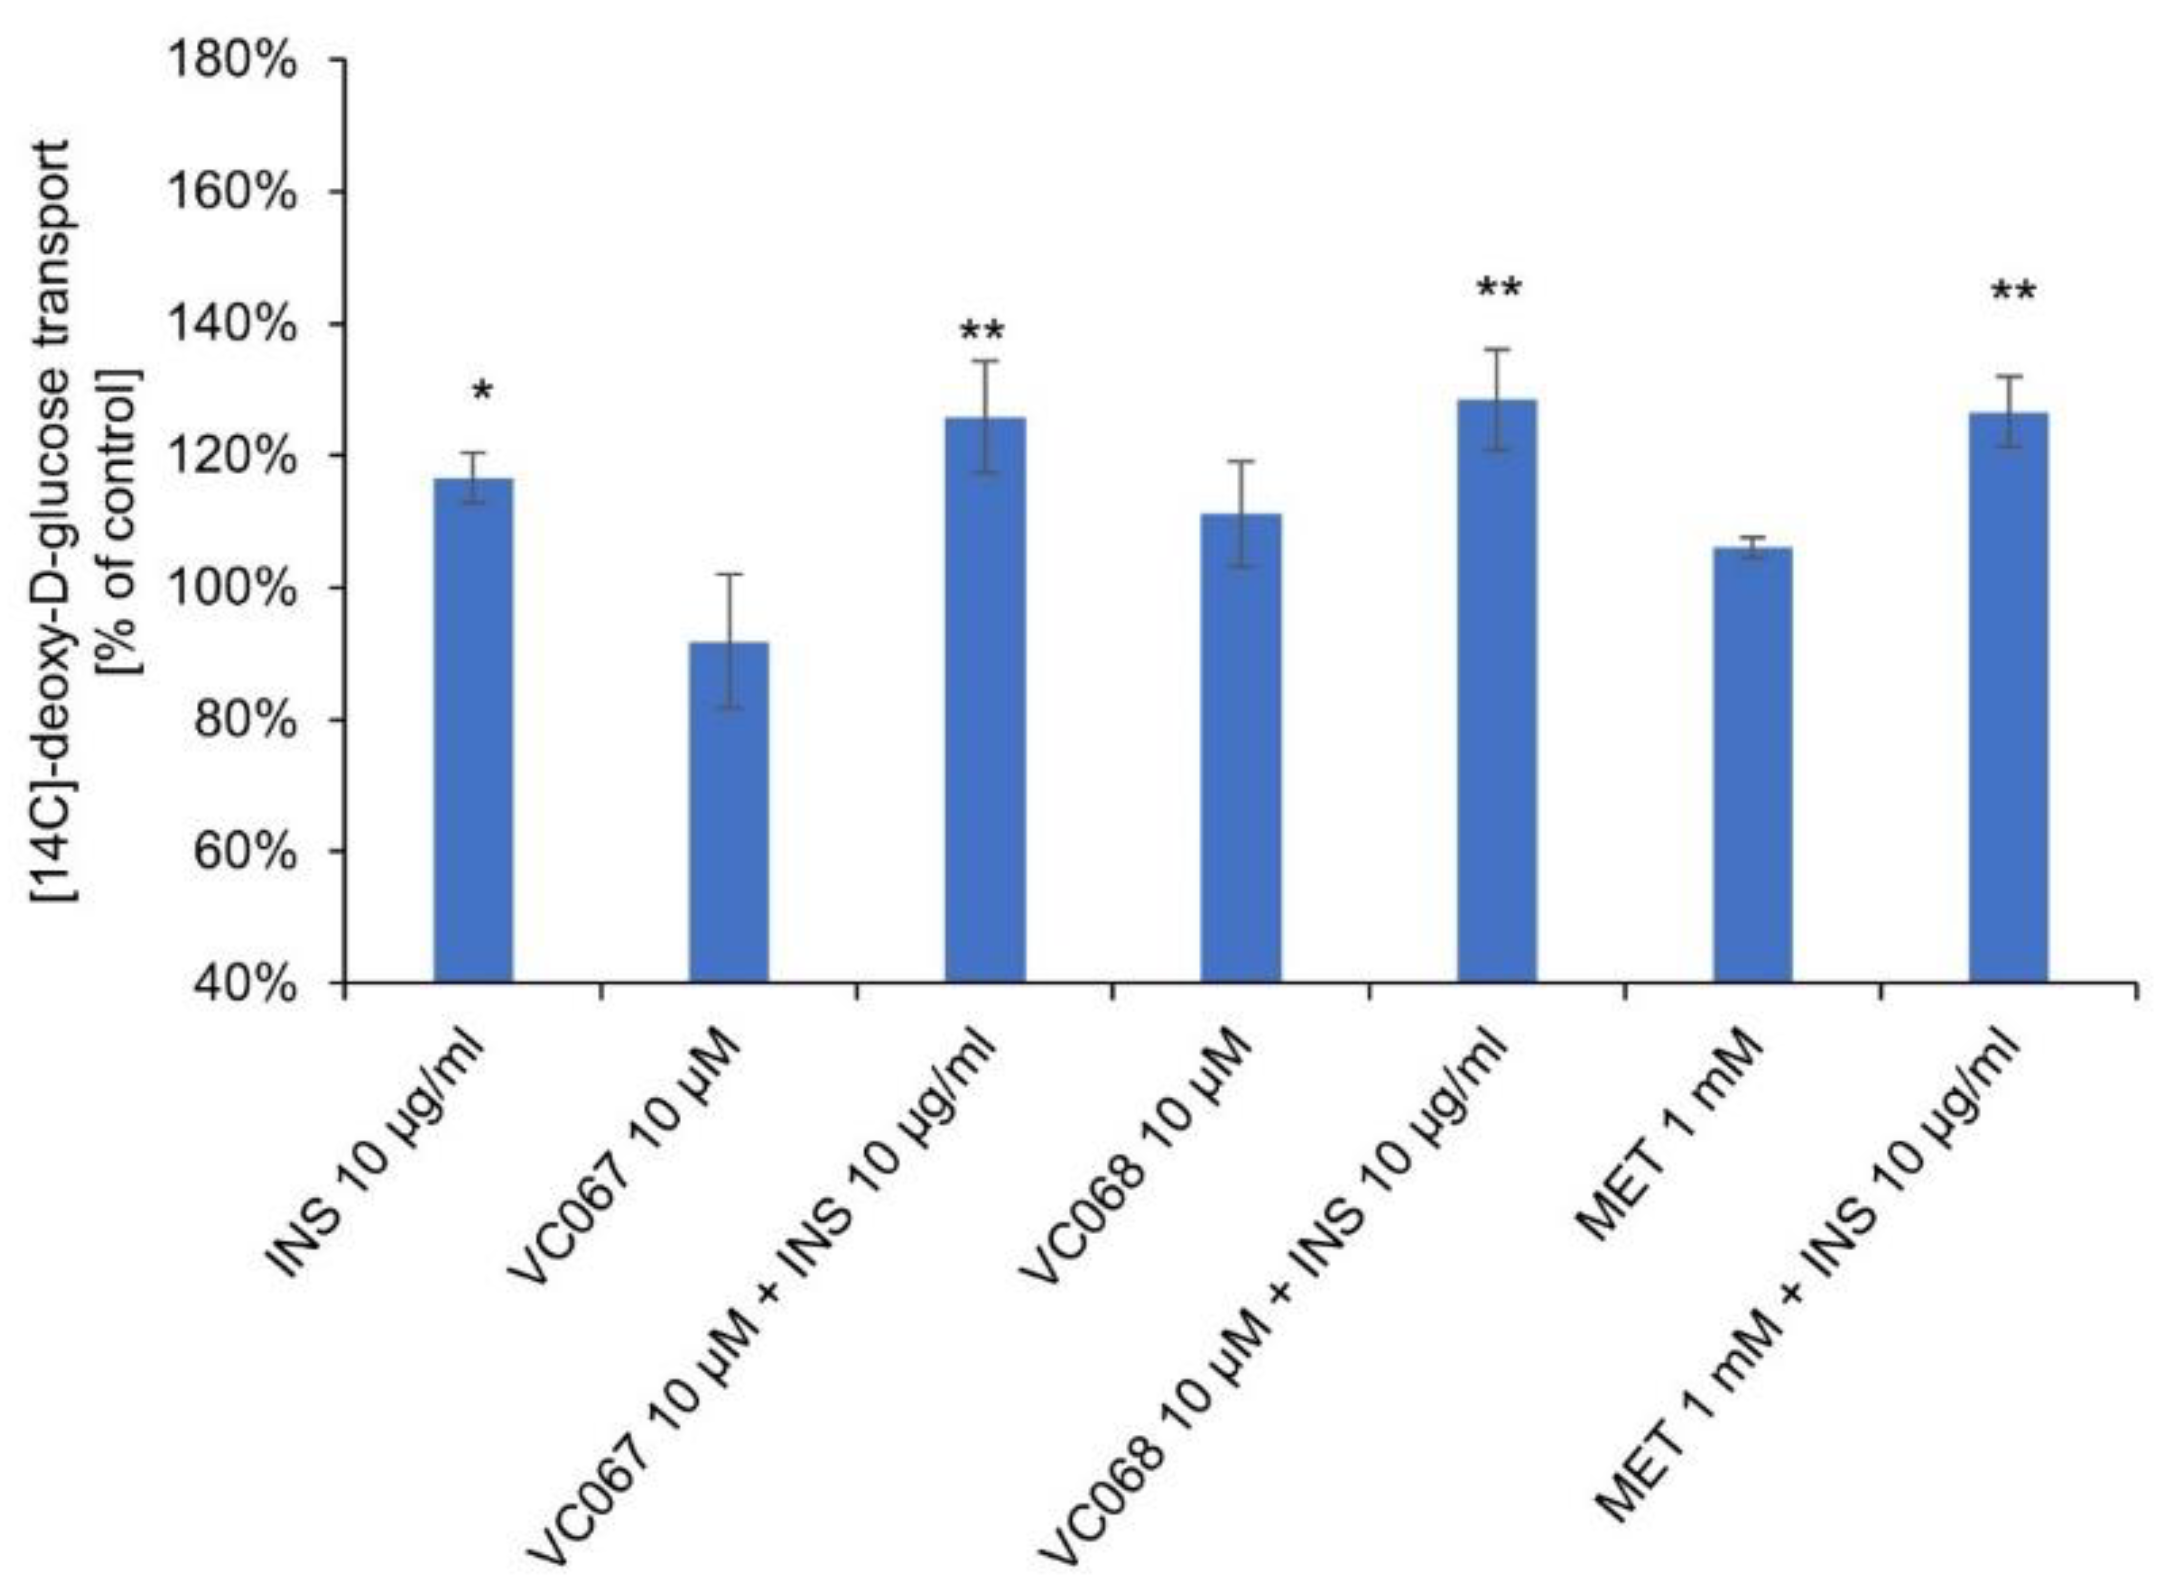
Figure 9.
The effect of the vanadium complexes on AKT(Thr308) phosphorylation in HepG2 hepatocytes. The results are presented as a percentage of the pAKT/AKT ratio against control cells treated with the solvent only (mean ± SD). Human insulin was used at the concentration of 10 µg/ml, wortmannin 1 µM, and triciribine 10 µM. Statistical significance vs. control is denoted as *p≤0.05, **p≤0.01, ***p≤0.001. For insulin with AKT inhibitors statistical significance vs. insulin alone.
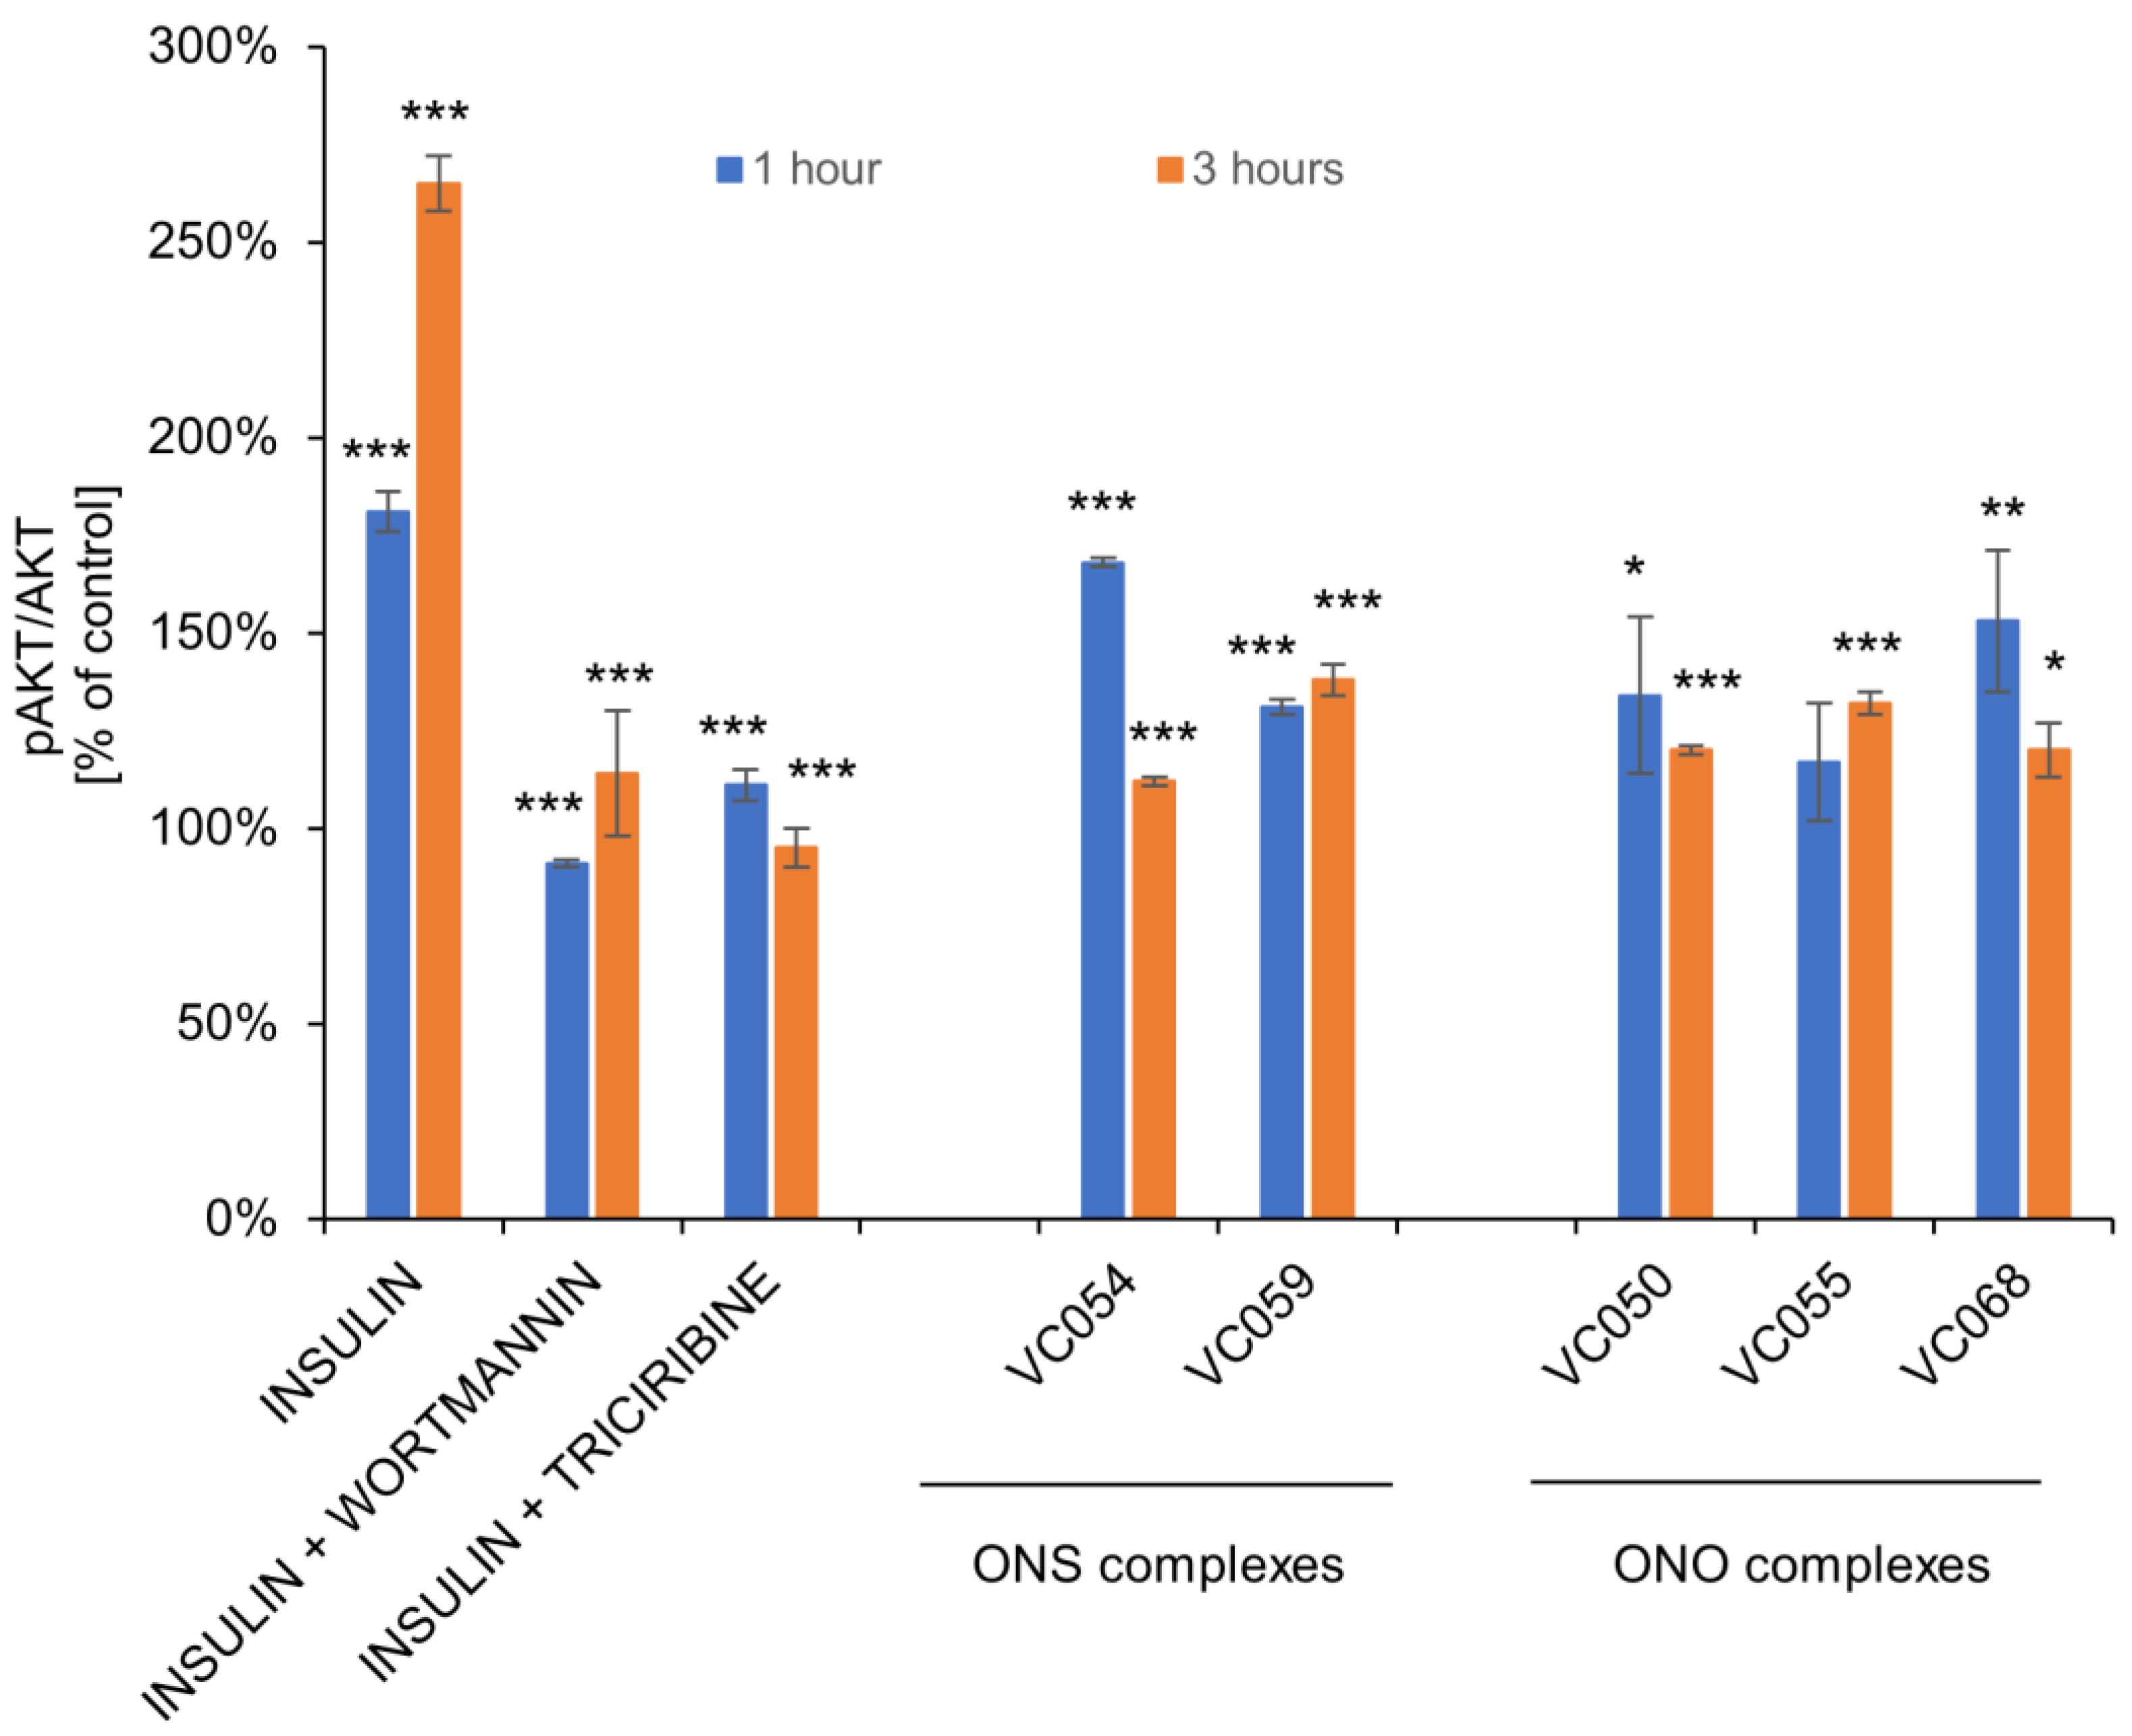
Figure 10.
The effect of the vanadium complexes on ERK1/2 (Thr202/Tyr204) phosphorylation in HepG2 hepatocytes. The results are presented as a percentage of the pERK/ERK ratio against control cells treated with the solvent only (mean ± SD). Human insulin was used at the concentration of 10 µg/ml, FR180204 2 µM, and PD98053 50 µM. Statistical significance vs. control is denoted as *p≤0.05, **p≤ 0.01, ***p≤ 0.001. For insulin with ERK inhibitors statistical significance vs. insulin alone.
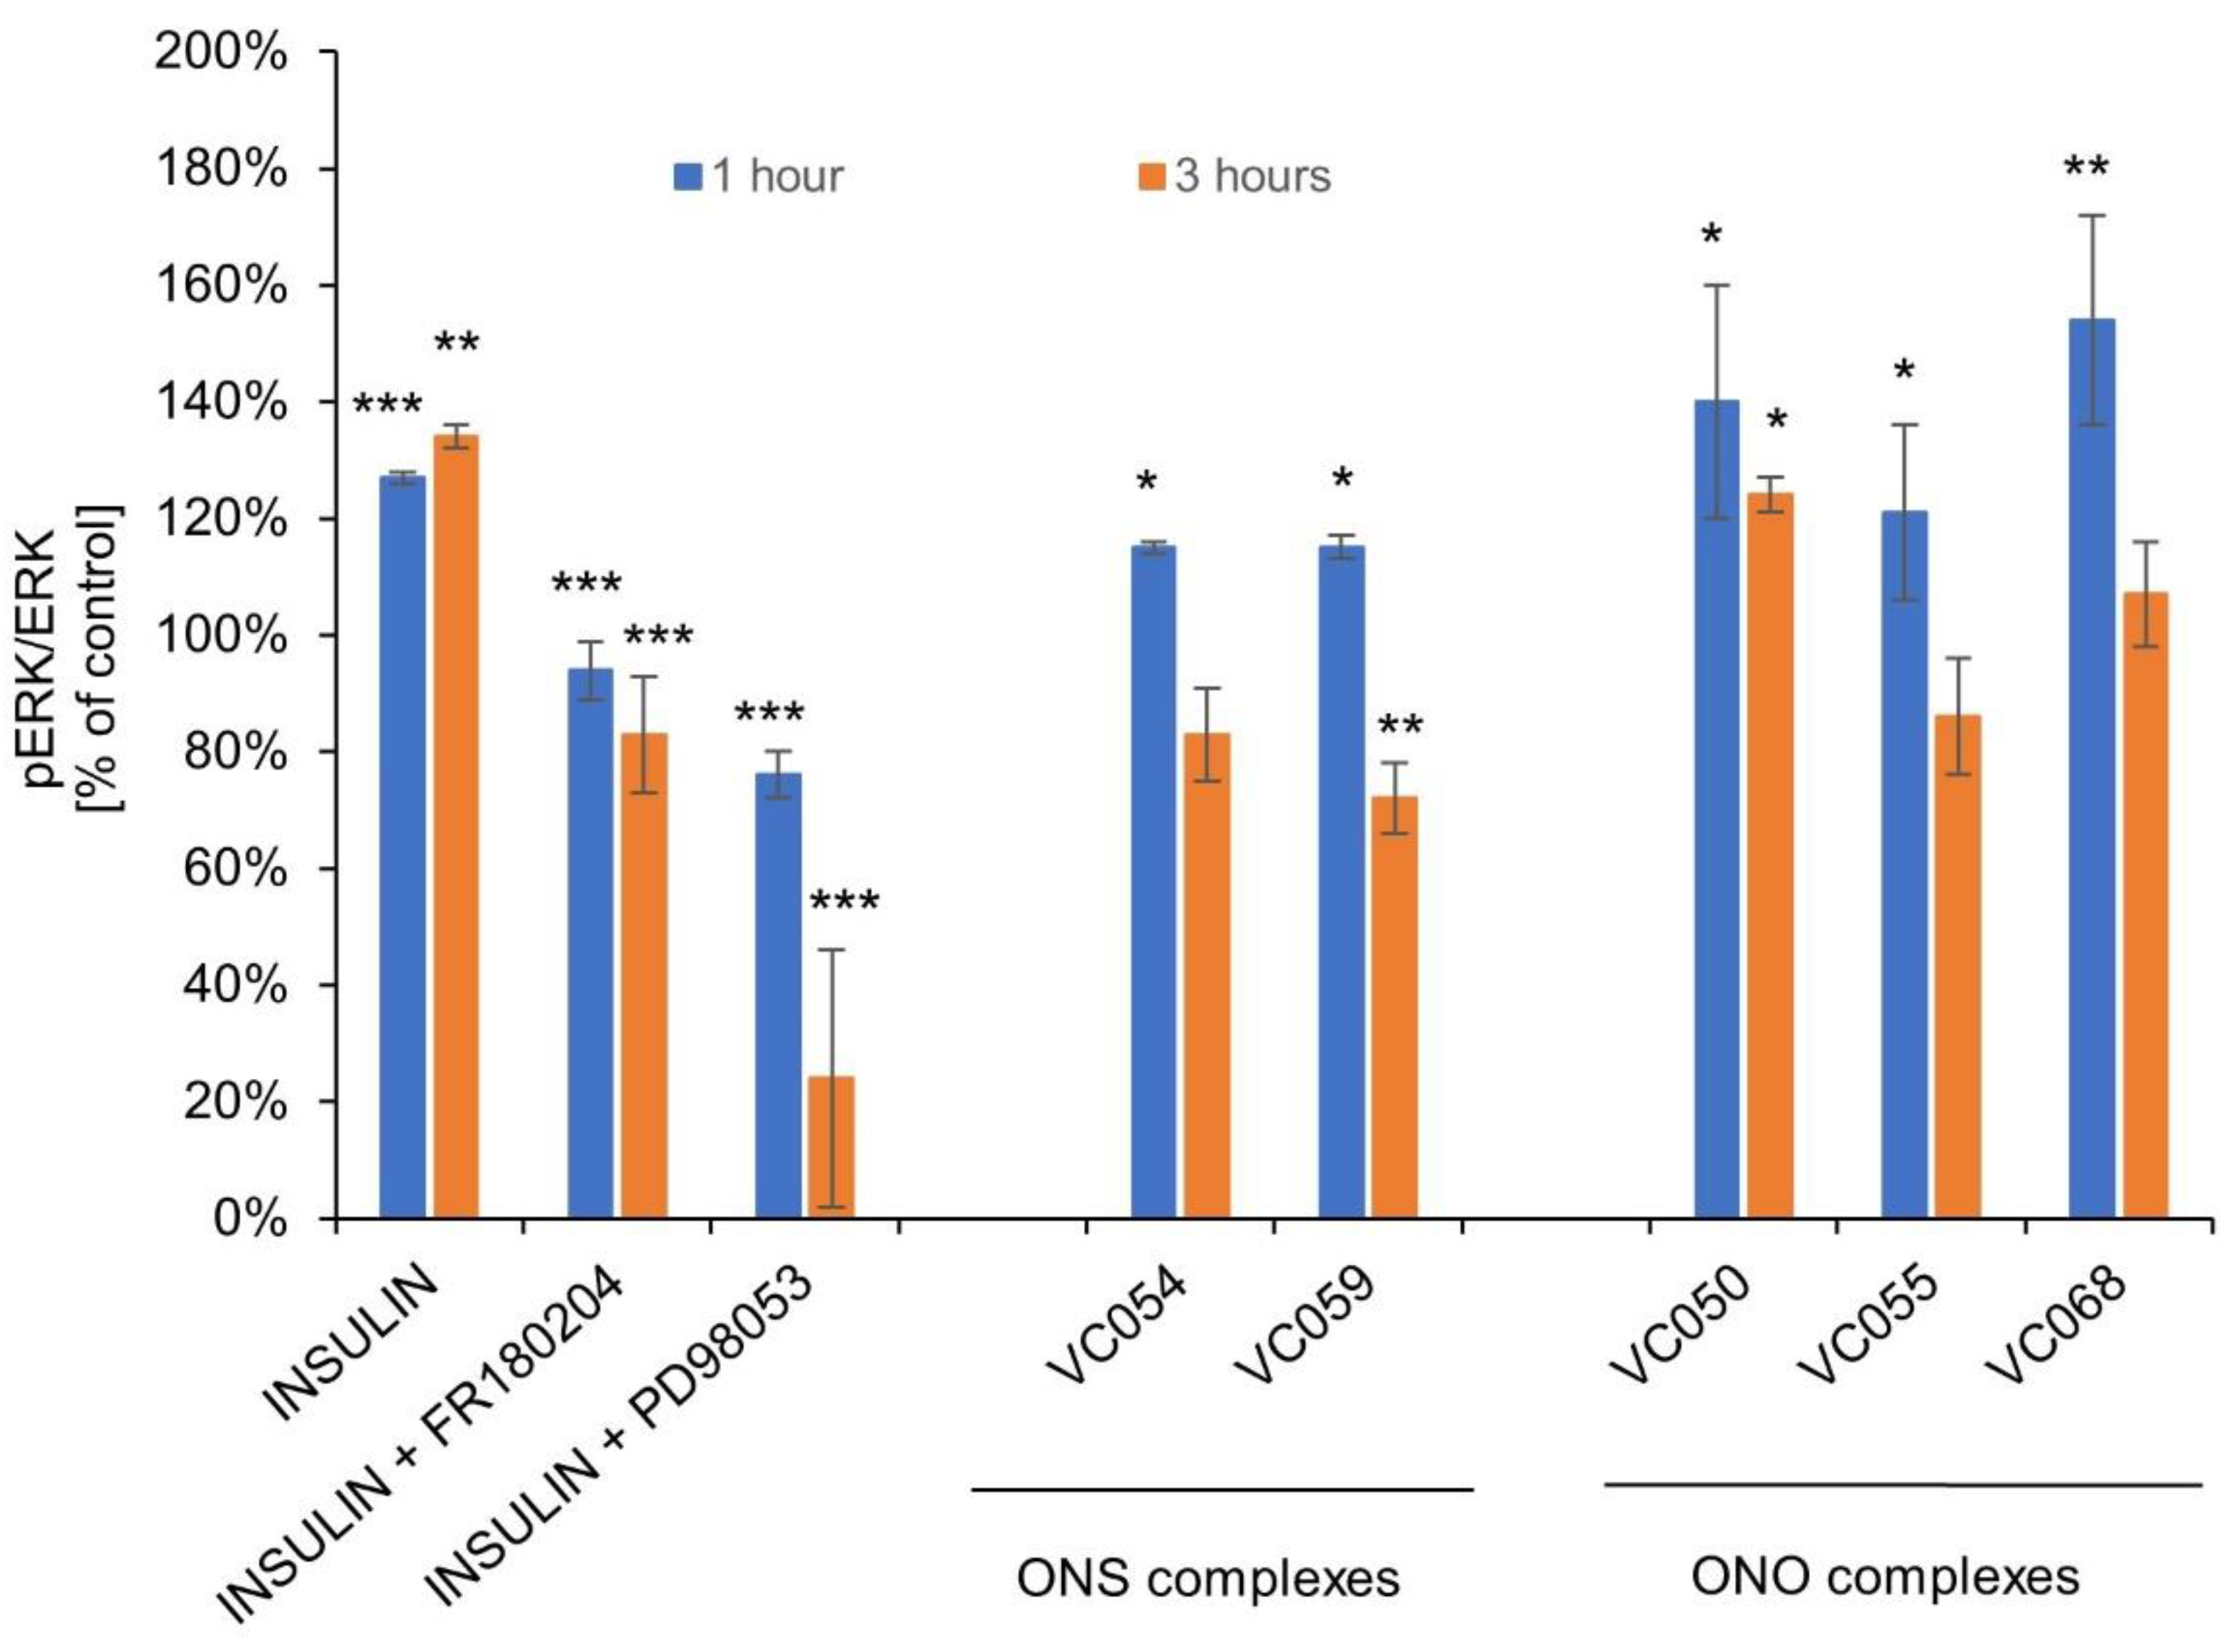

Table 1.
The formulas of the ONS complexes with the elemental analyses and IR spectra results.
| Compound | Starting amino acid | Structural formula of the complex |
Elemental analysis of the complex* [%] | IR bands [cm-1] |
|---|---|---|---|---|
| VC054 | L-tryptophan | [VOCl2(L1)]·THF·6HCl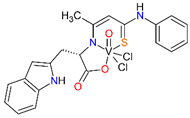
|
C, 37.38; 37.20 H, 4.86; 4.25 N, 5.22; 5.21 S, 2.91; 3.97 |
3192 (w), 3054 (w), 2922 (s), 1709 (w), 1645 (s), 1619 (w), 1523 (w), 1491 (w), 1430 (m), 1396 (w), 1370 (m), 1253 (w), 1199 (w), 1120 (w), 1040 (w), 983 (m), 807 (w), 744 (m), 701 (m), 599 (w) |
| VC059 | L-phenylalanine | [VOCl2(L2)]·0.5Et2O·1.5HCl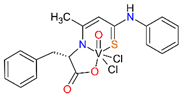
|
C, 44.62; 44.91 H, 4.35; 4.47 N, 4.58; 4.87 S, 5.55; 5.58 |
3059 (s), 1709 (w), 1624 (s), 1606 (s), 1524 (w), 1497 (s), 1439 (m), 1407 (w), 1349 (w), 1221 (w), 1131 (w), 1078 (w), 1025 (w), 986 (m), 813 (w), 755 (m), 701 (m), 600 (w) |
| VC070 | L-leucine | [VOCl2(L3)]·2.5HCl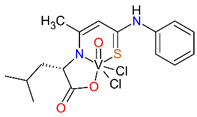
|
C, 36.54; 35.96 H, 4.66; 4.43 N, 4.88; 5.24 S, 5.40; 6.00 |
3070 (s), 2958 (s), 1714 (w), 1618 (s), 1560 (w), 1523 (m), 1497 (s), 1447 (m), 1412 (w), 1231 (w), 1179 (w), 1120 (w), 1078 (w), 988 (m), 946 (w), 876 (w), 760 (m), 696 (m), 603 (w) |
| VC073 | L-methionine | [VOCl2(L4)]·THF·2HCl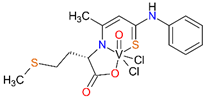
|
C, 37.29; 37.64 H, 4.79; 4.82 N, 3.98; 4.62 S, n/a |
3181 (w), 3001 (s), 2921 (s), 1709 (w), 1614 (s), 1603 (s), 1560 (w), 1528 (s), 1491 (s), 1433 (s), 1346 (w), 1243 (w), 1136 (w), 1078 (w), 983 (m), 760 (m), 692 (m), 596 (w) |
| VC109 | D/L-isoleucine | [VOCl2(L5)]·3HCl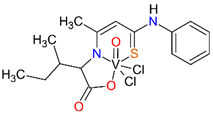
|
C, 34.77; 34.55 H, 4.38; 4.35 N, 5.07; 5.04 S, 5.80; 5.77 |
3338 (w), 3059 (w), 2970 (s), 2939 (w), 2885 (w), 1729 (w), 1606 (s), 1520 (s), 1489 (s), 1447 (m), 1389 (w), 1350 (w), 1218 (w), 1180 (w), 1114 (w), 986 (m), 865 (w), 758 (m), 696 (m), 599 (w) |
* the calculated elemental analyses were bolded.
Table 2.
The formulas of the ONO complexes and the hydrazide components of Schiff base ligands (Ln) used in synthesis with the reference for complexes previously described; phen = 1,10-phenanthroline.
Table 2.
The formulas of the ONO complexes and the hydrazide components of Schiff base ligands (Ln) used in synthesis with the reference for complexes previously described; phen = 1,10-phenanthroline.
| Compound | Formula | Ln components (1:1 molar ratio) | Ref. | |
|---|---|---|---|---|
| Aldehyde | Hydrazide | |||
| VC013 | [VO(L6)(phen)] ⋅H2O | 5-bromosalicyl-aldehyde | 2-hydroxybenzhydrazide | [45] |
| VC029 | [V(L7)(HL7)] | 2-hydroxybenzhydrazide | [46] | |
| VC032 | [V(L8)(HL8)]⋅H2O | benzhydrazide | [47] | |
| VC046 | [VO(L9)(phen)]⋅2H2O | 4-hydroxybenzhydrazide | [46] | |
| VC048 | [VO(L10)(phen)]⋅0.5H2O | 4-tertbutylbenzhydrazide | [47] | |
| VC055 | [V(L11)(HL11)] | 4-methoxybenzhydrazide | -* | |
| VC050 | [VO(L11)(phen)] | 4-chlorobenzhydrazide | [46] | |
| VC067 | [V(L12)(HL12)] | 3-hydroxy-2-naphthoic acid hydrazide | [46] | |
| VC068 | [V(L13)(HL13)] | 4-nitrobenzhydrazide | [46] | |
* described in this study.
Table 3.
Inhibition of human tyrosine phosphatases by the ONS and ONO vanadium complexes at the concentration of 1 µM. Results are expressed as percentage of inhibition of the control (solvent only). Standard deviation not excessed 6%.
Table 3.
Inhibition of human tyrosine phosphatases by the ONS and ONO vanadium complexes at the concentration of 1 µM. Results are expressed as percentage of inhibition of the control (solvent only). Standard deviation not excessed 6%.
| PTP1B | LAR | SHP1 | SHP2 | ||
|---|---|---|---|---|---|
| Comparators | VOSO4 | 62 | 44 | 70 | 77 |
| BMOV | 77 | 58 | 76 | 82 | |
| ONS complexes | VC054 | 78 | 67 | 84 | 87 |
| VC059 | 79 | 71 | 82 | 87 | |
| VC070 | 79 | 69 | 84 | 88 | |
| VC073 | 74 | 63 | 82 | 86 | |
| VC109 | 70 | 56 | 80 | 83 | |
| ONO complexes | VC013 | 60 | 66 | 67 | 74 |
| VC029 | 31 | 25 | 62 | 68 | |
| VC032 | 9 | 8 | 44 | 48 | |
| VC046 | 34 | 37 | 62 | 66 | |
| VC048 | 36 | 35 | 62 | 64 | |
| VC050 | 25 | 19 | 53 | 57 | |
| VC055 | 24 | 18 | 56 | 57 | |
| VC067 | 42 | 39 | 70 | 74 | |
| VC068 | 40 | 33 | 70 | 74 |
Background of the table cells represent heat map with a gradient of a two-color scale was used. The highest intensity of red color means 100% inhibition, the highest intensity of blue color means 0% and the middle of the scale corresponding to the 50% inhibition is colorless.
Table 4.
Inhibition of the human tyrosine phosphatases by the selected ONS and ONO complexes.
| IC50 [nM] | Log IC50±SD | ||||||||
|---|---|---|---|---|---|---|---|---|---|
| PTP1B | LAR | SHP1 | SHP2 | PTP1B | LAR | SHP1 | SHP1 | ||
| Comparators | VOSO4 | 99 | 95 | 17 | 13 | -7.00±0.07 | -7.88±0.10 | -7.77±0.02 | -7.77±0.02 |
| BMOV | 149 | 140 | 14 | 8 | -6.83±0.02 | -8.09±0.11 | -7.86±0.03 | -7.86±0.03 | |
| ONS complexes | VC054 | 141 | 112 | 20 | 20 | -6.85±0.01 | -7.70±0.06 | -7.56±0.02 | -7.56±0.02 |
| VC059 | 107 | 76 | 26 | 13 | -6.97±0.01 | -7.87±0.06 | -7.59±0.04 | -7.59±0.04 | |
| ONO complexes | VC050 | 4263 | 1714 | 657 | 273 | -5.37±0.03 | -6.56±0.04 | -6.18±0.03 | -6.18±0.03 |
| VC068 | 2034 | 619 | 517 | 235 | -5.69±0.02 | -6.63±0.03 | -6.29±0.02 | -6.29±0.02 | |
Table 5.
Inhibition of human non-tyrosine phosphatases and PTPRA by the selected ONS and ONO complexes. Results are expressed as percentage inhibition of control (solvent only) ±SD.
Table 5.
Inhibition of human non-tyrosine phosphatases and PTPRA by the selected ONS and ONO complexes. Results are expressed as percentage inhibition of control (solvent only) ±SD.
| CDC25A | PP2A | ||||
|---|---|---|---|---|---|
| 10 µM | 1 µM | 10 µM | 1 µM | ||
| Comparators | VOSO4 | 62±1 | 54±2 | 40±3 | 32±2 |
| BMOV | 61±1 | 54±1 | 63±4 | 52±15 | |
| ONS complexes | VC054 | 65±3 | 51±2 | 75±7 | 41±15 |
| VC059 | 68±3 | 55±3 | 54±9 | 44±1 | |
| ONO complexes | VC050 | 38±1 | 12±8 | 51±4 | 24±3 |
| VC068 | 62±2 | 54±3 | 55±15 | 26±12 | |
Disclaimer/Publisher’s Note: The statements, opinions and data contained in all publications are solely those of the individual author(s) and contributor(s) and not of MDPI and/or the editor(s). MDPI and/or the editor(s) disclaim responsibility for any injury to people or property resulting from any ideas, methods, instructions or products referred to in the content. |
© 2023 by the authors. Licensee MDPI, Basel, Switzerland. This article is an open access article distributed under the terms and conditions of the Creative Commons Attribution (CC BY) license (http://creativecommons.org/licenses/by/4.0/).
Copyright: This open access article is published under a Creative Commons CC BY 4.0 license, which permit the free download, distribution, and reuse, provided that the author and preprint are cited in any reuse.


