
Submitted:
20 April 2023
Posted:
21 April 2023
You are already at the latest version
Abstract
Near space environment is the airspace at an altitude of 20 km-100 km, where complex conditions such as low temperature, low pressure, high wind speed and solar radiation exist. As one of the important meteorological parameters, temperature is crucial for space activities, but the influence of the complex environment makes the error of conventional temperature measurement methods large. Therefore, a new microbridge temperature sensor was designed that can reduce solar radiation and achieve a fast response. And through simulation analysis, the three factors influencing the temperature errors of Joule heat, solar radiation heat and aerodynamic heat were investigated. And the influence of temperature error is reduced by optimizing the installation position of the sensor. Through the temperature error model, the error value in the actual measurement value is removed, to realize the high accuracy detection of near-space temperature.
Keywords:
near space
; Joule heat
; solar radiation
; aerodynamic
; temperature correction
1. Introduction
Near space refers to the airspace connecting the sky and space at an altitude of 20~100 km, where it is difficult for general aircraft to operate, and has an important strategic position [1,2,3,4]. The atmospheric environmental parameters in near space, including temperature, pressure, and wind, are important meteorological parameters that can directly affect space activities, so it is important to accurately detect these parameters [5,6,7,8]. Its environmental conditions are complex, with temperatures down to minus 70 ℃, ultra-low pressure, and also a complex wind field [9,10]. In addition, there are also environmental interference factors such as irradiation and electromagnetism, which affect the high-precision detection of atmospheric environmental parameters in near space [6]. The space-based platform is equipped with multi-parameter radio sounders, forming a large all-height detection cluster with fast maneuvering speed and high coverage, which can realize continuous detection of environmental parameters such as temperature, density, wind field and pressure at fixed points [11,12]. The sounding rocket platform is characterized by fast maneuverability and high coverage height, and the airship platform has the characteristics of high mobility and high carrying capacity [13,14]. The sounding rocket platform cooperates with the airship platform and is equipped with radiosondes to overcome the harsh environmental impact of near space and obtain fixed-point continuous detection of environmental parameters. When the radio sounder rises to a certain position with the platform it is ejected and descends, while the parachute opens. Due to the thin air, the radio sounder will descend with a vertical acceleration close to the acceleration of gravity. When reaching a low altitude, the air resistance becomes greater and the descent rate slows down.
For in-situ temperature detection, there are especially many temperature measurement errors [5]. According to the radiosonde temperature correction model given by the World Meteorological Organization, the factors that cause temperature measurement errors include aerodynamic heat, temperature hysteresis, solar radiation, solar radiation reflected by the ground and clouds, environmental long-wave radiation, radiation from sensors to the environment, heat conduction of the support structure, and Joule heat, etc., which need to be decoupled to obtain the true atmospheric temperature value [15,16].
Aerodynamic heat: due to the thin atmosphere in space, the falling speed can reach hundreds of meters per second during the dropping of the radiosonde [4]. The temperature sensor directly exposed to the air compresses the air in front of it, and the gas temperature rises, that is, aerodynamic heat. Therefore, the temperature field where the temperature sensor is located is not the real atmospheric temperature field, but the temperature field superimposed by aerodynamic heat [17,18].
Joule heat: during the working process of the resistance temperature sensor, a large Joule heat is generated due to the large resistance value, which has a significant impact on its thermal field characteristics and directly causes temperature measurement errors [19].
Solar radiation: the intensity of solar radiation in near space is large, and the amount of solar radiation will lead to the change in temperature error caused by the solar radiation heating effect. In addition, the change of air pressure and the sensor surface material will also cause different temperature errors of solar radiation. Other radiation: after entering the earth's atmosphere, the solar radiation will be absorbed, reflected, scattered by various components in the air, and then absorbed and reflected by the ground after reaching the ground. This part is the reflection of solar radiation from the ground and clouds, which will increase the temperature of the sensor. In near space, the temperature sensor is also exposed to long-wave radiation from the upper and lower atmosphere and the main body of the radiosonde, which belongs to the environmental long-wave radiation. In addition, there is the thermal radiation of the sensor to the environment in the form of electromagnetic waves [15,16,17,20,21,22].
Support structure heat conduction: This is the heat transfer between the sensor and the supporting structure [15].
Temperature hysteresis: The sensor has a certain volume and a heat capacity. When there is a temperature difference with the outside world, the sensor generates stress and needs a certain amount of time to change to the outside temperature, which is called thermal hysteresis [23,24,25].
The main temperature sensors for radiosonde are thermocouple sensors, bead thermistor temperature sensors, and platinum thin film temperature sensors. Among them, the accuracy and linearity of thermocouple sensor are poor. As the most commonly used bead thermistor temperature sensor, it has low sensitivity and is susceptible to electromagnetic interference. The platinum thin film temperature sensor has the advantages of high sensitivity, small size, good stability and high linearity. In terms of Pt thin film temperature sensor design, most of the existing platinum (Pt) thin film temperature sensors have Pt deposited on a substrate made of silicon or alumina, or have an adhesion layer added in between to increase the adhesion of the Pt [26,27,28,29]. For example, Huang et al. [29] evaluated electrical characteristics parameters such as resistance temperature coefficient, hysteresis, and measurement accuracy by preparing a temperature sensor with a Ti/Pt thin film layer. Zhang et al. [23] introduced a new processing technique for Pt thin film thermistors and verified the characteristics of Pt film thermistor models. Miyakawa et al. [30] obtained a thin film device with sufficient structural stability and adhesion by sputtering Pt films directly on the substrate and replacing the large-area Pt structure and passivation coating with an interconnected 10-µm-wide line. However, this structure still has a large heat transfer phenomenon from the substrate and the adhesion layer to the Pt thin film, and the Pt thin film heat dissipation is poor. And there is no radiation-proof structure resulting in large radiation errors.
In terms of temperature error analysis, Babita et al. [31] studied the variation of self-heating effect with applied current, temperature and different surroundings using a platinum resistance thermometer. Han et al. [32] proposed an e-type temperature sensor for high altitude meteorology, using a 0.02 mm diameter platinum wire as a thermistor, and the radiation temperature correction equation was obtained by fitting the simulation results. The uncertainty of solar radiation on temperature measurement was also explored by Philipona et al. [33] and Lee et al. [34]. However, these literatures only analyzed one of the errors, and their temperature error models do not match the temperature sensor designed in this paper. Therefore, the structural design and the corresponding temperature error analysis compensation are needed to achieve higher accuracy and performance of temperature measurement when performing in-situ temperature measurement in proximity space.
In this paper, by analyzing the source of temperature error, we optimize the sensor structure and the arrangement of sensors according to simulation and practical application, and improve the temperature error model to realize high-precision in-situ detection of temperature in the near space. The temperature error is corrected by the detected data, and the high-precision temperature value of the near space is obtained [5,12,35].
2. Materials and Methods
2.1. Structure of thin film temperature sensor
In order to accurately measure the fast-changing ambient temperature during the high-speed drop of a radiosonde, the temperature sensor needs to have a fast response and high sensitivity. So, the response speed can be improved by reducing the size of the platinum resistor to reduce the thermal hysteresis. At the same time, so as to achieve high sensitivity and high accuracy measurement, the resistance value can be increased, and the initial design resistance value is around 100 Ω. In addition, due to the thin atmosphere in near space and the weak heat dissipation capability of the object, the surface area of the Pt resistor needs to be increased to improve its heat dissipation capability. Therefore, by designing the platinum into a thin film shape, the performance of fast response and high accuracy measurement can be achieved.
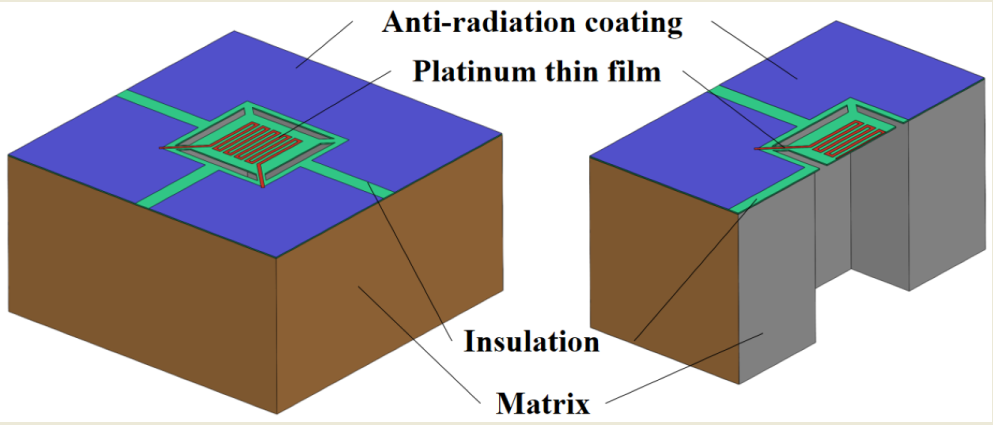
In this scheme, a Pt thin film microbridge temperature sensor was designed, as shown in Figure 1. The sensor consists of three parts, from top to bottom, a thermistor, an insulating layer and a matrix. To facilitate the full heat exchange between the thermistor and the air, the matrix was set to a structure with a hole in the middle, so that the central part of the insulator was suspended. To reduce the heat transfer from the insulating layer to the thermistor, the insulating layer was provided with heat insulation slots. The thermistor is a Pt thin film, the insulating layer is silicon dioxide, and the substrate is sapphire. Firstly, the small size and large surface area of the Pt thin film make the thermal hysteresis very small and allow for a fast response. Second, the silica has good thermal insulation properties. Finally, the sensor has an anti-radiation coating that provides some protection against radiation. Therefore, for the temperature correction model of the radiosonde in this paper, there are three temperature measurement errors, namely, aerodynamic heat, solar radiation and Joule heat, while the other errors are negligible [23,36].
2.2. Measurement model of thin film temperature sensor
In the process of Pt thin film temperature measurement, most of the heat of the Pt thin film can be transferred to the substrate in contact with it through heat conduction, which affects the temperature value of the Pt thin film and causes errors. Therefore, an insulating layer is added between the sensor substrate and the Pt thin film to reduce the solid heat conduction of the Pt thin film [15,23]. The whole Pt thin film is attached to the insulator, but the suspended micro-bridge structure of the Pt thin film is adopted, and the two ends of the Pt thin film are directly attached to the insulator bridge, as shown in Figure 2. The accuracy of the sensor can be improved by reducing the contact surface and reducing the ineffective heat loss from the Pt thin film, as Equation:
where is the heat transfer between the Pt thin film and the insulation layer, is the contact area between them, is the heat transfer coefficient between them, and is the temperature difference between the two sides of the contact surface.
The matrix size is 1000 µm×1000 µm×500 µm, the inner hole size is 400 µm×400 µm×500 µm, and the insulator size is 1000 µm×1000 µm×20 µm. The Pt thin film is a bending type, with a width of 10 µm, a thickness of 0.2 µm, a spacing of 10 µm, a single strip length of 200 µm, and a total resistance of 112.98 Ω.
The temperature measurement principle of the Pt thin film temperature sensor is that the Pt resistance value is linearly related to the temperature, a fixed voltage is applied at both ends of the Pt thin film, and the Pt resistance can be calculated by measuring the current [36]. When the external temperature changes, the resistance of the Pt thin film changes, which causes the current in the circuit to change. Then, the Pt thin film temperature (ambient temperature) can be obtained by measuring the current. Equation (2) shows the relationship between resistance and temperature, Equation (3) is the relationship between current and resistance under certain voltage, and Equation (4) is the change of current with temperature,
where, is the resistance value of the Pt thin film, is the resistance value of Pt thin film at 0 ℃, is the temperature coefficient of Pt resistance, is the ambient temperature, and is 0 ℃.
3. Theoretical analysis and simulation model of temperature error
In this paper, the error correction method of the near space temperature measurement process was proposed through theoretical analysis of Joule heat, radiation heat and aerodynamic heat generated by the temperature sensor in the working process, and simulated using COMSOL and ANSYS software. The error model was obtained from the simulation results and the sensor structure was optimized. The actual detection data was compensated for temperature error to achieve higher measurement accuracy. This error correction method can be applied to the in-situ measurement of temperature in near space.
3.1. Joule heat
The Pt thin film sensor will generate Joule heat when it works, and the magnitude of Joule heat is related to the applied voltage and the Pt thin film resistance. In order to improve the sensitivity of the sensor, it is necessary to increase the resistance value of Pt thin film. When the temperature changes, the greater the resistance change value is, and the greater the current change value is, the more sensitive the sensor is. Equation (5) is the relationship between the current change and resistance value,
where, is the current variation value, is the voltage variation value.
However, the larger the resistance value, the larger the volume of Pt thin film, which leads to the larger sensor volume and Joule heat. Therefore, considering comprehensively, the resistance value of the Pt thin film was set to about 100 Ω(0 ℃). The Joule heat of the sensor was also analyzed to obtain the measurement error and response time of the temperature sensor under the co-effect of rated voltage and heat dissipation.
To analyze the influence of different mechanical structures on the performance of the temperature sensor, six insulator structures have been designed, as Figure 3 shows. To study the influence of environment temperature on Joule heat, during the Joule thermal simulation of the temperature sensor, a voltage of 0.04 V was applied to both ends of the Pt thin film, and the ambient temperature was set at 233.15 K, the absolute pressure was set at 50 Pa, the wind speed was 100 m/s, and the initial temperature of the sensor was set at 228.15 K and 238.15 K, respectively. The response time and Joule heat of six kinds of sensors were compared to select the best insulator. The response time of the temperature sensor is represented by τ, and τ refers to the time required for the output change of the temperature sensor to reach 63.2% of the difference between its initial final value [37].
The Joule heat of the sensor has been analyzed to obtain the temperature variation and response time of the temperature sensor under the combined effect of rated voltage and heat dissipation. The electrical load of the Pt thin film was determined prior to probing, the Joule heat generated by the current during probing was certain, and the air pressure further influences the temperature value of the Pt thin film by affecting the heat transfer coefficient. The equations for heat dissipation and Joule heat of a Pt thin film are as follows:
where is the heat dissipated, is the contact area between the Pt thin film and the air, is the heat transfer coefficient between them, is the temperature difference between the two sides of the Pt thin film-air interface, is the joule heat, and is the unit time.
Thus, the amount of heat gain in the Pt thin film due to Joule heat is expressed as Equation (8):
Then the value of the temperature increase of the Pt thin film is:
where is the temperature rise of the Pt thin film due to Joule heat, is the thermal increment of the Pt thin film due to Joule heat, is the specific heat capacity of the Pt thin film, and is the mass of the Pt thin film.
Therefore, the initial temperature of the sensor was set to 231.15 K and the ambient temperature to 233.15 K. The temperature sensor was simulated and analyzed at ambient pressures of Pa, Pa, Pa, Pa, Pa and Pa to compare the differences in steady-state time and response rate.
3.2. Solar radiation
When the temperature sensor conducts in-situ measurements in near space, the Pt thin film will receive direct solar radiation and scattered radiation from the surrounding environment, which can transfer heat energy.
The formula for calculating the radiation heat flux of an object is:
where is the emissivity of the object, and its value is 0~1, is the irradiated surface area, is the Stephen-Boltzmann constant, which is , is the thermodynamic temperature of the blackbody.
Thus, the amount of heat gain in the Pt thin film due to radiation heat is expressed as Equation (11):
Then the value of the temperature increase of the Pt thin film is:
where is the temperature rise of the Pt thin film due to Joule heat, is the thermal increment of the Pt thin film due to Joule heat.
For the purpose of reducing the influence of radiation on the temperature sensor, the surface emissivity of the sensor can be changed. The surface emissivity of the silicon substrate and the silicon dioxide insulation layer is above 0.5, so the material surface was coated with radiation protection, and the coating structure is shown in Figure 1. So as to analyze the influence of different anti-radiation coatings on the radiation temperature rise, the influence of different coatings on sensor temperature was studied. Copper, aluminum and silver were selected as radiation-proof materials, and their surface emissivity is 0.03, 0.02 and 0.01 respectively. The atmospheric temperature was set at 233.15 K, the initial temperature of the sensor was 238.15 K, the ambient air pressure was 50 Pa, the wind speed was 100 m/s, and the solar radiation was set to 500 W/m2, 1000 W/m2, 1500 W/m2 and 2000 W/m2 to study the effect of radiation magnitude on the temperature rise of the temperature sensor. Similarly, different air pressures affect the Pt thin film heat dissipation, which further affects the temperature error generated by radiation. Therefore, the temperature rise of the sensor under different air pressure conditions of Pa, Pa, Pa, Pa, Pa and Pa was studied.
3.3. Aerodynamic heat
Based on the Joule and radiant heat simulation analysis above, the sensor scheme was determined and further optimization of the sensor arrangement was carried out based on the aerodynamic thermal analysis of the model. The aerodynamic heat is caused by the positive work of air compression on the front of the object, so the aerodynamic heat generated at the front of the object is larger, but the parts around the object also have airflow disturbances that generate a certain temperature difference. Therefore, ANSYS software was used to analyze the aerodynamic heat of the radiosonde and sensor to explore the distribution of the aerodynamic heat field [17]. Therefore, a cuboid flow field was applied outside the sensor to form a fluid boundary. The boundary conditions were determined by selecting the mathematical model. The K-epsilon standard model was selected for the turbulence model, and the SIMPLE algorithm was used to solve the pressure field and velocity field. In this study, the unstructured meshes of the sensor's geometric model were generated using the meshing software ICEM. Considering the calculation amount and calculation accuracy, the size of the airfield outside the sensor was set to 10 mm×10 mm×15 mm, and the sensor was placed in the middle of the front end of the fluid area. The overall calculation model is shown in Figure 4. For the setting of boundary conditions, the left end of the front end of the air domain was the velocity inlet boundary, the left end was the pressure outlet boundary, the four sides were the pressure far-field boundary, and the outer surface of the sensor was set as the fixed wall boundary.
The high-speed movement of the sensor in the near space will compress the front air. This positive pressure will cause the gas to compress and deform, and the gas will move toward the center under the action of external forces. Therefore, the sensor will do positive work on this part of the gas, which will raise the gas temperature. Aerodynamic heat generated on rockets and other aircraft exceeds 1000 K [38,39]. In the simulation of the sensor falling with the radiosonde by ANSYS software, it is found that this aerodynamic heat can make the gas temperature rise by tens of degrees or even hundreds of degrees. The magnitude of aerodynamic heat is related to the rate of descent of the object, i.e., to the relative flow rate of air, and also the atmospheric pressure affects the specific heat capacity of air, which also affects the size of aerodynamic heat. Firstly, the thermal field distribution of the radiosonde and sensors are studied by simulating the aerodynamic thermal field distribution at different altitude locations during the radiosonde's descent for sensor placement. Then, its effect on the aerodynamic heat of the radiosonde and sensor is studied by setting different air pressure ( Pa, Pa, Pa, Pa, Pa and ) and relative air flow rate (100 m/s, 150 m/s, 200 m/s, 250 m/s and 300 m/s). To reduce the computational effort, the whole model is simplified from a three-dimensional model to a two-dimensional model.
By setting different air pressures and relative air flow rates to study their effects on the aerodynamic heat of the radiosonde or sensor.
The aerodynamic heat error model is shown in Equation (13):
where, is the aerodynamic thermal correction error, is the temperature correction coefficient, is the relative air velocity, and is the air isobaric specific heat capacity.
3.4. Overall model
The temperature error model in the proximity space includes the measured temperature values of the temperature sensors and the Joule heat, radiant heat and aerodynamic heat error values caused by external disturbances. The real temperature value of the atmosphere can be obtained by eliminating the temperature error value caused by disturbance factors from the measured temperature value of the temperature sensor. Therefore, the temperature error model is constructed, where the measured value of the temperature sensor is expressed as:
where and are the measured data of two temperature sensors.
According to the definition, the near-space temperature T is calculated as shown in Equation (15) and (16):
4. Results and discussion
4.1. Joule heat
4.1.1. The effect of different insulators on Joule thermal errors
Figure 5 shows the temperature change curve of Pt thin film for sensors with different insulator structures when the initial temperatures are 228.15 K and 238.15 K respectively. Accordingly, the temperature corresponding to the response time is 231.31 K and 234.99 K respectively. It can be seen from the figure that all curves change sharply at first and then slowly, and the final temperature approaches a steady state, which is higher than the ambient temperature. As the sensor number increases, the final temperature decreases and the response time is longer.
This is because the Joule heat causes the final temperature of the Pt thin film to be greater than the ambient temperature. As can be seen from the graph, temperature sensor 5 has the fastest temperature change of the Pt thin film, followed by sensor 4, sensor 3, sensor 2, and sensor 1. This is because the heat exchange between the Pt thin film and the silica is faster than that with the air, and the large surface area of the silica makes it more fully heat exchange with the air, so the larger the area of the silica, the faster its temperature response. However, sensor 6 is the slowest, this is because the silica layer is not provided with an insulating groove, the heat capacity of the entire sensor is large and the temperature change of the Pt thin film through solid heat transfer is very slow. On balance, the 5th temperature sensor is chosen to shorten the response time of the temperature sensor and improve the measurement accuracy of the sensor. As shown, under the influence of Joule heat, sensor 5 has a response time of 20 ms during warming and 99 ms during cooling.
4.1.2. The effect of air pressure on the temperature measurement process of the temperature sensor
The temperature sensor of insulator No.5 was selected for simulation tests in this scenario. The initial temperature of the sensor was 231.15 K and the ambient temperature was set to 233.15 K. The temperature sensor was simulated and analyzed at air pressure environments of Pa, Pa, Pa, Pa, Pa and Pa to compare the difference in steady state time and response speed. The results are shown in Figure 6, as the air pressure increases, the response rate of the temperature sensor becomes faster and the steady state temperature is closer to the ambient temperature. Therefore, the higher the altitude and lower the air pressure, the less effective the heat transfer and the greater the temperature error value.
4.2. Solar radiation
4.2.1. The effect of different coatings on radiant heat errors
After simulation analysis, as shown in Figure 7, when the surface emissivity of the radiation-proof material is smaller, the less it is affected by solar radiation, and the thermal conductivity of the coating material also affects the heat exchange rate of the sensor. The radiation errors of the sensor using silver, aluminum and copper as radiation-proof coatings were 0.05 K, 0.10 K and 0.14 K at 1 s. Therefore, silver was used as the radiation-proof material for this sensor.
4.2.2. The effect of radiation conditions on radiant heat errors
The effect of radiation on the temperature rise of the sensor can be derived by simulating a comparative analysis with the sensor without radiation conditions at an ambient temperature of 233.15 K. The ambient air pressure was 50 Pa, the wind speed was 100 m/s, and the initial temperature of the temperature sensor was 236.15 K, and the radiation values are 0 W/m2, 500 W/m2, 1000 W/m2, 1500 W/m2, and 2000 W/m2.
Figure 8 shows the temperature variation of the Pt thin film under five different radiation conditions. It can be seen from the figure that the temperature of the Pt thin film increases as the amount of radiation increases. For example, the temperature of Pt thin film under 5 different radiation conditions at 600 ms is 233.39 K, 233.42 K, 233.46 K, 233.49 K, 233.53 K. This is because the greater the radiation, the greater the radiation heat generated by the Pt thin film.
4.2.3. The effect of different air pressures on radiant heat errors
The effect of solar radiation on the temperature rise of the sensor under different air pressure conditions during the soundings from high to low altitudes was also analyzed. The ambient temperature was set at 233.15 K, the air speed was 100 m/s, the initial temperature of the temperature sensor was 238.15 K, and the solar radiation was 1000 W/m2. The air pressure was set to Pa, Pa, Pa, Pa, Pa and Pa.
As can be seen from the Figure 9, the temperature of the sensor is first falling sharply and then slowly, in the first section with the increase in air pressure sensor temperature drop rate increases, in the second section with the increase in air pressure sensor temperature drop rate decreases, and the steady-state temperature difference is getting smaller and smaller. Overall, the steady-state temperature is closer to the ambient temperature as the air pressure increases over a certain time period, i.e. the temperature error decreases.
Similarly, as can be seen from Figure 10, the temperature of the sensor is first rising sharply and then slowly, in the first section with the increase in air pressure sensor temperature drop rate increases, in the second section with the increase in air pressure sensor temperature rise rate decreases, and the steady-state temperature difference is getting smaller and smaller. Overall, the steady-state temperature is closer to the ambient temperature as the air pressure rises over a certain period of time, i.e. the temperature error decreases.
Therefore, the higher the altitude and the lower the air pressure, the less effective the heat transfer and the greater the temperature error value.
4.3. Aerodynamic heat
When the radiosonde is equipped with a temperature sensor for temperature in-situ measurement in near space, the radiosonde is dropped when it reaches a certain position along with the space-based platform and accelerates to descend under the action of gravity. Through Matlab software simulation, when dropping at a height of 70 km, the initial speed was set as 100 m/s, and the change in the falling speed of the radiosonde as shown in Figure 11.
It can be seen from the figure that the speed of the radiosonde reaches the maximum at 61.72 km, which is 310.35 m/s, and then the speed gradually decreases. Table 1 shows the velocity, atmospheric temperature, air pressure and other parameters during the fall of the sounding device using Matlab.
ANSYS Fluent was used to analyze and study the aerodynamic thermal field generated by the radiosonde during its high-speed descent. According to the environmental parameters at different altitudes in Table 1, the aerodynamic thermal field distribution of the radiosonde at different altitudes was studied, and the altitudes of 60000 m, 50000 m, 40000 m and 30000 m were selected as the study objects.
4.3.1. Aerodynamic heat field distribution at different altitudes
The results of the analysis of the aerodynamic thermal field distribution of the radio soundings at different altitudes were shown in Figure 12, where the blank is the radiosonde, from which it can be seen that the temperature rises in front of the radiosonde is the largest due to aerodynamic heat. For example, in Figure 12a, the temperature in front of the radiosonde is 290.71 K with an error of +45.264 K. The temperature of the outer wall behind and around the radiosonde is 248.21 K with an error value of +2.76 K. Meanwhile, the temperature of some areas outside the side decreases to 199.92 K, resulting in a large temperature error of -45.53 K. At the same time, the aerodynamic thermal analysis is carried out for the temperature sensor. As shown in Figure 13a, the blank is the sensor, and the temperature around the sensor is different (Point 1, 292.11 K; Point 2, 274.42 K; Point 3, 281.32 K; Point 4, 281.35 K). In other words, the aerodynamic heat behind the temperature sensor is very small, so the temperature sensor is placed in the front of the radiosonde, the Pt film end is backward, and the two temperature sensors are symmetrically arranged to achieve uniform force on the sounder.
4.3.2. The effect of different air pressures on aerodynamic heat errors
To investigate the effect of different air pressures and relative flow rates on the aerodynamic heat of the sounder, different air pressures and air speeds were set to investigate the magnitude of the aerodynamic heat.
For the study of the effect of air pressure on aerodynamic heat, the ambient temperature was set to 233.15 K, the airflow rate was set to 200 m/s and the air pressure was set to Pa, Pa, Pa, Pa, Pa and Pa respectively, as shown in Figure 14.
Figure 14 shows that as the air pressure increases exponentially, the temperature at the two points rises rapidly and then slowly. This is because at low pressure, the magnitude of the pressure affects the magnitude of the specific heat capacity of the air, the greater the pressure, the greater the specific heat capacity of the air and the more aerodynamic heat is generated. In addition, the greater the air pressure, the smaller the change in the compression ratio of the gas ahead, and thus the smaller the change in aerodynamic heat, so the curve tends to be smooth.
4.3.3. The effect of different relative air speeds on aerodynamic heat errors
For the study of the effect of the relative air flow rate on aerodynamic heat, the ambient temperature was set to 233.15 K, the air pressure was set to 5 Pa and the airflow rates were set to 100m/s, 150 m/s, 200 m/s, 250 m/s and 300 m/s, respectively.
As shown in Figure 15, as the air velocity increases, the temperature at the two points then rises and the rate of warming increases. This is because the greater the air flow rate, the greater the aerodynamic heat, and according to the aerodynamic thermal error model it can be seen that the aerodynamic thermal error is proportional to the square of the relative air flow rate, so the slope of the curve increases.
From the above analysis, it can be seen that aerodynamic heat has the greatest effect on the temperature error, followed by the temperature error caused by Joule heat, and solar radiation has the least effect on the sensor temperature error. The detection temperature was corrected by the error model formula, and the correction was the sum of the thermal errors of aerodynamic heat, solar radiation and Joule heat, which greatly improves the accuracy of the temperature.
4.4. Overall analysis
Temperature sensor in the actual measurement of proximity space temperature, through the collection of other physical quantities of information, the temperature sensor’s measurement error (Joule heat, radiation heat, aerodynamic heat) can be calculated. Among them, due to the high-speed motion of the radiosonde, the sensor temperature rise caused by aerodynamic heat up to tens of Kelvins, which is the most influential factor in the three temperature errors. In addition, as a result of the presence of the radiation-proof layer, the temperature rise caused by the large solar radiation of 2000 W/m2 is much less than 1.00 K. Therefore, using the constructed temperature error model, the real atmospheric temperature value can be accurately calculated by the actual measured temperature value.
5. Conclusions
In response to the problems of existing methods, a method to achieve in-situ high-accuracy detection of temperature in near space was proposed by analyzing the actual measurement environment. By designing a new type of temperature sensor and analyzing the sources of error in the actual measurement process and its influencing factors, high-precision temperature values were obtained by means of a temperature error compensation method. The conclusions are as follows.
- (1)
- The temperature sensor has a micro-bridge structure and uses silver as the radiation-proof coating with a small response time. The sensor has a response time of 20 ms when heating up and 99 ms when cooling down under the influence of Joule heat. The choice of silver as the radiation-proof coating, with small radiation heat error, improves the measurement accuracy of the temperature sensor.
- (2)
- According to the optimized near space temperature error model, the resulting temperature measurement errors include aerodynamic heat, solar radiation and Joule heat. Aerodynamic heat has the greatest effect on temperature error, and solar radiant heat has the least effect.
- (3)
- The aerodynamic thermal error at the front end of the radionsonde is the largest, and the temperature error at the rear end is the smallest. The temperature sensor is arranged at the front end of the radiosonde. The aerodynamic thermal error of the front end of the sensor is the largest, the rear end has the smallest temperature error, and the Pt thin film is installed at the rear end of the sensor.
- (4)
- As the air pressure increases there will be the following changes: the response rate of the temperature sensor increases and the steady-state temperature is closer to the ambient temperature, i.e. the temperature error decreases. The temperature of the sensor rises rapidly and then slowly.
- (5)
- As the relative flow rate of air increases, the temperature of the sensor increases, and the rate of temperature rise increases.
- (6)
- Through the establishment of the temperature error model, the accuracy of obtaining the temperature value of near space can be greatly improved.
Author Contributions
Conceptualization and methodology, G.W. and C.H.; software, G.W. and F.C.; validation, G.W. and X.Y.; investigation, G.W.; writing—original draft preparation, G.W.; writing—review and editing, G.W.; visualization, G.W.; Supervision, D.Z; funding acquisition, D.Z. All authors have read and agreed to the published version of the manuscript.
Funding
This research was funded by the National Natural Science Foundation of China (Grant No.61827901; No. 62088101; No. 62203056) and the National Key R&D Program of China under grant No. 2021YFB3201502.
Institutional Review Board Statement
Not applicable.
Informed Consent Statement
Not applicable.
Data Availability Statement
Not applicable.
Conflicts of Interest
The authors declare no conflict of interest.
References
- Roney, J.A. Statistical wind analysis for near-space applications. J. Atmos. Solar-Terr. Phys. 2007, 69, 1485–1501. [Google Scholar] [CrossRef]
- Azadi, M.; Popov, G.A; Lu, Z.; Eskenazi, A.G.; Bang, A.J.W.; Campbell, M.F.; Hu, H.; Bargatin, I. Controlled levitation of nanostructured thin films for sun-powered near-space flight. Sci. Adv. 2021, 7, eabe1127. [Google Scholar] [CrossRef] [PubMed]
- Wang, W.Q.; Cai, J.; Peng, Q. Near-space microwave radar remote sensing: Potentials and challenge analysis. Remote Sens. 2010, 2, 717–739. [Google Scholar] [CrossRef]
- Wang, W.Q. Near-space vehicles: Supply a gap between satellites and airplanes for remote sensing. IEEE Aero. El. Sys. Mag. 2011, 26, 4–9. [Google Scholar] [CrossRef]
- Sun, G.; Li, M.; Wang, Y.; Zhou, K.; Hu, X.; Guo, Z.; Zhu, L. Temperature-compensated fiber-optic online monitoring methodology for 3D shape and strain of near-space airship envelope. Appl. Opt. 2022, 61, 9279–9295. [Google Scholar] [CrossRef]
- He, W.; Wu, K.; Feng, Y.; Chen, Z.; Li, F. The near-space wind and temperature sensing interferometer: forward model and measurement simulation. Remote Sens. 2019, 11, 914. [Google Scholar] [CrossRef]
- Wang, J.X.; Li, Y.Z.; Yu, X.K.; Li, G.C.; Ji, X.Y. Investigation of heat transfer mechanism of low environmental pressure large-space spray cooling for near-space flight systems. Int. J. Heat Mass Transfer 2018, 119, 496–507. [Google Scholar] [CrossRef]
- Wei, Q.; Yang, G.; Liu, G.; Jiang, H.; Zhang, T. Effects and mechanism on Kapton film under ozone exposure in a ground near space simulator. Appl. Surf. Sci. 2018, 440, 1083–1090. [Google Scholar] [CrossRef]
- Kozubek, M.; Laštovička, J.; Zajicek, R. Climatology and long-term trends in the stratospheric temperature and wind using ERA5. Remote Sens. 2021, 13, 4923. [Google Scholar] [CrossRef]
- Li, J.W.; Sheng, Z.; Fan, Z.Q.; Zhou, S.D.; Shi, W.L. Data analysis of upper atmosphere temperature detected by sounding rockets in China. J. Atmos. Ocean. Technol. 2017, 34, 555–565. [Google Scholar] [CrossRef]
- He, Y.; Sheng, Z.; He, M. Spectral analysis of gravity waves from near space high-resolution balloon data in Northwest China. Atmosphere 2020, 11, 133. [Google Scholar] [CrossRef]
- Li, T.; Wang, L.; Chen, R.; Fu, W.; Xu, B.; Jiang, P.; Han, Y. Refining the empirical global pressure and temperature model with the ERA5 reanalysis and radiosonde data. J. Geod. 2021, 95, 1–17. [Google Scholar] [CrossRef]
- Zuo, Z.; Song, J.; Zheng, Z.; Han, Q.L. A survey on modelling, control and challenges of stratospheric airships. Control. Eng. Pract. 2022, 119, 104979. [Google Scholar] [CrossRef]
- Zhou, L.; Sheng, Z.; Fan, Z.; Liao, Q. Data analysis of the TK-1G sounding rocket installed with a satellite navigation system. Atmosphere 2017, 8, 199. [Google Scholar] [CrossRef]
- Burt, S.; Podesta, M.D. Response times of meteorological air temperature sensors. Q. J. R. Meteorol. Soc. 2020, 146, 2789–2800. [Google Scholar] [CrossRef]
- De Jong, S.A.P.; Slingerland, J.D.; Van de Giesen, N.C. Fiber optic distributed temperature sensing for the determination of air temperature. Atmos. Meas. Tech. 2015, 8, 335–339. [Google Scholar] [CrossRef]
- Tang, J.; Xie, W.; Wang, X.; Chen, C. Simulation and analysis of fluid–solid–thermal unidirectional coupling of near-space airship. Aerospace 2022, 9, 439. [Google Scholar] [CrossRef]
- Sun, B.; Oran, E.S. New principle for aerodynamic heating. Natl. Sci. Rev. 2018, 5, 606–607. [Google Scholar] [CrossRef]
- Nursultanov, N.; Heffernan, W.J.B.; van Herel, M.J.W.M.R.; Nijdam, J.J. Computational calculation of temperature and electrical resistance to control Joule heating of green Pinus radiata logs. Appl. Ther. Eng. 2019, 159, 113855. [Google Scholar] [CrossRef]
- Cao, K.; Baker, J. Multimode heat transfer in a near-space environment. Heat Transfer Eng. 2010, 31, 70–82. [Google Scholar] [CrossRef]
- Fan, D.; Chen, X.; Li, Z.; Mei, X. Radiation environment study of near space in China area. In Proceedings of the Remote Sensing of Clouds and the Atmosphere XX, Toulouse, France, 16 October 2015. [Google Scholar]
- Lee, S.W.; Yang, I.; Choi, B.I.; Kim, S.; Woo, S.B.; Kang, W.; Oh, Y.K.; Park, S.; Yoo, J.; Kim, J.C.; et al. Development of upper air simulator for the calibration of solar radiation effects on radiosonde temperature sensors. Meteorol. Appl. 2020, 27, 1855. [Google Scholar] [CrossRef]
- Zhang, B.; Chen, X.; Yuan, J.; Zhu, H. Research on temperature measurement technology of platinum film thermistor. J. Phys.: Conf. Ser. 2021, 1907, 012038. [Google Scholar] [CrossRef]
- Žužek, V.; Batagelj, V.; Bojkovski, J. Determination of PRT Hysteresis in the Temperature Range from −50℃ to 300℃. Int. J. Thermophys. 2010, 31, 1771–1778. [Google Scholar] [CrossRef]
- Chiou, J.A.; Chen, S. Thermal hysteresis analysis of MEMS pressure sensors. J. Microelectromech. Syst. 2005, 14, 782–787. [Google Scholar] [CrossRef]
- Goncalves, S.B.; Palha, J.M.; Fernandes, H.C.; Souto, M.R.; Pimenta, S.; Dong, T.; Yang, Z.; Ribeiro, J.; Correia, J.H. LED optrode with integrated temperature sensing for optogenetics. Micromachines 2018, 9, 473. [Google Scholar] [CrossRef] [PubMed]
- Kandpal, M.; Shirhatti, V.; Singh, J.; Sontakke, B.A.; Jejusaria, A.; Arora, S.P.S.; Singh, S. Experimental study of chromium oxide thin films as an intermediate layer for Pt-based temperature sensor applications. J. Mater. Sci.: Mater. Electron. 2022, 33, 21287–21296. [Google Scholar] [CrossRef]
- Shao, L.; Zhao, X.; Gu, S.; Ma, Y.; Liu, Y.; Deng, X.; Jiang, H.; Zhang, W. Pt thin-film resistance temperature detector on flexible Hastelloy tapes. Vacuum 2021, 184, 109966. [Google Scholar] [CrossRef]
- Huang, M.M.; Zhao, L.B.; Han, X.G.; Jia, C.; Gao, Y.; Fan, S.; Yang, P.; Dong, L.; Jiang, Z.D. MEMS-based Pt film temperature sensor chip on silicon substrate. Meas. Sci. Technol. 2022, 33, 125113. [Google Scholar] [CrossRef]
- Miyakawa, N.; Legner, W.; Ziemann, T.; Telitschkin, D.; Fecht, H. J.; Friedberger, A. Microthruster with integrated platinum thin film resistance temperature detector (RTD), heater, and thermal insulation. In Proceedings of the Smart Sensors, Actuators, and MEMS V, Ulm, Germany, 5 May 2011. [Google Scholar]
- Babita; Pant, U.; Meena, H.; Gupta, G.; Bapna, K.; Shivagan, D.D. Evaluation of self-heating effect in platinum resistance thermometers. Measurement 2022, 203, 111994. [Google Scholar] [CrossRef]
- Han, S.; Liu, Q.; Han, X.; Dai, W.; Yang, J. An E-type temperature sensor for upper air meteorology. Nanotechnol. Precis. Eng. 2018, 1, 145–149. [Google Scholar]
- Philipona, R.; Kräuchi, A.; Romanens, G.; Levrat, G.; Ruppert, P.; Brocard, E.; Jeannet, P.; Ruffieux, D.; Calpini, B. Solar and thermal radiation errors on upper-air radiosonde temperature measurements. J. Atmos. Ocean. Technol. 2013, 30, 2382–2393. [Google Scholar] [CrossRef]
- Lee, S.W.; Park, E.U.; Choi, B.I.; Kim, J.C.; Woo, S.B.; Kang, W.; Park, S.; Yang, S.D.; Kim, Y.G. Compensation of solar radiation and ventilation effects on the temperature measurement of radiosondes using dual thermistors. Meteorol. Appl. 2018, 25, 209–216. [Google Scholar] [CrossRef]
- Farsad, S.; Ardekani, M.A.; Farhani, F. Experimental investigation of aerodynamic effects of probe on heat transfer from hot-wire sensors at vertical and horizontal orientations. Flow Meas. Instrum. 2019, 70, 101642. [Google Scholar] [CrossRef]
- Lacy, F. Using nanometer platinum films as temperature sensors (constraints from experimental, mathematical, and finite-element analysis). IEEE Sens. J. 2009, 9, 1111–1117. [Google Scholar] [CrossRef]
- Wales, M.D.; Clark, P.; Thompson, K.; Wilson, Z.; Wilson, J.; Adams, C. Multicore fiber temperature sensor with fast response times. OSA Continuum 2018, 1, 764–771. [Google Scholar] [CrossRef]
- Dimitrienko, Y.; Zakharov, A.; Koryakov, M. Coupled problems of high-speed aerodynamics and thermomechanics of heat-shielding structures. J. Phys.: Conf. Ser. 2018, 1141, 012094. [Google Scholar] [CrossRef]
- Wu, D.; Wu, S.; Wang, Y.; Gao, Z.; Yang, J. High-speed and accurate non-linear calibration of temperature sensors for transient aerodynamic heating experiments. Trans. Inst. Meas. Control 2014, 36, 845–852. [Google Scholar] [CrossRef]
Figure 1.
Structure diagram of Pt thin film temperature sensor.
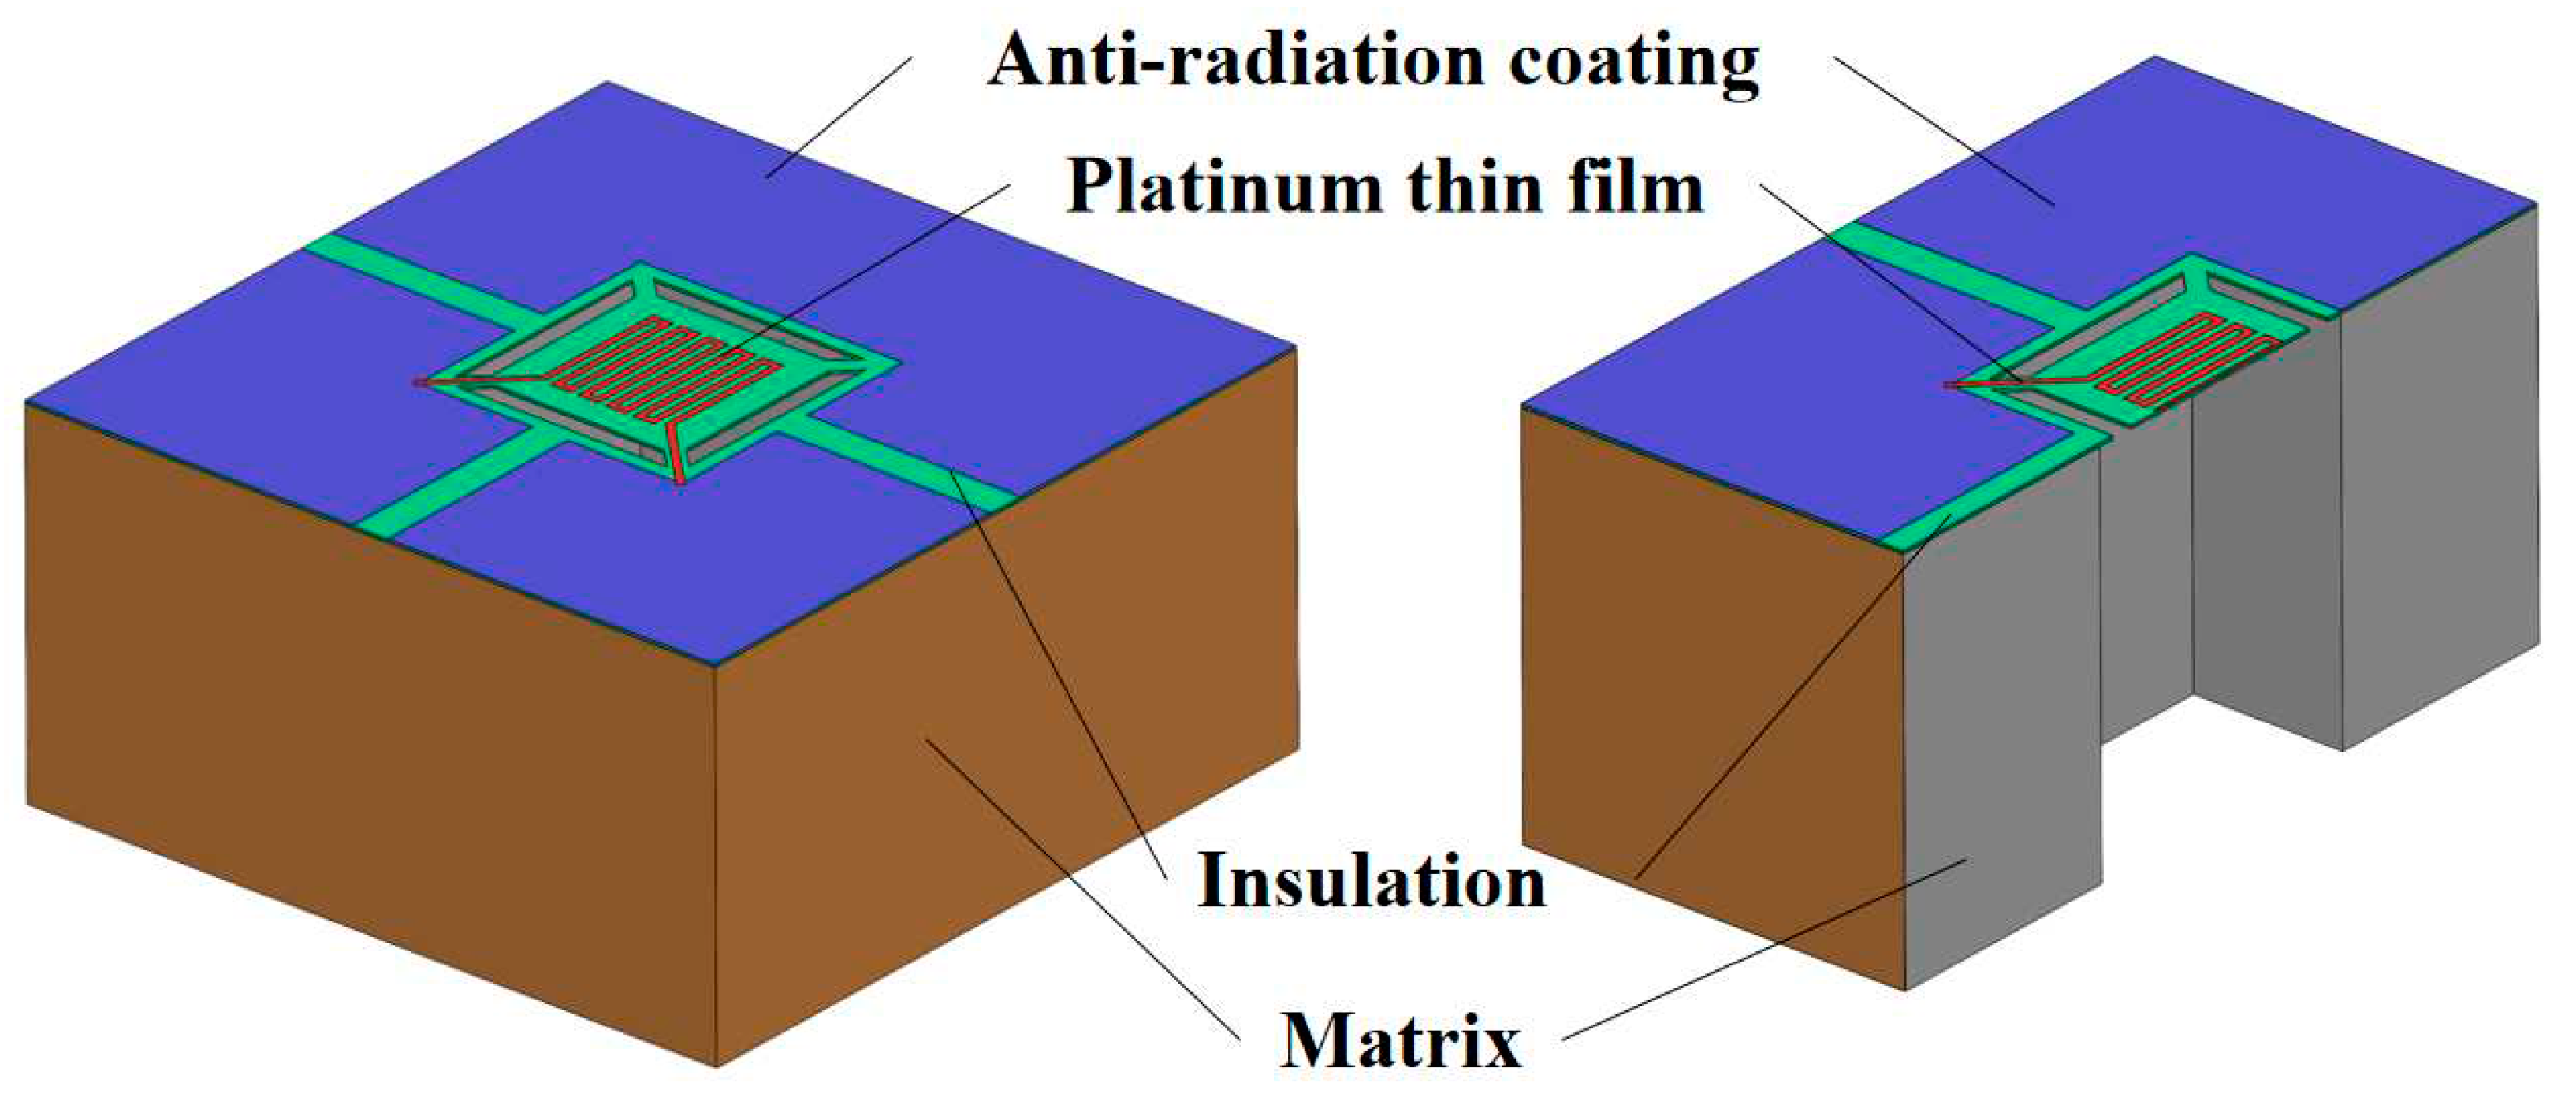
Figure 2.
Pt thin film structure and sensor structure.
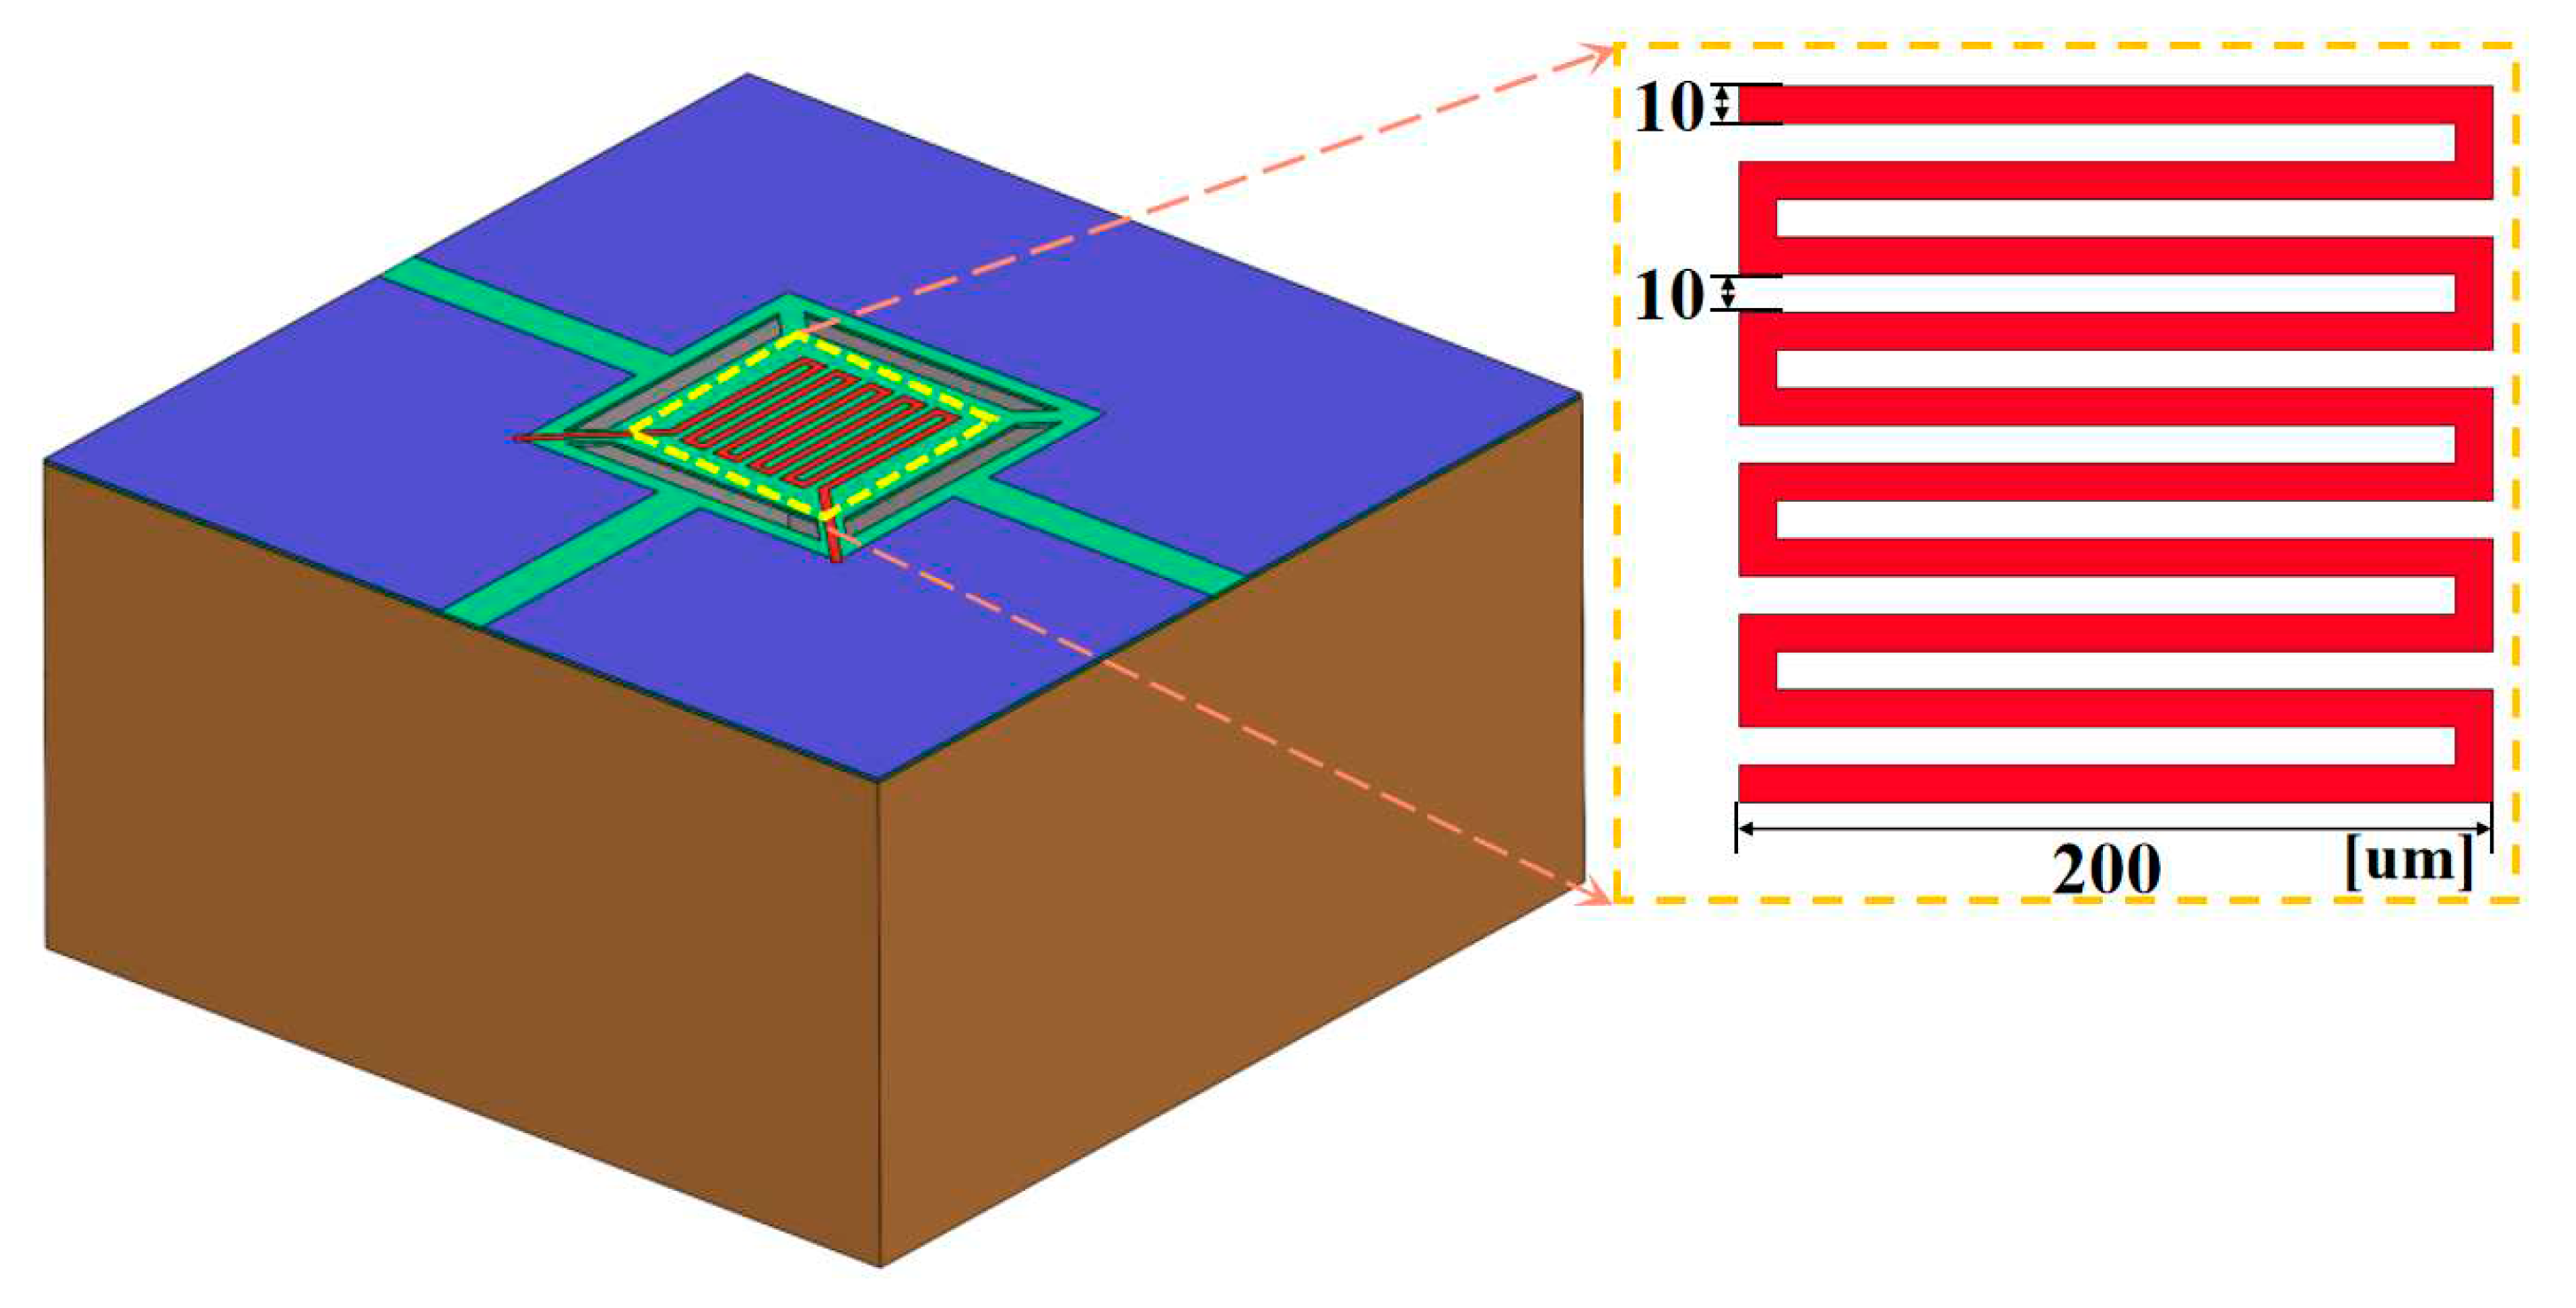
Figure 3.
Different insulator structures.
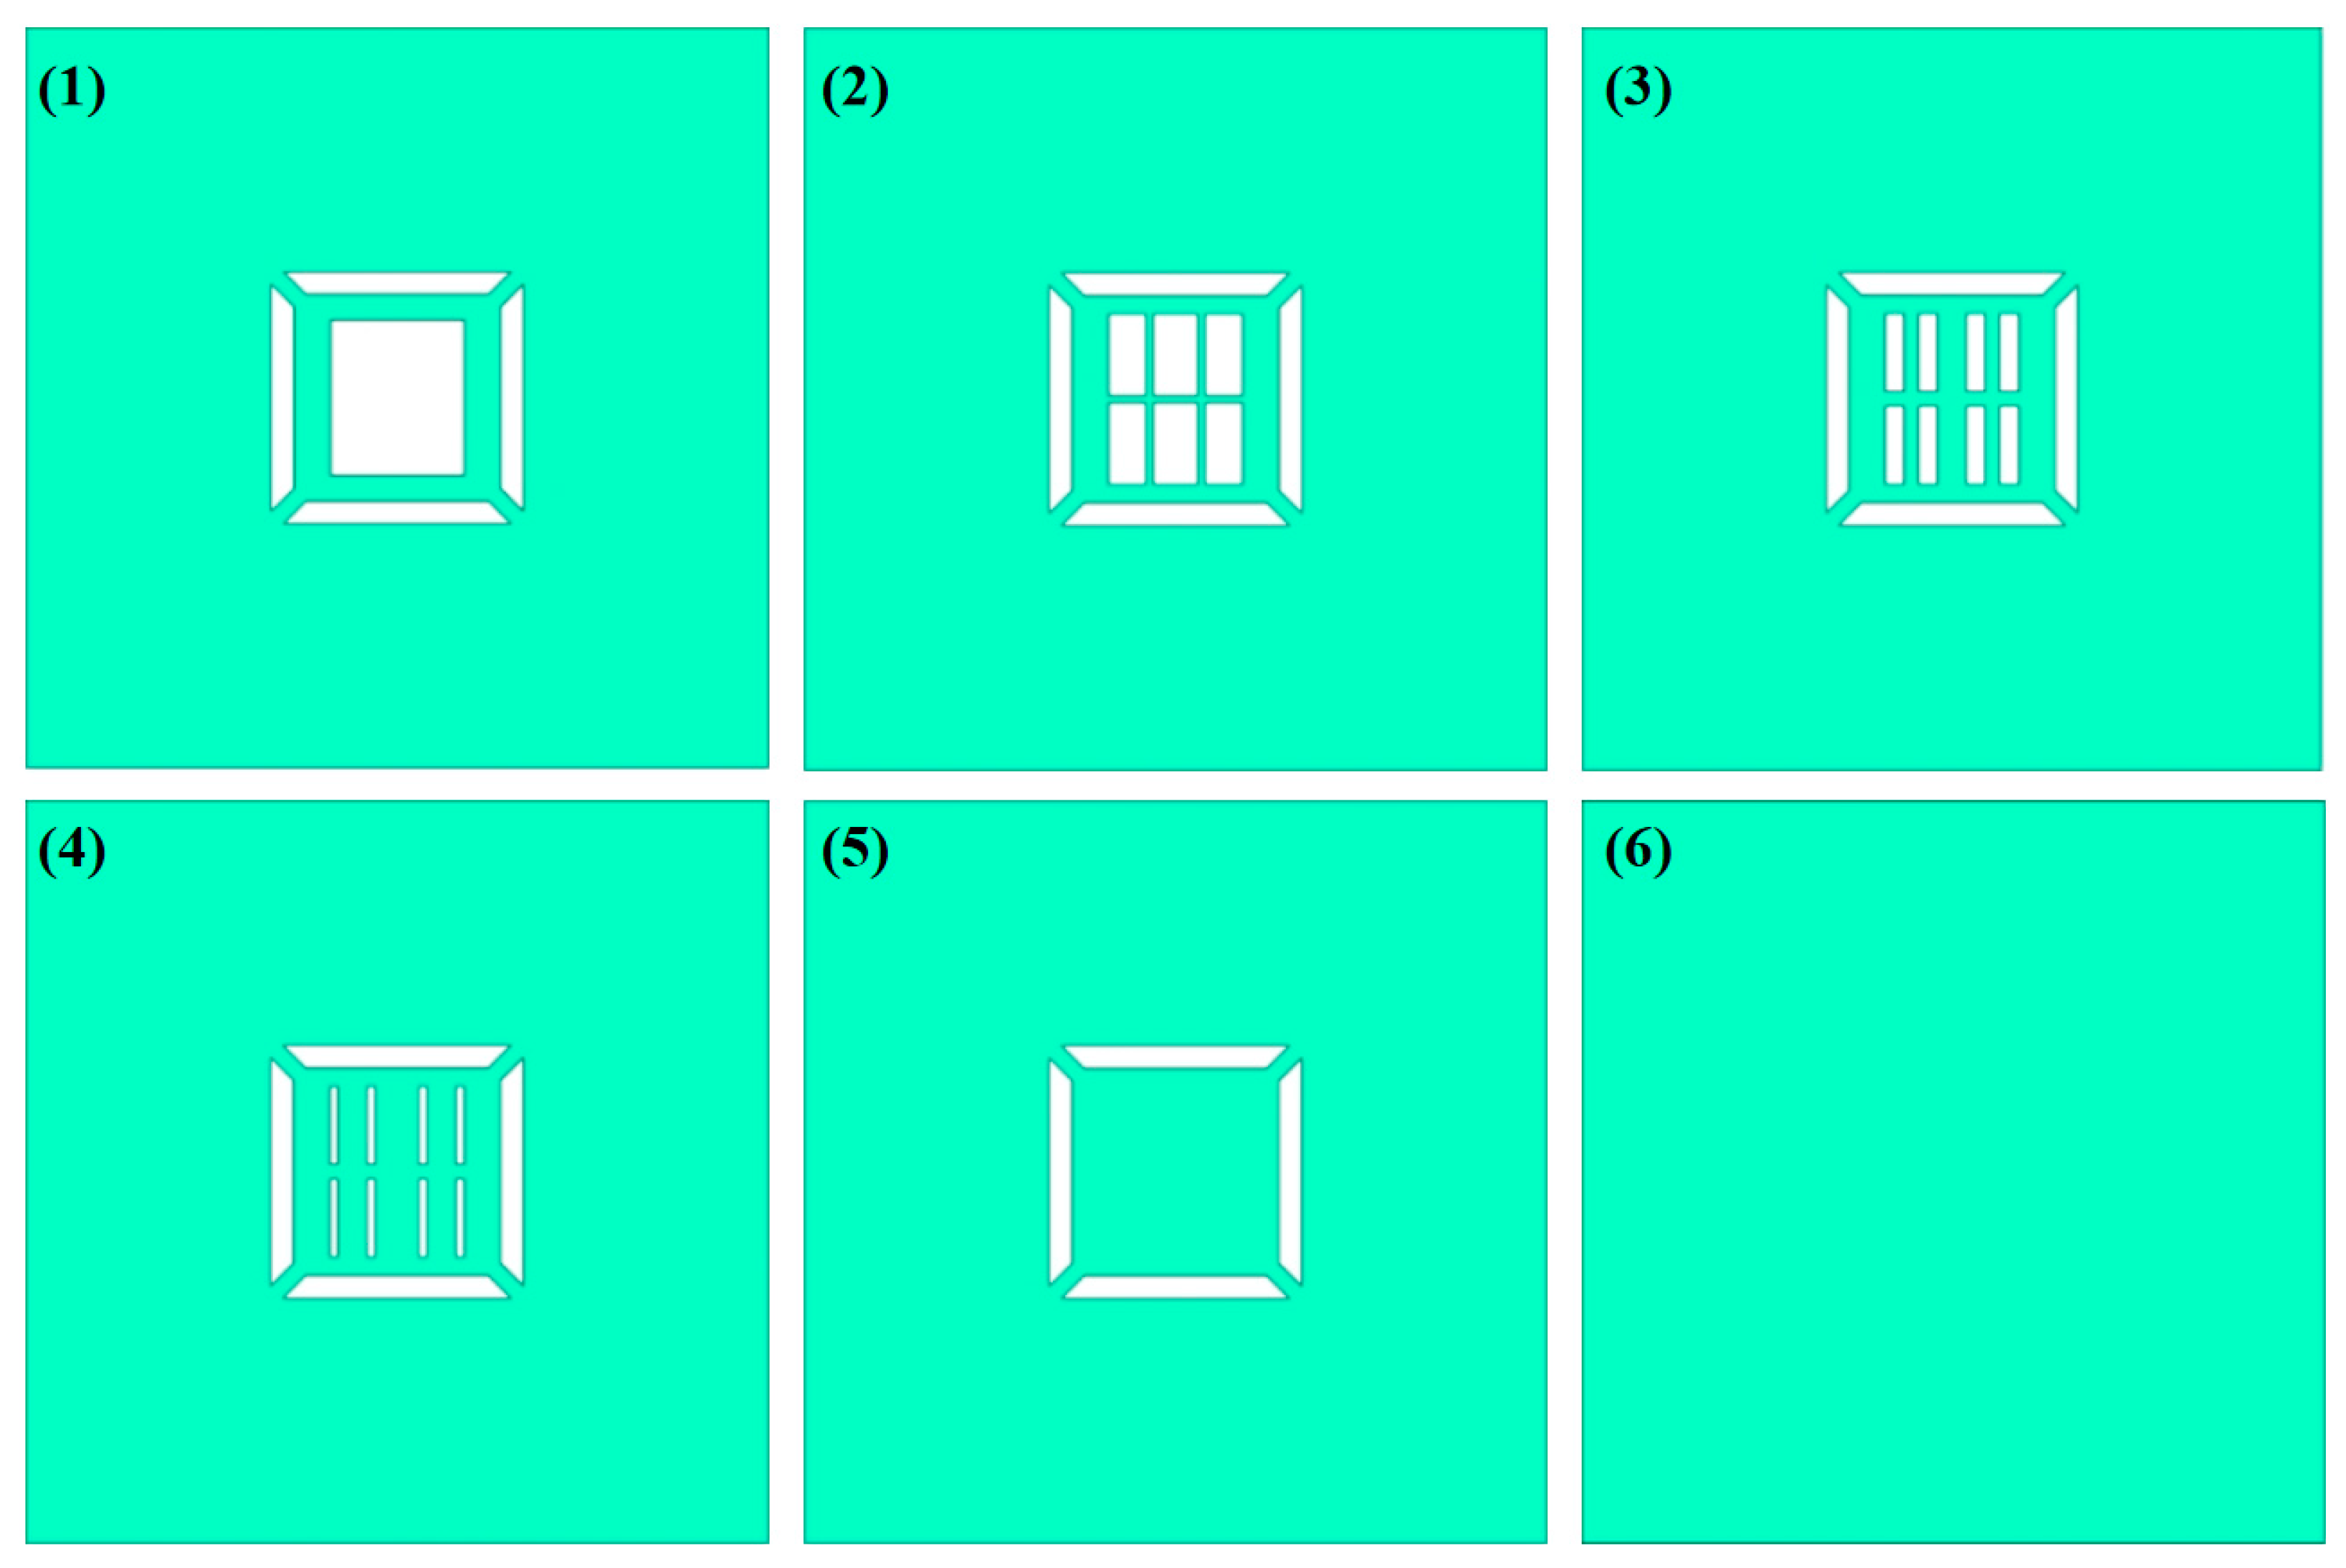
Figure 4.
Sensor and air flow field model.
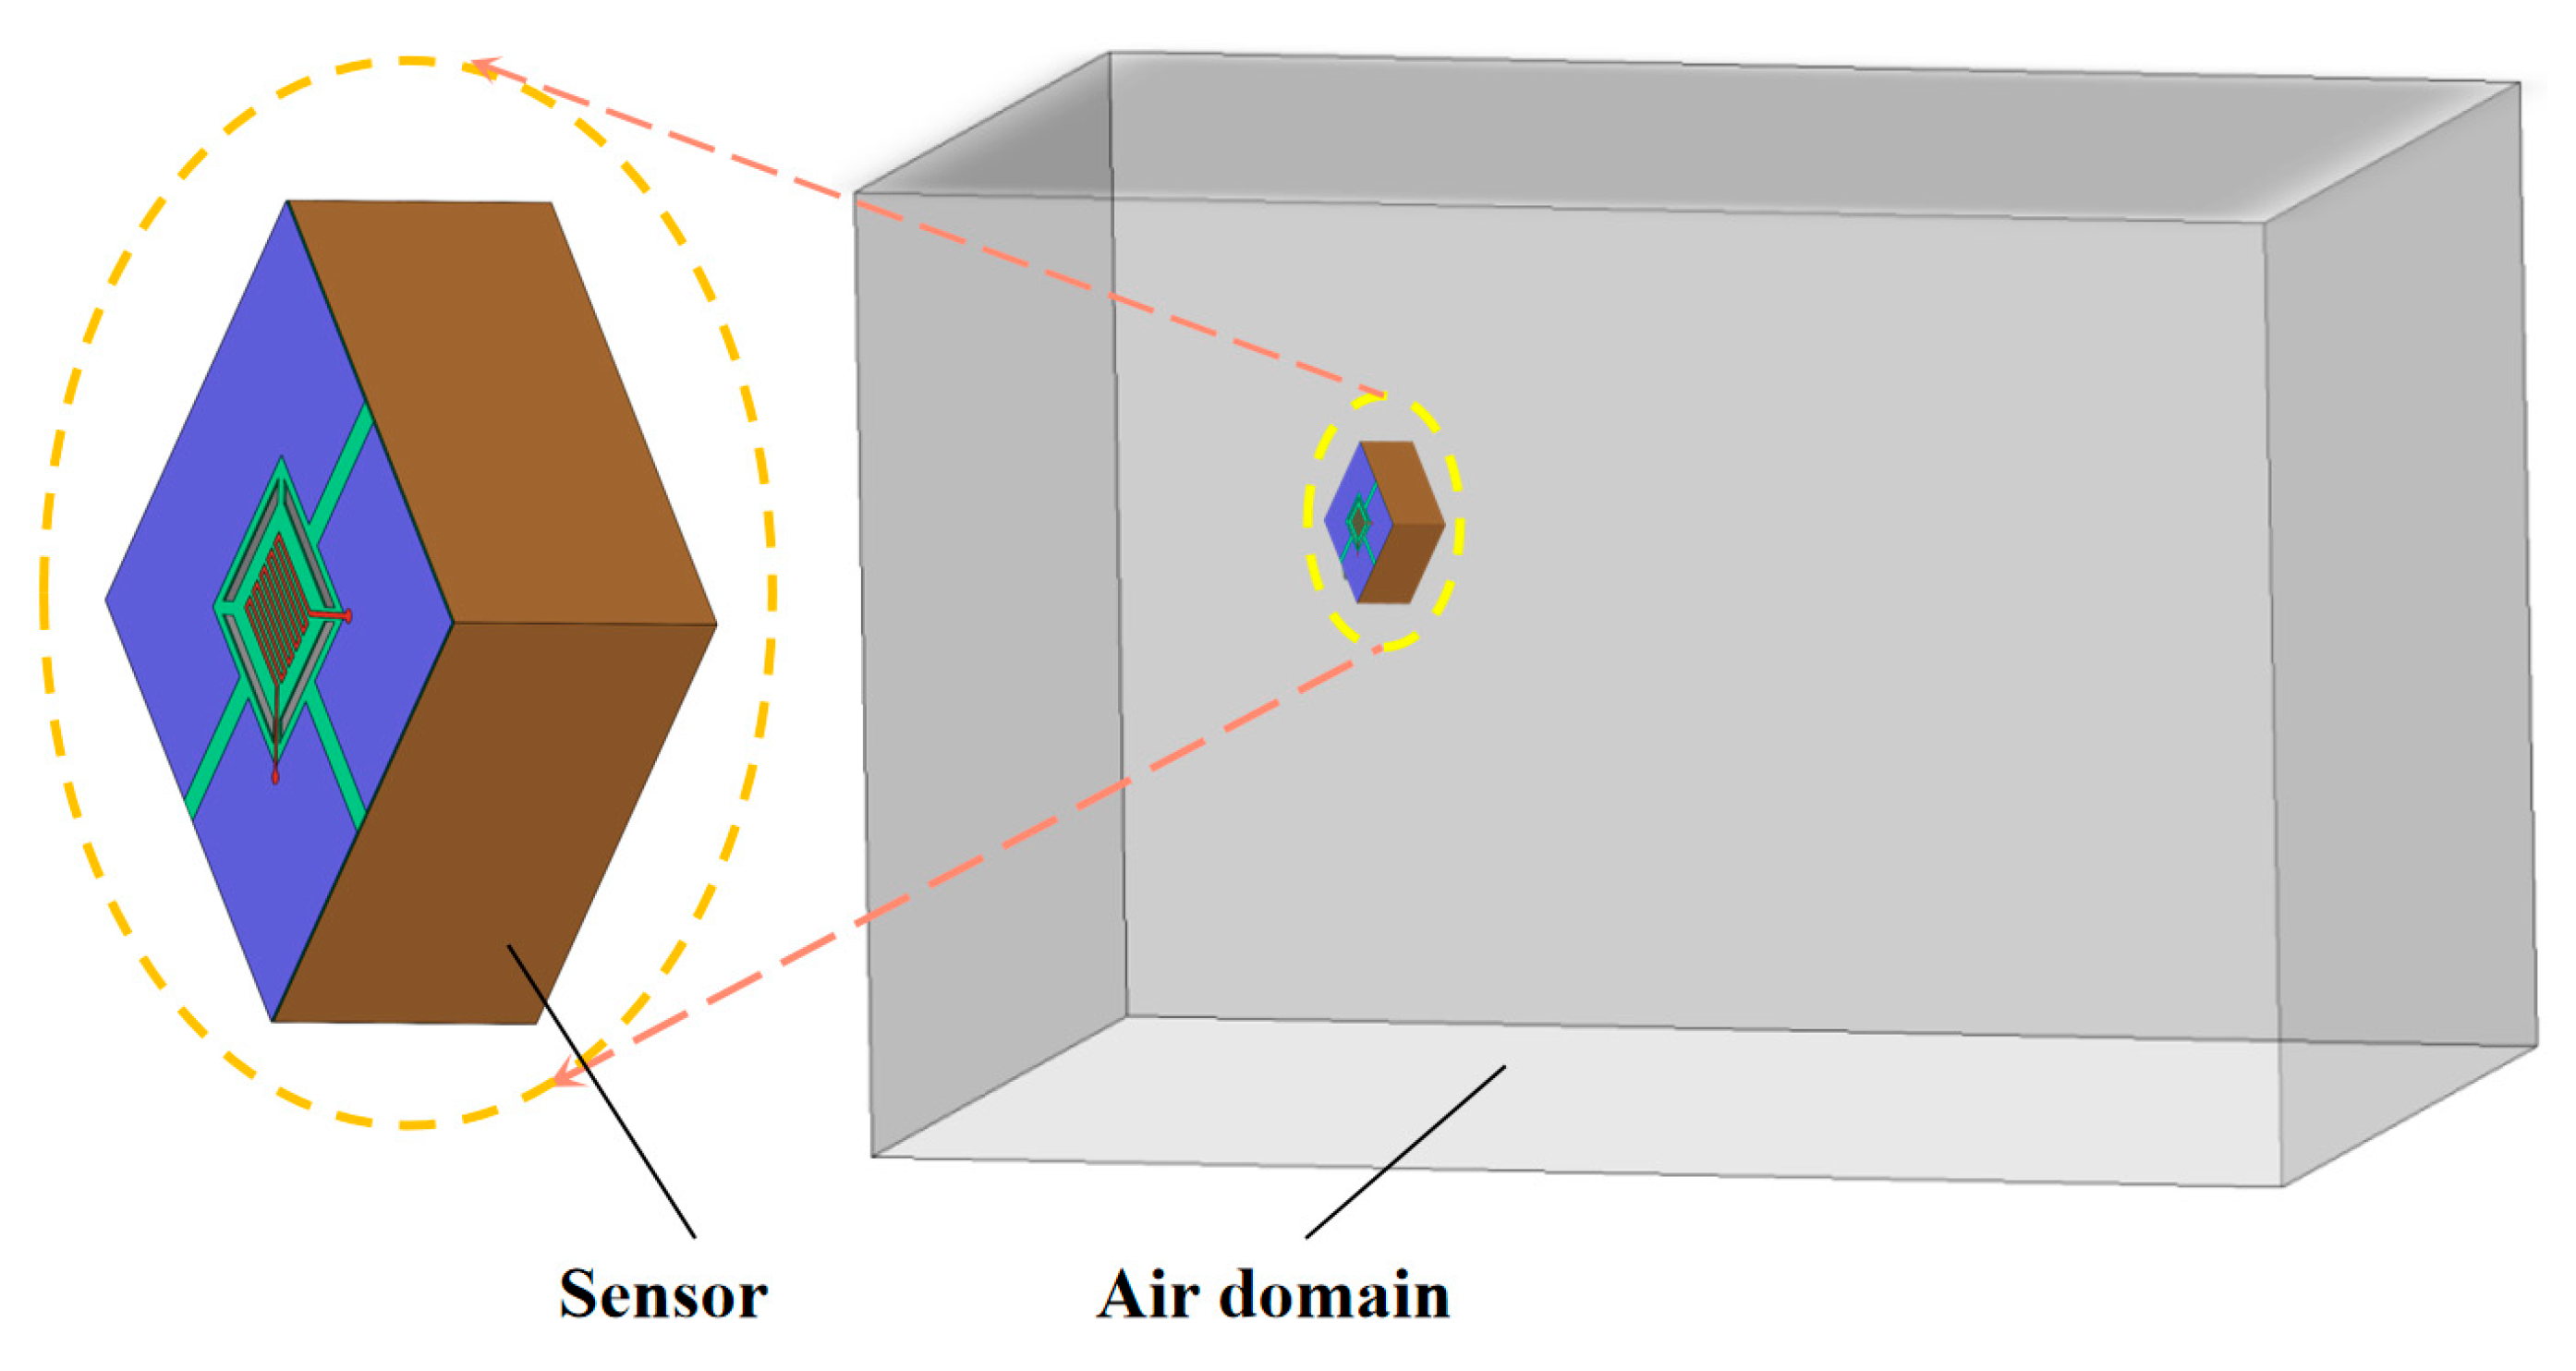
Figure 5.
Temperature variation curves of Pt thin film for sensors with different insulator structures at initial temperatures of (a) 228.15 K, and (b) 238.15 K.
Figure 5.
Temperature variation curves of Pt thin film for sensors with different insulator structures at initial temperatures of (a) 228.15 K, and (b) 238.15 K.
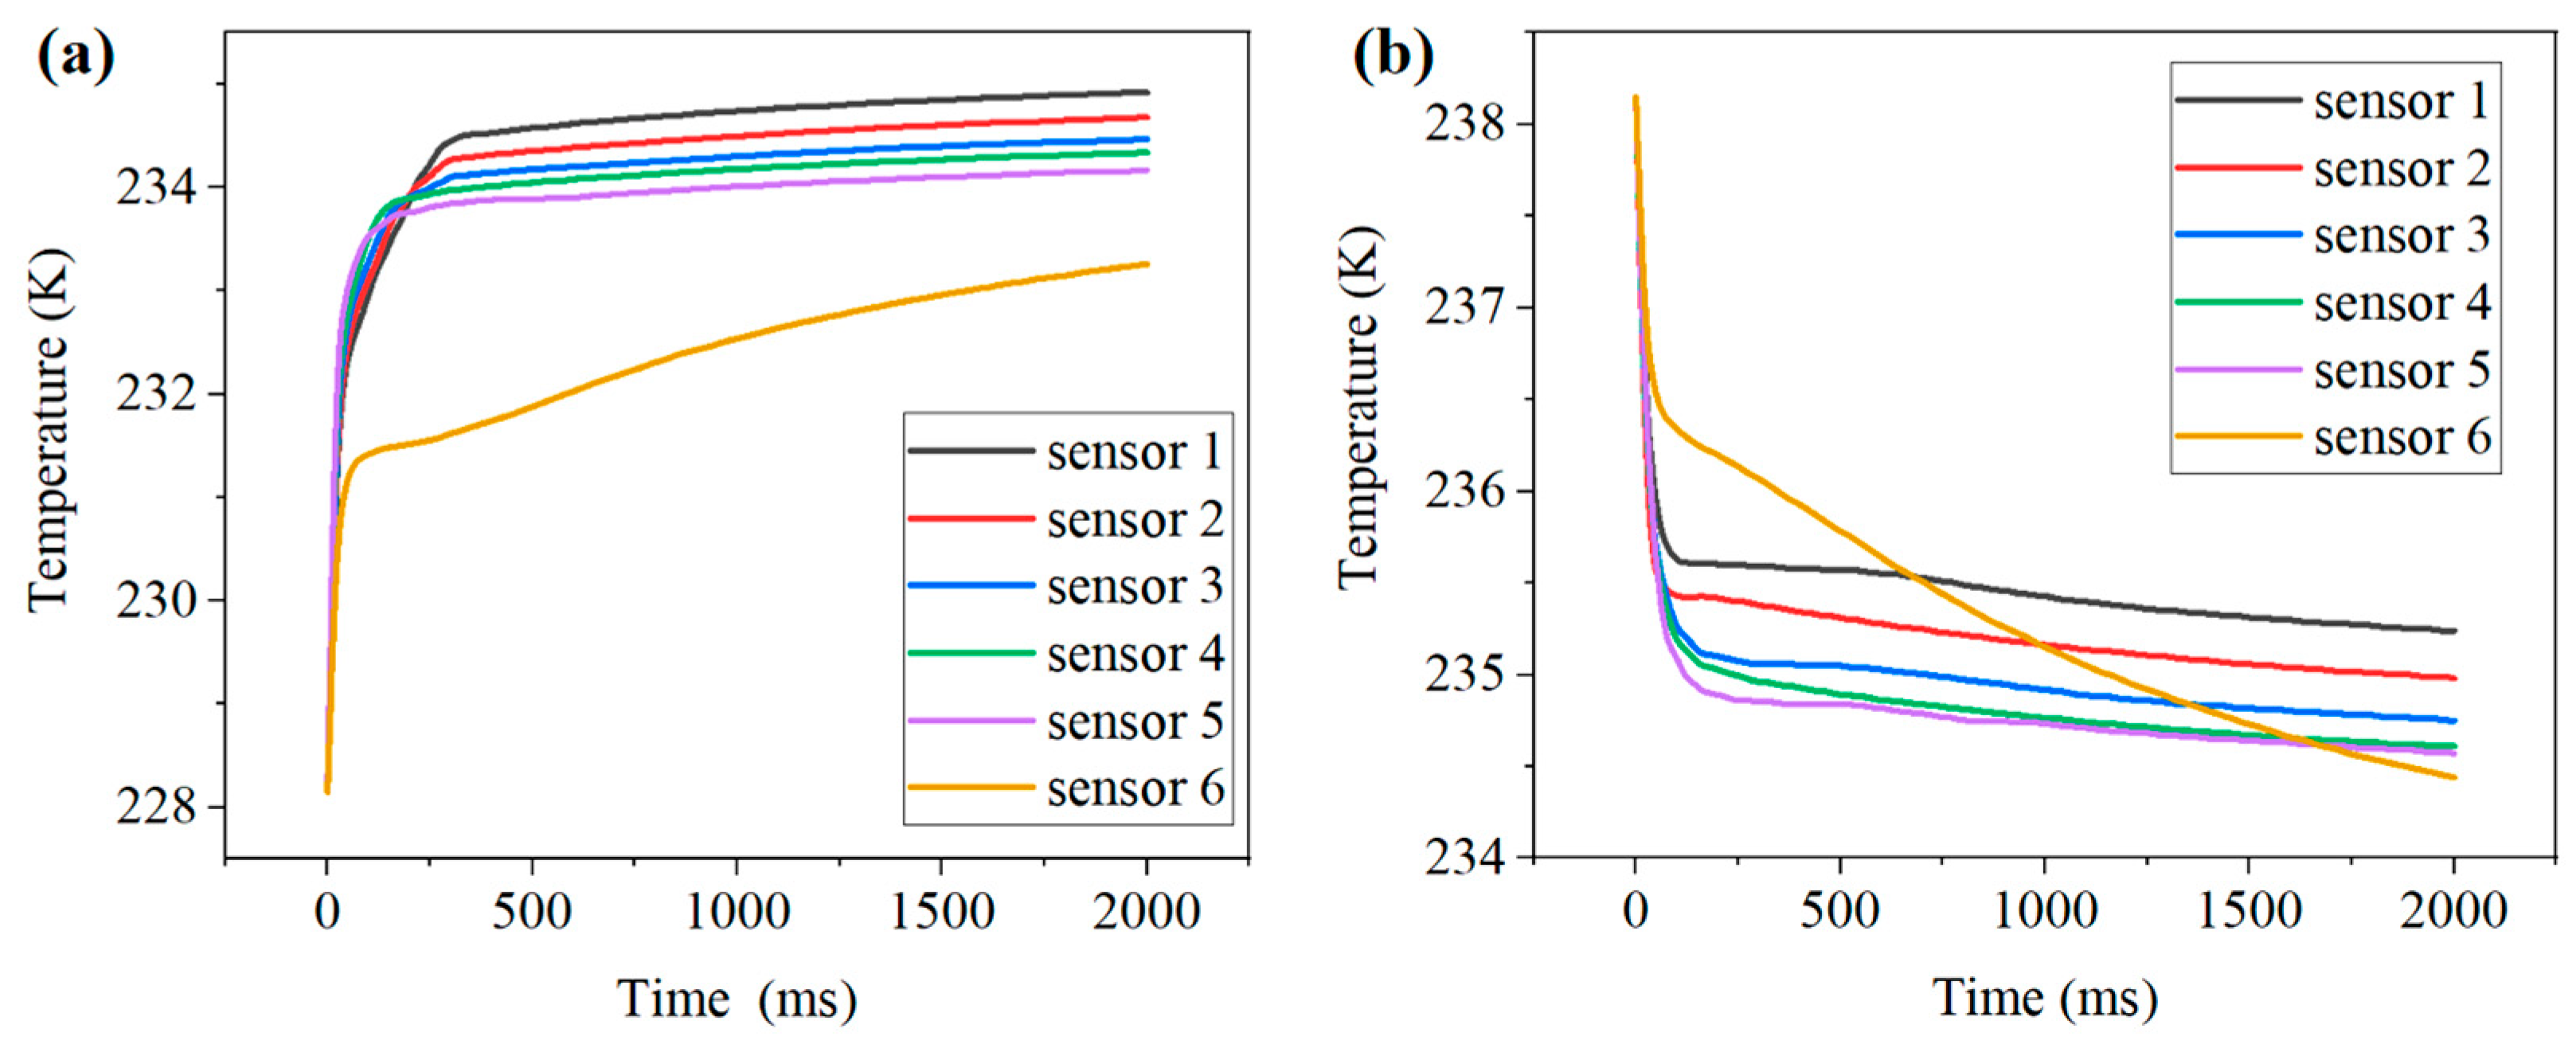
Figure 6.
Effect of different air pressures on temperature changes in Pt thin film.
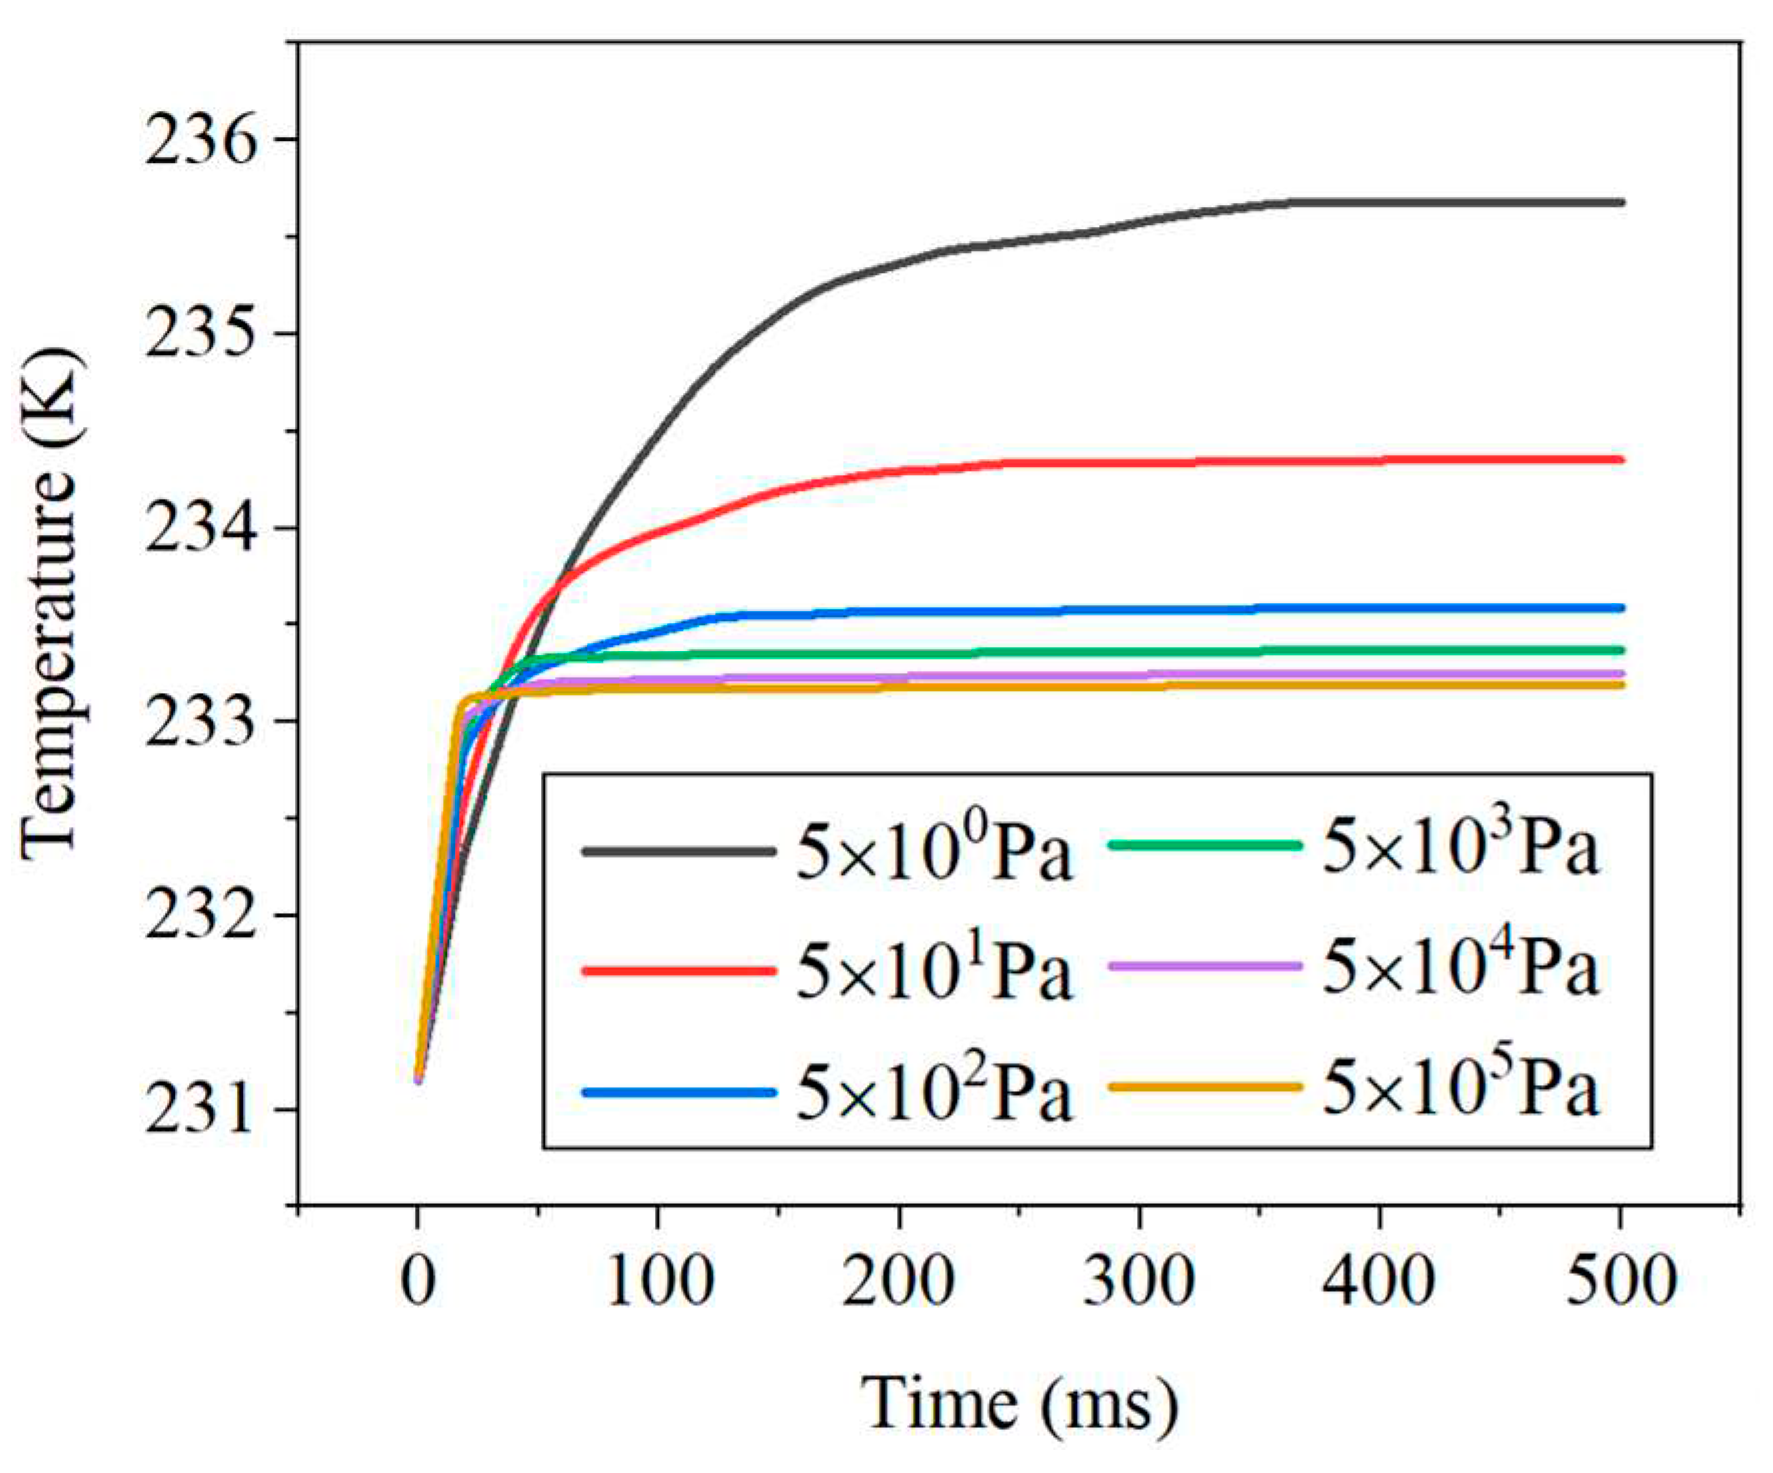
Figure 7.
Effect of different radiation-proof coatings on the temperature of temperature sensors.
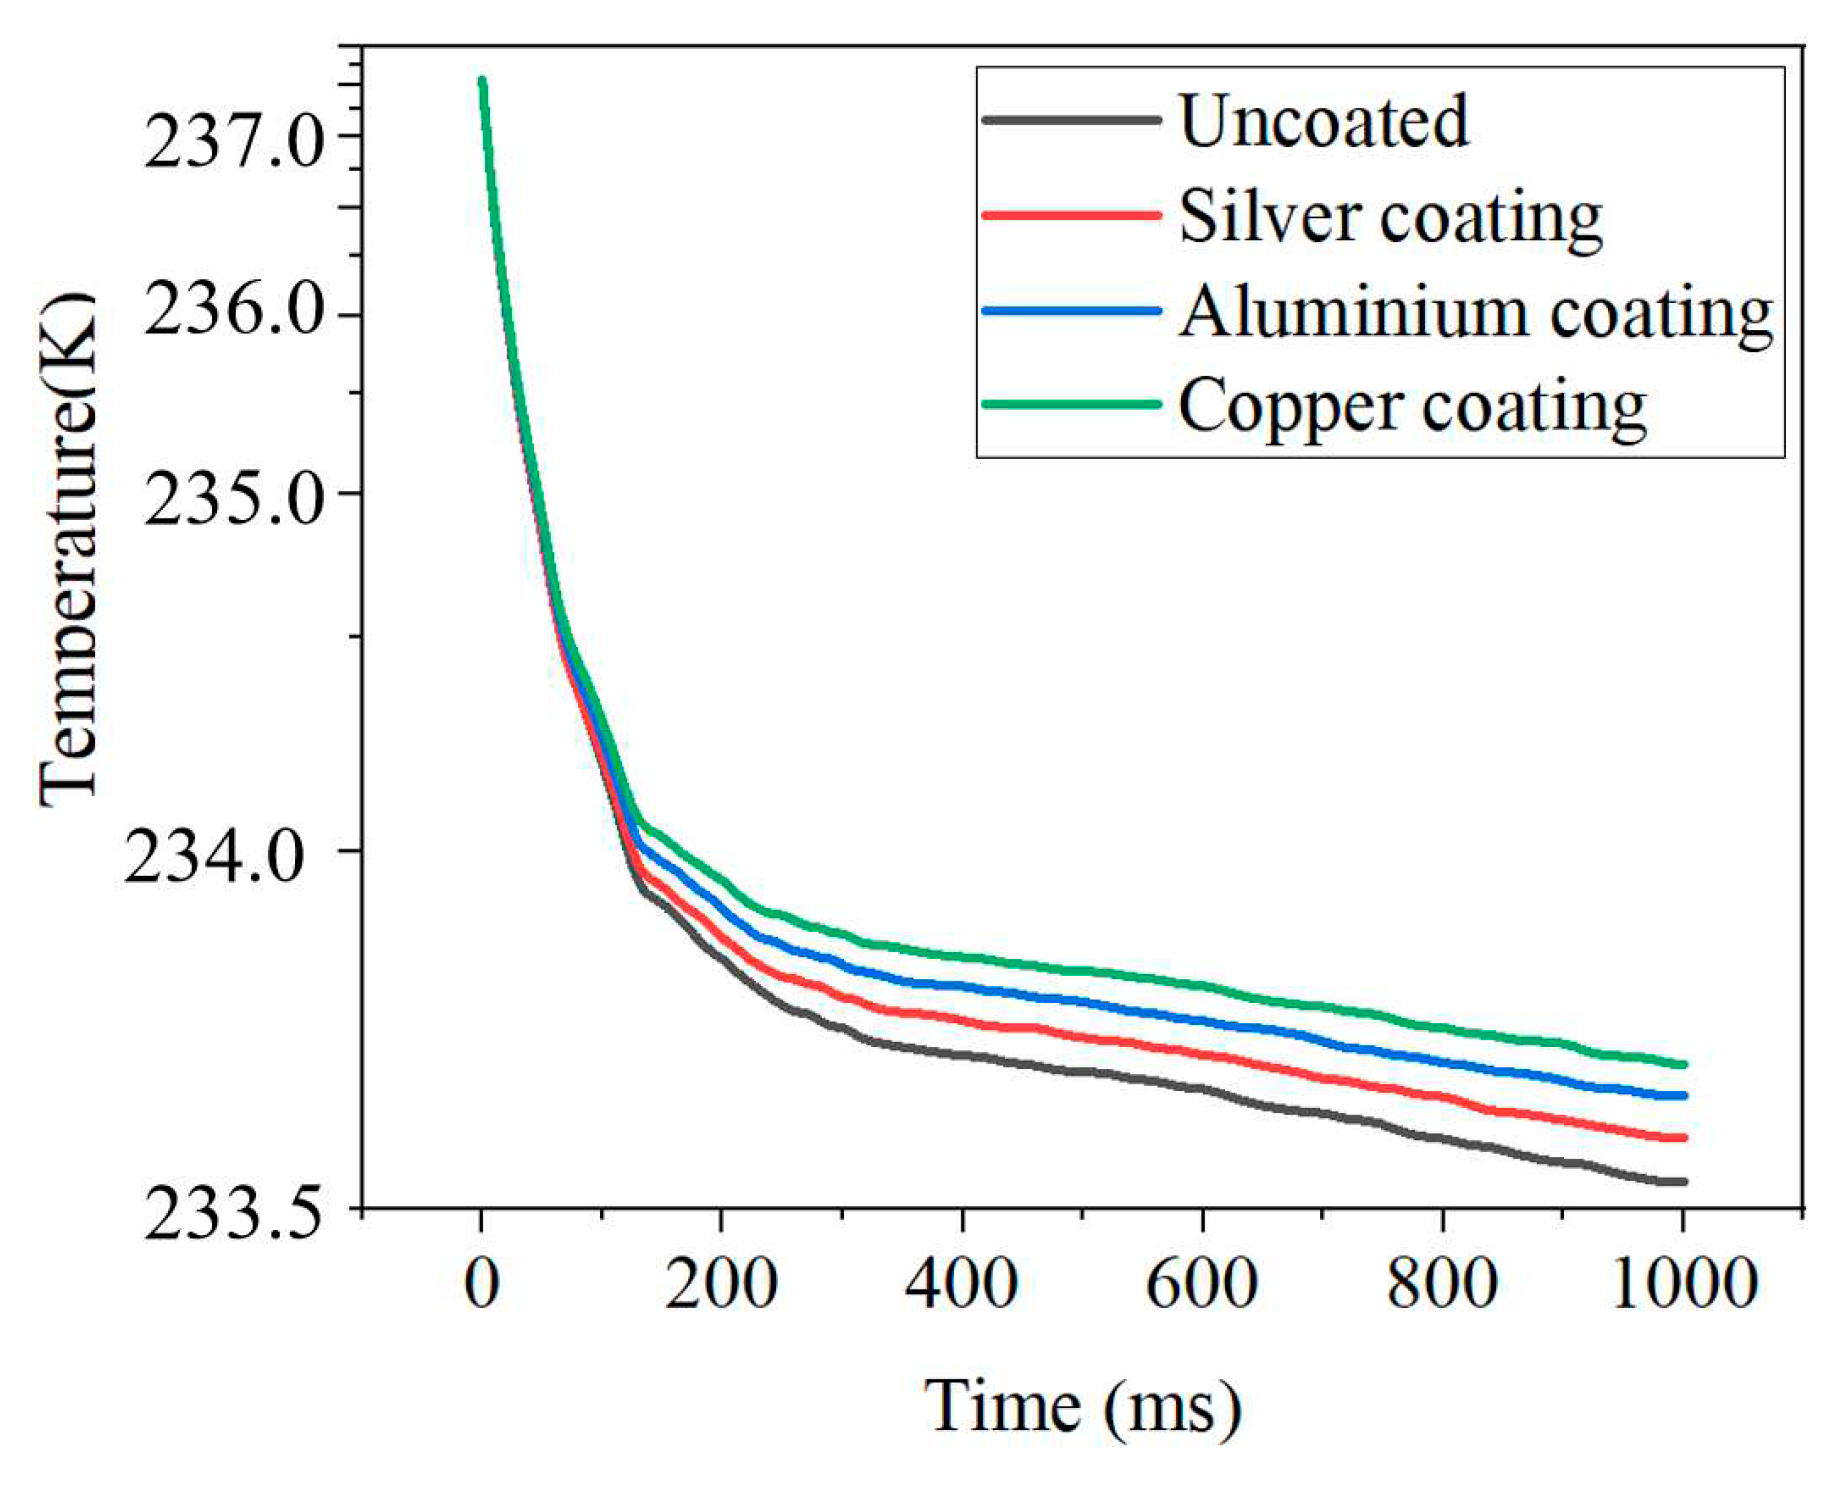
Figure 8.
Temperature variation of Pt thin film under different radiation conditions.
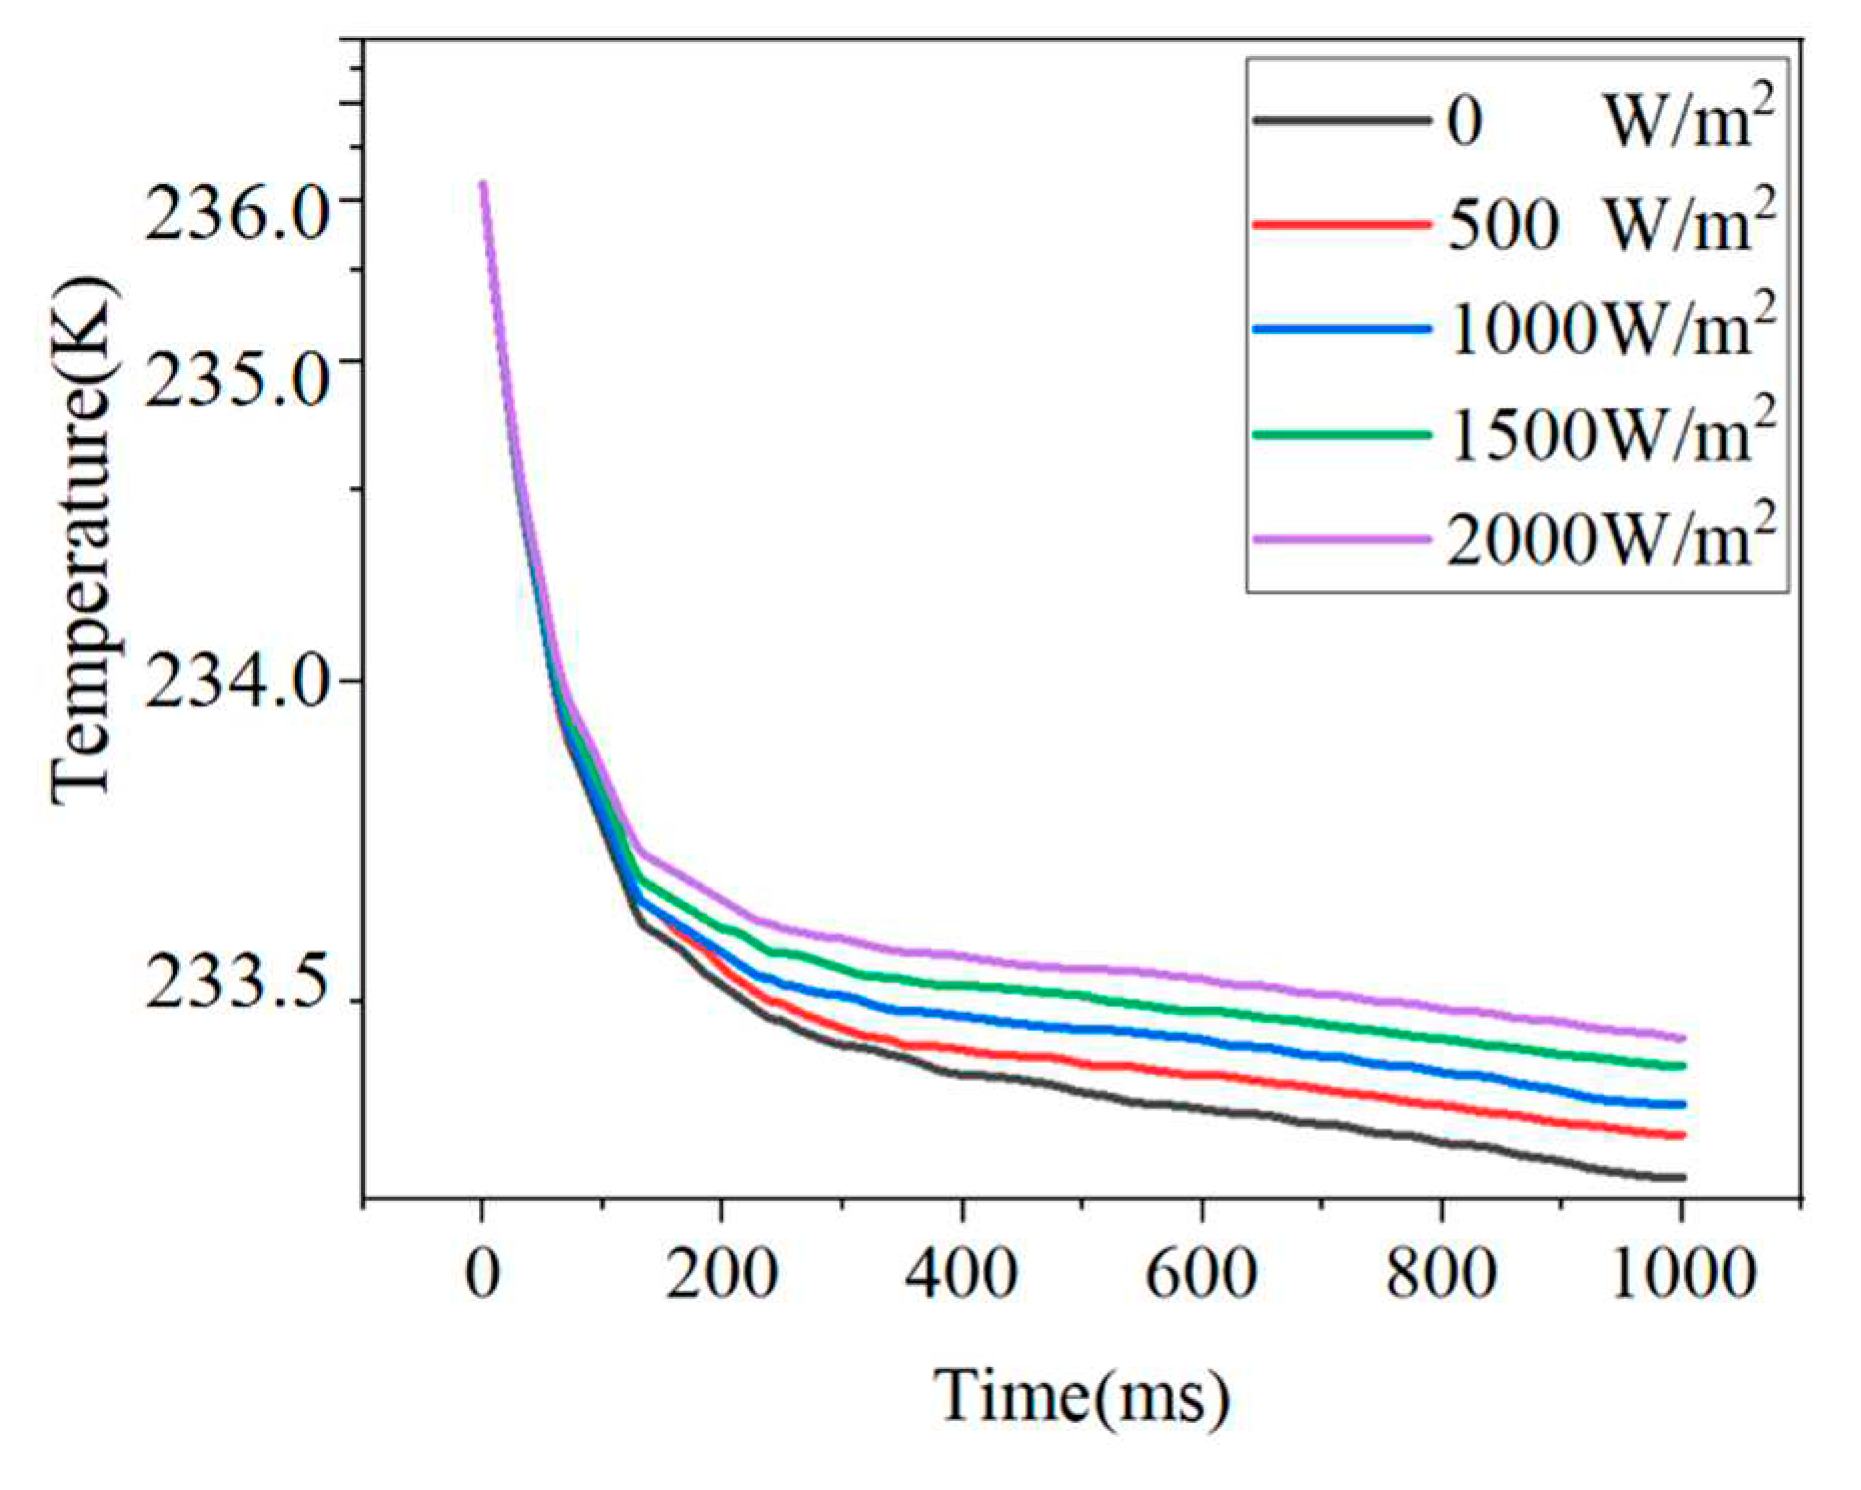
Figure 9.
Changes in cooling of Pt thin film under the influence of radiation at different air pressures.
Figure 9.
Changes in cooling of Pt thin film under the influence of radiation at different air pressures.
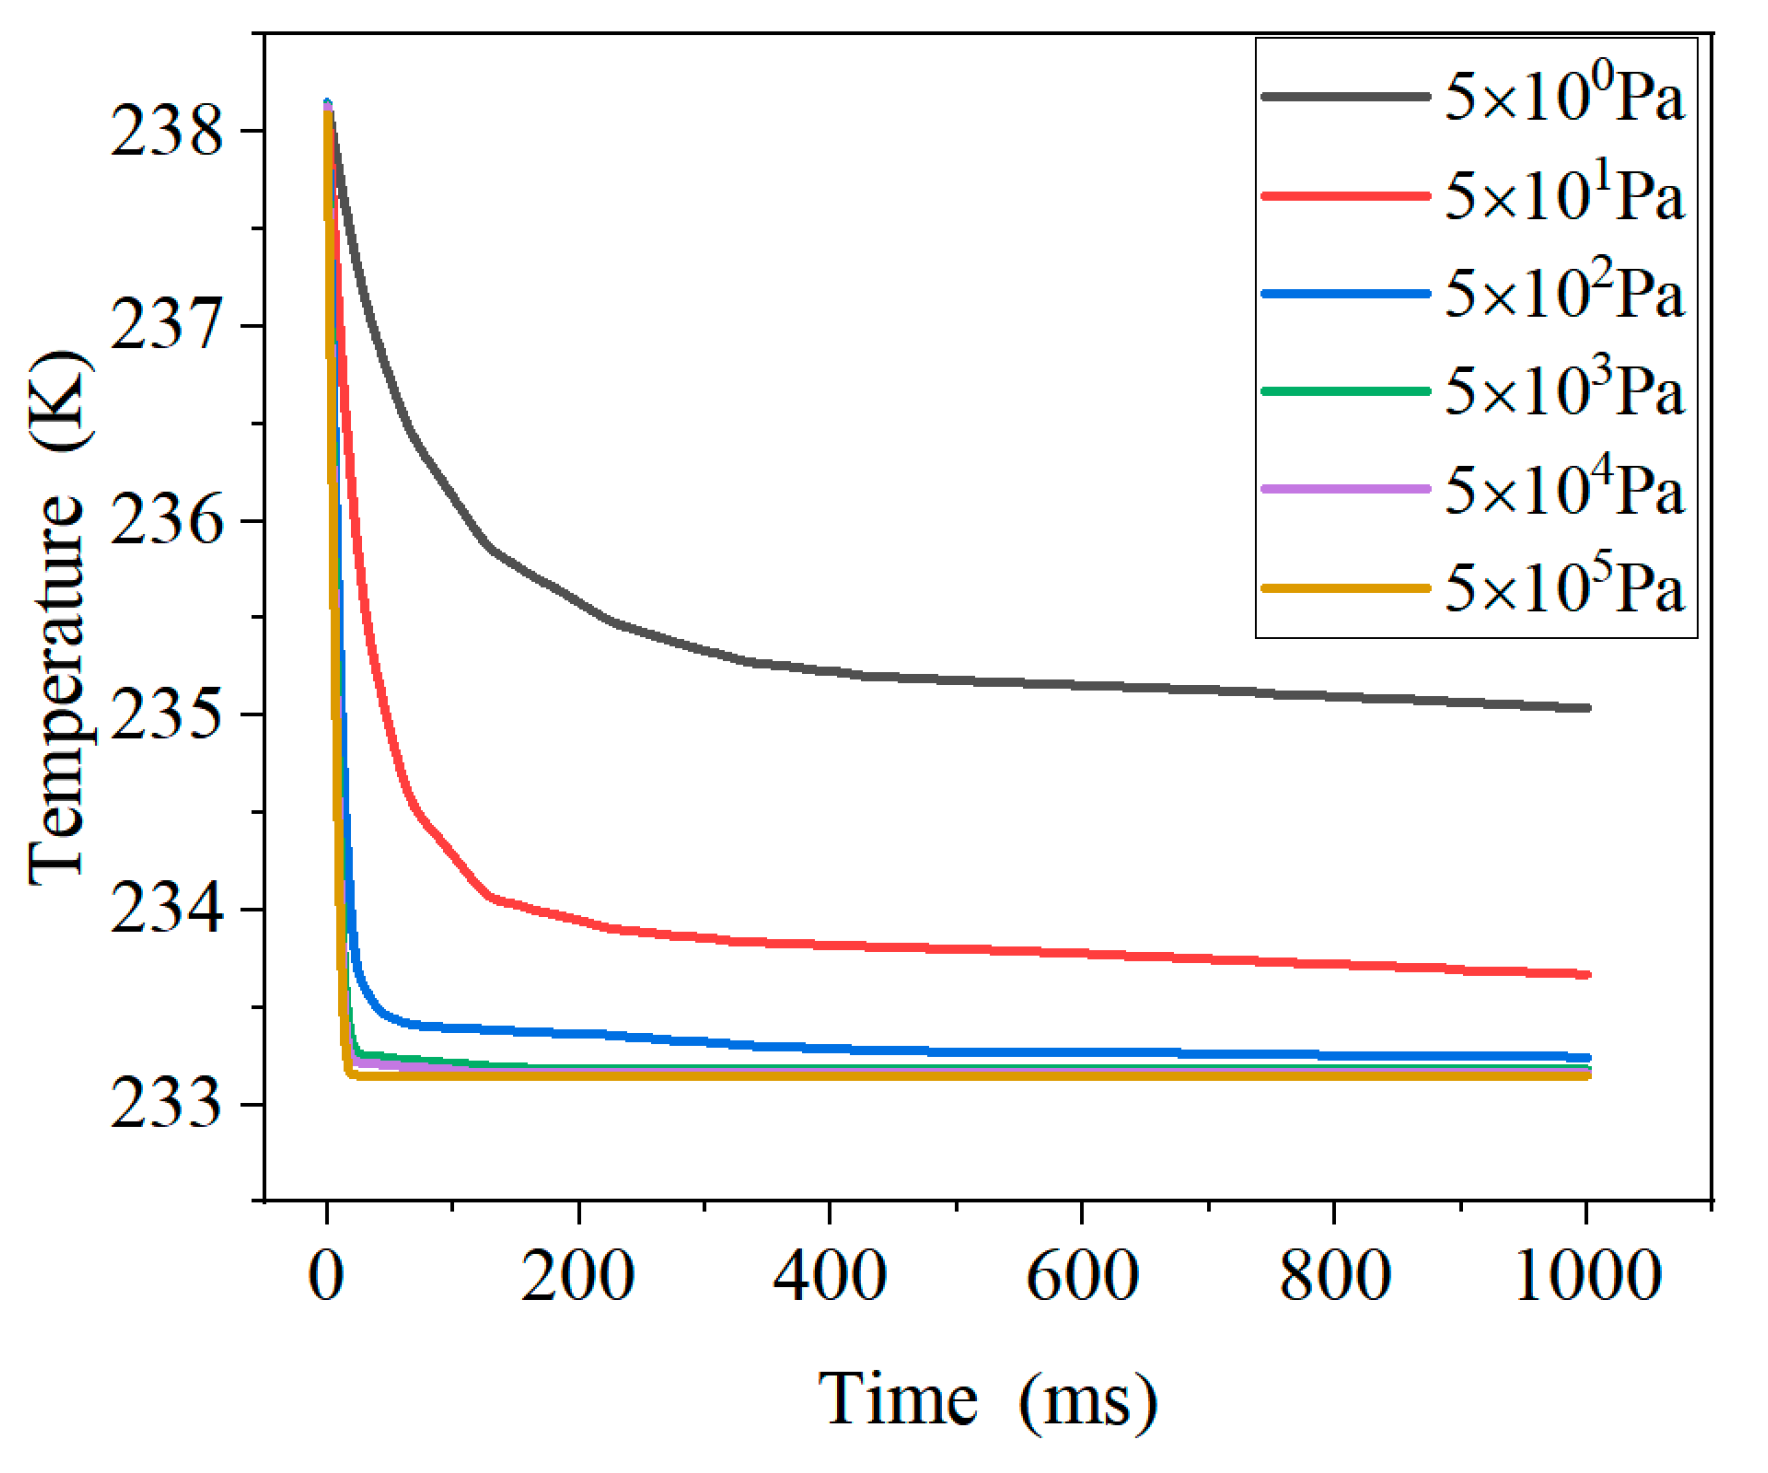
Figure 10.
Changes in the heating of Pt thin film under the influence of radiation at different air pressures.
Figure 10.
Changes in the heating of Pt thin film under the influence of radiation at different air pressures.
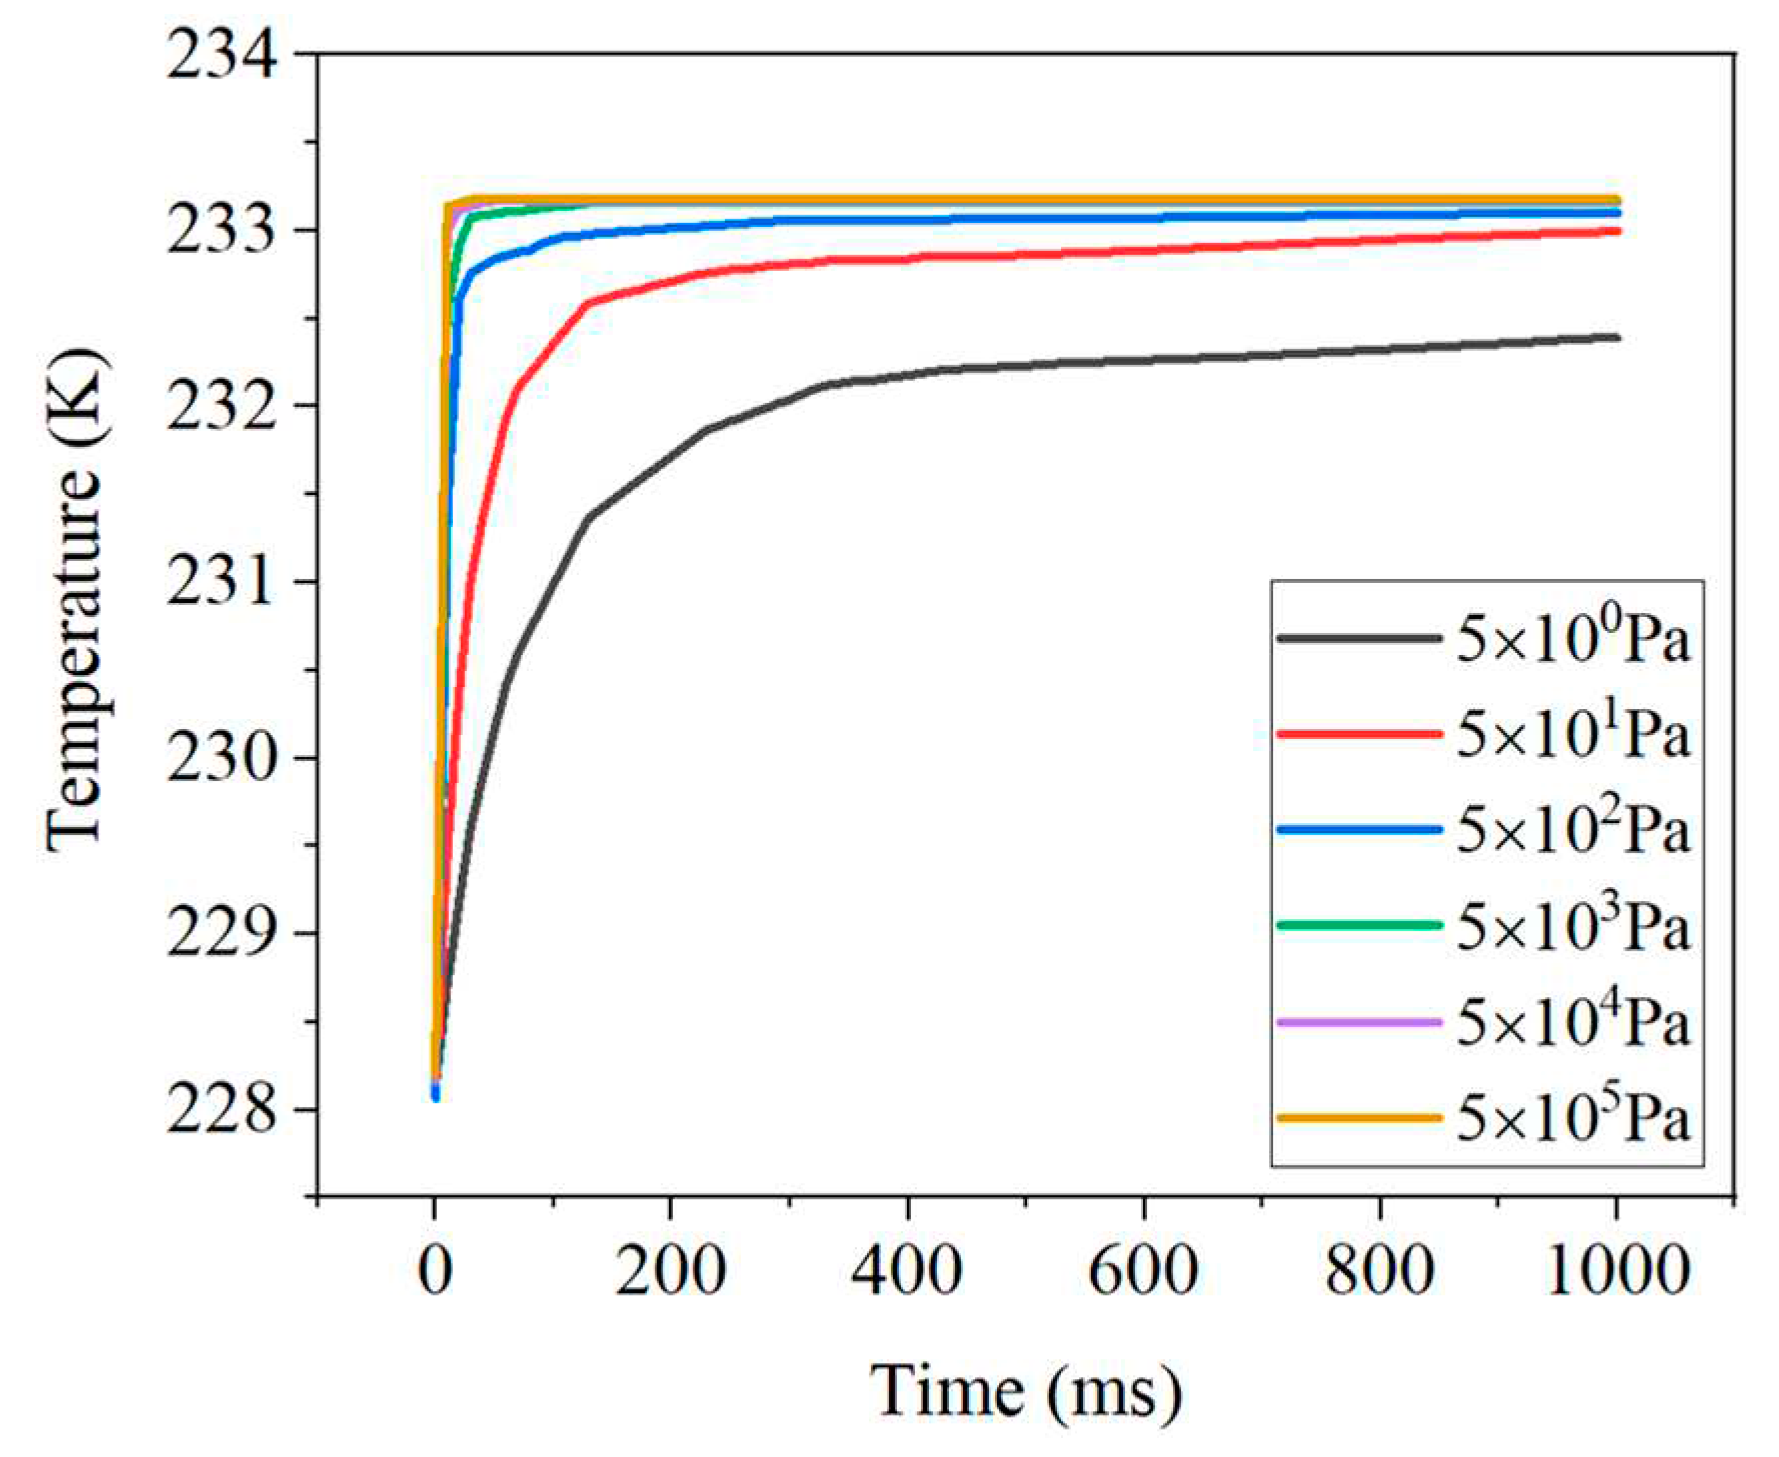
Figure 11.
Velocity curve of the falling radiosonde.
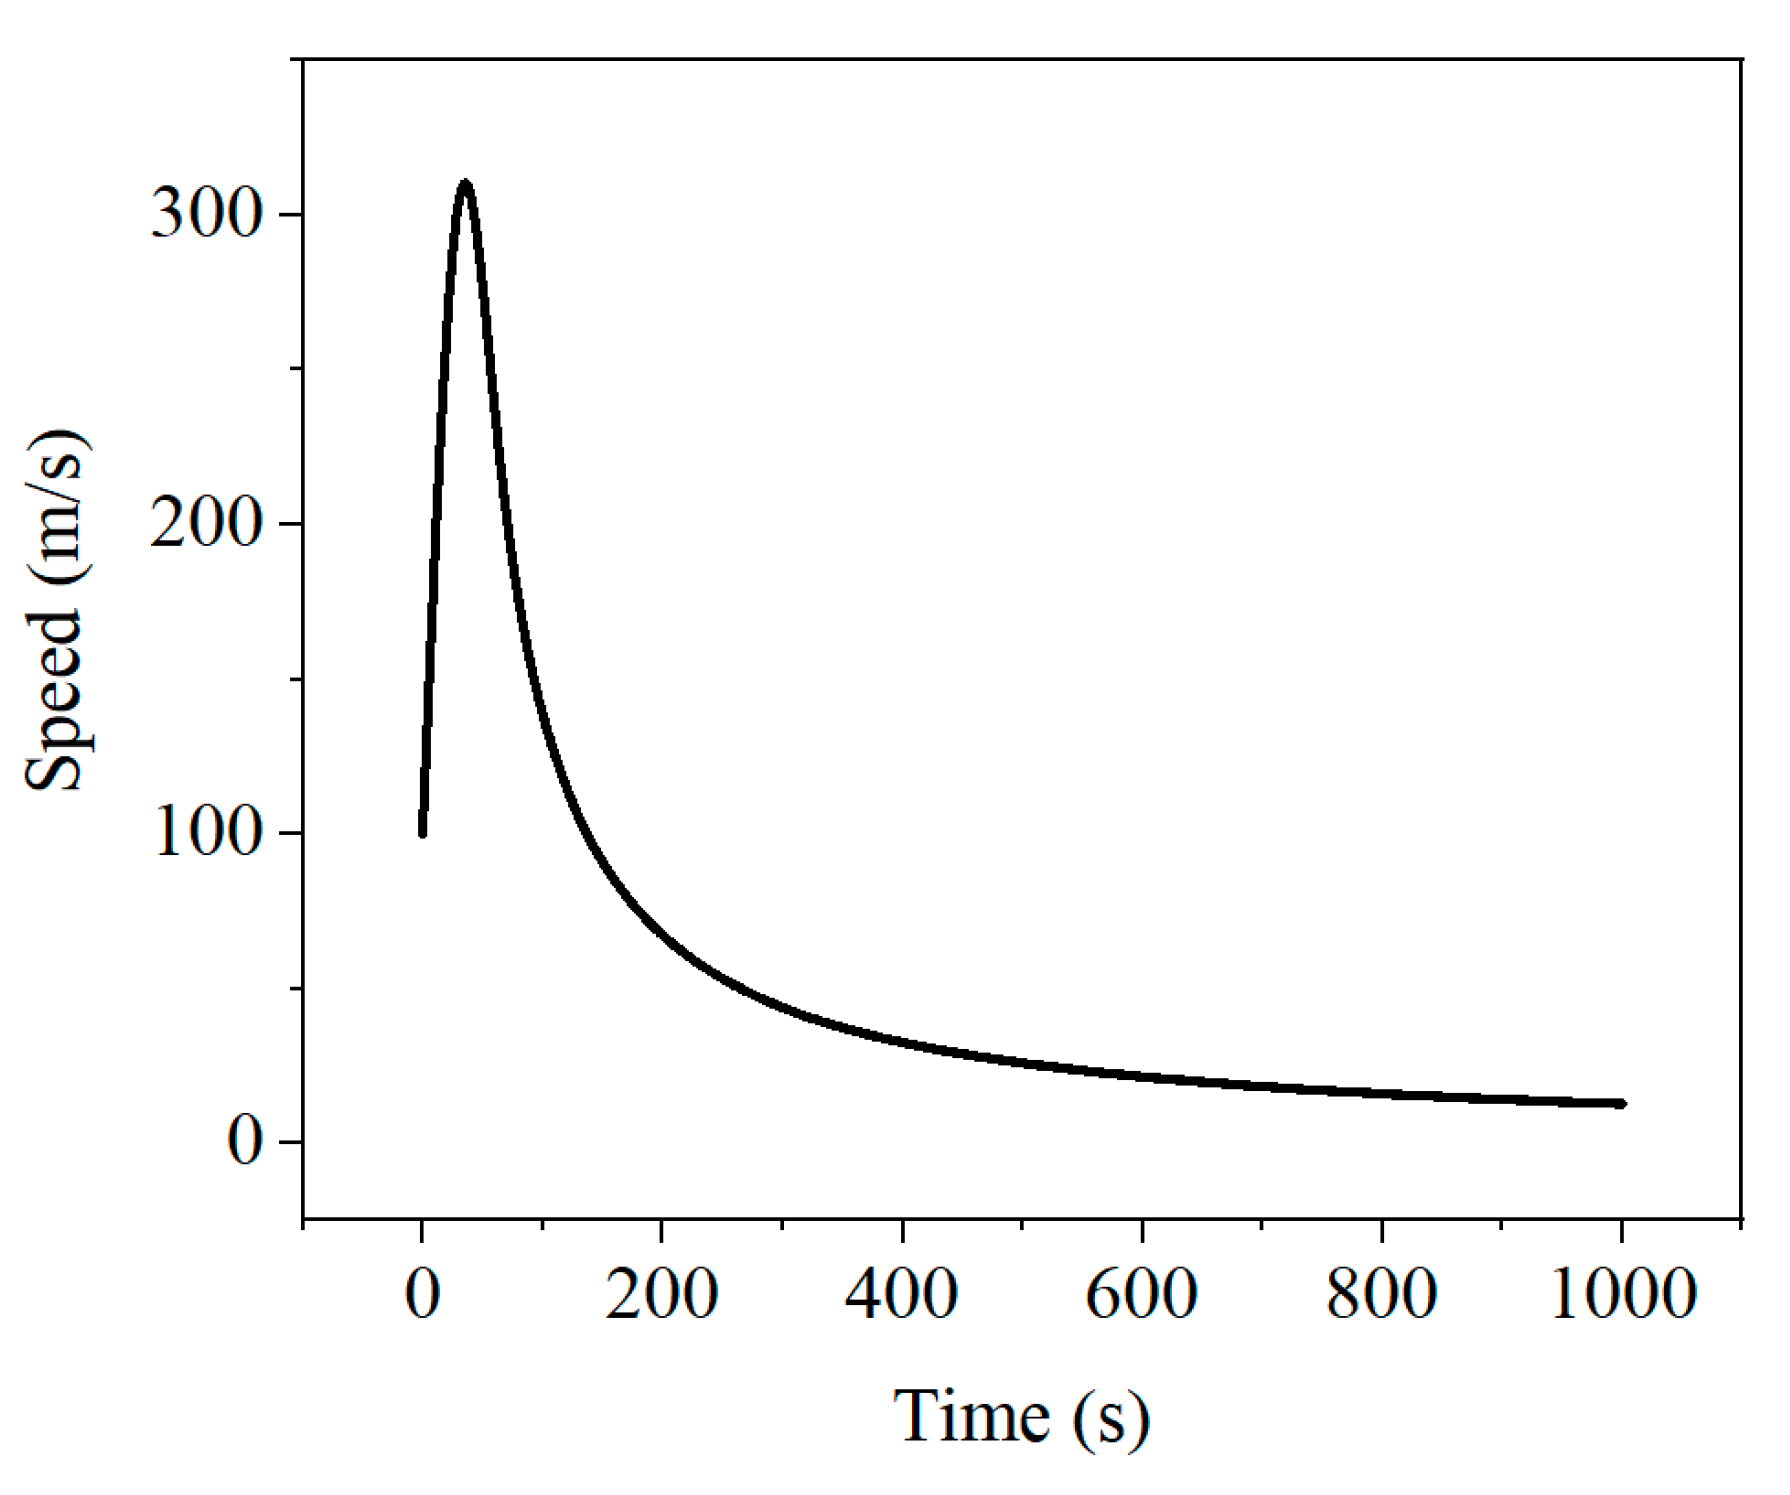
Figure 12.
Aerodynamic heat distribution of radiosonde at altitude of (a) 60000 m, (b) 50000 m, (c) 40000 m, (d) 30000 m during high-speed falling.
Figure 12.
Aerodynamic heat distribution of radiosonde at altitude of (a) 60000 m, (b) 50000 m, (c) 40000 m, (d) 30000 m during high-speed falling.
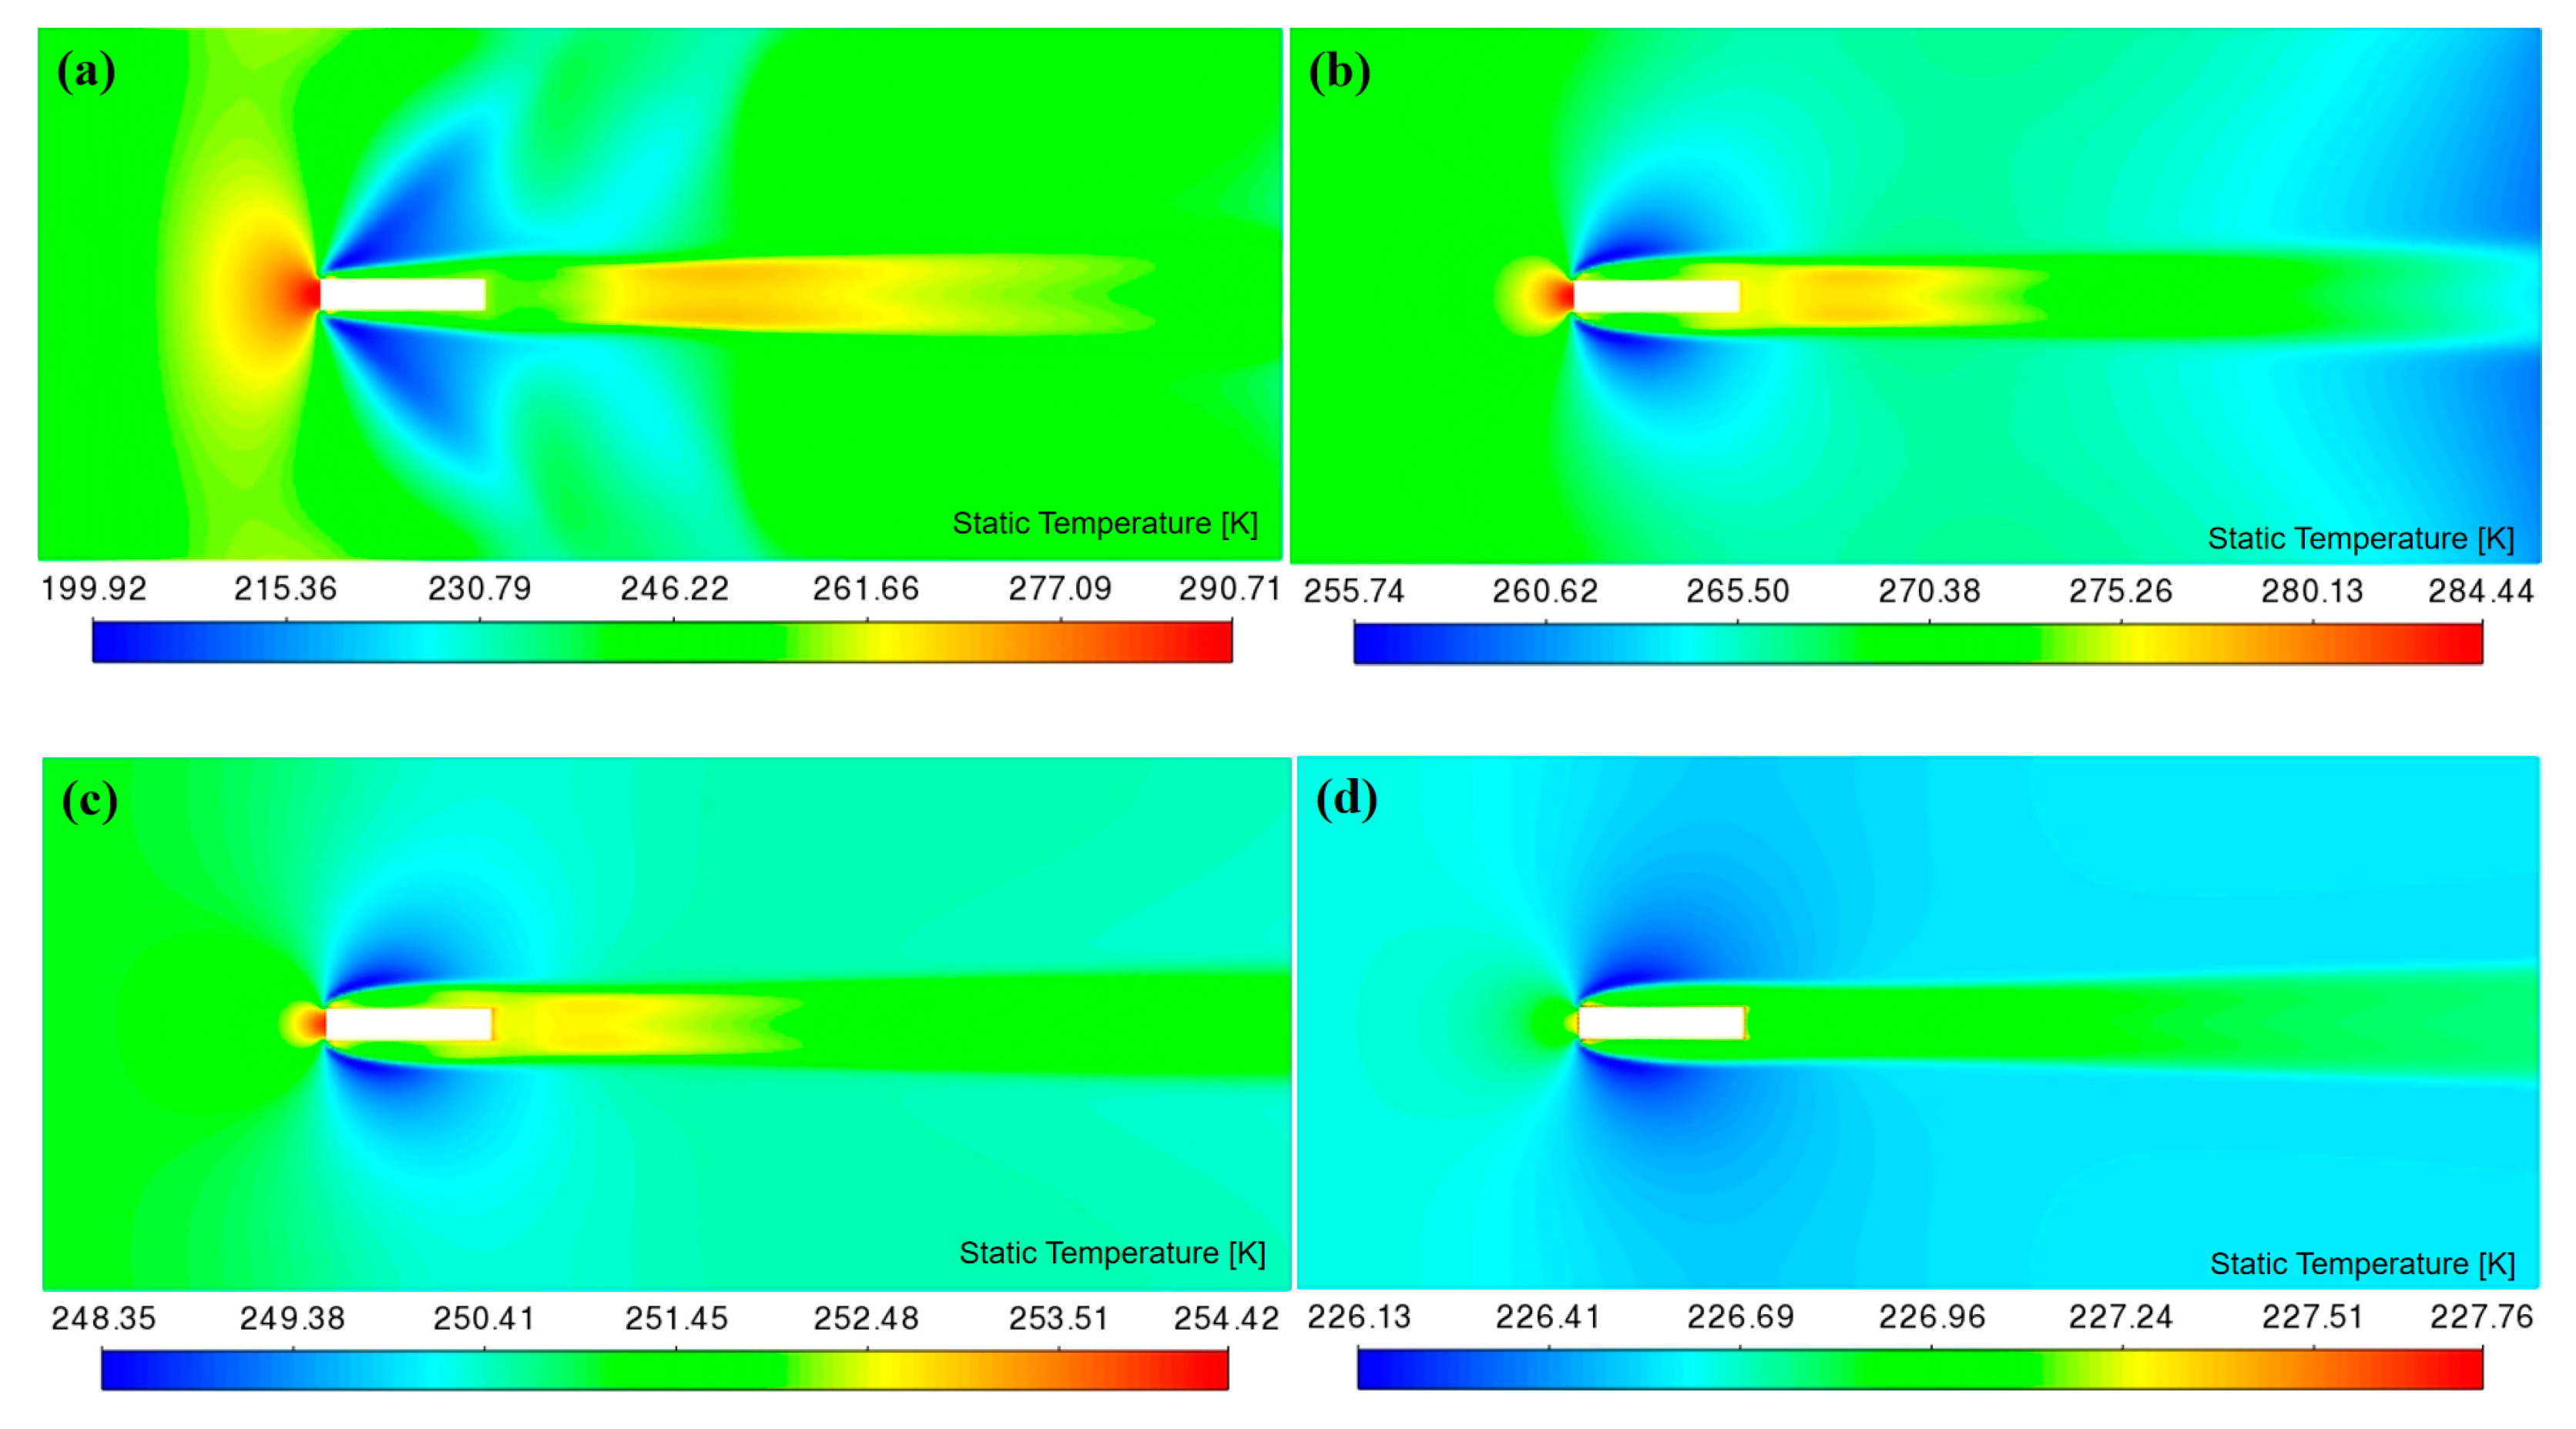
Figure 13.
Aerodynamic heat distribution of temperature sensor at altitude of (a) 60000 m, (b) 50000 m, (c) 40000 m, (d) 30000 m during high-speed falling.
Figure 13.
Aerodynamic heat distribution of temperature sensor at altitude of (a) 60000 m, (b) 50000 m, (c) 40000 m, (d) 30000 m during high-speed falling.
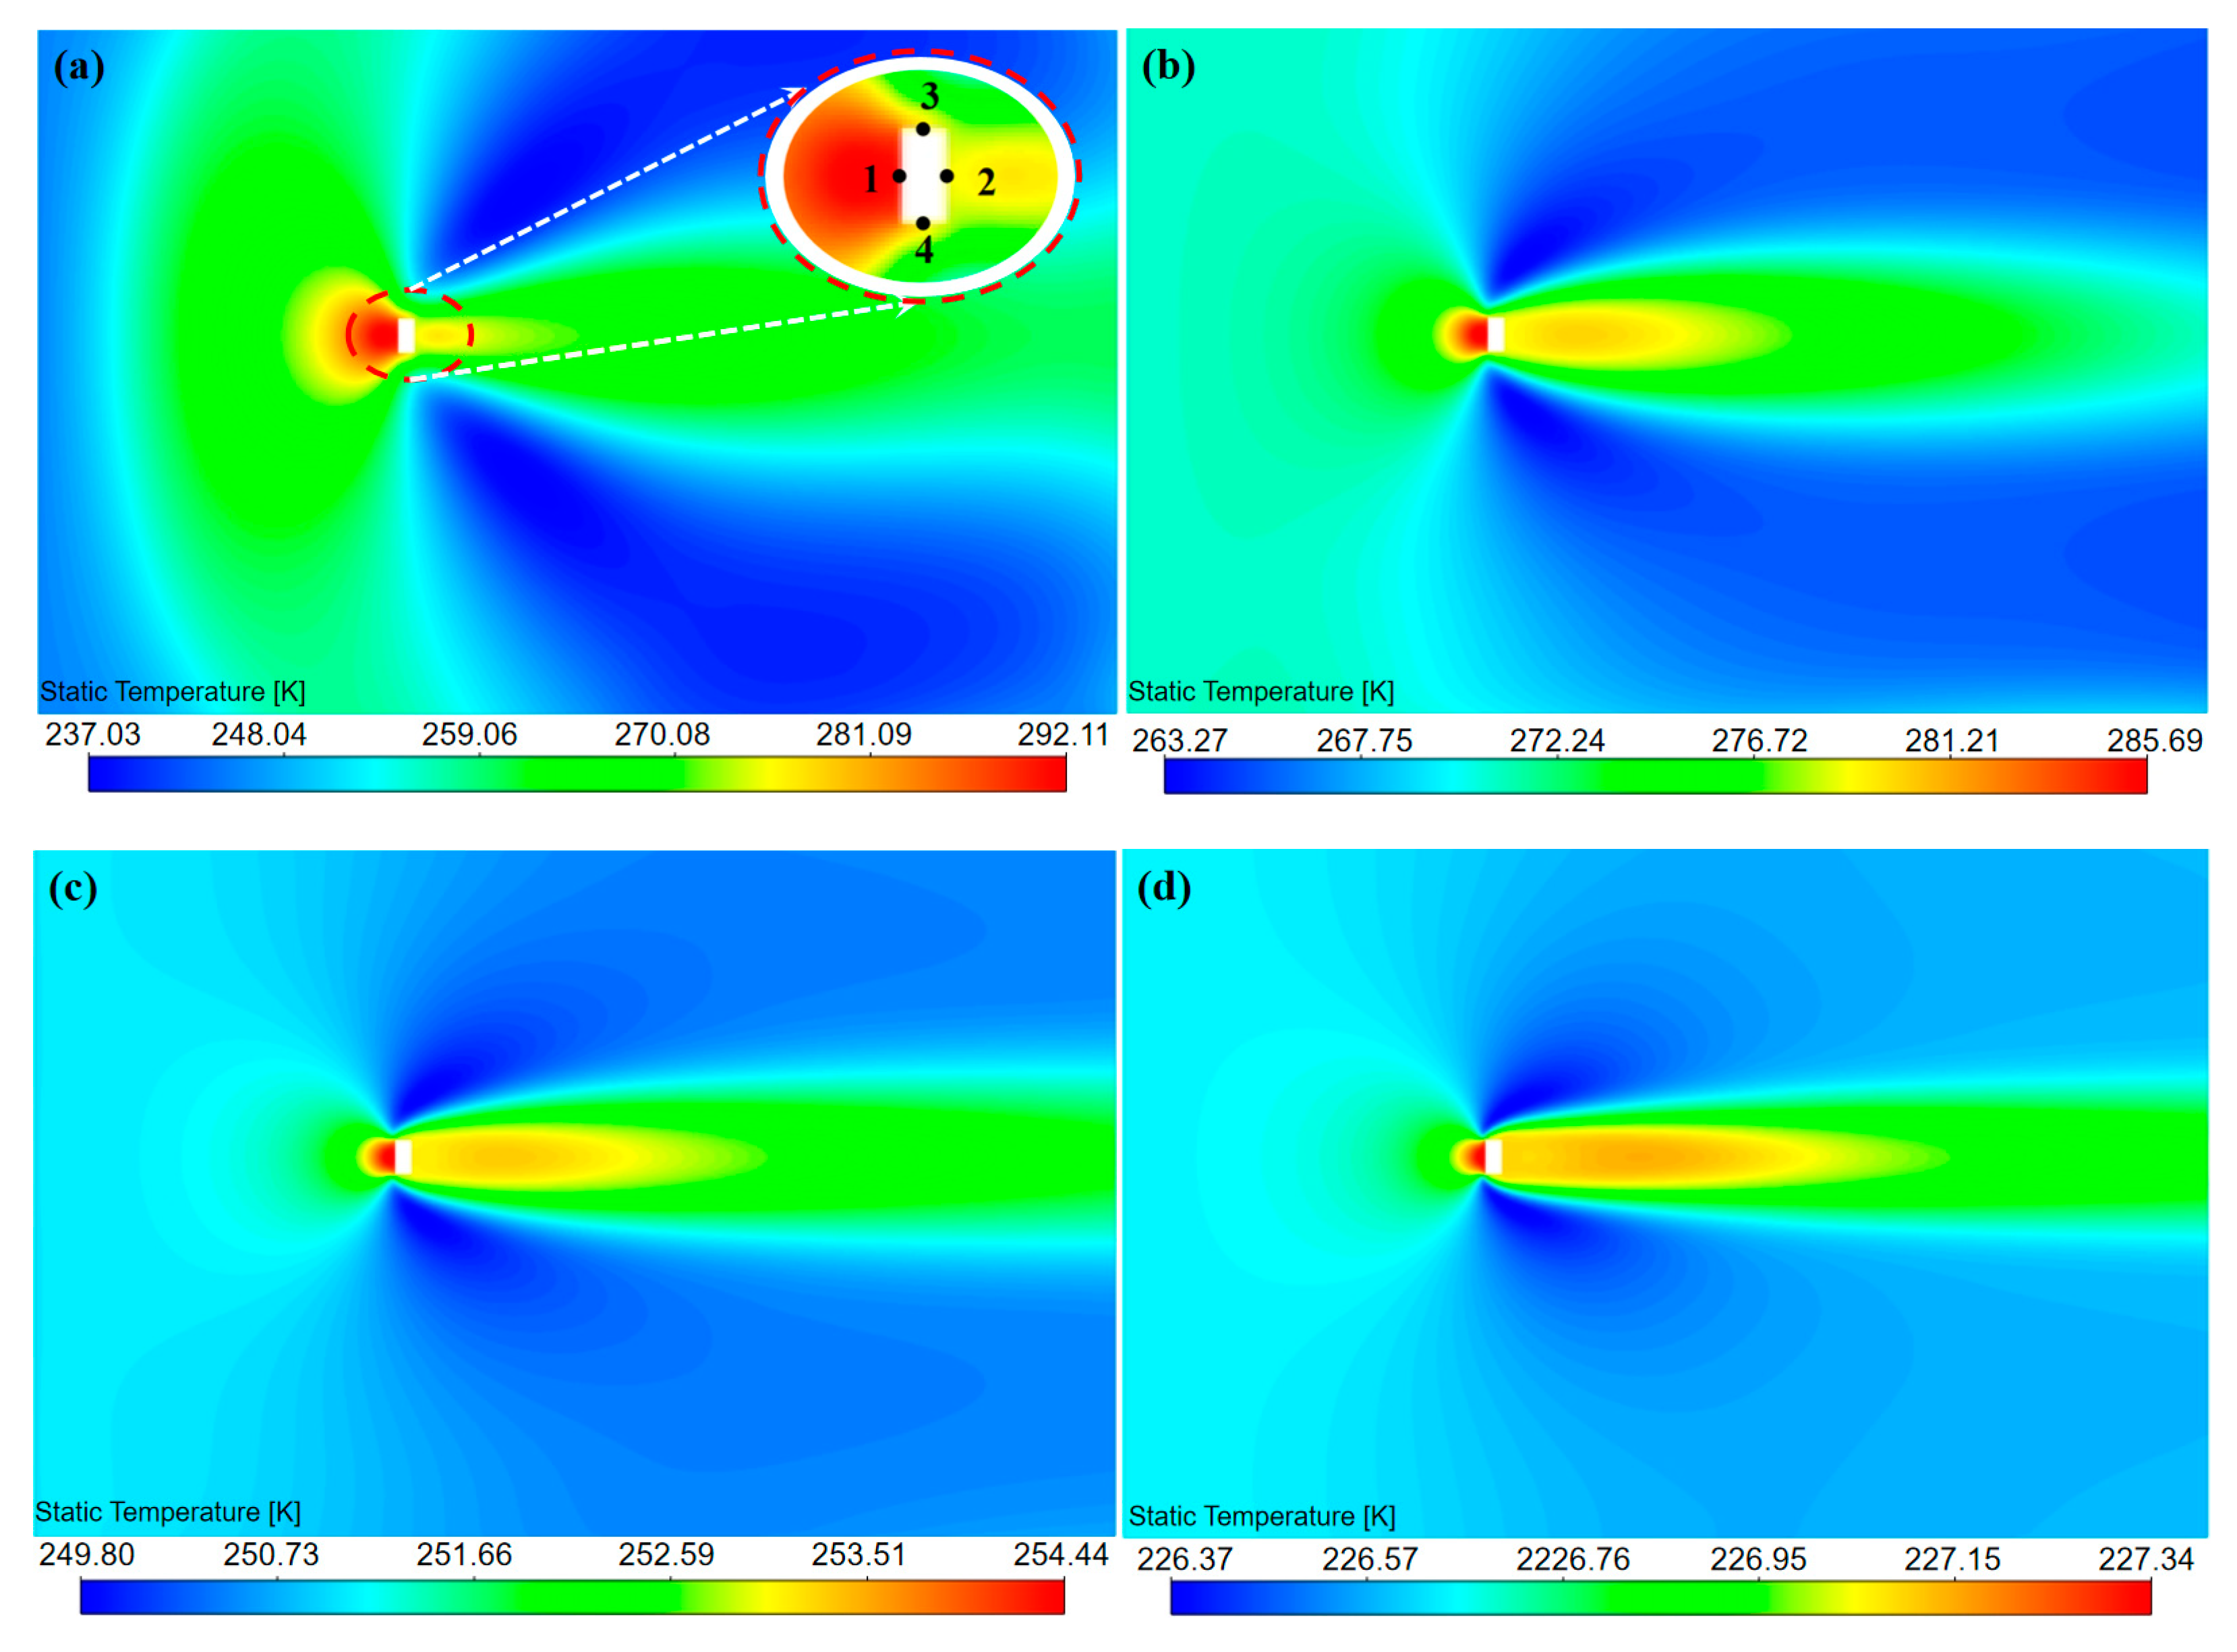
Figure 14.
Variation of aerodynamic heat with air pressure at two points of the sensor.
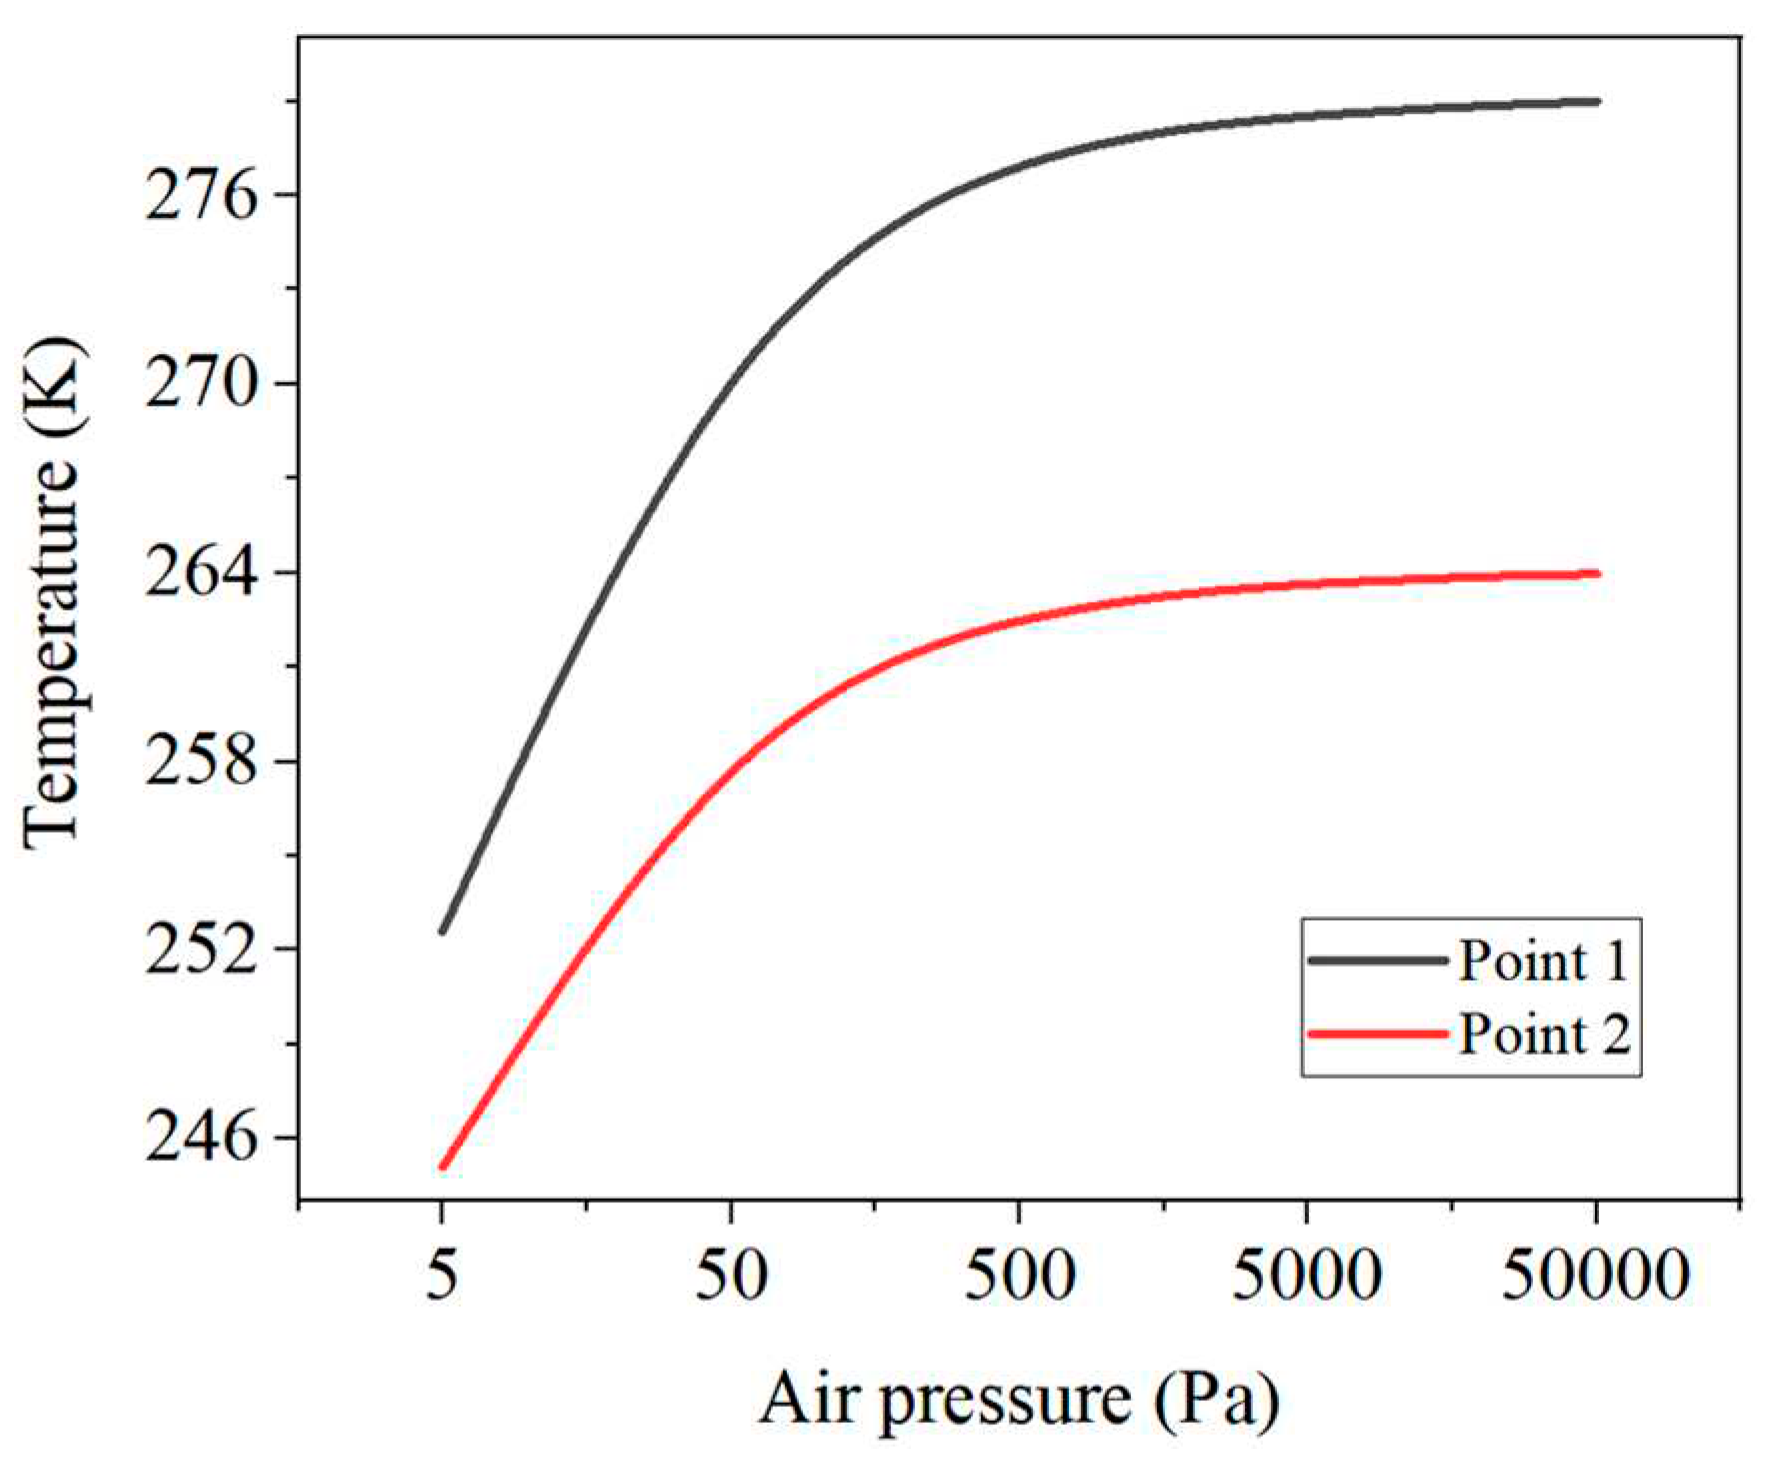
Figure 15.
Variation of aerodynamic heat with relative air speed at two points of the sensor.
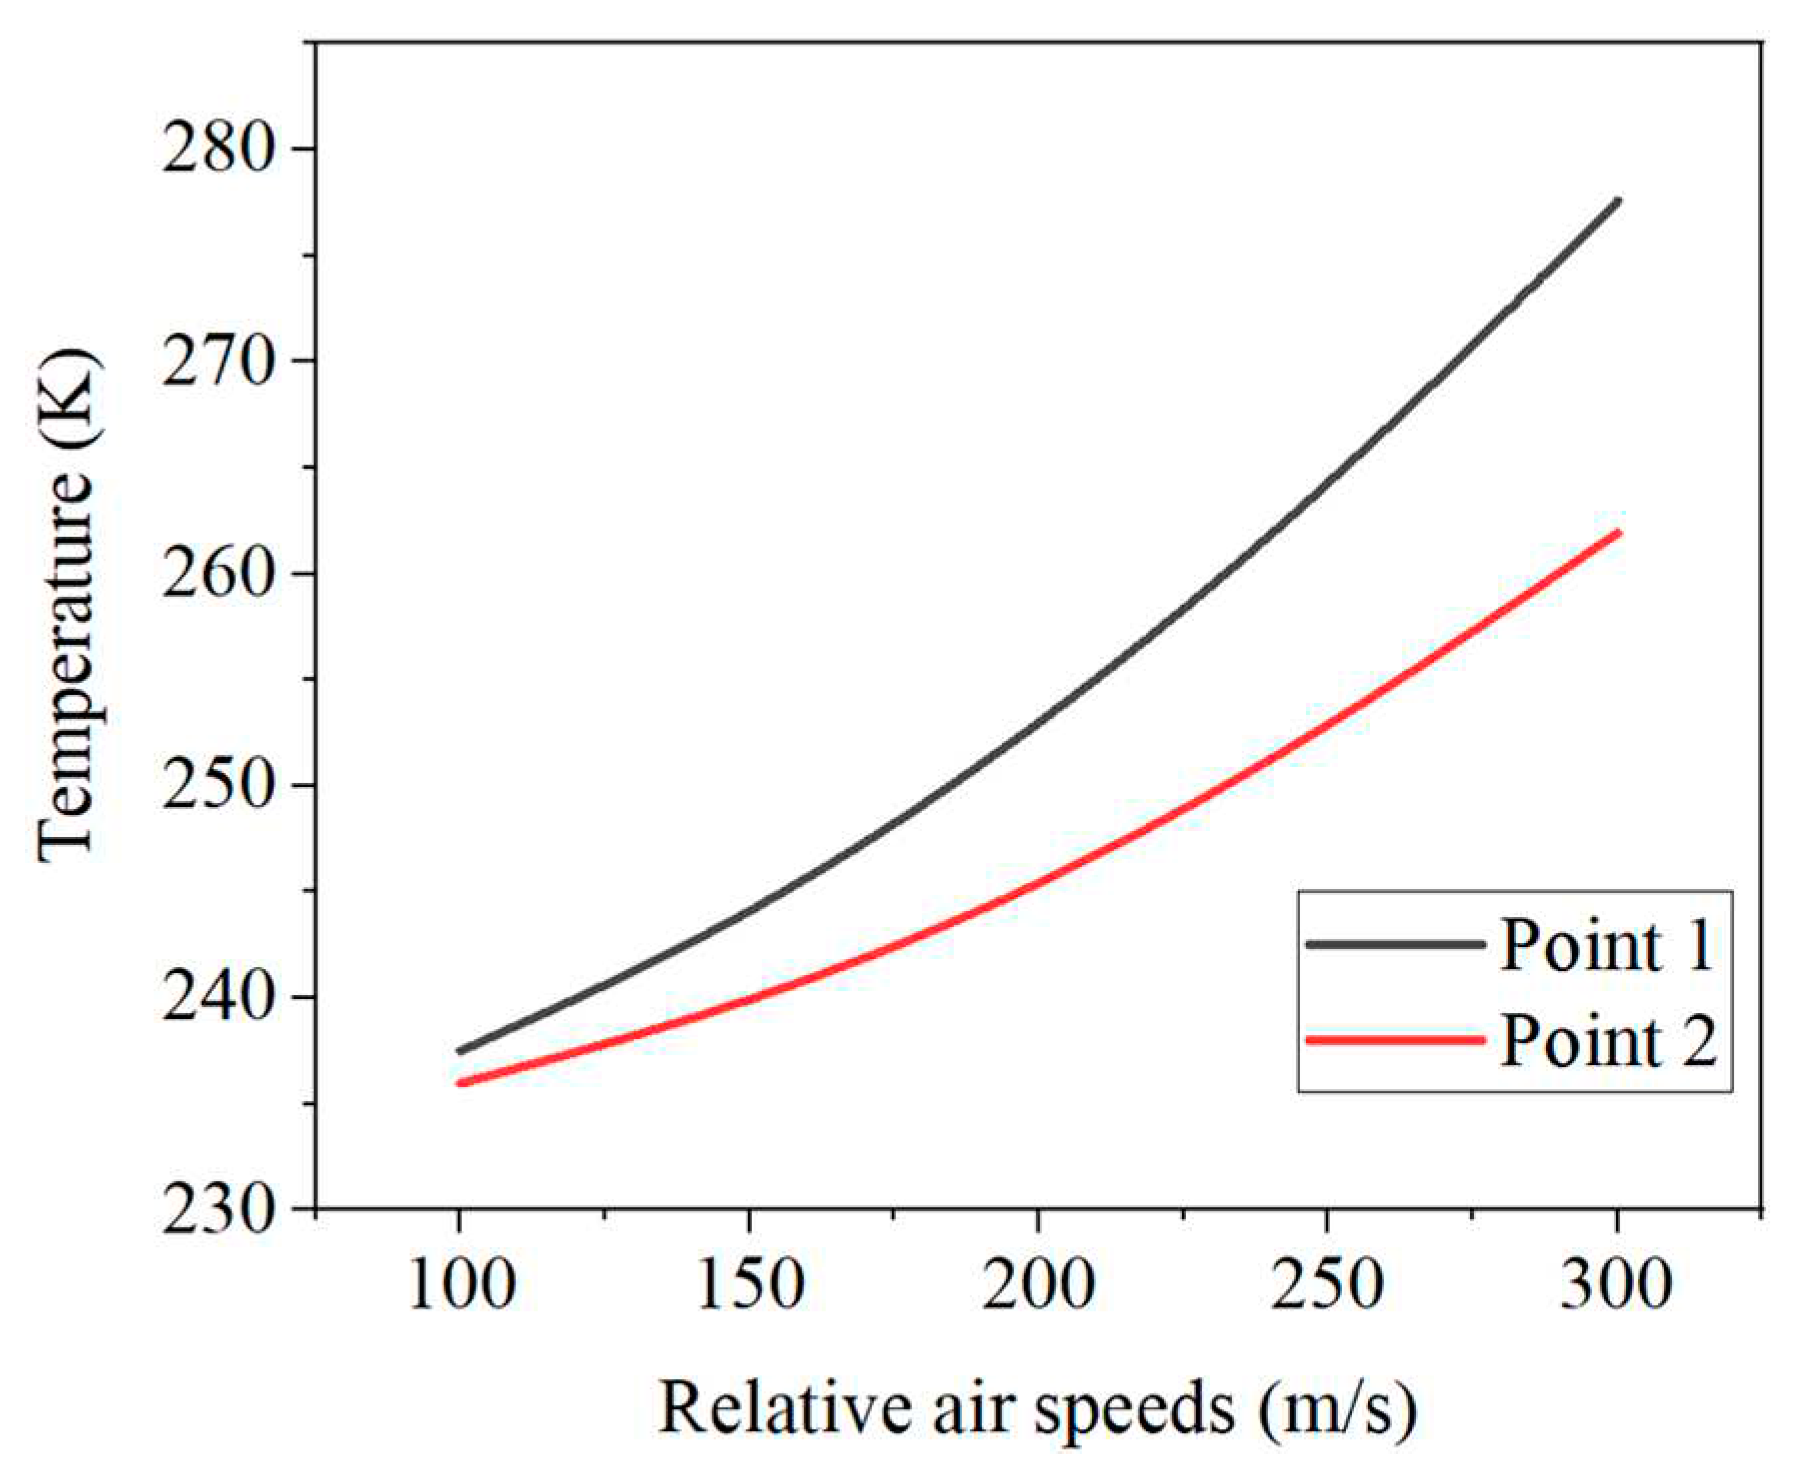

Table 1.
State parameters during the fall of the sounding device.
| Altitude (m) |
Falling speed (m/s) |
Ambient temperature (K) |
Air pressure (Pa) |
Time (s) |
|---|---|---|---|---|
| 70000 | 100 | 217.452 | 5.01699 | 0 |
| 61724 | 310.35 | 240.63 | 15.94 | 35.41 |
| 60000 | 304.34 | 245.45 | 20.31 | 40.97 |
| 50000 | 166.31 | 270.65 | 75.95 | 84.23 |
| 40000 | 77.76 | 251.05 | 277.55 | 174.27 |
| 30000 | 35.19 | 226.65 | 1171.95 | 370.02 |
Disclaimer/Publisher’s Note: The statements, opinions and data contained in all publications are solely those of the individual author(s) and contributor(s) and not of MDPI and/or the editor(s). MDPI and/or the editor(s) disclaim responsibility for any injury to people or property resulting from any ideas, methods, instructions or products referred to in the content. |
© 2023 by the authors. Licensee MDPI, Basel, Switzerland. This article is an open access article distributed under the terms and conditions of the Creative Commons Attribution (CC BY) license (https://creativecommons.org/licenses/by/4.0/).
Copyright: This open access article is published under a Creative Commons CC BY 4.0 license, which permit the free download, distribution, and reuse, provided that the author and preprint are cited in any reuse.


