
Submitted:
14 April 2023
Posted:
17 April 2023
You are already at the latest version
Abstract
Currently, the Israeli energy industry faces the challenge of a considerable increase in solar electricity production. Being a relatively isolated system, the significant expansion of solar electricity may cause problems with electricity quality. The electrical storage installation can resolve this problem. In Israel's situation, the optimal solution can be the creation of a channel between the Mediterranean and the Dead Sea. The channel can solve three closely related problems: the increased production of desalinated water for domestic, industrial, and agricultural needs; the prevention of a permanent Dead Sea level decline and its imminent disappearance; the development of hydro-pumping electrical storage stations; and the creation of numerous PV facilities in the Negev area for national electricity generation. However, a detailed analysis should be done for the estimation of the possible increase of solar electric generation with the consideration of a stochastic PV outcome and a potential ability to use the Dead Sea for the brine discharge from electrical hydro-storage plants.
Keywords:
Solar Electricity increase
; Channel Mediterranean Dead Sea
; water desalination.
1. Introduction
The present and future progress in the common worldwide electric industry as well as the domestic Israeli industry is closely related to renewable energy overall and solar PV power generation [1,2,3]. The trend of increasing usage of PV stations is determined by factors such as environmental protection against harmful pollution typical of conventional power plants [4,5], permanent diminishing of the costs of solar facilities [6,7], and the cost of solar electricity [8,9]. The potential of PV applications can be significantly larger with electrical storage facilities [10]. The Israeli electro-generating economy is feasibly rich with the ability of solar electricity production, which causes the tendency to increase renewable generation usage as determined by government directives [11] with the request to achieve 30% of total power by 2030. It is planned to increase preferences for solar electricity producers and encourage domestic storage installations. This roadmap paves the way for increased installation of new PV power facilities, both by private domestic consumers and big energy companies. To date, a summarized generation in the middle of the day can achieve up to 19–20% of the total national power installation. The tendency toward an increased widespread use of PV stations raises the natural question regarding feasible limits for providing consumers with solar electricity. To what extent can it be done without diminishing the required quality of the electrical supply.
Theoretical investigations and experimental practices of PV systems show evidence of some technical problems accompanying massive applications of solar power stations. Three main obstacles are preventing the wide use of PV electricity on a large scale. The first of these problems is the voltage instabilities in distribution lines enriched by numerous solar PV facilities [12,13,14,15,16]. Owing to the stochastic nature of solar irradiation, the power of a PV installation may change fast enough; sometimes generating power alternates up to 20–25% from its average magnitude during 1–1.5 minutes only. Such generational deviations are especially problematic if they coincide at this time with fault events in the network. These circumstances cause particularly strong voltage distortions, which cannot be compensated for by special distributing transformer appliances—tap-changers in the sub-stations. It is worth reminding readers that a tap-changer is a slow-functioning electromechanical device controlling transformation ratio by connection-disconnection of different transformer's sections and, therefore, cannot react to the fast-changing power balance in a network [17].
The AC frequency is becoming less stable, which is the second major problem caused by the widespread use of PV power stations in the domestic network. Due to numerous research works [18,19,20,21,22], the problem of frequency stability and control exists in large networks, including those with significant renewable generation, and it becomes especially urgent with the increasing portion of solar electricity. The lack of electromechanical inertia in PV facilities, which helps stabilize frequency in a grid and is an actual component of conventional generators in power stations, prevents the increase of solar electricity over some limit [23]. For the island networks, this restriction stands at around 10–12%, and additional PV production requires substantial technical efforts. For most applications, the cardinal solution is the use of electric storage facilities.
The third obstacle to a significant PV intervention in the domestic network is the absence of solar activity during the night. Therefore, electric power systems should supply a missing power requirement because conventional generating facilities are based on the governance of fossil fuels. The additional obstacle to massive solar energy application is the non-homogeneous spread of domestic consumers' electricity demands in time, which achieves minimum at night and maximum in the evening hours when solar irradiation does not already exist. Owing to the restricted flexibility of conventional steam turbine generators, which can be regulated in a relatively narrow range of power, their installed ability should be capable of providing not less than 70–80% of a total energy supply [24]. This limit can be increased mainly by the installation of massive electrical storage.
Summarizing what was mentioned above, the main solution for substantial PV energy increase can be the application of large storage facilities able to compensate for the missing electrical power during peak requirements and, in this way, diminish conventional power generation by minimizing its usage to some appropriate scale. Storage solutions are now rather expensive (except for pumping hydro-storage), and this is unlikely to alter soon [25]. Furthermore, existing electrochemical, mechanical, or special material solutions (for example, superconductivity) are not scalable to the requisite levels [26,27,28]. Nevertheless, a hybrid combination of solar PV generation with pumped storage may be the solution to these challenges [29,30,31,32]. Pumped hydro-storage is a viable method for large-scale energy production that provides reasonably inexpensive and adequate electricity. The practical cost of 2-3 cents per kWh is mentioned as an achievable price for electricity storage in hydro-pumped systems with 100 MW or more installed power. Because of these benefits, many applications of hydro-pumped appliances for renewables have been developed over the last 10–15 years [33,34,35]. Notwithstanding the benefits of hydro-storage, there are many questions about its practical application in real-world energy systems. As a result, the authors in [36,37,38] examined many techno-economic elements of optimal collaboration between solar or other renewable power generation and hydro-pumped storage. The findings of these studies point to a significant possibility for hydro-pumped storage in combination with renewable energy sources. However, for such systems to be effective, a proper selection of storage qualities and parameters must be made. As a result, the current restricted capabilities of various storage technologies will prevent the total abolition of fossil (or nuclear) powerplants in a national network from being achieved in the next 40–50 years. Hence, the optimal solution seems to be the optimal conjunction of renewable (namely, solar) and conventional generation of electricity added with storage systems, between which the hydro-pumped power stations for Israeli conditions are preferable.
Hydro-pumped storage can ensure the growing freshwater demands, along with clean energy production, and environmental preservation. Really, in the Israel region that is mostly arid, however, close to two seacoasts, the lack of a freshwater supply is being fulfilled by the seawater desalination process, which requires a big amount of electricity [39,40,41]. Among existing desalination approaches, the utilization of reverse osmosis membranes is promoted. The continuous advancement of this technology over time has resulted in low water costs as well as the durability of desalination plants. The desalination process is accompanied by the formation of a highly concentrated brine that must be disposed of. Nonetheless, brine is preferable discharged along the shore for economic purposes. For the time being, the Mediterranean lake is the primary source of seawater for desalination. Significant portions of brine in the eastern border of the Mediterranean offshore zone, which has few mixing currents, will result in a permanently saline area that will harm the sea's flora and fauna. Given the foregoing, freshwater production can be accompanied by pumped hydro-storage, which symbolizes a viable approach for balancing energy demands. For example, turbines capable of operating in seawater and concentrated (brine) water are already available [42] and might be used in electric systems.
The additional and significantly harmful environmental problem is the permanently decreasing level of the Dead Sea, which is causing its progressive disappearance. The negative balance between water inflow and evaporation causes a permanent decrease in its level and an eventual disappearance, which will represent a catastrophic environmental change. The Dead Sea area produces unique climate and balneological conditions. Intensively evaporating water masses rise upward and exert a positive influence on the entire climate of the adjacent area. It is impossible or extremely difficult to predict all the negative results if the Dead Sea is lost. The pumping hydro-storage can solve this problem by the way the brine, as a by-product, will be discharged to the Dead Sea instead of being returned to the Mediterranean. Being in the vicinity of the Dead Sea, the Mediterranean Sea can provide the water for the pumping to the Judea Mountings, where desalination plants should be established. The brine from desalination during the day will be accumulated in special ponds, and later in the evening hours it will be dumped into the Dead Sea through a cascade of hydro-power stations producing electricity at the scale required to compensate for the electricity demand during the peak hours in evening.
In summary, the creation of a Mediterranean-Dead Sea channel can address three critical concerns impeding Israel's future progress and prosperity: a major growth in renewable electricity generation, freshwater availability, and averting the extinction of the Dead Sea. However, certain critical difficulties must be addressed, such as the best path of a channel, determining the possible growth in PV electricity, and producing desalinated water.
This article describes the optimal approach for solving this problem. The article is organized as section 2 gives the statistical evaluation of its permanently decreasing level and external surface area; 3—Methods represent the methodology of the optimal parameter calculation; and the next section, 4—Results, analyzes the outcome of the investigation. Sections 5—Discussion—and 6—Conclusions—declare the important issues of the performed research work.
2. Dead Sea Review
The Dead Sea region is a unique natural water reservoir that was created millions of years ago near the Jordan Valley in the Great Syria-African Rift, which represents a break in the earth’s crust extending 6,000 km from the Lebanon Mountains to Mozambique in southeast Africa. Its basin is separated from the worldwide ocean, and for millions of years, because of water evaporation and freshwater income from the Jordan River from the Lebanon Mountains, a special eco-system was produced. The relatively constant balance between incoming and evaporating water was destroyed during the last 80–90 years because of a reduced supply of water extensively used for agricultural needs and developing mining industries employing sea brine for different mineral productions. The relatively constant balance between incoming and evaporating water was destroyed during the last 80–90 years because of a reduced flow of water extensively used for agricultural needs and developing mining industries employing sea brine for different mineral productions. The result of the evaporation-supply disbalance is a permanently lowered sea level and a decrease in the sea's surface area. The diagram in Figure 1 shows the alteration of the sea level [43]. The shrinking of the sea level surface, which diminished by about a third from 950 km2 to 620 km2 from 1960 to 2020, can be seen in Figure 2 [44]. The sea level dropped by more than 30 m, and this process is continuing at a rate of 1 m per year.
The important factor is the rate of water evaporation from the surface of the Dead Sea. It influences the amount of brine produced after the desalination process, which should be dumped into the sea without causing a significant rise in the water level. The extensive increase of Dead Sea surface is not desirable since it may cause environmental problems when rapidly rising water levels can flood existing structures and roads near the coast. The expression connecting the aggregate volume of evaporated water with the Dead Sea surface area is shown below [45,46]:
Where: , - is the saturation vapor pressure above a fresh water surface as a function of temperature and on the surface and in the air; Ψ - is the relative humidity (expressed as a fraction) and f(W) is an empirical function of wind speed W. The saturation vapor pressure can be described [45] as:
Where the result is obtained in mbar and θ-is the temperature in ⁰C degrees. The corrected saturation vapor pressure is:
Where coefficient β is an empirical function of a salinity S. The Coefficient β changes for different ionic compositions and is determined graphically [45]. Considering the composition of the water (in the Mediterranean, the main ions are MgCl2 and NaCl, whereas in the Dead Sea, KCl ions are prevalent), the coefficient β is 1.09–1.1 times bigger for the first sea region than for the other. Thus, the evaporation process of the brine after desalination of the Mediterranean water will be faster than that of the Dead Sea, as predicted by equation (1). Hence, the decrease in water altitude can be greater than the existing 1 m/year. Therefore, the potential dumping of a brine volume can be larger, and together with a gradual increase in sea surface area because of sea level rise, pumped hydro-storage can be much more significant.
Resuming what was mentioned above, the Dead Sea can be an excellent choice for creating hydro-pumped storage that can adopt surplus PV electricity production.
2. Methods
This section represents the total solution of the electric power system including conventional electricity generation, renewable PV production, and hydro-power storage with desalination facilities. Further, the analysis of energy demands and optimal parameters for PV electricity and freshwater production are represented.
2.1. The schematic diagram of a domestic electric power system combined from conventional generating facilities together with PV plants and hydro-power storage.
There are close to 20-22 potential locations of PV station sites from the South to the North on the Israeli map. The summarized ability of the annual energy is estimated as not less than 30 TWh/year or 18 GW of average power [47]. This magnitude of power is much more than the maximum observed during the last 5 years and can be achieved due to a prognosis only in 2030-35 years. Therefore, the capability to provide 25-30% of the total electricity supply from solar stations seems very realistic. However, the problems of stochastic and poor predictable solar electricity production force us to apply storage technology. As mentioned above, the best solution can be hydro storage. Taking into consideration the vicinity of the Dead Sea to the Mediterranean the best solution for hydro-pumping storage can be based on the channel between these two regions. The diagram of a channel with desalination facilities and accumulating pools in the Judea Mountings are shown in Figure 3.
The total potential of PV installations can be accessed as per the capability of storage technology and will be discussed later based on required electricity demands and the ability of the Dead Sea to assume brine water after desalination and evaporate it.
2.2. Estimation of the Dead Sea level increase as per the dumping of the sea water
Owing to the results of section 1 the estimation of the evaporation rate and the possible rate of a brine dumping to the Dead Sea can be evaluated. The calculations are based on a linear interpolation of surface area and evaporating. Assuming a historical alteration of the Dead Sea surface and water altitude the surface area as per the sea level altitude can be assessed:
Where: Δh is a water level rise, m; Htot – total decrease of the altitude during determined historic period; Abeg, A0 – surface area at the beginning of the historic period and now, km2.
The simplified differential equation of the altitude dynamics is described by the following:
Where: Vbrine – the rate of a brine dumping to the Dead Sea, km3/year; Vevap, νevap – the quickness of the volume and surface evaporate process, km3/year, m/year in accordance. The annual evaporation rate of an altitude can be considered as a constant value equal to 1.05-1.08 m/year as it is followed from section 1.
The character of a solution dependences on the right-hand side of the equation (5). If it is negative, thus sea level continues to decrease, when it is equal to zero – the sea surface altitude remains unchangeable, otherwise, if it is positive – the sea level begins to rise. The integral of (5) and the final solution are given below:
The solution of (6) depends on the sign of the expression . If it is negative, thus the sea level will decrease all the time, which makes no sense. If it is equal to zero, accordingly sea level will remain constant and the volume of a brine that can be directed to the Dead Sea will be equal to:
The case of positiveness represents the most interest since provides the possibility to increase brine dumping without negative outcomes. The sea level at the first period will grow, and this will be escorted by the enlarged surface area and, therefore, with the increasing evaporation velocity. After the rate of sea level enlarge equals to the evaporating velocity then the steady state when sea altitude remains on the same level, takes place. The bigger is brine dumping rate the higher is a steady state sea surface altitude. Below are graphs of the altitude increase during the years to come for some brine dumping velocities.
The magnitude of a dumping rate determines several important parameters of the electric industry combing conventional power stations, PV plants, and hydro-pumped storage with hydro-generating facilities. As well it ensures the total volume of desalinated water and the amount of energy stored in the hydro-pumped facilities.
2.3. Analysis of the electricity demands and hypothetical solar electricity production.
The demands for electric power in Israel have a positive annual trend of 3%. This tendency will continue as it seems until 2030–2035 as the answer to the growing population and industry development. In this regard, and especially in view of the growing population density, the use of solar and other renewable energies is particularly relevant. Despite the rising electricity needs, the daily (hourly) character of the energy supply remains relatively constant. Some deviations related to specific weekdays and holidays can be neglected in our analysis. A typical diagram of domestic electricity requirements together with conventional and renewable power production is shown in Figure 4. The curve of supplied power has a minimum at night and in the early morning hours, gradually rising to midday with a slight decrease after noon. Further, the curve of electricity supply grows up once again, achieving the evening maximum and later relatively quickly slowing down to the night minimum. This type of electricity demand is rather unusual and different from needs in European countries, for example. This distinction can be explained by the widespread use of electrified public transportation in these regions. It is worth reminding that nearby all electrical needs (96–97%) are covered by conventional power plants that apply gas or coal burning for steam production for activating steam turbines. The presence of solar electricity and storage hydro-pumped systems with desalination facilities in the electric industry can dramatically change the curve of generating supply power (Figure 4). First, conventional stations can be activated much more reliably, providing power in a relatively narrow range deviating 10% to 12% up and down from the average. This circumstance is relevant as the PV production meets 25–30% of the total needs. Following this case, Section 1 (Positive generation balance in the time from t4 to t2) is distinguished (Figure 5) as characterized by the surplus of a conventional electricity production over requirements. The excess of power going to the Mediterranean water pumping to the altitudes of the Judea Mountings and freshwater production. The next in the daytime is Section 2 (Positive generation balance as well in the time from t1 to t3), when power demands are being covered by a summarizing of conventional stations together with PV facilities. This time, owing to the increased PV outcome, the surplus of electricity is once again directed to the water pumping and desalination. Later, in the evening hours after when the solar energy disappears and the time of the evening peak comes, the requirements (section of the storage energy release in the time t2-t4) are supplied by conventional power plants and hydro-pumped storage together. This time accumulated brine is dumped into the Dead Sea through a cascade of hydroelectric stations.
The calculations of the energy balance considering the importance of providing guidelines for the channel development, is being fulfilled for the averaging values of the electricity consumptions and solar PV power. The average level of a solar irradiation per day hours and net PV power per sq. m are represented below in Figure 6:
The primary parameter for the assessment of maximum allowable PV facilities sizing is the ultimate daily energy possibility (W) of hydro-power generation. The following expression gives the answer:
Where: ηHP-the total efficiency of hydropower stations. Today it can achieve a value of ~0.9 (90%), however, for sure we took 0.85 (85%) [48]; g – gravitational acceleration, 9.85 m/s2; Htot – summarized height between upper level of a brine pools and the lowest altitude of hydropower stations in the vicinity of the Dead Sea surface, m; , the brine density [49], equal to (1.06-1.07)∙103,[kg/m3]; Vyear – maximum allowable brine dumping, km3/year. It is worth noting that the entire height of brine dumping is defined by the unique path of a channel and can range from the depth of the Dead Sea level beneath the Mediterranean to the height of brine lakes in the Judea Mountings. In practice, it may range from 600m to 1000m.
Considering results of Figure 4 and expression (8), the total daily energy production is represented by curves in Figure 7 for different heights (Htot) of a brine dumping.
The electrical energy generated from conventional and renewable power stations is used to produce fresh water and as a co-product some volume of brine. Today the desalination procedure is mainly based on reverse osmosis as the most effective and cheapest technology in the Middle East region [49]. This technology uses the property of the special osmosis membrane to pass fresh water through from a salted solution under pressure that overcomes some magnitude. Owing to this circumstance, this process requires energy which is expressed in kilowatt-hours per cubic meter of fresh water. The energy demands for water desalination [50,51] depend on the type of membrane configuration (the single- or two-stage water pass) and recovery coefficient -the ratio of the obtained fresh to the total seawater volume. For the Mediterranean region for a single stage pass and ~45% (Krec) of recovery coefficient that is the most usable there, the energy demands equal to Ewd=4.2-4.5 kWh/m3 (~4.3∙103, GWh/km3) of freshwater. This data was used in the present investigation.
Several requirements should be fulfilled for daily energy generation in the system including conventional and renewable PV power stations, seawater desalination facilities, and hydro-power storage plants (Figure 5). The first one of them determines the power balance which provides the entire requirements of consumers by a summarized energy generation of conventional power stations and PV facilities:
The following constrain determines the required volume of a hydro-storage for covering an evening power peak:
Where: Pgen =(Pconv+PPV) – summarized electricity production of conventional power stations and PV plants; Pcons- domestic power consumption; t1, t2, - times in the integral (9) that depended on both electricity productions and consumers demands; KPS – coefficient of pumping storage efficiency is defining the ratio of a net electric storage energy to that that energy applied to generate it. KPS is determined by a ratio between the energy which will be realized from brine dumping through the cascade of hydropower stations and that has been consumed to raise seawater to the desalination facilities on mountain heights. The energy utilizing for a desalination process was not considered in the presented expression since resulting in freshwater production has its own cost and, therefore, can be neglected.
The afterwards requirement of a summarized Pconv and PPV generation ensures that the day peak of energy demands should be entirely covered:
The energy required for water lifting is summarized from the power needed to overcome the pressure of a water column and the friction during flow through pipes in the distance of their length. Following the guide of [52], the energy which will be utilized for seawater lifting is equal to:
Where: ηpump – pumping efficiency (~0.8-0.85); ΔH- is the difference between Mediterranean and Dead Sea levels (~400m); -the density of Mediterranean water ~ (1.02-1.03)∙103 kg/m3; Vsw-the volume of a seawater for a day; (Td+t1-t2) – the time of water pumping; - the coefficient of a laminar flow in pipes including pipes length L and diameter D, and the viscosity of a water solution μ.
The energy which will be obtained through the dumping of a brine (WHP) is as:
Where Krec – coefficient of recovery showing the portion of a freshwater obtained from a seawater. Therefore, the coefficient of a pumping storage efficiency KPS that expresses the productivity of a hydro-pumping storage:
In principle, coefficient KPS shows how many kWh of electricity can be obtained from each kWh of the energy spent to sea water pumping. The bigger KPS the better is represented energy system.
The magnitude of KPS for all internal coefficients in (11) which were assumed as constants (for pipes length equal to a real ~60 km), is both a function of a total height Htot and daily sea water volume Vsw can be calculated for pipes diameter 2m. Since the efficiency drops with the pumping altitude and with the number of hydro-cascades, the expression for KPS is as:
The expression (15) was obtained with the consideration that ~ each 100m of a pumping or hydro-generation the efficiency decreases exponentially. This function has decreasing tendence with the growing brine and desalinated water production. In turn, the brine volume is determined by the required amount of hydro-pumping storage release as is seen in (10). The graph of KPS (15) vs brine year producing is shown in Figure 8.
The represented curves prove the statement that for different brine volume production the tendency of the efficiency of a hydro-pumping storage has dissimilar direction. For a rate of 0.257 km3/year of brine production the lifting doesn’t influence and KPS remains constant. The lower rate of brine production (less than 0.257 km3/year) leads the increases in the efficiency when seawater lifting is raised, whereas the bigger rate causes a diminishing of the efficiency of hydro-pumping storage when the lifting height grows. Despite this negative tendency, the efficiency of a pumping hydro-storage remains higher than that of a case with a lower rate of brine release.
It is worth reminding the volume of freshwater which will be produced through the desalination process and the amount of electricity that will be consumed for this. The amount of freshwater (VFW) depends on the brine volume as:
The general quantity of daily electricity for the desalination can be assessed:
All mentioned above consideration should be taken for the optimization of PV electricity generation.
3. Results
The research methodology described above allows for the most efficient use of PV energy facilities. Three scenarios (Htot = 600, 800, and 1000m) were taken for the investigation. For each height, the maximum total daily energy storage is determined by (8). This quantity of electricity is known as "storage energy realization," or WSER. It is equal to the integral (18) (see Figure 5) in the time interval t2-t4:
This energy WSER must be equal to or greater than the residual from meeting the total energy demand with the help of conventional and solar power plants. As it seems from (18), WSER is a function of the ability of conventional stations and the power of PV facilities. This circumstance makes the analytical solution for the assessment of both power parameters (PV and grid generation) more difficult. However, it can be solved by a numerical approach that takes into consideration construction (10), restrictions (9), and (11). The additional restriction required was based on the consideration that even the minimum conventional power should be surely bigger than the minimum domestic energy demands at night. Together, conventional power should be equal to or slightly more than the maximum evening peak. Thus:
The coefficient of reliability KR ensuring the consistency of power supply (despite the stochastic behavior of consumers) can be assumed to be 1.3–1.4. The additional requirement is associated with the feasible range of power control in the conventional power network, which can be represented as a ratio between minimum (Pmin) and maximum (Pmax) generating capability. Real-energy generating facilities based on a standard cycle of fuel burning and vapor production with the following use of turbines to rotate synchronous generators cannot operate in a wide range of powers without significant losses in efficiency. Considering this circumstance, some authors [53] introduced a parameter named flexibility factor (ff) equal to:
In the Israeli electric industry in the 2006–2010 years, ff was equal to 0.65. That is the range in which a power control lies between Pmax/Pmin <2.85. The immense introduction of PV and other renewable sources with massive storage appliances will allow an efficiency increase in conventional power facilities. Therefore, the range of power control should be narrower and the relation Pmax/Pmin should not be bigger than 1.5–1.8. This range of possible power variations should be taken for investigation.
Additional restriction relates to the maximum allowable Dead Sea level increase that due to ecological reasons cannot be more than ~35m during 30 future years. Therefore, maximum brine dumping (Equation (6), Figure 4) should be ~1.6 km3/year.
For the study of the influence of all involved parameters, special MATLAB software was developed. This software provides numerical solutions that are graphically represented below.
The influence of renewable electricity generation for some altitudes of seawater lifting can be seen in Figure 9, which shows the consistent decrement of conventional power diminishing with growing PV production.
The dependence on brine and freshwater production vs. conventional power is seen in Figure 10a,b. The tendency of a potential freshwater (and brine) flow is non-monotonic with the change in seawater lifting for desalination. It is explained by the decreasing efficiency of the water pumping for raising and generating in the cascade of hydropower stations with the elevation of seawater lifting height. This circumstance should be considered in the development of a real project.
6. Discussion
The tendency toward increasing renewable energy production leads to finding unusual techno-economic solutions able to neutralize the negative results of a massive introduction of PV facilities into domestic networks. In Israel, where the electrical industry is rather isolated and relatively small, the major answer to the PV problem is the use of energy storage technologies. Considering Israel's geographic location in the vicinity of the Mediterranean and Dead Seas, the optimal solution seems to be the development of a channel between those seas. Additional important reasons approve this decision. The first is a consistently growing gap of 400 m below Dead Sea level under the worldwide ocean, which can be exploited to produce surplus electricity. The second reason is the rising demands for freshwater (desalinated) production due to increasing population and industry. Altogether, including the requirements of energy storage for smoothing stochastic PV generation, make the project of a channel between the Mediterranean and Dead Sea especially actual and valid. However, between both seas are located the Judea Mountings, and this circumstance requires a special and precise investigation of the channel parameters influencing the outcomes of its functionality. The research was based on a detailed analysis of daily electricity consumption, solar possibilities to generate electrical power in the daytime, the feasibility of seawater desalination with reverse osmosis, energy expenditures for water pumping, and achievable generation in hydro-power stations. The obtained results show the following possibilities and advantages of the project: First, the optimal solution for electricity production should be a combination of conventional generating facilities (power stations based on burning fossil fuels) with PV plants and a cascade of hydropower stations. The optimal topology of the channel includes the placement of desalinating facilities on the heights of the Judea Mountings, for which the Mediterranean water will be lifted at a time characterized by a surplus of electricity. As a rule, this is a deep night with minimal energy consumption that is much smaller than the economically permissible minimum of conventional stations. Beyond it can be noontime, when PV plants can have a significant power surplus over consumption. Together with water feeding for desalination plants, a surplus of energy is spent on freshwater production and accumulating brine, as a co-product of a desalination process, in special ponds adjacent to a descent to the Dead Sea. Later, at the time of the evening consumption peak, the brine will be dumped into the Dead Sea through a cascade of hydropower stations, and this way, stored hydro-energy will be realized. The following results can be obtained depending on the total elevation difference of the hydro-power power plants over the Dead Sea level. First, conventional generation based on fuel burning can be decreased by 35–40% at a minimum. Together with this, the flexibility factor of the electro-generating industry can achieve a value of 0.16-0.17, meaning that the relation between maximal and minimally generated power is only 1.2, which provides additional improvement to the efficiency of conventional stations. The total output of hydropower stations can reach a level of 320–330 MW, and the output of installed PV plants cannot be less than 8–10 GW. The hydro-storage may daily provide 3.5–4 GWh, together with 150–180×103 m3 of freshwater production.
Conclusions
In conclusion, the challenges posed by the increasing solar electricity production in the Israeli energy industry can be effectively addressed through the installation of electrical storage systems. Among the potential solutions, the creation of a channel between the Mediterranean and the Dead Sea holds great promise. This channel can not only generate desalinated water to meet domestic, industrial, and agricultural needs but also prevent the permanent decline of the Dead Sea and create hydro-pumping electrical storage stations. Additionally, it can facilitate the development of numerous PV facilities in the Negev area for national electricity generation. However, further detailed analysis, including stochastic PV outcome and the potential use of the Dead Sea for brine discharge from electrical hydro-storage plants, should be conducted to accurately estimate the increase in solar electric generation. By implementing innovative solutions like the channel between the Mediterranean and the Dead Sea, Israel can effectively manage the challenges associated with the expansion of solar electricity production and ensure a sustainable energy future.
Author Contributions
conceptualization, M.A., and S.L.; methodology, M.A. and A.S.; formal analysis, A.S.; investigation, S.L.; data curation, S.L.; writing—original draft preparation, M.A.; writing—review and editing, A.S.; supervision, M.A.; project administration, S.L.
Funding
“This research received no external funding”
Conflicts of Interest
“The authors declare no conflict of interest.”
References
- Li, G.; Shittu, S.; Diallo, T.M.; Yu, M.; Zhao, X.; Ji, J. A review of solar photovoltaic-thermoelectric hybrid system for electricity generation. Energy 2018, 158, 41–58. [Google Scholar] [CrossRef]
- Spyridonidou, S.; Sismani, G.; Loukogeorgaki, E.; Vagiona, D.G.; Ulanovsky, H.; Madar, D. Sustainable spatial energy planning of large-scale wind and PV farms in Israel: A collaborative and participatory planning approach. Energies 2021, 14, 551. [Google Scholar] [CrossRef]
- Milstein, I.; Tishler, A.; Woo, C. Wholesale electricity market economics of solar generation in Israel. Utilities Policy 2022, 79, 101443. [Google Scholar] [CrossRef]
- Guttikunda, S.K.; Jawahar, P. Atmospheric emissions and pollution from the coal-fired thermal power plants in India. Atmos Environ 2014, 92, 449–460. [Google Scholar] [CrossRef]
- Zhao, Y.; Wang, S.; Duan, L.; Lei, Y.; Cao, P.; Hao, J. Primary air pollutant emissions of coal-fired power plants in China: Current status and future prediction. Atmos Environ 2008, 42, 8442–8452. [Google Scholar] [CrossRef]
- Arcos-Vargas, A.; Cansino, J.M.; Román-Collado, R. Economic and environmental analysis of a residential PV system: A profitable contribution to the Paris agreement. Renewable and Sustainable Energy Reviews 2018, 94, 1024–1035. [Google Scholar] [CrossRef]
- Glenk, G.; Meier, R.; Reichelstein, S. Cost dynamics of clean energy technologies. Schmalenbach Journal of Business Research 2021, 73, 179–206. [Google Scholar] [CrossRef]
- Branker, K.; Pathak, M.; Pearce, J.M. A review of solar photovoltaic levelized cost of electricity. Renewable and sustainable energy reviews 2011, 15, 4470–4482. [Google Scholar] [CrossRef]
- Comello, S.; Reichelstein, S.; Sahoo, A. The road ahead for solar PV power. Renewable and Sustainable Energy Reviews 2018, 92, 744–756. [Google Scholar] [CrossRef]
- Balali, M.H.; Nouri, N.; Omrani, E.; Nasiri, A.; Otieno, W. An overview of the environmental, economic, and material developments of the solar and wind sources coupled with the energy storage systems. Int J Energy Res 2017, 41, 1948–1962. [Google Scholar] [CrossRef]
- Ashwarya, S. Israel’s Renewable Energy Strategy: A Review of its Stated Goals, Current Status, and Future Prospects. Perceptions: Journal of International Affairs 2021, 26, 321–340. [Google Scholar]
- Rajput, S.; Amiel, I.; Sitbon, M.; Aharon, I.; Averbukh, M. Control the Voltage Instabilities of Distribution Lines using Capacitive Reactive Power. Energies 2020, 13, 875. [Google Scholar] [CrossRef]
- Amiel, I.; Rajput, S.; Averbukh, M. Capacitive reactive power compensation to prevent voltage instabilities in distribution lines. International Journal of Electrical Power & Energy Systems 2021, 131, 107043. [Google Scholar]
- Sultan, H.M.; Diab, A.A.Z.; Kuznetsov, O.N.; Ali, Z.M.; Abdalla, O. Evaluation of the impact of high penetration levels of PV power plants on the capacity, frequency and voltage stability of Egypt’s unified grid. Energies 2019, 12, 552. [Google Scholar] [CrossRef]
- Yan, R.; Saha, T.K. Investigation of voltage stability for residential customers due to high photovoltaic penetrations. IEEE Trans Power Syst 2012, 27, 651–662. [Google Scholar] [CrossRef]
- Saidi, A.S. Impact of grid-tied photovoltaic systems on voltage stability of 15unisian distribution networks using dynamic reactive power control. Ain Shams Engineering Journal 2022, 13, 101537. [Google Scholar] [CrossRef]
- Zhou, H.; Yan, X.; Liu, G. A review on voltage control using on-load voltage transformer for the power grid, IOP Conference Series: Earth and Environmental Science, IOP Publishing: 2019;, pp. 03 2144.
- Alam, M.; Chowdhury, T.A.; Dhar, A.; Al-Ismail, F.S.; Choudhury, M.; Shafiullah, M.; Hossain, M.; Ullah, A.; Rahman, S.M. Solar and Wind Energy Integrated System Frequency Control: A Critical Review on Recent Developments. Energies 2023, 16, 812. [Google Scholar] [CrossRef]
- Mansouri, N.; Lashab, A.; Sera, D.; Guerrero, J.M.; Cherif, A. Large photovoltaic power plants integration: A review of challenges and solutions. Energies 2019, 12, 3798. [Google Scholar] [CrossRef]
- Uzum, B.; Onen, A.; Hasanien, H.M.; Muyeen, S. Rooftop solar pv penetration impacts on distribution network and further growth factors—a comprehensive review. Electronics 2020, 10, 55. [Google Scholar] [CrossRef]
- Rajan, R.; Fernandez, F.M.; Yang, Y. Primary frequency control techniques for large-scale PV-integrated power systems: A review. Renewable and Sustainable Energy Reviews 2021, 144, 110998. [Google Scholar] [CrossRef]
- Shafiullah, M.; Ahmed, S.D.; Al-Sulaiman, F.A. Grid Integration Challenges and Solution Strategies for Solar PV Systems: A Review. IEEE Access 2022. [Google Scholar] [CrossRef]
- Zhang, Q.; Mao, M.; Ke, G.; Zhou, L.; Xie, B. Stability problems of PV inverter in weak grid: a review. IET Power Electronics 2020, 13, 2165–2174. [Google Scholar] [CrossRef]
- Solomon, A.A.; Faiman, D.; Meron, G. Grid matching of large-scale wind energy conversion systems, alone and in tandem with large-scale photovoltaic systems: An Israeli case study. Energy Policy 2010, 38, 7070–7081. [Google Scholar] [CrossRef]
- X Luo, J Wang, M Dooner, J Clarke. Overview of current development in electrical energy storage technologies and the application potential in power system operation. Appl. Energy. 2015, 137, 511–536. [Google Scholar] [CrossRef]
- D Akinyele, R Rayudu. Review of energy storage technologies for sustainable power networks. Sustainable Energy Technologies and Assessments. 2014, 8, 74–91. [Google Scholar] [CrossRef]
- Azzuni and, C. Breyer, "Energy security and energy storage technologies. " Energy Procedia 2018, 155, 237–258. [Google Scholar] [CrossRef]
- M. Z. Jacobson, M.A. Delucchi, M.A. Cameron and B.A. Frew, Low-cost solution to the grid reliability problem with 100% penetration of intermittent wind, water, and solar for all purposes. Proc. Natl. Acad. Sci. USA 2015, 112, 15060–15065. [Google Scholar] [CrossRef]
- M. Z. Jacobson and M.A. Delucchi, "Providing all global energy with wind, water, and solar power, part I: Technologies, energy resources, quantities and areas of infrastructure, and materials. Energy Policy 2011, 39, 1154–1169. [Google Scholar] [CrossRef]
- M. Aliyu, G. Hassan, S.A. Said, M.U. Siddiqui, A.T. Alawami and I.M. Elamin, "A review of solar-powered water pumping systems." Renewable and Sustainable Energy Reviews 2018, 87, 61–76.
- V. C. Sontake and V.R. Kalamkar, "Solar photovoltaic water pumping system - A comprehensive review. Renewable and Sustainable Energy Reviews 2016, 59, 1038–1067. [Google Scholar] [CrossRef]
- T. Ma, H. Yang and L. Lu, "Feasibility study and economic analysis of pumped hydro storage and battery storage for a renewable energy powered island. Energy Conversion and Management 2014, 79, 387–397. [Google Scholar] [CrossRef]
- Blakers, A.; Stocks, M.; Lu, B.; Cheng, C. A review of pumped hydro energy storage. Progress in Energy 2021, 3, 022003. [Google Scholar] [CrossRef]
- Hunt, J.D.; Zakeri, B.; Lopes, R.; Barbosa, P.S.F.; Nascimento, A.; de Castro, N.J.; Brandão, R.; Schneider, P.S.; Wada, Y. Existing and new arrangements of pumped-hydro storage plants. Renewable and Sustainable Energy Reviews 2020, 129, 109914. [Google Scholar] [CrossRef]
- Hunt, J.D.; Byers, E.; Wada, Y.; Parkinson, S.; Gernaat, D.E.; Langan, S.; van Vuuren, D.P.; Riahi, K. Global resource potential of seasonal pumped hydropower storage for energy and water storage. Nature communications 2020, 11, 947. [Google Scholar] [CrossRef] [PubMed]
- W. Fang, Q. Huang, S. Huang, J. Yang, E. Meng and Y. Li, "Optimal sizing of utility-scale photovoltaic power generation complementarily operating with hydropower: A case study of the world’s largest hydro-photovoltaic plant. Energy Conversion and Management 2017, 136, 161–172. [Google Scholar] [CrossRef]
- Ming, P. Liu, S. Guo, X. Zhang, M. Feng and X. Wang, "Optimizing utility-scale photovoltaic power generation for integration into a hydropower reservoir by incorporating long- and short-term operational decisions. Applied Energy 2017, 204, 432–445. [Google Scholar] [CrossRef]
- T. Ma, H. Yang, L. Lu and J. Peng, "An optimization sizing model for solar photovoltaic power generation system with pumped storage. Energy Procedia 2014, 61, 5–8. [Google Scholar] [CrossRef]
- A Cipollina, G Micale, L Rizzuti, Seawater desalination: conventional and renewable energy processes, Springer Science & Business Media 2009.
- E Chafik. A new type of seawater desalination plants using solar energy. Desalination. 2003, 156, 333–348. [Google Scholar] [CrossRef]
- WG Shim, K He, S Gray, IS Moon. Solar energy assisted direct contact membrane distillation (DCMD) process for seawater desalination. Separation and Purification Technology. 2015, 143, 94–104. [Google Scholar] [CrossRef]
- L. Chen and W. Lam, "A review of survivability and remedial actions of tidal current turbines. Renewable and Sustainable Energy Reviews 2015, 43, 891–900. [Google Scholar] [CrossRef]
- https://icl-group-sustainability.com/reports/dead-sea-water-level/.
- https://water.fanack.com/publications/red-sea-dead-sea-project/.
- Salhotra, A.M.; Adams, E.E.; Harleman, D.R. Effect of salinity and ionic composition on evaporation: Analysis of Dead Sea evaporation pans. Water Resour Res 1985, 21, 1336–1344. [Google Scholar] [CrossRef]
- Chen, C.; Kuang, Y.; Hu, L. Challenges and opportunities for solar evaporation. Joule 2019, 3, 683–718. [Google Scholar] [CrossRef]
- https://www.gov.il/en/departments/publications/reports/potential_for_solar_production_on_existing_structures_jan_2020. 2020.
- Chang, J.; Li, Y.; Yuan, M.; Wang, Y. Efficiency evaluation of hydropower station operation: A case study of Longyangxia station in the Yellow River, China. Energy 2017, 135, 23–31. [Google Scholar] [CrossRef]
- Kress, N.; Gertner, Y.; Shoham-Frider, E. Seawater quality at the brine discharge site from two mega size seawater reverse osmosis desalination plants in Israel (Eastern Mediterranean). Water Res 2020, 171, 115402. [Google Scholar] [CrossRef] [PubMed]
- Stover, R.L. Seawater reverse osmosis with isobaric energy recovery devices. Desalination 2007, 203, 168–175. [Google Scholar] [CrossRef]
- Kim, J.; Park, K.; Yang, D.R.; Hong, S. A comprehensive review of energy consumption of seawater reverse osmosis desalination plants. Appl Energy 2019, 254, 113652. [Google Scholar] [CrossRef]
- Watton, J. Fundamentals of fluid power control, Cambridge University Press: 2009.
- Solomon, A.A.; Faiman, D.; Meron, G. Properties and uses of storage for enhancing the grid penetration of very large photovoltaic systems. Energy Policy 2010, 38, 5208–5222. [Google Scholar] [CrossRef]
Figure 1.
The lowering of the Dead Sea water level.
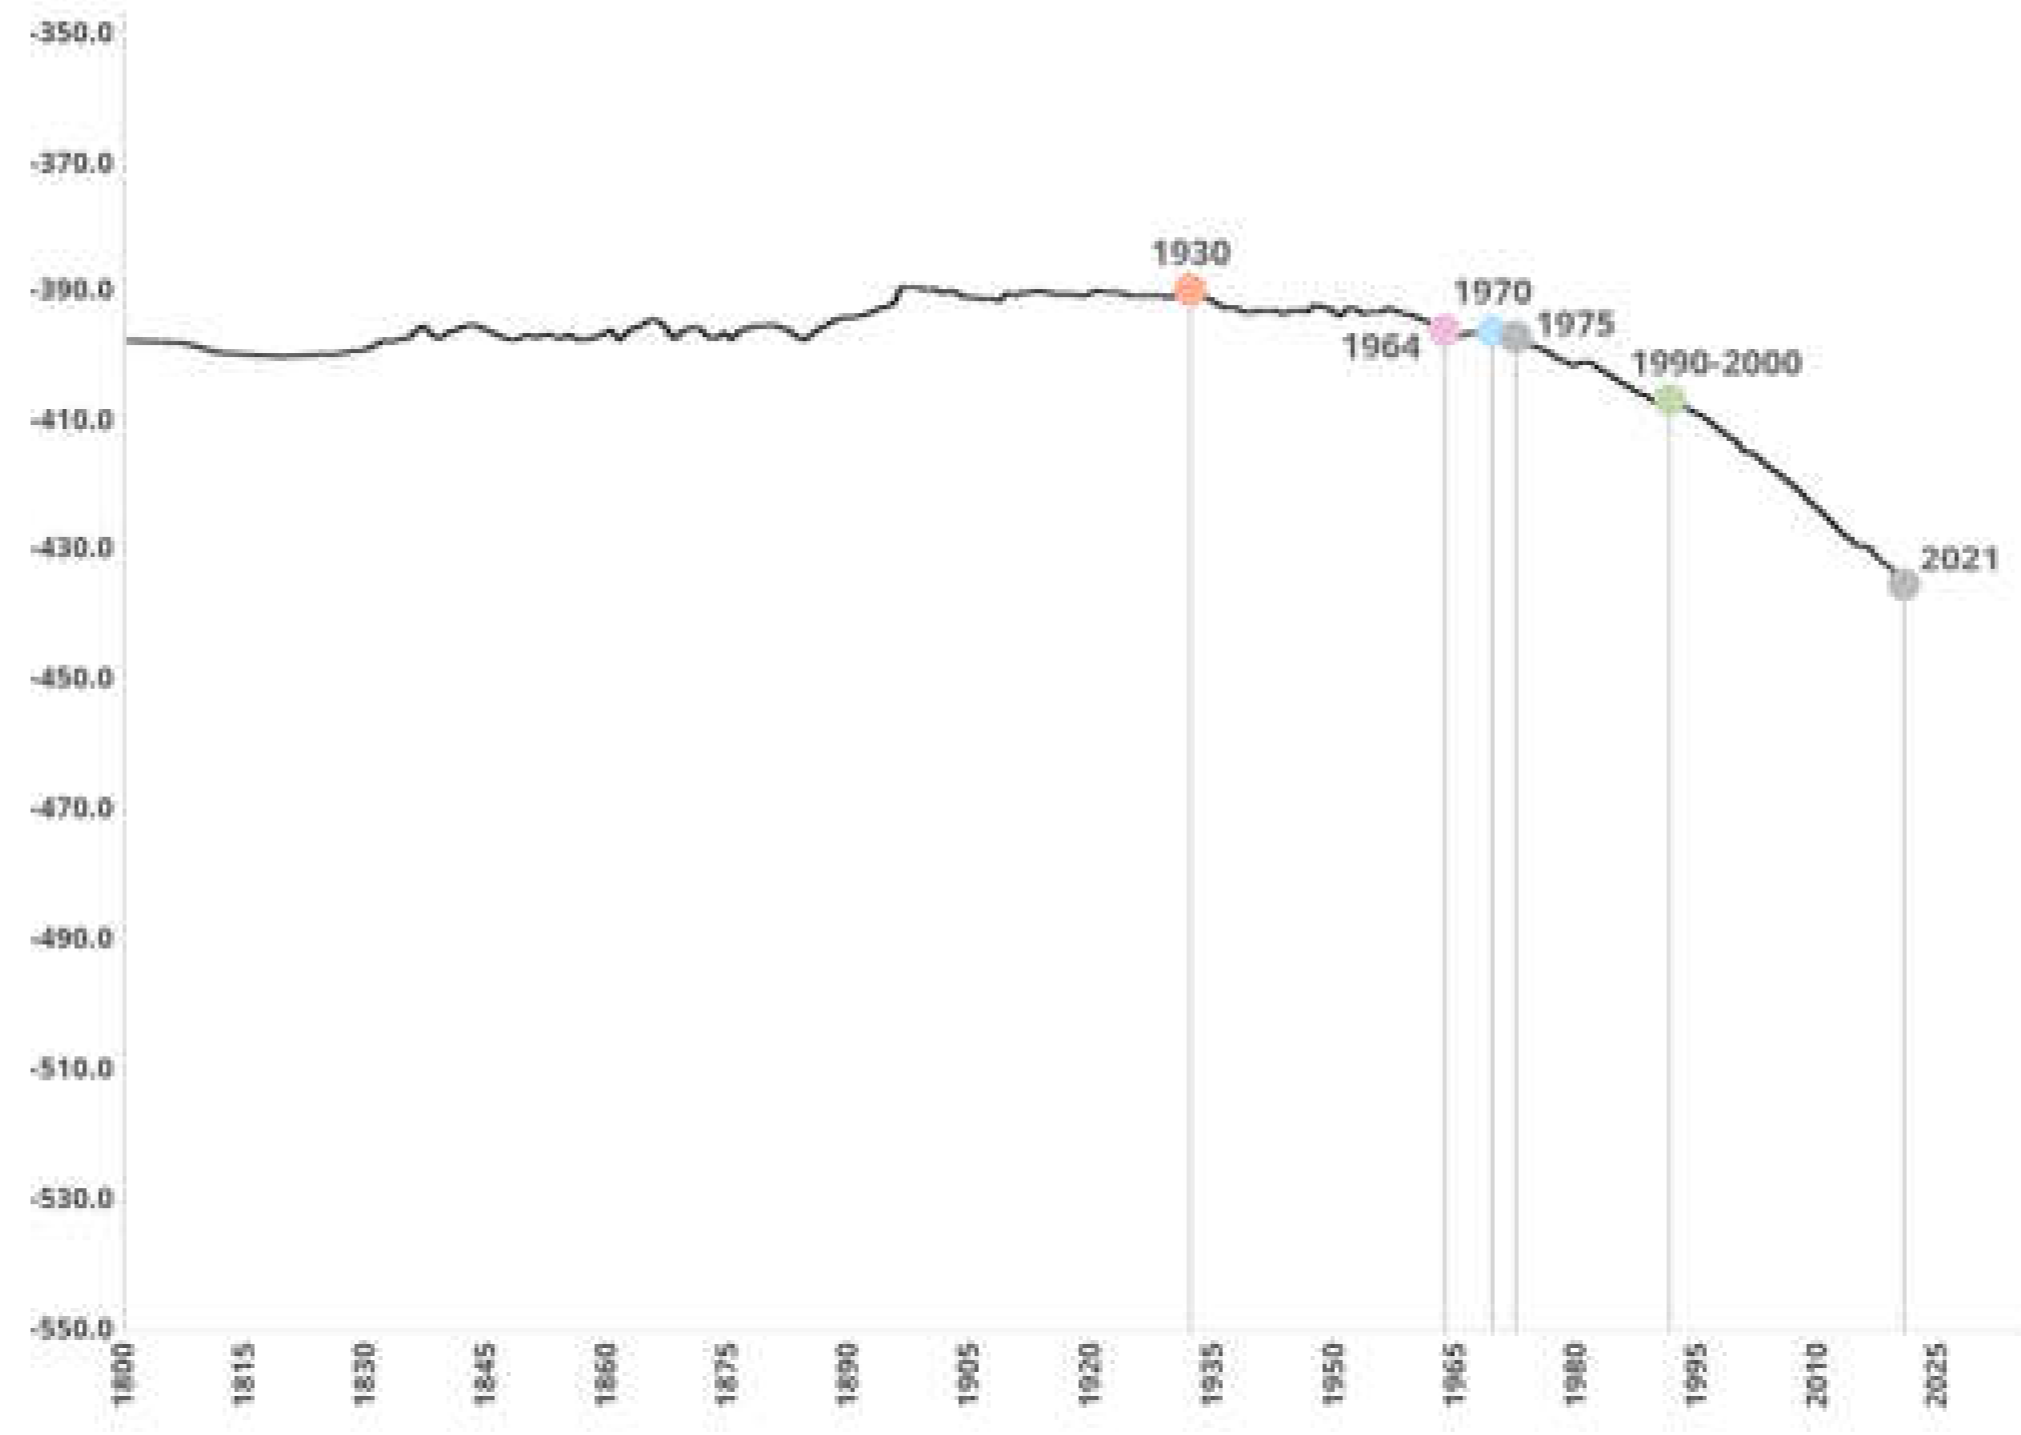
Figure 2.
The permanent decrease of the Dead Sea surface.
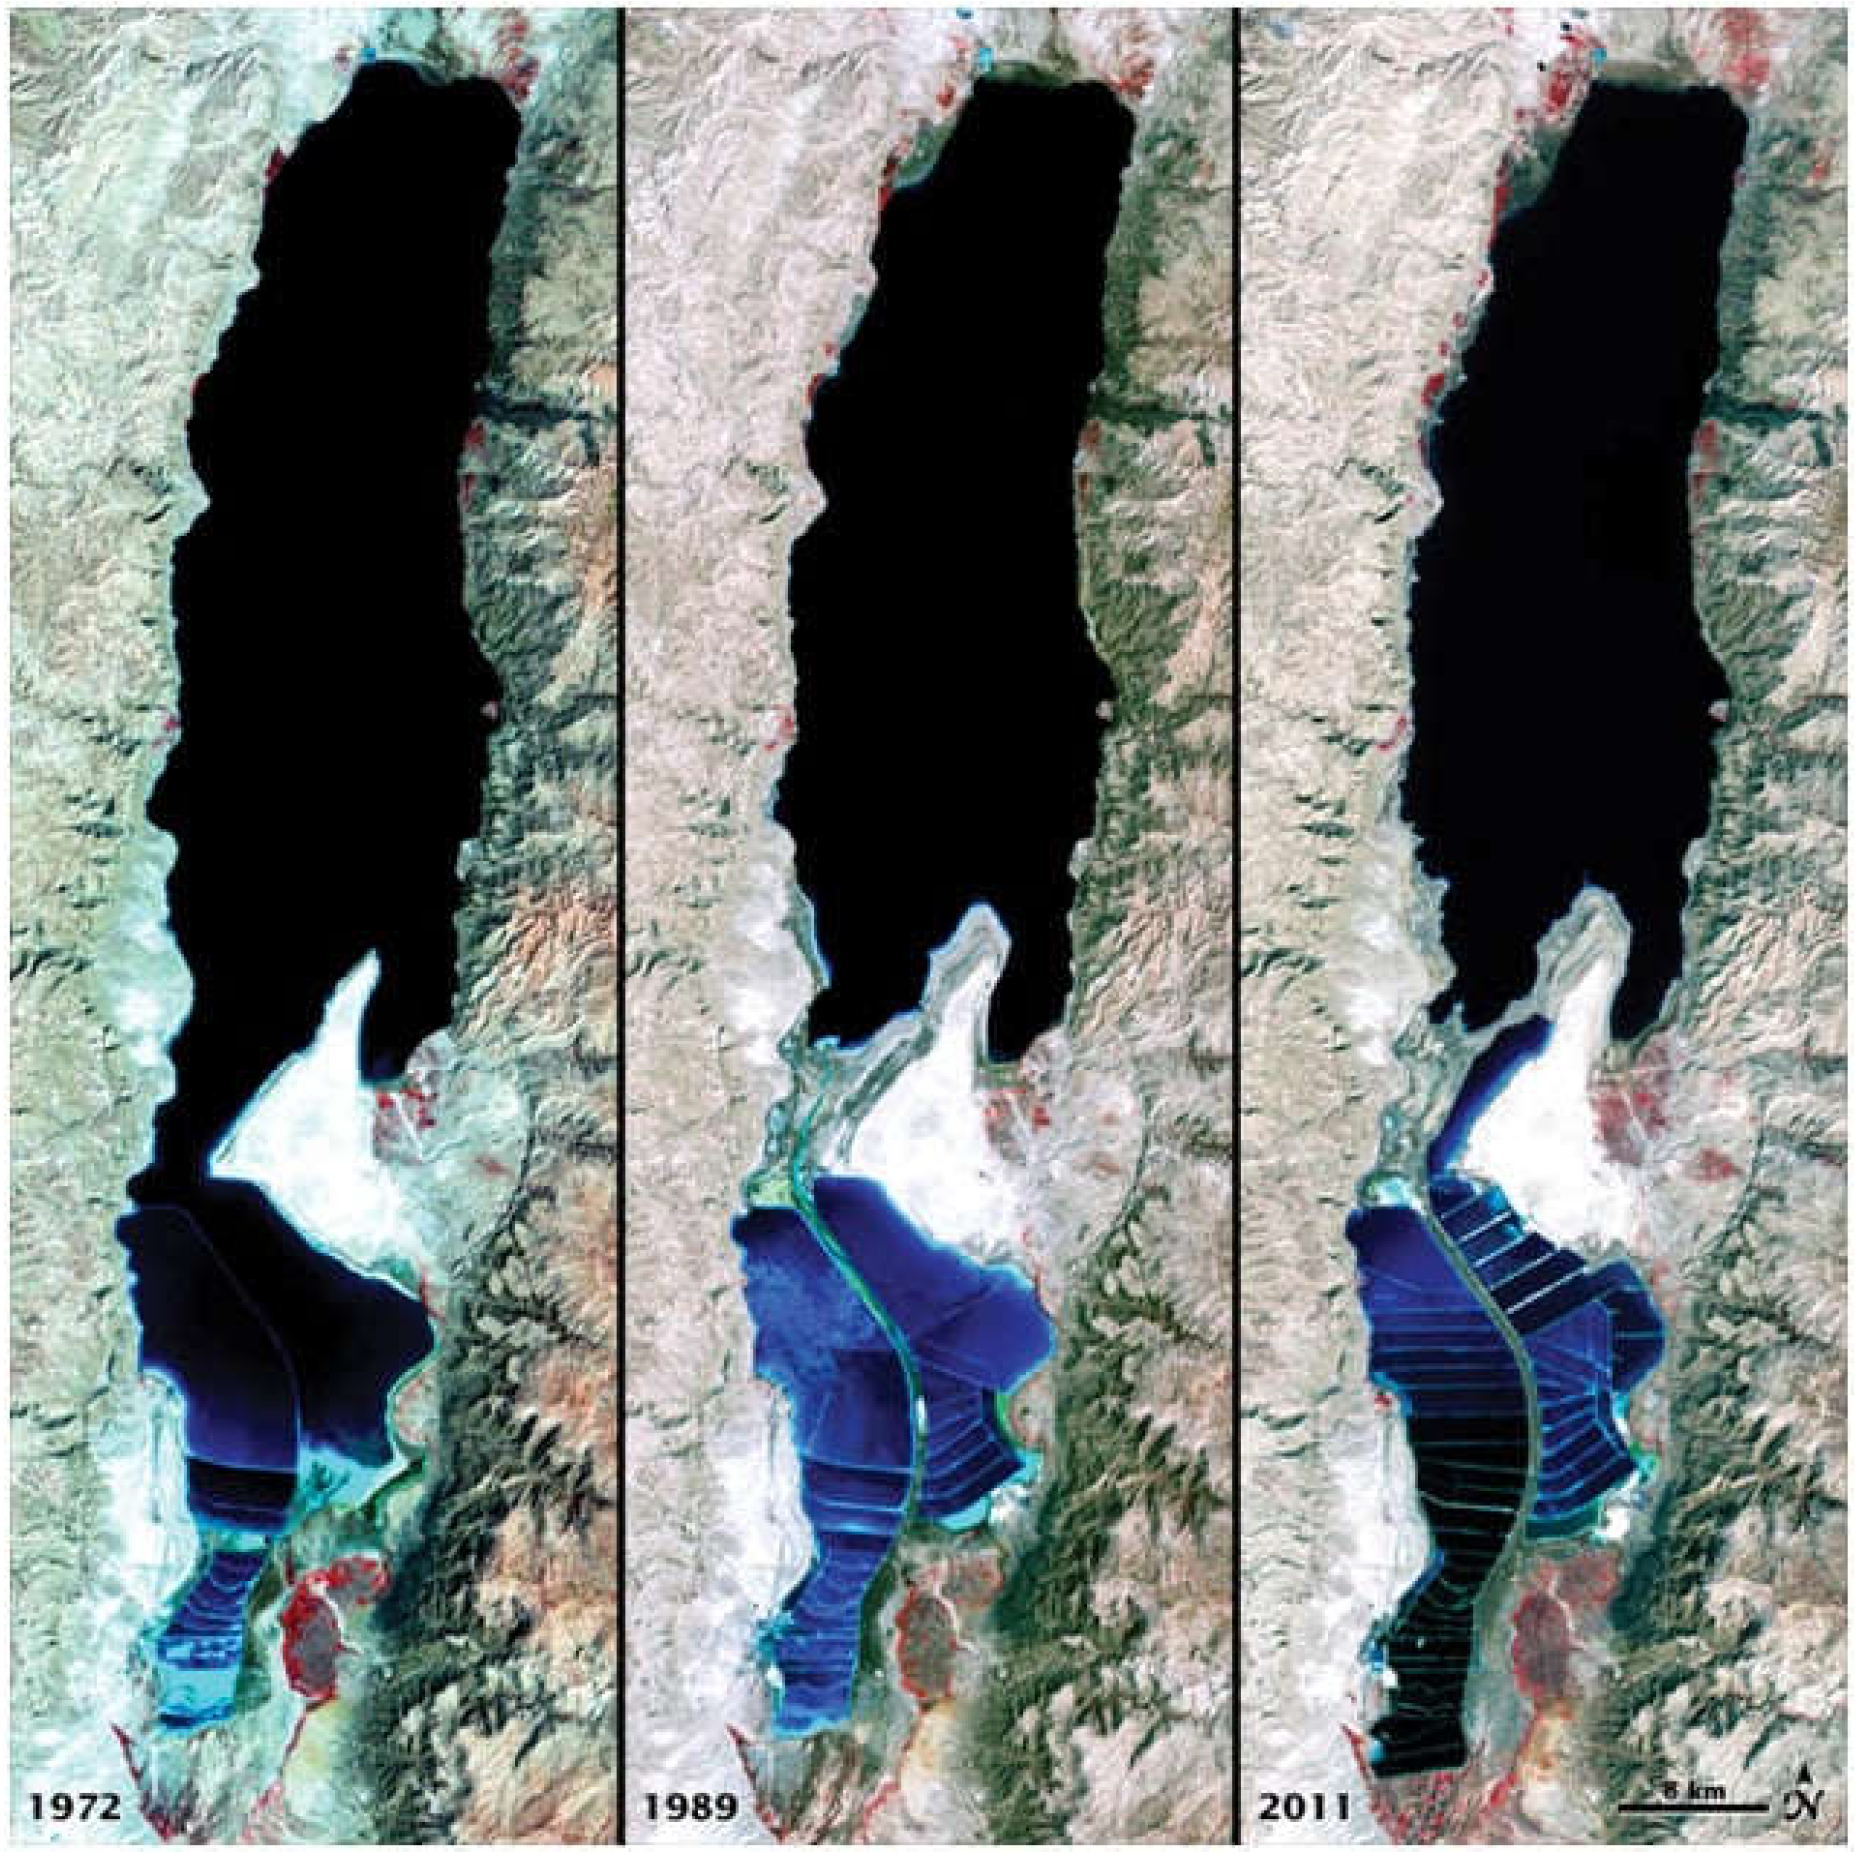
Figure 3.
The schematic diagram of the hydro-pumping storage based on a channel Mediterranean- Dead Sea.
Figure 3.
The schematic diagram of the hydro-pumping storage based on a channel Mediterranean- Dead Sea.
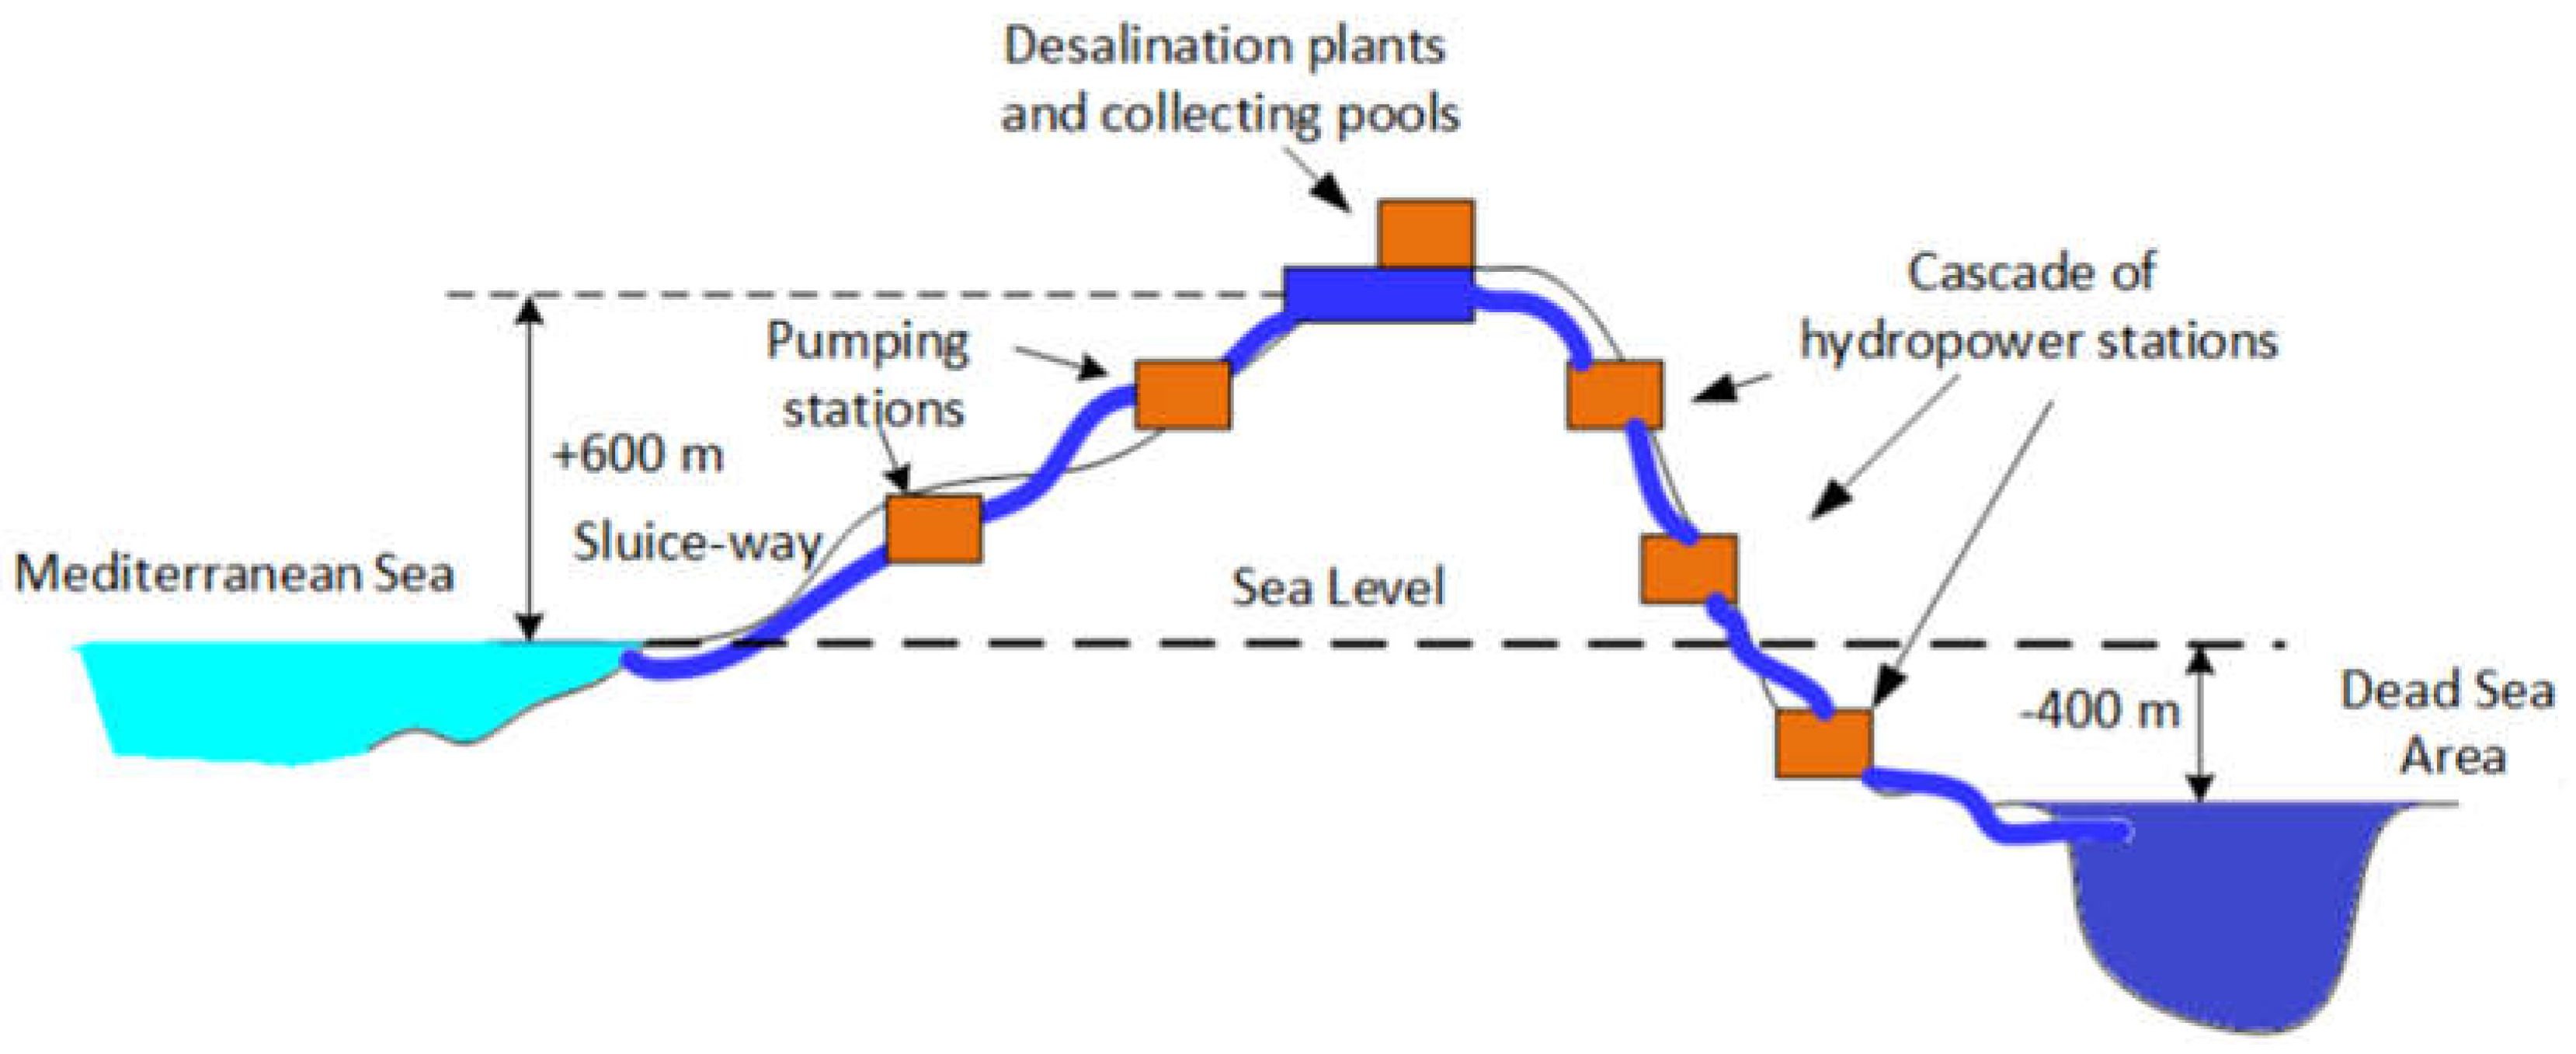
Figure 4.
The Dead Sea level rises as per different rates of brine dumping.
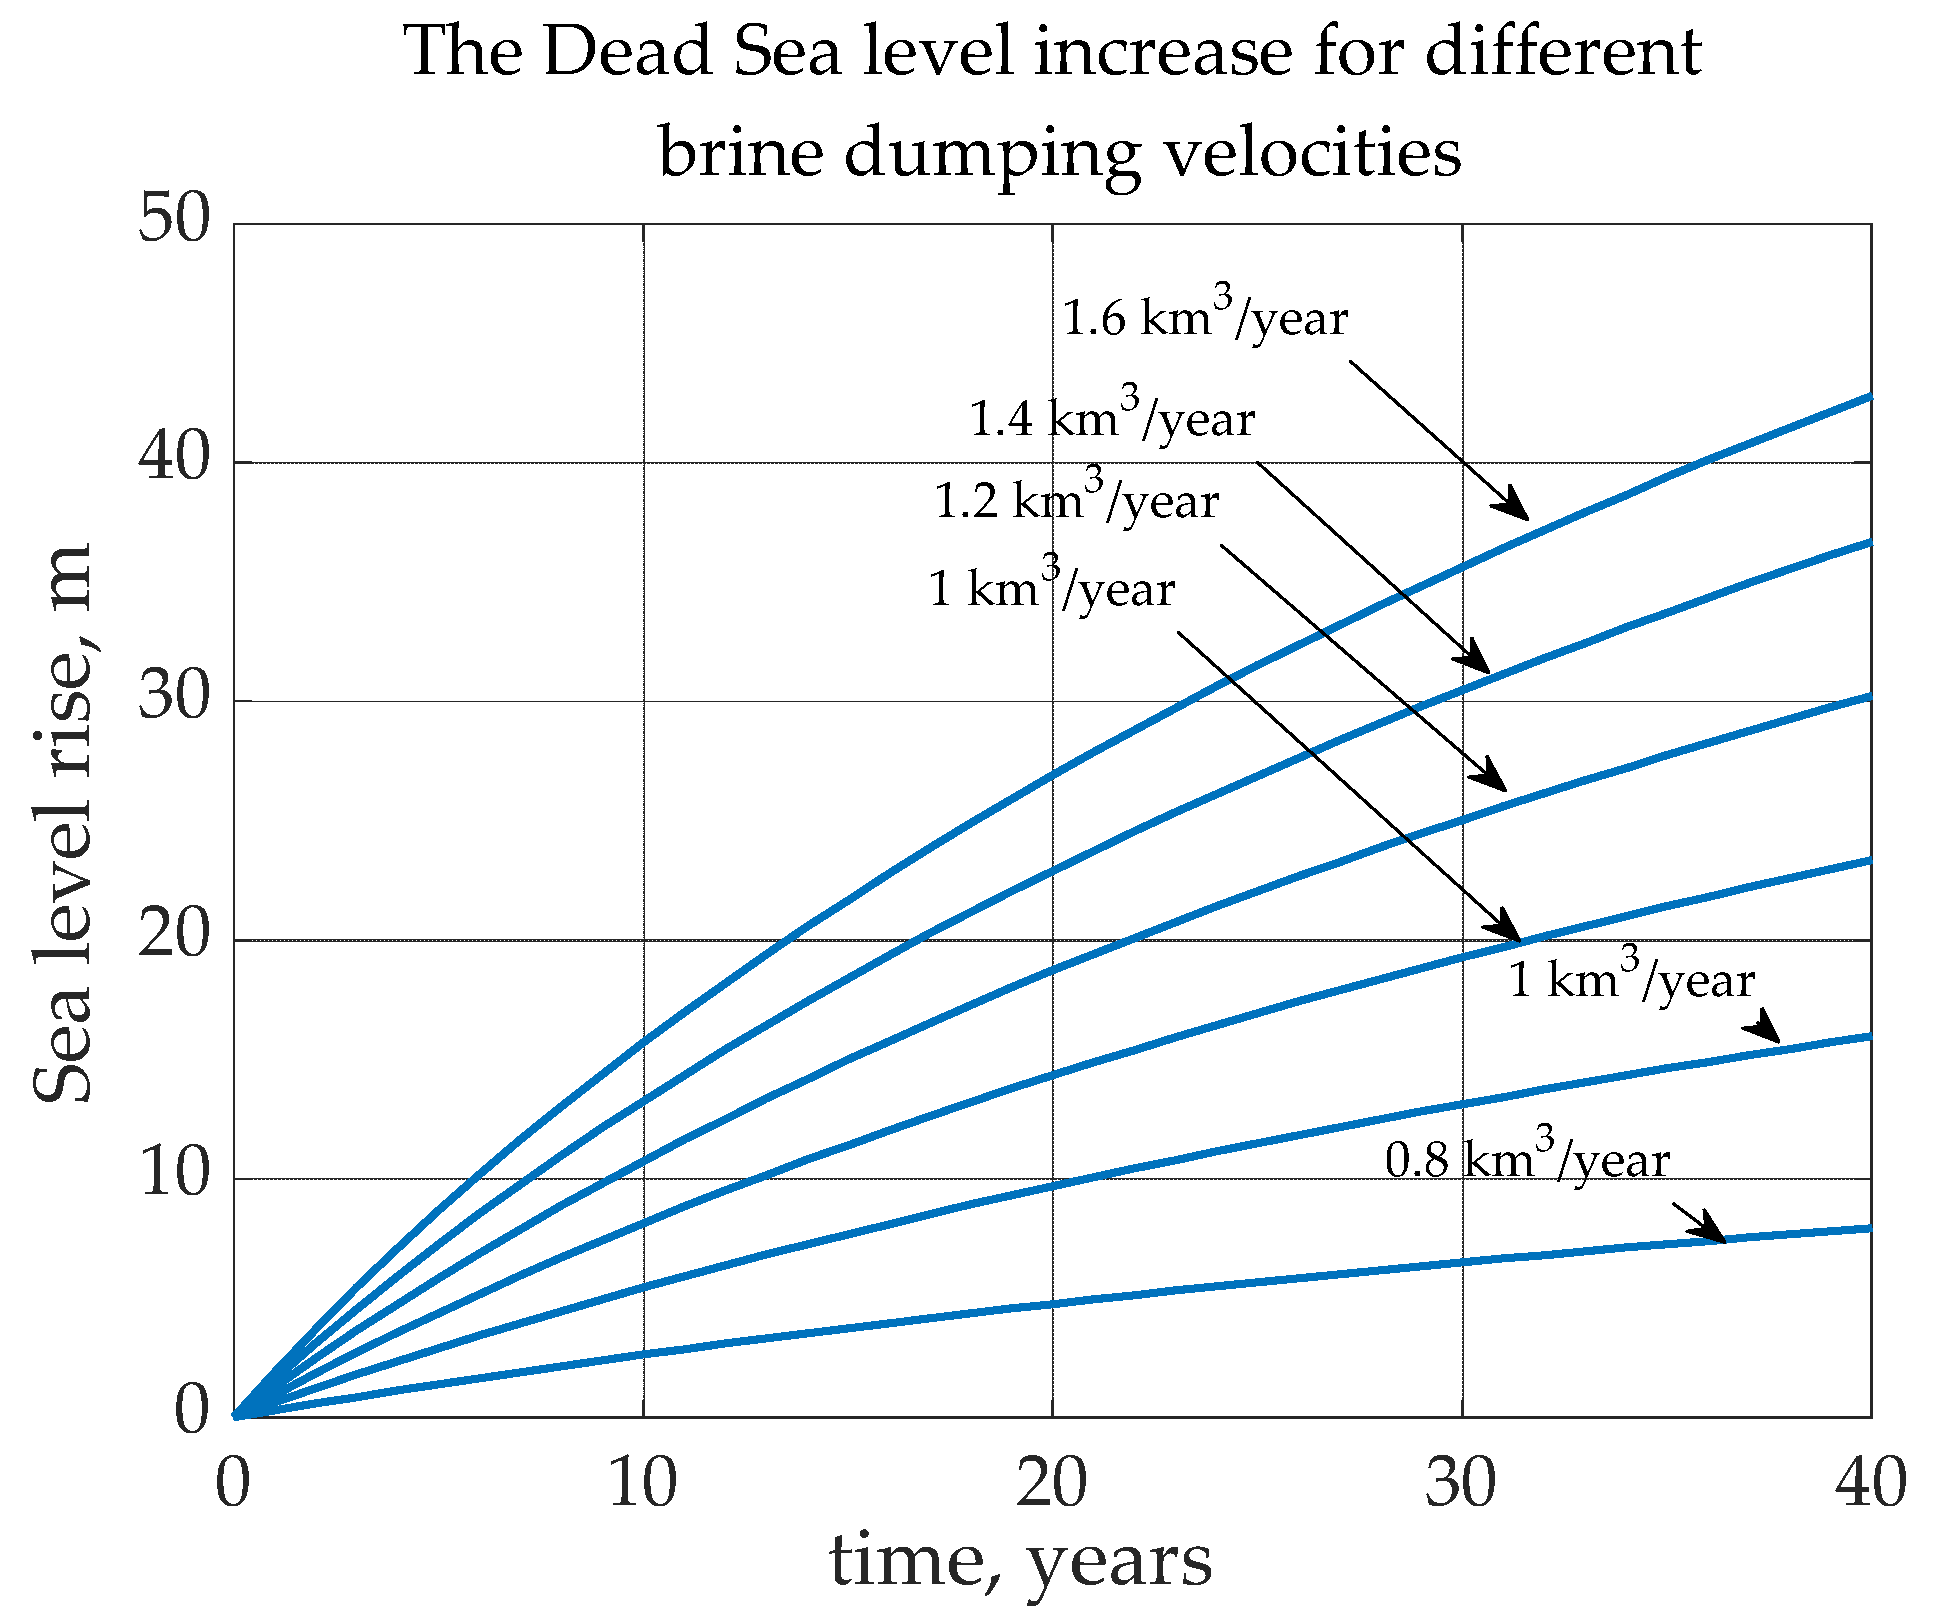
Figure 5.
Typical domestic power requirements with conventional, renewable (PV) electricity production, desalination process, and hydro-pumping storage.
Figure 5.
Typical domestic power requirements with conventional, renewable (PV) electricity production, desalination process, and hydro-pumping storage.
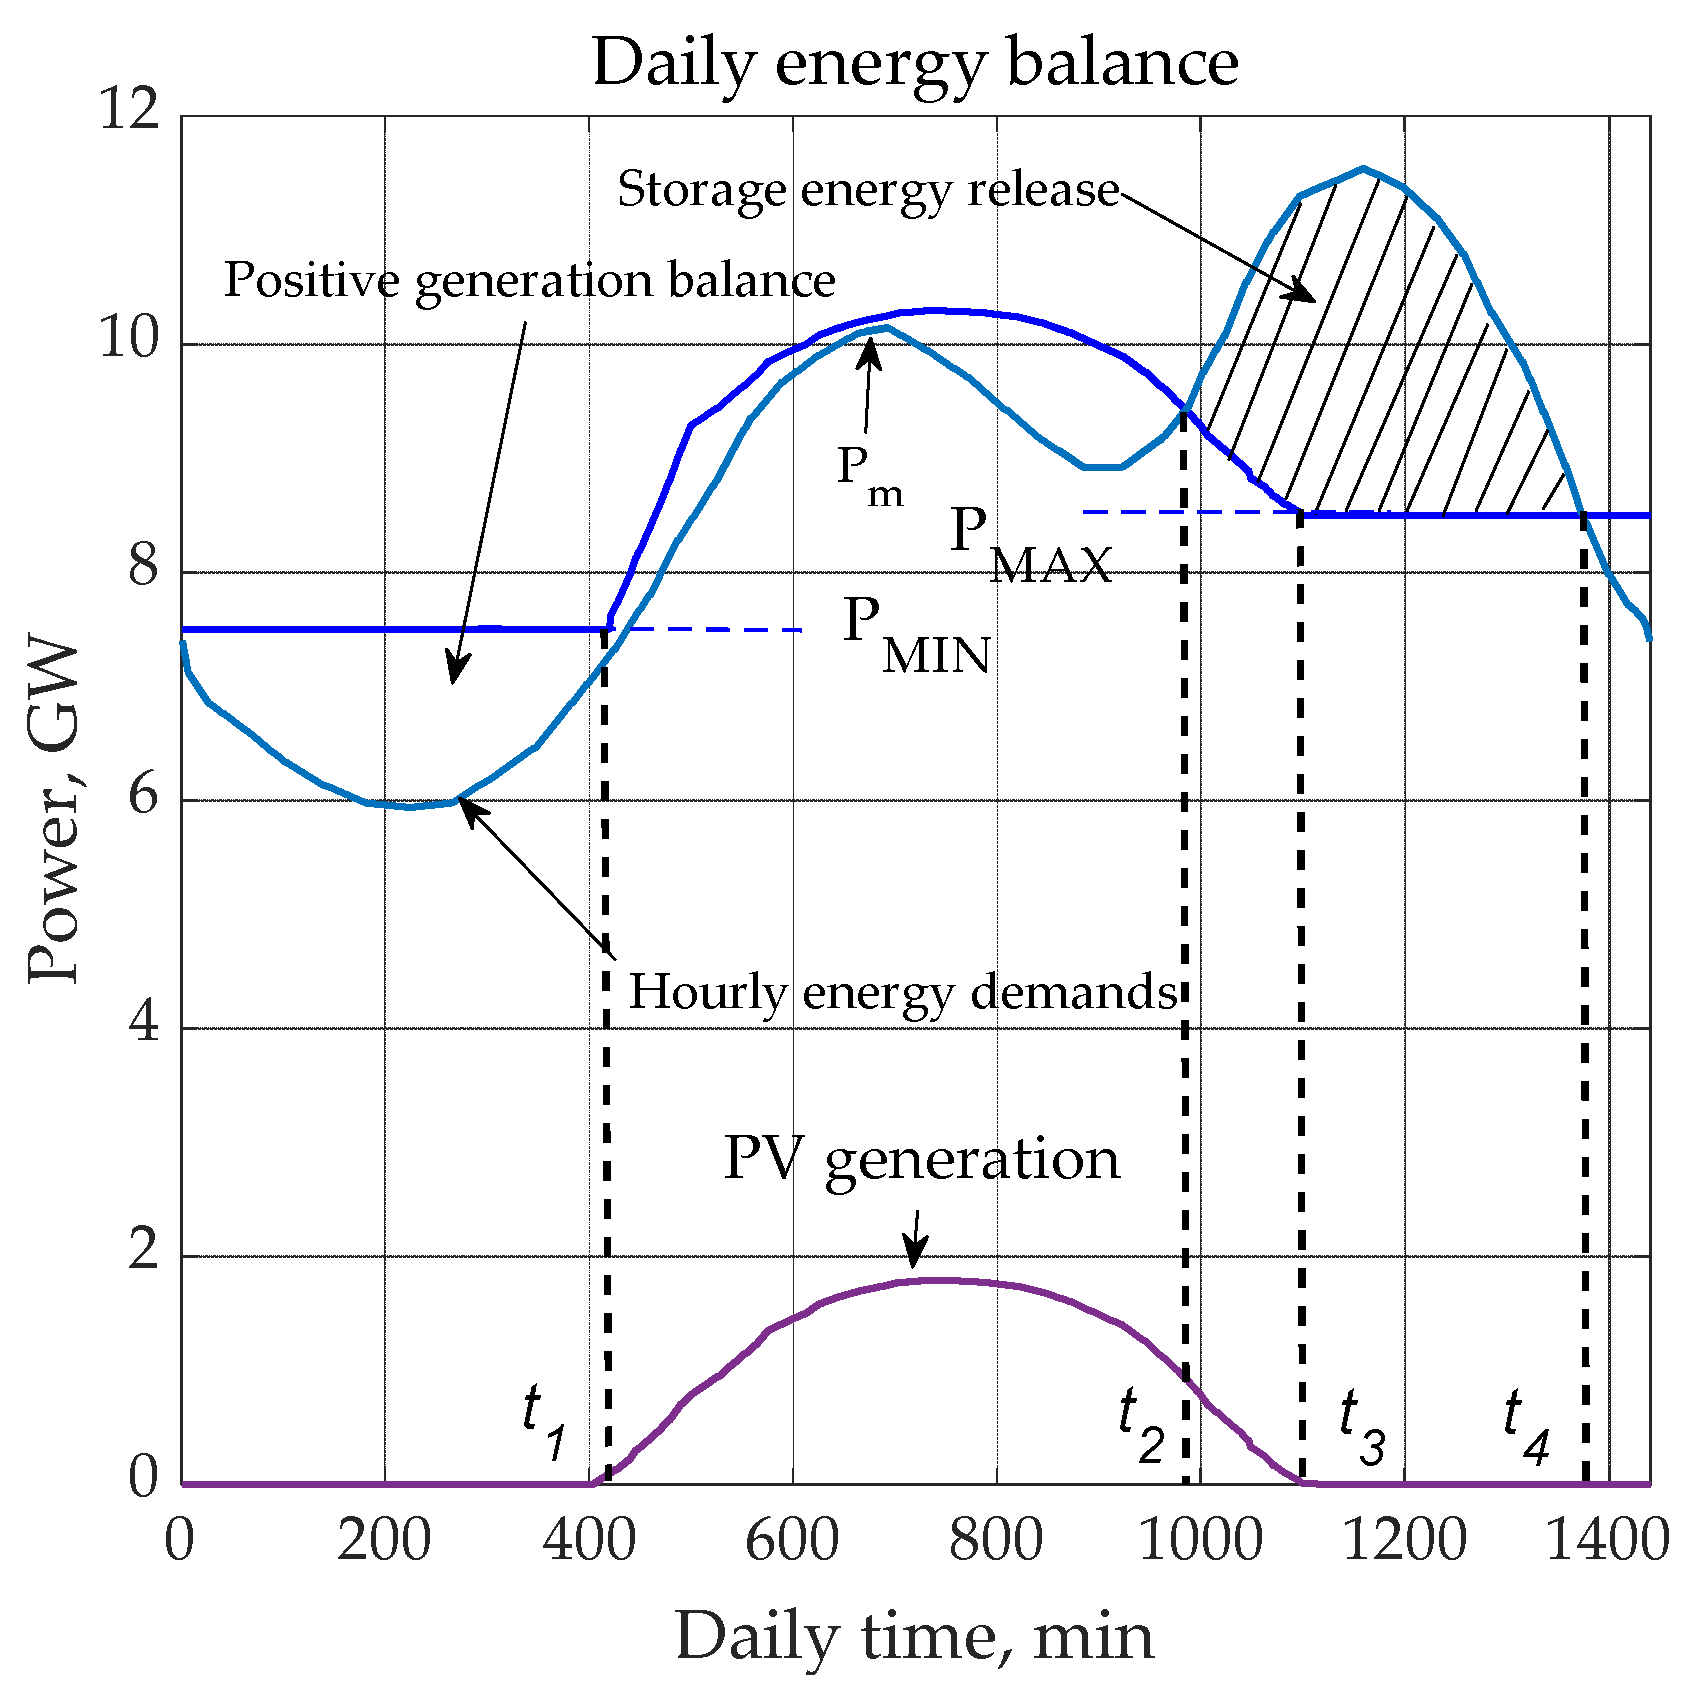
Figure 6.
Average solar irradiation and net PV power per day hours.
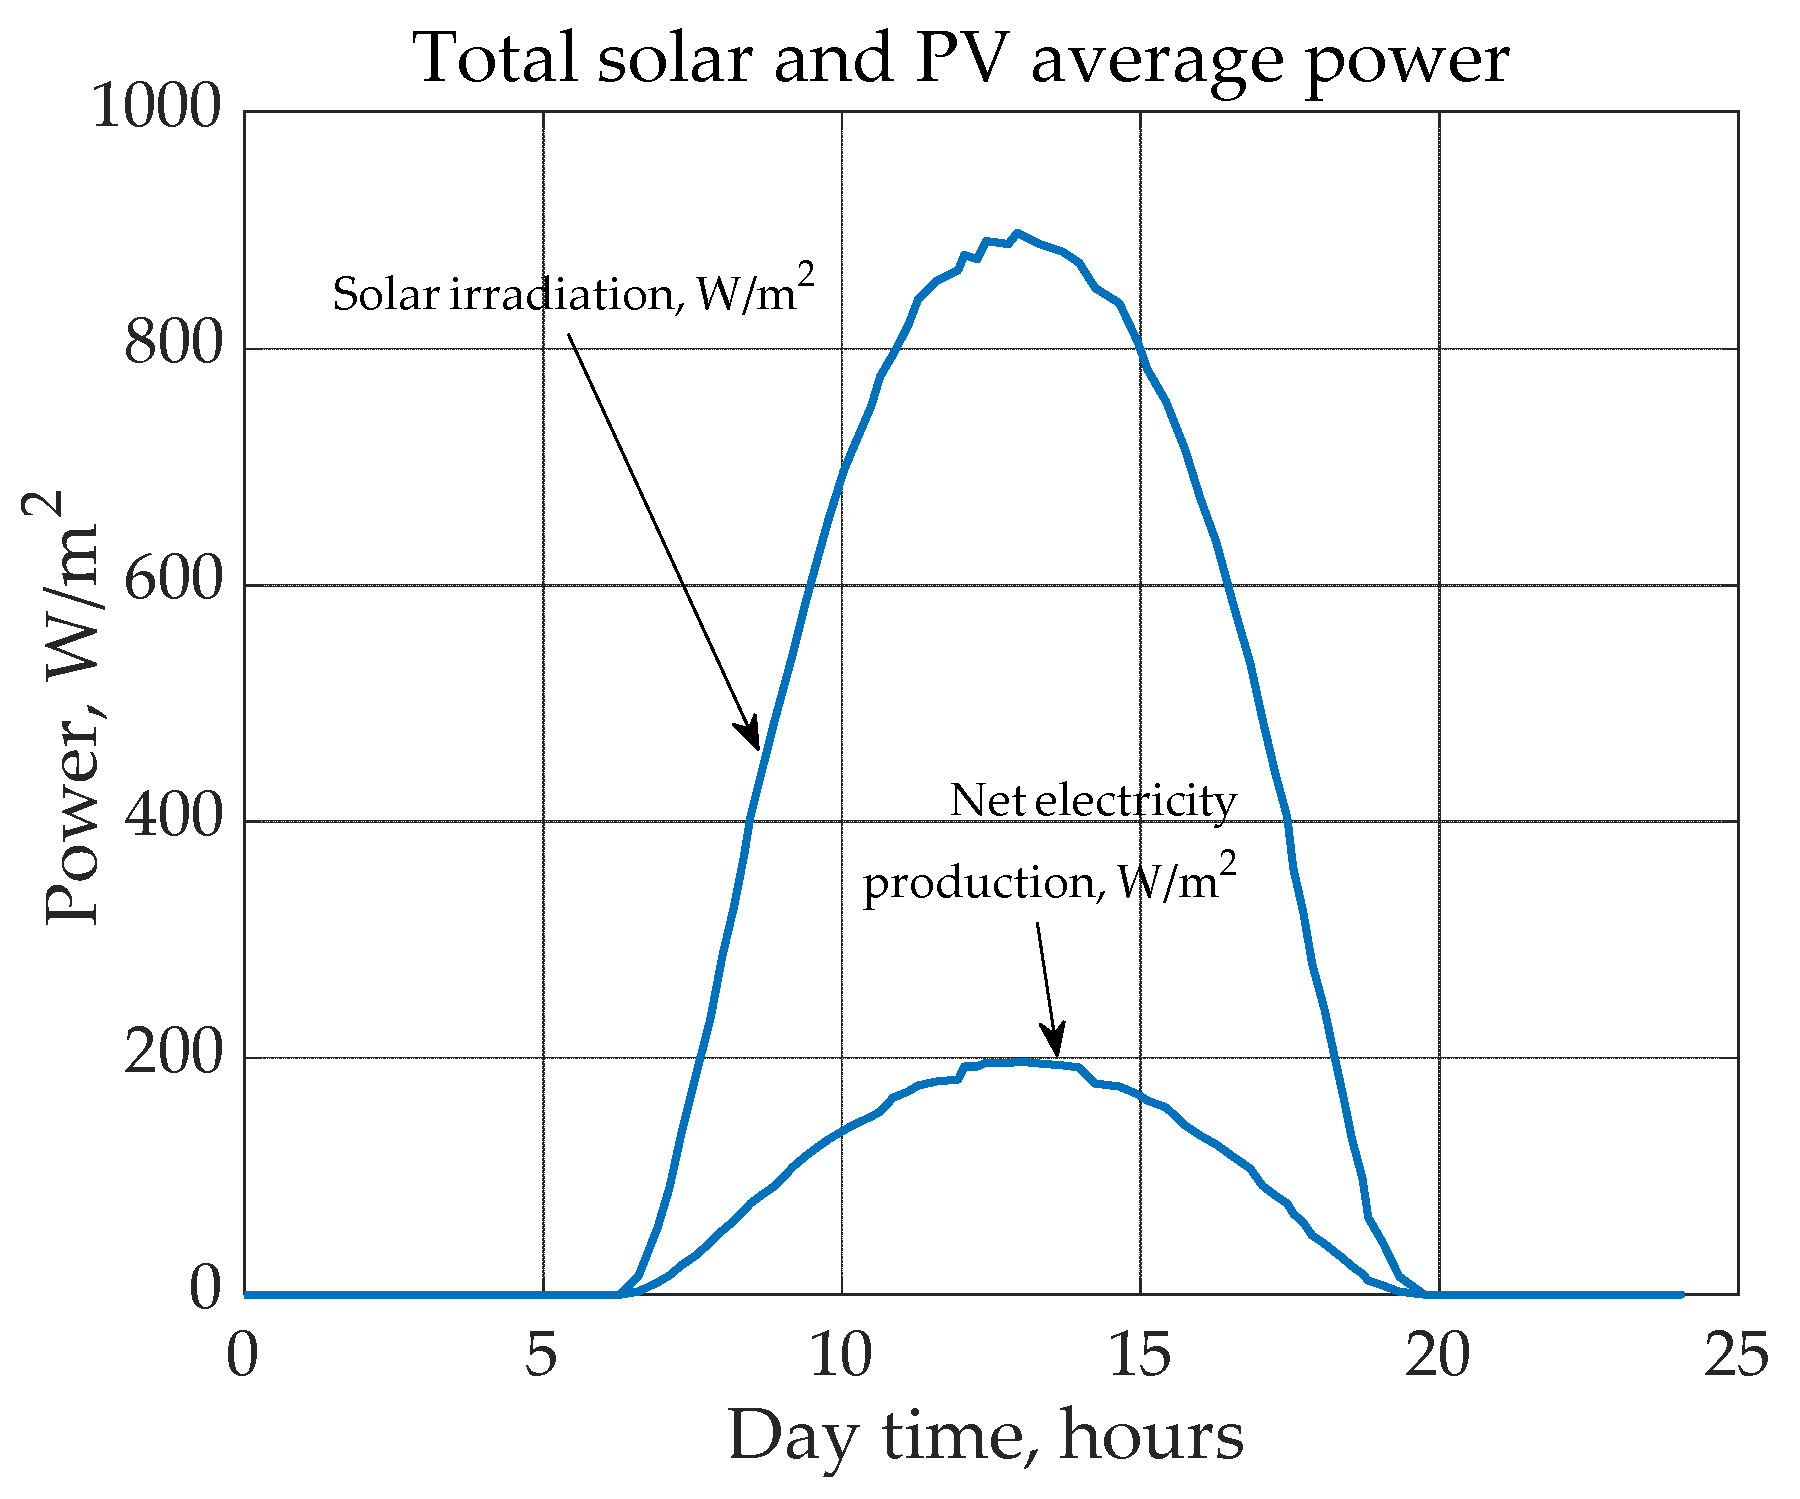
Figure 7.
The average daily electric hydropower production as per the different heights of a brine dumping.
Figure 7.
The average daily electric hydropower production as per the different heights of a brine dumping.
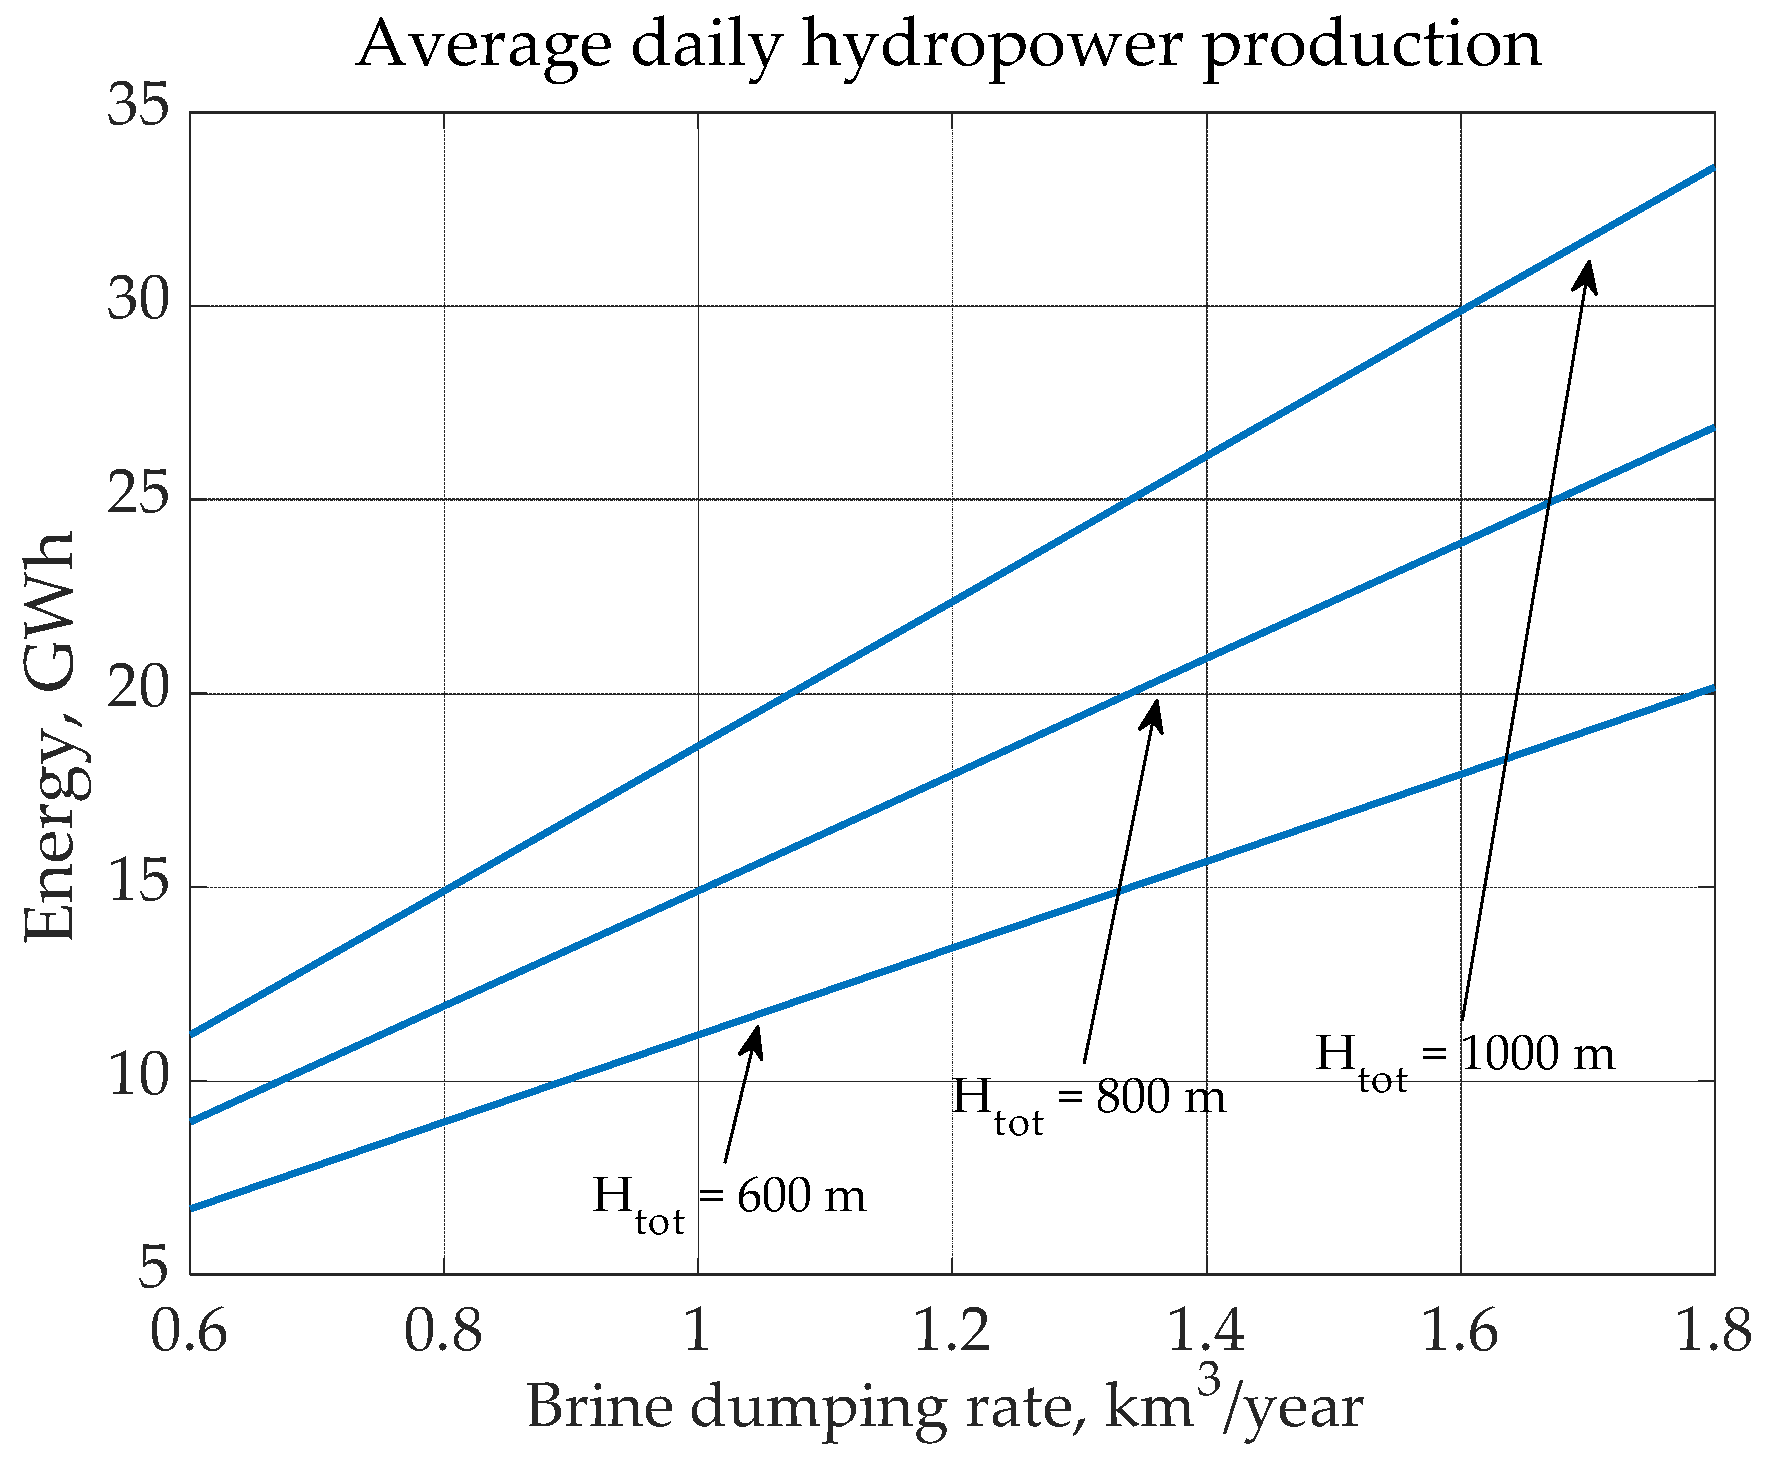
Figure 8.
The coefficient of the efficiency of a hydro-pumping storage as a function of a total height of a brine dumping.
Figure 8.
The coefficient of the efficiency of a hydro-pumping storage as a function of a total height of a brine dumping.
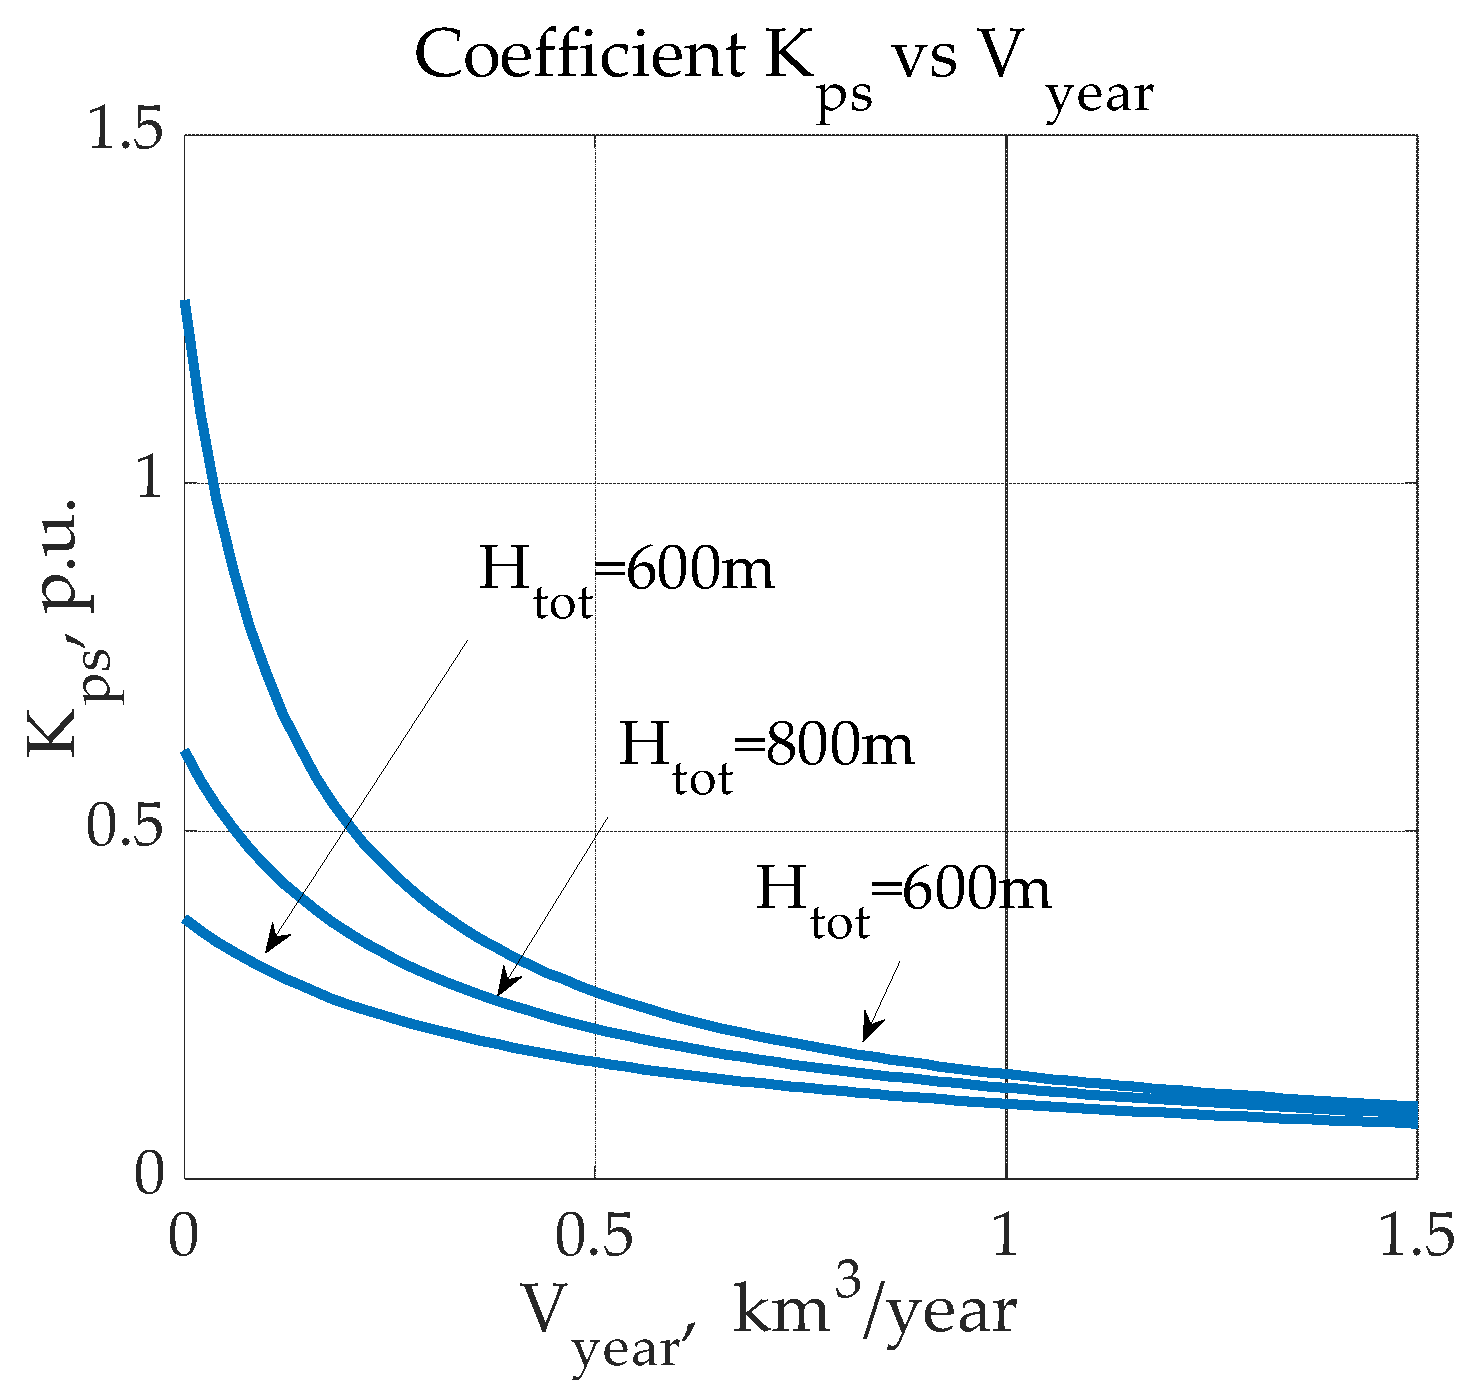
Figure 9.
The PV installation vs a power of conventional stations.
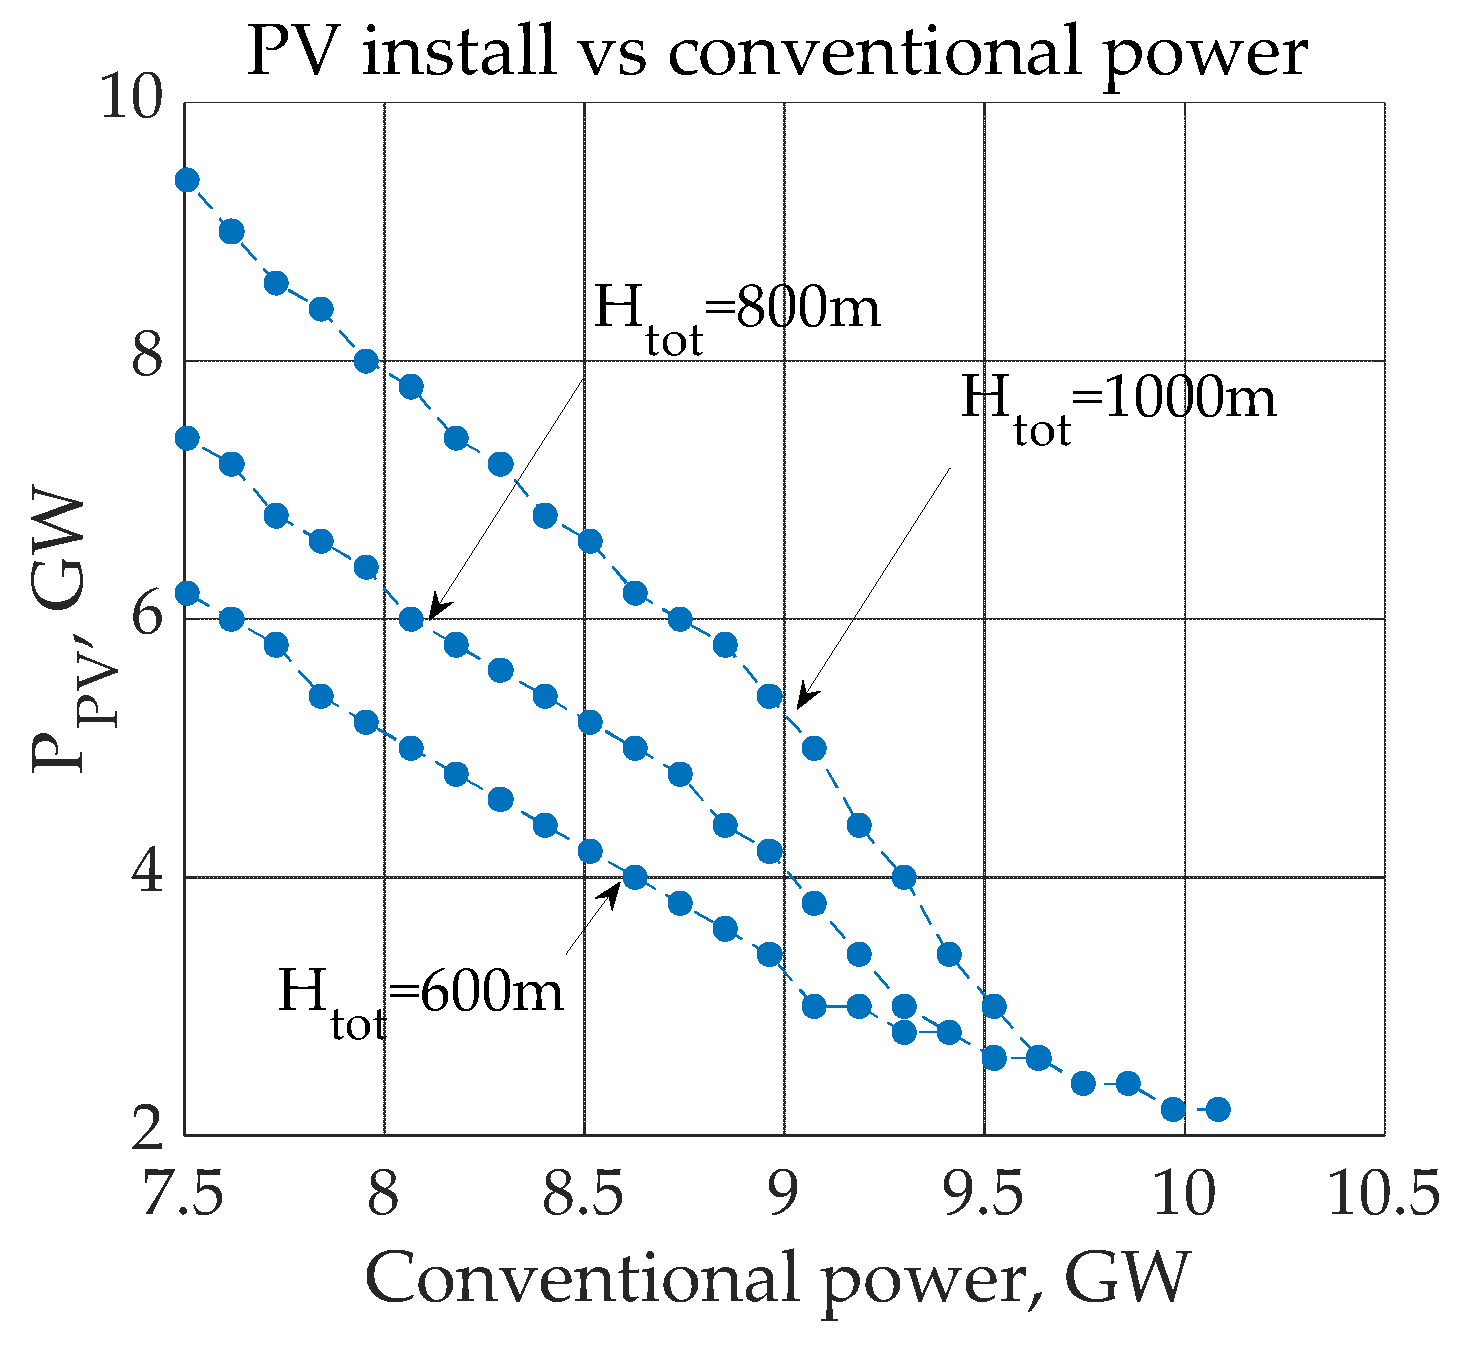
Figure 10.
The brine (a) and freshwater (b) production vs power of conventional stations.
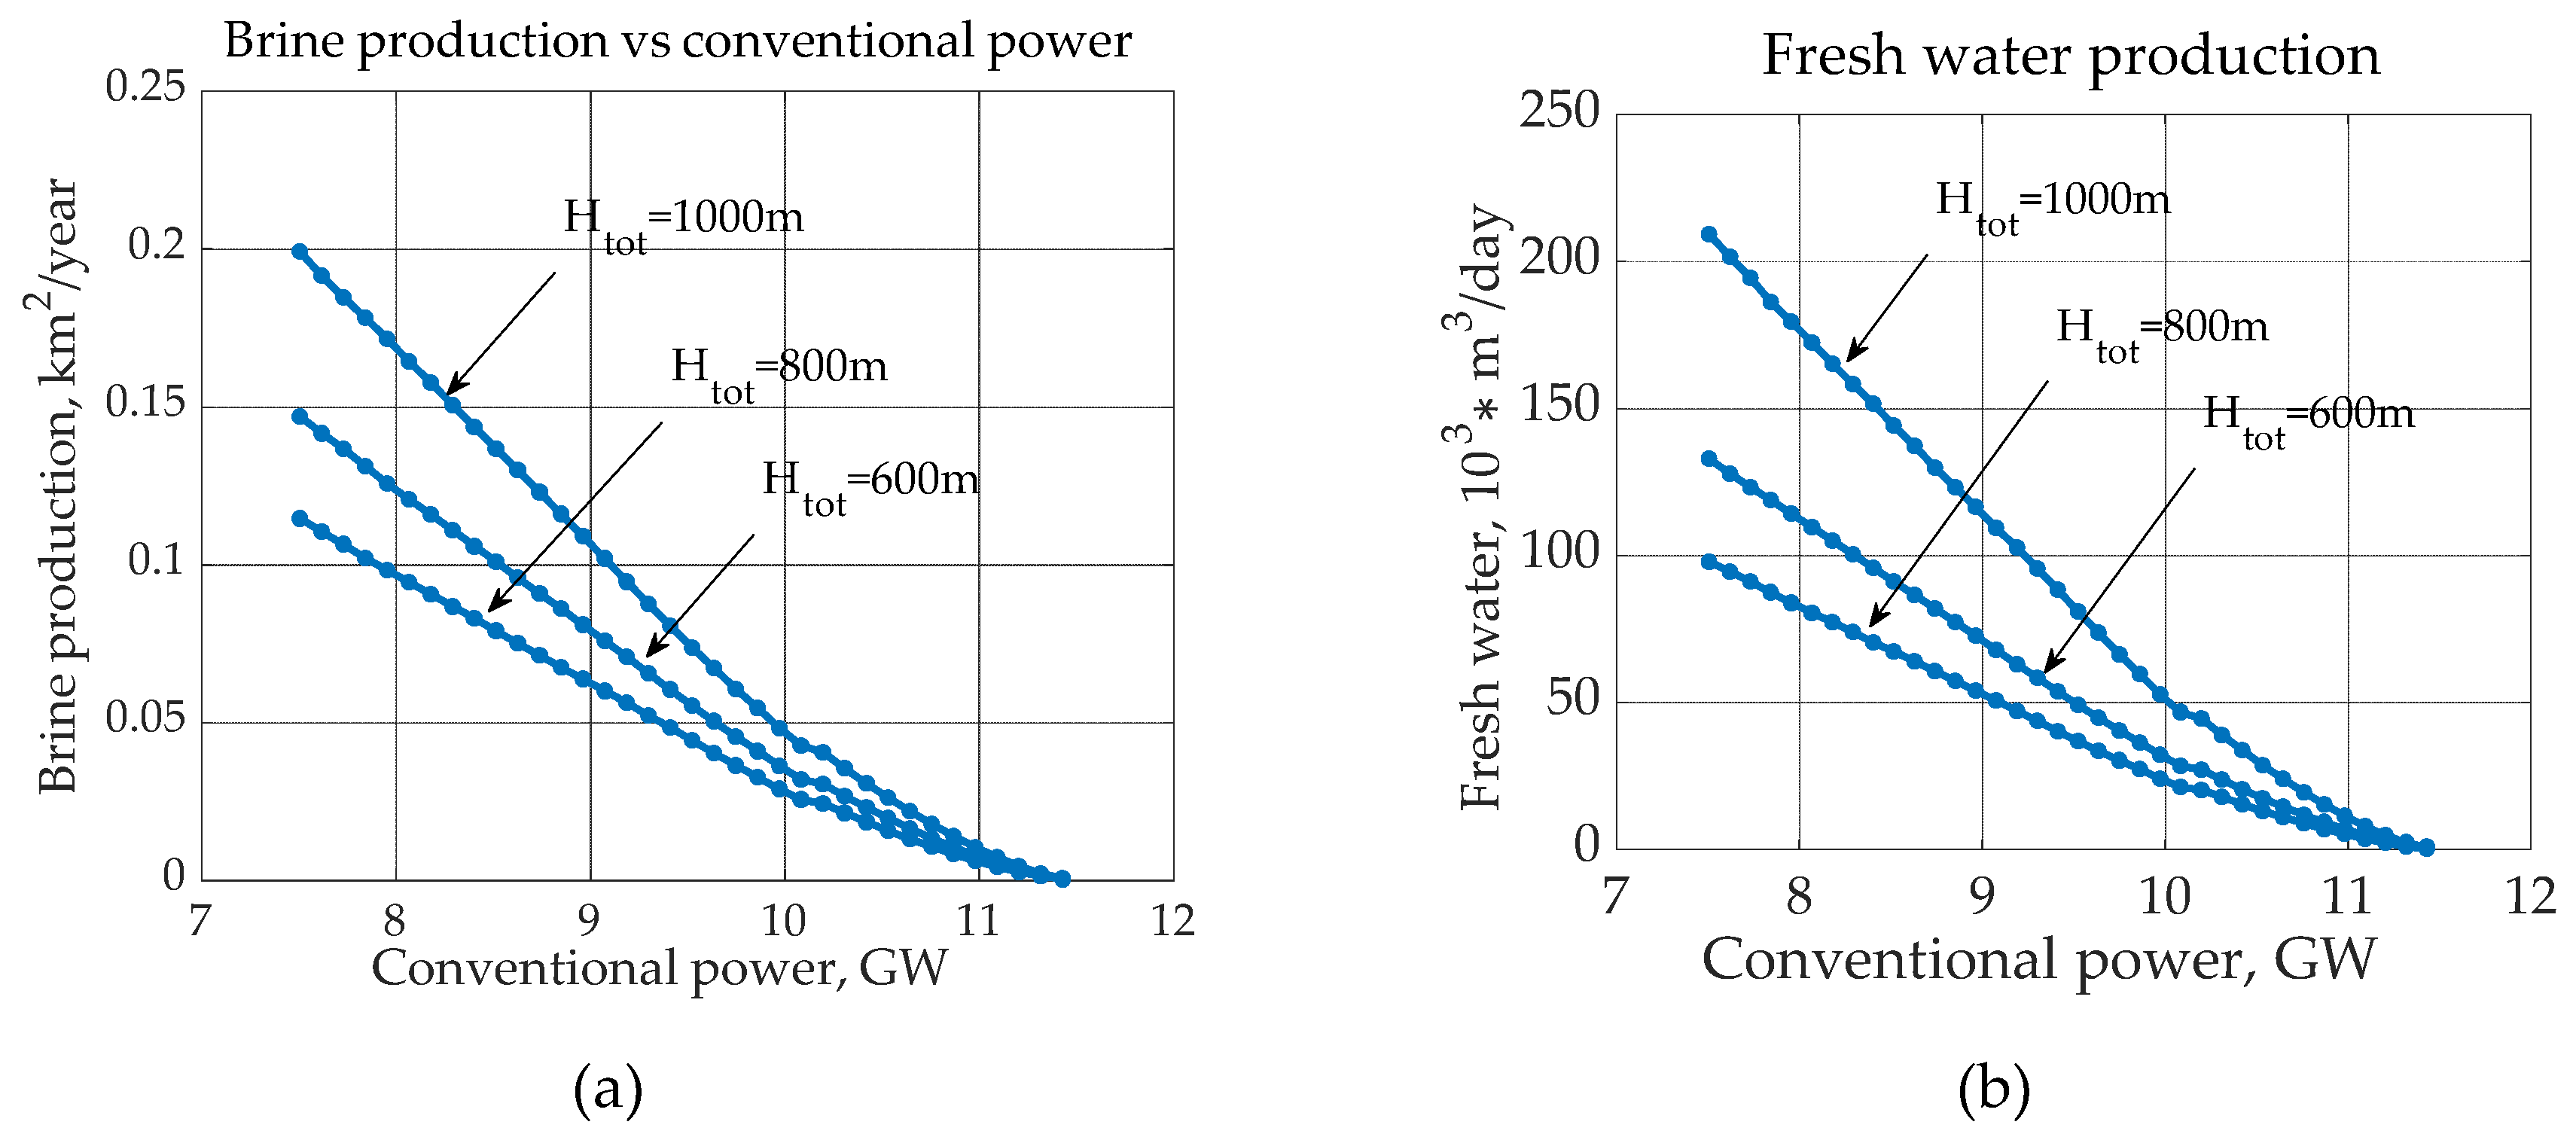
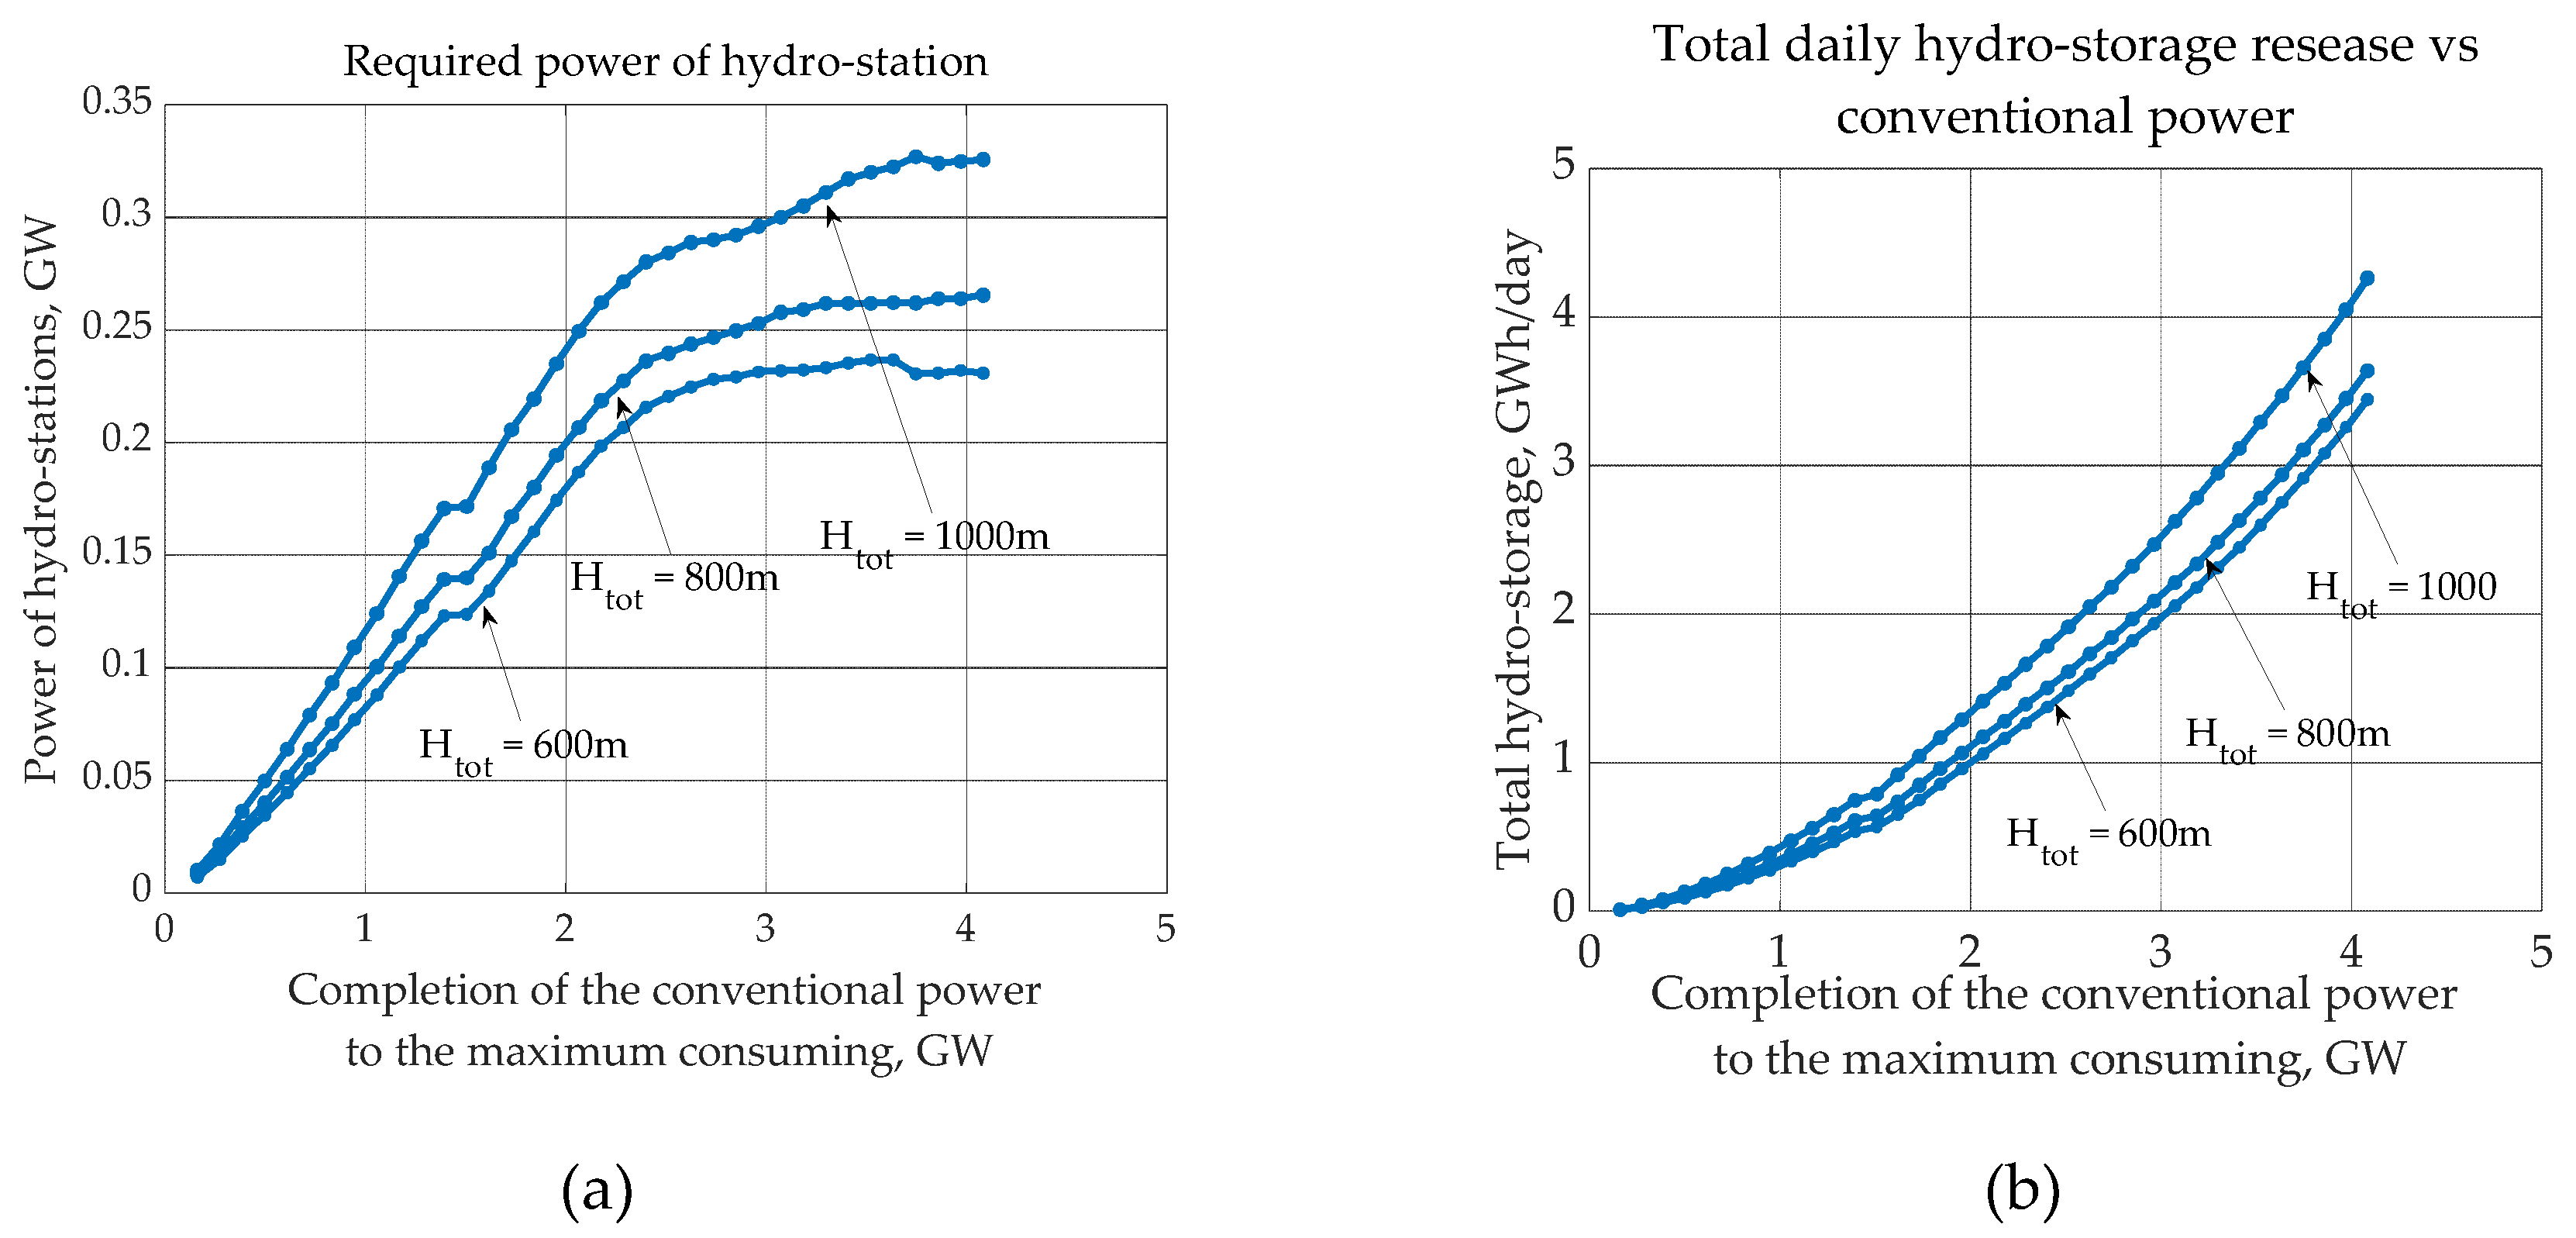
Figure 11.
Required power of hydro-stations and total daily release of hydro-storage: a) required power of hydro-stations; b) total hydro-storage daily release.
Figure 11.
Required power of hydro-stations and total daily release of hydro-storage: a) required power of hydro-stations; b) total hydro-storage daily release.
Disclaimer/Publisher’s Note: The statements, opinions and data contained in all publications are solely those of the individual author(s) and contributor(s) and not of MDPI and/or the editor(s). MDPI and/or the editor(s) disclaim responsibility for any injury to people or property resulting from any ideas, methods, instructions or products referred to in the content. |
© 2023 by the authors. Licensee MDPI, Basel, Switzerland. This article is an open access article distributed under the terms and conditions of the Creative Commons Attribution (CC BY) license (http://creativecommons.org/licenses/by/4.0/).
Copyright: This open access article is published under a Creative Commons CC BY 4.0 license, which permit the free download, distribution, and reuse, provided that the author and preprint are cited in any reuse.


