
Submitted:
13 April 2023
Posted:
14 April 2023
You are already at the latest version
Abstract
Co-free Li-rich oxide is a promising cathode for low cost high energy density Li-ion battery but presents poor cyclic stability. To address this issue, CeO2 is coated on Co-free Li-rich oxide through a low-temperature aged process, resulting in a novel CeO2-coated Li-rich oxide compo-site. Due to the low-temperature aged process, a uniform CeO2 coating layer of 6 nm in thickness is successfully coated on Co-free Li-rich oxide. With this uniform coating, the resulting CeO2-coated Li-rich oxide composite presents improved cyclic stability as well as rate capability as the cathode of Li-ion battery. The capacity retention of the resulting CeO2-coated Li-rich oxide is enhanced from 67% to 85% after 100 cycles and its capacity retention of 5C/0.05C is enhanced from 10% to 23%, compared with the uncoated sample. Such significant improvements enable this low-temperature aged process to be helpful for the practical application of Li-rich oxide materials, not limited to Co-free Li-rich oxide.
Keywords:
Li-rich oxide
; surface coating
; cerium oxide
; low temperature aging
; lithium-ion battery
1. Introduction
Li-ion batteries have been widely used in various electronic devices because of their higher energy density and longer cycle life than other secondary batteries[1,2,3]. Comparing with anodes, the currently available cathodes for lithium ion batteries have low specific capacity, which cannot meet the high energy density requirement of advanced devices[4,5,6]. Layered Li-rich manganese oxides (LLMOs) with a formula of xLi2MnO3·(1-x)LiMO2 (M=Mn, Ni, Co) have received much attention due to their large specific capacity (>200 mAh g-1) and high operating voltage (>4.5 V vs. Li/Li+) [7,8,9,10,11,12,13]. However, the poor cyclic stability of LLMOs prevents them from commercial applications. Dissolution of manganese from LLMOs and the electrolyte oxidation decomposition on LLMOs are the main reasons for the poor cyclic stability of LLMOs [7,14,15,16,17,18,19,20,21,22,23]. Co-doping is effective for cyclic stability improvement of LLMOs [23], but Co is expensive and toxic compared with Mn and Ni in LLMOs. Therefore, it remains a challenge to develop Co-free LLMOs that possess good cyclic stability.
It is known that coating LLMOs with inert compounds such as AlF3, AlBO3, P2O5, and B2O3, can improve the cyclic stability of LLMOs [24,25,26,27,28,29,30,31,32,33]. These coating layers separate LLMOs from a direct contact with electrolyte and mitigate manganese dissolution and electrolyte decomposition. However, the coating increases the interfacial impedance of LLMO/electrolyte because the coating layers are usually ionic and electronic insulators, leading to poor rate capability of LLMOs.
Due to its highly electronic and ionic conductivity, cerium oxide (CeO2) has been widely used in catalysts, oxygen sensors, solid electrolyte in fuel cells, and refractory materials in thermal barrier coating [34,35]. CeO2 exhibits face-centered cubic (fcc) unit cell with cation (Ce4+) and anion (O2-) occupying the octahedral interstitial sites [36]. Its ionic and electronic conductivities originate from the oxygen vacancy migration based on Ce4+/Ce3+ redox [37,38] and are related to its particle size [39,40], morphology, and crystallinity [41,42]. With these features, CeO2 has been used to coat cathode of lithium-ion batteries [43,44]. Several coating processes for CeO2 in lithium-ion batteries have been developed up to date. One involves a simple dispersion of the cathode materials in cerium-containing solution at room temperature, followed by drying and heating [44]. In this process, isolated CeO2 particles will be formed and thus the resultant coating layer is uneven. To improve the uniformity of the CeO2 coating layer, sol-gel process was adopted, in which chelators are required [47]. Since many factors in sol-gel process, such as concentration of chelators, pH value of the solution, and temperature, affect the formation of CeO2 coating layer, it is difficult to control the physical properties of the coating layer. Atomic layer deposition (ALD) is another strategy for coating uniformly, but this strategy needs complex equipment and is not suitable for large-scale applications [48].
The processes of CeO2 coating involve nucleation and crystal growth of CeO2. The former determines the uniformity of the coating layer and the latter affects the particle size of CeO2, both of which therefore determine the physical properties of CeO2 coating layer. With this knowledge, herein, we proposed a new strategy for coating CeO2 uniformly on Co-free LLMOs, which involves a simple co-precipitation of Ce ions from aqueous solutions, followed by a low-temperature aged process. The aqueous Ce-containing solution benefits the nucleation of CeO2, while the low-temperature aged process favors the formation of uniform particles due to the suppression of CeO2 crystal growth [39,40,49]. Thanks to the low-temperature aged process, a uniform CeO2 coating layer of 6 nm in thickness is successfully coated on LLMOs. To the best of our knowledge, it is the first time to apply low-temperature aged process for coating LLMOs, which ensures a thin and uniform coating. Most importantly, the resulting Co-free LLMOs present an excellent cyclic stability and rate capability, with an enhanced cycle capacity retention of 85% after 100 cycles (vs. 67%) and a enhanced rate capacity retention of 5C/0.05C of 23% (vs. 10% ) compared with the uncoated sample. Such significant improvements enable this low-temperature aged process to be helpful for the practical application of Li-rich oxide materials, not limited to Co-free Li-rich oxide.
2. Materials and Methods
2.1. Sample Preparation
Co-free lithium-rich oxide, Li1.2Ni0.2Mn0.6O2, was synthesized by co-precipitation method. Typically, 1.32 g manganese sulfate (MnSO4·H2O) and 0.76 g nickel nitrate (Ni(NO3)2·6H2O) (molar ratio of Mn : Ni = 3 : 1) were dissolved in deionized water, followed by dropwise adding excessive NaOH solution under constant stirring at 50 ℃. The pH value of the solution was controlled to 11.5 by using ammonium aqueous solution during the co-precipitation process. The precipitated precursor Ni0.2Mn0.6(OH)x was filtered, washed by deionized water and vacuum dried at 105 ℃ for 8 h. The obtained powders were mixed with 0.69 g LiOH·H2O (5 wt. % excess of Li compared to the stoichiometric Li1.2Ni0.2Mn0.6O2), followed by calcining at 450 ℃ for 4 h and 900 ℃ for 15 h with 3 ℃ min-1 heating rate in air, to obtain Li-rich oxide, denoted as LMN-P.
The preparation of CeO2-coated Co-free Li-rich oxide, denoted as LMN-C, is illustrated in Figure 1. Firstly, 1.00 g obtained LMN-P powder and 0.06 g Ce(NO3)3·6H2O were dispersed into deionized water ultrasonically for 30 min. Secondly, appropriate amount of ammonium aqueous solution was added into the above solution under 100℃, followed by quickly cooling to 0 ℃ and subsequently aging at 0℃ for 24 h. To obtain the product LMN-C, the precipitated product was filtered, washed by deionized water, vacuum dried at 105 ℃ for 8 h, and calcined at 650 ℃ for 5 h in air flow.
2.2. Physical Characterization
The crystalline structure of the resulting samples was characterized by XRD (SHIMADZU X-ray diffractometer XRD-6100 with Cu Kα radiation) in the 2θ range of 10-80 ° at an interval of 0.02 ° and scanning rate of 2 ° min-1. The XRD patterns were refined by using MDI Jade 6 software. The morphology was observed by scanning electron microscopy (SEM, ZEISS Ultra 55) and transmission electron microscopes (TEM, JEM-2100HR). The surface composition was analyzed by FTIR (Bruker Tensor 27, Germany). The contents of elements on the lithium anode were analysed by Energy Dispersive Spectrdmeter (EDS) (JEM-2100HR) and inductively coupled plasma (ICP) (Huake, 8100). X-ray photoelectron spectroscopy (XPS) was conducted on a Thermo ScientificTM K-AlphaTM+ spectrometer equipped with a monochromatic Al Kα X-ray source (1486.6 eV) operating at 100 W. Samples were analyzed under vacuum (P < 10−8 mbar) with a pass energy of 150 eV (survey scans) or 25eV (high-resolution scans). All the peaks were calibrated with C1s peak binding energy at 284.3 eV. The experimental peaks were fitted with XPSPEAK41 software.
2.3. Electrochemical Measurements
For electrochemical measurements, the electrodes were prepared by coating a mixing slurry of 80 wt. % active material, 10 wt. % conductive carbon (Super P) and 10 wt. % binder (polyvinylidene fluoride) onto Al foil. CR2032 coin cells were assembled in a highly pure Ar-filled glove box, with the prepared electrodes as working electrode and Li metal as counter electrode. 1.0 mol dm-3 LiPF6 in ethylene carbonate (EC)/ethyl methyl carbonate (EMC)/diethyl carbonate (DEC) (1:1:1 wt. %). (Dongguan Kaixin Battery Material Co., Ltd.) was used as the electrolyte, and microporous membrane (Celgard 2400) as the separator. Charge-discharge tests were carried out on Land test system. The cyclic voltammetry was performed on the CHI test system with a scan rate of 0.2 mV s-1 in the voltage range of 2.0-5.0 V (vs. Li/Li+).
3. Results and Discussions
3.1. Structure and Morphology
Figure 2 presents the XRD patterns of LMN-P and LMN-C. For LMN-P, all of the diffraction peaks can be indexed to trigonal α-NaFeO2 structure with R-3m symmetry (PDF#89-3601) and monoclinic Li2MnO3 with C2/m symmetry (PDF#84-1634). Specifically, the broad diffraction peaks of (020) and (110) between 20 ° and 25 ° are the key characteristics of weak superstructure diffractions for the arrangements of metal cations (Li+ and Mn4+) in the transition metal layer [10,50]. Comparing with LMN-P, a very weak peak corresponding to fluorite structure phase of CeO2 (PDF#34-0394) appears in LMN-C, indicating that CeO2 has been successfully coated on Li-rich oxide. Usually, the components with low contents in the sample are difficult to be detected by XRD. In LMN-C, CeO2 is detected by XRD in a very low intensity, which should be ascribed to the good crystallization of CeO2. The peaks of (111), (200), (220) and (311) in LMN-C demonstrate that the resulting CeO2 exhibits center-facing cubic structure with high crystallinity. Note that the ratio of I(003)/I(104) for LMN-P and LMN-C is 1.59 and 1.62, respectively, which means a low Li+ and Ni2+ disordering in both samples [51]. In addition, the sharp split peaks in (006)/(012) and (018)/(110) in both samples further confirm the layer structure with good crystallinity [19,41,44]. The XRD patterns of the layered LMN-P and LMN-C suggest that pure samples with good crystal structure, low Li+ and Ni2+ disordering were obtained, and the introduction of the CeO2 coating layer does not change the crystal structure of Li-rich oxide.
The SEM and TEM images of LMN-P and LMN-C are shown in Figure 3. It can be seen from Figure 3A and 3B that there is no obvious difference in morphology and particle size between LMN-P and LMN-C. A smooth and clean surface can be observed for LMN-P particles. A slight difference is the rougher surface of LMN-C than that of LMN-P. It can be found by comparing the TEM images of two samples in Figure 3C and 3D that a uniform layer of 6 nm in thickness, composed of nanoparticles with grain size of about 3 nm, is presented on LMN-C. This identification suggests that CeO2 is coated uniformly and compactly on the Li-rich oxide. Apparently, a simple low-temperature aged method can effectively realize uniform CeO2 coating for Li-rich oxide. With the separation of this uniform and compact CeO2 coating layer, it can be expected that the dissolution of metal ions from and the decomposition of electrolyte on LLMOs will be suppressed effectively.
3.2. Electrochemical Performances
Cyclic voltammograms of LMN-P and LMN-C are shown in Figure 4. During forward scanning in the 1st cycle, LMN-P electrode exhibits two coalescent oxidation peaks below 4.40 V (vs. Li/Li+), as shown in Figure 4A. These peaks are attributed to the oxidations of nickel ions in different chemical environments, namely in LiMO2-like (M=Ni, Mn) and Li2MnO3-like (LiM6) components [52]. A large oxidation current starting from 4.40 V (vs. Li/Li+) and reaching the maximum at 4.81 V (vs. Li/Li+) can be observed in the subsequent charging process, which is attributed to the simultaneous extraction of lithium and oxygen from the Li2MnO3 component and the structure rearrangement in which oxygen vacancies are partially occupied by transition metal cations in the LiMnO3 [13,53]. These processes are irreversible and cannot be identified in the discharge process.
Owing to the irreversible oxygen loss reaction and the rearrangement of LiMnO3 structure in the first cycle, the oxidation peak at above 4.70 V (vs. Li/Li+) disappears in the subsequent cycles, as shown in Figure 4B. In the backward scanning, the reduction peak at around 3.60 V (vs. Li/Li+) corresponding to the reduction of Ni4+ to Ni2+ can be identified, as shown in Figure 4A. Additionally, a small reduction current appears at ~3.30 V (vs. Li/Li+) in the 1st cycle and this reduction peak becomes more significant for the subsequent cycles, as shown in Figure 4B. These changes suggest that the structural rearrangement induced by irreversible loss of oxygen has significantly influenced on the electronic environment of manganese ions, corresponding to the reversible reaction of Mn4+/Mn3+ during the cycling [53].
After the Li-rich oxide is coated with CeO2, the peak potentials for the oxidation of nickel ions and irreversible reaction of Li2MnO3 in the first cycle shift to negatively to 4.14 V (vs. Li/Li+) and 4.73 V (vs. Li/Li+), respectively (Figure 4A). Correspondingly, the oxidation peak shifts negatively and the reduction peak shifts positively for Ni2+/Ni4+ reactions in the subsequent cycles (Figure 4B). Additionally, all the reaction currents increase due to the CeO2 coating. These results suggest that the CeO2 coating increases the reversibility of electrochemical redoxes of Li-rich oxide, which can be ascribed to electronically and ionically conductive property of CeO2.
To further demonstrate the effect of CeO2 coating on the electrochemical performances of Li-rich oxide, charge/discharge tests and electrochemical impedance spectroscopy were performed in coin cells with a comparison between LMN-P and LMN-C. The obtained results are presented in Figure 5. Figure 5A presents the cyclic stability at 0.05 C (1 C=200 mA g-1) for initial 4 cycles and 0.1 C for the subsequent cycles in the voltage range of 2.0-4.8 V (vs. Li/Li+). It can be found from Figure 5A that LMN-P exhibits a poor cycling stability: the discharge capacity at 0.1 C decreases from 191 mAh g-1 to 127 mAh g-1 with capacity retention of 67% after 100 cycles. This is the main issue that limits the application of Li-rich oxide, which is related to the unprotected interface between LMN-P and electrolyte, on which dissolution of transition metal ion and the decomposition of electrolyte might take place. Comparatively, LMN-C shows a significantly improved cycling stability: the discharge capacity changes from 200 mAh g-1 to 170 mAh g-1 with capacity retention of 85% after 100 cycles. Apparently, the low-temperature aged process ensures a uniform CeO2 coating layer that efficiently protects Li-rich oxide from dissolution and prevents the electrolyte from decomposition, resulting in significantly improved cycling stability of Li-rich oxide.
The charge/discharge curves at the first cycle (0.05 C, Figure 5B) show that both samples have similar charge/discharge performance. There are two potential plateaus at around 4.10 and 4.50 V (vs. Li/Li+), respectively, which correspond to the oxidation of Ni2+/Ni4+ and the irreversible oxygen loss from the layered lattice. This similarity suggesting that the CeO2 coating does not change the intrinsic electrochemical property of Li-rich oxide, which is in agreement with the same crystal structure of LMN-C as LMN-P. Differently, LMN-C shows a slightly lower charge potential plateau and a slightly higher discharge potential plateau, suggesting that LMN-C has less polarization for lithiation/delithiation kinetics than LMN-P. This decreased polarization of LMN-C can be ascribed to electronically and ionically conductive property of CeO2 coating [48]. Due to the decreased polarization, LMN-C delivers a higher initial discharge capacity (226 mAh g-1) than LMN-P (208 mAh g-1). As cycling proceeds, the difference in polarization between two samples becomes more significant, as shown in Figure 5C, suggesting that the interface between Li-rich oxide and electrolyte is deteriorated by the dissolution of transition metal ions and the decomposition of electrolyte for LMN-P, which can be mitigated by CeO2 coating.
With its less polarization, LMN-C exhibits better rate capability than LMN-P, as shown in Figure 5D. At 0.05, 0.1, 0.2, 0.5, 1, 2, and 5 C, LMN-P delivers 213 mAh g-1, 199 mAh g-1, 181 mAh g-1, 154 mAh g-1, 124 mAh g-1, 94 mAh g-1 and 21 mAh g-1,with the rate capacity retention (n/0.05 C, n=0.1, 0.2, 0.5, 1, 2, and 5 C) are 93%, 85%, 72%, 58%, 44% and 10%, respectively. Comparatively, LMN-C delivers 229 mAh g-1, 213 mAh g-1, 198 mAh g-1, 170 mAh g-1, 149 mAh g-1, 121 mAh g-1 and 59 mAh g-1, with the rate capacity retention are 93%, 86%, 74%, 65%, 53% and 23%, respectively. There is no obvious difference in the rate capacity retention between two samples when the current is below 0.5 C. However, obvious difference appears as the discharge rates increases. This phenomenon can be explained by the contribution of electronic and ionic conductivity of CeO2, which plays more important role in lithiation/delithiation kinetics under higher rates [47]. Noticeably, the LMN-C exhibits the higher discharge capacity for all rates, which can be ascribed to the oxygen storage capability of CeO2 that can reduce the irreversible consumption of Li along with the irreversible oxygen losing for the Li2MnO3 component. In addition, the LMN-C exhibits more decent capacity recovery than LMN-P after high rate discharge, suggesting that the CeO2 coated layer is beneficial for keeping structure stability of Li-rich oxide.
Figure 5E presents the electrochemical impedance spectra obtained in the fresh coin cells. The spectra consisted of two pressed semicircles at high frequencies and a slope line at low frequencies. The first semicircle is corresponding to film resistance (Rf) of electrode/electrolyte, the second is corresponding to and charge transfer resistance (Rct), and the slope line is ascribed to the Li+ ion diffusion in the Li-rich electrode (Wol). It can be seen from the values in Table 1, which were obtained by fitting with the equivalent circuit inserted in Figure 5E, that the Rf and Rct are decreased from 106 Ω to 93 Ω, and 181 Ω to 172 Ω after the CeO2 coating layer is introduced. These decreased interfacial resistances explain the improved rate capability of LMN-C.
The contribution of the CeO2 coating layer to the LLMO can be further demonstrated by characterizing the cycled electrodes with SEM and TEM, FTIR and XRD, as shown in Figure 6. After cycling, LMN-P is apparently covered with thick deposit (Figure 6A) and the well-crystallized particles observed from Figure 3C cracks, as marked by the red arrows in Figure 6C, confirming that severe electrolyte decomposition and particle separation happen on the unprotected Li-rich oxide. Differently, less deposit is observed (Figure 6B) and well-crystallized particles covered with CeO2 coating layer are maintained (Figure 6D) for cycled LMN-C electrode. Obviously, CeO2 coating layer provides a protection for maintaining the integrity of Li-rich oxide and exhibits an ability to suppress the electrolyte decomposition. Fig 6E shows the FTIR spectrum of the cycled electrode. The peaks approximately at 840, 1066, 1175, 1230 and 1398 cm-1, which are ascribed to the PVDF [55,56,57], are stronger for LMN-C, demonstrating that there are less electrolyte decomposition products on LMN-C than LMN-P, which is consistent with the SEM and TEM observations. The peaks at 1626 and 1734 cm-1 in LMN-P, representing the polycarbonates resulting from the electrolyte decomposition [56,58], vanish in LMN-C, confirming that CeO2 can suppress the electrolyte decomposition. It can be noted that CeO2 is not detected for LMN-C by FTIR, which can be explained by the insensitivity of inorganic compounds with low contents in the sample to FTIR.
From the XRD patterns of the cycled electrodes (Fig 6F), the main diffraction peaks of Li-rich oxide (in Figure 2) remain, and new peaks appear at 65° and 78° for both cycled electrodes, which belong to the current collector (aluminum). However, LMN-P changes the strongest diffraction peak from crystal face (001) (in Figure 2) to (104) (in Figure 6F), while LMN-C maintains the same peak position and intensity. Due to the strong diffraction of the aluminum current collector, the most intensive (003) reflection peak for the pristine materials, as recorded in Figure 2, becomes weaker for the cycled electrodes. This peak remains most intense for the cycled LMN-C, but becomes weaker than the peak at (104) for the cycled LMN-P, indicating that the crystal structure is maintained in the cycled LMN-C but suffers degradation in the cycled LMN-P.
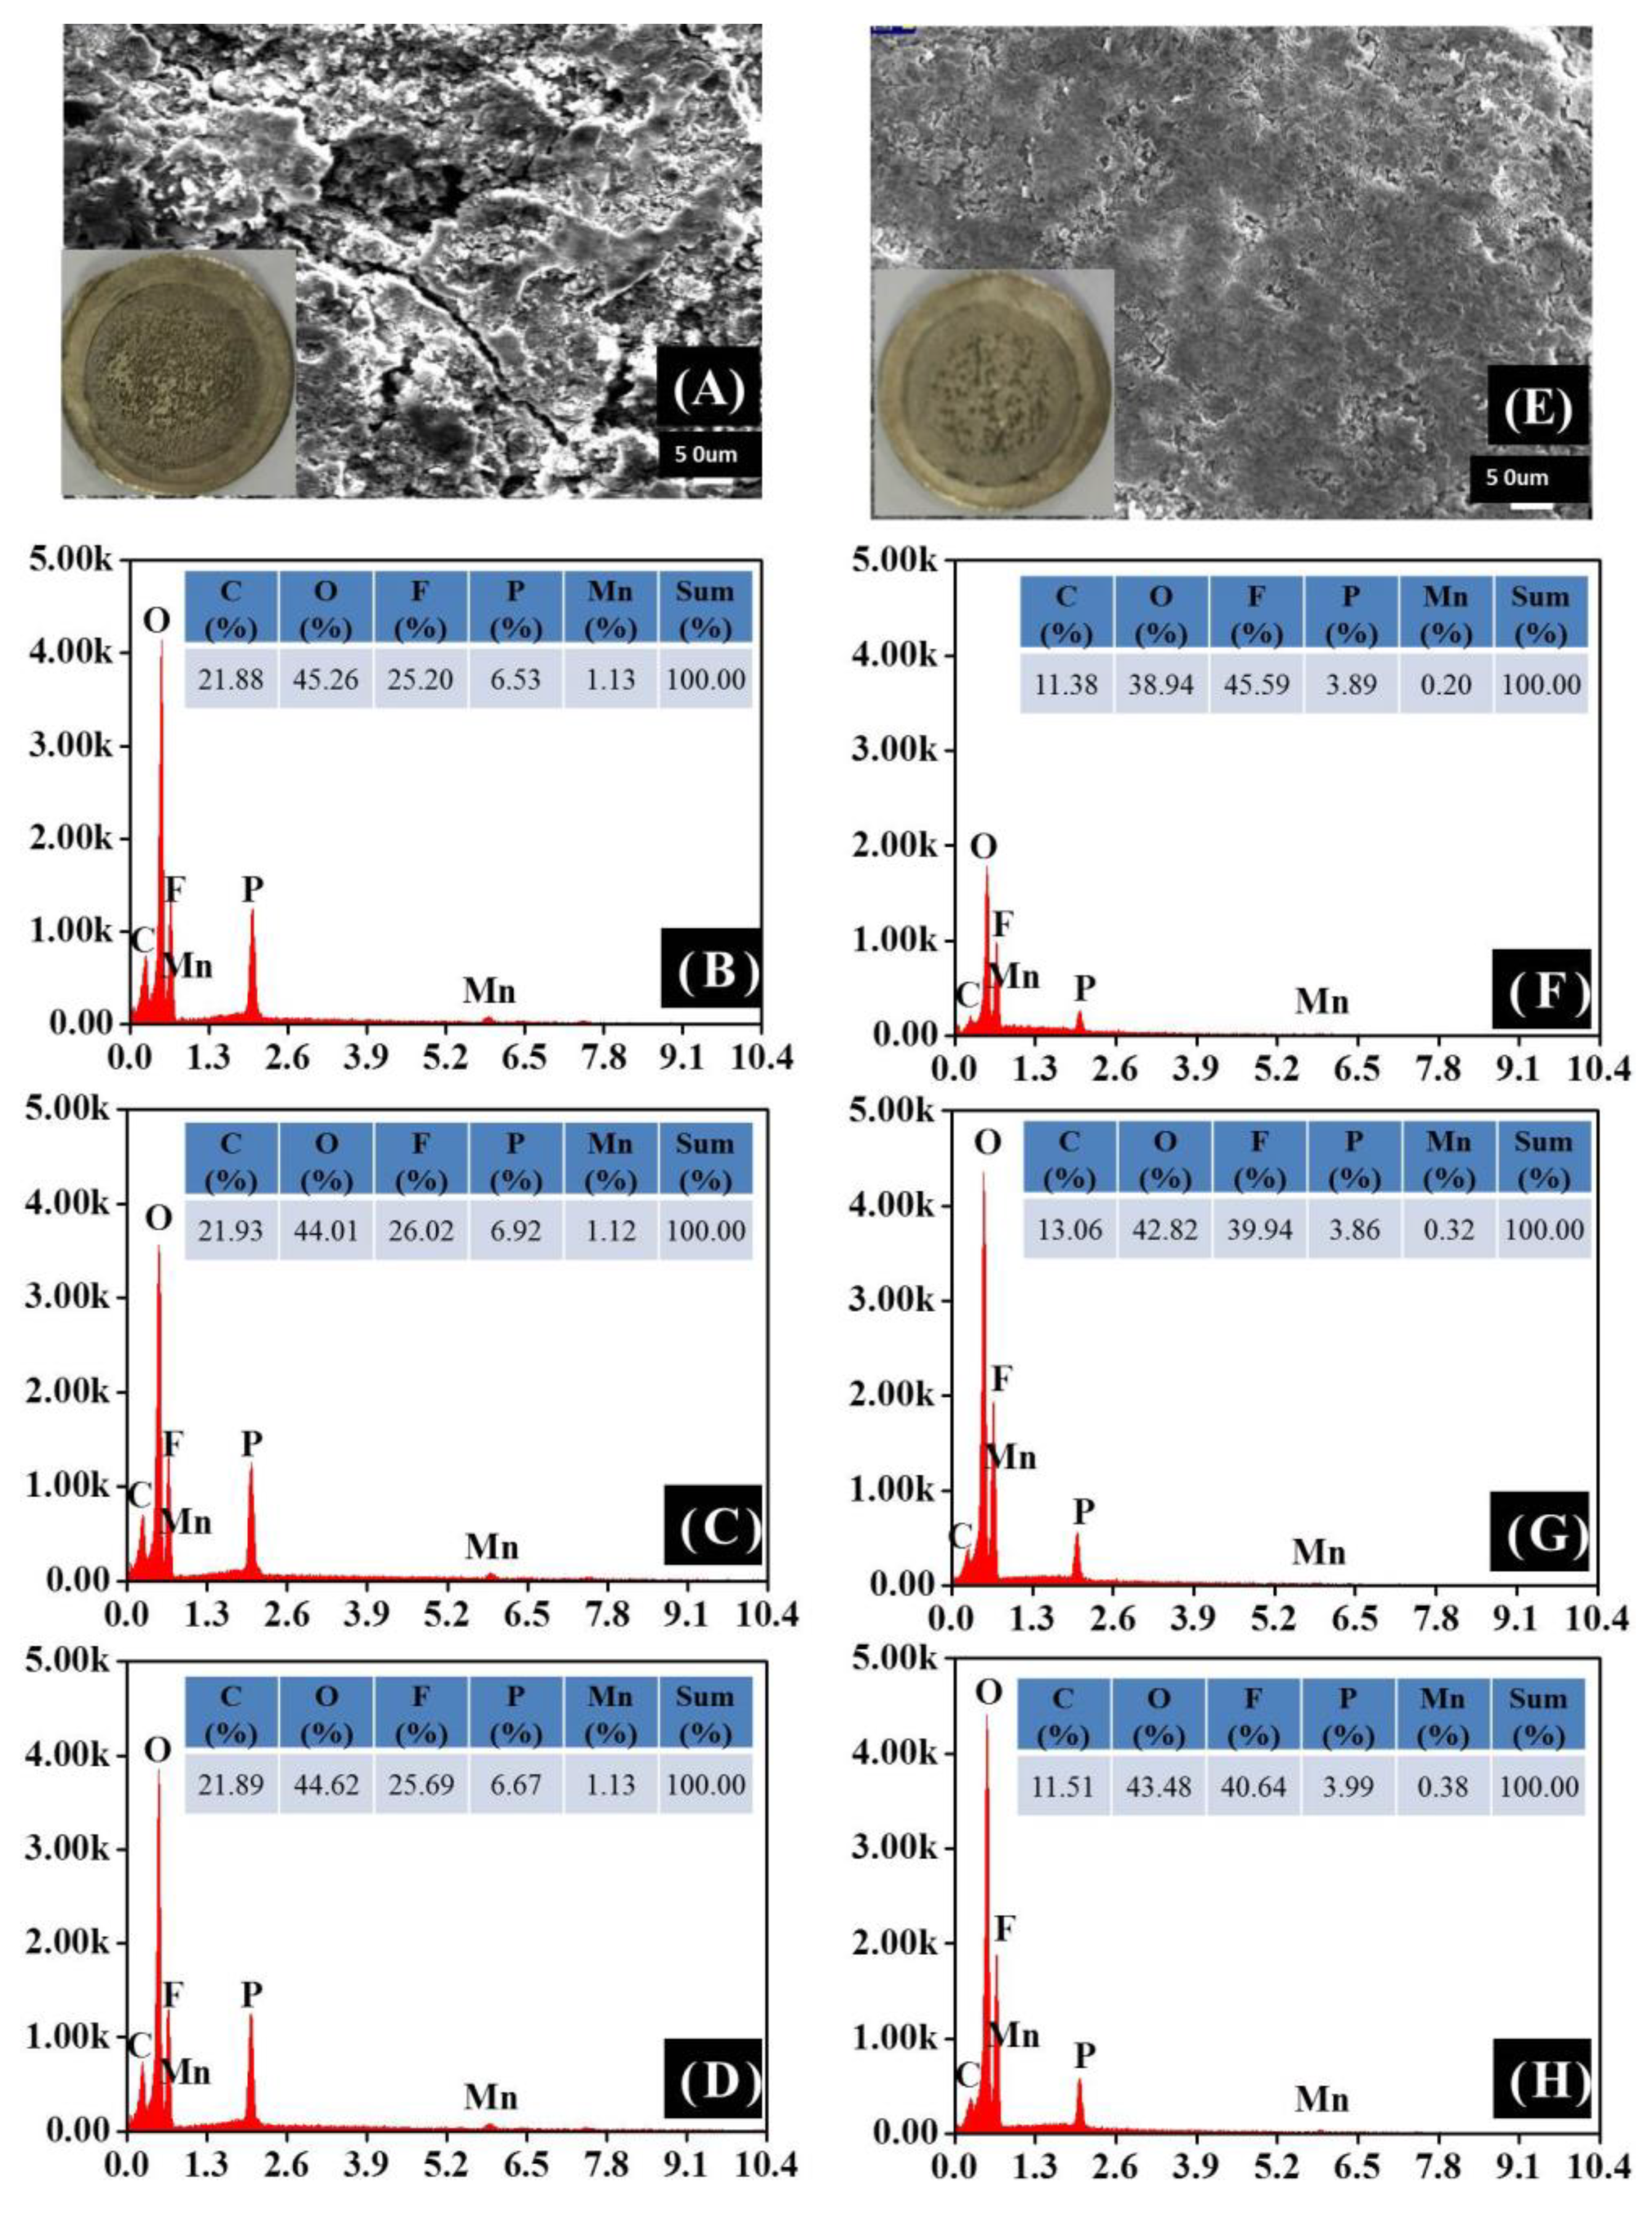
The dissolution of the transition metal ions from cathode will transport to and deposit on anode, which can be detected by ZAF corrected EDS and ICP. Figure 7 and Table S1 and S2 present the surface morphology and element contents of the lithium anodes from the cycled cells with LMN-P and LMN-C as cathodes. The lithium anode of the cell with LMN-P (Figure 7A) is coarser than that with LMN-C (Figure 7E), suggesting that more severe electrolyte decomposition happens on the anode in the cell with Li/LMN-P. The EDS and ICP results (Figure 7B-D and 7E-H, Table S1 and S2) show that both anodes contain C, O, F, P, and Mn, but the contents of these elements are different. C and O come from the solvent decomposition on lithium anode. The smaller contents of C and O on the lithium anode for LMN-C than those for LMN-P can be explained by the thinner deposit layer on the anode for LMN-C. P comes from LiPF6 decomposition. The far larger content of P on the lithium anode for LMN-P than that for LMN-C can be ascribed to the more severe electrolyte decomposition on the anode for LMN-P. Mn and Ni are from the dissolution of cathode. The contents of Mn and Ni on the anode for LMN-P are far larger than that for LMNC, which are responsible for the more severe electrolyte decomposition on the anode for LMN-P and confirm that LMN-C is structurally more stable than LMN-P. Apparently, CeO2 coating layer suppresses the Mn and Ni dissolution from Li-rich oxide, which is important for battery performance improvement [59].
The protection of Li-rich oxide by CeO2 coating layer can be further confirmed by XPS analyses. Figure S2 presents the XPS patterns of the LMN-P and LMN-C electrodes after 100 cycles at the voltage range of 2.0-4.8 V. In the C 1s spectrum, the peak at 284.3 eV is ascribed to the conductive carbon [60,61]. The peaks at 285.6 eV and 290.8 eV are assigned to the C-H bond and C-F bond in PVDF binder, while the peak at 265.5 eV, 288.6 eV, 289.9 eV and 284.9 eV belongs to the C-O, C=O bond, OCO2 and polycarbonates, respectively [61,62]. Comparatively, the weaker intensity of PVDF bond along with the stronger intensity of C-O and OCO2 for LMN-P can be ascribed to the more severe electrolyte decomposition that causes the thicker deposit on the electrode. This difference can also be observed from the M-O bond and C-O bond in the O 1s spectrum, as well as the peak at 136.8 eV corresponding to LixPFy in the P 2p spectrum [63,64]. These observations further confirm the contribution of CeO2 coating layer to the suppression of the electrolyte decomposition and the protection for the Li-rich oxide.
4. Conclusions
In this work, we proposed a new approach for synthesizing CeO2-coated Li-rich oxides, in which uniform CeO2 coating layer is achieved with a low-temperature aged process. Due to ionic conductivity of CeO2 and its inert to the electrolyte decomposition, the CeO2 coating layer not only provides a protection for Li-rich oxides from structural collapse, but also reduces the interfacial resistance of Li-rich oxide/electrolyte. With these contributions, the as-synthesized CeO2-coated Li-rich oxide presents improved performances when it is used as cathode for lithium ion batteries, in terms of rate capability and cyclic stability. Further improvements can be improved by optimizing the synthesis condition, and therefore this low-temperature aged process provides a promising strategy to address the challenges remaining in the practical application of Li-rich oxide materials, not limited to Co-free Li-rich oxide.
Supplementary Materials
The following supporting information can be downloaded at: www.mdpi.com/xxx/s1, Figure S1: TEM image (A) and corresponding EDS elemental mapping of Ce (B), TEM image (C) and selected area electron diffraction (SAED) of CeO2 (D) for CeO2 coated Li1.2Ni0.2Mn0.6O2 without the low-temperature-aged coating process; Figure S2: XPS of the cycled LMN-P and LMN-C electrode; Table S1: EDS of lithium electrodes from the cycled cells with LMN-P and LMN-C; Table S2: ICP analysis for Mn and Ni of the lithium electrodes from the cycled cells with LMN-P and LMN-C.
Author Contributions
Conceptualization, Y.L. and W.L.; methodology, Y.L., B. L. and W. L; software, Y.L. and B. L.; validation, M.C. and W.L.; formal analysis, Y.L. and W.L.; investigation, Y.L.; resources, W.L.; data curation, Y.L. and W.L.; writing—original draft preparation, Y.L.; writing—review and editing, Y.L., B. L. and W.L.; visualization, Y.L.; supervision, W.L.; project administration, W.L.; funding acquisition, Y.L. and W. L. All authors have read and agreed to the published version of the manuscript.
Funding
This research was funded by National Natural Science Foundation of China, grant number 22005063.
Data Availability Statement
Not applicable.
Conflicts of Interest
The authors declare no conflict of interest.
References
- Goodenough, J.B.; Kim, Y. Challenges for Rechargeable Li Batteries. Chem. Mater. 2010, 22, 587–603. [Google Scholar] [CrossRef]
- Grey, C.P.; Hall, D.S. Prospects for lithium-ion batteries and beyond—a 2030 vision. Nat. Commun. 2020, 11, 1–4. [Google Scholar] [CrossRef] [PubMed]
- Wu, K.; Cui, J.; Yi, J.; Liu, X.; Ning, F.; Liu, Y.; Zhang, J. Biodegradable Gel Electrolyte Suppressing Water-Induced Issues for Long-Life Zinc Metal Anodes. ACS Appl. Mater. Interfaces 2022, 14, 34612–34619. [Google Scholar] [CrossRef] [PubMed]
- Molaiyan, P.; Dos Reis, G.S.; Karuppiah, D.; Subramaniyam, C.M.; García-Alvarado, F.; Lassi, U. Recent Progress in Biomass-Derived Carbon Materials for Li-Ion and Na-Ion Batteries—A Review. Batteries 2023, 9, 116. [Google Scholar] [CrossRef]
- Andre, D.; Kim, S.-J.; Lamp, P.; Lux, S.F.; Maglia, F.; Paschos, O.; Stiaszny, B. Future generations of cathode materials: an automotive industry perspective. J. Mater. Chem. A 2015, 3, 6709–6732. [Google Scholar] [CrossRef]
- Li, B.; Wang, Y.; Tu, W.; Wang, Z.; Xu, M.; Xing, L.; Li, W. Improving cyclic stability of lithium nickel manganese oxide cathode for high voltage lithium ion battery by modifying electrode/electrolyte interface with electrolyte additive. Electrochimica Acta 2014, 147, 636–642. [Google Scholar] [CrossRef]
- Rozier, P.; Tarascon, J.M. Review—Li-Rich Layered Oxide Cathodes for Next-Generation Li-Ion Batteries: Chances and Challenges. J. Electrochem. Soc. 2015, 162, A2490–A2499. [Google Scholar] [CrossRef]
- Fang, L.; Chen, M.; Nam, K.-W.; Kang, Y.-M. Redox Evolution of Li-Rich Layered Cathode Materials. Batteries 2022, 8, 132. [Google Scholar] [CrossRef]
- Thackeray, M.M.; Kang, S.-H.; Johnson, C.S.; Vaughey, J.T.; Benedek, R.; Hackney, S.A. Li2MnO3-stabilized LiMO2 (M = Mn, Ni, Co) electrodes for lithium-ion batteries. J. Mater. Chem. 2007, 17, 3112–3125. [Google Scholar] [CrossRef]
- Thackeray, M. M.; Johnson, C. S.; Vaughey, J. T.; Li, N.; Hackney, S. A. Advances in manganese-oxide ‘composite’ electrodes for lithium-ion batteries. J. Mater. Chem. 2005, 15, 2257–2267. [Google Scholar] [CrossRef]
- Chen, D.; Yu, Q.; Xiang, X.; Chen, M.; Chen, Z.; Song, S.; Xiong, L.; Liao, Y.; Xing, L.; Li, W. Porous layered lithium-rich oxide nanorods: Synthesis and performances as cathode of lithium ion battery. Electrochimica Acta 2015, 154, 83–93. [Google Scholar] [CrossRef]
- Armstrong, A. R.; Holzapfel, M.; Novák, P.; Johnson, C. S.; Kang, S.; Thackeray, M. M.; Bruce, P. G. Demonstrating Oxygen Loss and Associated Structural Reorganization in the Lithium Battery Cathode Li[Ni0.2Li0.2Mn0.6]O2. J. Am. Chem. Soc. 2006, 128, 8694–8698. [Google Scholar] [CrossRef] [PubMed]
- Xiang, X.; Li, X.; Li, W. Preparation and characterization of size-uniform Li[Li0.131Ni0.304Mn0.565]O2 particles as cathode materials for high energy lithium ion battery. J. Power Sources 2013, 230, 89–95. [Google Scholar] [CrossRef]
- Ji, X.; Xia, Q.; Xu, Y.; Feng, H.; Wang, P.; Tan, Q. A review on progress of lithium-rich manganese-based cathodes for lithium ion batteries. J. Power Sources 2021, 487, 229362. [Google Scholar] [CrossRef]
- Zuo, W.; Luo, M.; Liu, X.; Wu, J.; Liu, H.; Li, J.; Winter, M.; Fu, R.; Yang, W.; Yang, Y. Li-rich cathodes for rechargeable Li-based batteries: reaction mechanisms and advanced characterization techniques. Energy Environ. Sci. 2020, 13, 4450–4497. [Google Scholar] [CrossRef]
- Xiang, X.; Li, W. Significant influence of insufficient lithium on electrochemical performance of lithium-rich layered oxide cathodes for lithium ion batteries. Electrochimica Acta 2014, 133, 422–427. [Google Scholar] [CrossRef]
- Lee, S.H.; Moon, J.-S.; Lee, M.-S.; Yu, T.-H.; Kim, H.; Park, B.M. Enhancing phase stability and kinetics of lithium-rich layered oxide for an ultra-high performing cathode in Li-ion batteries. J. Power Sources 2015, 281, 77–84. [Google Scholar] [CrossRef]
- Ramakrishnan, S.; Park, B.; Wu, J.; Yang, W.; McCloskey, B.D. Extended Interfacial Stability through Simple Acid Rinsing in a Li-Rich Oxide Cathode Material. J. Am. Chem. Soc. 2020, 142, 8522–8531. [Google Scholar] [CrossRef]
- Fan, J.; Li, G.; Luo, D.; Fu, C.; Li, Q.; Zheng, J.; Li, L. Hydrothermal-Assisted Synthesis of Li-Rich Layered Oxide Microspheres with High Capacity and Superior Rate-capability as a Cathode for Lithium-ion Batteries. Electrochimica Acta 2015, 173, 7–16. [Google Scholar] [CrossRef]
- Ji, X.; Xu, Y.; Xia, Q.; Zhou, Y.; Song, J.; Feng, H.; Wang, P.; Yang, J.; Tan, Q. Li-Deficient Materials-Decoration Restrains Oxygen Evolution Achieving Excellent Cycling Stability of Li-Rich Mn-Based Cathode. ACS Appl. Mater. Interfaces 2022, 14, 30133–30143. [Google Scholar] [CrossRef]
- Cao, X.; Sun, J.; Chang, Z.; Wang, P.; Yue, X.; Okagaki, J.; He, P.; Yoo, E.; Zhou, H. Enabling Long-Term Cycling Stability Within Layered Li-Rich Cathode Materials by O2/O3-Type Biphasic Design Strategy. Adv. Funct. Mater. 2022, 32, 2205199. [Google Scholar] [CrossRef]
- Ates, M. N.; Jia, Q.; Shah, A.; Busnaina, A.; Mukerjee, S.; Abraham, K. M. Mitigation of Layered to Spinel Conversion of a Li-Rich LayeredMetal Oxide Cathode Material for Li-Ion Batteries. J. Electrochem. Soc. 2014, 161, A290–A301. [Google Scholar] [CrossRef]
- Chen, G.; An, J.; Meng, Y.; Yuan, C.; Matthews, B.; Dou, F.; Shi, L.; Zhou, Y.; Song, P.; Wu, G.; et al. Cation and anion Co-doping synergy to improve structural stability of Li- and Mn-rich layered cathode materials for lithium-ion batteries. Nano Energy 2019, 57, 157–165. [Google Scholar] [CrossRef]
- Li, L.; Song, B. H.; Chang, Y. L.; Xia, H.; Yang, J. R.; Lee, K. S.; Lu, L. Retarded phase transition by fluorine doping in Li-rich layered Li1.2Mn0.54Ni0.13Co0.13O2 cathode material. J. Power Sources 2015, 283, 162–170. [Google Scholar] [CrossRef]
- Qiu, Y.; Peng, X.; Zhou, L.; Song, Y.; Bi, L.; Long, X.; He, L.; Xie, Q.; Wang, S.; Liao, J. Building Ultrathin Li4Mn5O12 Shell for Enhancing the Stability of Cobalt-Free Lithium-Rich Manganese Cathode Materials. Batteries 2023, 9, 123. [Google Scholar] [CrossRef]
- Zhang, J.; Zhang, D.; Wang, Z.; Zheng, F.; Zhong, R.; Hong, R. AlF3 coating improves cycle and voltage decay of Li-rich manganese oxides. J. Mater. Sci. 2023, 58, 4525–4540. [Google Scholar] [CrossRef]
- Dong, S.; Zhou, Y.; Hai, C.; Zeng, J.; Sun, Y.; Ma, Y.; Shen, Y.; Li, X.; Ren, X.; Sun, C.; Zhang, G.; Wu, Z. Enhanced Cathode Performance: Mixed Al2O3 and LiAlO2 Coating of Li1.2Ni0.13Co0.13Mn0.54O2. ACS Appl. Mater. Interfaces 2020, 12, 38153–38162. [Google Scholar] [CrossRef]
- Zhao, Y.; Sun, Y.; Yue, Y.; Hu, X.; Xia, M. Carbon Modified Li-rich Cathode Materials Li1.26Fe0.22Mn0.52O2 Synthesized via Molten Salt Method with Excellent Rate Ability for Li-ion Batteries. Electrochimica Acta 2014, 130, 66–75. [Google Scholar] [CrossRef]
- Hou, M.; Liu, J.; Guo, S.; Yang, J.; Wang, C.; Xia, Y. Enhanced electrochemical performance of Li-rich layered cathode materials by surface modification with P2O5. Electrochem. Commun. 2014, 49, 83–87. [Google Scholar] [CrossRef]
- Shobana, M.K. Metal oxide coated cathode materials for Li ion batteries—A review. J. Alloy. Compd. 2019, 802, 477–487. [Google Scholar] [CrossRef]
- Seu, C.S.; Davis, V.K.; Pasalic, J.; Bugga, R.V. Aluminum Borate Coating on High-Voltage Cathodes for Li-Ion Batteries. J. Electrochem. Soc. 2015, 162, A2259–A2265. [Google Scholar] [CrossRef]
- Zheng, J.; Gu, M.; Xiao, J.; Polzin, B.J.; Yan, P.; Chen, X.; Wang, C.; Zhang, J.-G. Functioning Mechanism of AlF3 Coating on the Li- and Mn-Rich Cathode Materials. Chem. Mater. 2014, 26, 6320–6327. [Google Scholar] [CrossRef]
- Moghadam, Y. S.; Kharbachi, A. E.; Cambaz, M. A.; Dinda, S.; Diemant, T.; Hu, Y.; Melinte, G.; Fichtner, M. Borate-Based Surface Coating of Li-Rich Mn-Based Disordered Rocksalt Cathode Materials. Adv. Mater. Interfaces 2022, 9, 2201200. [Google Scholar] [CrossRef]
- Kehoe, A.B.; Scanlon, D.O.; Watson, G.W. Role of Lattice Distortions in the Oxygen Storage Capacity of Divalently Doped CeO2. Chem. Mater. 2011, 23, 4464–4468. [Google Scholar] [CrossRef]
- Jaksic, J.M.; Nan, F.; Papakonstantinou, G.D.; Botton, G.A.; Jaksic, M.M. Theory, Substantiation, and Properties of Novel Reversible Electrocatalysts for Oxygen Electrode Reactions. J. Phys. Chem. C 2015, 119, 11267–11285. [Google Scholar] [CrossRef]
- Suzuki, T.; Kosacki, I.; Anderson, H.U.; Colomban, P. Electrical Conductivity and Lattice Defects in Nanocrystalline Cerium Oxide Thin Films. J. Am. Ceram. Soc. 2001, 84, 2007–2014. [Google Scholar] [CrossRef]
- Tuller, H.L. Ionic conduction in nanocrystalline materials. Solid State Ionics 2000, 131, 143–157. [Google Scholar] [CrossRef]
- Uberuaga, B.P.; Sickafus, K.E. Interpreting oxygen vacancy migration mechanisms in oxides using the layered structure motif. Comput. Mater. Sci. 2015, 103, 216–223. [Google Scholar] [CrossRef]
- Deshpande, S.; Patil, S.; Kuchibhatla, S.V.; Seala, S. Size dependency variation in lattice parameter and valency states in nanocrystalline cerium oxide. Appl. Phys. Lett. 2005, 87, 133113. [Google Scholar] [CrossRef]
- Lavik, E. B.; Kosacki, I.; Tuller, H. L.; Chiang, Y. M.; Ying, J. Y. Nonstoichiomerty and electrical conductivity of nanocrystalline CeO2-x. J. of Electroceram. 1997, 1, 7–14. [Google Scholar] [CrossRef]
- Ko, H.-H.; Yang, G.; Wang, M.-C.; Zhao, X. Isothermal crystallization kinetics and effect of crystallinity on the optical properties of nanosized CeO2 powder. Ceram. Int. 2014, 40, 6663–6671. [Google Scholar] [CrossRef]
- Sreekanth, T.; Dillip, G.; Lee, Y.R. Picrasma quassioides mediated cerium oxide nanostructures and their post-annealing treatment on the microstructural, morphological and enhanced catalytic performance. Ceram. Int. 2016, 42, 6610–6618. [Google Scholar] [CrossRef]
- Ha, H.-W.; Yun, N.J.; Kim, M.H.; Woo, M.H.; Kim, K. Enhanced electrochemical and thermal stability of surface-modified LiCoO2 cathode by CeO2 coating. Electrochimica Acta 2006, 51, 3297–3302. [Google Scholar] [CrossRef]
- Yao, J.; Wu, F.; Qiu, X.; Li, N.; Su, Y. Effect of CeO2-coating on the electrochemical performances of LiFePO4/C cathode material. Electrochim. Acta 2011, 56, 5587–5592. [Google Scholar] [CrossRef]
- Ha, H.-W.; Yun, N.J.; Kim, K. Improvement of electrochemical stability of LiMn2O4 by CeO2 coating for lithium-ion batteries. Electrochimica Acta 2007, 52, 3236–3241. [Google Scholar] [CrossRef]
- Ha, H.-W.; Jeong, K.H.; Yun, N.J.; Hong, M.Z.; Kim, K. Effects of surface modification on the cycling stability of LiNi0.8Co0.2O2 electrodes by CeO2 coating. Electrochimica Acta 2005, 50, 3764–3769. [Google Scholar] [CrossRef]
- Yuan, W.; Zhang, H.; Liu, Q.; Li, G.; Gao, X. Surface modification of Li(Li0.17Ni0.2Co0.05Mn0.58)O2 with CeO2 as cathode material for Li-ion batteries. Electrochimica Acta 2014, 135, 199–207. [Google Scholar] [CrossRef]
- Zhou, M.; Zhao, J.; Qiu, S.; Tian, F.; Potapenko, O.; Zhong, S.; Potapenko, H.; Liang, Z. Structural and Electrochemical Properties of Li1.2Ni0.16Mn0.54Co0.08O2 - Al2O3 Composite Prepared by Atomic Layer Deposition as the Cathode Material for LIBs. Int. J. Electrochem. Sci. 2020, 15, 10759–10771. [Google Scholar] [CrossRef]
- Han, W. Q.; Wu, L.; Zhu, Y. Formation and Oxidation State of CeO2-x Nanotubes. J. Am. Chem. Soc. 2005, 127, 12814–12815. [Google Scholar] [CrossRef]
- Johnson, C. S.; Li, N.; Lefief, C.; Thackeray, M. M. Anomalous capacity and cycling stability of xLi2MnO3 · (1 − x)LiMO2 electrodes (M = Mn, Ni, Co) in lithium batteries at 50 °C. Electrochem. Commun. 2007, 9, 787–795. [Google Scholar] [CrossRef]
- Chen, Y.; Chen, Z.; Xie, K. Effect of annealing on the first-cycle perfomance and reversible capabilities of lithium-rich layered oxide cathodes. J. Phys. Chem. C. 2014, 118, 11505–11511. [Google Scholar] [CrossRef]
- Kang, S.-H.; Kempgens, P.; Greenbaum, S.; Kropf, A.J.; Amine, K.; Thackeray, M.M. Interpreting the structural and electrochemical complexity of 0.5Li2MnO3·0.5LiMO2electrodes for lithium batteries (M = Mn0.5−xNi0.5−xCo2x, 0 ≤ x ≤ 0.5). J. Mater. Chem. 2007, 17, 2069–2077. [Google Scholar] [CrossRef]
- Zheng, J.; Gu, M.; Genc, A.; Xiao, J.; Xu, P.; Chen, X.; Zhu, Z.; Zhao, W.; Pullan, L.; Wang, C.; et al. Mitigating Voltage Fade in Cathode Materials by Improving the Atomic Level Uniformity of Elemental Distribution. Nano Lett. 2014, 14, 2628–2635. [Google Scholar] [CrossRef] [PubMed]
- Kalyani, P.; Chitra, S.; Mohan, T.; Gopukumar, S. Lithium metal rechargeable cells using Li2MnO3 as the positive electrode. J. Power Sources 1999, 80, 103–106. [Google Scholar] [CrossRef]
- Wang, X.; Zheng, X.; Liao, Y.; Huang, Q.; Xing, L.; Xu, M.; Li, W. Maintaining structural integrity of 4.5 V lithium cobalt oxide cathode with fumaronitrile as a novel electrolyte additive. J. Power Sources 2017, 338, 108–116. [Google Scholar] [CrossRef]
- Li, J.; Xing, L.; Wang, Z.; Tu, W.; Yang, X.; Lin, Y.; Liao, Y.; Xu, M.; Li, W. Insight into the capacity fading of layered lithium-rich oxides and its suppression via a film-forming electrolyte additive. RSC Adv. 2018, 8, 25794–25801. [Google Scholar] [CrossRef] [PubMed]
- Chen, J.; Gao, Y.; Li, C.; Zhang, H.; Liu, J.; Zhang, Q. Interface modification in high voltage spinel lithium-ion battery by using N-methylpyrrole as an electrolyte additive. Electrochimica Acta 2015, 178, 127–133. [Google Scholar] [CrossRef]
- Li, J.; Zhang, L.; Yu, L.; Fan, W.; Wang, Z.; Yang, X.; Lin, Y.; Xing, L.; Xu, M.; Li, W. Understanding Interfacial Properties between Li-Rich Layered Oxide and Electrolyte Containing Triethyl Borate. J. Phys. Chem. C 2016, 120, 26899–26907. [Google Scholar] [CrossRef]
- Li, B.; Wang, Y.; Rong, H.; Wang, Y.; Liu, J.; Xing, L.; Xu, M.; Li, W. A novel electrolyte with the ability to form a solid electrolyte interface on the anode and cathode of a LiMn2O4/graphite battery, J. Mater. Chem. A. 2013, 1, 12954–12961. [Google Scholar] [CrossRef]
- Verma, P.; Maire, P.; Novák, P. A review of the features and analyses of the solid electrolyte interphase in Li-ion batteries. Electrochimica Acta 2010, 55, 6332–6341. [Google Scholar] [CrossRef]
- DeKoven, B.M.; Hagans, P.L. XPS studies of metal/polymer interfaces — Thin films of Al on polyacrylic acid and polyethylene. Appl. Surf. Sci. 1986, 27, 199–213. [Google Scholar] [CrossRef]
- Lazarraga, M.G.; Pascual, L.; Gadjov, H.; Kovacheva, D.; Petrov, K.; Amarilla, J.M.; Rojas, R.M.; Martin-Luengo, M.A.; Rojo, J.M. Nanosize LiNiyMn2 ? yO4 (0 < y ? 0.5) spinels synthesized by a sucrose-aided combustion method. Characterization and electrochemical performance. J. Mater. Chem. 2004, 14, 1640–1647. [Google Scholar] [CrossRef]
- Li, B.; Wang, Y.; Lin, H.; Liu, J.; Xing, L.; Xu, M.; Li, W. Improving high voltage stability of lithium cobalt oxide/graphite battery via forming protective films simultaneously on anode and cathode by using electrolyte additive. Electrochimica Acta 2014, 141, 263–270. [Google Scholar] [CrossRef]
- Liu, Y.; Wang, K.; Lin, Y.; Zhu, Y.; Tu, W.; Xu, M.; Liu, X.; Li, B.; Li, W. Tetrafluoroterephthalonitrile: A Novel Electrolyte Additive for High-Voltage Lithium Cobalt Oxide/Graphite Battery. Electrochimica Acta 2017, 256, 307–315. [Google Scholar] [CrossRef]
Figure 1.
Illustration on low-temperature-aged synthesis of CeO2-coated Li-rich oxide.
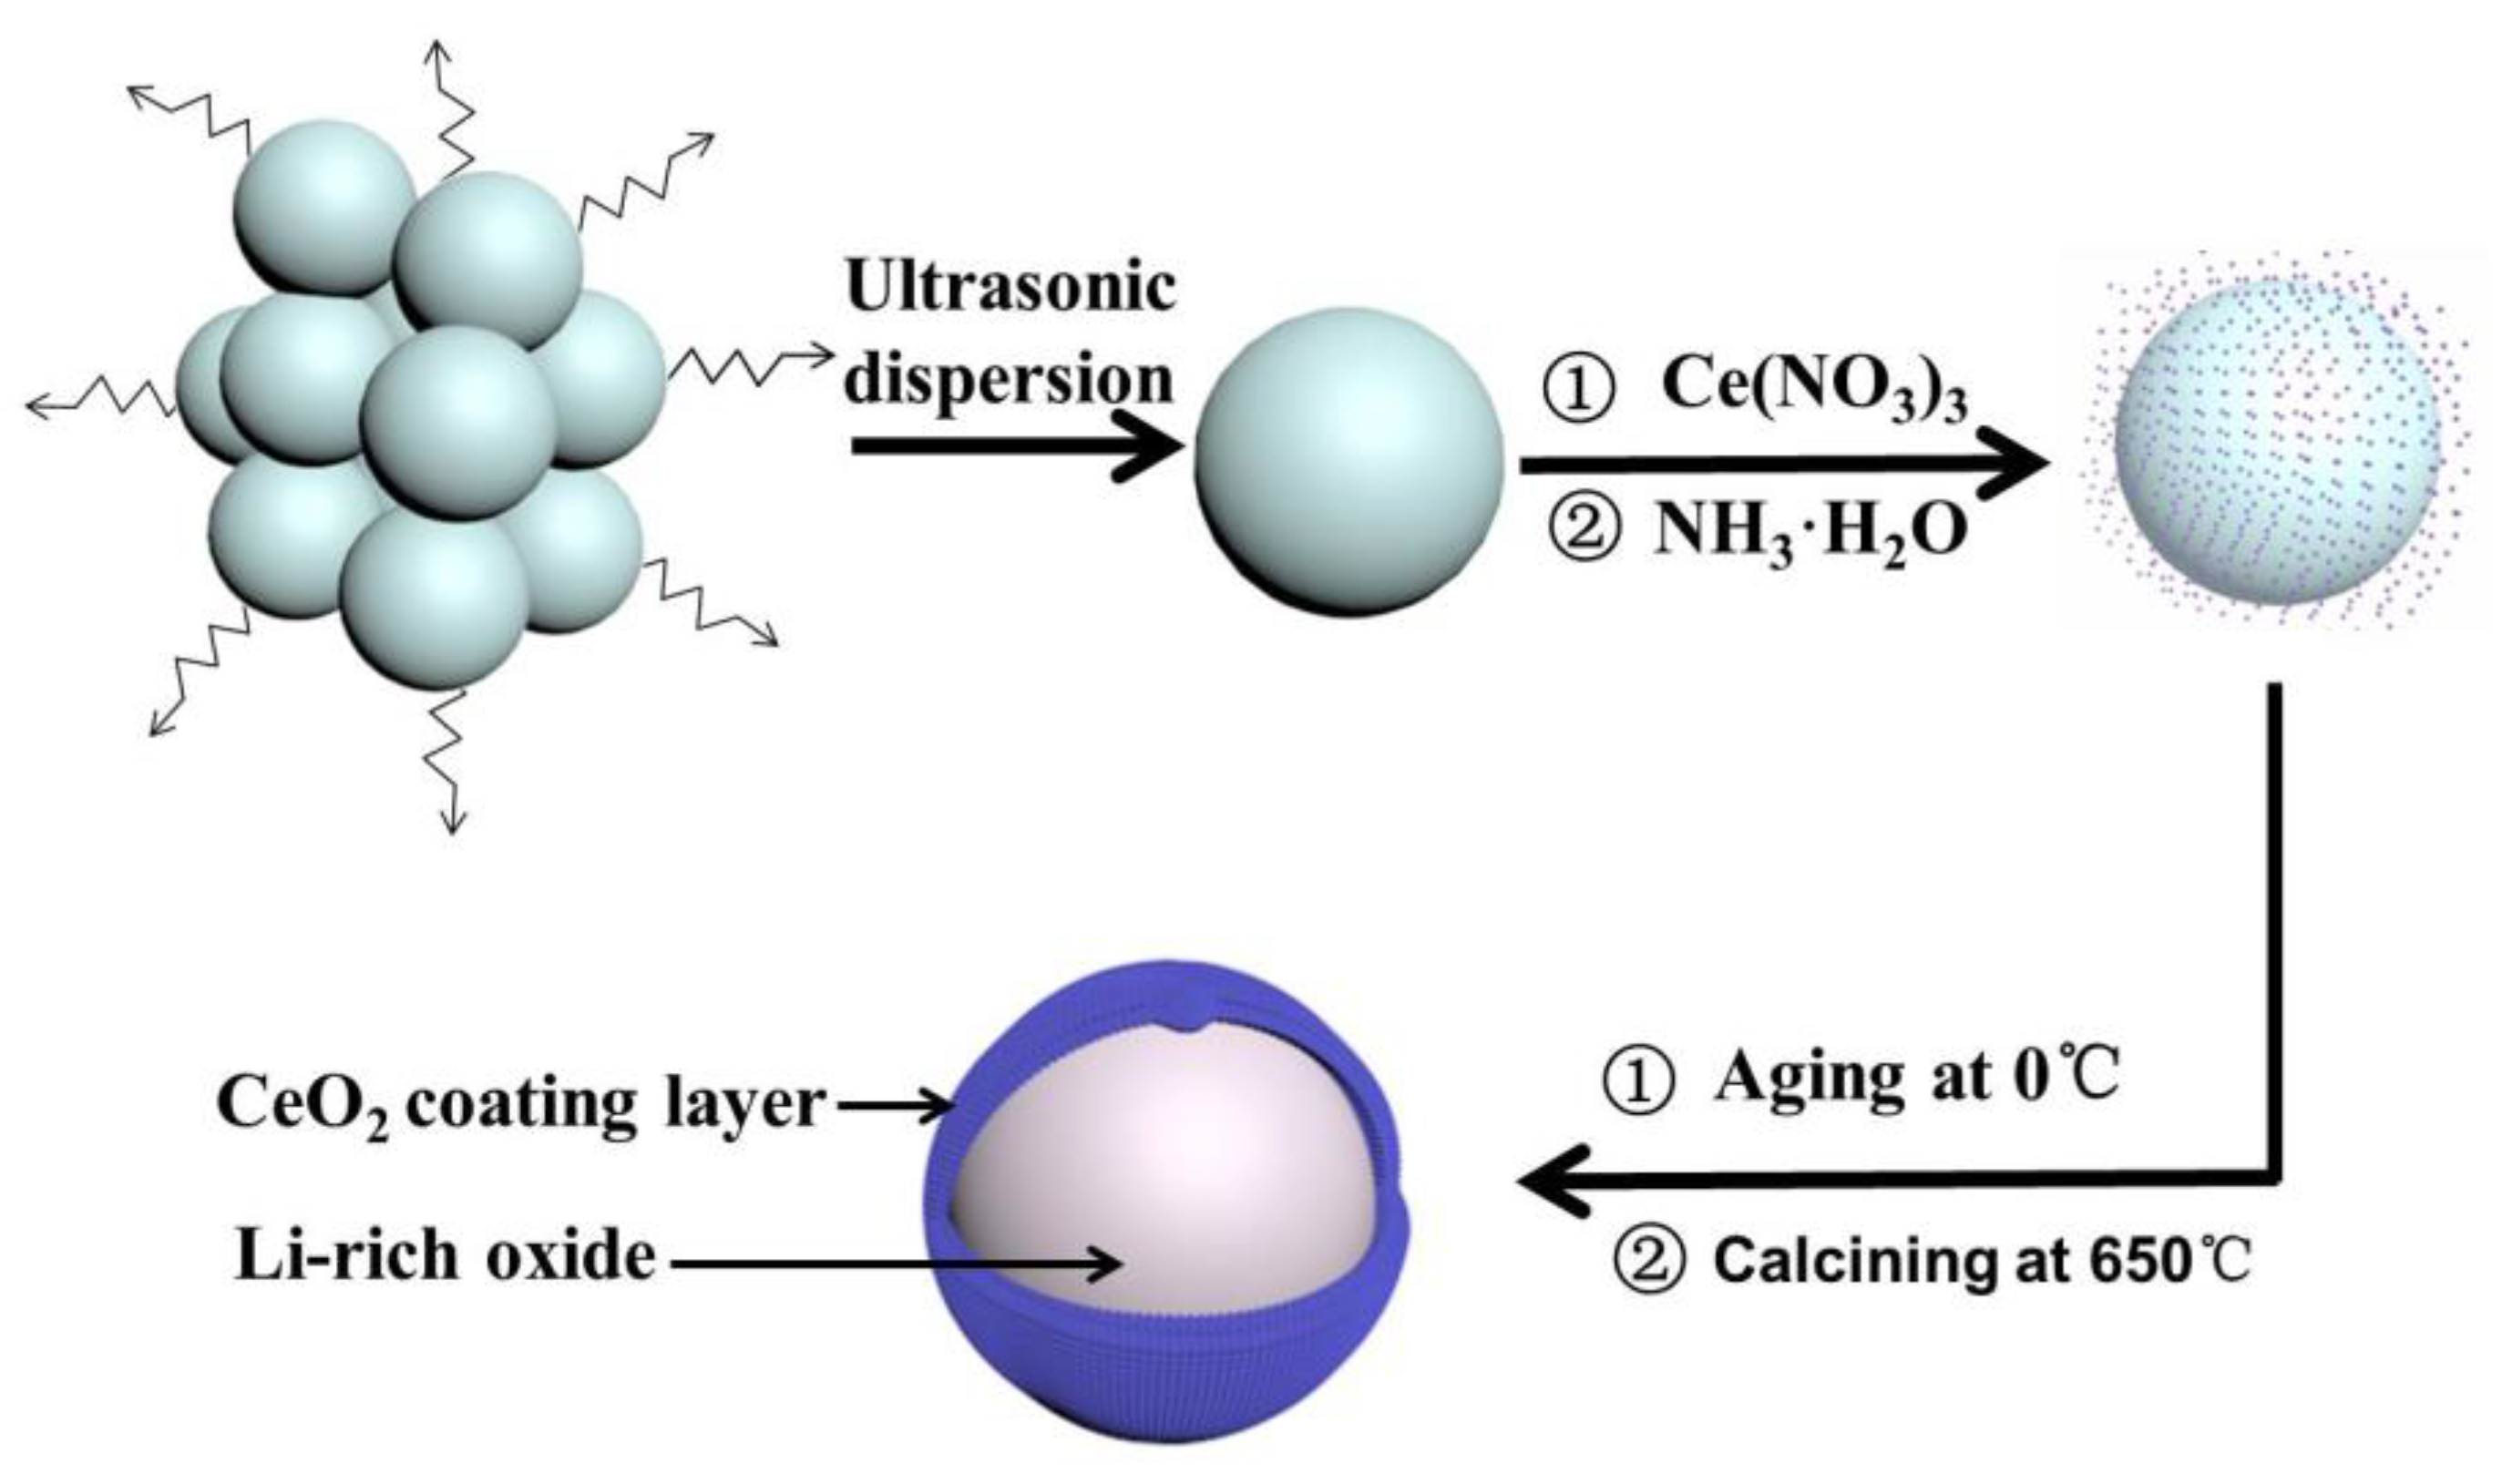
Figure 2.
XRD patterns of pristine Li[Li0.2Ni0.2Mn0.6]O2 (LMN-P) and CeO2-coated Li[Li0.2Ni0.2Mn0.6]O2 (LMN-C).
Figure 2.
XRD patterns of pristine Li[Li0.2Ni0.2Mn0.6]O2 (LMN-P) and CeO2-coated Li[Li0.2Ni0.2Mn0.6]O2 (LMN-C).
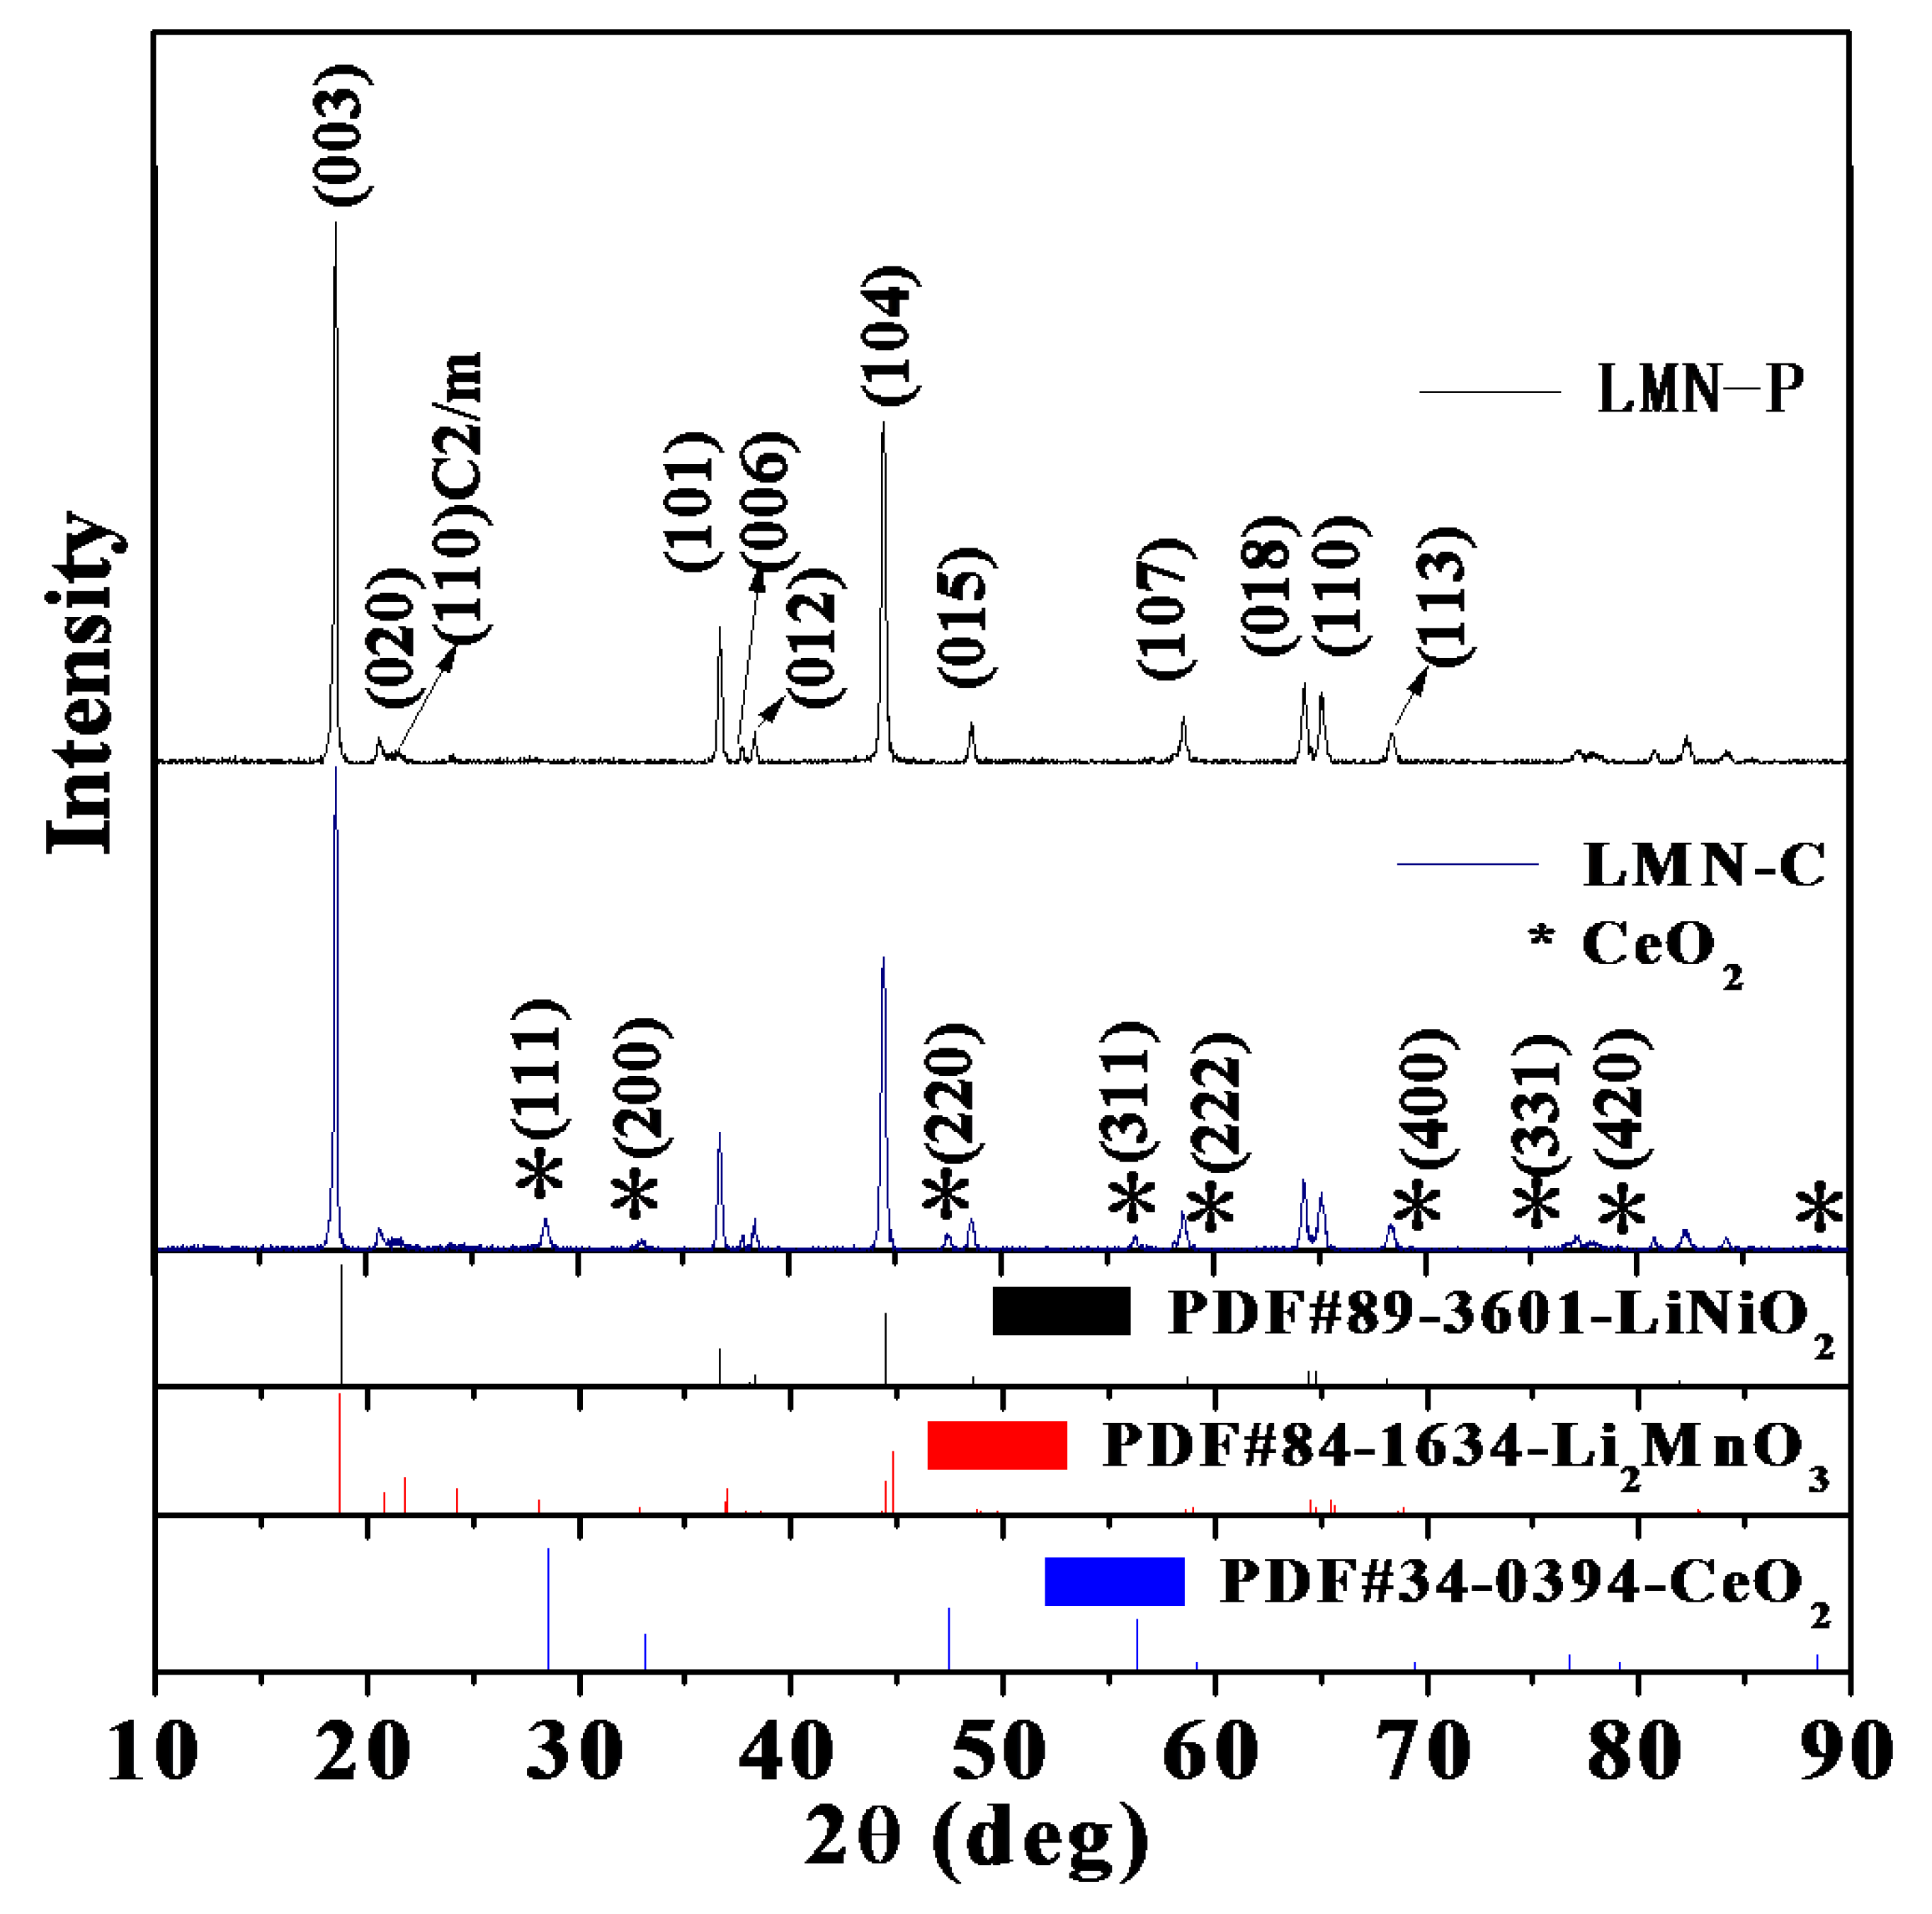
Figure 3.
SEM images of LMN-P (A) and LMN-C (B); TEM images of LMN-P (C) and LMN-C with an insertion of selected area electron diffraction (SAED) (D).
Figure 3.
SEM images of LMN-P (A) and LMN-C (B); TEM images of LMN-P (C) and LMN-C with an insertion of selected area electron diffraction (SAED) (D).
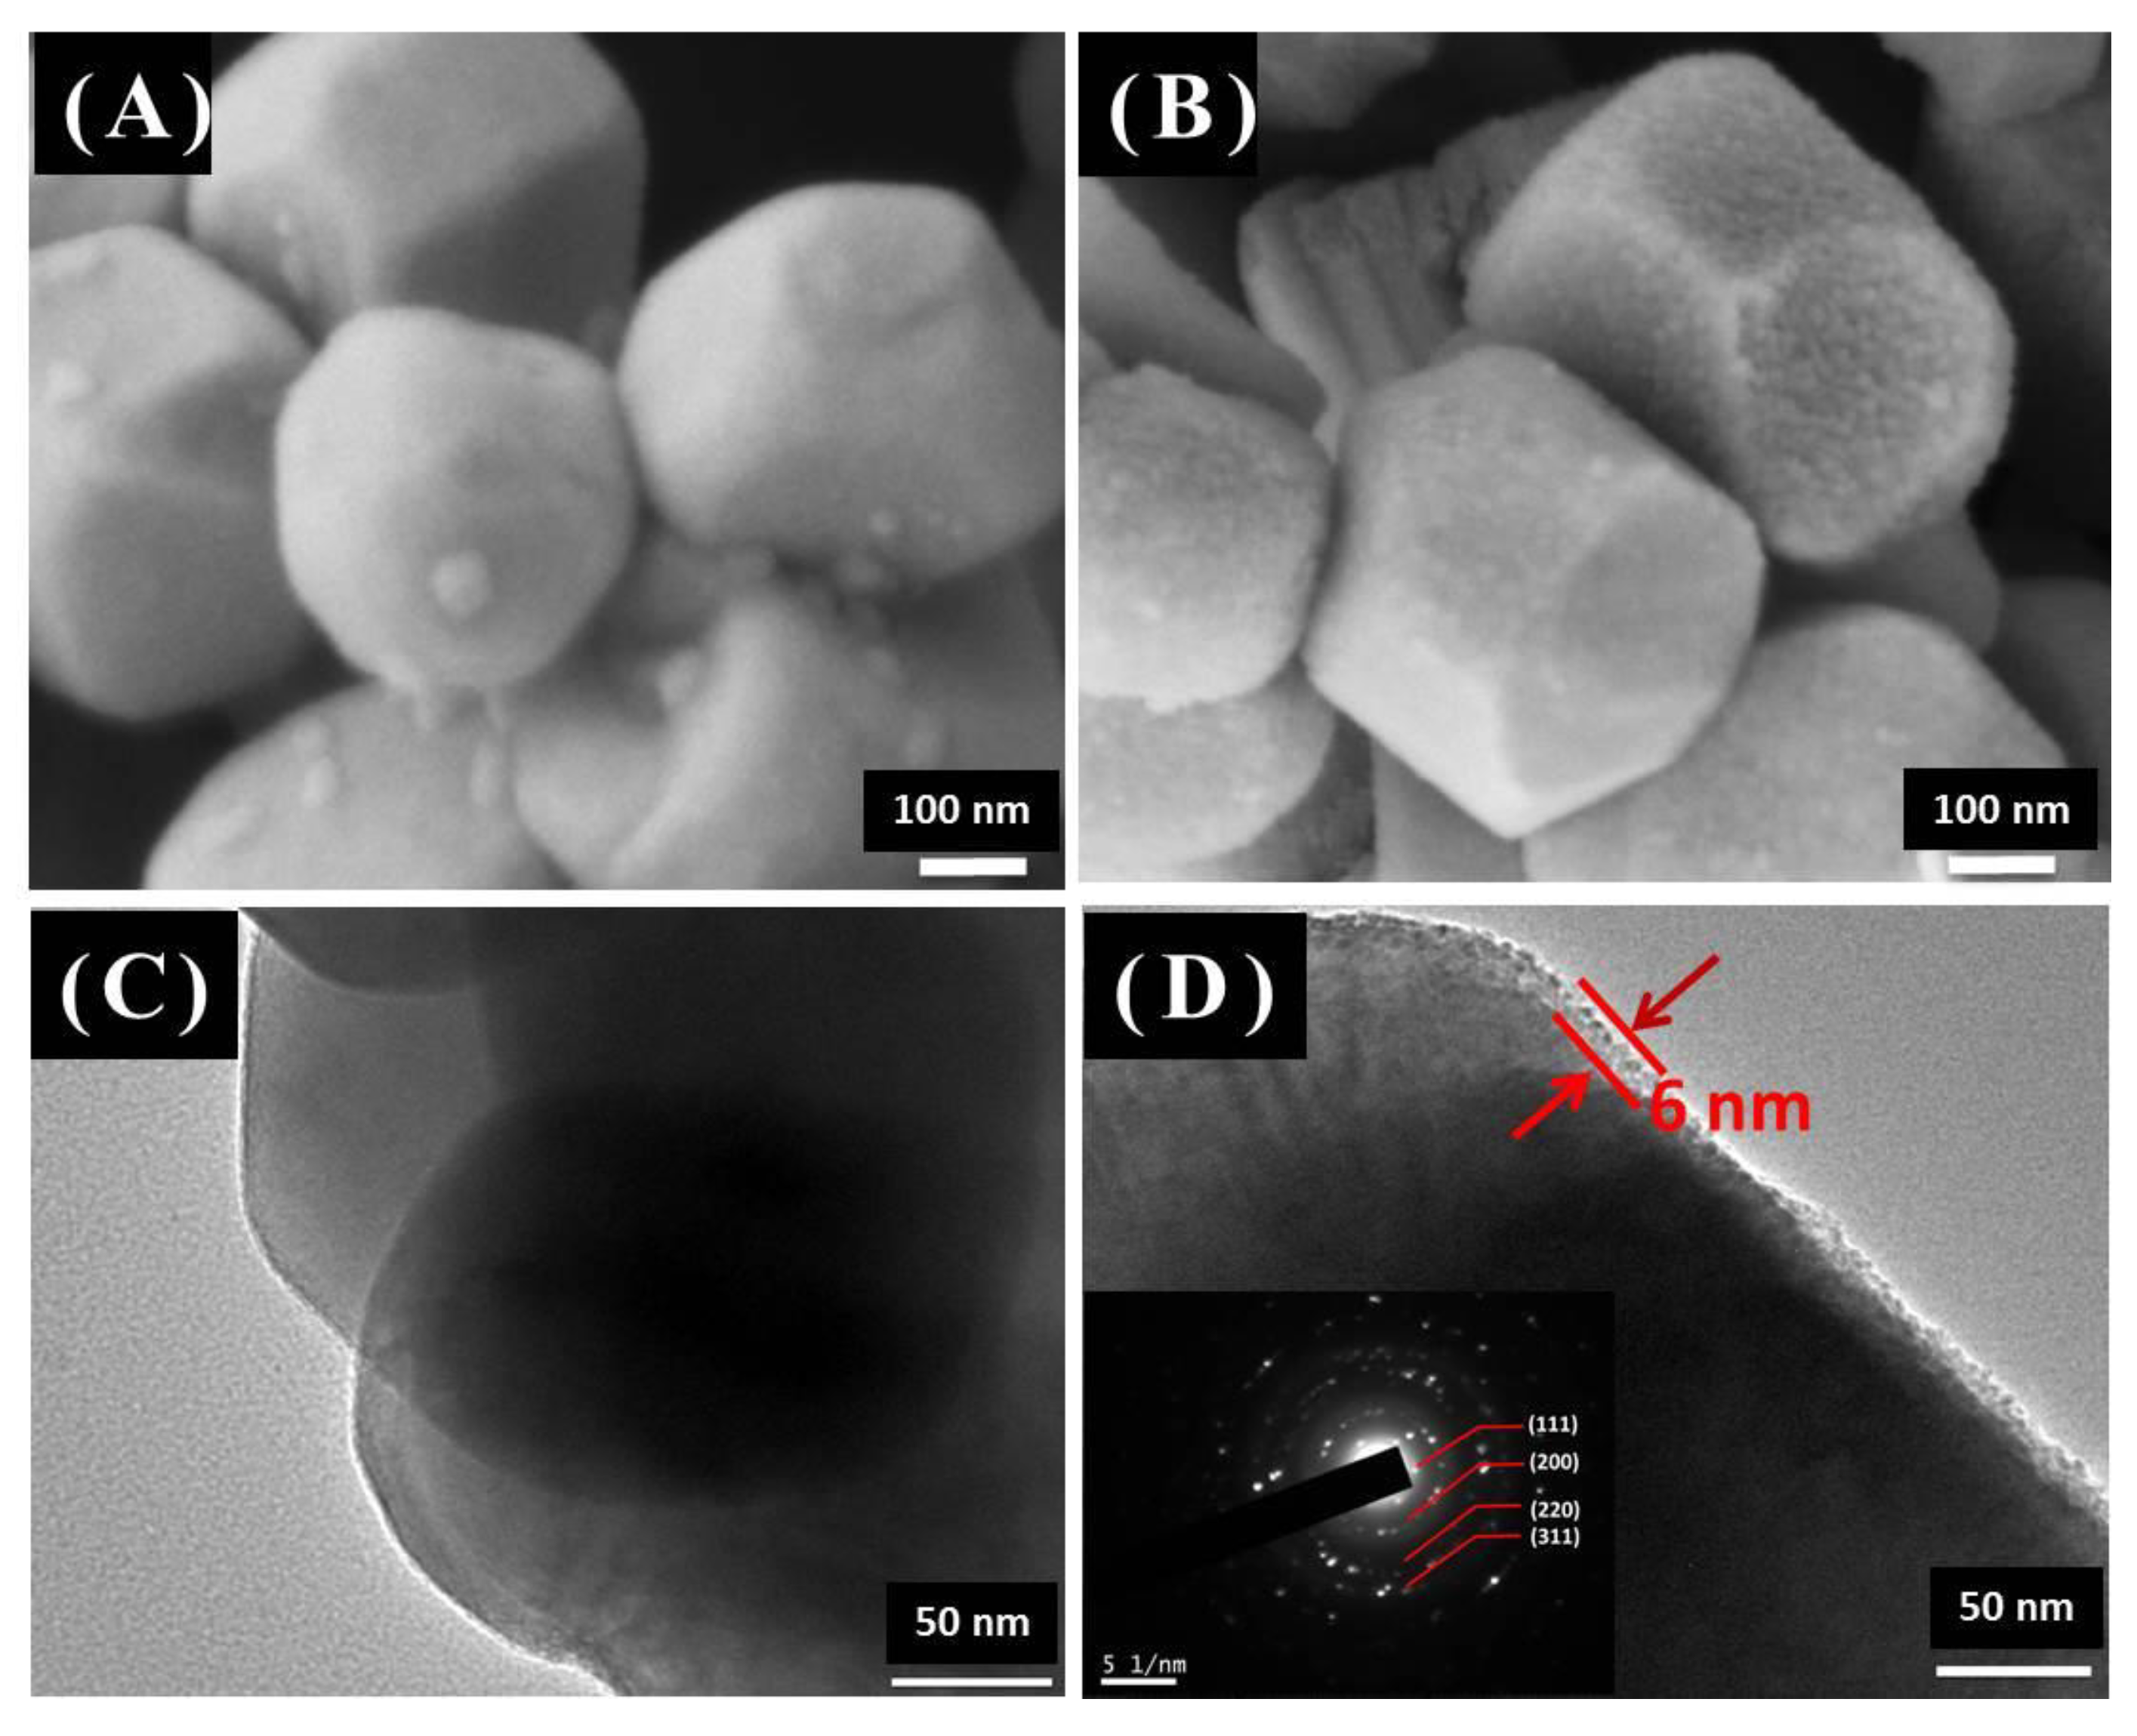
Figure 4.
Cyclic voltammograms of LMN-P and LMN-C at scan rate 0.2 mV s-1 in the voltage range of 2.0-5.0 V (vs. Li/Li+) for the first (A) and the third (B) cycles.
Figure 4.
Cyclic voltammograms of LMN-P and LMN-C at scan rate 0.2 mV s-1 in the voltage range of 2.0-5.0 V (vs. Li/Li+) for the first (A) and the third (B) cycles.
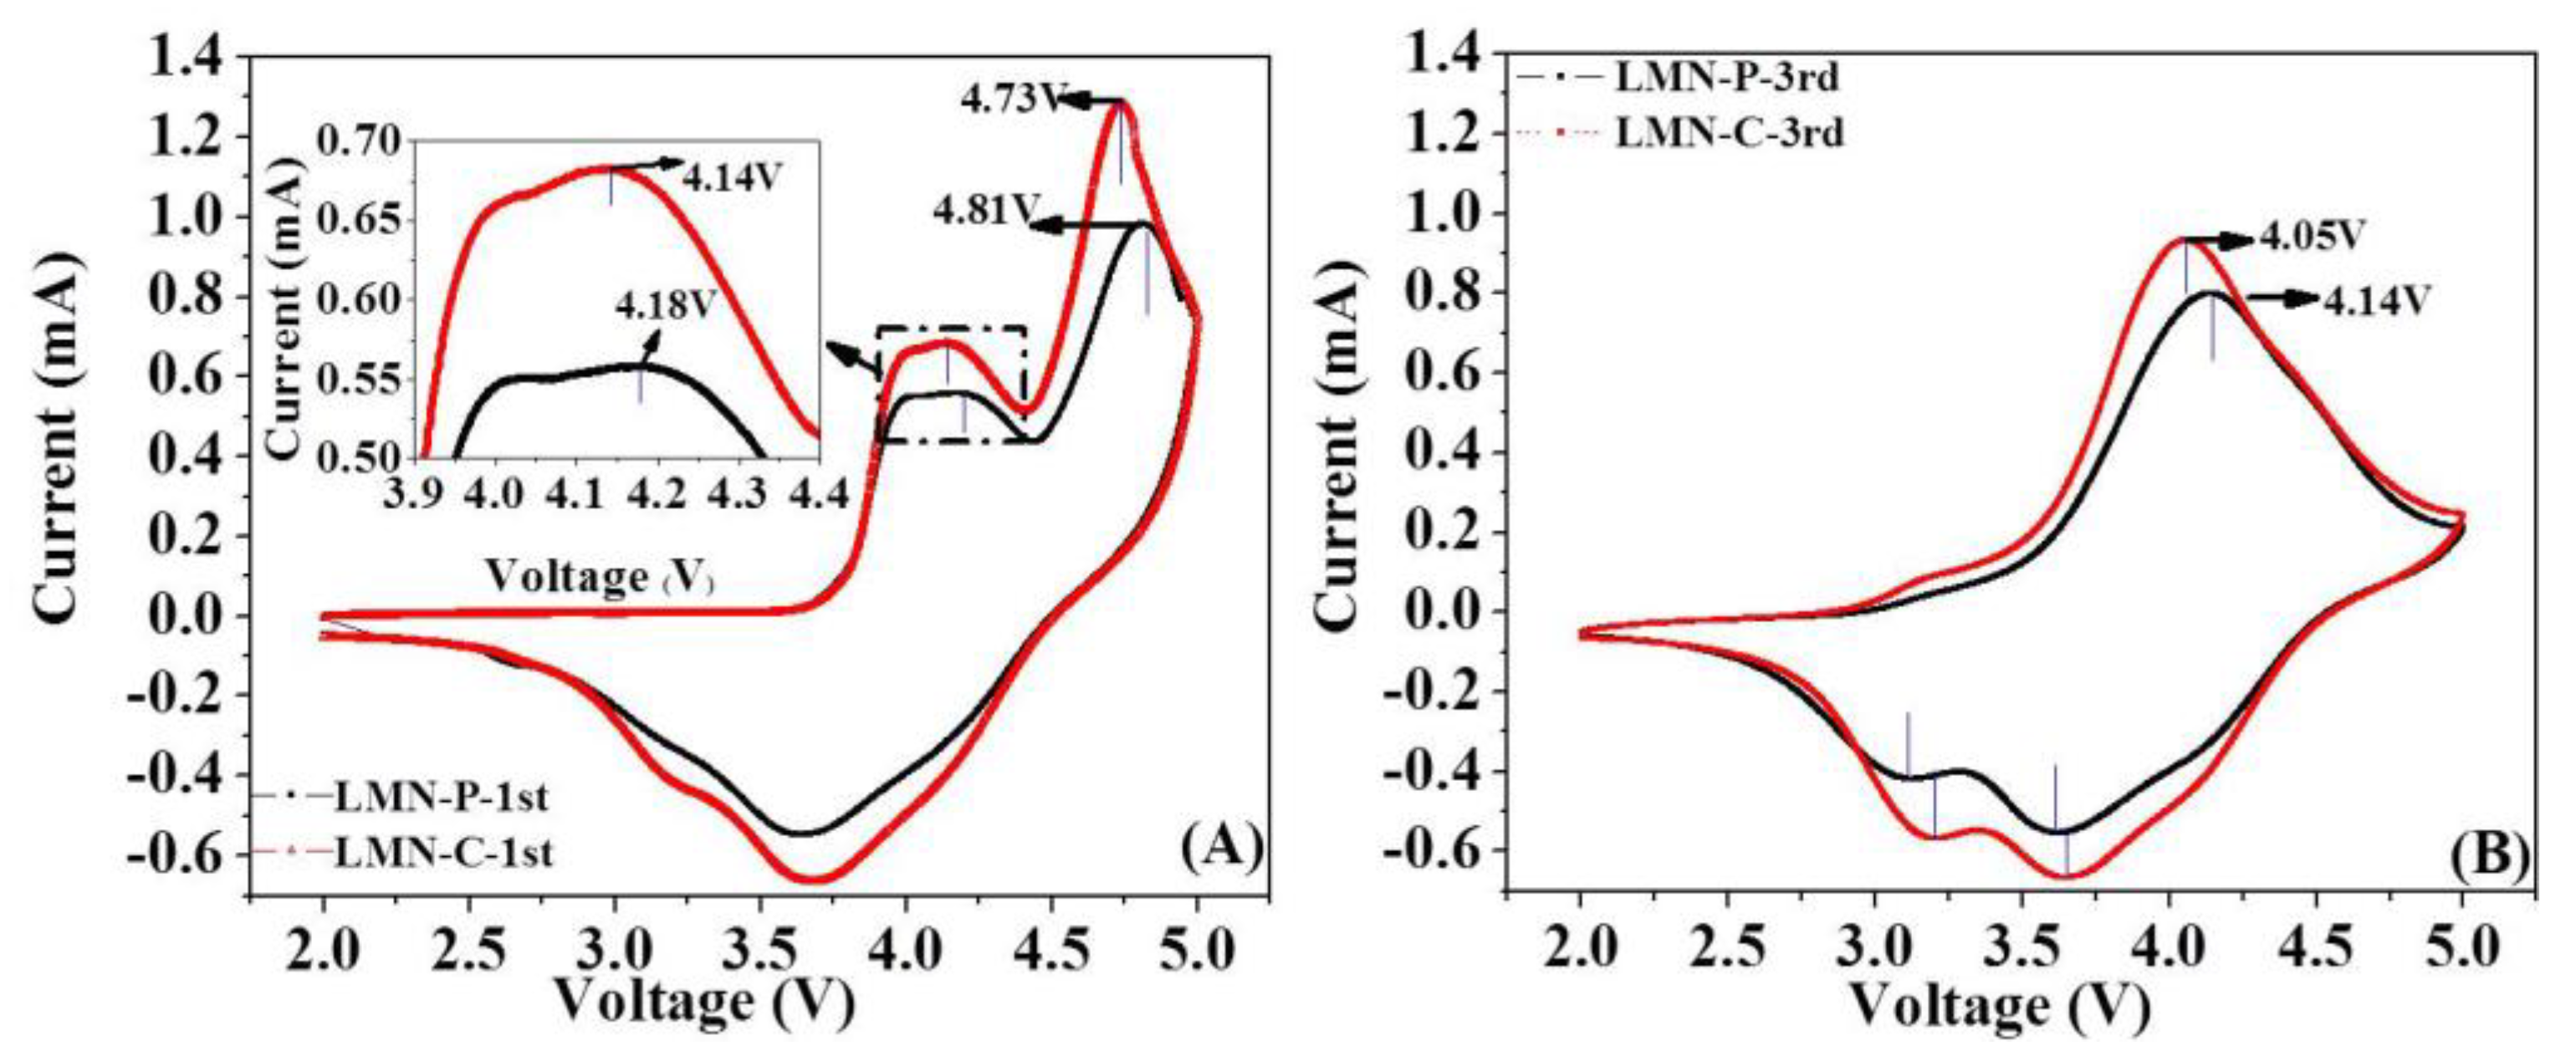
Figure 5.
Cycling stability (A), Charge/discharge curves for the 1st (B) and the 3rd (C) cycles with a current density of 10 mA g-1, Rate capability (D), and (E) Electrochemical impedance spectra with the equivalent circuit for fitting of the assembled cell for LMN-P and LMN-C.
Figure 5.
Cycling stability (A), Charge/discharge curves for the 1st (B) and the 3rd (C) cycles with a current density of 10 mA g-1, Rate capability (D), and (E) Electrochemical impedance spectra with the equivalent circuit for fitting of the assembled cell for LMN-P and LMN-C.

Figure 6.
SEM and TEM images of LMN-P (A, C) and LMN-C (B, D); FTIR spectra (E) and XRD patterns (F) of LMN-P and LMN-C electrodes after cycling test in Figure 3C.
Figure 6.
SEM and TEM images of LMN-P (A, C) and LMN-C (B, D); FTIR spectra (E) and XRD patterns (F) of LMN-P and LMN-C electrodes after cycling test in Figure 3C.
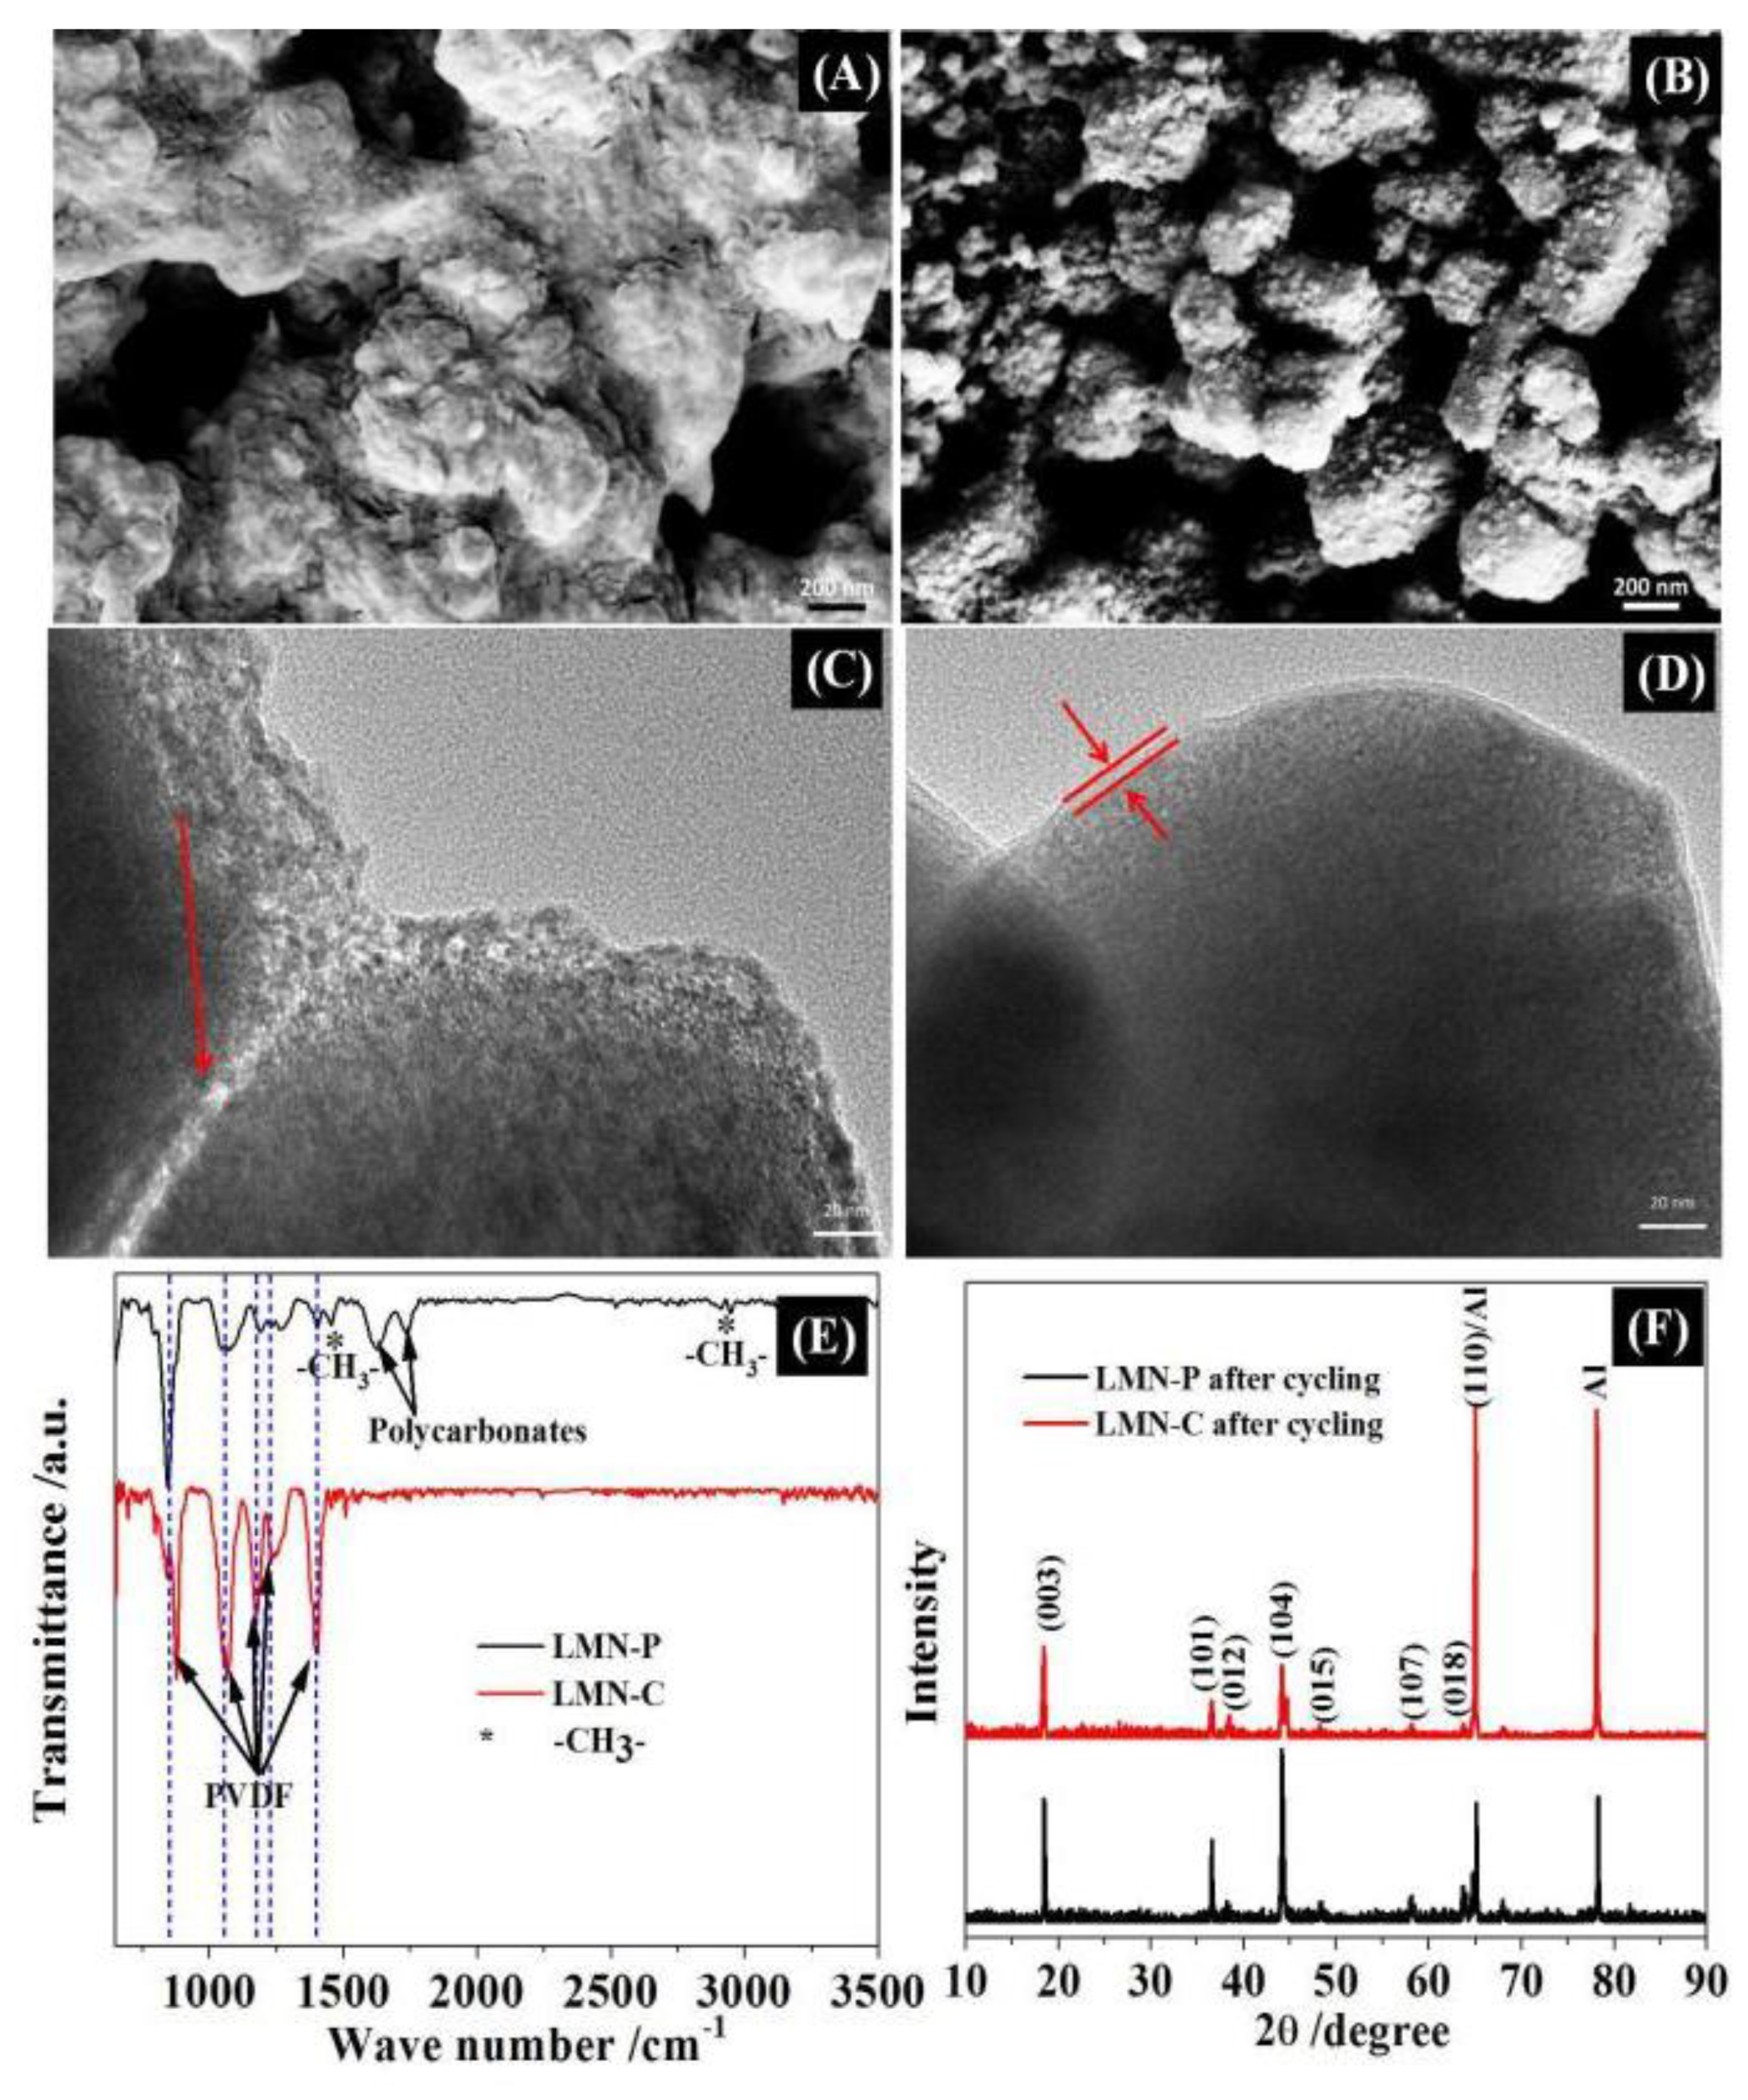
Figure 7.
SEM images and EDS of lithium electrodes from the cycled cells with LMN-P (A -D) and LMN-C (E-H).
Figure 7.
SEM images and EDS of lithium electrodes from the cycled cells with LMN-P (A -D) and LMN-C (E-H).
Disclaimer/Publisher’s Note: The statements, opinions and data contained in all publications are solely those of the individual author(s) and contributor(s) and not of MDPI and/or the editor(s). MDPI and/or the editor(s) disclaim responsibility for any injury to people or property resulting from any ideas, methods, instructions or products referred to in the content. |
© 2023 by the authors. Licensee MDPI, Basel, Switzerland. This article is an open access article distributed under the terms and conditions of the Creative Commons Attribution (CC BY) license (http://creativecommons.org/licenses/by/4.0/).
Copyright: This open access article is published under a Creative Commons CC BY 4.0 license, which permit the free download, distribution, and reuse, provided that the author and preprint are cited in any reuse.


