Submitted:
04 April 2023
Posted:
06 April 2023
You are already at the latest version
Abstract
Keywords:
Introduction
Objective
Methodology
Limitation
Major Findings of the Study
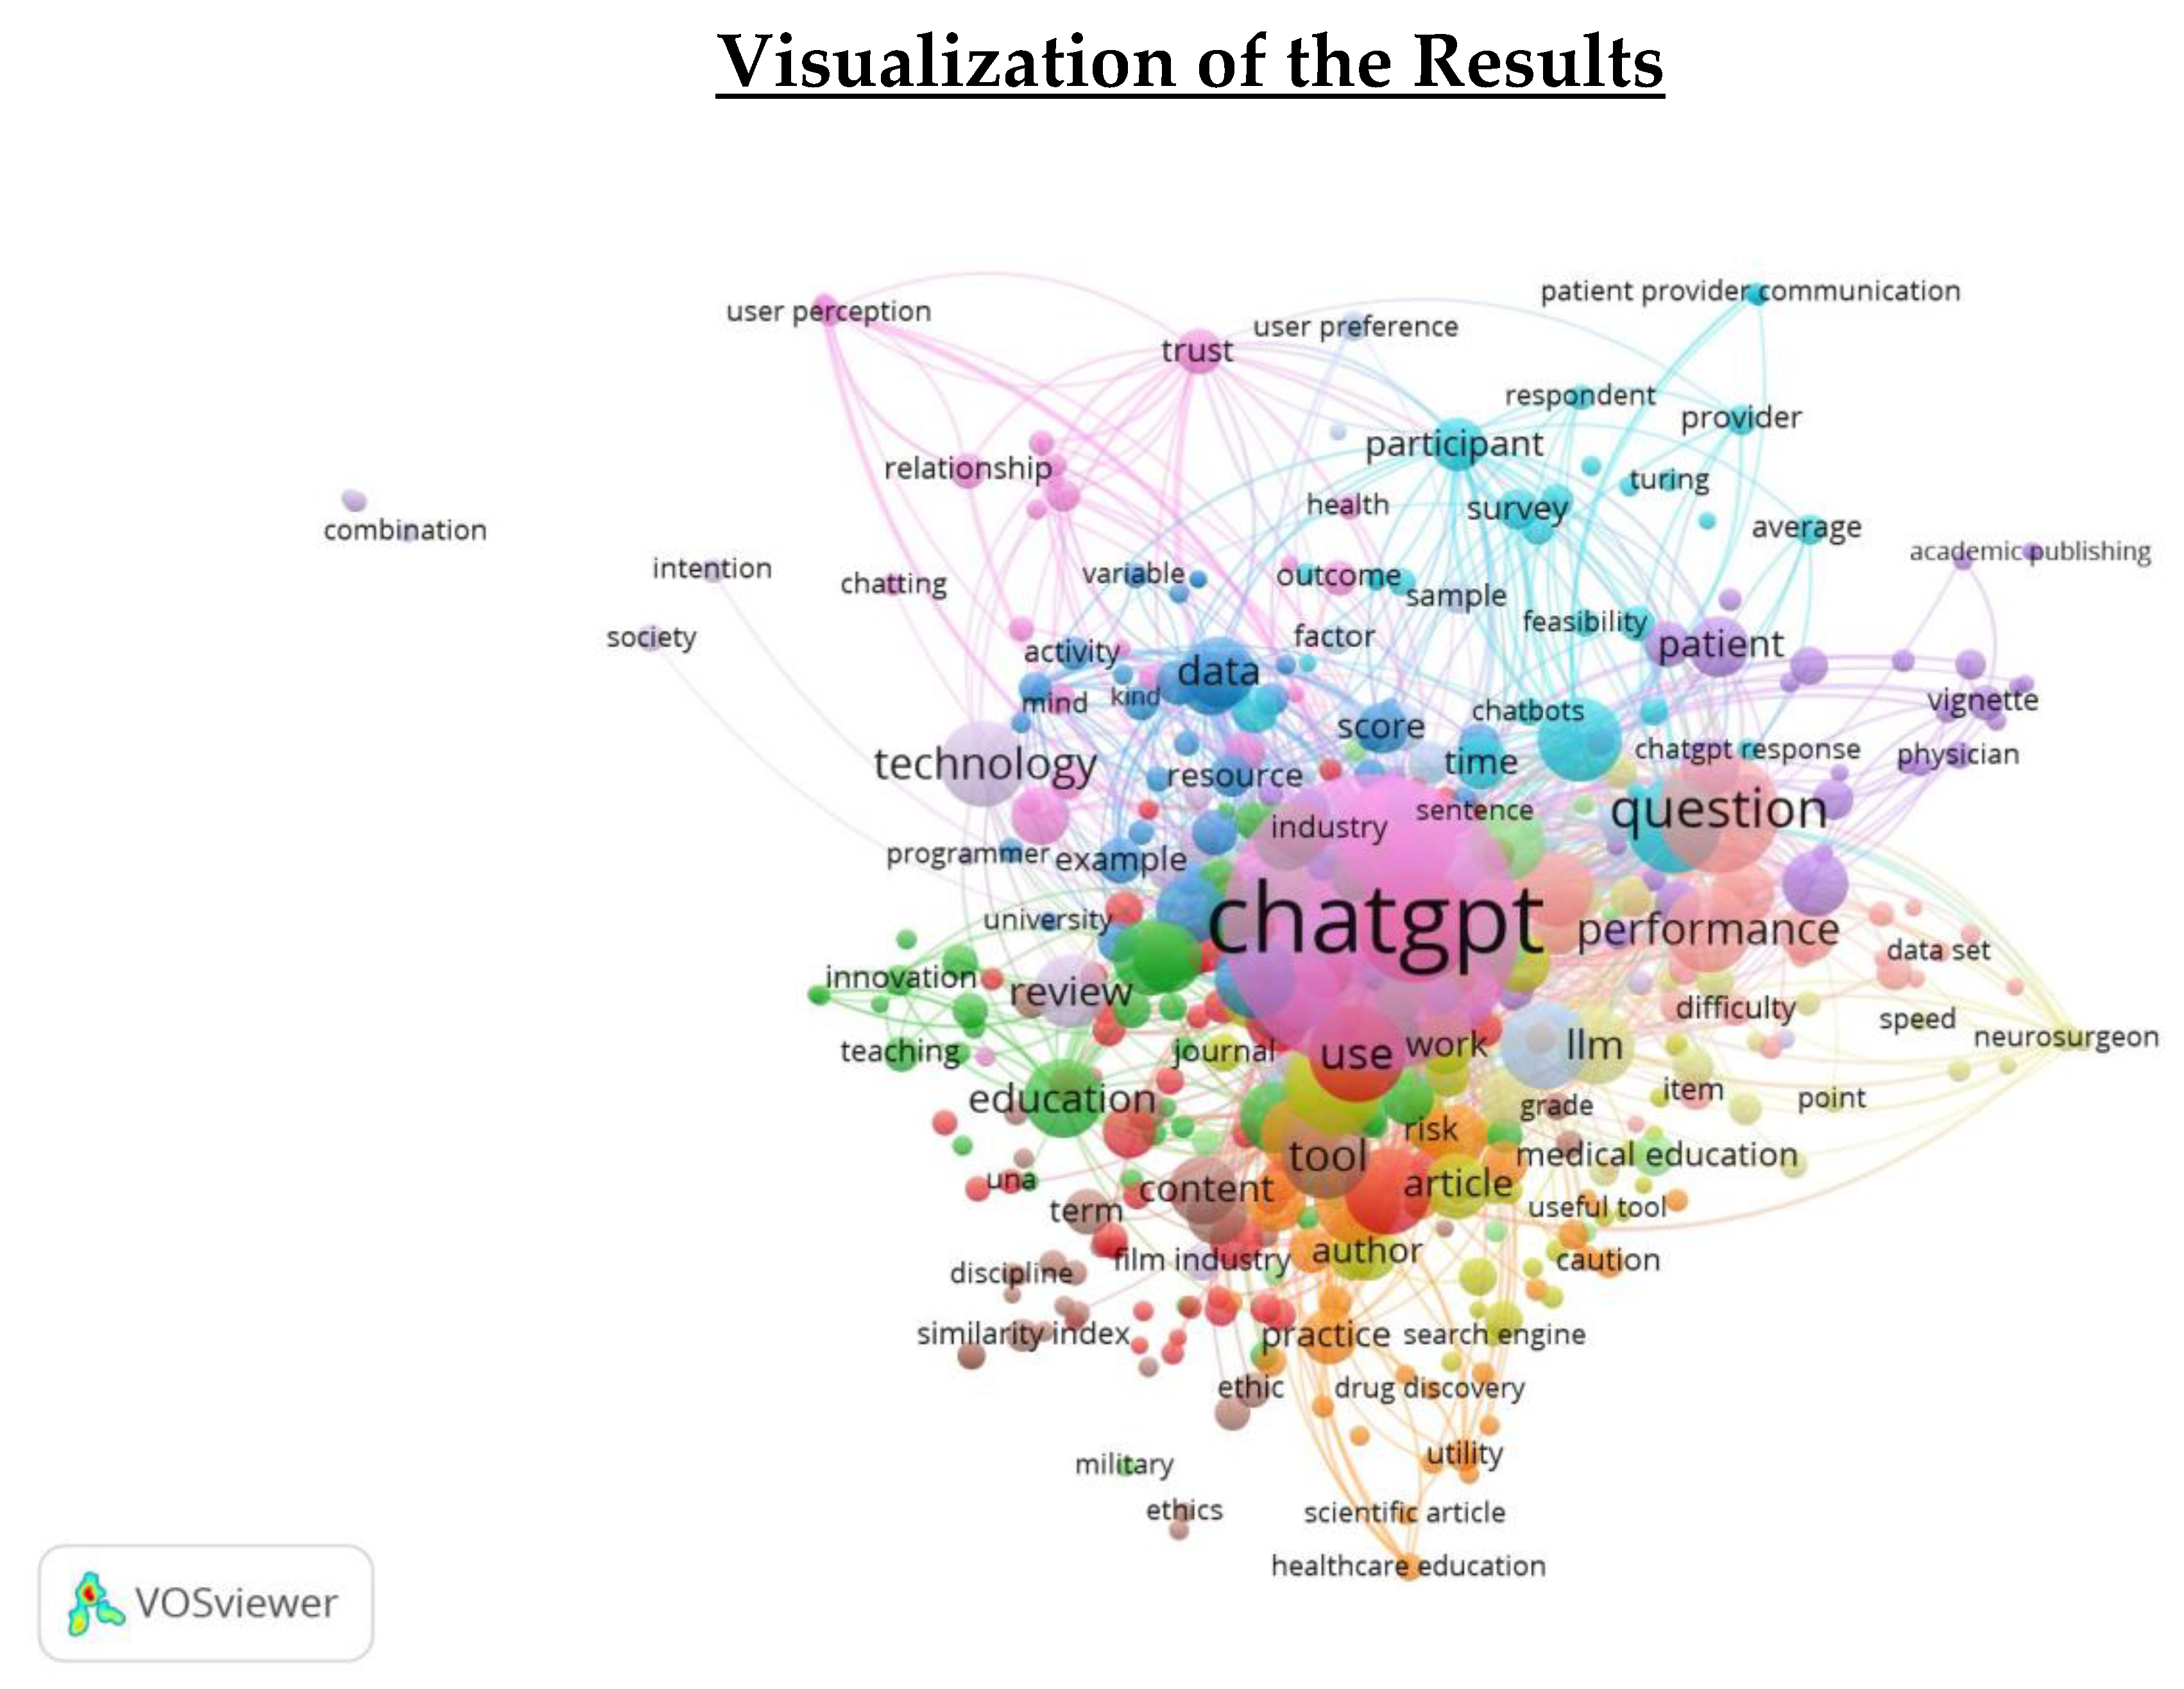
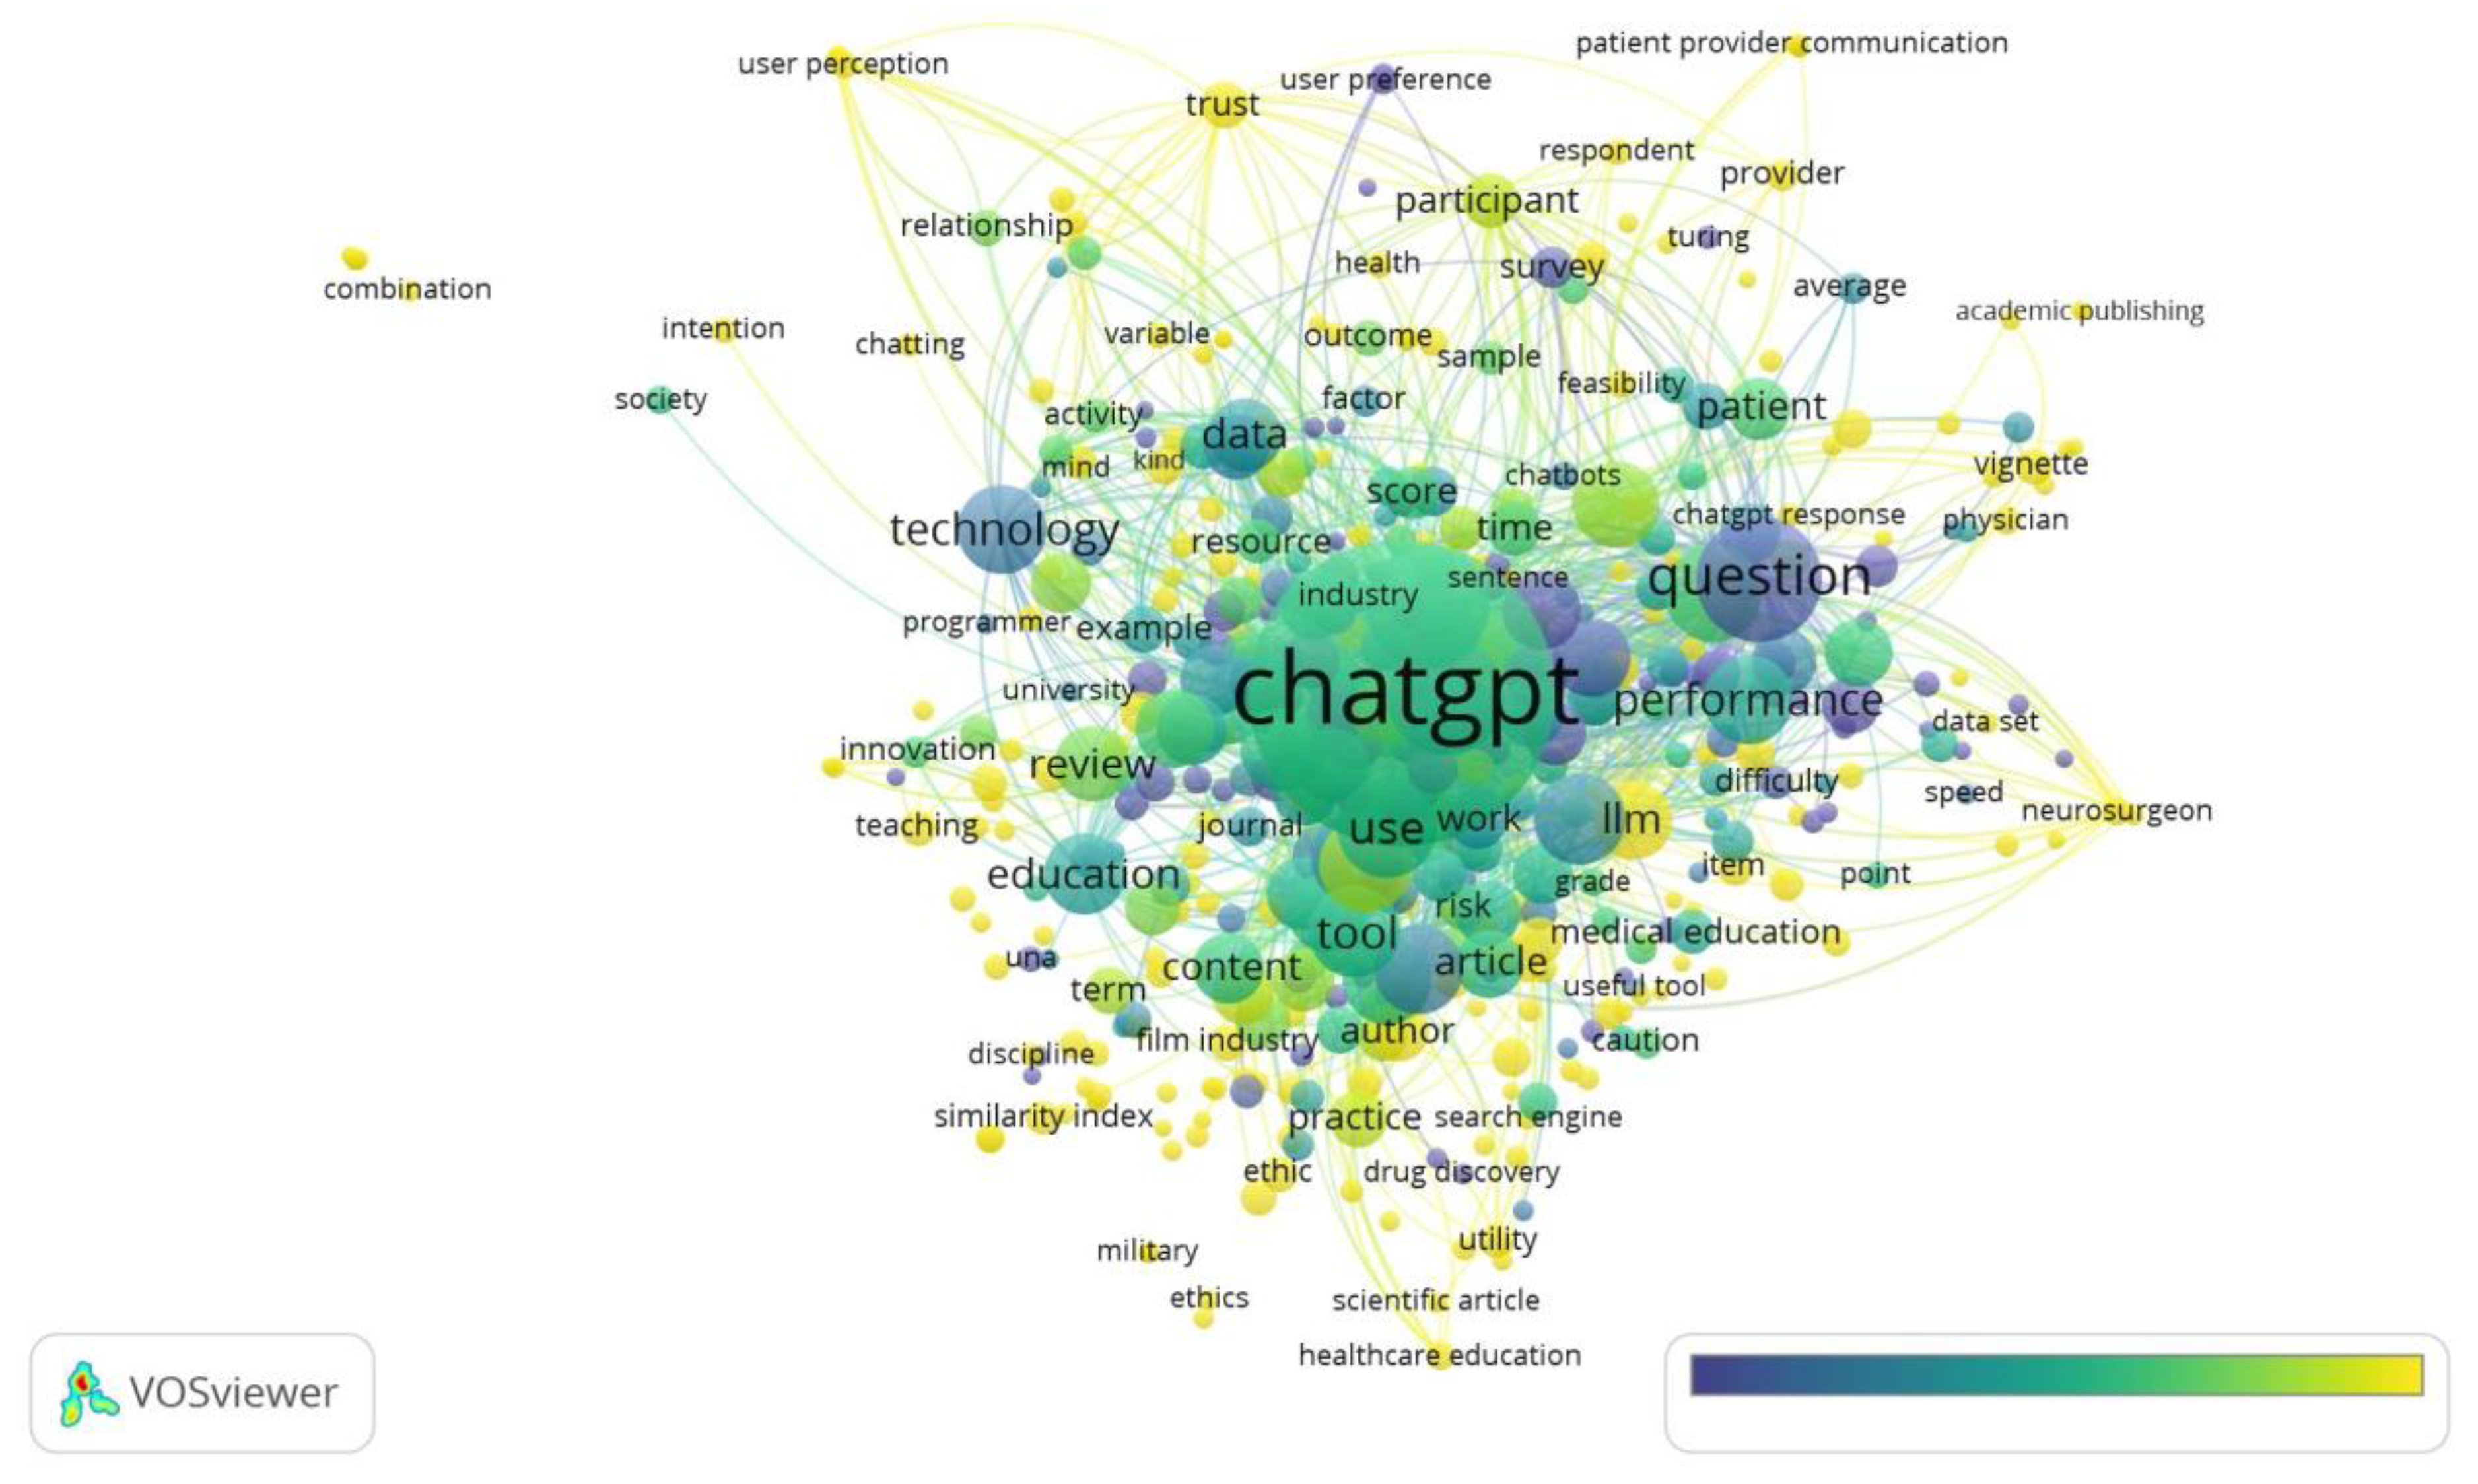
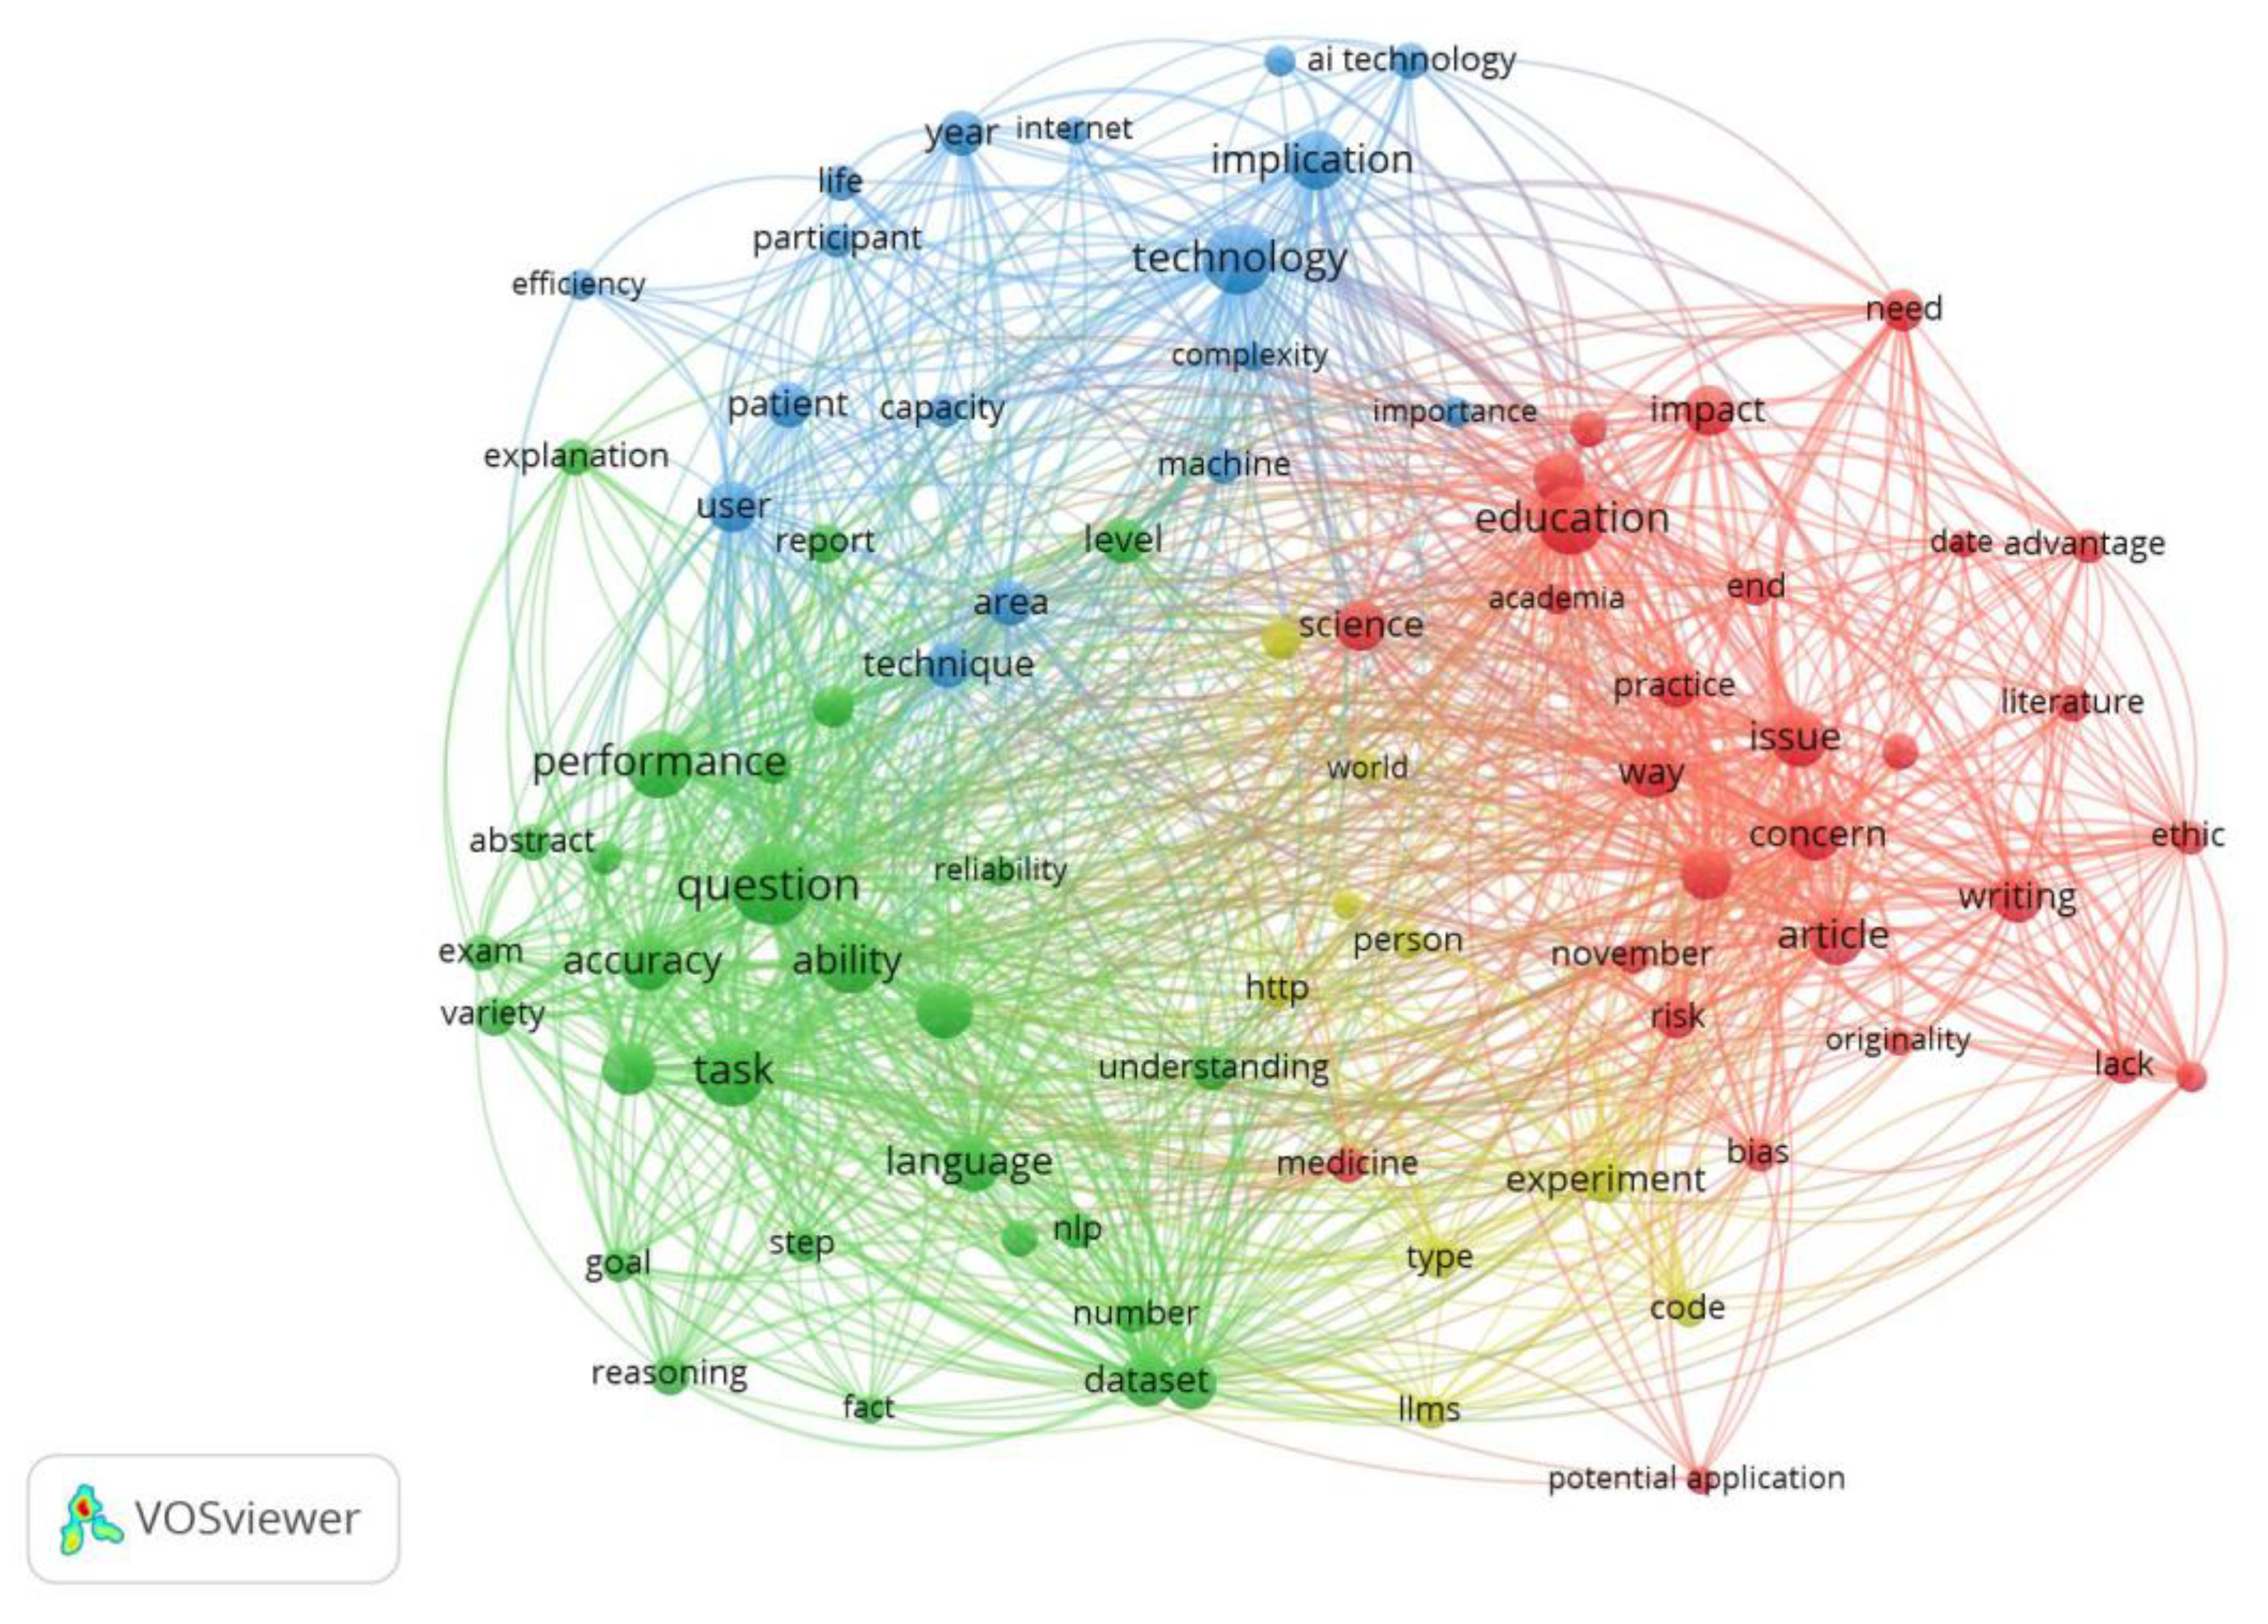
- 6908 terms were obtained from 577 publications by extracting the term co-occurrence of title and abstract filed. 50 most occurrencewords out of 6908 terms are given in Appendix 1 where terms, their occurrences time, relevance score and percentage are given. From that table it can be seen that the term chatgpt score the highest position with 1276 occurrence, followed by question (215), study (208), model (188) etc. The strong relationship between these terms is easily seen from the Network Visualization image (Figure 1, Figure 2 and Figure 3).
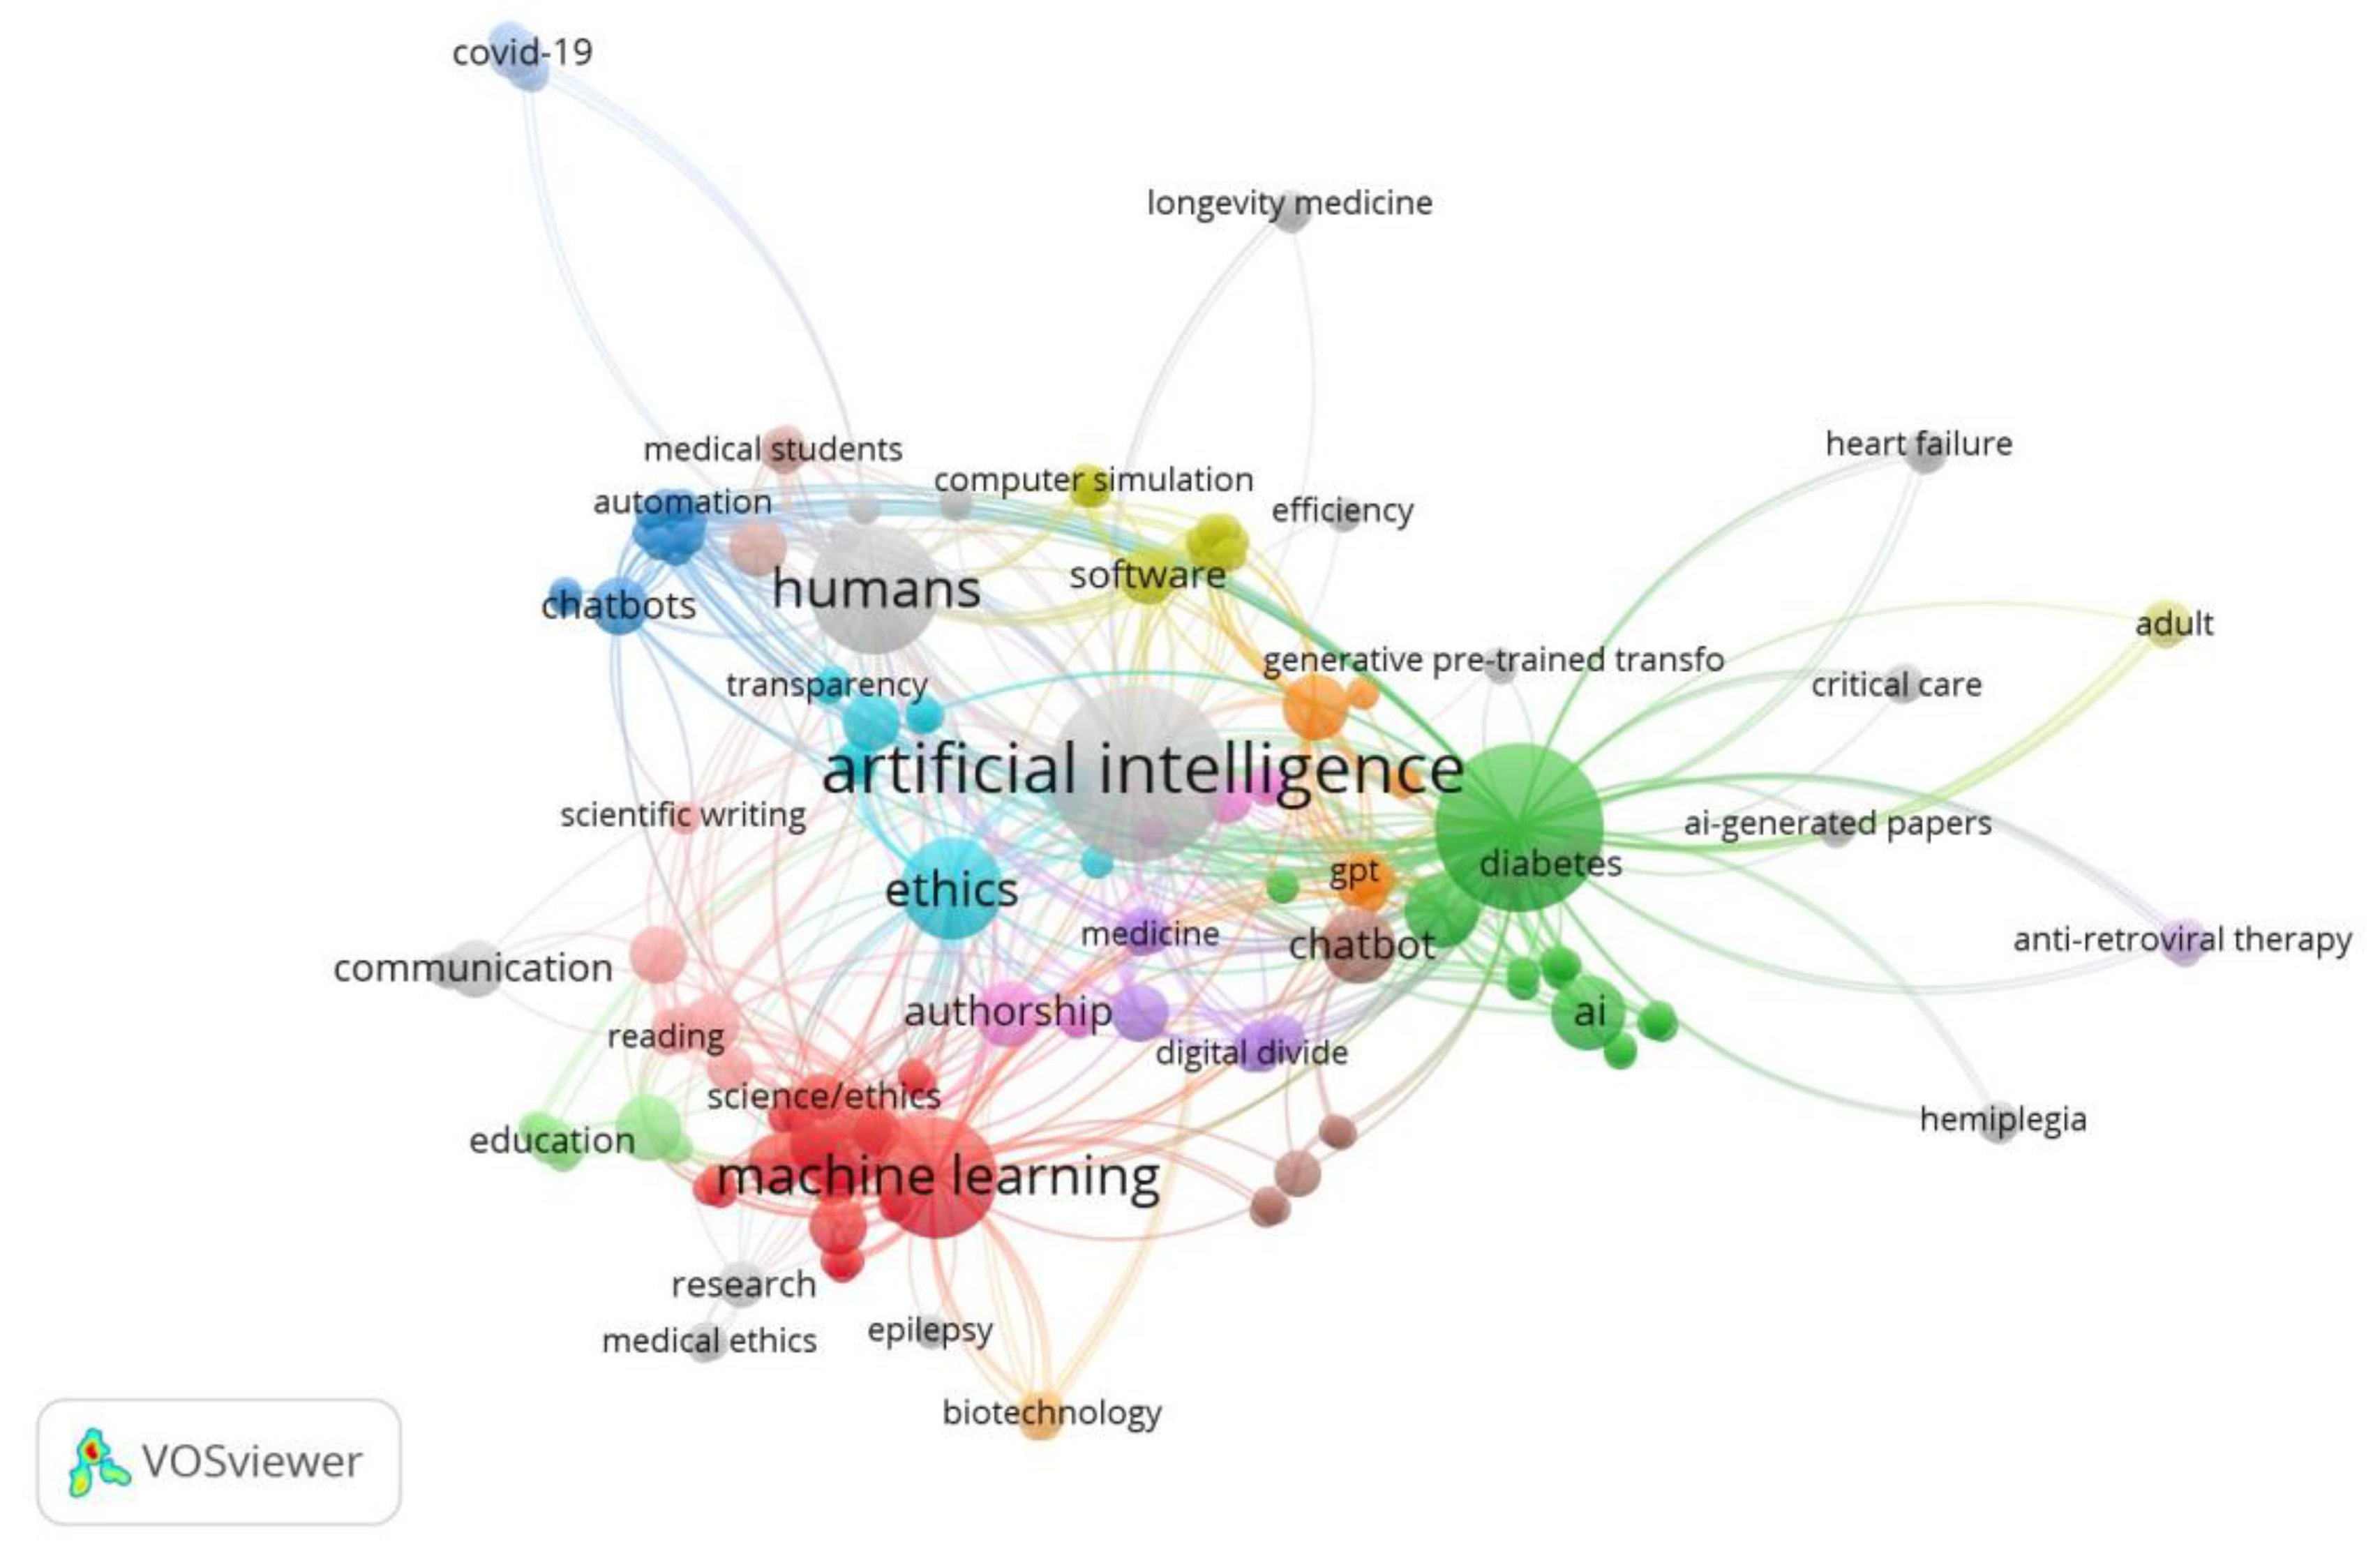
- Keyword Co-occurrence mapping (Figure 4) of all keywords shows that artificial intelligence is at the first place followed by chatgpt, humans, machine learning, ethics, publishing etc.
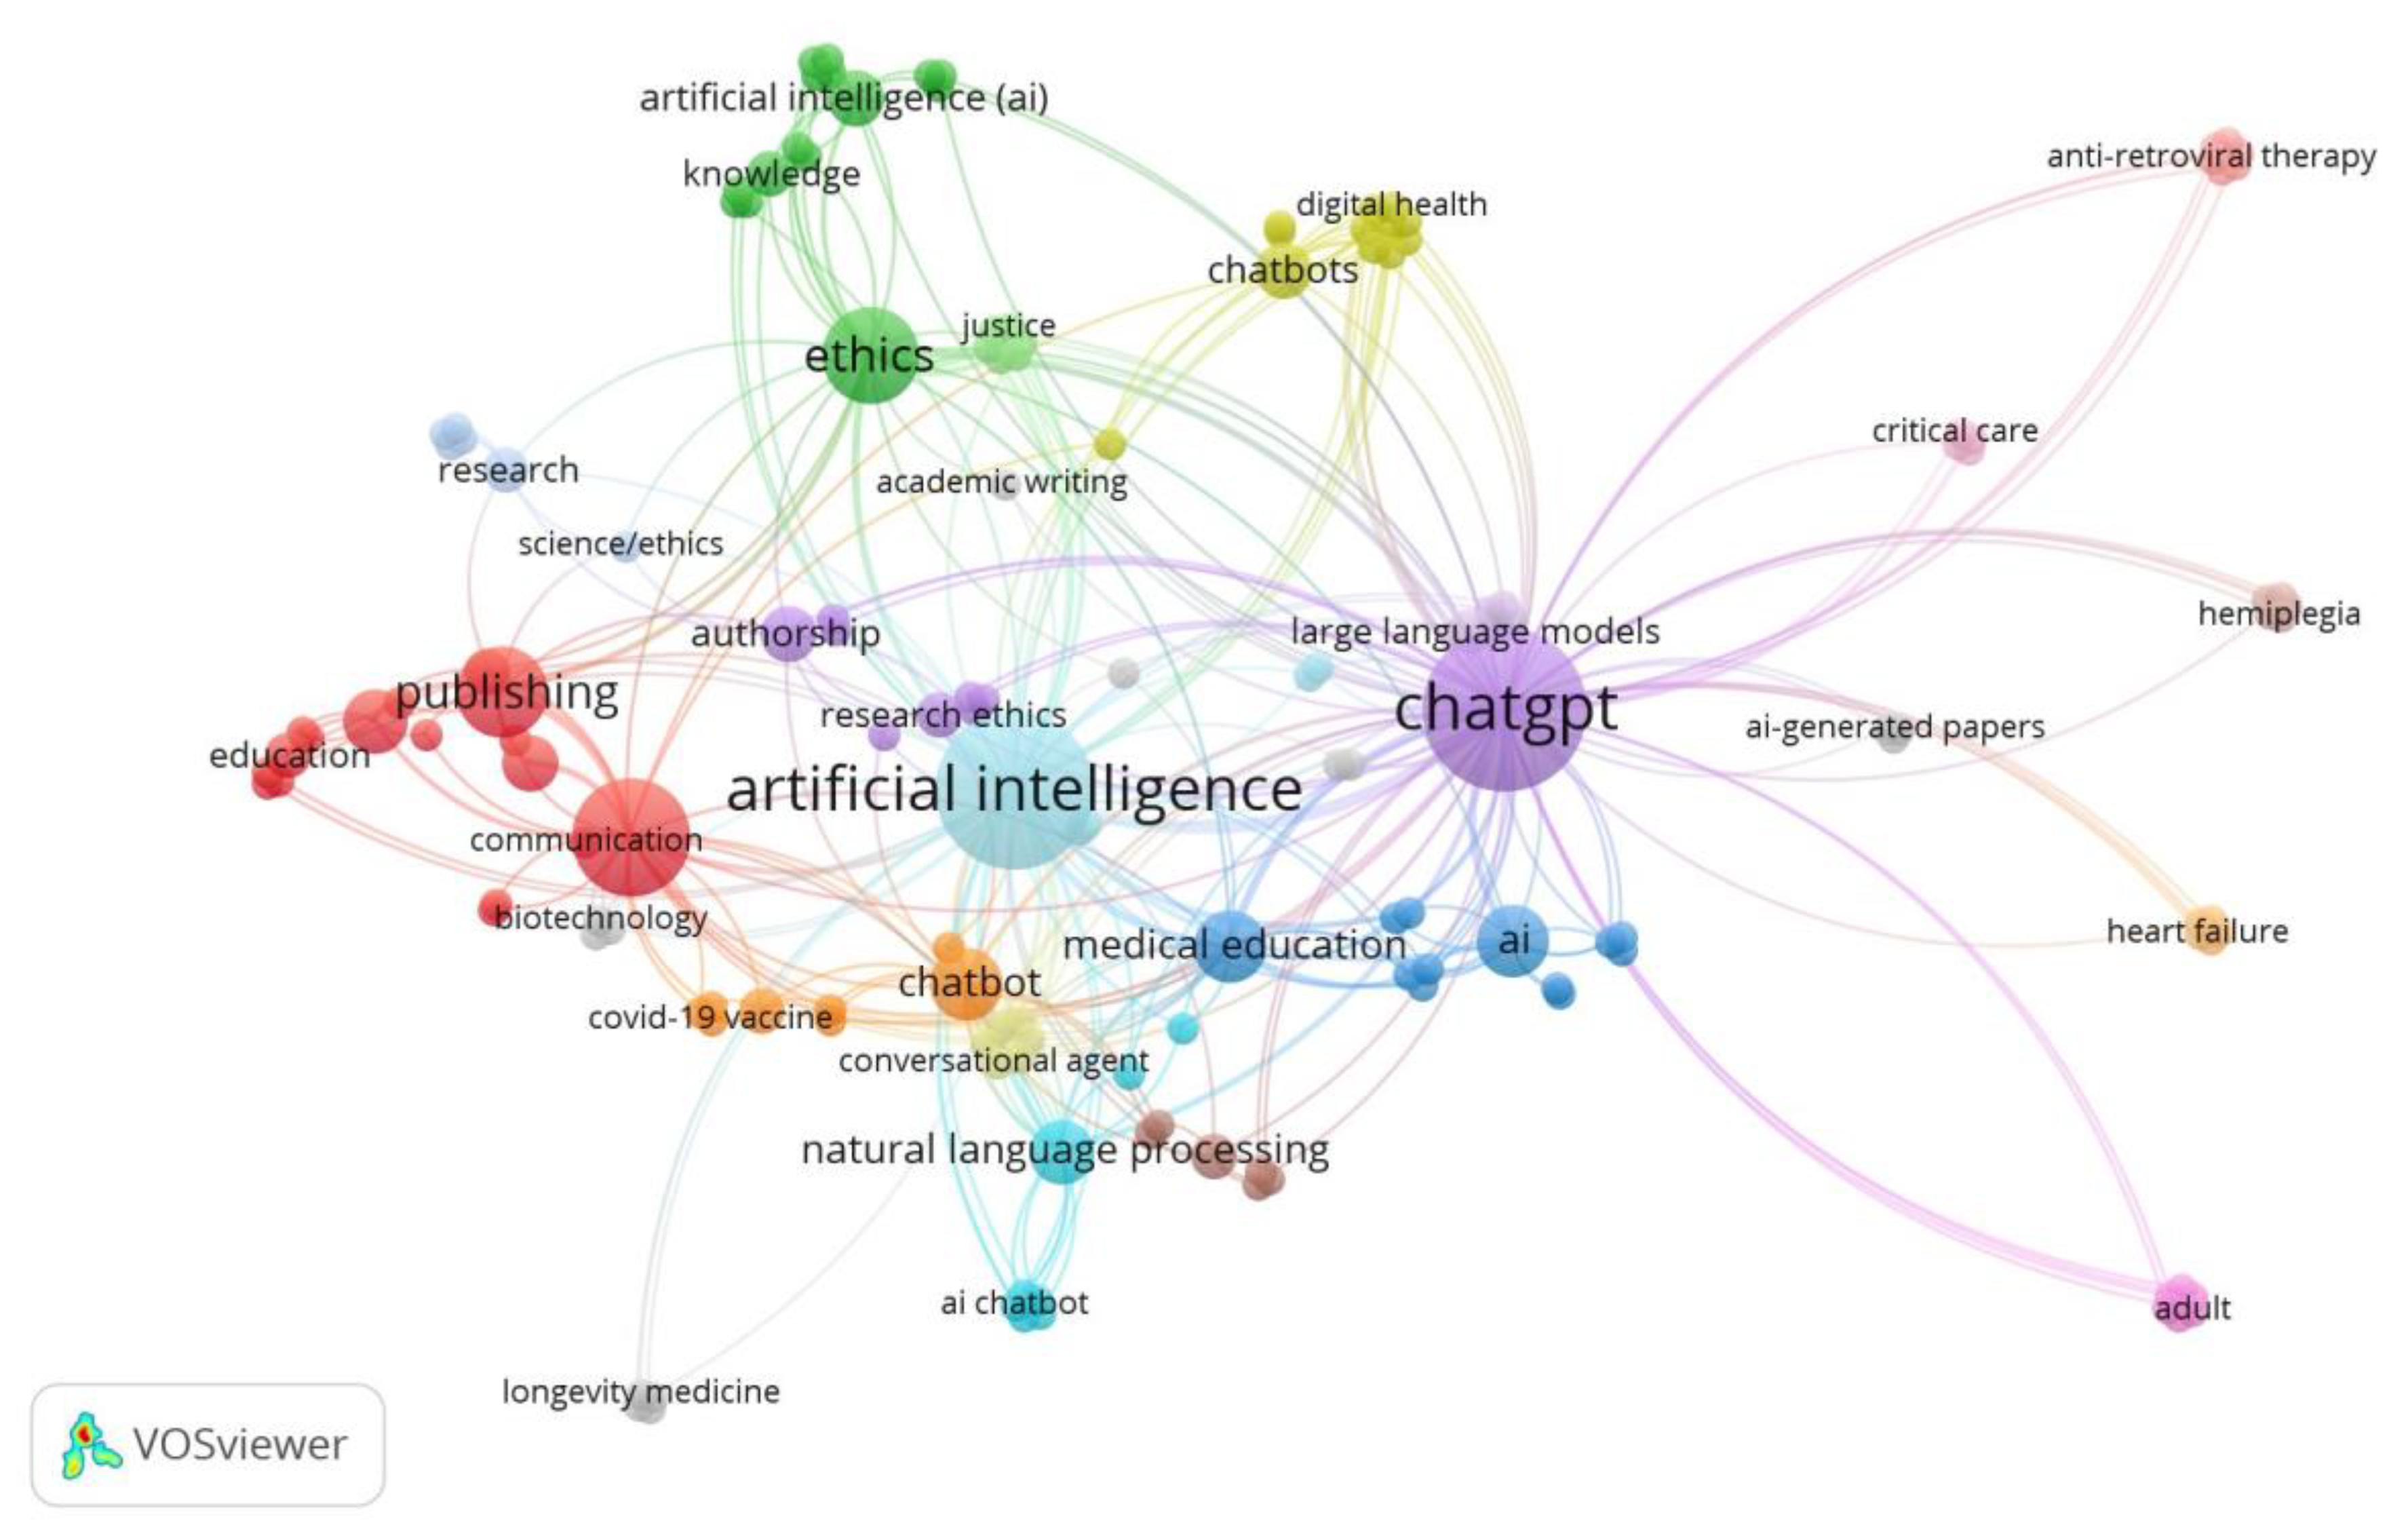
- Keyword Co-occurrence mapping (Figure 5) of author keywords shows that chatgpt, artificial intelligence and machine learning are the most use term followed by ethics, publishing, ai, chatbot, medical education etc.
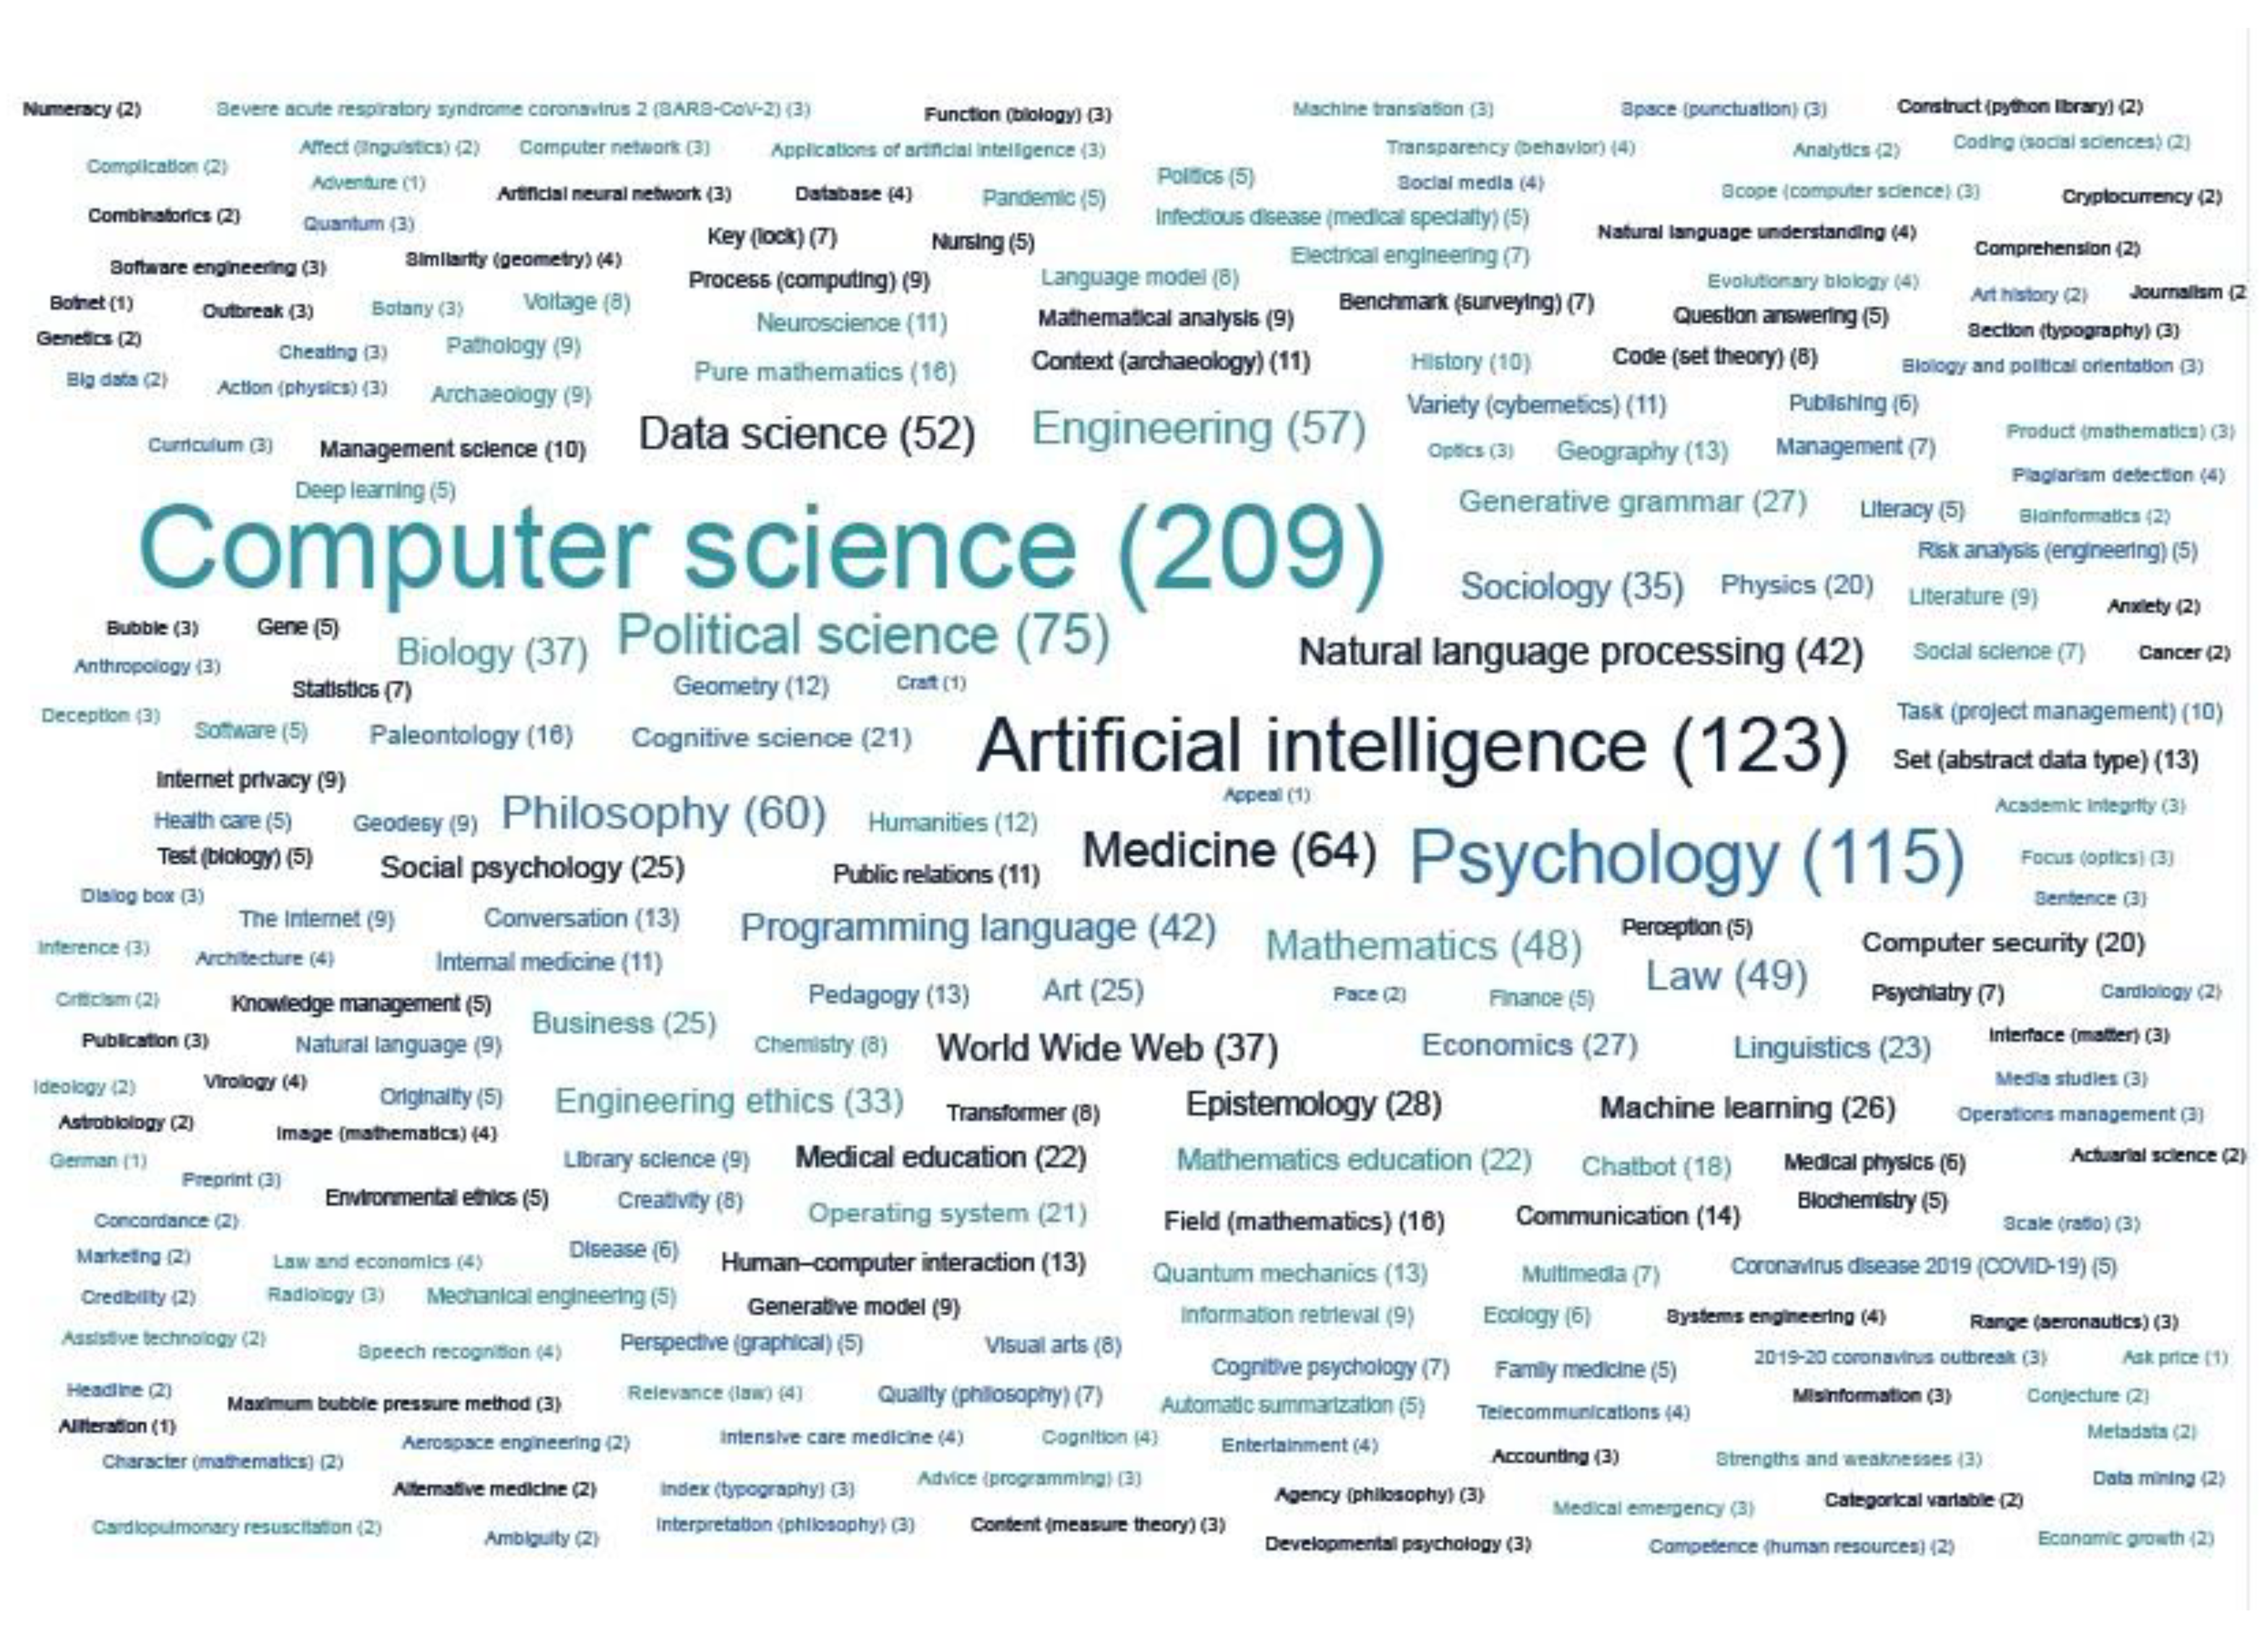
- Top research areas of ChatGPT shows that most papers are published under the field of computer science (209), followed by artificial intelligence (123) and psychology (115) respectively. In addition, many other topics are already being worked on with ChatGPT, as it can be easily seen from the word cloud (Figure 5) provided by the Lens database. From the subject trends, it is easy to say that the application of ChatGPT in various topics is currently being worked by the researcher globally and more research will be done on this topic in the future.
Conclusion
Appendix 1: Top 50 term co-occurrence of title and abstract
| term | occurrences | relevance score | Percentage |
| chatgpt | 1276 | 0.0381 | 18.47 |
| question | 215 | 0.2896 | 3.11 |
| study | 208 | 0.1293 | 3.01 |
| model | 188 | 0.1187 | 2.72 |
| use | 137 | 0.0585 | 1.98 |
| response | 128 | 0.3439 | 1.85 |
| artificial intelligence | 124 | 0.1263 | 1.80 |
| large language model | 116 | 0.0956 | 1.68 |
| tool | 116 | 0.1185 | 1.68 |
| text | 115 | 0.1253 | 1.66 |
| gpt | 111 | 0.4569 | 1.61 |
| research | 110 | 0.2952 | 1.59 |
| technology | 110 | 0.3435 | 1.59 |
| performance | 108 | 0.2939 | 1.56 |
| chatbot | 103 | 0.4858 | 1.49 |
| paper | 100 | 0.1604 | 1.45 |
| education | 97 | 0.6251 | 1.40 |
| llm | 88 | 0.1658 | 1.27 |
| application | 87 | 0.1891 | 1.26 |
| task | 85 | 0.1249 | 1.23 |
| information | 83 | 0.1857 | 1.20 |
| system | 83 | 0.5392 | 1.20 |
| review | 78 | 0.2389 | 1.13 |
| student | 77 | 0.1696 | 1.11 |
| data | 75 | 0.2729 | 1.09 |
| openai | 72 | 0.0973 | 1.04 |
| challenge | 71 | 0.1577 | 1.03 |
| content | 69 | 0.5895 | 1.00 |
| field | 67 | 0.25 | 0.97 |
| role | 67 | 0.2091 | 0.97 |
| article | 66 | 0.2202 | 0.96 |
| accuracy | 63 | 0.529 | 0.91 |
| capability | 62 | 0.1158 | 0.90 |
| language model | 61 | 0.0713 | 0.88 |
| user | 61 | 0.4332 | 0.88 |
| analysis | 60 | 0.0793 | 0.87 |
| limitation | 60 | 0.122 | 0.87 |
| answer | 59 | 0.2812 | 0.85 |
| implication | 59 | 0.1055 | 0.85 |
| approach | 58 | 0.3713 | 0.84 |
| ability | 57 | 0.0927 | 0.83 |
| patient | 57 | 0.6724 | 0.83 |
| issue | 54 | 0.3323 | 0.78 |
| knowledge | 54 | 0.1308 | 0.78 |
| science | 54 | 0.403 | 0.78 |
| dataset | 53 | 0.2038 | 0.77 |
| context | 52 | 0.2209 | 0.75 |
| author | 51 | 0.3966 | 0.74 |
| case | 51 | 0.4292 | 0.74 |
| topic | 51 | 0.1271 | 0.74 |
References
- Aparicio, G., Iturralde, T., & Maseda, A. (2019). Conceptual structure and perspectives on entrepreneurship education research: A bibliometric review. European research on management and business economics, 25(3), 105-113.
- Bondi, M. (2010). Perspectives on keywords and keyness. Keyness in texts, 1-20.
- Cech, F. (2017). Exploring emerging topics in social informatics: an online real-time tool for keyword co-occurrence analysis. In Social Informatics: 9th International Conference, SocInfo 2017, Oxford, UK, September 13-15, 2017, Proceedings, Part II 9 (pp. 527-536). Springer International Publishing.
- Ellegaard, O., & Wallin, J. A. (2015). The bibliometric analysis of scholarly production: How great is the impact?. Scientometrics, 105, 1809-1831.
- Farhat, F., Sohail, S. S., & Madsen, D. Ø. (2023) How Trustworthy is ChatGPT? The Case of Bibliometric Analyses. Preprints.org. [CrossRef]
- Hunston, S. (2007). Semantic prosody revisited. International journal of corpus linguistics, 12(2), 249-268.
- Jiang, Y., Ritchie, B. W., & Benckendorff, P. (2019). Bibliometric visualisation: An application in tourism crisis and disaster management research. Current Issues in Tourism, 22(16), 1925-1957.
- Kirtania, D. K. (2023). ChatGPT as a Tool for Bibliometrics Analysis: Interview with ChatGPT. Available at SSRN . Available online: https://papers.ssrn.com/sol3/papers.cfm?abstract_id=4391794.
- Lee, M. R., & Chen, T. T. (2012). Revealing research themes and trends in knowledge management: From 1995 to 2010. Knowledge-Based Systems, 28, 47-58.
- Liao, H., Tang, M., Luo, L., Li, C., Chiclana, F., & Zeng, X. J. (2018). A bibliometric analysis and visualization of medical big data research. Sustainability, 10(1), 166.
- Lozano, S., Calzada-Infante, L., Adenso-Díaz, B., & García, S. (2019). Complex network analysis of keywords co-occurrence in the recent efficiency analysis literature. Scientometrics, 120, 609-629.
- Najmi, A., Rashidi, T. H., Abbasi, A., & Travis Waller, S. (2017). Reviewing the transport domain: An evolutionary bibliometrics and network analysis. Scientometrics, 110, 843-865.
- Perianes-Rodriguez, A., Waltman, L., & Van Eck, N. J. (2016). Constructing bibliometric networks: A comparison between full and fractional counting. Journal of informetrics, 10(4), 1178-1195.
- Pradhan, P. (2017). Science mapping and visualization tools used in bibliometric & scientometric studies: An overview. Available online: https://ir.inflibnet.ac.in/bitstream/1944/2132/1/INFLIBNET%20NEWSLETTER%20Vol.23%20No.%204%20(October-%20December%202016).pdf.
- Radhakrishnan, S., Erbis, S., Isaacs, J. A., & Kamarthi, S. (2017). Novel keyword co-occurrence network-based methods to foster systematic reviews of scientific literature. PloS one, 12(3), e0172778.
- Reed, M. S., Ferre, M., Martin-Ortega, J., Blanche, R., Lawford-Rolfe, R., Dallimer, M., & Holden, J. (2021). Evaluating impact from research: A methodological framework. Research Policy, 50(4), 104147.
- Santoni, D., & Pourabbas, E. (2016). Automatic detection of words associations in texts based on joint distribution of words occurrences. Computational Intelligence, 32(4), 535-560.
- Scott, M., & Tribble, C. (2006). Textual patterns: Key words and corpus analysis in language education (Vol. 22). John Benjamins Publishing.
- Shasha, Z. T., Geng, Y., Sun, H. P., Musakwa, W., & Sun, L. (2020). Past, current, and future perspectives on eco-tourism: A bibliometric review between 2001 and 2018. Environmental Science and Pollution Research, 27, 23514-23528.
- Weerasekara, S., Lu, Z., Ozek, B., Isaacs, J., & Kamarthi, S. (2022). Trends in Adopting Industry 4.0 for Asset Life Cycle Management for Sustainability: A Keyword Co-Occurrence Network Review and Analysis. Sustainability, 14(19), 12233.
- Zhang, L., & Eichmann-Kalwara, N. (2019). Mapping the scholarly literature found in Scopus on “research data management”: A bibliometric and data visualization approach. Journal of Librarianship and Scholarly Communication, 7(1). [CrossRef]
Disclaimer/Publisher’s Note: The statements, opinions and data contained in all publications are solely those of the individual author(s) and contributor(s) and not of MDPI and/or the editor(s). MDPI and/or the editor(s) disclaim responsibility for any injury to people or property resulting from any ideas, methods, instructions or products referred to in the content. |
© 2023 by the author. Licensee MDPI, Basel, Switzerland. This article is an open access article distributed under the terms and conditions of the Creative Commons Attribution (CC BY) license (https://creativecommons.org/licenses/by/4.0/).


