
Submitted:
29 March 2023
Posted:
29 March 2023
You are already at the latest version
Abstract
Psychomotor developmental delay in infants includes failure to acquire abilities such as sitting, walking, grasping objects and communication at the ages when most infants have acquired these abilities. Known risk factors include a large number of aspects of family environment, socioeconomic position, problems in pregnancy and birth, and maternal health. It is clinically useful to be able to screen for developmental delay so that healthcare interventions can be considered. The present research used machine learning (random forest) to create an algorithm predicting psychomotor delay in 9-month-old infants using information ascertainable at birth and in early infancy. The dataset was the UK longitudinal Millennium Cohort study. Fifty-two predictors measuring socioeconomic indicators, paternal, family and social support for the mother, beliefs about good parenting, maternal health, pregnancy and birth were included in the initial algorithm. Feature reduction showed that of the 52 variables, birthweight, family income and parents’ ages had the highest feature importance scores and could alone correctly predict developmental delay with over 99% sensitivity and 100% specificity. The relationships between delay and some of the predictors, particularly income, were nonlinear and complex. The results suggest that the risk of psychomotor developmental delay can be identified in early infancy using machine learning, and that the best predictors are factors present prior to birth. Surprisingly, the most important factors included in the present study did not include illnesses during pregnancy such as eclampsia and infections.
Keywords:
Developmental milestones
; artificial intelligence
; classification algorithms
; infant growth
1. Introduction
Children’s progress in achieving developmental milestones in infancy and childhood is dependent on a large number of factors. These include growth in utero, size at birth, maternal health, socioeconomic position, genetically inherited developmental patterns, and many family and social factors [1,2,3,4,5,6,7,8,9,10,11,12,13,14,15,16,17]. This makes predicting developmental delay in advance so that steps can be taken to avoid it difficult, as there are so many potentially important causes and the relative importance of each is not clear. For an increasing number of health conditions with complex aetiologies, artificial intelligence (AI) has been successfully applied to identify when an individual is at high risk for a future adverse health outcome e.g., [18,19]. In the discipline of developmental psychology, the machine learning approach Random Forests (RF) has been applied to predict future psychiatric conditions [20] and to predict infant growth using inflammatory markers [21]. The present study applied RF to predict psychomotor developmental delay in 9-month-old infants using data on a wide array of factors in pregnancy, birth and early infancy. The intent was to achieve higher sensitivity and specificity than has been achieved in prior studies approaching similar problems using regression methods, which rarely have greater than 80% sensitivity [15].
Other than machine learning approaches, several statistical techniques are potentially appropriate for classification problems including predicting developmental delay. Van Dokkum et al. [15] used logistic regression to predict developmental delay at age four, producing an algorithm with 73% sensitivity and 80% specificity. Another promising linear modelling approach when there is a large number of predictor variables is principal component analysis (PCA). However, both statistical techniques assume linear relationships between values of the predictor variable and the outcome: PCA is based on linear transformation using orthogonal matrices, and logistic regression assumes that the log-odds of the relationship between each predictor and the outcome is linear. There is no reason to believe that predictors have linear associations with developmental delay: for example, birthweight has negative associations with developmental delay at both low and very high levels [15,22], and socioeconomic position may not be important for health outcomes above a threshold level [23]. For the present research, Random Forest (RF), which is an ensemble decision-tree classifier was chosen. RF can handle large numbers of predictors (features) simultaneously and does not assume linear or monotonous relationships between predictors and an outcome [24,25].
2. Methods
Population and sample
The UK Millennium cohort sample (henceforth MCS) consists of infants born in the United Kingdom from September 2000 to August 2001, identified using Universal Child Benefit records and NHS Health Visitors [26]. In the British healthcare system, Health Visitors are usually registered nurses who provide ante- and post-natal care and advice in the home. The sample was not a random sample: ethnic minority and low socio-economic groups were oversampled to compensate for loss to follow-up of these segments of the population that occurred in Britain’s earlier longitudinal cohort studies. Here, data were analysed using the first survey of the cohort, which took place when the infants were around 9 months old. The maximum possible sample size for analysis using this cohort is 18,467. A cohort profile is available providing far more detail about the sample and sampling methods [27].
Outcome variable
Developmental delay is typically identified in clinical settings using parental questionnaires. The 9-month MCS interview with parents or the main care giver included questions about infant psychomotor development which are very similar in content and format to the Ages and Stages 12-month questionnaire [26]. The aim in creating the dependent variable was to capture infant development across a number of cognitive and motor skill domains. Second, variation in reaching developmental milestones has the most practical or clinical significance if a statistical model is created to predict substantial delay versus the range of normal development. With these aims in mind, a dependent variable was created using parental or main caregiver reports of achievement of developmental milestones. The interview contained 12 questions on cognitive and motor skills development. Responses to the 12 questions were on three-point scales, coded as “1” for the infant frequently demonstrates the developmental milestone, “2” for sometimes, and “3” for the infant has not yet demonstrated the milestone. The 12 items were: sits up; smiles; stands up holding on, puts hands together; grabs objects; holds small objects; passes a toy; walks a few steps; gives toy; waves bye-bye, extends arms; nods for yes. The responses were summed into a single score, followed by splitting into a binary variable with the cut point at the fifth percentile.
Predictor variables (features)
The first MCS survey was broad in scope, covering aspects of pregnancy, labour, birth, and children’s and their parents’ social, work, and economic situations. Many of the variables included in the MCS have been demonstrated to be or could plausibly be associated with child development. Covariates were selected by reading through the MCS variable list and selecting all that appeared appropriate for analysis. The variable selection process is illustrated in Figure 1. Some additive combining of variables was performed where two or more variables were repeated information about a single concept. For example, paternal involvement in infant care was represented in the original data as questions about each individual act of care, such as nappy changing, getting up in the night, etc. These were additively combined to create a single variable. Of note, a decision was made to combine medical problems in pregnancy into a single variable. In descending order of their prevalence in the dataset the most common were: bleeding in pregnancy, eclampsia, hyperemesis, urinary tract infections, anaemia, and non-trivial infections. These were combined because conceptually they should all affect foetal nutrition, and because in initial testing of algorithms they performed poorly as predictors of developmental delay when included separately. Fifty-two variables were included in total. For ease of reading, variables were classified into groupings based on the concept that each represented: family & social support; socioeconomic indicators; infant characteristics; beliefs about parenting; medical circumstances in pregnancy and birth; maternal factors; and paternal and family factors. Supplementary material Table S1 includes details of variable coding, the MCS names and any changes made to the original MCS variables.
Data analysis
The MCS data were analysed using random forests (RF), a supervised machine learning decision tree algorithm easily implemented in statistical software such as Stata. In building each decision tree, the RF algorithm used half of the data (the training set), and with bootstrapping created sets of decision trees with the bootstrapped subsets of the data which comprise of a decision rule at each branch node. The remaining half of the data for each tree (the test set) was used to test how well the algorithm performed classifying observations correctly. Missing data occurred due to unanswered interview items on a small number of variables, particularly paternal support. The RF algorithm contained a proximity algorithm to handle missing observations for features. Observations with a missing value for the outcome variable were dropped from the analysis, and continuous predictors were transformed to z-scores.
All analyses were carried out in Stata 16. For the RF model, the plug-in Rforest was used [29]. Algorithm hypertuning of the number of variables included at each split and number of iterations were performed using Stata code developed by Schonlau and Zou [29]. A backward elimination wrapper method was applied to produce a reduced model which maximised number correctly classified using the fewest variables.
3. Results
Descriptive statistics
Descriptive statistics are displayed for all variables in Table 1, split into groups of variables as described above.
RF algorithms
The RF algorithm for all 52 predictors had an out of bag error rate of 0.0389. Hypertuned values for number of iterations and number of variables at each split were 25 and 14 respectively. Only 29 infants were classified incorrectly (0.16% of observations). The left side of Table 2 displays a classification table of correctly classified cases in the 52-predictor algorithm, and the right-side correct classification with the reduced model with the fewest incorrectly classified cases by exhaustive backwards selection. The reduced model was hypertuned to 80 iterations and 5 variables at each split. This algorithm incorrectly classified only 6 cases using five features: birthweight, the infant’s age in days at the time of the interview with the main caregiver, maternal and paternal ages, and equivalised income (McClement’s score, adjusted for household size and ages of children in the household). Out of bag error (oob) for this algorithm was 0.0393, or only marginally worse than for the 52-feature algorithm.
Figure 2 displays the variable importance plot for the 52-predictor RF algorithm. The variable with the highest feature importance score was birthweight, hence all of the importance scores are relative to the importance of birthweight for predicting being in the bottom 5% for development scores. It should be noted that the model did not include gestational age at birth, hence birthweight is almost certain to incorporate effects of premature delivery. This is desirable so that predictors are compared relative to a statistically (and clinically) very important variable. None of the variables had feature importance scores close to zero, meaning that all had some predictive utility in the RF algorithm.
Decision tree algorithms do not produce a statistic or parameter estimate showing the direction of association, as they are not linear models. To overcome this, two-way prediction plots are displayed for the reduced (5-variable) algorithm in Figure 3, and for all features in Supplementary material Figure S1. The plots shown are two-way prediction plots with either a Lowess smooth fit line, a quadratic fit line, or as a linear plot for binary predictors (whichever best described the observed relationship). The direction or shape of relationships between developmental delay and all predictors are described in writing in Figure 2.
4. Discussion
The RF machine learning approach allowed simultaneous analysis of a large number of maternal, paternal, social and health-related factors. The algorithm performed very well when applied to the test dataset, with sensitivity at the level of a good diagnostic medical test. The results were consistent with developmental delay having a complex aetiology: 45 variables had importance scores above 0.2. However, prediction measured as number of observations correctly classified by the algorithm was maximised using only five predictors, one of which was simply the infants exact age in days. The algorithm suggested that a typical developmentally delayed child is likely to have been born low birthweight to older parents. Household income had an important but nonlinear relationship with developmental delay. While low birthweight and socioeconomic position are well-established predictors of developmental delay, the importance of both maternal and paternal age was surprising. Maternal age has previously been found to have the opposite relationship to developmental delay to what was found here: there was a monotonic trend towards lower risk of delay beginning with the youngest mothers (see Figure 3). In prior research infants of teenage mothers had an increased risk of delay [13]. Prior research additionally highlighted the importance of maternal education [16,17]. Here, income had a higher importance score than maternal education.
Study limitations
A prospective longitudinal study design would be necessary to confirm algorithm performance in a clinical setting. Psychomotor delay in the MCS 9-month interview was measured using fewer items than are typically found in established scales such as Age and Stages. In addition, Ages and Stages and similar scales identify more infants as showing delay than the bottom 5% analysed in the current study. The same data quality issue applies more generally to most of the concepts in this analysis: national cohort study data allows for large analysis sample sizes and the potential for high statistical power, but this comes at a cost to the level of detail gathered about each concept: for example, family support variables were from interview rather than methods which directly measure social support. Methods that directly measure or change social support would be preferable.
Conclusion
RF can be easily implemented in statistical software such as Stata, as well as in open source software such as BlueSky Statistics. It is preferable to regression when there is a large number of potentially important predictors of an outcome. A disadvantage is that other than producing sensitivity and specificity values, the underlying concepts and results interpretation are not familiar to the majority of medical and social science researchers. The results of the RF modelling here showed remarkably high sensitivity and specificity which were far in excess of existing regression-based algorithms predicting developmental delay [15]. The features with the highest importance scores: birthweight, household income, maternal and paternal ages and duration of labour can all be discerned at birth. This implies that screening for developmental delay can be successfully implemented in the neonatal period. Features representing early infant environment and parenting all had lower importance scores. Maternal health problems during pregnancy, including eclampsia, bleeding and non-trivial infections also had lower importance scores than expected.
Supplementary Materials
Figure S1. Two way plots showing the direction of effect between each predictor in the full RF model and developmental delay. Lines are Lowess, quadratic or linear, depending on which best visually summarises the observed relationship. Table S1. Variable names and transformations from the original MCS codes or names.
Funding
This research received no specific grant from any funding agency in the public, commercial or not-for-profit sectors.
Ethics Statement
Detailed information on ethical approval can be accessed here: https://cls.ucl.ac.uk/wp-content/uploads/2017/07/MCS-Ethical-review-and-consent-Shepherd-P-November-2012.pdf
Data Sharing Statement
The data used in this study are available free of charge via the UK Data Service. https://beta.ukdataservice.ac.uk/datacatalogue/studies/#!?Search=&Rows=10&Sort=0&DataTypeFacet=Cohort%20and%20longitudinal%20studies&Page=1&DateFrom=440&DateTo=2022 (accessed on 15 January 2021).
Conflicts of Interest
There were no competing interests associated with this manuscript.
References
- Sadruddin, A.F.; Ponguta, L.A.; Zonderman, A.L.; Wiley, K.S.; Grimshaw, A.; Panter-Brick, C. How do grandparents influence child health and development? A systematic review. Social Science & Medicine 2019, 112476. [CrossRef]
- Erel, O.; Oberman, Y.; Yirmiya, N. Maternal versus nonmaternal care and seven domains of children’s development. Psychological Bulletin 2000, 126(5), 727–747. [CrossRef]
- Crnic, K.A.; Greenberg, M.T.; Ragozin, A.S.; Robinson, N.M.; Basham, R.B. Effects of Stress and Social Support on Mothers and Premature and Full-Term Infants. Child Development 1983, 54(1), 209. [CrossRef]
- Shaver, J.H.; Power, E.A.; Purzycki, B.G.; Watts, J.; Sear, R; Shenk, M.K.; Sosis, R.; Bulbulia, J.A. Church attendance and alloparenting: an analysis of fertility, social support and child development among English mothers. Philosophical Transactons of the Royal Society B. 2020, 375, 20190428. [CrossRef]
- Sacker, A.; Quigley, M.A.; Kelly, Y.J. Breastfeeding and Developmental Delay: Findings From the Millennium Cohort Study. Pediatrics 2006, 118(3), e682–e689. [CrossRef]
- Chiu, W.C.; Liao, H.F.; Chang, P.J.; Chen, P.C.; Chen, Y.C. Duration of breast feeding and risk of developmental delay in Taiwanese children: a nationwide birth cohort study. Paediatric and Perinatal Epidemiology 2011, 25: 519–527.
- Belsky, J. Early child care and early child development: Major findings of the NICHD study of early child care. European Journal of Developmental Psychology 2006, 3(1), 95–110. [CrossRef]
- Waynforth, D. Effects of Conception Using Assisted Reproductive Technologies on Infant Health and Development: An Evolutionary Perspective and Analysis Using UK Millennium Cohort Data. Yale Journal of Biology & Medicine 2018, 91, 225–235.
- Brown, M.A.; McIntyre, L.L.; Crnic, K.A.; Baker, B.L.; Blacher, J. Preschool Children With and Without Developmental Delay: Risk, Parenting, and Child Demandingness. Journal of Mental Health Research in Intellectual Disabilities 2011, 4(3), 206–226. [CrossRef]
- Conde-Agudelo, A.; Castaño, F.; Norton, M.H.; Rosas-Bermudez, A. Effects of Birth Spacing on Maternal, Perinatal, Infant, and Child Health: A Systematic Review of Causal Mechanisms Studies in Family Planning 2012, 43, 93–114. [CrossRef]
- McIntire, D.D.; Bloom, S.L.; Leveno, K.; Casey, B.M. Birth Weight in Relation to Morbidity and Mortality among Newborn Infants. New England Journal of Medicine 1999, 340, 1234–1238. [CrossRef]
- Ketterlinus, R.D.; Henderson, S.H.; Lamb, M.E. Maternal age, sociodemographics, prenatal health and behavior: Influences on neonatal risk status. Journal of Adolescent Health & Care 1990, 11, 423–431. [CrossRef]
- Ozkan, M.; Senel, S.; Arslan, E.A. et al. The socioeconomic and biological risk factors for developmental delay in early childhood. Eur J Pediatr. 2012, 171, 1815–1821. [CrossRef]
- Liu, X.; Sun, Z.; Neiderhiser, J. M.; Uchiyama, M.; Okawa, M. Low birth weight, developmental milestones, and behavioral problems in Chinese children and adolescents. Psychiatry Research 2001, 101(2), 115–129. [CrossRef]
- Van Dokkum, N.H.; Reijneveld, S.A.; Heymans, M.W.; Bos, A.F.; de Kroon, M.L.A. Development of a Prediction Model to Identify Children at Risk of Future Developmental Delay at Age 4 in a Population-Based Setting. International Journal of Environmental Research and Public Health 2020, 17(22), 8341. [CrossRef]
- Abubakar, A.; Holding, P.; Van de Vijver, F.J.R.; Newton, C.; van Baar, A. Children at risk for developmental delay can be recognised by stunting, being underweight, ill health, little maternal schooling or high gravidity. Journal of Child Psychology and Psychiatry 2009, 51(6), 652–659. [CrossRef]
- Najman, J.M.; Bor, W.; Morrison, J.; Andersen, M.; Williams, G. Child developmental delay and socio-economic disadvantage in Australia: A longitudinal study. Social Science & Medicine 1992, 34(8), 829–835. [CrossRef]
- Myszczynska, M.A.; Ojamies, P.N.; Lacoste, A.M.B. et al. Applications of machine learning to diagnosis and treatment of neurodegenerative diseases. Nature Reviews: Neurology 2020, 16, 440–456. [CrossRef]
- Goecks, J.; Jalili, V.; Heiser, L.M.; Gray, J.W. How Machine Learning Will Transform Biomedicine, Cell 2020, 181, 92-101. [CrossRef]
- Usta, M.B.; Karabekiroglu, K,; Say, G.N.; Gumus, Y.Y.; Aydın, M.; Sahin, B.; Bozkurt, A.; Karaosman. A.A.; Cobanoglu, C.; Kurt, D.A.; Kesim, N.; Sahin I. Can We Predict Psychiatric Disorders at the Adolescence Period in Toddlers? A Machine Learning Approach. Psychiatry and Behavioral Sciences 2020,10(1):7-12. [CrossRef]
- Harrison, E.; Syed, S.; Ehsan, L. et al. Machine learning model demonstrates stunting at birth and systemic inflammatory biomarkers as predictors of subsequent infant growth – a four-year prospective study. BMC Pediatrics 2020, 20, 498. [CrossRef]
- Vora, N.; Bianchi, D.W. Genetic considerations in the prenatal diagnosis of overgrowth syndromes. Prenatal. Diagnosis 2009, 29: 923-929. [CrossRef]
- Patel, M.; Waynforth, D. Influences of zero hour contracts and disability–Analysis of the 1970 British Cohort study. SSM-Population Health 2022, Jul 31:101182.
- Grömping, U. Variable Importance Assessment in Regression: Linear Regression versus Random Forest. The American Statistician 2009, 63(4), 308-319. [CrossRef]
- Breiman, L. Random Forests. Machine Learning 2001, 45, 5–32.
- Ketende, S.; Jones, E. User Guide to Analysing MCS Data using Stata. 2011. London, Centre for Longitudinal Studies.
- Connelly, R.; Platt, L. Cohort Profile: UK Millennium Cohort Study: MCS. International Journal of Epidemiology 2014, 43, 1719–1725.
- Bricker, D.; Squires, J.; Mounts, L.; Potter, L.; Nickel, R; Twombly, E.; Farrell, J. Ages and stages questionnaire. Baltimore, MD: Paul H. Brookes. 1999.
- Schonlau, M.; Zou, R.Y. The Random Forest Algorithm for Statistical Learning., The Stata Journal 2020, 20, 3-29.
Figure 1.
Variable selection procedure for RF algorithm.
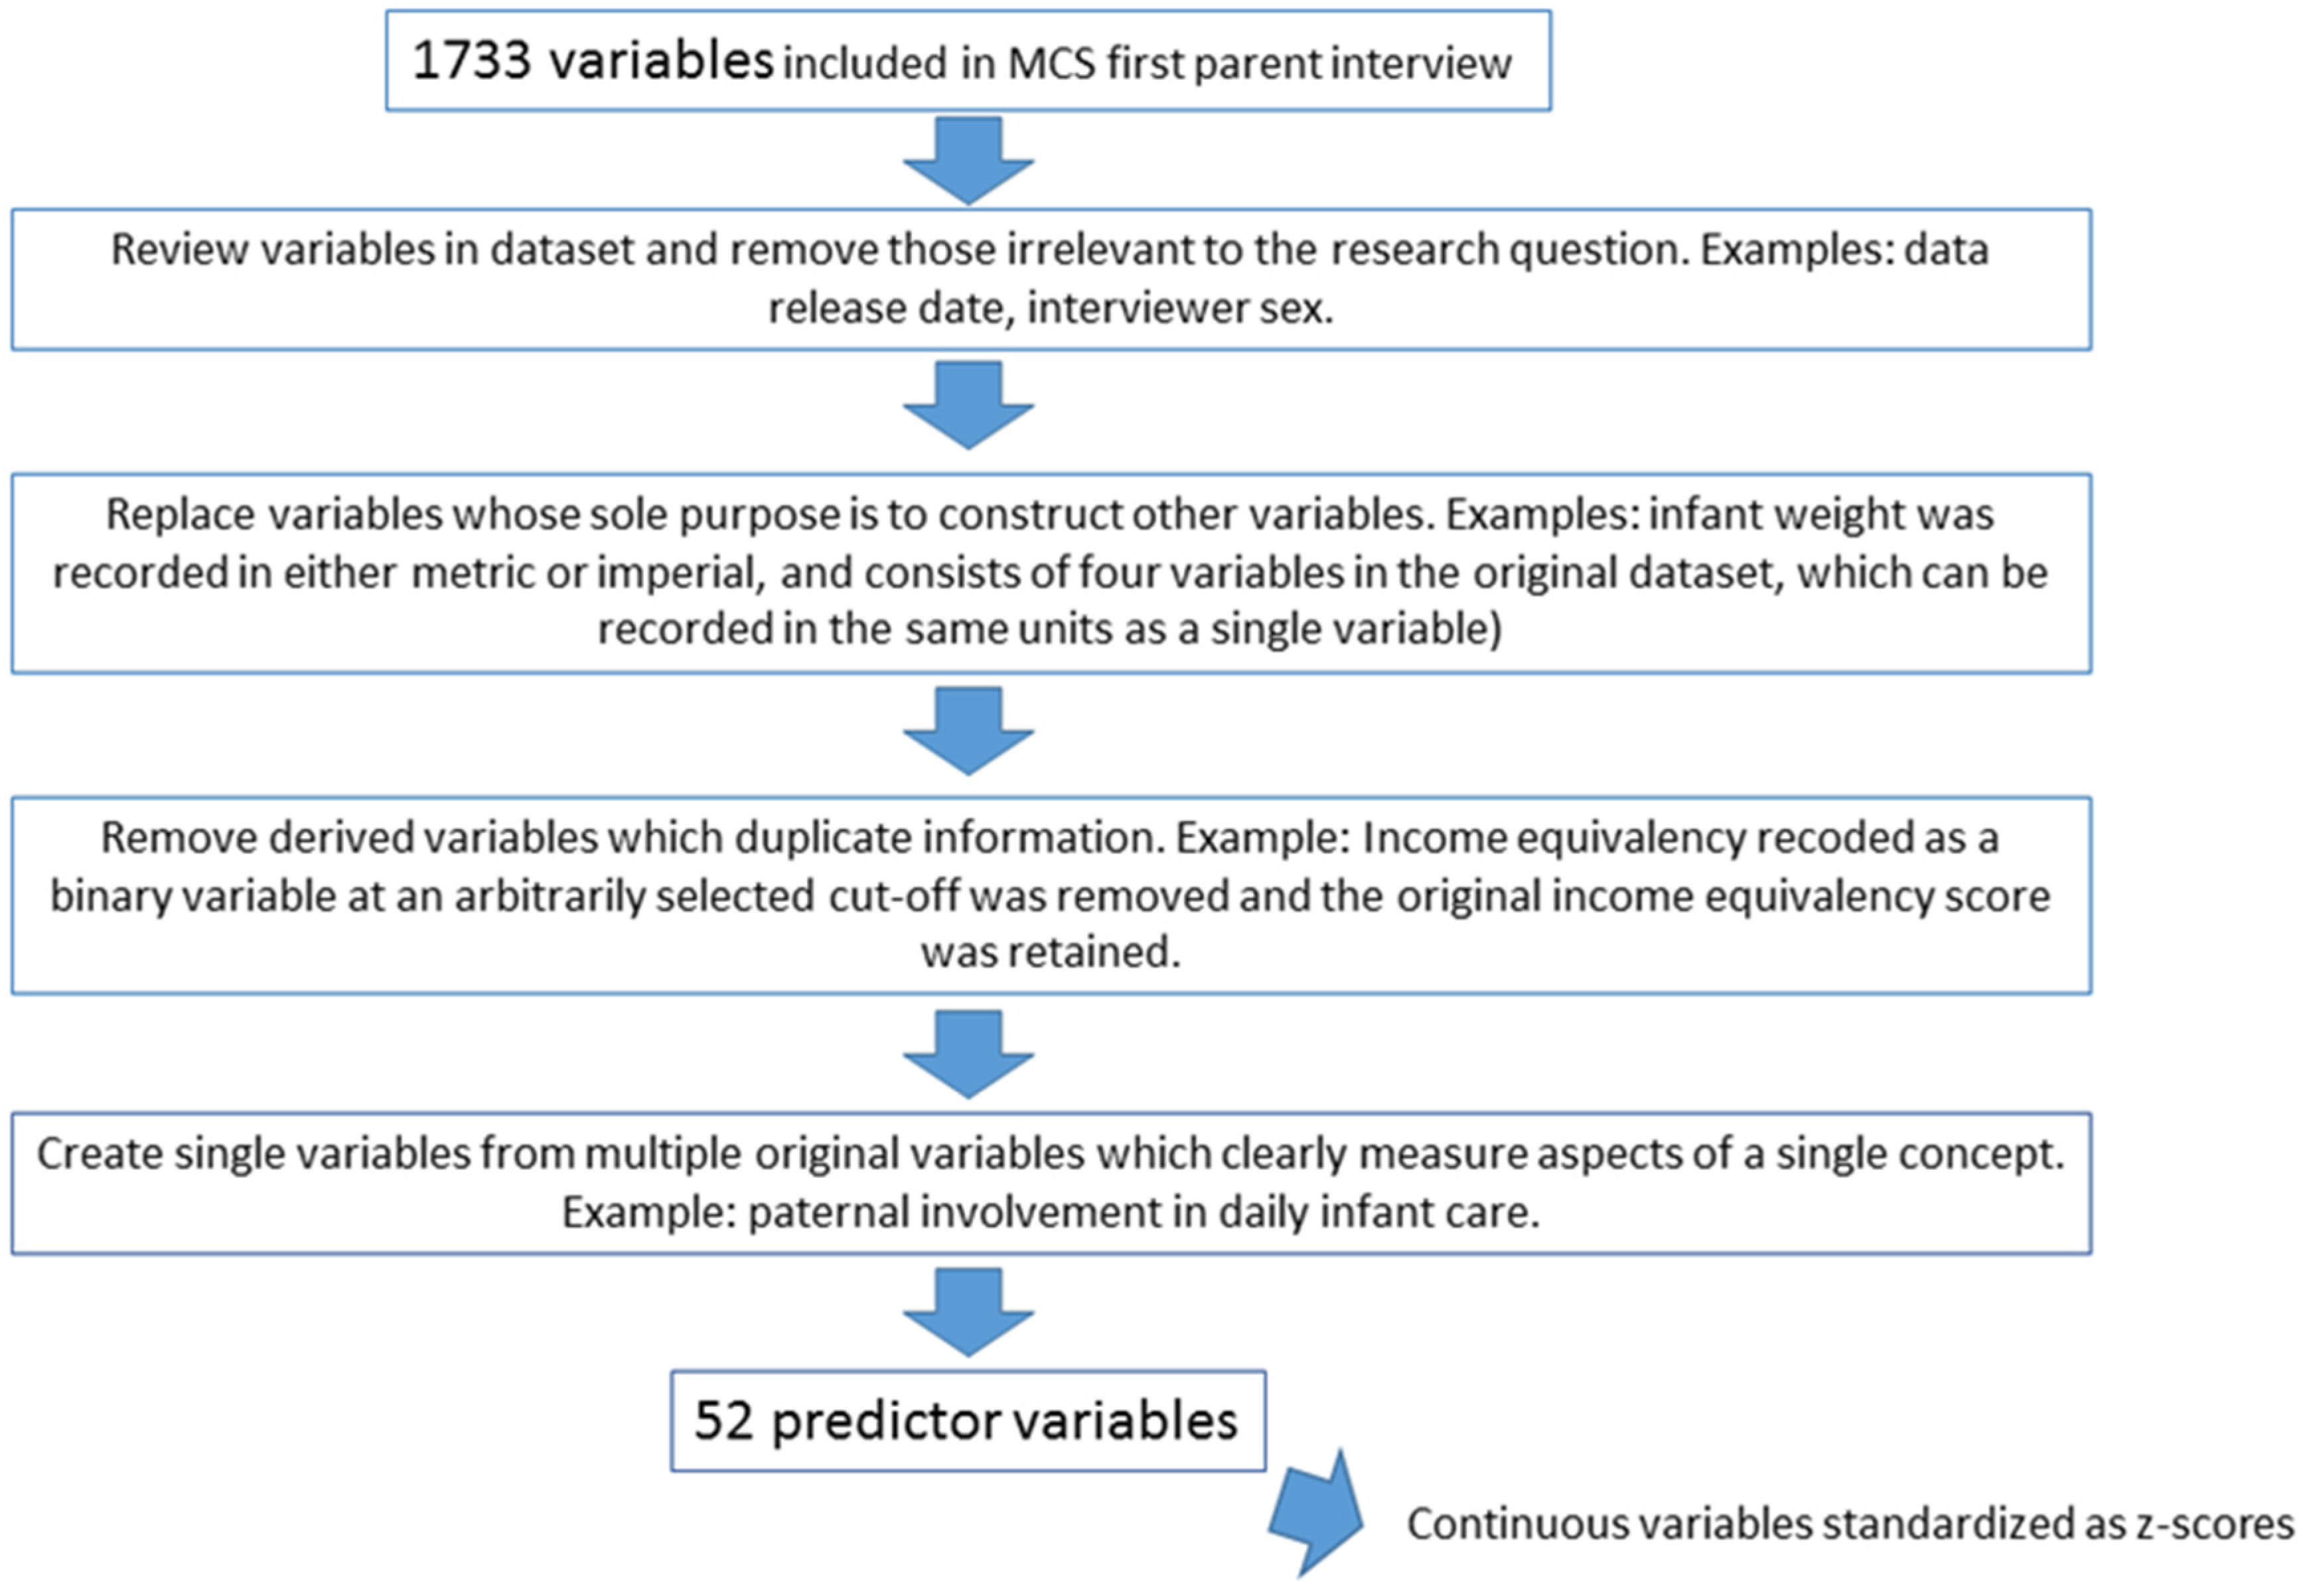
Figure 2.
Importance plot using the feature importance scores from the 52-feature RF algorithm. Red bars = family and social support variables; green = socioeconomic indicators; dark blue = infant characteristics; light blue = beliefs about parenting; purple = medical factors in pregnancy and birth; yellow = maternal factors; orange = paternal and family factors.
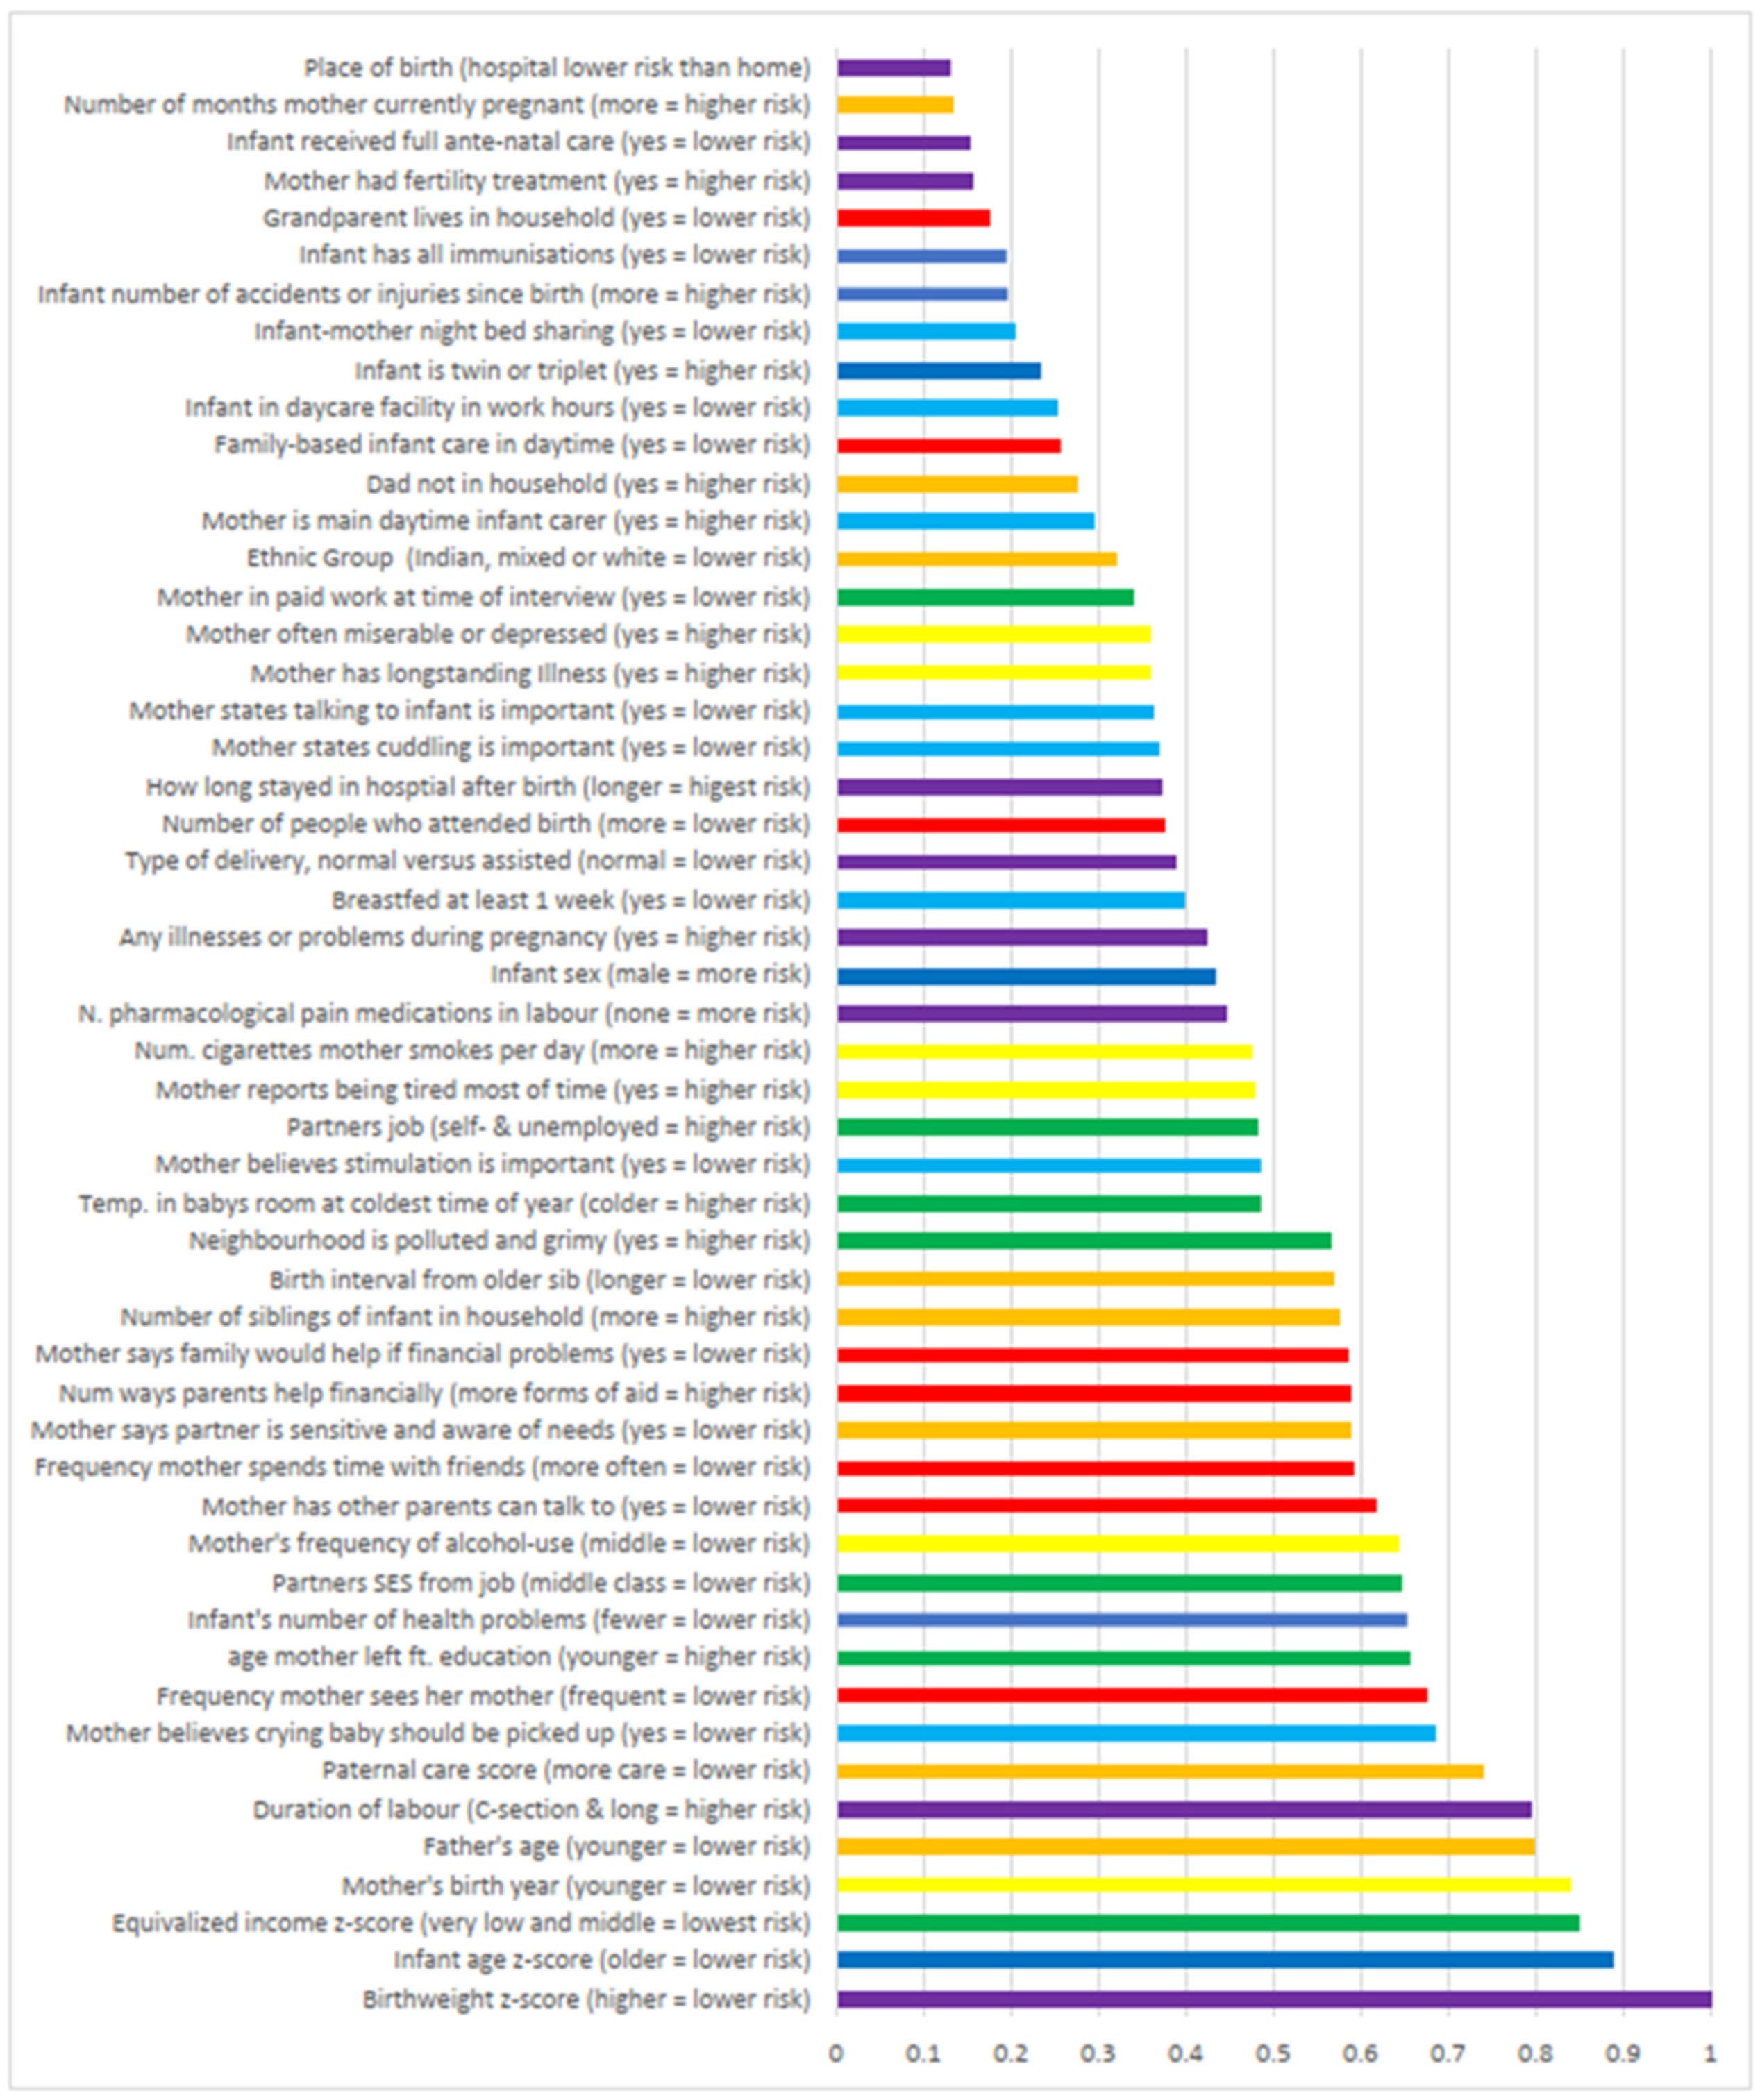
Figure 3.
Two-way prediction plots displaying the shapes of the associations between the features with the highest importance scores (other than the infant’s age) and psychomotor delay.
Figure 3.
Two-way prediction plots displaying the shapes of the associations between the features with the highest importance scores (other than the infant’s age) and psychomotor delay.
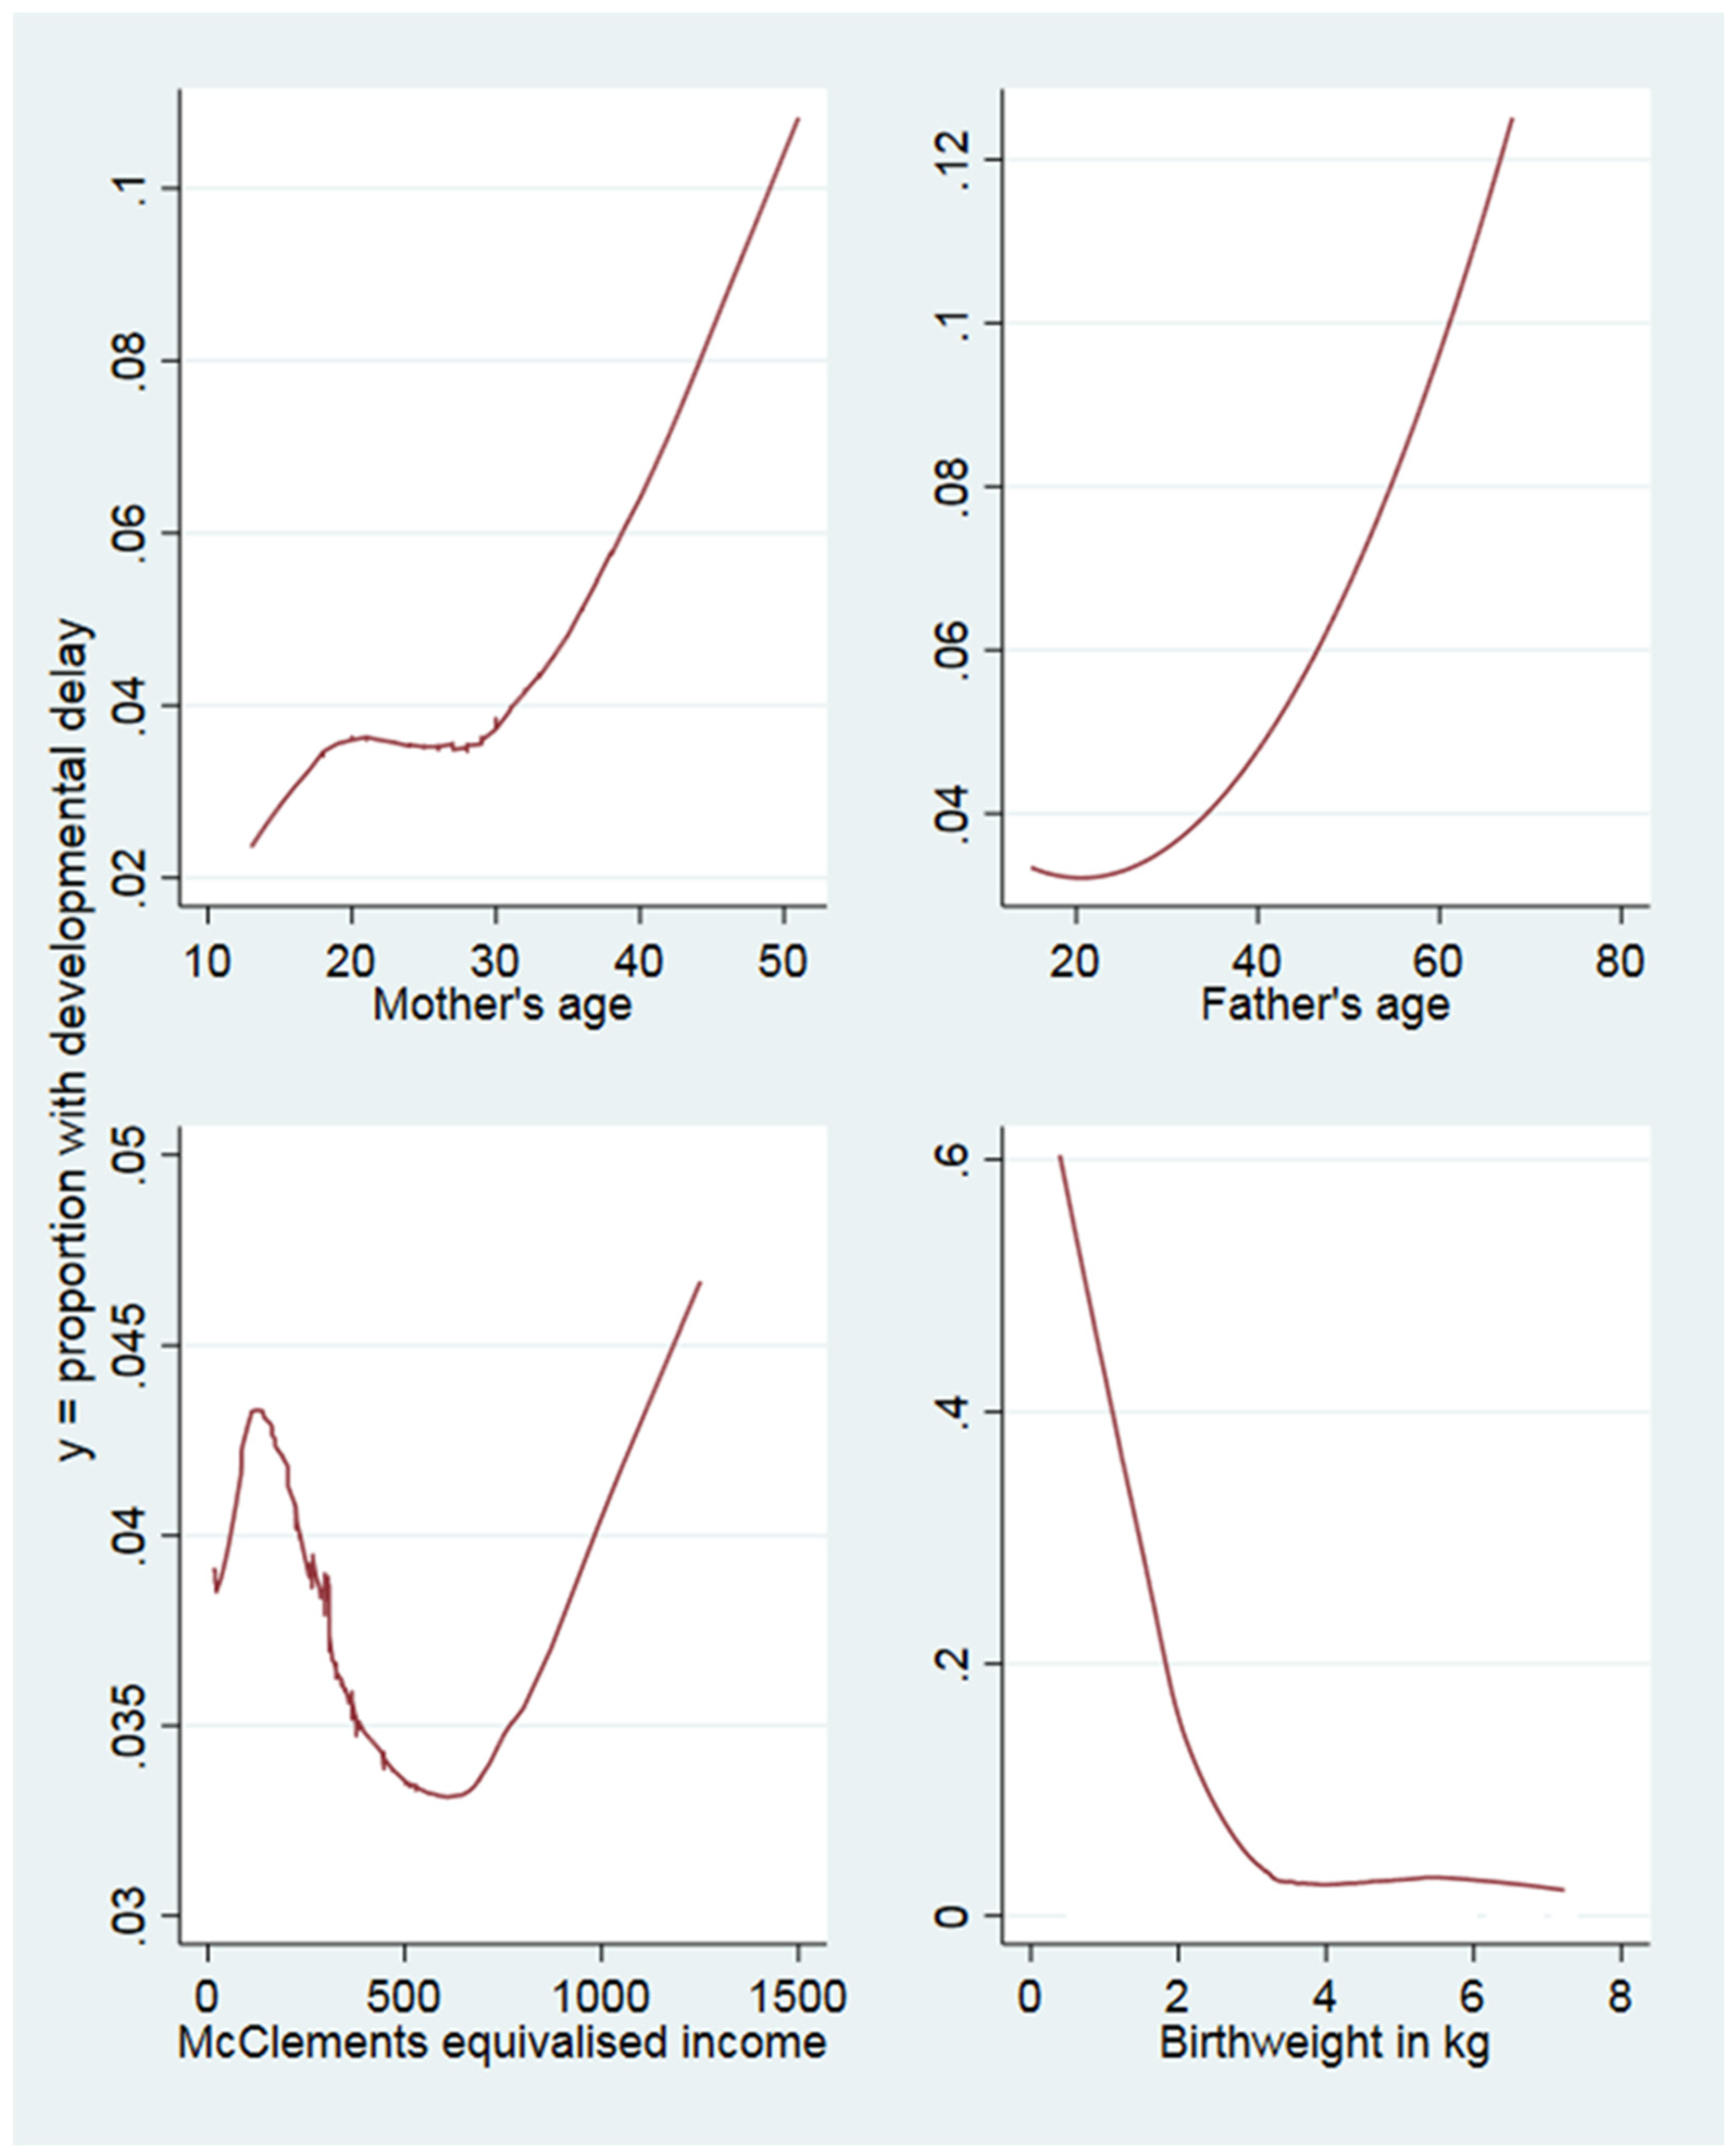

Table 1.
Variable coding and descriptive statistics. All variables are from maternal or main care provider interviews.
Table 1.
Variable coding and descriptive statistics. All variables are from maternal or main care provider interviews.
| Variable | Coding | Obs | Mean (Std.Dev.) | Min-Max | ||||
| Outcome and its constituent child development measures | ||||||||
| Development below fifth percentile | Above 5th percentile =0, below =1 | 18432 | .039 (.193) | 0-1 | ||||
| Smiles | 1=often, 2=sometimes, 3=not yet | 18432 | 1.006 (.082) | 1-3 | ||||
| Sits up | 18432 | 1.066 (.318) | 1-3 | |||||
| Stands up holding on | 18432 | 1.475 (.78) | 1-3 | |||||
| Puts hands together | 18432 | 1.209 (.532) | 1-3 | |||||
| Grabs objects | 18432 | 1.01 (.117) | 1-3 | |||||
| Holds small objects | 18432 | 1.147 (.454) | 1-3 | |||||
| Passes a toy | 18432 | 1.065 (.295) | 1-3 | |||||
| Walks a few steps | 18432 | 2.81 (.519) | 1-3 | |||||
| Gives a toy | 18432 | 1.52 (.717) | 1-3 | |||||
| Waves bye-bye | 18432 | 1.912 (.839) | 1-3 | |||||
| Extends arms | 18432 | 1.205 (.499) | 1-3 | |||||
| Nods for yes | 18432 | 2.72 (.617) | 1-3 | |||||
| Family & social support | ||||||||
| Frequency mother sees her mother | 0=lives with mother, 1=every day, to 8=never | 18544 | 3.277 (2.352) | 0-8 | ||||
| Mother has other parents to talk to | 1=most, to 5=least | 17805 | 2.096 (1.016) | 1-5 | ||||
| Family would help if financial problems | Strongly agree=1 to strongly disagree=5 | 17803 | 1.747 (.971) | 1-5 | ||||
| Number of types of financial help from grandparents | Gifts, money for daycare, essentials, trust funds, household items, other | 18547 | 1.235 (1.057) | 0-6 | ||||
| Frequency mother reports spending time with friends | 1=every day, to 5=never or no friends | 18527 | 2.958 (.974) | 1-5 | ||||
| Number of people who attended birth | 18432 | 1.12 (.495) | 0-4 | |||||
| Family-based infant care in work hours | 1=no, 2=yes | 18387 | 1.17 (.375) | 1-2 | ||||
| Grandparent lives in household | 1=yes, 2=no | 18432 | 1.921 (.269) | 1-2 | ||||
| Socioeconomic indicators | ||||||||
| Equivalised household income | McClement’s equivalised income | 18432 | 296.833 (217.102) | 14.31-1250.78 | ||||
| Age mother left full time education | 18341 | 17.578 (2.848) | 5-36 | |||||
| Partner’s SES from job | NS-SEC 7 classes, 1=highest, 7=lowest, 8=not in work | 18432 | 5.352 (2.641) | 1-8 | ||||
| Partner’s employment status | 1=employed, 2=self-employed, 3=looking for work, 4=not seeking work due to health, 5=New Deal/ apprenticeship, 6=student, 7=no partner/unknown | 18432 | 3.388 (3.084) | 1-8 | ||||
| Mother employed | Mother in paid work at 9 month interview=1, else=2 | 18399 | 1.448 (.497) | 1-2 | ||||
| Winter temperature in room where baby sleeps | 5-point scale where 1 = warmest and 5 = cold | 18310 | 2.301 (.745) | 1-5 | ||||
| Mother’s report of pollution & grime in neighbourhood | Reported on a 4-point scale, 1 = most, to 4 = least pollution | 18218 | 3.089 (.892) | 1-4 | ||||
| Infant characteristics | ||||||||
| Infant’s sex | 1=male, 2=female | 18432 | 1.487 (.5) | 1-2 | ||||
| Infant has all immunisations | 1=yes, 2=no | 18175 | 1.039 (.194) | 1-2 | ||||
| Infant’s age in days when mother was interviewed | 18432 | 295.487 (15.23) | 243-382 | |||||
| Infant’s number of reported illness | 18422 | 1.633 (1.992) | 0-50 | |||||
| Infant’s number of accidents | 18430 | .083 (.296) | 0-5 | |||||
| Beliefs about parenting & parenting practices | ||||||||
| Beliefs: Baby should be picked up when cries | 1=strongly agree, to 5=strongly disagree | 17810 | 2.966 (1.045) | 1-5 | ||||
| Beliefs: Stimulation is important for infant development | 1=strongly agree, to 5=strongly disagree | 17806 | 1.431 (.626) | 1-5 | ||||
| Beliefs: Talking to infants is important | 1=strongly agree, to 5=strongly disagree | 17814 | 1.200 (.448) | 1-5 | ||||
| Beliefs: cuddling infants is important | 1=strongly agree, to 5=strongly disagree | 17815 | 1.191 (.452) | 1-5 | ||||
| Bed co-sleeping main sleeping arrangement in first 9 months | 1=no, 2=yes | 18431 | 1.089 (.285) | 1-2 | ||||
| Breastfed at least 1 week | 1=no, 2=yes | 18431 | 1.536 (.499) | 1-2 | ||||
| Work hours infant care is daycare centre | 1=no, 2=yes | 18432 | 1.115 (.319) | 1-2 | ||||
| Main work hours infant care is mother | 1=no, 2=yes | 18432 | 1.691 (.462) | 1-2 | ||||
| Variable | Coding | Obs | Mean (Std.Dev.) | Min-Max | ||||
| Factors in pregnancy & birth | ||||||||
| Birthweight (kg) | 18382 | 3.344 (.589) | .39-7.23 | |||||
| Number of pharmacological pain interventions in labour | 18293 | .731 (.667) | 0-4 | |||||
| Infant conceived using fertility treatment | 1=no, 2=yes | 18425 | 1.974 (.159) | 1-2 | ||||
| Duration of labour | In hours, C-section=0 | 17680 | 9.160 (11.145) | 0-100 | ||||
| Type of delivery | 1=normal, C-section & emergency=2 | 18398 | 1.313 (.464) | 1-2 | ||||
| Singleton birth | 1=singleton, 2=twin, 3=triplet | 18432 | 1.014 (.123) | 1-3 | ||||
| Pregnancy illnesses (e.g., preeclampsia) | 1=yes, 2=no | 18396 | 1.623 (.485) | 1-2 | ||||
| Place of birth | Hospital=1, else 2 | 18401 | 1.020 (.142) | 1-2 | ||||
| How long mother and infant stayed in hospital after birth | 1=weeks, 2=days, 3=hours | 18020 | 2.046 (.421) | 1-3 | ||||
| Received full ante-natal care | 1=yes, 2=no | 18391 | 1.038 (.192) | 1-2 | ||||
| Maternal factors | ||||||||
| Mother’s birth year | 18426 | 1972 (5.95) | 1949-1987 | |||||
| Mother reports being tired all the time | 1=yes, 2=no | 17805 | 1.509 (.5) | 1-2 | ||||
| Mother reports being depressed | 1=yes, 2=no | 17802 | 1.849 (.358) | 1-2 | ||||
| Average number of cigarettes mother smokes per day | 18420 | 3.315 (6.271) | 0-60 | |||||
| Frequency mother drinks alcohol | Every day=1 to never=7 | 18429 | 5.134 (1.49) | 1-7 | ||||
| Mother has longstanding illness | 1=yes, 2=no | 18425 | 1.789 (.408) | 1-2 | ||||
| Number of months pregnant at interview | 18423 | .196 (1.013) | 0-10 | |||||
| Paternal & family factors | ||||||||
| Ethnicity | 1=white, 2=mixed, 3=India, 4=Pakistani, 5=Bangladeshi, 6=Caribbean, 7=African, 8=East Asian & others | 18402 | 1.627 (1.609) | 1-8 | ||||
| Father present in household | 0=yes, 1=no | 18403 | .172 (.378) | 0-1 | ||||
| Father’s age when infant was born | 18395 | 31.91 (5.713) | 15-68 | |||||
| Paternal involvement score: how much help father is | Summed score of how often father does: general childcare, feeding, getting up in night, changing nappies. 1=least, to 21=most | 16255 | 10.205 (5.868) | 1-21 | ||||
| Birth interval in months from older sibling | 8997 | 42.803 (27.86) | 9-318 | |||||
| Number of siblings in household | 18432 | .938 (1.081) | 0-9 | |||||
| Mother reports partner sensitive and aware of her needs | Strongly agree=1 to strongly disagree=5 | 14358 | 1.986 (.929) | 1-5 | ||||
Table 2.
Confusion matrix/Classification table for RF models (n=18,432).
| Observations correctly classified by RF algorithms | ||
|---|---|---|
| All 52 predictors (oob=0.0389) | Only top 5 features from IF scores in full model (oob=0.0393) |
|
| Cases with developmental delay | 659/687 (96%) |
681/687 (99%) |
| Cases without developmental delay | 17,716/17,716 (100%) |
17,716/17,716 (100%) |
Disclaimer/Publisher’s Note: The statements, opinions and data contained in all publications are solely those of the individual author(s) and contributor(s) and not of MDPI and/or the editor(s). MDPI and/or the editor(s) disclaim responsibility for any injury to people or property resulting from any ideas, methods, instructions or products referred to in the content. |
© 2023 by the authors. Licensee MDPI, Basel, Switzerland. This article is an open access article distributed under the terms and conditions of the Creative Commons Attribution (CC BY) license (http://creativecommons.org/licenses/by/4.0/).
Copyright: This open access article is published under a Creative Commons CC BY 4.0 license, which permit the free download, distribution, and reuse, provided that the author and preprint are cited in any reuse.


