
Submitted:
16 March 2023
Posted:
21 March 2023
You are already at the latest version
Abstract
Purpose: The intervertebral disc is a leading avascular organ in the body that may gather nutrition through diffusion. It maintains homeostasis by the use of autophagy and apoptosis to survive in unfavorable conditions such as stress and mechanical force. Therefore, excessive force and stress beyond normal conditions may cause intervertebral disc degeneration. The purpose of this study was to examine which is the better method, either external fixator (EF) or saline injection (SI), for inducing autophagy and apoptosis-mediated nucleus pulposus (NP) cell death in the discs of rat tail’s. Methods: Sixteen, nine-weeks-old male Sprague–Dawley rat tails were treated with 0.9% saline and EF (two-cross Kirschner wires) for a period ofsix and twelve weeks. Treated discs were dissected to identify the participation of autophagy and apoptosis in intervertebral disc degeneration. For identification purposes, H&E staining, Masson’s trichrome staining, and immunohistochemistry (IHC) for LC3, beclin-1, and P62 in addition to MMP-2, MMP-3, and TIMP-1 were performed. Furthermore, we performed real-time polymerase chain reaction (RT-PCR) to observe autophagy-related gene expression (beclin-1, LC3, and P62) and apoptosis-related gene expression (MMP-2, MMP-3, and TIMP-1). Results: TheEF group showed more insidious NP cell degeneration than the control (Ctrl) group. Degeneration was elevated with increasing compression duration of EF group, whereas the SI group could not distinguish the margin of annulus fibrosus (AF) and NP cells. LC3, beclin-1, and P62 showed the highest and lateral expression whilst MMP-2, MMP-3, and TIMP-1 showed up-regulated and central expression in both groups, although the SI group could not recognize the boundary between NP and AF cells. The EF group showed the highest autophagy-related gene expression whereas the SI group showed lower expression. In addition, the EF group showed more autophagy-accumulating materials than the SI group which elevated with increasing compression duration. Furthermore, the SI group induced the highest apoptotic gene expression, but the EF group showed the lowest expression. Conclusion: The EF method was better for studying autophagy and apoptosis because it enhanced intervertebral disc degeneration after compression, which is actively linked to autophagy and apoptosis. The degeneration process was elevated by increasing the compression duration, but SI could not distinguish AF and NP cell margins.
Keywords:
Intervertebral disc degeneration
; nucleus pulposus
; autophagy
; apoptosis
; external fixator
; saline injection
1. Introduction
Intervertebral disc degeneration (IVDD) is a crucial recognizable fact in adult back and neck pain which can lead to a decreased quality of life and cause disabilities [1,2,3,4,5]. IVDD is a pathological and physiological process that can be chronic and progressive and has wide spread prevalence [1,5].About 80% of mature individuals suffer from back and neck pain at any life stage [2,6,7]. The intervertebral disc (IVD), an essential element, can tolerate various kinds of load intensities [8]. Many previous studies have mentioned that excessive external stress, hereditary disease, obesity, and aging are the most common enhancers of IVDD[1,3,7,9]. However, mechanical stimulus is another critical contributor to IVDD when it exceeds the tolerable margin of load baring elements [10]. Tolerable mechanical pressure usually creates a defensive effect on the IVD, but too much mechanical pressure often exacerbates IVD-related cell death. The IVD is composed of three distinct but interdependent tissues: central nucleus pulposus (NP), outer AF, and cartilage end plates on the superior and inferior surfaces [1,3,11,12]. NP cells play a vital role in maintaining the normal skeleton and physiological function of the IVD by producing an extracellular matrix (ECM), including type II collagen and proteoglycans (mainly aggrecans)[1,11,13,14]. The innermost NP cells are the fundamental part of the IVD. The effect of pathological loading is usually harsher in NP cells than in other types of IVD cells due to compression-mediated disc deterioration [15]. Reducing the NP cell number is the crucial element of IVDD and is strongly connected with programmed cell death (PCD) [15,16].
In cell biology, there are two classic and morphologically unique modes of PCD: autophagy and apoptotic cell death [1,13]. Stress can frequently influence both types of PCD. Autophagy provides energy by degrading the accumulated damaged organelles and miss-folded proteins under stress conditions [1,17,18].To examine whether autophagy or apoptosis plays a more significant role in compression-mediated NP cell injury, researchers have conducted many studies regarding compression-mediated apoptosis. Conversely, few studies have been conducted regarding the role of autophagy in IVD cells. However, these studies do not provide sufficient information regarding exposure of the IVD to compression. Therefore, further investigation regarding the relationship between autophagy and apoptosis in the IVD is required. It is thought that NP cells have a strong connection with the etiology of IVDD, and excessive compression advances the process of IVD degeneration [1,3,10].
Hence, IVD cells would demonstrate different forms of cell death besides apoptosis and autophagy in response to compression [17].Furthermore, needle puncture may directly alter mechanical properties through NP depressurization or AF damage [19] and show involvement with autophagy and apoptosis. Moreover, most disc degeneration studies have previously focused on MMP, TIMP, and others, but nowadays, it is thought that autophagy processes have a pivotal function in central disc degeneration. However, because the autophagic process begins during the initial stages of disc degeneration, some studies were not suitable for the early stages of degeneration. Therefore, this study aimed to examine which methods are most suitable for studying disc degeneration, and the EF and SI methods were selected to study autophagy and apoptosis-mediated IVDD through NP cell injury in rat tail discs (Figure 1).
2. Materials and Methods
2.1. Animal preparation
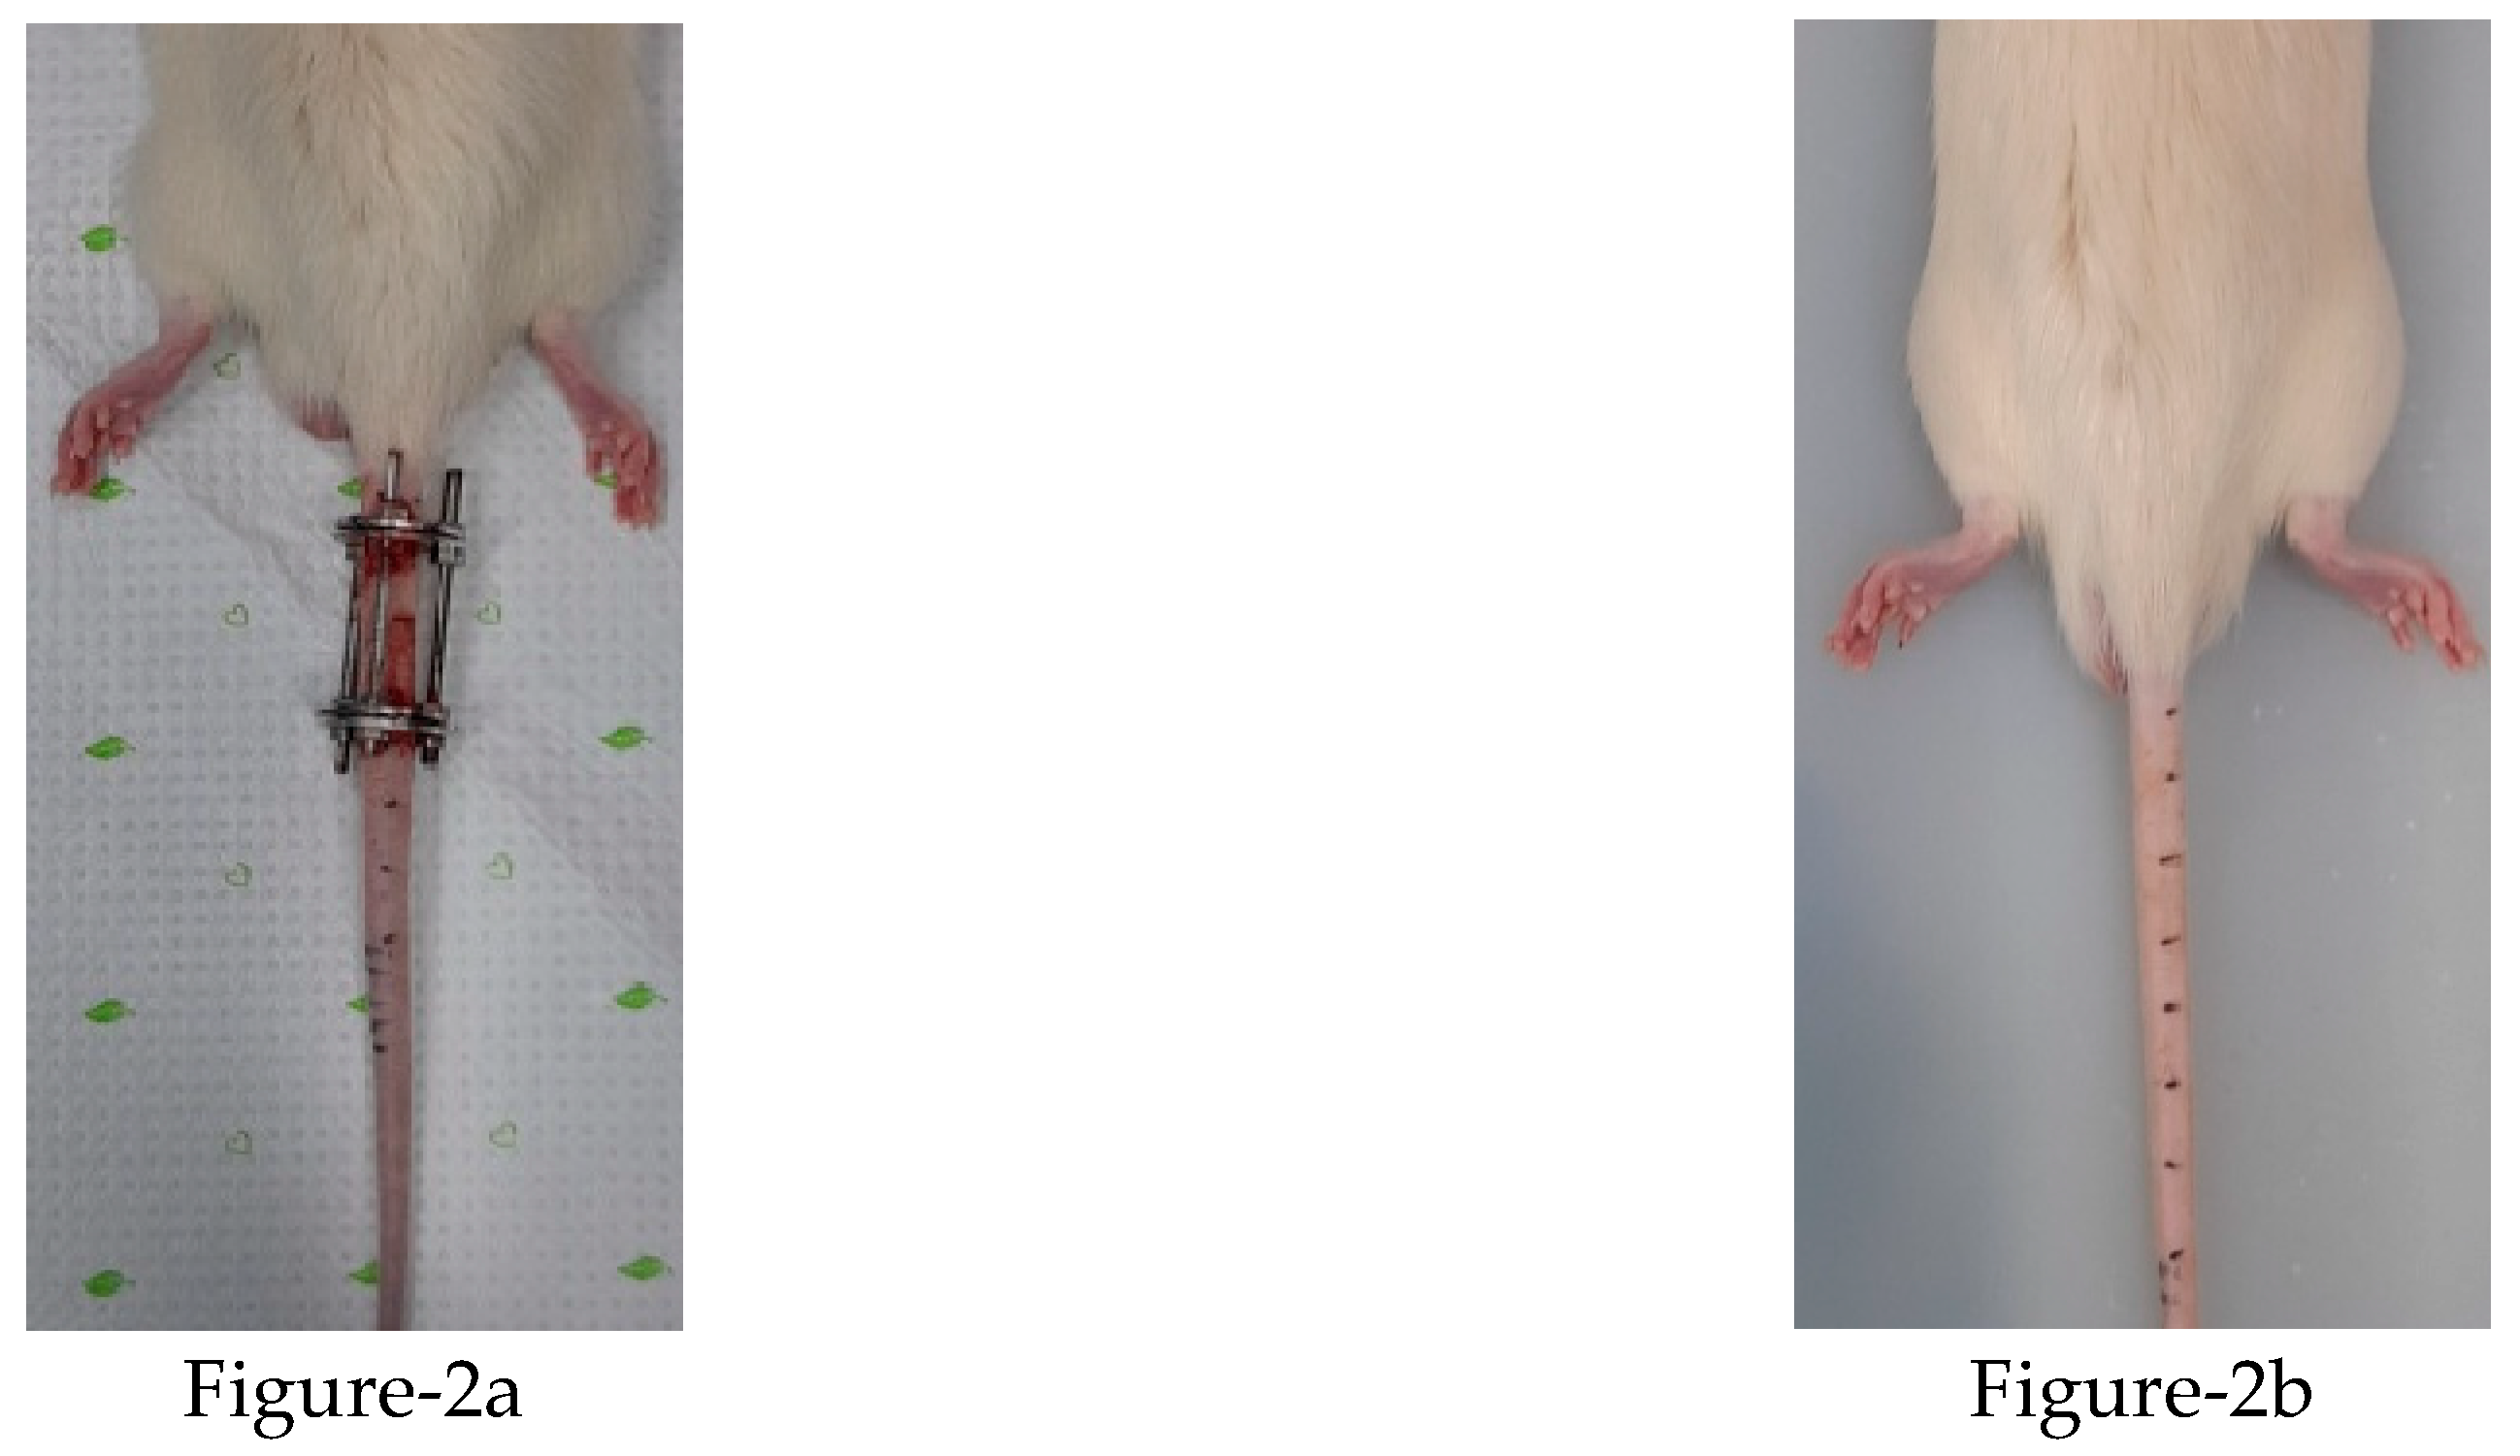
A total of 16, nine-week-old male Sprague-Dawley rats (KOATECH Korea Animal technology) were used in this experiment. The Institutional Review Board of the Animal Experimentation Committee (IRB number CMCDJ-AP-2021-006) approved this study. The rats were randomly divided into three groups; the control (Ctrl) group, EF group, and SI group. Four rats were used in the Ctrl group, six in the EF group, and six in the SI group. The Ctrl group was divided into two sub-groups of six weeks and twelve weeks, and kept and housed without any treatment. TheEF group was divided into the same sub-groups and Kirschner wire was used for compression. The SI group was also divided into the same sub-groups and 0.9% normal saline was used. After intraperitoneal anesthesia, two-cross 0.7 mm diameter Kirschner wires were inserted percutaneously into each vertebral body, perpendicular to the tail’s axis, and attached with aluminum rings (figure-2a). The rings were connected longitudinally with three threaded rods. For the SI group, 0.9% normal saline was injected into the discs of the rat tail using a syringe (figure-2b). A registered orthopedic surgeon performed all surgery in a controlled room. After surgery, rats were housed at 12 h light/dark cycles with a temperature of 23 ± 2 ◦C, and humidity of 55 ± 5%. The rats were kept separately in specific pathogen-free housing and given free access to food and water. (See the figure 2a and 2b below after compression and saline injection).
Figure 2.
State of postpreparartion of external fixator and saline injection of rat tail preparation (left EF.
Figure 2.
State of postpreparartion of external fixator and saline injection of rat tail preparation (left EF.
2.2. Paraffin-Embedded Tissue Preparation
The experimental part of the rat’s tail was excised carefully, immediately immersed in 4% paraformaldehyde, and kept at room temperature for 48 days. Afterward, the excised tail was rinsed with water and immersed in decalcification reagents until fully decalcified. Then, the rat tail was vertically cut to an appropriate size for placing in a plastic block and immersed in 10% formaldehyde overnight. The following day, dehydration steps were carried out. Each section was sliced at a thickness of about 5μm using a microtome and mounted onto slides, according to a standard protocol. Finally, slides were allowed to dry overnight and stored at room temperature until ready for use.
2.3. H&E staining
Paraffin-embedded sections were deparaffinized following the instruction steps of a standard protocol. Afterwards, hematoxylin and eosin staining was performed according to a standard procedure and photographed using the OLYMPUS, BX53 U-CMAD3 microscope (T7 TOKYO, JAPAN).
2.4. Masson’s trichrome staining
Formalin-fixed paraffin-embedded sections were dehydrated. Afterward, slides were placed in Bouin’s solution overnight at room temperature. The following day, the slides were washed using tap water until the yellow coloration was gone. Then, slides were stained in Weigert’s hematoxylin for 15 minutes and placed in Biebrich scarlet-acid fuchsin for 5–10 minutes after rinsing with water. The slides were then placed in phosphomolybdic-phosphotungstic acid solution in a plastic Coplin jar for 15 minutes after washing them with water. Finally, the slides were stained with aniline blue solution for 10 minutes and after rinsing with water, followed by dehydration, were mountedusing appropriate coverslips and photographed using the OLYMPUS, BX53 U-CMAD3 microscope (T7 TOKYO, JAPAN).
2.5. Immunohistochemistry (IHC)
Sections were deparaffinized in xylene, dehydrated in graded ethanol, and washed for 5 minutes in tap water. Sections were rinsed with distilled water and treated for antigen retrieval using proteinase K enzyme. Sections were incubated with 1:200 rabbit monoclonal primary antibody LC3 (#3868; Cell Signaling Technology, USA), 1:400 diluted mouse monoclonal primary antibody Beclin 1 (#sc-48381; Santa Cruz Biotechnology, Inc. USA), and 1:50 diluted mouse monoclonal primary antibody p62 (#ab56416; Abcam, UK)at 4°C overnight. A 1:50 diluted mouse monoclonal antibody MMP2 (#sc53630; Santa Cruz Biotechnology, Inc. USA), 1:50 diluted mouse monoclonal antibody MMP3 (#sc21732; Santa Cruz Biotechnology, Inc. USA), and 1:100 diluted mouse monoclonal antibody TIMP1 (#sc21732; Santa Cruz Biotechnology, Inc. USA) was also used and incubated at 4°C overnight. The following day, slides were treated with peroxidase-labeled anti-mouse or anti-rabbit antibody (VECTASTIN Elite ABC Kit, Vector Laboratories, Inc, USA) at room temperature for 30 minutes. Subsequently, HRP detection solutions (ImmPACTNovaRED Substrate kit peroxidase, Vector Laboratories, Inc, USA) were added and incubated for 15 minutes at room temperature. Counterstaining was then performed using Mayer’s hematoxylin, and dehydration steps were followed. Finally, slides were mounted using the appropriate coverslips and photographed using the OLYMPUS, BX53 U-CMAD3 microscope (T7 TOKYO, JAPAN).
2.6. RNA Extraction and RT-PCR
Experimental discs were excised carefully (including AF and NP), kept in liquid nitrogen to prevent RNA degradation, and stored at −80°C. Total RNA was isolated using the RNeasy Mini Kit (Qiagen, Hilden, Germany). Then, 2 μg RNA was reverse transcribed using a Revertra Ace RT Master Mix Kit (TOYOBO, Osaka, Japan). Relative mRNA expression encoding autophagy-related genes (LC3, Beclin-1, and P62) and apoptosis-related genes (MMP-2 and MMP-3 and TIMP-1) were evaluated by real-time (RT)-polymerase chain reaction (PCR). The Applied Biosystems 7500 Fast Real-Time PCR System(Thermo Fisher Scientific, USA) and thunderbird SYBR Green RT-PCR mix (TOYOBO, Osaka, Japan) were used for identification. The primer sequences are listed in Table 1. Glyceraldehyde3-phosphate dehydrogenase (GAPDH) mRNA expression was measured as an endogenous control. The mRNA expression of each protein in the experimental discs was transformed into a relevant number representing the amount of mRNA compared with the control group using the 2−ΔΔCt method. The formula ΔCt = Cttarget gene – CtGAPDH was used to calculate the difference in threshold cycles for the target gene and reference gene. Finally, the mRNA expression fold change of the target gene as 2−ΔΔCt in the treated discs was calculated.
2.7. Statistical analysis
Data were expressed as mean ± standard deviation and two-way ANOVA was used to investigate changes in the effects of EF and SI after six weeks and twelve weeks. Eight discs from four rats were analyzed in the Ctrl group. Twelve discs from six rats were used for the EF group and the SI group. Statistical significance was assessed with P< 0.05, P< 0.01, and < 0.001(level of significance is * P < 0.05, ** P < 0.05, *** P< 0.05, and ****P< 0.05) using GraphPad Prism (GraphPad Software, Inc., USA).
3. Results
3.1. External fixator exerted insidious degradation of NP cells
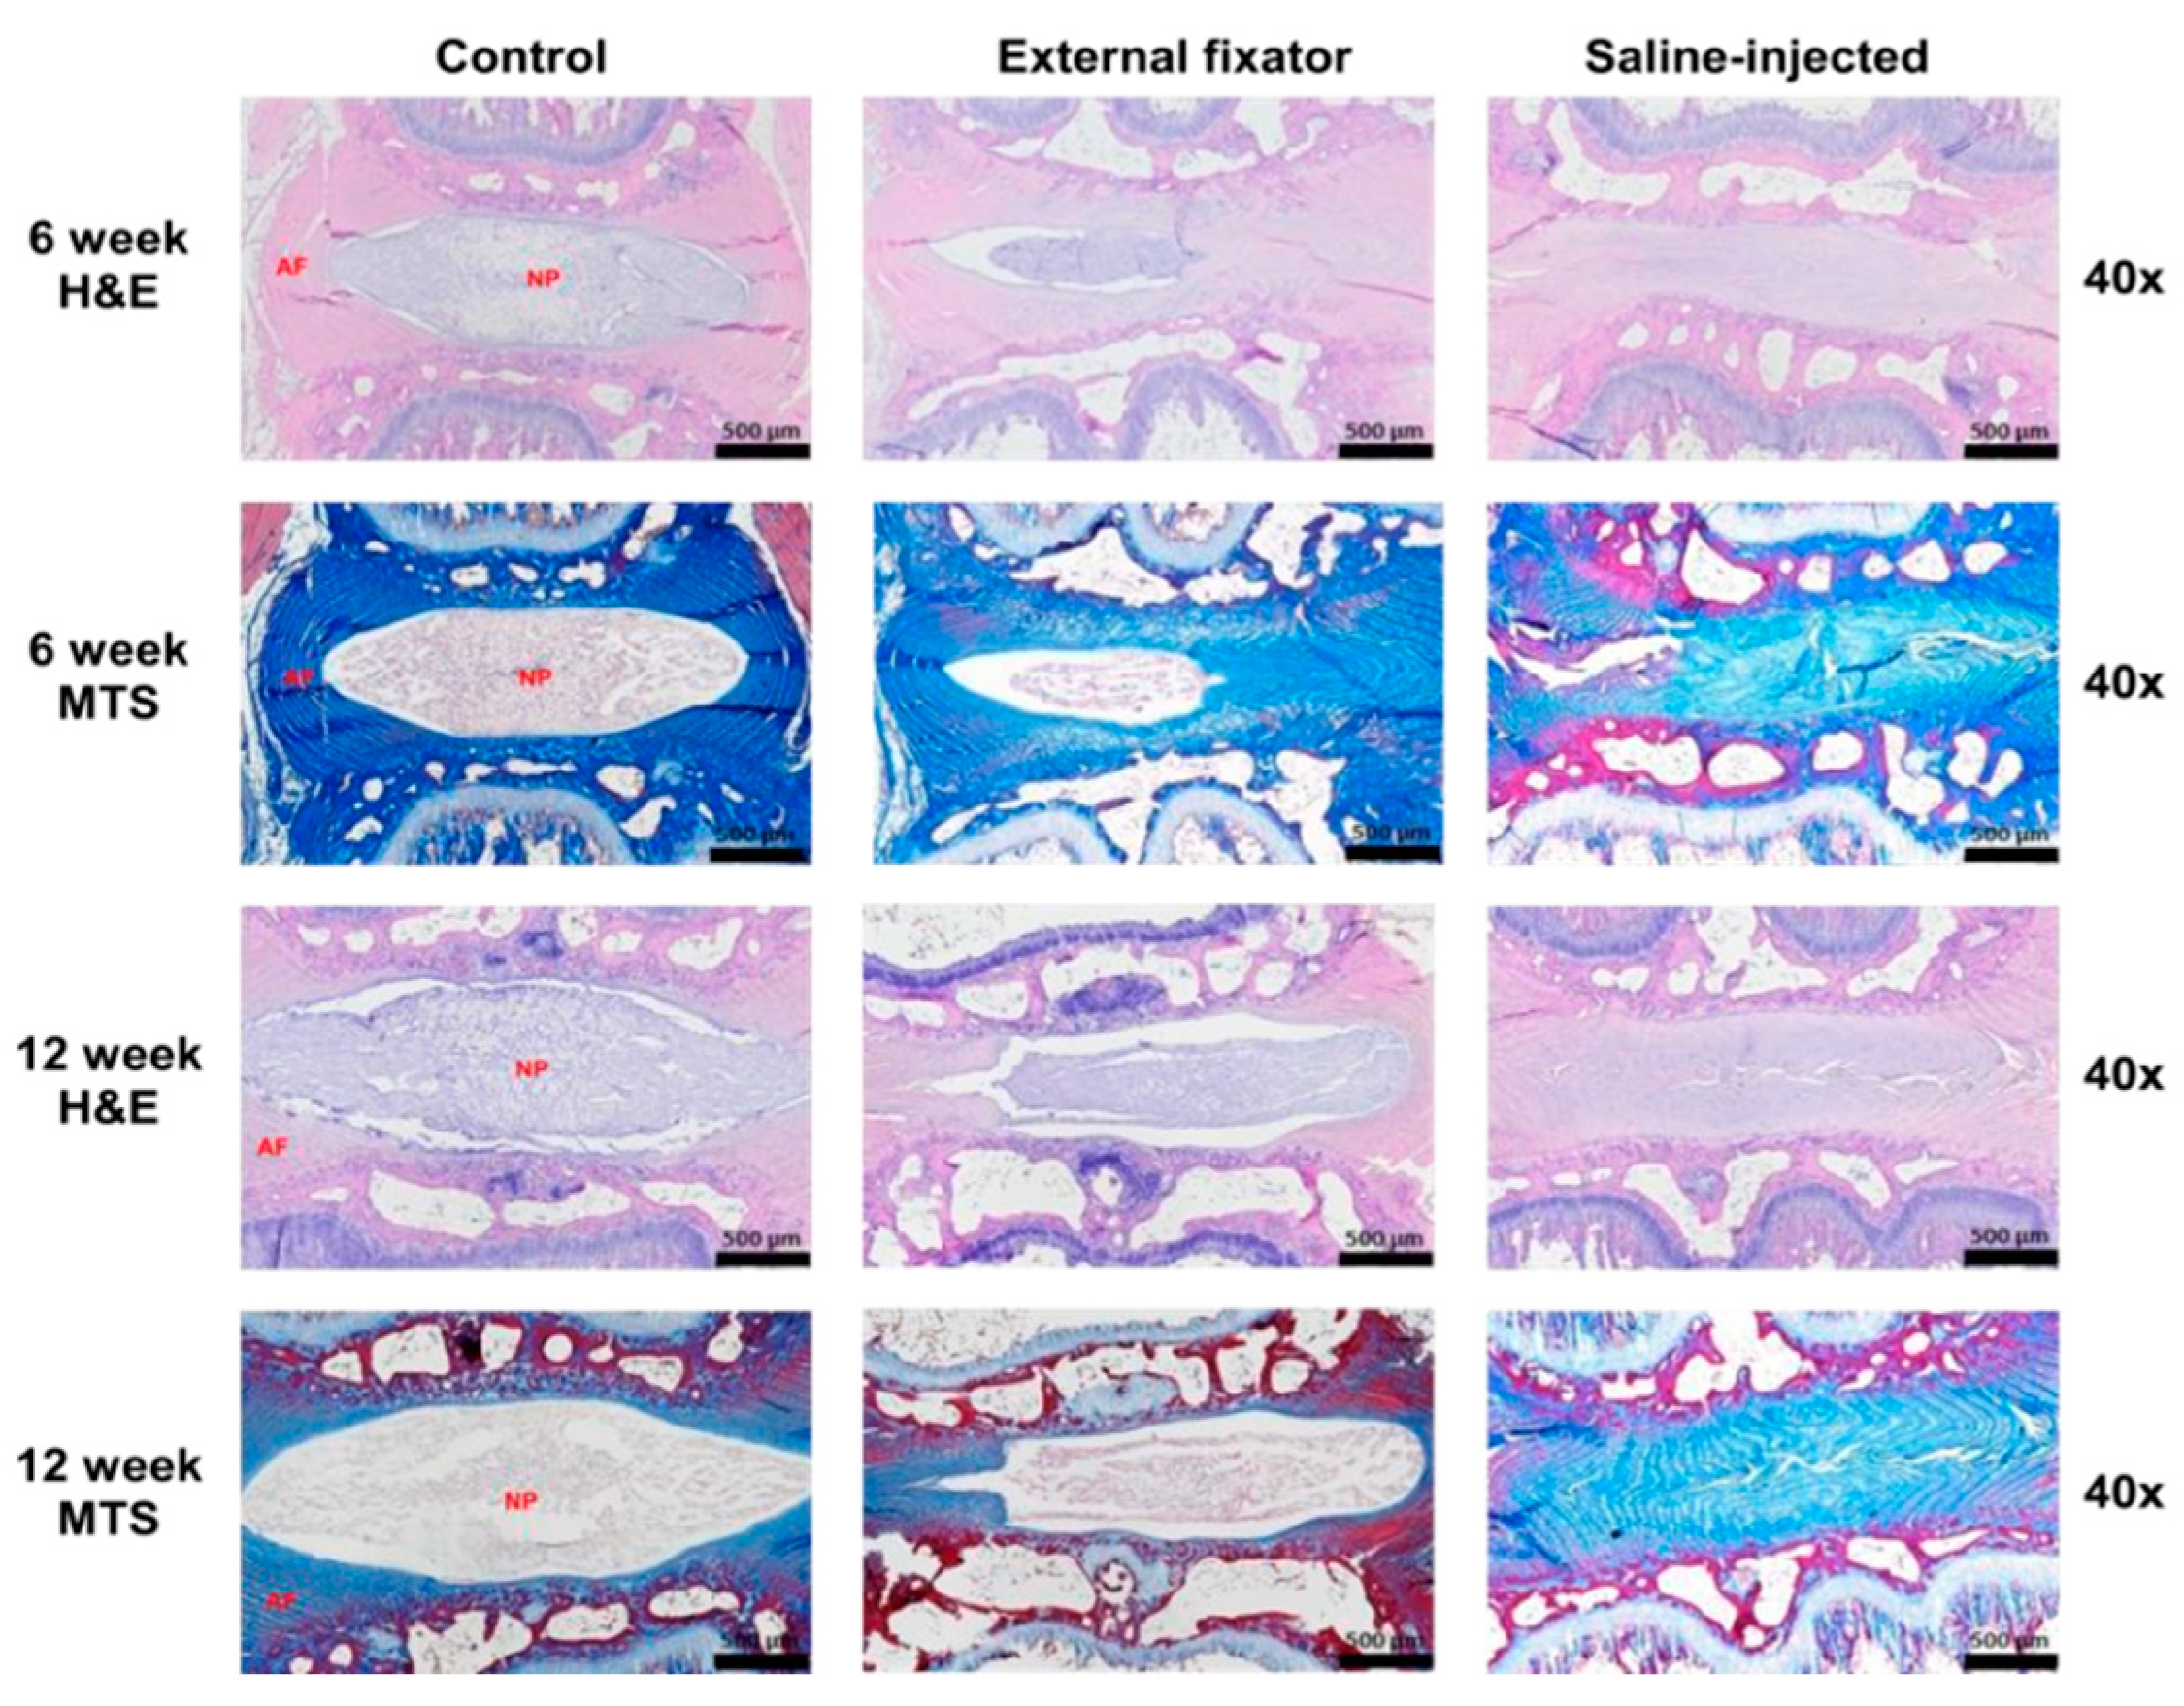
To identify NP cell degradation, H&E staining was performed when the EF and SI groups showed more insidious NP cell degeneration than the Ctrl group, even if the SI group showed there was no margin between AF and NP. However, the degradation rate was elevated with an increasing duration of compression (Figure-3). Masson’s trichrome staining was performed to understand the status of NP cell morphology. The EF and SI groups showed more subtle NP cell degeneration than the control group. Furthermore, the degradation rate inclined along with increasing compression duration, even though the SI group showed there was no boundary between AF and NP cells (Figure-3).
Figure 3.
H&E and Masson’s trichrome staining results for theEF, SI, and Ctrl group after six weeks and twelve weeks. Both H&E and MTS showed more insidious NP cell degeneration in the EF group than the Ctrl group after six and twelve weeks but the SI group showed no margin between AF and NP cells.
Figure 3.
H&E and Masson’s trichrome staining results for theEF, SI, and Ctrl group after six weeks and twelve weeks. Both H&E and MTS showed more insidious NP cell degeneration in the EF group than the Ctrl group after six and twelve weeks but the SI group showed no margin between AF and NP cells.
3.2. External fixator-induced autophagy-mediated NP cell degradation
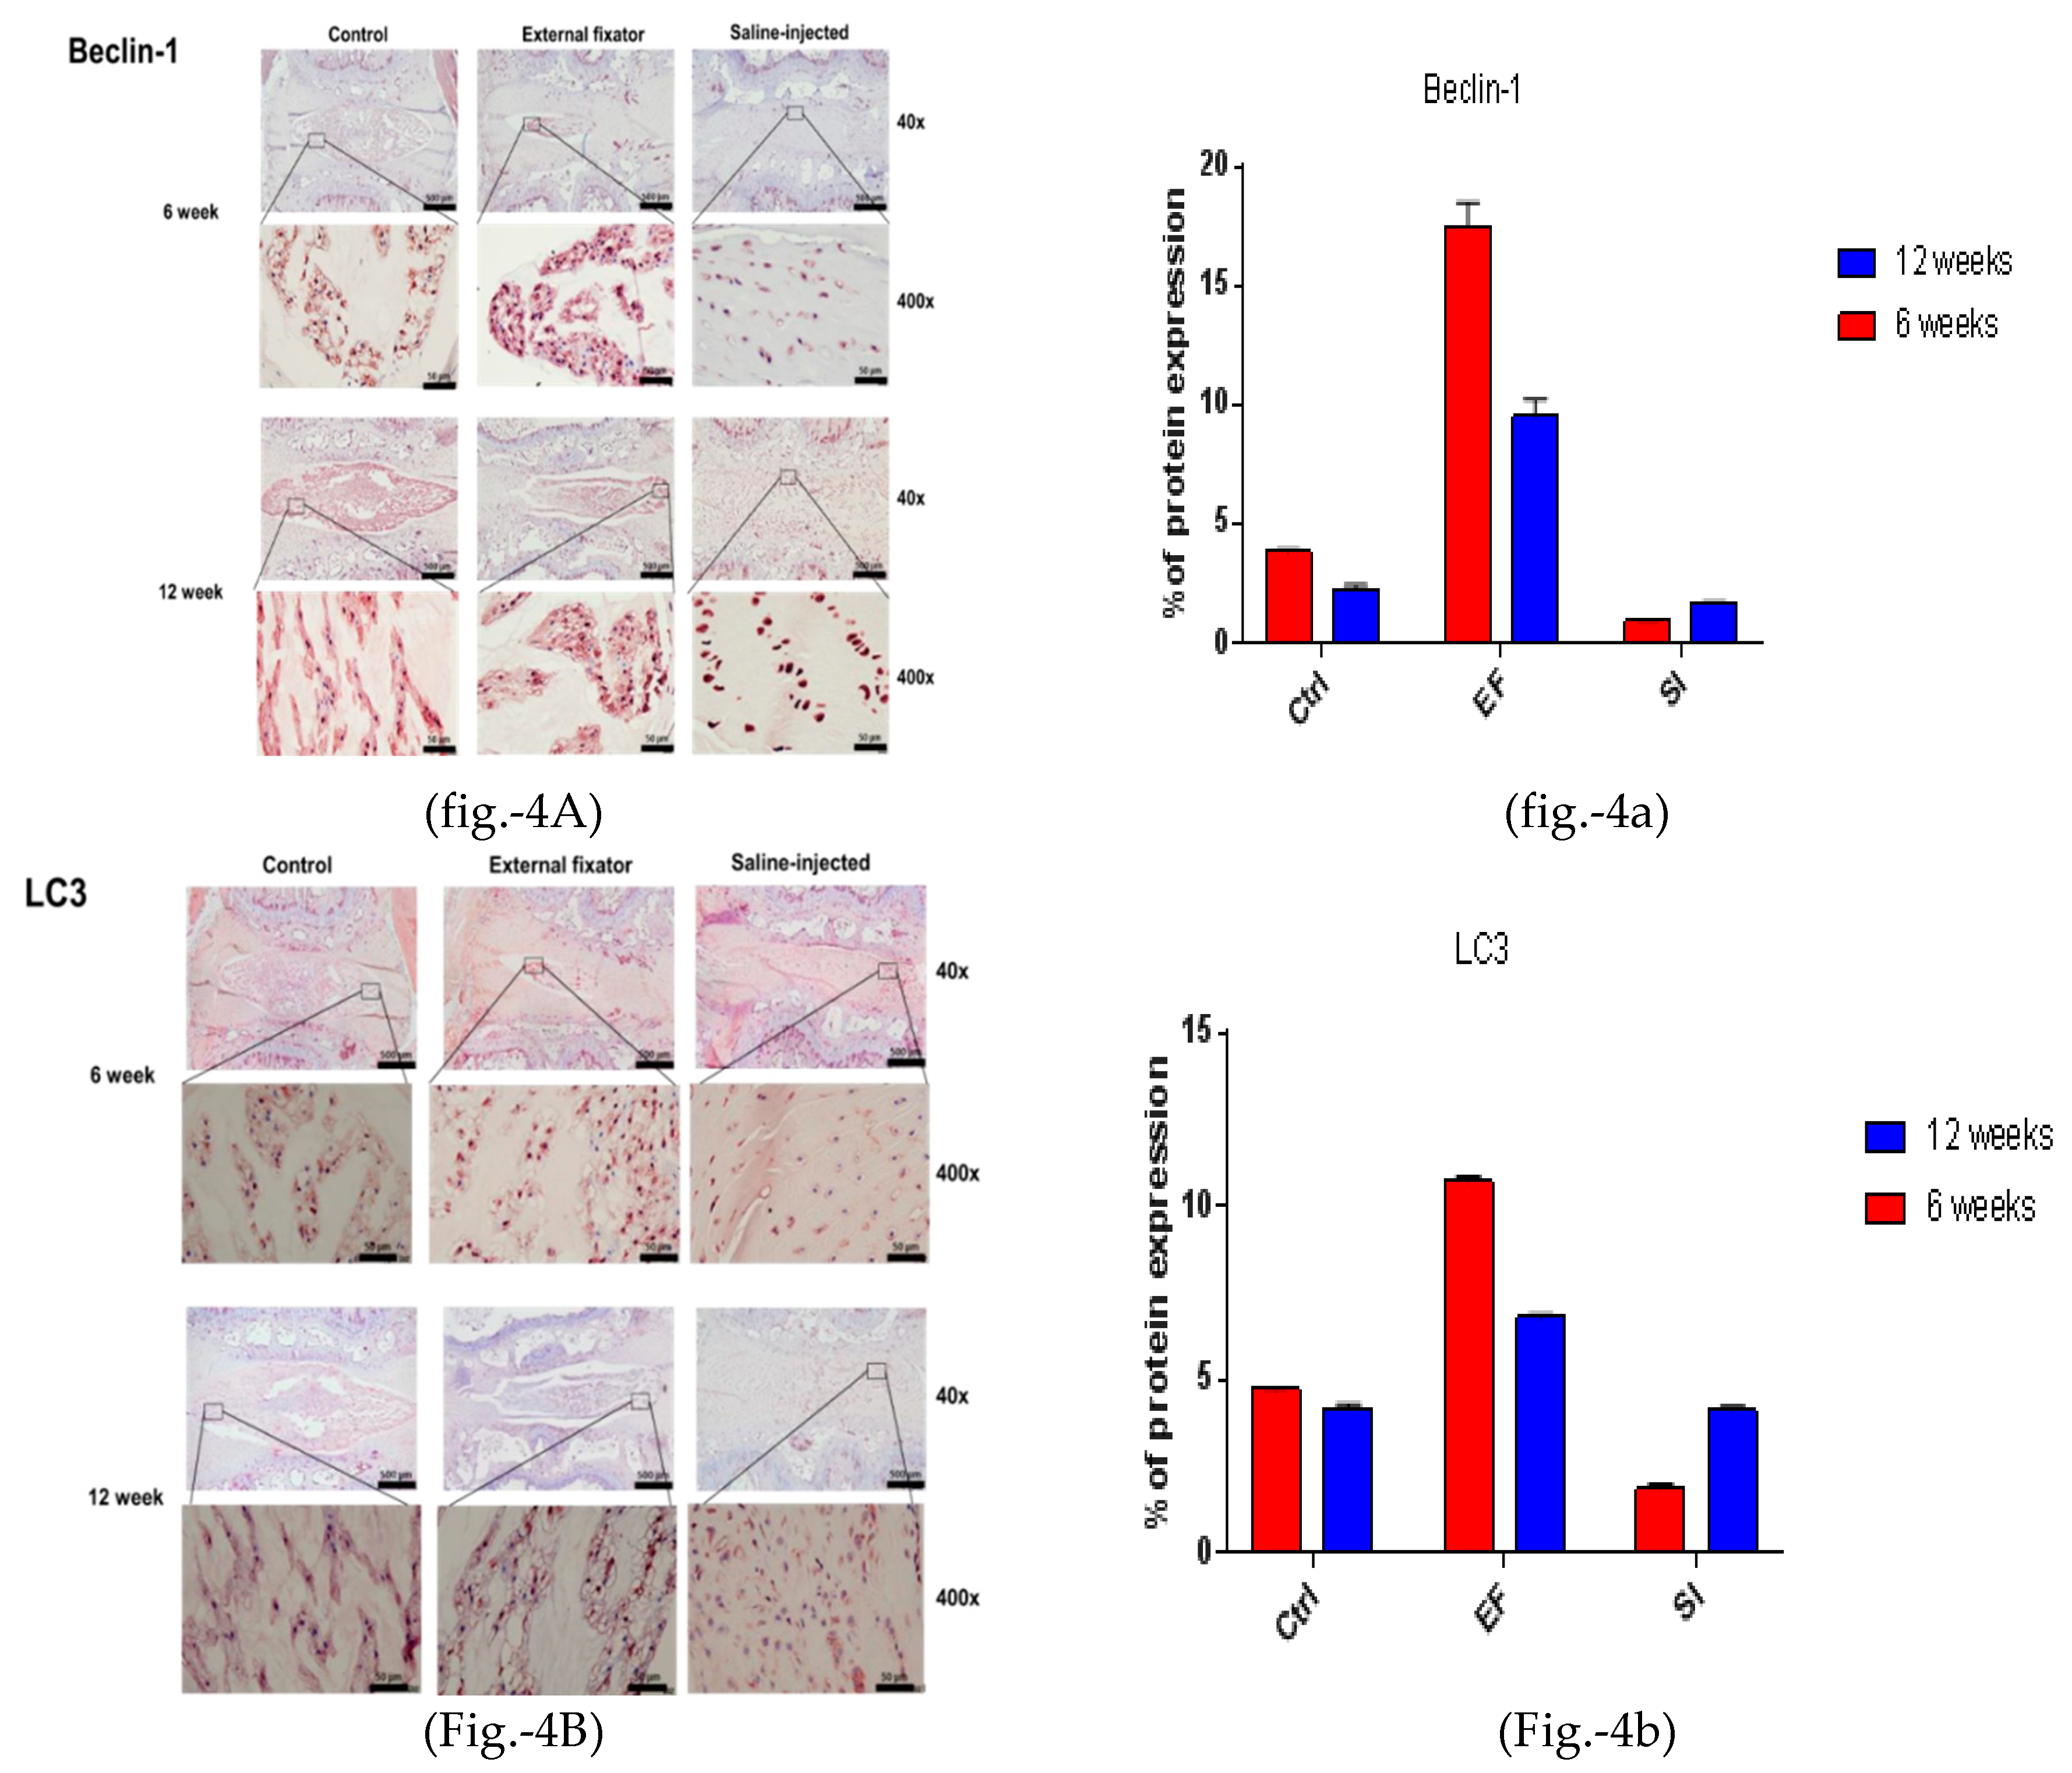
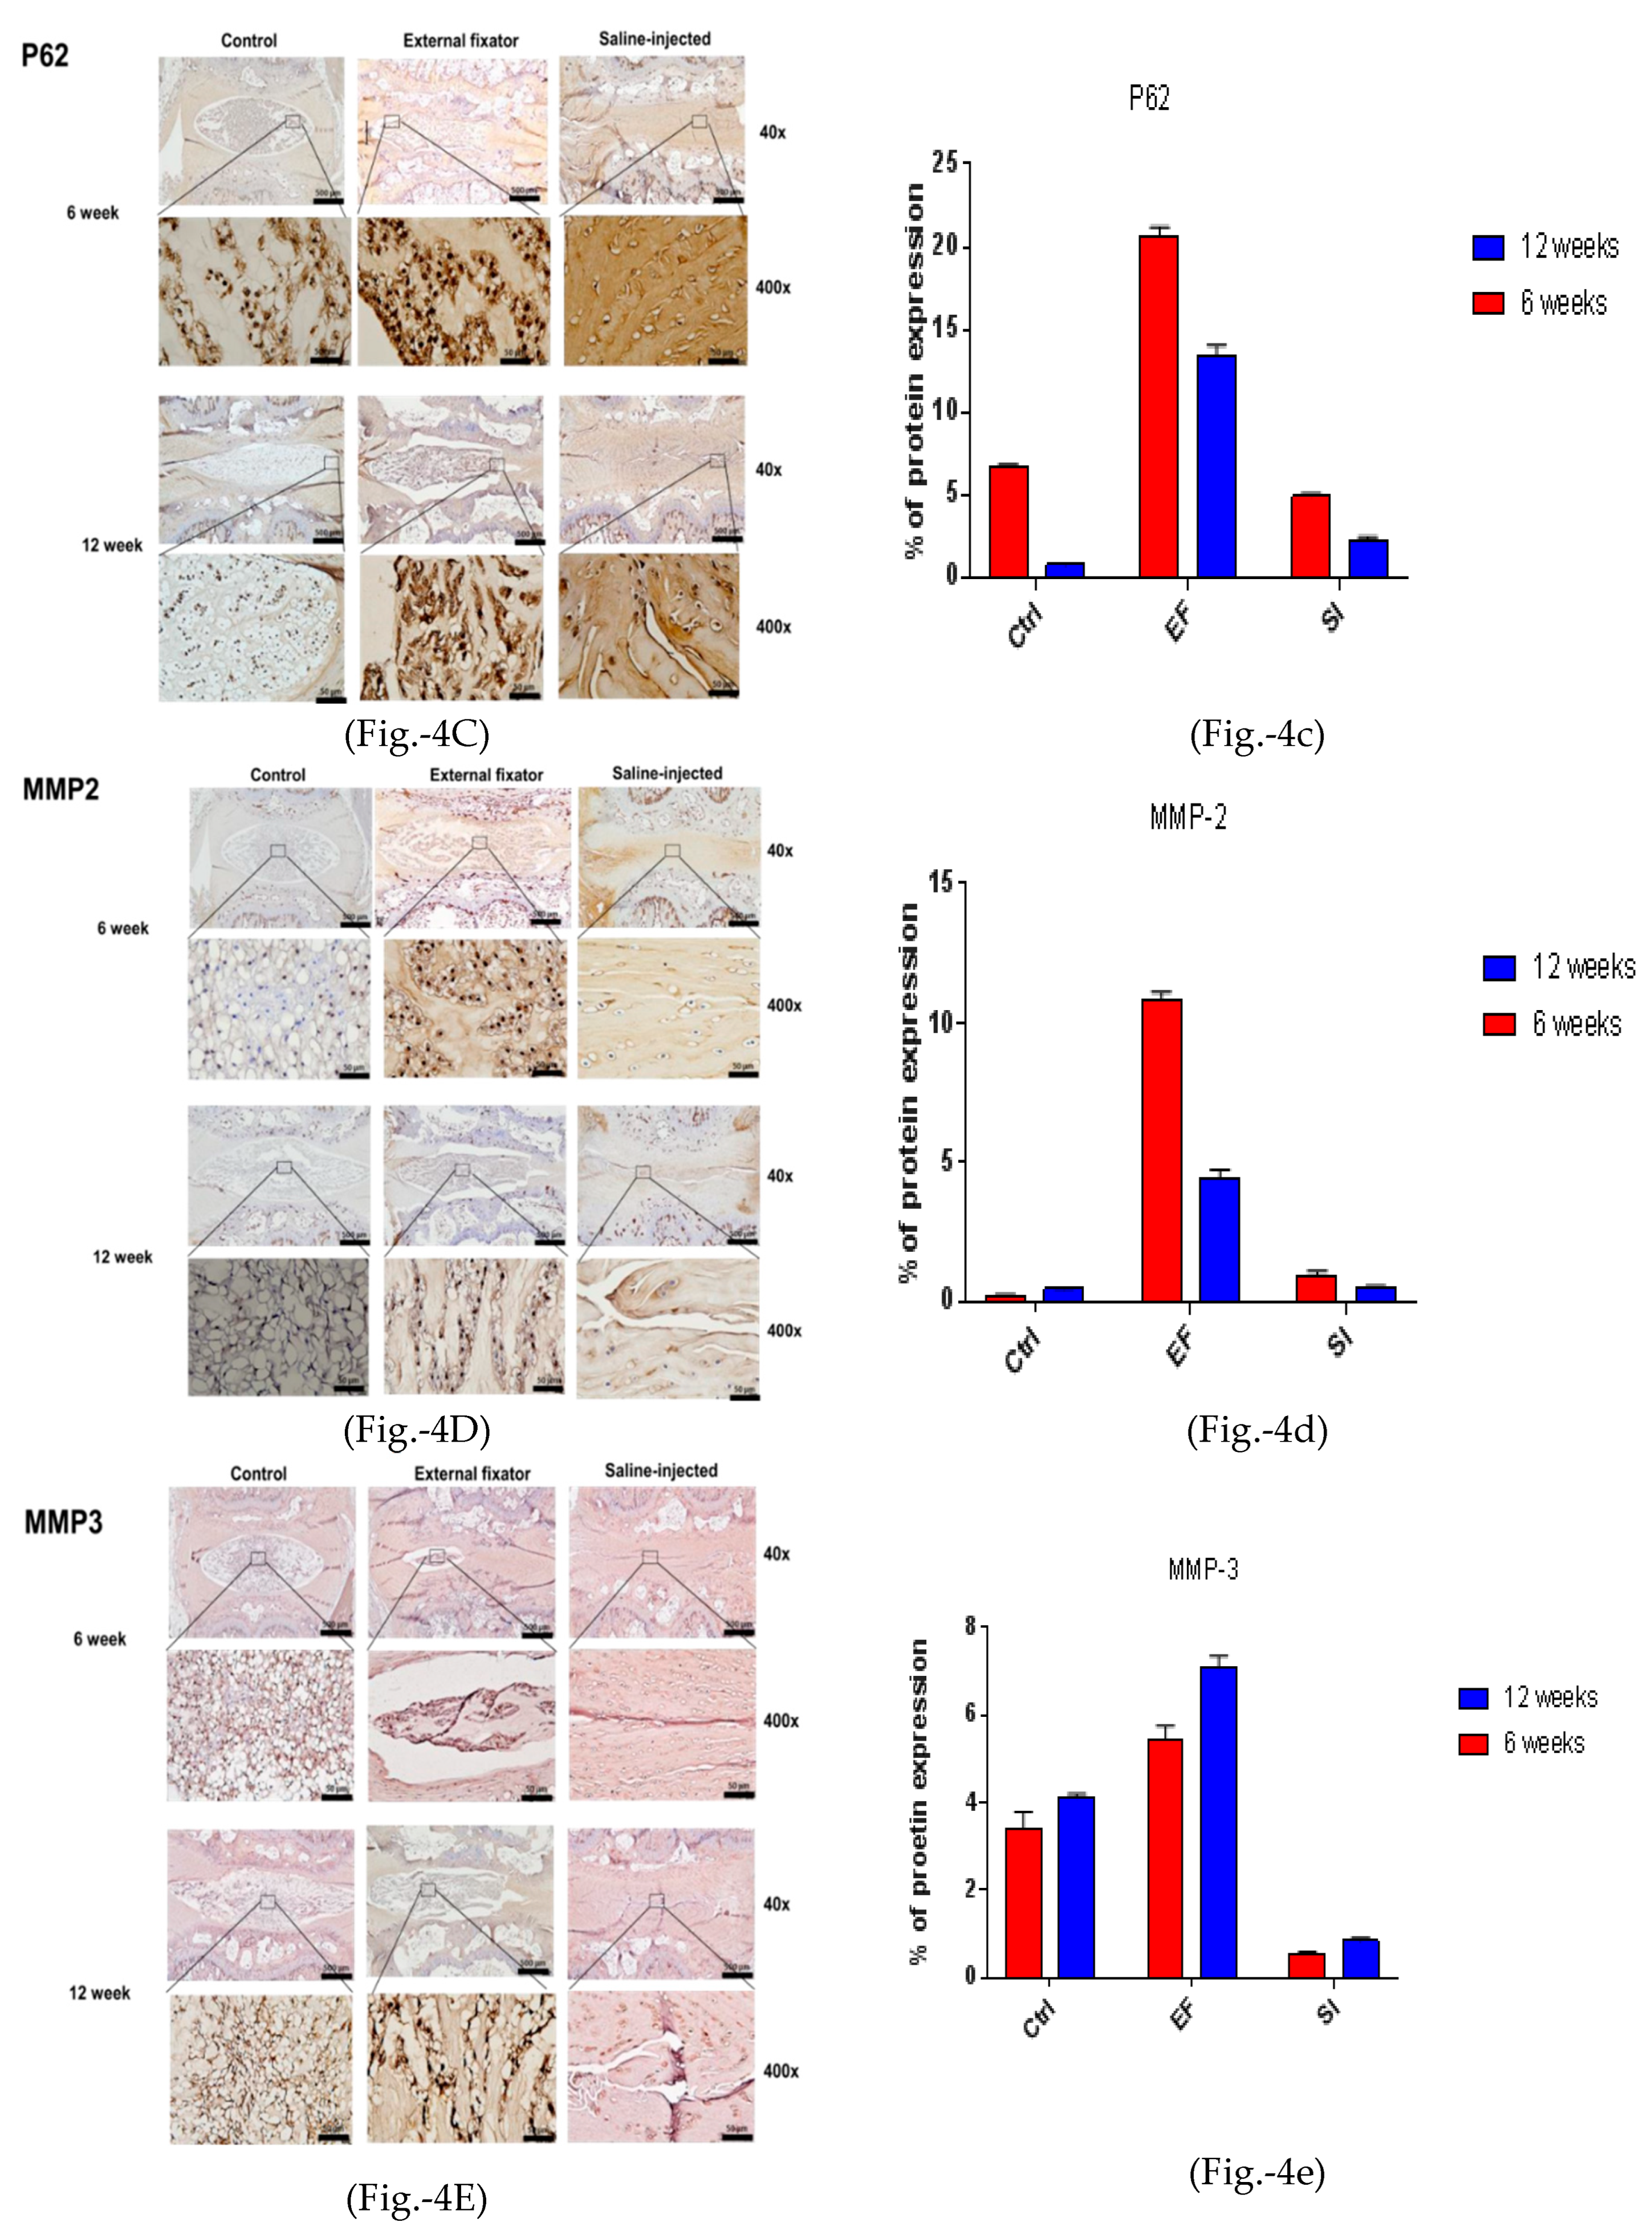
To observe autophagy-mediated NP cell degradation, IHC for LC3, Beclin-1, and P62 was performed. Beclin-1 showed the highest lateral expression in the EF group after six weeks and was down-regulated after twelve weeks. The SI group also showed upregulated and lateral expression. However, it showed significantly upregulated expression after twelve weeks than six weeks, even though the SI group cannot distinguish the margin between NP cells and AF cells. Furthermore, the SI group showed less upregulated expression than the EF group (Figure-4A and 4a). Elevated lateral LC3 expression was found in both EF and SI groups after six weeks and twelve weeks than the Ctrl group but the EF group showed more upregulated expression than the SI group (Figure-4B and 4b). P62 showed the highest and lateral expression in the EF and the SI groups after six weeks, but after twelve weeks, it showed more down-regulated expression than six weeks. Nevertheless, the EF group showed more upregulated expression than the SI group (Figure-4A-C and 4a-c). This indicates that the EF group induced more lateral autophagy-mediated NP cell degradation.
Figure 4.
(4A left and 4a right). Beclin‐1 protein expression for the EF, SI, and Ctrl groups after six weeks and twelve weeks; more up‐regulated and lateral expression in EF than in Ctrl after six and twelve weeks, but after twelve weeks, down‐regulated expression found compared to six weeks. Whereas, SI group showed more down regulated expression after six and twelve weeks compared to Ctrl group. (4B left and 4b right). LC3 protein expression for the EF, SI, and Ctrl group after six weeks and twelve weeks; more up‐regulated and lateral expression found in EF than in Ctrl after six and twelve weeks. On the other hand, SI group showed more down regulated expression after six weeks but after twelve weeks, no significant changes was identified. (4C left and 4c right). P62
protein expression for the EF, SI, and Ctrl group after six and twelve weeks; the highest and lateral
expression was seen in the EF group than in the Ctrl group after six and twelve weeks. However, after
twelve weeks, lateral and down‐regulated expression found compared to six weeks what’s more it
was more up‐regulated than Ctrl and SI groups. (4D left and 4d right). MMP‐2 protein expression for
the EF, SI, and Ctrl group after six and twelve weeks; the expression is maximum and central in the
EF group compared to the Ctrl and SI group after six and twelve weeks. However, after twelve weeks,
central and down‐regulated expression was found compared six weeks. Whereas, in Si group, no
significant changes was seen after six and twelve weeks compared to Ctrl group. (4E left side and 4e
right side). MMP‐3 protein expression for the EF, SI, and Ctrl group after six weeks and twelve weeks;
the highest and central expression was identified in the EF group compared to the Ctrl and SI groups
after six and twelve weeks, but after twelve weeks, expression was more up‐regulated central than
six weeks in EF group. Whereas, the SI group showed more down‐regulated expression compared to
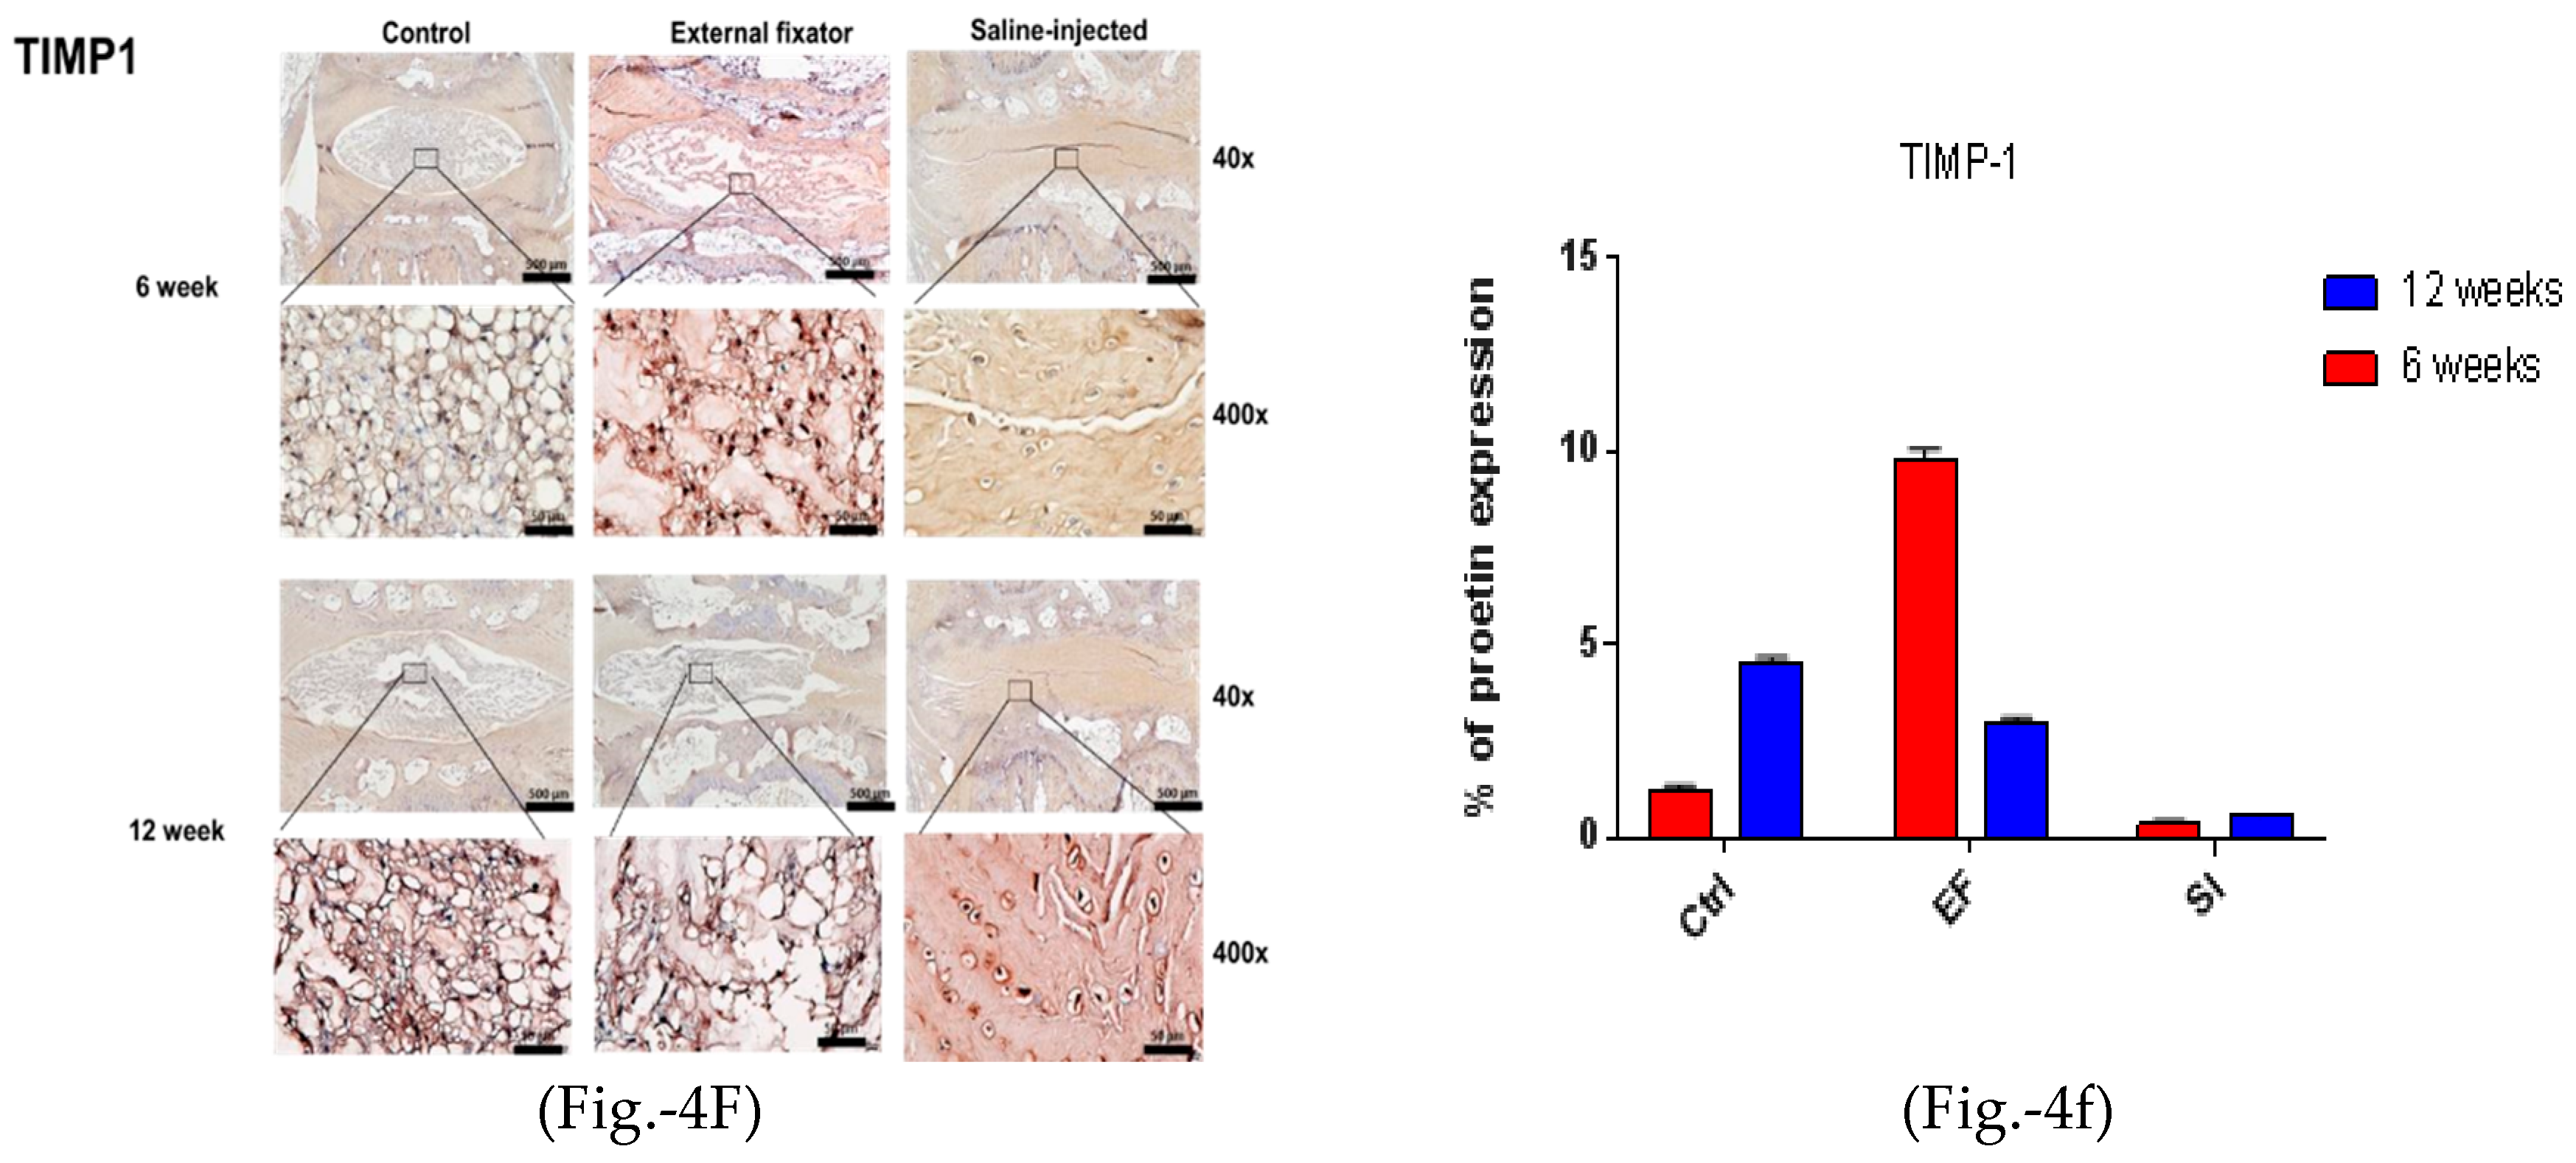
the Ctrl group after both six and twelve weeks. (4F left side and 4f right side). TIMP1 protein
expression for the EF, SI, and Ctrl group after six weeks and twelve weeks; the highest and central
TIMP‐1 expression was found in the EF group compared to the Ctrl group after six and twelve weeks,
but after twelve weeks, the expression was central and down‐regulated and somewhat less than Ctrl.
Whereas, in SI group, more down regulated expression was seen after both six and twelve weeks.
Figure 4.
(4A left and 4a right). Beclin‐1 protein expression for the EF, SI, and Ctrl groups after six weeks and twelve weeks; more up‐regulated and lateral expression in EF than in Ctrl after six and twelve weeks, but after twelve weeks, down‐regulated expression found compared to six weeks. Whereas, SI group showed more down regulated expression after six and twelve weeks compared to Ctrl group. (4B left and 4b right). LC3 protein expression for the EF, SI, and Ctrl group after six weeks and twelve weeks; more up‐regulated and lateral expression found in EF than in Ctrl after six and twelve weeks. On the other hand, SI group showed more down regulated expression after six weeks but after twelve weeks, no significant changes was identified. (4C left and 4c right). P62
protein expression for the EF, SI, and Ctrl group after six and twelve weeks; the highest and lateral
expression was seen in the EF group than in the Ctrl group after six and twelve weeks. However, after
twelve weeks, lateral and down‐regulated expression found compared to six weeks what’s more it
was more up‐regulated than Ctrl and SI groups. (4D left and 4d right). MMP‐2 protein expression for
the EF, SI, and Ctrl group after six and twelve weeks; the expression is maximum and central in the
EF group compared to the Ctrl and SI group after six and twelve weeks. However, after twelve weeks,
central and down‐regulated expression was found compared six weeks. Whereas, in Si group, no
significant changes was seen after six and twelve weeks compared to Ctrl group. (4E left side and 4e
right side). MMP‐3 protein expression for the EF, SI, and Ctrl group after six weeks and twelve weeks;
the highest and central expression was identified in the EF group compared to the Ctrl and SI groups
after six and twelve weeks, but after twelve weeks, expression was more up‐regulated central than
six weeks in EF group. Whereas, the SI group showed more down‐regulated expression compared to
the Ctrl group after both six and twelve weeks. (4F left side and 4f right side). TIMP1 protein
expression for the EF, SI, and Ctrl group after six weeks and twelve weeks; the highest and central
TIMP‐1 expression was found in the EF group compared to the Ctrl group after six and twelve weeks,
but after twelve weeks, the expression was central and down‐regulated and somewhat less than Ctrl.
Whereas, in SI group, more down regulated expression was seen after both six and twelve weeks.
3.3. External fixator-induced apoptosis-mediated NP cell death
To identify apoptotic-mediated NP cell degradation, we performed IHC for MMP-2, MMP-3, and TIMP-1. MMP-2 showed the highest and central expression in the EF group, but the SI group could not differentiate the border between AF cells and NP cells. Furthermore, it showed central down-regulated expression after twelve weeks in both groups, although the SI group showed less expression than the EF group (Figures- 4D and 4d). MMP-3 showed upregulated and central expression in both EF and SI groups. However, MMP-3 expression was upregulated and amplified with increasing the compression duration (Figures-4E and 4e). The highest and central TIMP-1 expression was found in both EF and SI groups compared to the Ctrl group after six and at twelve weeks. However, after six weeks, the EF group showed more central expression than twelve weeks, whereas the SI group showed more upregulated expression after twelve weeks than at six weeks (Figure-4F and 4f), although the SI group cannot recognize the margin between AF and NP cells. This indicates that there may have been apoptosis-mediated degradation in NP cells.
3.4. RT-PCR results
3.4.1. External fixator up-regulated autophagy-related gene expression
To examine catabolic gene expression, mRNA expression for beclin-1, LC3, and P62 were evaluated. Where beclin-1 showed up-regulated mRNA expression in the SI and EF groups after six and twelve weeks, but higher expression was observed after six weeks than at twelve weeks. However, after twelve weeks, the EF and SI groups showed down-regulated expression compared to six weeks, except for the SI group, which showed up-regulated expression (Figure-5).LC3 showed up-regulated mRNA expression in both groups after six weeks compared to the Ctrl group. After twelve weeks, the EF group showed a similar expression to six weeks, and the SI group showed no significant up-regulated expression compared to the Ctrl group (Figure-5).P62 showed less mRNA expression after six weeks in the SI group than in the Ctrl group, whereas the EF group showed significant up-regulation than the Ctrl group. In fact, after twelve weeks, P62 showed the highest mRNA expression in the EF group than in the Ctrl group, whereas no significant changes were found in the SI group compared to the Ctrl group. This indicates that the EF group accumulated the highest autophagy degradation material after six and twelve weeks, and showed the highest expression after twelve weeks (Figure 5).
These findings showed that the EF group induced more autophagy-related gene expression than the SI group. However, autophagy initiation gene expression was high in both the EF and SI groups but it was reduced after twelve weeks. Furthermore, the highest autophagy accumulating materials was found in the EF group compared to the SI group and it was elevated with increased compression duration.
3.4.2. Saline injection upregulated apoptosis-related gene expression
After six weeks, MMP-2 showed more down-regulated mRNA expression in the SI group than in the Ctrl group, but no significant change was found in the EF group compared to the Ctrl group. However, after twelve weeks, MMP-2 showed the highest mRNA expression in both groups compared to the Ctrl group, but the maximum mRNA expression was recognized in the EF group than in the SI group (Figure-5).MMP-3 showed elevated mRNA expression in both groups after six weeks, but the SI group showed more expression than the EF group. After twelve weeks, higher mRNA expression was found in both groups than in the ctrl group, but the SI group showed higher mRNA expression than the EF group. This indicates that the SI group expressed more apoptosis-related genes and reached a peak position after six weeks than at twelve weeks (Figure-5). After six weeks, TIMP-1showed no significant changes in the SI group compared to the Ctrl group, but the EF group showed significant up-regulation compared to the Ctrl group. After twelve weeks, significant uppermost mRNA expressions were recognized in both groups, but the EF group showed higher mRNA expression than the SI group. This indicates that TIMP-1 showed the highest protective approach against the EF group of MMP3 (Figure-5).
The above evidence shows that the highest amount of apoptotic-related genes were expressed in the SI group, whereas the EF group showed the lowest expression.TIMP-1 and MMP3 mRNA expression were inversely correlated and mRNA expression of MMP2 was proportionally correlated with TIMP-1.
4. Discussion
A large number of research has been conducted on IVDD disease, but it remains indistinct. Several factors may play a role in the pathogenesis of IVDD, such as nutrition, age, mechanical force, and others [1,5,20]. From these contributing factors, it has been well-documented that mechanical pressure is a crucial enhancer for IVDD [3,11,21]. Furthermore, it has also been mentioned that the degeneration of NP cells is the key reason for IVDD, which can be up-regulated through compression [11,22]. Moreover, increasing compression may induce autophagy and apoptosis-mediated NP cell death[16,21]. Zhang et al. (2016) established that NP cell dysfunction is closely linked with IVDD. Some studies have also reported that apoptosis and autophagy-mediated disc degeneration causes low back pain [1,20,23]. This research examines the contribution of autophagy and apoptosis to IVDD after exposure toEF and SI and identified that insidious NP cell destruction in the EF and SI group could not differentiate the margin between NP and AF cells.
LC3, beclin-1, and P62 are key protein markers for autophagy identification because these markers are available when the autophagy pathway activates. Specifically, beclin-1 is expressed during the initiation stages of autophagy pathway, LC3 is expressed during autophagolysome formation, and P62 isthe degradation material that becomes available in this pathway before degradation[24]. Beclin 1, the mammalian orthologue of yeast Atg6, has a crucial function in autophagy, a pathway of programmed cell survival, which is increased during periods of cell stress and extinguished during the cell cycle [22,25]. Several studies have mentioned that compression induces morphological changes, the expression of biochemical markers of autophagy in rat NP cells, and triggers autophagosome formation by LC3B expression [17,25,26].This study identified that there was higher and more laterally expressed Beclin-1 protein using EF. In addition, SI cannot differentiate the boundary between NP cells and AF cells. The highest and lateral LC3 expression was identified in EF after six weeks and twelve weeks. This indicates that there was no autophagy-mediated degradation in central NP cells. The EF group induced the highest and lateral P62 expression after six and twelve weeks, proving that there may have been lateral NP cell degradation.
NP cell apoptosis, senescence, and imbalance between matrix anabolism and catabolism are widely recognized as the main contributors to IVDD [20,27]. This study identified that MMP-2 expression was higher and central in the EF group. However, no significant changes were found for MMP-2 expression in the SI group, and it could not distinguish the margin between NP and AF cells. A higher and central expression of MMP-3 was observed in the EF group for six and twelve weeks, but a higher expression was observed after twelve weeks, than at six weeks. The expression of TIMP-1 was higher and expressed more centrally in six weeks. After twelve weeks, the expression was central down regulated. These results are consistent with the above-mentioned statement and suggest that more apoptosis-mediated degradation was present in central NP cells in the EF group. The apoptotic marker was highly expressed in central NP cells and upregulated after increasing the compression duration.
Both the SI and EF groups showed upregulated beclin-1 mRNA expression, but the SI group showed a more marked expression than the EF group after six weeks. Nevertheless, after twelve weeks, mRNA expression declined in both groups; therefore, EF and SI groups showed more expression than Ctrl. This indicates that the mRNA of beclin-1 was highly expressed immediately after getting compression, but decreased after increasing the compression duration. The EF group showed higher LC3 mRNA expression than the SI group. However, surprisingly, more upregulated P62 mRNA expression was found in the EF group than in the SI and Ctrl groups at all times. This suggests that the maximum autophagy material was accumulated but not destroyed. This result shows an inconsistent relationship between LC3 and P62/SQSTM1,an adaptor protein in autophagosome degradation, unlike in vitro conditions. The inconsistency between in vitro and in vivo expression patterns of LC3 and P62/SQSTM1 should be distinguished. Unlike in vitro conditions, autophagy is stimulated as LC3 inclines and P62/SQSTM1 declines under serum deprivation [24].However, in vivo decreases in LC3 and P62/SQSTM1 under static compression do not necessarily indicate autophagy deficiency. Decreased LC3 indicates reductions in autophagosome formation and maturation, resulting in the loss of autophagic potential [3,28]. Meanwhile, decreased P62/SQSTM1 may reflect severely degenerated conditions after impaired autophagy by unphysiological mechanical pressure [3,29].
Apoptosis is crucial to cell death and is linked with characteristic morphological changes, including the formation of membrane blebs, apoptotic bodies, chromatin and nuclear condensation, and DNA fragmentation [12,30]. It is well known that tissue inhibitor of metalloproteinases-1 (TIMP-1) has anti-apoptotic activity which can enhance cell growth [31,32]. Furthermore, some data has been published that matrix metalloproteinase (MMP) members have a major role in cell apoptosis in disc degeneration. During apoptosis, MMP members are required to remodel the cell matrix, and cell-to-cell contact with balancing the extracellular matrix is also interlinked with apoptosis [33,34]. In this study, down-regulated mRNA expression was observed for MMP-2 after six weeks in the SI group, and no significant changes were found in the EF group. However, after twelve weeks, the EF and SI groups showed up-regulated MMP-2 expression and the EF group showed higher expression than the SI group. Up-regulated mRNA expression was observed for MMP-3 in six and twelve weeks, but the expression decreased after twelve weeks compared to 6 weeks. In both cases, the SI group showed more over-expression than the EF group. This indicates that apoptotic-promoting mRNA expression was more elevated in the SI group than in the EF group. mRNA expression of TIMP-1 was up-regulated in the EF group, but no significant change was identified in the SI group after six weeks. After twelve weeks, TIMP-1 expression was elevated in both the EF and SI groups, but the EF group showed more expression than the SI group. This evidence shows that the anti-apoptotic gene was induced more in the EF group than in the SI group because there is more time to deal with the early degeneration process in the EF group. This proves that compression induces apoptotic gene expression and elevates the expression along with the increasing duration of compression. Although MMP-2 showed some anti-apoptotic activity, that was not unusual because some studies have reported that MMP-2 has anti-apoptotic activity [35]. Therefore, this result was consistent with the previously reported results.
Using a limited number of rats was the major limitation of this study. Another limitation was that rats are not a standard working animal model, so the disc degeneration process does not match with the human discs’ condition. More extensive investigation is to be required to identify the root cause of increasing the P62 protein expression after compression in vivo. There may be another halting mechanism that needs to be investigated. In addition, SI could not give us accurate data to prove whether there was central NP cell death or AF cell death.
5. Conclusions
The external fixator of the disc degeneration model is the better method for studying autophagy and apoptosis because it induces NP cell degradation by the lateral expression of autophagy and the central expression of apoptosis. In addition, the saline injection method may not be ideal for simultaneously studying autophagy and apoptosis because it cannot distinguish the boundary between NP cells and AF cells. Thus, saline injection may degenerate the discs too fast, that is why it sometimes loses the initial degeneration process too early.
Acknowledgments
This work has been supported by The Catholic University of Korea Daejeon St. Mary's Hospital, Clinical research institute (No.: CMCDJ-A-2022-016) and funded by The Catholic University of Korea Daejeon St. Mary's Hospital.
Conflicts of Interest
The authors declare no conflict of interest.
References
- Quan, M., et al., Relationships Between Disc Degeneration and Autophagy Expression in Human Nucleus Pulposus. Orthop Surg, 2020. 12(1): p. 312-320. [CrossRef]
- Zhang, S., et al., Quercetin Alleviates Intervertebral Disc Degeneration by Modulating p38 MAPK-Mediated Autophagy. Biomed Res Int, 2021. 2021: p. 6631562. [CrossRef]
- Yurube, T., et al., Involvement of Autophagy in Rat Tail Static Compression-Induced Intervertebral Disc Degeneration and Notochordal Cell Disappearance. Int J Mol Sci, 2021. 22(11). [CrossRef]
- Banala, R.R., et al., The Anti-Inflammatory and Cytoprotective Efficiency of Curvularin, a Fungal Macrolactone against Lipopolysaccharide-Induced Inflammatory Response in Nucleus Pulposus Cells: An In Vitro Study. Asian Spine J, 2021. 15(2): p. 143-154. [CrossRef]
- Andersson, G.B., Epidemiological features of chronic low-back pain. Lancet, 1999. 354(9178): p. 581-5. [CrossRef]
- Rajasekaran, S., et al., Proteomic Signature of Nucleus Pulposus in Fetal Intervertebral Disc. Asian Spine J, 2020. 14(4): p. 409-420. [CrossRef]
- Baldia, M., et al., Development of a Unique Mouse Intervertebral Disc Degeneration Model Using a Simple Novel Tool. Asian Spine J, 2021. 15(4): p. 415-423. [CrossRef]
- Zhao, L., et al., Hydrogen peroxide induces programmed necrosis in rat nucleus pulposus cells through the RIP1/RIP3-PARP-AIF pathway. J Orthop Res, 2018. 36(4): p. 1269-1282. [CrossRef]
- Che, H., et al., p16 deficiency attenuates intervertebral disc degeneration by adjusting oxidative stress and nucleus pulposus cell cycle. Elife, 2020. 9. https://doi.org/10.7554/eLife.52570.
- Yurube, T., et al., Notochordal cell disappearance and modes of apoptotic cell death in a rat tail static compression-induced disc degeneration model. Arthritis Res Ther, 2014. 16(1): p. R31. [CrossRef]
- Yurube, T., et al., Autophagy and mTOR signaling during intervertebral disc aging and degeneration. JOR Spine, 2020. 3(1): p. e1082. [CrossRef]
- Zhang, F., et al., Molecular mechanisms of cell death in intervertebral disc degeneration (Review). Int J Mol Med, 2016. 37(6): p. 1439-48. [CrossRef]
- Zhao, C.Q., L.S. Jiang, and L.Y. Dai, Programmed cell death in intervertebral disc degeneration. Apoptosis, 2006. 11(12): p. 2079-88. [CrossRef]
- Ding, F., Z.W. Shao, and L.M. Xiong, Cell death in intervertebral disc degeneration. Apoptosis, 2013. 18(7): p. 777-85. [CrossRef]
- Chen, S., et al., RIPK1/RIPK3/MLKL-mediated necroptosis contributes to compression-induced rat nucleus pulposus cells death. Apoptosis, 2017. 22(5): p. 626-638. [CrossRef]
- Chen, S., et al., Critical contribution of RIPK1 mediated mitochondrial dysfunction and oxidative stress to compression-induced rat nucleus pulposus cells necroptosis and apoptosis. Apoptosis, 2018. 23(5-6): p. 299-313. [CrossRef]
- Tsujimoto, R., et al., Involvement of autophagy in the maintenance of rat intervertebral disc homeostasis: an in-vitro and in-vivo RNA interference study of Atg5. Osteoarthritis Cartilage, 2022. 30(3): p. 481-493. [CrossRef]
- Yu, L., Y. Chen, and S.A. Tooze, Autophagy pathway: Cellular and molecular mechanisms. Autophagy, 2018. 14(2): p. 207-215. [CrossRef]
- Elliott, D.M., et al., The Effect of Relative Needle Diameter in Puncture and Sham Injection Animal Models of Degeneration. Spine, 2008. 33(6): p. 588-596. [CrossRef]
- Kang, L., et al., Restoration of Autophagic Flux Rescues Oxidative Damage and Mitochondrial Dysfunction to Protect against Intervertebral Disc Degeneration. Oxid Med Cell Longev, 2019. 2019: p. 7810320. [CrossRef]
- Ma, K.G., et al., Autophagy is activated in compression-induced cell degeneration and is mediated by reactive oxygen species in nucleus pulposus cells exposed to compression. Osteoarthritis Cartilage, 2013. 21(12): p. 2030-8. [CrossRef]
- Kang, R., et al., The Beclin 1 network regulates autophagy and apoptosis. Cell Death Differ, 2011. 18(4): p. 571-80. [CrossRef]
- Ma, K., et al., Mechanisms of endogenous repair failure during intervertebral disc degeneration. Osteoarthritis Cartilage, 2019. 27(1): p. 41-48. [CrossRef]
- Yurube, T., et al., Serum and nutrient deprivation increase autophagic flux in intervertebral disc annulus fibrosus cells: an in vitro experimental study. Eur Spine J, 2019. 28(5): p. 993-1004. [CrossRef]
- Carames, B., et al., Autophagy is a protective mechanism in normal cartilage, and its aging-related loss is linked with cell death and osteoarthritis. Arthritis Rheum, 2010. 62(3): p. 791-801. [CrossRef]
- Kakiuchi, Y., et al., Pharmacological inhibition of mTORC1 but not mTORC2 protects against human disc cellular apoptosis, senescence, and extracellular matrix catabolism through Akt and autophagy induction. Osteoarthritis Cartilage, 2019. 27(6): p. 965-976. [CrossRef]
- Li, Y.X., et al., Nucleus pulposus cells degeneration model: a necessary way to study intervertebral disc degeneration. Folia Morphol (Warsz), 2022. [CrossRef]
- Runwal, G., et al., LC3-positive structures are prominent in autophagy-deficient cells. Sci Rep, 2019. 9(1): p. 10147. [CrossRef]
- Gruber, H.E., et al., Autophagy in the Degenerating Human Intervertebral Disc: In Vivo Molecular and Morphological Evidence, and Induction of Autophagy in Cultured Annulus Cells Exposed to Proinflammatory Cytokines-Implications for Disc Degeneration. Spine (Phila Pa 1976), 2015. 40(11): p. 773-82. [CrossRef]
- Jiang, L., et al., Apoptosis, senescence, and autophagy in rat nucleus pulposus cells: Implications for diabetic intervertebral disc degeneration. J Orthop Res, 2013. 31(5): p. 692-702. [CrossRef]
- Kandasamy, A.D., et al., Matrix metalloproteinase-2 and myocardial oxidative stress injury: beyond the matrix. Cardiovasc Res, 2010. 85(3): p. 413-23. [CrossRef]
- Ghoshal-Gupta, S., et al., TIMP-1 downregulation modulates miR-125a-5p expression and triggers the apoptotic pathway. Oncotarget, 2018. 9(10): p. 8941-8956. [CrossRef]
- Lao, G., et al., Human tissue inhibitor of metalloproteinases-1 improved wound healing in diabetes through its anti-apoptotic effect. Exp Dermatol, 2019. 28(5): p. 528-535. [CrossRef]
- Kim, E.M., et al., Matrix metalloproteinase-3 is increased and participates in neuronal apoptotic signaling downstream of caspase-12 during endoplasmic reticulum stress. J Biol Chem, 2010. 285(22): p. 16444-52. [CrossRef]
- Shapiro, S., et al., Different activation forms of MMP-2 oppositely affect the fate of endothelial cells. Am J Physiol Cell Physiol, 2010. 298(4): p. C942-51. [CrossRef]
Figure 1.
Experimental schematic diagram of this study for autophagy and apoptosis.

Figure 5.
mRNA expression for the EF group, SI group, and Ctrl group after 6 weeks and 12 weeks (level of significance is * P < 0.05, ** P < 0.05, *** P< 0.05, and ****P< 0.05). (1).Autophagy-related gene mRNA expression was highly expressed in the EF group whereas the SI group showed less expression but higher than the Ctrl. (2) Apoptosis-related gene mRNA expression; the SI group showed maximum mRNA expression whereas the EF group showed less expression but significantly higher than the Ctrl.
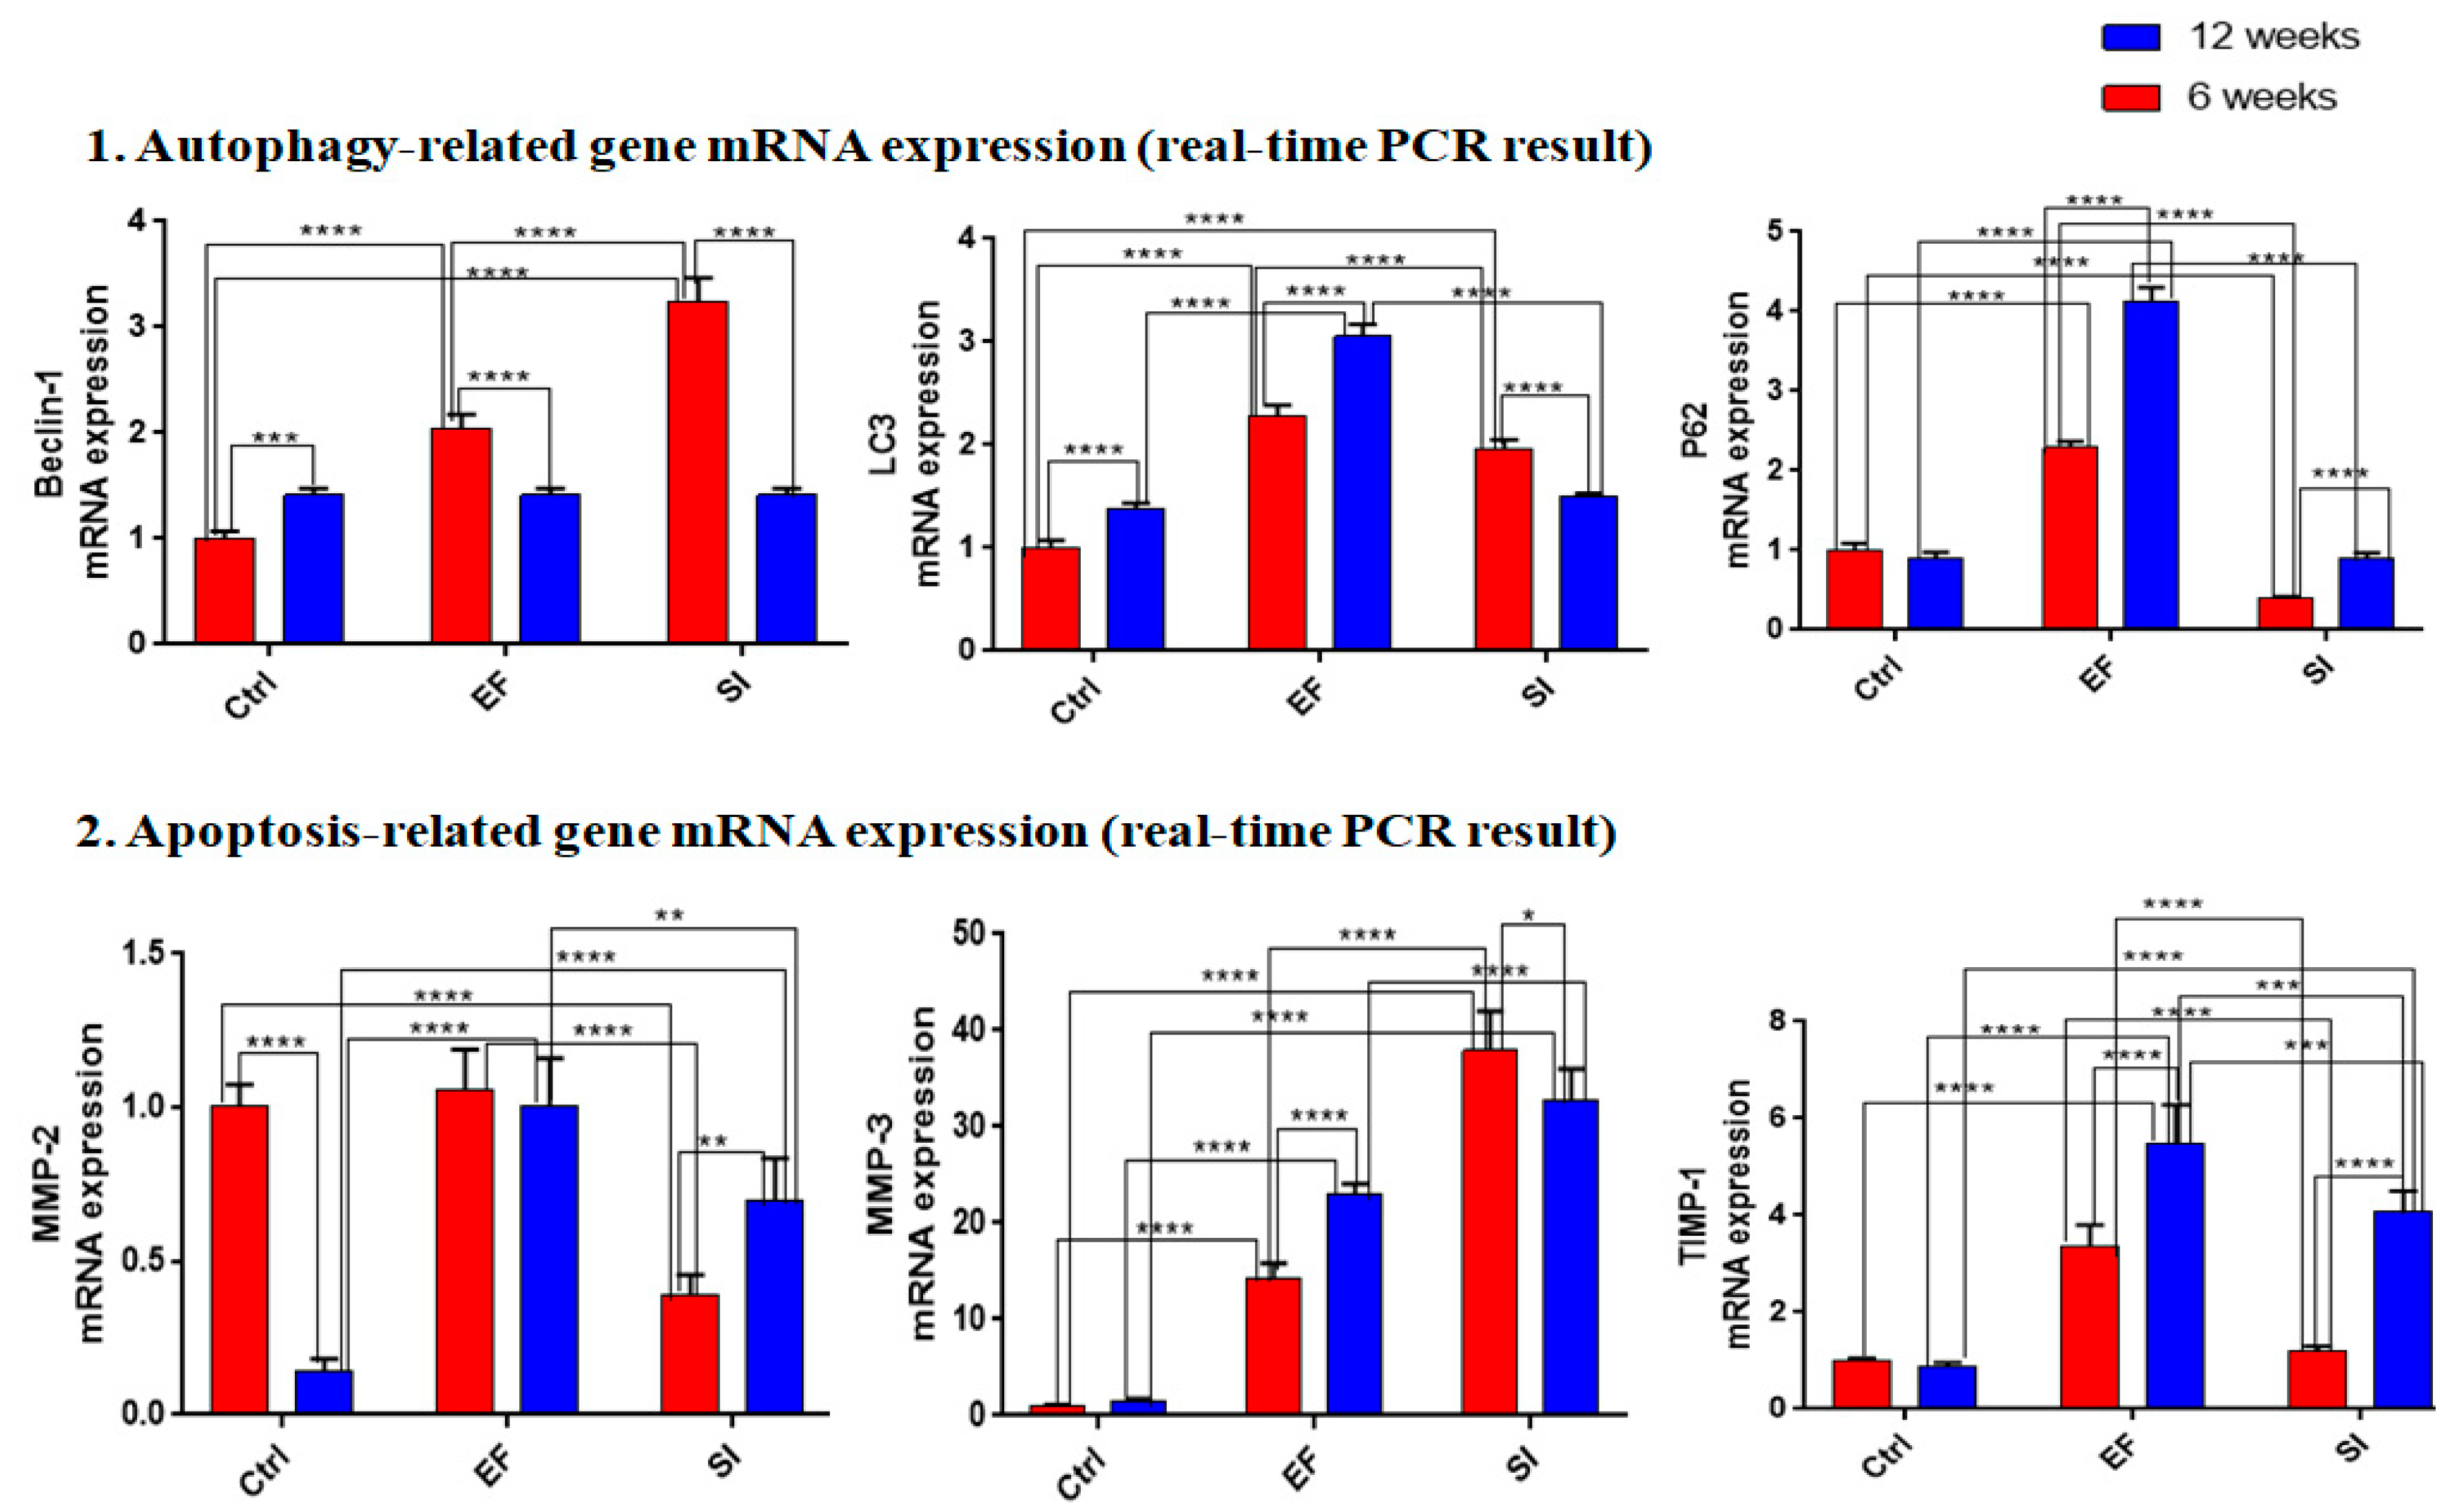

Table 1.
List of primers.
| Primer name | Primer sequence |
|---|---|
| LC3 | Forward 5′-CCTGCTGCTGGCCGTAGT-3′ Reverse 5′ -TGATGAAGTCTTCCTGCCAAAA-3′ |
| Beclin-1 | Forward 5′ -TTCAAGATCCTGGACCGAGTGAC-3′ Reverse 5′ -AGACACCATCCTGGCGAGTTTC-3′ |
| P62 | Forward 5′ -TCCCTGTCAAGCAGTATCC-3′ Reverse 5′ -TCCTCCTTGGCTTTGTCTC-3′ |
| MMP2 | Forward 5′ -GACCTTGACCAGAACACCATCG-3′ Reverse 5′ -GCTGTATTCCCGACCGTTGAAC-3′ |
| MMP3 | Forward 5′ -TTTGGCCGTCTCTTCCATCC-3′ Reverse 5′ -CTGCTGGGTGGTAACTCTT-3′ |
| TIMP1 | Forward 5′ -CTGTTCCCACTCCCATCTTT-3′ Reverse 5′ -CTGCTGGGTGGTAACTCTT-3′ |
| GAPDH | Forward 5′-GTATCGGACGCCTGGTTAC-3′ Reverse 5′-CTTGCCGTGGGTAGAGTCAT-3′ |
Disclaimer/Publisher’s Note: The statements, opinions and data contained in all publications are solely those of the individual author(s) and contributor(s) and not of MDPI and/or the editor(s). MDPI and/or the editor(s) disclaim responsibility for any injury to people or property resulting from any ideas, methods, instructions or products referred to in the content. |
© 2023 by the authors. Licensee MDPI, Basel, Switzerland. This article is an open access article distributed under the terms and conditions of the Creative Commons Attribution (CC BY) license (http://creativecommons.org/licenses/by/4.0/).
Copyright: This open access article is published under a Creative Commons CC BY 4.0 license, which permit the free download, distribution, and reuse, provided that the author and preprint are cited in any reuse.


