
Submitted:
18 March 2023
Posted:
21 March 2023
You are already at the latest version
Abstract
Prevalence of malnutrition among children under five is alarmingly high in Pakistan. However, there are ready-to-use therapeutic foods (RUTF) available which may be used to treat children with severe acute malnutrition (SAM). This study aims to assess the efficacy of prebiotics as a synergistic additive to RUTF to enhance blood parameters and anthropometric measurements in children with uncomplicated SAM living in Southern Punjab, Pakistan. A double-blind parallel treatment randomized controlled trial was conducted on 204 children aged between 6-59 months. Participants were randomized and allocated to the placebo (n=102) and experimental arms (n=102) at a 1:1 ratio. One group of children were provided RUTF and 4 g prebiotics, while the other group were given RUTF and starch as a placebo. Participants recruited for both arms were given treatment for eight weeks, and then their biochemical and anthropometric outcomes were evaluated. A substantial difference between the mean weight, mid upper arm circumference, haemoglobin, haematocrit, platelet count, mean corpuscular volume, mean corpuscular haemoglobin, and albumin was revealed. Conclusively, supplementation with RUTF and prebiotics has proven to be an efficient, effective and safe therapy for children suffering from SAM to improve their growth and development indicators and reduce the dangers of malnutrition in comparison to RUTF alone.
Keywords:
RUTF
; prebiotics
; SAM
; CMAM
; malnourishment
1. Introduction
Undernutrition is a rising cause of compromised health and untimely death in children under five, particularly in developing and underdeveloped countries. Malnutrition has serious and long-term effects on the developmental, social, economic, and medical aspects of individuals, families, communities, and countries at large. Children who experience severe acute malnutrition (SAM) are at more significant risk of lasting and adverse effects on their physical and mental health (Galler et al., 2021), which can negatively impact on economic and disease burden (Lokuruka, 2020). Sustainable Development Goals 1 and 2 address the eradication of poverty and hunger in susceptible populations. However, these issues still exist in the majority of low- and middle-income countries.
Compared to other developing countries, Pakistan ranks among the worst in the prevalence of malnutrition in children under five years of age (Saleem et al., 2021), causing high rates of infant as well as under-five mortality rates. According to the estimates of the Government of Pakistan, the infant mortality rate is 57 deaths per 1,000 live births, while the under-five mortality rate is 65.2 deaths per 1,000 live births. It is estimated that malnutrition is responsible for the deaths of approximately 3 million children under five years of age per annum (UNICEF/WHO/WORLD BANK, 2021; UNICEF, 2023).
To combat the risk of malnutrition in children under five and its associated long-term effects, a public health intervention named community-based management of severe acute malnutrition (CMAM) has been initiated in Pakistan in 2011. The mainstay of this program is the early detection of SAM children and the provision of basic health care and ready-to-use therapeutic food (RUTF) for the management of uncomplicated SAM children. Research indicates the effectiveness of RUTF for treating SAM children across different parts of the world, including Pakistan (Schoonees et al., 2019; Shokry et al., 2020). However, the WHO has encouraged nutritional scientists and researchers to find different complementary therapies that could be utilized with the administration of RUTF among uncomplicated SAM children to enhance their developmental processes and weight gain.
Recent studies have revealed the gut microbiota to be a significant contributor to undernutrition (Iddrisu et al., 2021). Children who encounter diarrhoea at an early age might experience impairment in the composition of their gut microbiota, which can result in continuous diarrhoea, leading to growth faltering and reduced absorption of important nutrients. Therefore, prebiotics and probiotics can be used to support the gut microbiota and reduce diarrhoea and malnutrition (Bandsma et al., 2019). In addition, some studies have shown that prebiotic and probiotic supplementation plays a significant role in improving growth and weight gain parameters among infants who are born underweight (Iddrisu et al., 2021; Nuzhat et al., 2023). The antimicrobial and anti-inflammatory properties of prebiotics and probiotics (Dahiya & Nigam, 2022) contribute as a complementary factor that may enhance response to standard therapy given to uncomplicated SAM children who are also struggling with systematic inflammation and infections associated with it.
Therefore, using prebiotics as an additional component in the treatment of uncomplicated SAM children can be provided with a cost-effective approach to the prevention and treatment of SAM children. Fortifying the microbiota with prebiotics could enhance energy and may protect against diarrhoea. To our knowledge, randomized controlled trials (RCTs) assessing the role of prebiotic supplementation in children with SAM have not been conducted in Pakistan until now. Therefore, clinical evidence is lacking and the topic of concern cannot be translated into clinical practice until scientific evidence has been generated, for which the present study has been established. The main focus of the present study is to determine whether the addition of prebiotics to a standard RUTF will improve treatment outcomes (nutritional and clinical) in children affected by uncomplicated SAM.
2. Materials and Methods
Study Design and Setting
A double-blind parallel treatment randomized placebo-controlled clinical trial was conducted to determine whether the addition of prebiotics to a standard RUTF will improve treatment outcomes in children less than five years of age affected by uncomplicated SAM. The present study was conducted in the southern Punjab region of Pakistan, as approximately 43% of the region’s population lives below the poverty line. The “National Program for Family Planning and Primary Health Care” manages 52 functional outpatient treatment centers (OTPs) in the Dera Ghazi Khan (DGK) district of south Punjab. The OTP center of the teaching hospital in DGK was chosen to enrol children with SAM since this city connects all four provinces of Pakistan and is the primary hospital with the OTP center where patients come for treatment.
The chosen study location is underdeveloped, has inadequate socioeconomic housing due to poverty and illiteracy, is overcrowded, and has unsanitary living circumstances. DGK’s population comprises a tri-ethnic mix of natives (non-Baloch), Baloch, and Indian migrants (Muhajirs). The most underdeveloped region of southern Punjab is frequently impacted by floods and hill torrents. Children between the ages of 6–59 months suffering from SAM without complications living in district DGK were selected as the population of the present study.
Predefined inclusion and exclusion criteria were used to recruit participants with 1:1 allocation ratio in both arms: Only clinically well children who are alert and have a good appetite were screened for possible recruitment after parental consent. Children with grade 1–2 bilateral edema and a weight-for-height z-score of -3 or mid upper arm circumference (MUAC) of 11.5 cm that are otherwise clinically healthy, aware, and with a decent appetite are classified as SAM children by the WHO. Children with any complications of SAM (i.e., acute lower respiratory infection or hypoglycemia, high pyrexia, hypothermia, anorexia, severe pitting edema and severe dehydration) were excluded from the study.
Sample Size
A sample size of 158 participants (79 in each arm) was calculated using the formula given below.
Where p1 is the success percentage in the control group, and p2 is the success percentage in the experimental group. We anticipated that 76% of children in the control arm would gain more weight than 15% of their baseline weight at 60 days. To detect a 16% absolute increase (to 92%) in the proportion of kids gaining >15% weight at 60 days in the intervention arm with 80% power at 5% significance level, this was the bare minimum number of samples needed to complete follow-up.
This calculated sample size was increased to a total of 194 participants to account for attrition due to death and loss of follow-up by assuming a 25% international acceptable standard for the CMAM program, >75% recovery rate, 15% default rate, and 10% death rate. Therefore, the total sample size of the present study, calculated and adjusted, is 194 participants (97 participants per arm).
Screening of Participants
Children between the ages of 6 and 59 months with a MUAC of 11.5 cm or z-score of weight-for-height −3SD were found in the community through a door-to-door survey with the agreement of the district chief executive officer utilizing lady health workers of the selected area. Children were inspected by female health workers using MUAC tape marked with a specific colour. To confirm SAM, they referred all children who met the requirements of the CMAM program to an outpatient therapeutic program for assessment by a competent nutrition staff nurse.
Parents who agreed to enrol their children were then assessed further. At the first stage, children were evaluated for complications. A particular test was conducted to gauge the child’s hunger. The mother of the infant was given a RUTF sachet and instructed to give it to the child with lots of water. The child must consume at least one-third of a packet of RUTF to meet the requirement for a good appetite. The medical professional observed the child. The child was referred for inpatient treatment and excluded from the research if they did not consume at least one-third of a packet of RUTF (3 teaspoons equals 30 g) after three feeding attempts. This is a reliable method for assessing the child’s appetite; if they can eat half or more, it indicates a good appetite.
A detailed history and medical examination were taken to assess the child’s health. Children suffering from high-grade fever, shortness of breath, severe vomiting, and edema or looked lazy, apathetic or unconscious or had seizures were excluded from the study trial and referred to a stabilization center for further treatment. Children with a history of recent watery diarrhoea associated with eyelid retraction, absence of urinary output and tears with cold peripheries and lethargy were diagnosed with severe dehydration. They were also excluded from the study trial. Children were assessed for anaemia, and those whose palms were very pale, gave a white look, were diagnosed with severe anaemia and were also not enrolled for the administration of RUTF (Guideline, 2013) in the present trial.
Children were assessed for the presence of pitting edema, and thumb pressure was applied to the ankle for three seconds. If a thumb impression remained for a few seconds on both feet, edema was graded as mild (Grade 1, affecting both feet/ankles), moderate (Grade 2, affecting both feet, plus lower legs, hands and lower limbs) or severe (Grade 3, generalized edema including both feet, plus legs, arms and face). Therefore, children suffering from severe pitting edema (Grade 3) were excluded from the trial. Vital signs (temperature, pulse and respiratory rate) of the child were also recorded: Children suffering from hypothermia or who had a high temperature (axillary temperature <35°C or >39°C, respectively) were excluded from the trial. Children with >50 breaths per minute, chest in-drawing, wheeze or strider were classified as having a likely acute lower respiratory infection and were not included in the trial. To check hypoglycemia, a heel finger-prick was performed by using a Dextrostix reagent strip. A glucose concentration of <3 mmol/l was considered hypoglycemic, and such children were not enrolled in the trial.
Baseline (pretest) Assessment
Children with uncomplicated SAM were then enrolled in the study and underwent baseline assessment. Sociodemographic, anthropometric measurements including MUAC and blood samples were collected from the randomized participants. Age-related information was recorded from the antenatal record in case of hospital-based delivery. However, when giving birth at home, the maternal report was used to obtain age-related information. Weight and MUAC were measured by an outpatient trained staff nurse. Recommended procedures and apparatus were used for measurements. Double measurements were taken, however, in case of any difference between both of the measurements, additional measurements were made until an exact value was obtained.
The children’s weight was assessed and recorded by UNISCALE (de Onis, Onyango, Van den Broeck, Chumlea & Martorell, 2004) to the nearest 10 g unclothed or in very light clothing. The scale was adjusted and calibrated to zero before each measurement. For infants and children who could not stand, the UNISCALE was used to measure the mother’s weight first. The mother was then handed the undressed baby/child while standing on the scales, and the combined weight of the mother and baby was measured. The difference between the two readings was used to calculate the baby/child’s weight.
The MUAC of each child was measured with colour-labelled MUAC tape to the nearest 0.1 cm, the midpoint between the olecranon process and the acromion process. Children’s arms were measured with care, with the upper arm bent and exposed until the shoulder and the lower arm resting transversely on the stomach while looking straight ahead. The elbow’s top bone tip and the top of the shoulder were identified, and the distance between the two tips was measured and divided by two to obtain the midpoint. The tape was applied across the arm at the designated midpoint and comfortably wrapped the arm without being either too tight or too loose. To evaluate and classify the nutritional status of children, MUAC was assessed. For data related to ethnicity and residence, mother’s verbal history was taken into account.
Intervention
All children fulfilling the inclusion criteria were enrolled for eight weeks in the study and were allocated to either the placebo or experimental group with a 1:1 allocation ratio. Children blindly allocated to the experimental group were given RUTF with 4 g of prebiotic, while those to placebo group were given RUTF with starch. Prebiotic galacto-oligosaccharides, Vivinal GOS powder having degree of polymerization between 2–10, were procured from Friesland Campina, Netherlands. The sachet contains galacto-oligosaccharides in 4 g. RUTF was procured from the IRMNCH program from DGK Division, and starch as a placebo was taken from the market.
RUTF was handed over to the parents, and the quantity of the RUTF sachets was given according to the requirement and the child’s body weight. Two sachets were given to a child with a weight of 5–6.9 kg in a day/week, three sachets were given to a child weighing 7–9.9 kg in a day/week, and four sachets were given to a child with a weight less than or equal to ten kg in a day/week. The training staff educated the parents about the importance of the RUTF and directed them on how to feed the child, and then sachets were given to parents. In the intervention arm of the trial, participants received a daily dose of prebiotics in such a way that prebiotics (4 g) were mixed with milk and water with the start of RUTF on the same day. Medicated sachets were packed in the clear cover and sealed by the manufacturer. On the other hand, in the control arm of the trial, participants received a placebo in a transparent sachet daily in such a way on the same day RUTF started, and 4 g of placebo mixed with water and milk was also given to the participants. Medicated sachets were packed and covered with plastic by the registered pharmacist at the pharmacy of Teaching Hospital, DGK District. Active and placebo-medicated sachets with unique identity numbers were placed in a sterile environment and a dry place for up to eight weeks, as recommended by the manufacturer.
Outcomes
The primary outcome measure of the present study was the proportion of individuals gaining weight more than 15% of their baseline weight at the end of the two-month follow-up period. The proportion of individuals with anaemia at two months and the mean serum levels of haemoglobin (Hb), haematocrit (HCT), mean corpuscular volume (MCV), mean corpuscular haemoglobin (MCH), platelets and serum albumin at two months were the study’s secondary endpoints. Mortality and severe adverse events (SAEs) were considered as safety endpoints in this study.
Randomization and blinding
In the process of randomization and allocation to study groups, the statistician generated the random allocation sequence in an Excel spreadsheet. Equal numbers ranging from 1 to 200 were allocated to the placebo and active groups. No block size, stratification or any other kind of limitations were applied. All the sachets of study medication, including both placebo and active study medication, were then labelled using the given sequence of a number along with the study number by study pharmacy of the teaching hospital of DGK. In the CMAM program, participants were enrolled and allocated consecutive identity numbers as per the sequence marked by the teaching pharmacy and then marked. An identification number was provided with the supplied sachets of placebo medication.
The sachets were prepared and transported to the study site within seven days. CMAM enrolment cards allocated to the already enrolled children in the hospital are assigned identity numbers. After this, the study medication that the pharmacy department prepared was given to the participants with the assigned identity number. A child with their whole identity number was provided with the sachet either containing a placebo (containing starch) or the treatment (oligosaccharides or prebiotics). First, the sachet tagged with a particular identity number was verified and recorded on the CMAM enrolment card. Second, the identity number was confirmed again before giving the sachet to the particular child.
The staff nurses and health workers allocated the study participants and the parents/guardians were blinded from the study intervention. All the sachets, whether containing placebo or active medication, were identical to the plastic sachet and had identical texture and appearance.
Medications during the study period for any comorbidity
According to the CMAM protocol (Guideline, 2013) the following medicine was allowed during the study period: a 7-day course of the antibiotic amoxicillin (60 g/kg/day/eight hourly) for children with a mild form of diarrhoea and other infections. Furthermore, a single dose of artesunate-amodiaquine combined therapy to treat children diagnosed with malaria was allowed, with syrup paracetamol if the child suffers from fever (temp >37.5°C). Children suffering from dehydration from diarrhoea can be given an oral rehydration solution made from ReSoMal (a rehydration solution for malnourished children).
Laboratory methods
WHO guidelines on drawing blood and best practices in phlebotomy were adopted for a sample collection of 2–3 ml of whole blood in a Lavender-top (EDTA) tube labelled with a patient unique number. The drawn blood sample was sent to a local laboratory to record baseline data related to blood cell morphology, including haemoglobin (Hb g/dl), haematocrit (HCT %), mean corpuscular volume (MCV fl), mean corpuscular haemoglobin (MCH pg), platelets and serum albumin (g/dL). The complete blood count analysis was performed using sysmax XN 1000, Japan and the albumin analysis were performed on Alinity Ci series, Abbot, USA.
Follow-up assessment
Study participants were given CMAM enrolment cards. Parents of the children were advised to visit OTPs weekly for eight weeks for follow-up checkups. Lady health workers helped mothers or other family members to bring children for their routine visits in the study OTPs where the nutritional supervisor evaluated the child’s overall health. The child’s health was assessed weekly in the center and was evaluated if there were any medical and nutritional complications as per the standard practice and protocol. The need to refer to the tertiary care hospital in case of any serious adverse events was also assessed. However, no such case was reported in any participant during the study period. The nurses gave the parents RUTF based on the child’s weight using a CMAM OTP chart. Parents were urged to follow up with their children for a health and nutritional status check on the seventh day. The benefits of feeding a child a healthy diet were also discussed with the mother. During the trial duration in the outpatient centers, parents were appreciated and encouraged to bring their child to the center for any ailment, and treatment given to the child was free for the study participants. All participants’ 3 ml blood samples were also taken at the 2-month follow-up for biochemical analysis and were sent to the local lab for calculating the blood cell morphology. Developmental and physical health examinations and anthropometry were also performed again after two months: CMAM health workers who did not know the allocation procedure assessed the anthropometric measurements.
Statistical analysis
SPSS version 25 was used for data entry, cleaning and analysis. Frequencies, percentages, and mean± standard deviation (SD) were calculated to demonstrate descriptive analysis. Furthermore, the skewness of data was checked. All the quantitative variables were normally distributed; paired sample t-tests were used to evaluate the difference between the outcome measures in the treatment group before and after the treatment, and independent sample t-tests were used to evaluate the difference between the outcome measures of both arms of the trial, i.e., placebo and treatment. All tests were applied at a 95% confidence interval (CI) considering a p-value ˂0.05 as a significant value. No interim analysis was planned for this study.
Ethical considerations
The Advanced Study Research Board at University of Punjab approved the study (reference D/No 150/Acad). Written informed consent was obtained from the parents of the children enrolled in the present study. The present study is registered in ClinicalTrial.gov under trial number NCT05390437.
Timeline of the study
Children were started to recruit in the study trial from November 2020 to September 2021. The follow-up period was completed in December 2021, followed by data entry, cleaning analysis and report writing.
To enrol 97 participants in each arm, a total of 256 children were screened for eligibility criteria. A few more participants were recruited in each arm to compensate in case of attrition due to loss of follow-up. The diagram below shows 107 and 106 participants recruited in the control and prebiotic arms, respectively. However, the parents of two children in the control arm and the parents of three children in the prebiotic arm withdrew written consent. Three children from the control group and one from the prebiotic arm were lost in the follow-up. In the final data analysis, 204 children were included, 102 in each arm (Figure 1).
3. Results
Sociodemographic characteristics
The majority of children were male (52.9%), up to the age of 12 months (51.0%), Punjabi (60.3%), and resided in rural areas (63.7%). The precise frequencies and percentages are provided in Table 1.
Pre- and post- comparison of growth parameters for treatment group
Repeated measure design paired sample t-test was used to evaluate the effect of treatment of RUTF + prebiotics on different growth measures (weight, MUAC, HB, HCT, etc.) and to check whether the treatment is efficient. The analysis revealed that for pair 1, the weight of children (p < 0.001), pair 2 MUAC of the children (p < 0.001), pair 3 Hb of the children (p < 0.001), pair 6 MCV of the children (p < 0.001), pair 7 MCH of the children (p < 0.001), and for pair 8 albumins of the children (p < 0.001), before and after the treatment, the effect of treatment was significant. Furthermore, mean difference for all variables in paired sample t-test was negative (weight = −0.77696; MUAC = −0.71176; Hb = −0.80490; HCT = −8.96912; platelets count = −5.50980; MCV = −3.21912; MCH = −1.98873; albumin = −0.32549), which indicates that the mean value for all variables was increased post-intervention, i.e. supplementation of RUTF+ prebiotics (Table 2).
Differences between control and treatment group
Furthermore, the effect of RUTF and RUTF with prebiotics on uncomplicated SAM children’s growth and development indicators was analysed. The analysis showed the improvement of growth indicators of children enrolled in both the treatment and control groups, including their mean weight, MUAC, HB count, HCT count, platelet count, MCV count, MCH count and albumin. However, the mean growth parameters were significantly improved in the treatment group compared to the control group (Table 3).
Before the trial, there were no significant differences in the mean weight of the children for both groups. However, the analysis revealed that at the end of the trial, there was a significant difference in the mean weight of the children of the treatment group (mean weight = 6.53) and control group (mean weight = 5.89). Children enrolled in the treatment group gained approximately 20% of their baseline weight during the 2-month follow-up period of the trial (pre mean weight = 5.44 ± 1.35; post mean weight = 6.53 ± 1.45). However, for children enrolled in the control group, 8.5% of baseline weight was gained (pre mean weight = 5.43 ± 1.55; post mean weight = 5.89 ± 1.72), highlighting the significant role of RUTF with prebiotics on the weight of uncomplicated children (p = 0.005) (Table 3).
Similarly, the analysis revealed a significant difference between the MUAC (p = 0.001), HB (p < 0.001), HCT (p = 0.006), platelet count (p = 0.031), MCV (p < 0.001), MCH (p < 0.001) and albumin (p = 0.009) of children enrolled in the treatment and control groups post-trial, with children enrolled in the treatment group having larger mean MUAC (mean count = 10.80), HB count (mean count = 10.57), HCT count (mean count = 46.53), MCV (mean count = 74.35), MCH (mean count = 25.31) and albumin (mean count = 3.98). It can be concluded that although RUTF has a role in improving some of the growth parameters in uncomplicated SAM children, when RUTF is combined with prebiotics, more significant positive results can be achieved. The detailed analysis with mean values pre- and post-trial among the control and treatment groups with their significant p-values is given in Table 3.
Adverse Events
No actual or suspected adverse events were reported or arose during the trial duration.
4. Discussion
Malnutrition has serious and long-term effects on the developmental, social, economic, and medical aspects of individuals, families, communities, and countries at large. However, children are generally more vulnerable to wider consequences of any disruption (Shapira et al., 2021). Similarly, malnutrition is a significant contributor to various morbidities and, ultimately, mortality among children less than five years of age around the globe, with these numbers being more concerning in underdeveloped and developing countries such as Pakistan.
Considering the effects of malnutrition among children, the present study focuses on the role of RUTF individually and RUTF with prebiotics in improving the growth indicators of children with uncomplicated SAM. Likewise, past studies conducted on SAM among children revealed a high frequency of malnutrition among children in rural setting residencies (Smith, Ruel & Ndiaye, 2005). Our study also revealed that the majority of the participants resided in rural areas (63.7%). The reason behind the high frequency of malnutrition among children in rural areas could be because of compromised hygiene and sanitation conditions. Previous studies revealed a high prevalence of undernutrition among children living in compromised hygienic and sanitary conditions, even when they do not suffer from diarrhoea or intestinal worms (Humphrey, 2009). This is because the continuous absorption of faecal bacteria among children may result in a condition of environmental enteric, which in turn causes further complications, including inflammation of cells in the guts, poor villi functioning, leaking mucosa and malabsorption that ultimately results in body faltering (Burton et al., 2015). Other factors that predict poor nutrition and health statuses of children include nutritional intake and economic, cultural, demographic, social and environmental factors (Humphrey, 2009; Ngure et al., 2014a).
Different direct and indirect predictors of undernutrition among children under five years of age include different environmental factors, i.e., hygiene, poor sanitation and quality of drinking water, poor level of education of mothers, lack of access to healthcare services, poor child healthcare practices and food insecurity. According to the joint report of UNICEF, WHO and World Bank (UNICEF/WHO/WORLD BANK, 2021), infections linked with diarrhoea can interfere with the absorption of nutrients, which may negatively influence the immunity of children (Chase & Ngure, 2016; Ngure et al., 2014b) and can cause malnutrition among them. The treatment cost of diarrhoeal-associated infections may affect households and food budgets, and less food availability may result in insufficient nutrient intake and undernutrition among children under five years of age (Prüss-Ustün et al., 2014).
Moreover, the results of the present study showed an improvement in the growth indicators of children enrolled in both groups, i.e., the treatment and control groups, including their mean weight, MUAC, HB count, HCT count, platelet count, MCV count, MCH count and albumin level. However, the mean growth parameters were significantly improved in the RUTF and prebiotics groups compared to the RUTF only group. In echo with the findings of the present study, past studies on prebiotic supplementation also revealed a significant role of prebiotics in improving the growth and weight gain parameters among infants, especially those who were born underweight, as well as indicated to produce outcomes on the gut (Gibson et al., 2005). Likewise, some studies have also revealed significant improvements in Hb, HCT and white blood cell levels among children suffering from SAM with prebiotic supplementation. On the other hand, Nakamura and colleagues (2006) claimed no significant effect of prebiotics on the growth indicators of children suffering from malnutrition. However, the fact cannot be neglected that in the mentioned study, supplementation with an isotonic solution of prebiotics was administered individually, whereas in most of the studies, prebiotics were administered in combination with other conventional therapies.
Prebiotics are selectively fermentable dietary fibres, including galacto-oligosaccharides (GOS), fructo-oligosaccharides (FOS) and inulin, with positive and specific impacts on the microflora of the gut. Past studies have also shown that several prebiotics, including lactulose, are responsible for the management and control of the intestinal microbiota by triggering the selective growth of lactic acid bacteria (Li et al., 2021). Furthermore, using the protection that prebiotics provide, local bifido-bacteria and lactobacilli can also control intestinal infections by a chain of potential mechanisms. These microorganisms secrete metabolic end-products that help reduce the gut pH levels to such an extent that these pathogens are rendered completely ineffective. The findings of our study support the narrative that the antimicrobial and anti-inflammatory properties of prebiotics contribute as a complementary factor that results in the enhancement of response to standard therapy of RUTF given to uncomplicated SAM children.
The main strength of our study is that to the best of our knowledge, the present study is the first RCT conducted in Pakistan to evaluate the role of prebiotic (GOS) supplementation in combination with RUTF on the nutritional outcome of uncomplicated SAM children. Furthermore, data and anthropometric measures were collected by trained staff to minimize measurement bias and avoid missing data. Last, the study medication’s effect was observed to allow for 100% adherence. Although the present study is one of its kinds, there are some gaps in the present study that need to be mentioned here. On the one hand, the present study was conducted in a single district of the South Punjab region, i.e., DGK, where a significant portion of people live below the poverty line. Due to the homogenous living conditions of the children, the results of the present study may not be a good representation of children of the same age group in the country. The follow-up duration of the present study was short, highlighting only the short-term benefits of the treatment on the anthropometric measures and health indicators of SAM children and does not take into account the long-term benefits as well as the sustainability of the efficacy and effectiveness of the treatment. Therefore, there is a need to conduct future trial-based studies with a more extensive scope and more extensive follow-up period and focusing on both complicated and uncomplicated SAM children.
5. Conclusion
Conclusively, supplementation with RUTF and prebiotics has proven to be an efficient, effective and safe therapy for children suffering from uncomplicated SAM to improve their growth and development indicators and reduce the dangers of malnutrition. However, further longitudinal studies with longer follow-up periods are desirable to further evaluate the effect of RUTF and prebiotics on children’s growth and sustainability.
Author Contributions
Conceptualization, M.B., J.S. and R.Z.; Methodology, M.B., J.S., and R.Z.; Formal Analysis, M.B. and J.S.; Data Curation, M.B. and S.I.; Writing—Original Draft Preparation, M.B.; Writing—Review & Editing, J.S., R.Z., S.I., R.S., M.S.B., S.H. and F.F.; Supervision, R.Z. and F.F. All authors have read and agreed to the published version of the manuscript.
Funding
This research received no external funding.
Institutional Review Board Statement
The study was conducted according to the guidelines of the Declaration of Helsinki, and approves by the Advanced Study Research Board at University of Punjab approved the study (reference D/No 150/Acad).
Informed Consent Statement
Written informed consent was obtained from the parents of the children enrolled in the present study.
Data Availability Statement
Data is available from corresponding author upon reasonable request.
Conflict of Interest
The authors declare no conflict of interest.
References
- Bandsma RH, J.; Sadiq, K.; Bhutta, Z.A. Persistent diarrhoea: current knowledge and novel concepts. Paediatrics and International Child Health 2019, 39, 41–47. [Google Scholar] [CrossRef]
- Burton, M.J.; Rajak, S.N.; Hu, V.H.; Ramadhani, A.; Habtamu, E.; Massae, P.; Tadesse, Z.; Callahan, K.; Emerson, M.; Khaw, P.T.; Jeffries, D.; Mabey DC, W.; Bailey, R.L.; Weiss, A.; Holland, M.J. Pathogenesis of Progressive Scarring Trachoma in Ethiopia and Tanzania and Its Implications for Disease Control : Two Cohort Studies; 2015; pp. 1–23. [Google Scholar] [CrossRef]
- Chase, C.; Ngure, F.M. Multisectoral Approaches to Improving Nutrition: Water, Sanitation, and Hygiene. Wsp.Org, 20 February 2016; 42p. [Google Scholar]
- Dahiya, D.; Nigam, P.S. The Gut Microbiota Influenced by the Intake of Probiotics and Functional Foods with Prebiotics Can Sustain Wellness and Alleviate Certain Ailments like Gut-Inflammation and Colon-Cancer. Microorganisms 2022, 10. [Google Scholar] [CrossRef] [PubMed]
- Galler, J.R.; Bringas-Vega, M.L.; Tang, Q.; Rabinowitz, A.G.; Musa, K.I.; Chai, W.J.; Omar, H.; Abdul Rahman, M.R.; Abd Hamid, A.I.; Abdullah, J.M.; Valdés-Sosa, P.A. Neurodevelopmental effects of childhood malnutrition: A neuroimaging perspective. NeuroImage 2021, 231, 117828. [Google Scholar] [CrossRef] [PubMed]
- Gibson, G.R.; McCartney, A.L.; Rastall, R.A. Prebiotics and resistance to gastrointestinal infections. British Journal of Nutrition 2005, 93, S31–S34. [Google Scholar] [CrossRef] [PubMed]
- Guideline, *!!! REPLACE !!!*. Updates on the Management of Severe Acute Malnutrition in Infants and Children; World Health Organization: Geneva, 2013. [Google Scholar]
- Humphrey, J.H. Child undernutrition, tropical enteropathy, toilets, and handwashing. The Lancet 2009, 374, 1032–1035. [Google Scholar] [CrossRef]
- Iddrisu, I.; Monteagudo-Mera, A.; Poveda, C.; Pyle, S.; Shahzad, M.; Andrews, S.; Walton, G.E. Malnutrition and Gut Microbiota in Children. Nutrients 2021, 13. [Google Scholar] [CrossRef]
- Li, H.-Y.; Zhou, D.-D.; Gan, R.-Y.; Huang, S.-Y.; Zhao, C.-N.; Shang, A.; Xu, X.-Y.; Li, H.-B. Effects and Mechanisms of Probiotics, Prebiotics, Synbiotics, and Postbiotics on Metabolic Diseases Targeting Gut Microbiota: A Narrative Review. Nutrients 2021, 13. [Google Scholar] [CrossRef] [PubMed]
- Lokuruka, M.N.I. Food and Nutrition Security in East Africa (Kenya, Uganda and Tanzania): Status, Challenges and Prospects. In Food Security in Africa; Mahmoud, B., Ed.; IntechOpen, 2020. [Google Scholar] [CrossRef]
- Nakamura, S.; Sarker, S.A.; Wahed, M.A.; Wagatsuma, Y.; Oku, T.; Moji, K. Prebiotic effect of daily fructooligosaccharide intake on weight gain and reduction of acture diarrhea among children in a Bangladesh urban slum: A randomized double-masked placebo-controlled study. Tropical Medicine and Health 2006, 34, 125–131. [Google Scholar] [CrossRef]
- Ngure, F.M.; Reid, B.M.; Humphrey, J.H.; Mbuya, M.N.; Pelto, G.; Stoltzfus, R.J. Water, sanitation, and hygiene (WASH), environmental enteropathy, nutrition, and early child development: Making the links. Annals of the New York Academy of Sciences 2014, 1308, 118–128. [Google Scholar] [CrossRef] [PubMed]
- Ngure, F.M.; Reid, B.M.; Humphrey, J.H.; Mbuya, M.N.; Pelto, G.; Stoltzfus, R.J. Water, sanitation, and hygiene (WASH), environmental enteropathy, nutrition, and early child development: making the links. Annals of the New York Academy of Sciences 2014, 1308, 118–128. [Google Scholar] [CrossRef]
- Nuzhat, S.; Hasan SM, T.; Palit, P.; Islam, R.; Mahfuz, M.; Islam, M.M.; Alam, A.; Flannery, R.L.; Kyle, D.J.; Sarker, S.A.; Ahmed, T. Effects of probiotic and synbiotic supplementation on ponderal and linear growth in severely malnourished young infants in a randomized clinical trial. Scientific Reports 2023, 1–9. [Google Scholar] [CrossRef]
- Prüss-Ustün, A.; Bartram, J.; Clasen, T.; Colford, J.M.; Cumming, O.; Curtis, V.; Bonjour, S.; Dangour, A.D.; De France, J.; Fewtrell, L.; Freeman, M.C.; Gordon, B.; Hunter, P.R.; Johnston, R.B.; Mathers, C.; Mäusezahl, D.; Medlicott, K.; Neira, M.; Stocks, M.; Cairncross, S. Burden of disease from inadequate water, sanitation and hygiene in low- and middle-income settings: A retrospective analysis of data from 145 countries. Tropical Medicine and International Health 2014, 19, 894–905. [Google Scholar] [CrossRef] [PubMed]
- Saleem, J.; Zakar, R.; Bukhari GM, J.; Naz, M.; Mushtaq, F.; Fischer, F. Effectiveness of ready-to-use therapeutic food in improving the developmental potential and weight of children aged under five with severe acute malnourishment in Pakistan: A pretest-posttest study. International Journal of Environmental Research and Public Health 2021, 18. [Google Scholar] [CrossRef]
- Schoonees, A.; Lombard, M.J.; Musekiwa, A.; Nel, E.; Volmink, J. Ready-to-use therapeutic food (RUTF) for home-based nutritional rehabilitation of severe acute malnutrition in children from six months to five years of age. The Cochrane Database of Systematic Reviews 2019, 5, CD009000. [Google Scholar] [CrossRef] [PubMed]
- Shapira, G.; Ahmed, T.; Henriette, S.; Drouard, P.; Fernandez, P.A.; Kandpal, E.; Nzelu, C.; Wesseh, C.S.; Mohamud, N.A.; Smart, F.; Mwansambo, C.; Baye, M.L.; Diabate, M.; Yuma, S.; Ogunlayi, M.; Jean, R.; Rusatira, D.D.; Hashemi, T.; Vergeer, P.; Friedman, J. Disruptions in maternal and child health service utilization during COVID-19 : analysis from eight sub-Saharan African countries; 2021; pp. 1–12. [Google Scholar] [CrossRef]
- Shokry, E.; Sadiq, K.; Soofi, S.; Habib, A.; Bhutto, N.; Rizvi, A.; Ahmad, I.; Demmelmair, H.; Uhl, O.; Bhutta, Z.A.; Koletzko, B. Impact of treatment with rutf on plasma lipid profiles of severely malnourished pakistani children. Nutrients 2020, 12, 1–23. [Google Scholar] [CrossRef]
- UNICEF/WHO/WORLD BANK. Levels and trends in child malnutrition UNICEF / WHO / World Bank Group Joint Child Malnutrition Estimates Key findings of the 2021 edition. World Health Organization. 2021, pp. 1–32. Available online: https://www.who.int/publications/i/item/9789240025257.
- UNICEF. Pakistan Humanitarian Situation Report No. 9. 2023. Available online: https://reliefweb.int/report/pakistan/unicef-pakistan-humanitarian-situation-report-no-9-end-year-2022.
Figure 1.
Flow diagram.
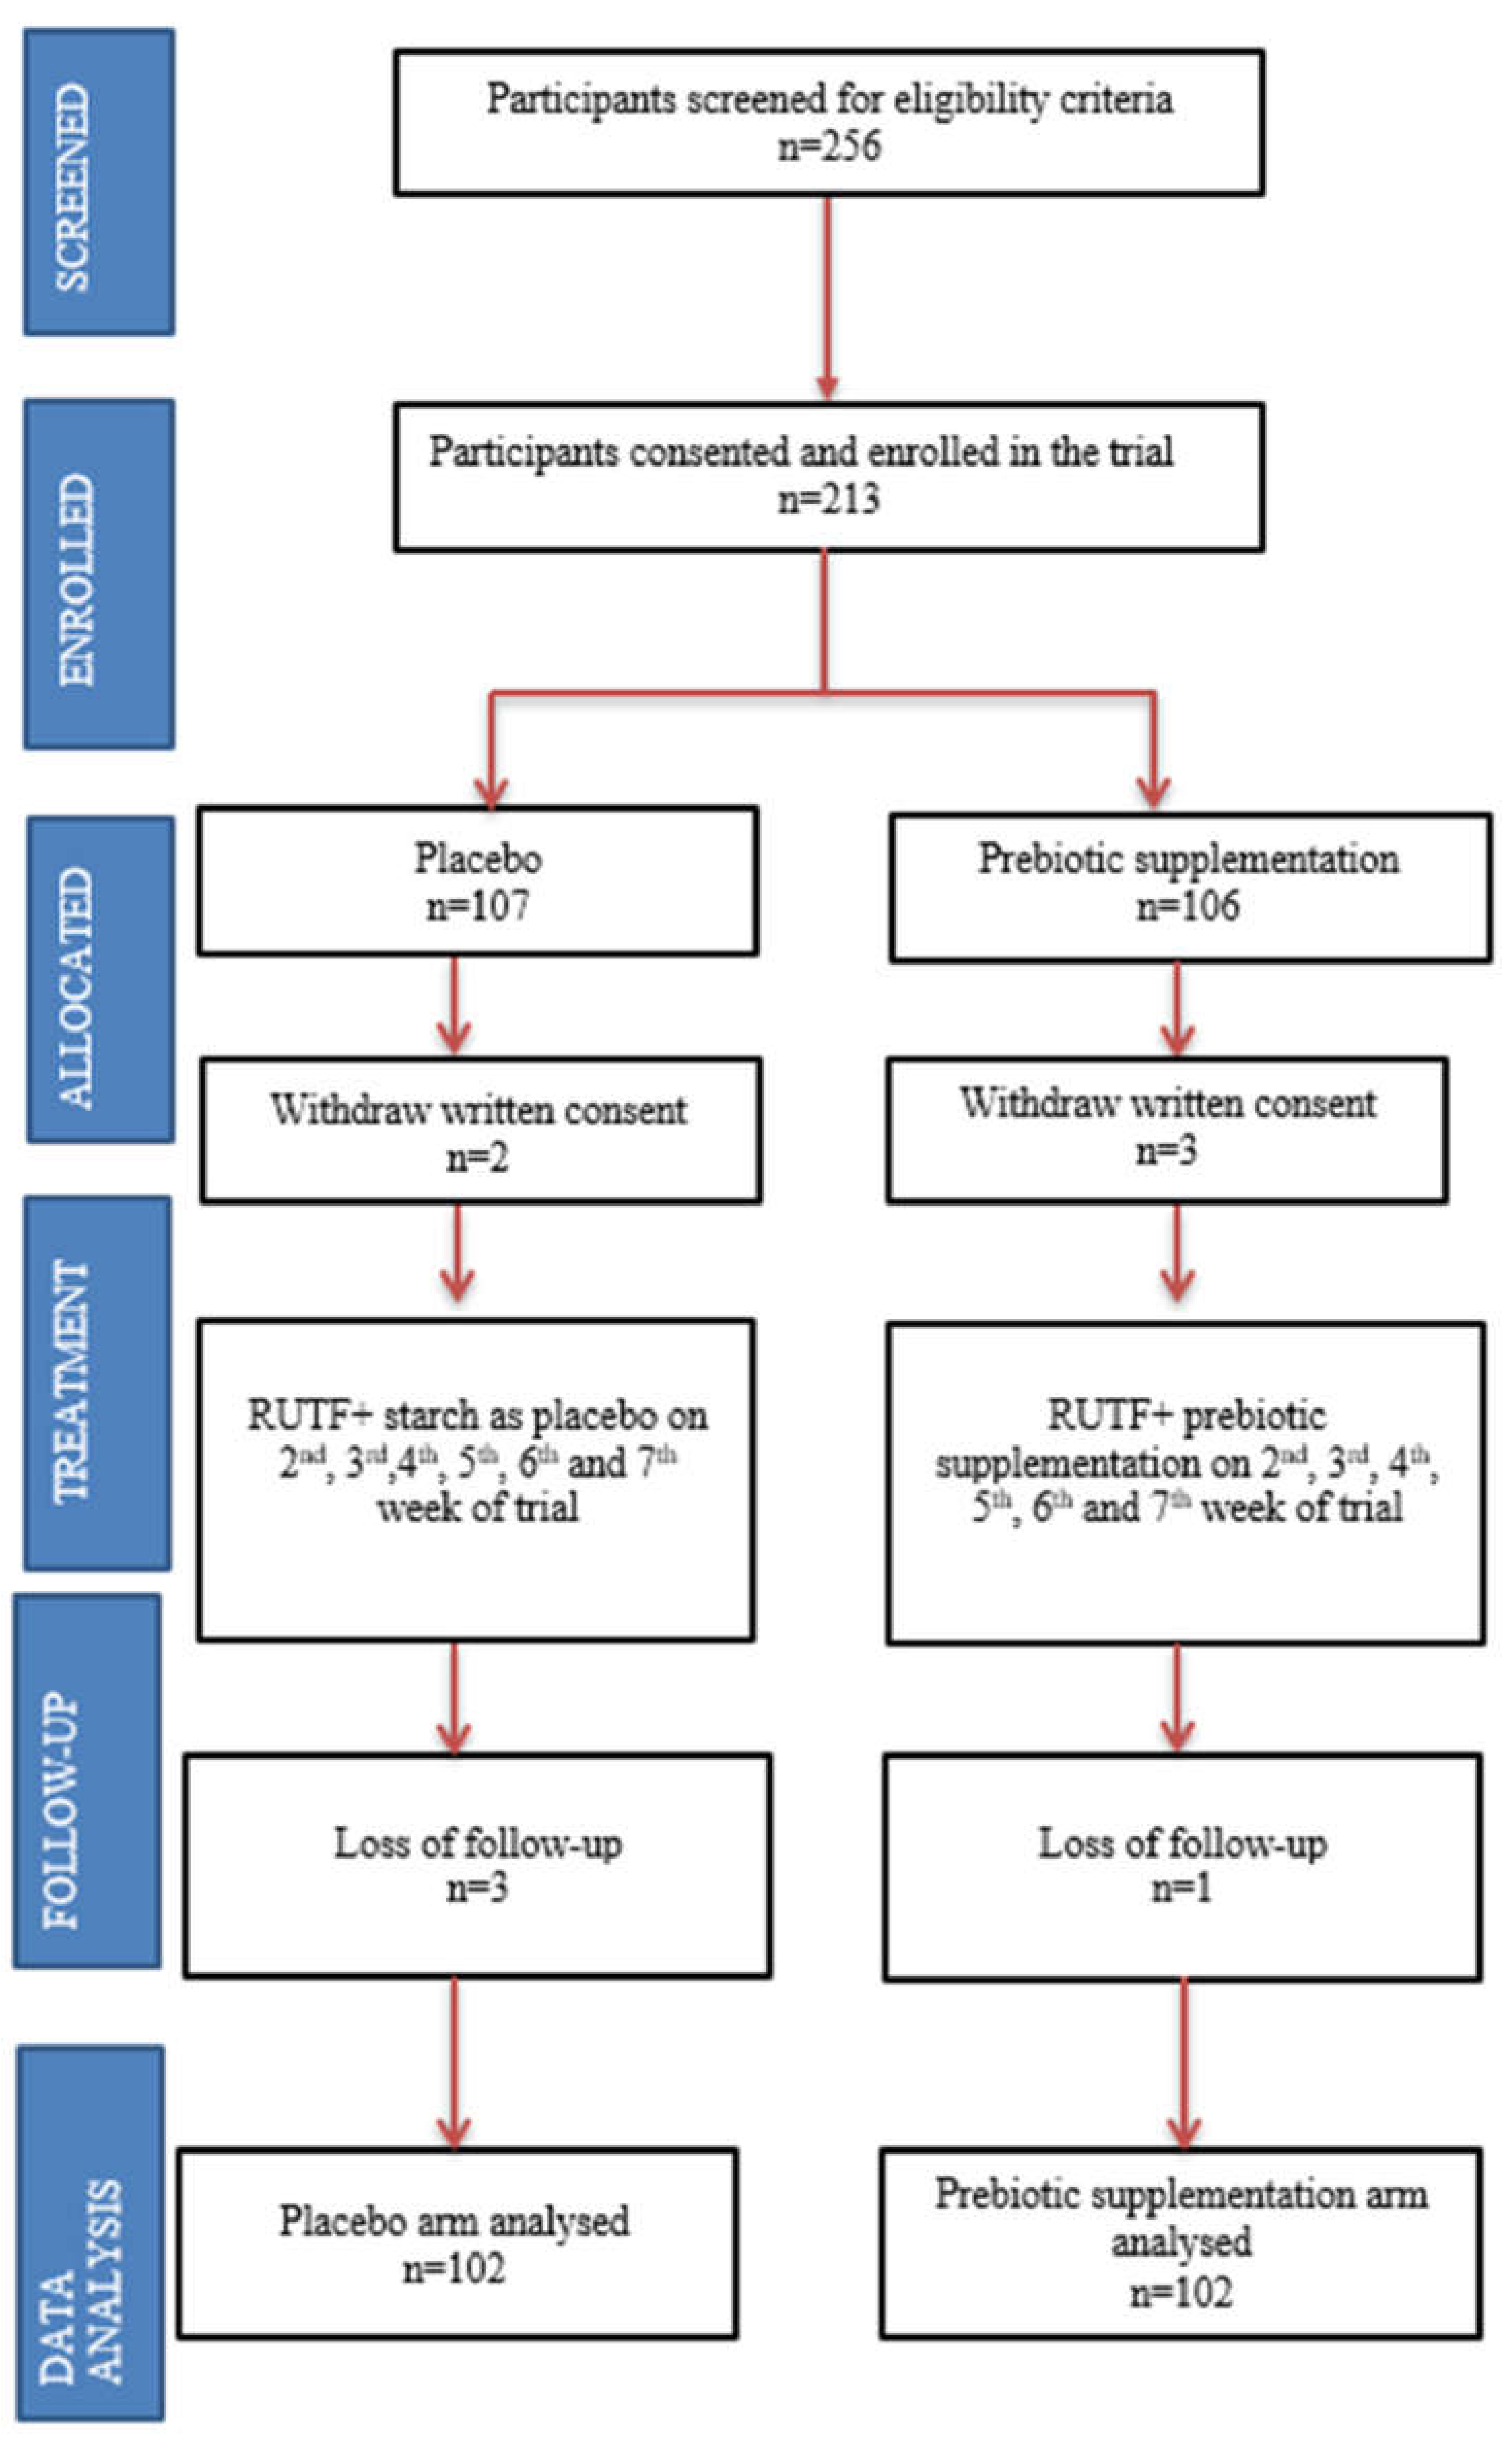

Table 1.
Comparison of sociodemographic characteristics in the treatment and control group.
| Sociodemographic characteristics |
Treatment n (%) |
Control n (%) |
Total | |
|---|---|---|---|---|
| Gender (n = 204) | Male | 51 (25%) | 57 (27.9%) | 108 (52.9%) |
| Female | 51 (25%) | 45 (21.1%) | 96 (47.1%) | |
| Age (n = 204) | Up to 12 months | 55 (27.0%) | 49 (24.0%) | 104 (51%) |
| 13–24 months | 32 (15.7%) | 39 (19.1%) | 71 (34.8%) | |
| 25–36 months | 12 (5.9%) | 9 (4.4%) | 21 (10.3%) | |
| 37–48 months | 2 (1.0%) | 3 (1.5%) | 5 (2.5%) | |
| 49–60 months | 1 (0.5%) | 2 (1.0%) | 3 (1.5%) | |
| Ethnicity (n = 204) | Baloch | 28 (13.7%) | 40 (19.6%) | 68 (33.3%) |
| Migrant | 7 (3.4%) | 6 (2.9%) | 13 (6.4%) | |
| Native (Punjabi) | 67 (32.8%) | 56 (27.5%) | 123 (60.3%) | |
| Resident (n = 204) | Rural | 61 (29.9%) | 69 (33.8%) | 130 (63.7%) |
| Tribal | 6 (2.9%) | 7 (3.4%) | 13 (6.4%) | |
| Urban | 35 (17.2%) | 26 (12.7%) | 61 (29.9%) | |
Table 2.
Pre- and post-comparison of the growth parameters of uncomplicated SAM children for the treatment group (RUTF + prebiotics) (n = 102).
Table 2.
Pre- and post-comparison of the growth parameters of uncomplicated SAM children for the treatment group (RUTF + prebiotics) (n = 102).
| Outcome measures | Paired differences | p-value * | ||||||
|---|---|---|---|---|---|---|---|---|
| Correlation | Mean difference | SD | Std. Error Mean | 95% CI of the difference | ||||
| Lower | Upper | |||||||
| Pair 1 | Pre-weight— Post-weight |
0.893 | −0.77696 | 0.73048 | 0.05114 | −0.87780 | −0.67612 | <0.001 |
| Pair 2 | Pre-MUAC— Post-MUAC |
0.801 | −0.71176 | 0.85539 | 0.05989 | −0.82985 | −0.59368 | <0.001 |
| Pair 3 | Pre-HB— Post-HB |
0.504 | −0.80490 | 1.38057 | 0.09666 | −0.99549 | −0.61432 | <0.001 |
| Pair 4 | Pre-HCT— Post-HCT |
-0.039 | −8.96912 | 72.28303 | 5.06082 | −18.94764 | 1.00941 | 0.078 |
| Pair 5 | Pre-platelets count—Post-platelets count | 0.816 | −5.50980 | 56786.822 | 3975.872 | −8390.283 | 7288.32299 | 0.890 |
| Pair 6 | Pre-MCV— Post-MCV |
0.712 | −3.21912 | 4.17567 | 0.29236 | −3.79556 | −2.64267 | <0.001 |
| Pair 7 | Pre-MCH— Post-MCH |
0.678 | −1.98873 | 2.47062 | 0.17298 | −2.32979 | −1.64766 | <0.001 |
| Pair 8 | Pre-Albumin— Post-Albumin |
0.503 | −0.32549 | 0.53860 | 0.03771 | −0.39984 | −0.25114 | <0.001 |
| * p-value calculated using paired sample t-test at 95% CI | ||||||||
Table 3.
Difference between the outcomes of children enrolled in the control (n = 102) and treatment (n = 102) group.
Table 3.
Difference between the outcomes of children enrolled in the control (n = 102) and treatment (n = 102) group.
| Outcome measures | Groups | Mean ± SD | t-test | p value* |
|---|---|---|---|---|
| Pre-weight | Treatment | 5.44 ± 1.35 | 0.044 | 0.965 |
| Control | 5.43 ± 1.55 | |||
| Post-weight | Treatment | 6.53 ± 1.45 | 2.842 | 0.005 |
| Control | 5.89 ± 1.72 | |||
| Pre-MUAC | Treatment | 9.69 ± 1.20 | -0.822 | 0.412 |
| Control | 9.84 ± 1.39 | |||
| Post-MUAC | Treatment | 10.80 ± 1.28 | 3.316 | 0.001 |
| Control | 10.16 ± 1.45 | |||
| Pre-HB | Treatment | 8.85 ± 1.28 | -2.967 | 0.003 |
| Control | 9.41 ± 1.37 | |||
| Post-HB | Treatment | 10.57 ± 1.18 | 6.854 | <0.001 |
| Control | 9.32 ± 1.37 | |||
| Pre-HCT | Treatment | 27.57 ± 4.43 | −2.775 | 0.080 |
| Control | 29.25 ± 4.11 | |||
| Post-HCT | Treatment | 46.53 ± 102.19 | 1.757 | 0.006 |
| Control | 28.56 ± 3.94 | |||
| Pre-platelets count | Treatment | 280234.00 ± 89078.95 | −0.526 | 0.600 |
| Control | 287502.00 ± 105696.33 | |||
| Post-platelets count | Treatment | 271500.00 ± 60080.00 | −2.174 | 0.031 |
| Control | 296230.00 ± 96572.14 | |||
| Pre-MCV | Treatment | 68.99 ± 5.95 ± | −1.411 | 0.160 |
| Control | 70.16 ± 5.76 | |||
| Post-MCV | Treatment | 74.35 ± 4.48 | 4.519 | <0.001 |
| Control | 71.31 ± 4.99 | |||
| Pre-MCH | Treatment | 22.33 ± 3.33 | −0.028 | 0.978 |
| Control | 22.35 ± 3.24 | |||
| Post-MCH | Treatment | 25.31 ± 2.55 | 5.130 | <0.001 |
| Control | 23.38 ± 2.79 | |||
| Pre-Albumin | Treatment | 3.59 ± 0.52 | 1.045 | 0.298 |
| Control | 3.51 ± 0.51 | |||
| Post-Albumin | Treatment | 3.98 ± 0.470 | 2.648 | 0.009 |
| Control | 3.77 ± 0.63 | |||
| * p-value calculated using independent sample t-test at 95% CI | ||||
Disclaimer/Publisher’s Note: The statements, opinions and data contained in all publications are solely those of the individual author(s) and contributor(s) and not of MDPI and/or the editor(s). MDPI and/or the editor(s) disclaim responsibility for any injury to people or property resulting from any ideas, methods, instructions or products referred to in the content. |
© 2023 by the authors. Licensee MDPI, Basel, Switzerland. This article is an open access article distributed under the terms and conditions of the Creative Commons Attribution (CC BY) license (http://creativecommons.org/licenses/by/4.0/).
Copyright: This open access article is published under a Creative Commons CC BY 4.0 license, which permit the free download, distribution, and reuse, provided that the author and preprint are cited in any reuse.


