
Submitted:
15 March 2023
Posted:
20 March 2023
You are already at the latest version
Abstract
Introduction: Weighting is widely used in applied statistics especially while dealing with survey data. In recent years, multilevel modeling under complex survey designs has increased, resulting into demand for level weights. However, survey data that are accessible to the public for use usually do not contain level weights that are useful in multilevel modeling, but final survey weights that are only appropriate for single level analyses. In this paper, we demonstrate how the final survey weights can be used to estimate level weights for multilevel data analysis, and compare a model that applied level weights with one that applied the final survey weights. Methods: A framework for approximating level weights proposed by the Demographic Health Survey (DHS) program was used to estimate the level weights. Models were fitted using a multilevel mixed effects logistic regression method. Estimates from a model that applied survey weights was compared to those from a model that applied level weights. Results: Application of final survey weights instead of level weights underestimated standard errors and led to loss of precision of model estimates. Conclusions: Use of level weights produces estimates with high precision and yields correct values of standard errors hence appropriately informing inference.
Keywords:
complex survey design
; multilevel models
; nonresponse
; sampling probability
; survey data
; Uganda
; weighting
1. Introduction
Weighting is a correction technique applied to survey data to improve the accuracy of the survey estimates (Lavrakas 2008) especially for health surveys that are typically based on complex survey designs like stratified multistage clustered designs (Graubard and Korn 1996). Survey data is usually weighted for two reasons; to correct for unequal probabilities of selection that often have occurred during sampling and to compensate for survey nonresponse during data collection (Gelman 2007, Kalton and Flores-Cervantes 2003, Lavrakas 2008, Lepkowski, et al. 2013, Little and Vartivarian 2003, Pfeffermann-a 1993, Seaman and White 2013, Wagemaker 2020).
Though widely accepted in descriptive analyses, weights have been criticized by some modelers in analytical inference (Pfeffermann-a 1993). However, weighting sample observations produces consistent estimators of the model parameters (Bethlehem and Keller 1987, Skinner and Mason n.d.), averts model misspecification (Pfeffermann-b 1996) and reduces bias in the survey estimates (Chen, et al. 2015, Kim and Skinner 2013) while analyzing data from unequal probability designs (Nahorniak, et al. 2015). Despite efforts to maximize response rates, virtually all sample surveys are prone to nonresponses (Wun, et al. 2007).
One of the critical challenges faced by analysts using Demographic and Health Survey (DHS) program datasets for multilevel modeling and other survey datasets is that sampling weights related to the specific levels of the multistage design (level weights) are not incorporated in these datasets. Providing the exact level weights may create disclosure risks where dataset users may recognize specific clusters, households, or individuals within the clusters if they have access to sampling frames. Hence, instead of level-specific weights, the final survey weights are made available in the public-used datasets. Yet, multilevel modeling requires level-specific sampling weights instead of the final survey weights, the product of the level weights. The final survey weights are only adequate for most analytical purposes besides multilevel modeling (Elkasabi, Ren and Pullum 2020). Ignoring these level weights however, may lead to erroneous inferences with respect to the sample design (Hakim, et al. 2020, West, et al. 2015).
Notably, few guidelines for integrating weights into multilevel models are in place (Carle 2009). Hence, this paper aimed at demonstrating the estimation of level weights and comparing weighted models; one that applied the final survey weights and another that applied the estimated level weights, using the Uganda Malaria Indicator Survey (UMIS) data of 2018/19.
2. Methods
Source of Data and Study Population
The study applied secondary data from the latest UMIS of 2018/19. The data are based on a two-stage cluster and stratified sampling procedure, meeting the requirements of a complex survey design. A total of 7,632 children below 5 years of age that were tested for anaemia and malaria infection formed the study population. Blood samples from the children to be tested were collected by finger or heel prick. Anaemia and malaria testing was carried out by health technicians (NMCD, UBOS and ICF 2020).
Weighting
Sampling weights are required for analysis to ensure that the survey results are representative at the national level as well as the domain level due to the non-proportional allocation of the sample to different regions and to their urban and rural areas, and the possible differences in response rates (UBOS and ICF 2018). Since the 2018/19 UMIS sample is a two-stage stratified cluster sample, sampling weights were calculated separately, based on sampling probabilities for each sampling stage and for each cluster (NMCD, UBOS and ICF 2020).
In this study, we used a procedure for estimating level weights in Malaria Indicator Surveys (MIS) proposed by the Demographic Health Survey (DHS) program (Elkasabi, Ren and Pullum 2020). The procedure required information available in the UMIS datasets and the final report. The following steps were followed to approximate level-2 (household) and level-3 (enumeration area) as outlined in Table 1.
Where;
- HV005 is the final household survey weight variable, from the household recode (HR) dataset.
- is the number of finalized EAs in stratum or region for the strata. The number of interviewed EAs, was calculated from the household (HR) dataset.
- is the number of households in stratum for all strata.
- is the number of households in the whole of Uganda according to the Uganda Population and Housing Census of 2014.
- is the number of households in EA per EA. These numbers were estimated using the average number of households in each EA in strata according to the most recent Uganda Population and Housing Census data of 2014.
- is the number of complete households in the survey.
- is the approximated household number at the time of the survey in the whole country. This was approximated by the number of households in Uganda according to the Uganda Population and Housing Census of 2014.
The applied variation factor depends on the exponent specification , thus contributing different degrees to and . The factor is fully assigned to and also fully assigned to when and , respectively. In the case of this study, it is equally assigned to the two weights as . In case extreme values are applied, all the weight variation is attributed to either the level-2 or level-3 weight.
De-normalization of the final survey weight was done to restore the original scale of the survey weight using the available information in the UMIS dataset and the UMIS final report. The de-normalized final survey weights in the first step were estimated as:
where is the number of households in the entire country.
Multilevel mixed effects models
Weighted multilevel mixed effects logistic regression models were specified to explain the contextual area associations. The model is represented in the equation below:
- is the natural logarithm.
- is the probability of testing positive for malaria for the child in the household and EA.
- is the average log-odds of malaria infection.
- is a covariate at level-1 for the child in the household and EA.
- denotes the slope related with representing the association between the individual child covariates and the log-odds of malaria infection.
- is the EA random effect.
- is the household random effect.
Note that the random effects are assumed to be independently and identically distributed to one another with zero mean and and variances, for EA and household respectively.
Model comparison
Design factor (deft) was used to compare model estimates since nonresponse results into loss in the precision of survey estimates, primarily due to reduced sample size (Brick 2013). A model was therefore considered better if it produced estimates with lower deft values in general. Lower deft values are associated with lower loss of precision of model estimates (Sturgis 2004). The deft was calculated as follows:
Where;
- is the design effect.
- is the intra-class correlation for the variable in question.
- is the size of the cluster.
3. Results
Comparison of Models Using Standard Errors of Model Estimates
Findings from this study indicated that the model weighted with the final survey weights underestimated standard errors compared to one that was weighted with the estimated level weights (Figure 1). Underestimated standard errors in turn resulted into narrow confidence intervals (Table 2 and Figure 3), presenting seemingly high accuracy of model estimates and likely overconfidence in the model estimates. This is worth paying attention to because overconfidence in results leads to rejecting the null hypothesis when it should not be the case (Type I error) which most likely misleads inference.
Comparison of Models Using Design Factor Values of Model Estimates
Design factor (deft) values for the model weighted with final survey weights were generally higher than those for the model weighted with level weights (Figure 2 and Table 3). This indicates that the use of final survey weights resulted into a considerble loss of precision for model estimates compared to the use of level weights. Almost half (5 of the 11) estimates for the model weighted with final survey weights produced deft values greater than 1.2, a value commonly taken to indicate sizeable variance inflation compared to only 1 estimate for the model weighted with level weights.
4. Discussions
Recently, the application of multilevel analysis on complex survey data has increased as well as the accessibility of public available survey datasets collected from large national samples. However, the challenge with modeling in these data is weighting, as researchers have continuously applied the final survey weights that are inappropriate for multilevel analysis (Elkasabi, Ren and Pullum 2020) instead of level weights at the sampled hierarchies (Rabe-Hesketh and Skrondal 2006). The use of the former weights has a number of implications on model estimates among which is misestimating standard errors and model parameters (Carle 2009). Ignoring specific level weights has consequences; at the first stage, it results into biased estimates on the intercept and variance of random effect, whereas at the second stage, it leads to slightly underestimated fixed effects and residual variance, in addition to the biased estimates on the intercept and variance of the random effect (Cai 2013).
A model that applied final survey weights produced more estimates with design factor values greater than 1.2 a, value commonly taken to indicate sizeable variance inflation (Sturgis 2004) hence increasing the variance of the estimated coefficients (Skinner and Mason n.d.), an indication that level weights are useful in reducing variance of model estimate (Dargatz and Hill 1996, Liao and Valliant 2012).
Computation of appropriate standard errors with complex survey data has important implications for policy research since standard errors are the foundation upon which statistical significance testing is based (Davern, et al. 2007) which informs inference. Besides, the DHS public available datasets like other complex survey data are used extensively for health policy research, with significant implications for national health policy formulation decisions. A model weighted by final survey weights underestimated standard errors for the model estimates. This has an effect on model estimates (Daniels, Dominici and Zeger 2004). Underestimation of standard errors leads to narrow confidence interval, affecting test of statistical significance and possibly misleading inference.
5. Conclusions
Use of level weights instead of the final survey weights produces correct values of standard errors hence correctly informing inference. Models that apply level weights also produce estimates with high precision. Researchers should always estimate and apply level weights while using survey data for multilevel analysis with final survey weights especially datasets under the DHS program, for better model estimates and inference.
Funding
This work was supported through the DELTAS Africa Initiative Grant No. 107754/Z/15/Z-DELTAS Africa SSACAB. The DELTAS Africa Initiative is an independent funding scheme of the African Academy of Sciences (AAS)’s Alliance for Accelerating Excellence in Science in Africa (AESA) and supported by the New Partnership for Africa’s Development Planning and Coordinating Agency (NEPAD Agency) with funding from the Wellcome Trust (Grant No. 107754/Z/15/Z) and the UK government. The views expressed in this publication are those of the author(s) and not necessarily those of AAS, NEPAD Agency, Wellcome Trust or the UK government.
References
- Bethlehem, J. G., & Keller, W. J. (1987). Linear weighting of sample survey data. Journal of official statistics, 3(4), 141-153. https://www.scb.se/contentassets/ca21efb41fee47d293bbee5bf7be7fb3/linear-weighting-of-sample-survey-data.pdf.
- Brick, J. Michael. 2013. "Unit Nonresponse and Weighting Adjustments: A Critical Review." Journal of Official Statistics 29 (3): 329–353. [CrossRef]
- Cai, Tianji. 2013. "Investigation of Ways to Handle Sampling Weights for Multilevel Model Analyses." Sociological Methodology 43 (1): 178-219. [CrossRef]
- Carle, Adam C. 2009. "Fitting multilevel models in complex survey data with design weights: Recommendations." BMC Med Res Methodol 9 (49). [CrossRef]
- Chen, Qixuan, Andrew Gelman, Melissa Tracy, Fran H Norris, and Sandro Galea. 2015. "Incorporating the sampling design in weighting adjustments for panel attrition." Stat Med 34 (28): 3637-47. [CrossRef]
- Daniels, Michael J., Francesca Dominici, and Scott Zeger. 2004. "Underestimation of Standard Errors in Multi-Site Time Series Studies." Epidemiology 15 (1): 57-62. https://www.jstor.org/stable/20485840.
- Dargatz, D A, and G W Hill. 1996. "Analysis of survey data." Preventive Veterinary Medicine 28 (4): 225-237. [CrossRef]
- Davern, Michael, Arthur Jones, James Lepkowski, Gestur Davidson, and Lynn A. Blewett. 2007. "Estimating Regression Standard Errors with Data from the Current Population Survey’s Public Use File." Inquiry 44: 211–224. https://journals.sagepub.com/doi/pdf/10.5034/inquiryjrnl_44.2.211.
- Elkasabi, Mahmoud, Ruilin Ren, and Thomas W. Pullum. 2020. Multilevel Modeling Using DHS Surveys: A Framework to Approximate Level-Weights. I: Reports No. 27, Rockville, Maryland, USA; 27.
- Gelman, Andrew. 2007. "Struggles with Survey Weighting and Regression Modeling." Statist. Sci 22 (2): 153-164. [CrossRef]
- Graubard, Barry, and Edward L Korn. 1996. "Modelling the sampling design in the analysis of health surveys." Stat Methods Med Res 5 (3): 263-81. [CrossRef]
- Hakim, Ferdous, Rijwan Bhuiyan, Khaleda Akter, and Mostafa Zaman. 2020. "Weighting National Survey Data for Bangladeshi Population." Research Methods Cases. [CrossRef]
- Kalton, Graham, and Ismael Flores-Cervantes. 2003. "Weighting Methods." Journal of Official Statistics 19 (2): 81-97. http://www.sverigeisiffror.scb.se/contentassets/ca21efb41fee47d293bbee5bf7be7fb3/weighting-methods.pdf.
- Kim, Jae Kwang, and C. J. Skinner. 2013. "Weighting in survey analysis under informative sampling." Biometrika 100 (2): 385–398. [CrossRef]
- Lavrakas, Paul J. 2008. Encyclopedia of survey research methods. S: Oaks, Carifonia. [CrossRef]
- Lepkowski, James M., William D. Mosher, Robert M Groves, Brady T. West, and James Wagner. 2013. Responsive design, weighting, and variance estimation in the 2006-2010 National Survey of Family Growth. /: National Center for Health Statistics. https, 2206.
- Liao, Dan, and Richard Valliant. 2012. "Variance inflation factors in the analysis of complex survey data." Survey Methodology 38 (1): 53-62. https://www.rti.org/publication/variance-inflation-factors-analysis-complex-survey-data/fulltext.pdf.
- Little, Roderick J, and Sonya Vartivarian. 2003. "On weighting the rates in non-response weights." Stat Med 22 (9): 1589-99. [CrossRef]
- Nahorniak, Matthew, David P Larsen, Carol Volk, and Chris E Jordan. 2015. "Using Inverse Probability Bootstrap Sampling to Eliminate Sample Induced Bias in Model Based Analysis of Unequal Probability Samples." PLoS One 10 (6): e0131765. [CrossRef]
- NMCD, UBOS, and ICF. 2020. Uganda Malaria Indicator Survey 2018-19. /: and Rockville, Maryland, USA: Uganda National Malaria Control Division (NMCD), Uganda Bureau of Statistics (UBOS), and ICF. https.
- Pfeffermann-a, Danny. 1993. "The Role of Sampling Weights When Modeling Survey Data." International Statistical Review 61 (2): 317-337. [CrossRef]
- Pfeffermann-b, Danny. 1996. "The use of sampling weights for survey data analysis." Stat Methods Med Res 239-261. [CrossRef]
- Rabe-Hesketh, Sophia, and Anders Skrondal. 2006. "Multilevel Modelling of Complex Survey Data." Journal of the Royal Statistical Society 169 (4): 805–827. http://www.jstor.org/stable/3877401.
- Seaman, Shaun R, and Ian R White. 2013. "Review of inverse probability weighting for dealing with missing data." Statistical Methods in Medical Research 22 (3): 278–295. [CrossRef]
- Skinner, Chris, and Ben Mason. n.d. "Weighting in the regression analysis of survey data with a cross-national application." The Canadian Journal of Statistics 40 (4): 697-711. [CrossRef]
- Sturgis, Patrick. 2004. "Analysing Complex Survey Data: Clustering, Stratification and Weights." social research UPDATE (43). https://sru.soc.surrey.ac.uk/SRU43.PDF.
- UBOS, and ICF. 2018. Uganda Demographic and Health Survey 2016. /: and Rockville, Maryland, USA: Uganda Bureau of Statistics (UBOS) and ICF. https.
- Wagemaker, Hans, ed. 2020. Reliability and Validity of International Large-Scale Assessment. S: Switzerland. [CrossRef]
- West, Brady T., Linda Beer, Garrett W. Gremel, John Weiser, Christopher H. Johnson, Shikha Garg, and Jacek Skarbinski. 2015. "Weighted Multilevel Models: A Case Study." Am J Public Health 105 (11): 2214–2215. [CrossRef]
- Wun, Lap-Ming, Trena M Ezzati-Rice, Nuria Diaz-Tena, and Janet Greenblatt. 2007. "On modelling response propensity for dwelling unit (DU) level non-response adjustment in the Medical Expenditure Panel Survey (MEPS)." Stat Med 26 (8): 1875-84. [CrossRef]
Figure 1.
Comparison of standard errors of model estimates (survey weights versus level weights).
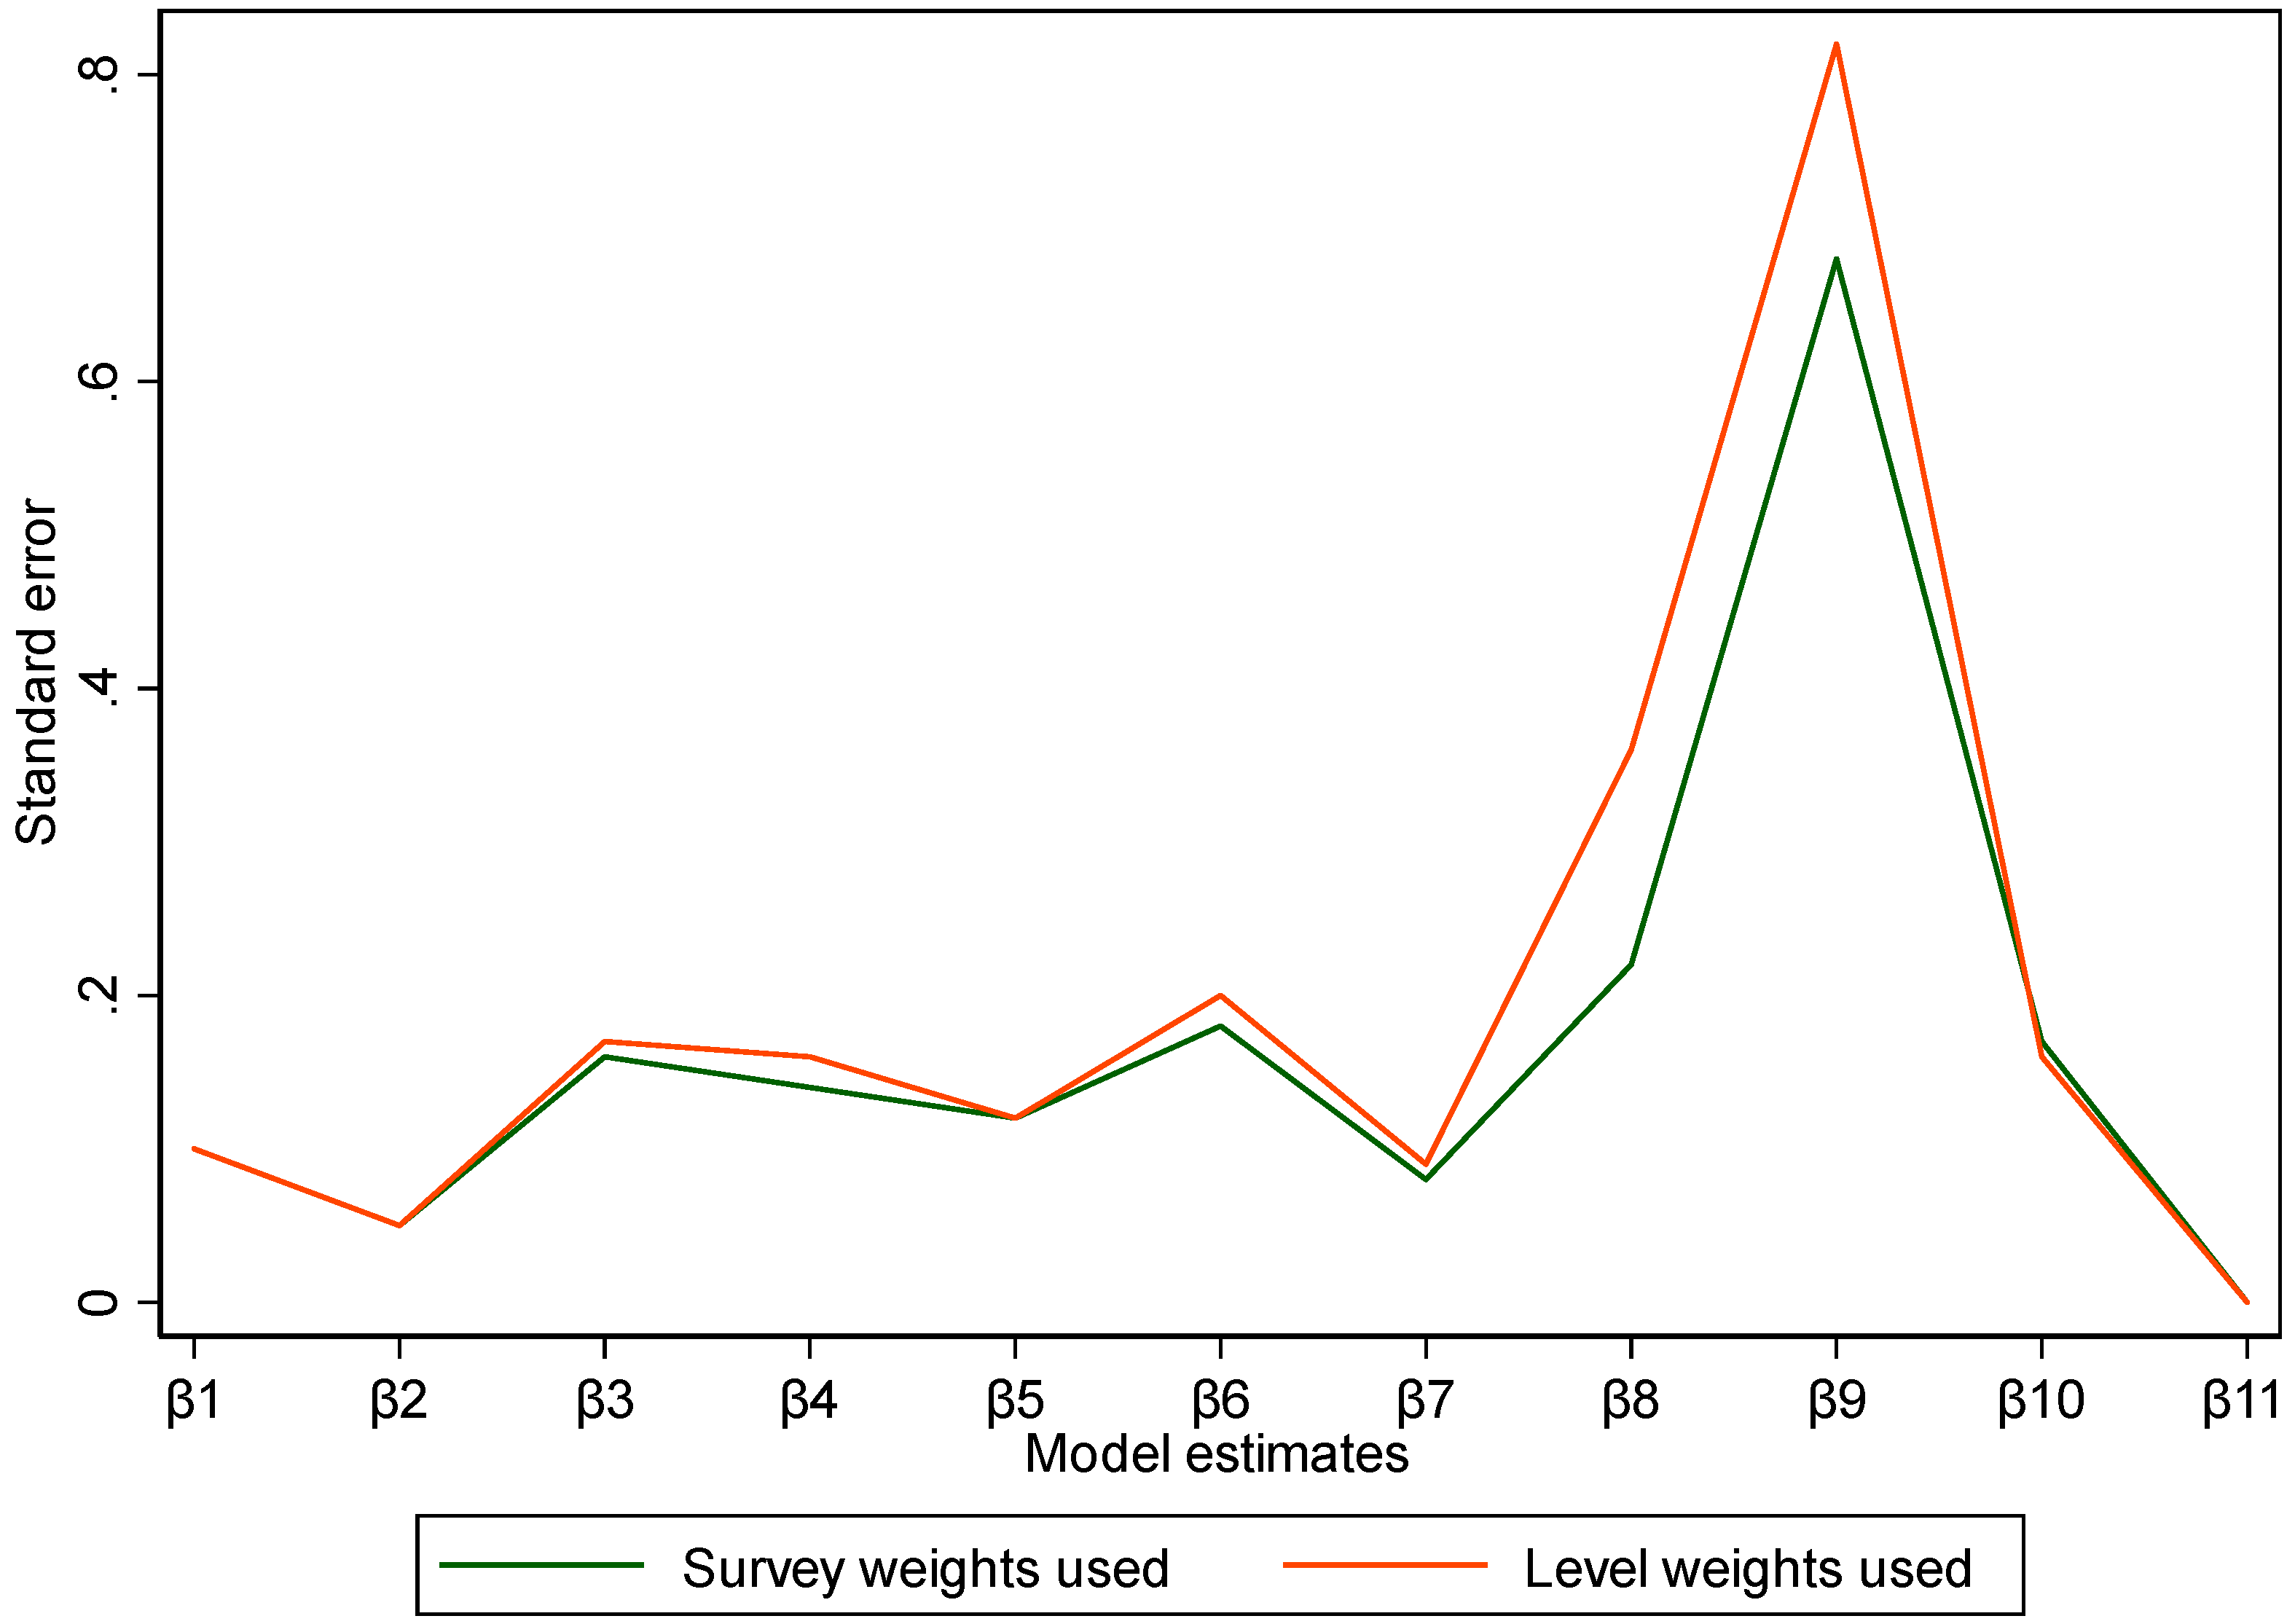
Figure 2.
Comparison of design factor values of survey-weighted and level-weighted models.
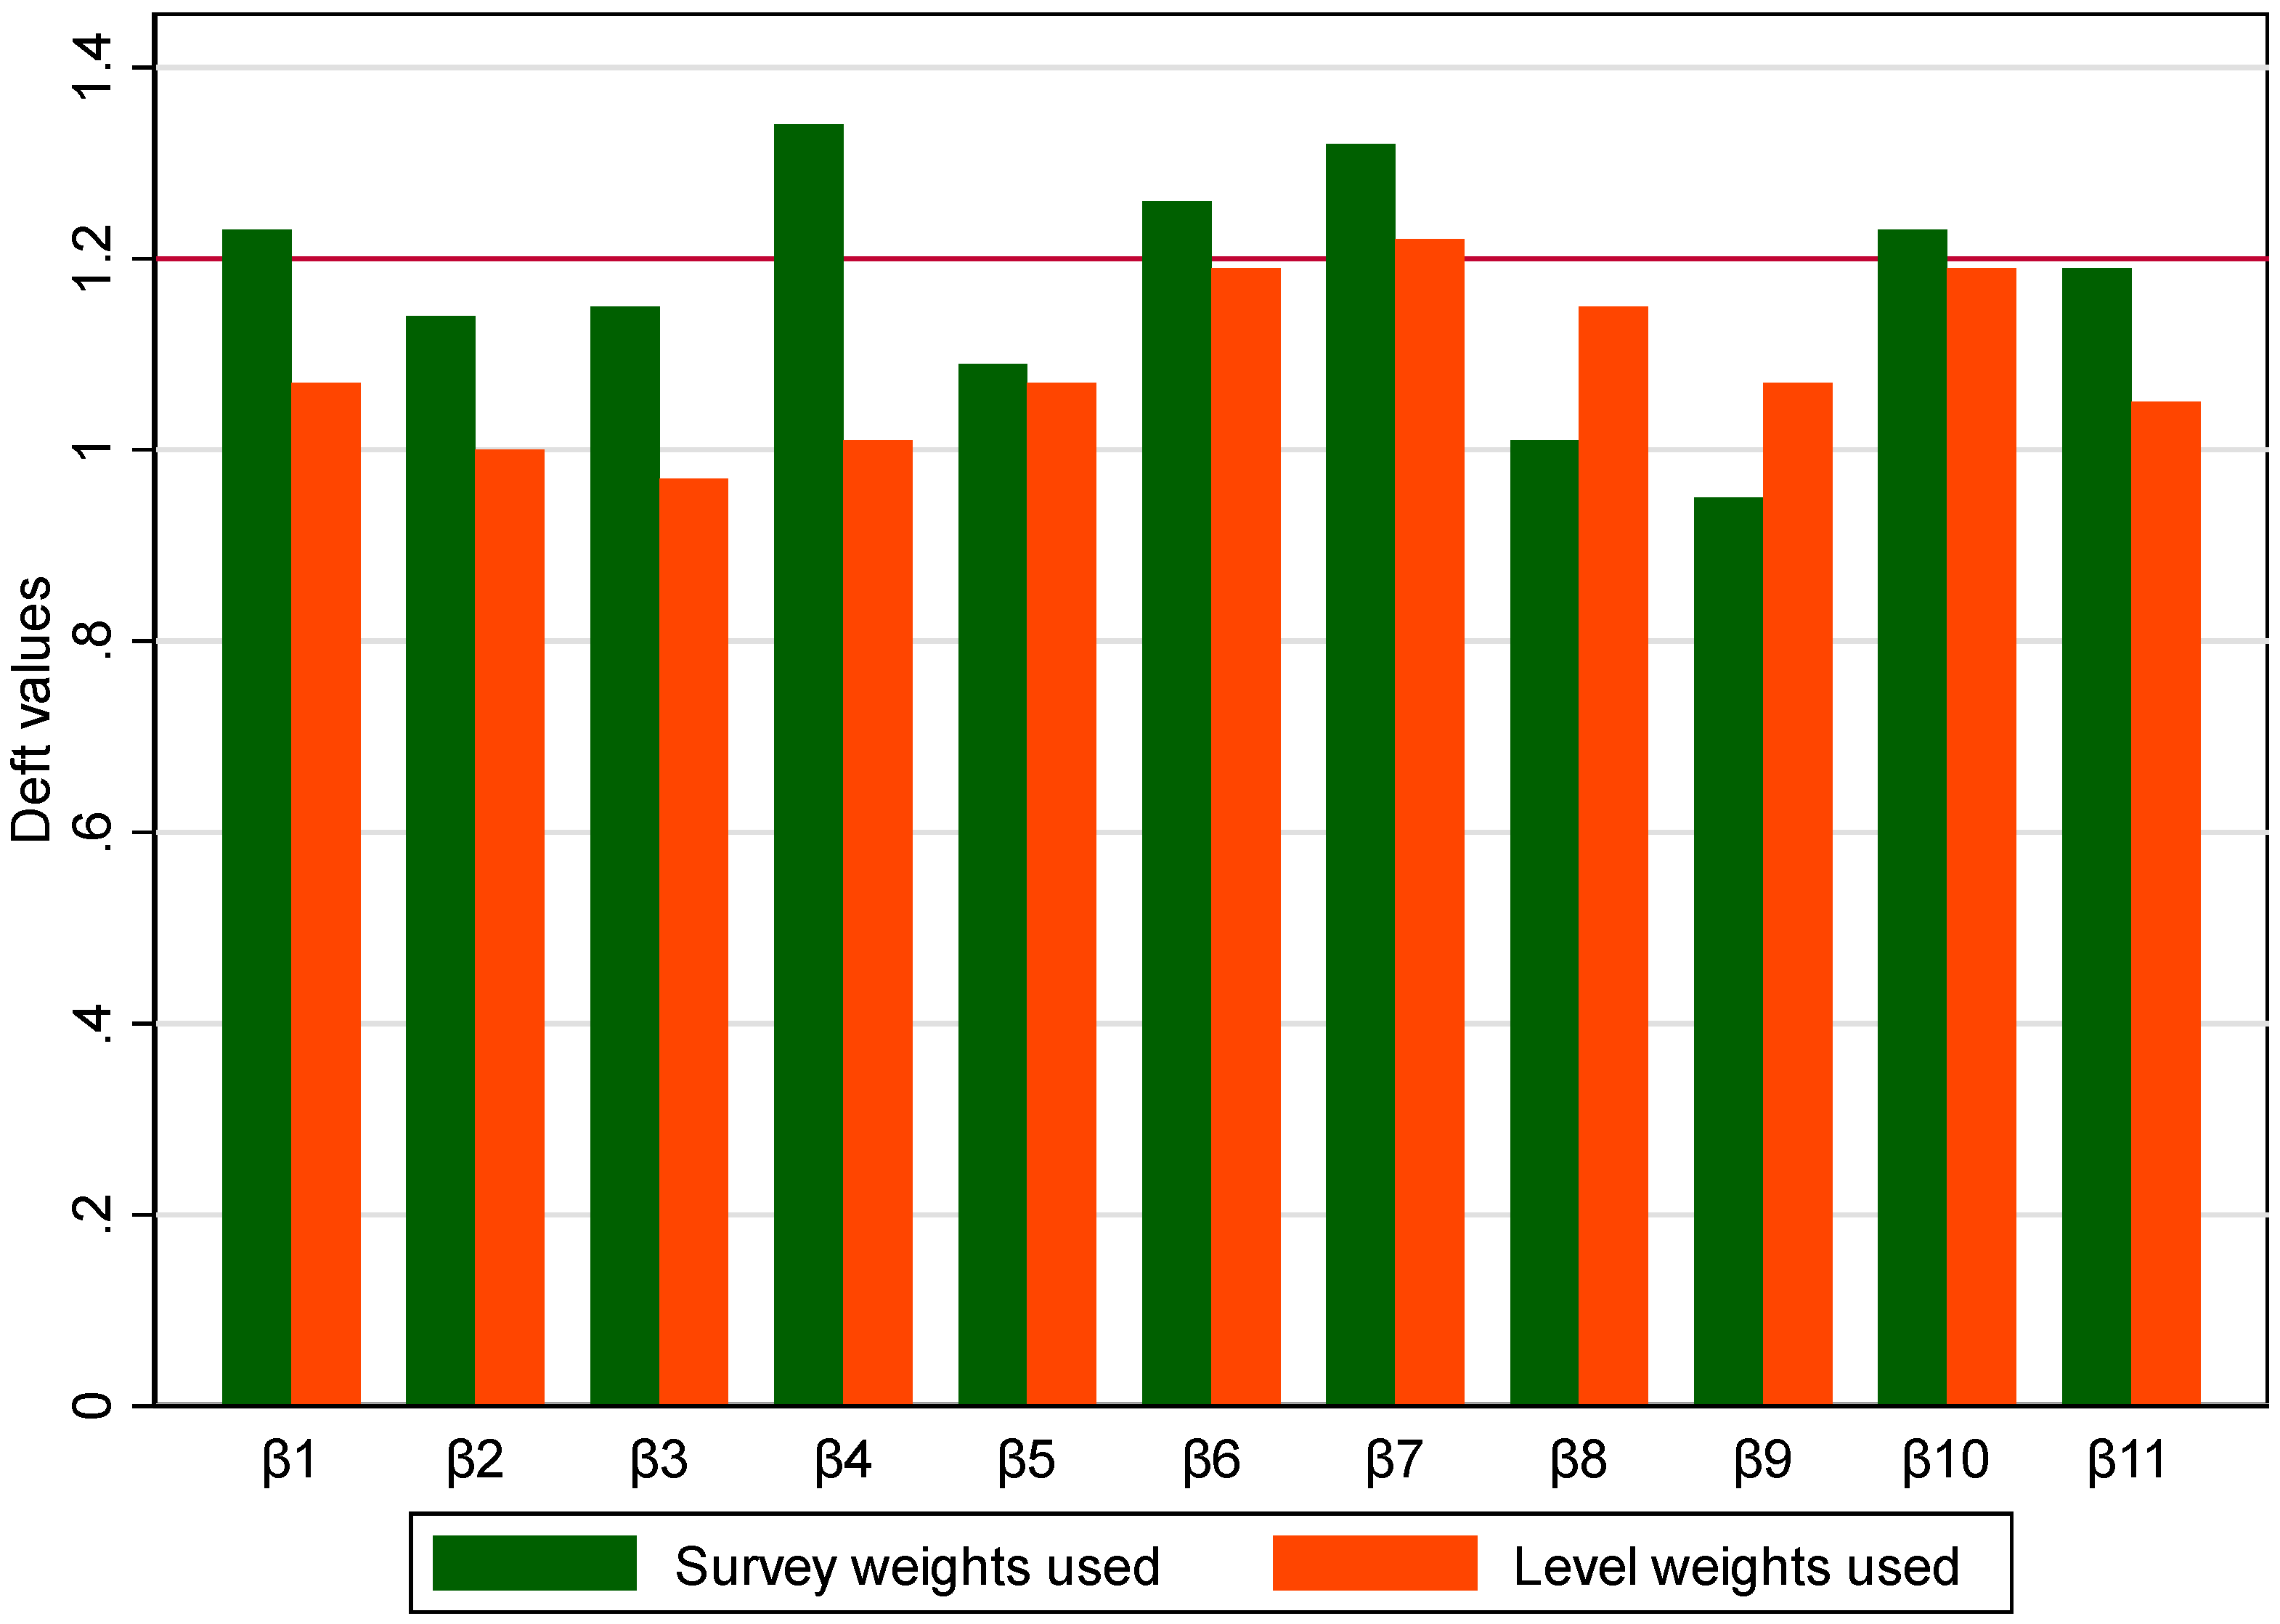
Figure 3.
Confidence intervals for estimates when using survey weights versus level weights.
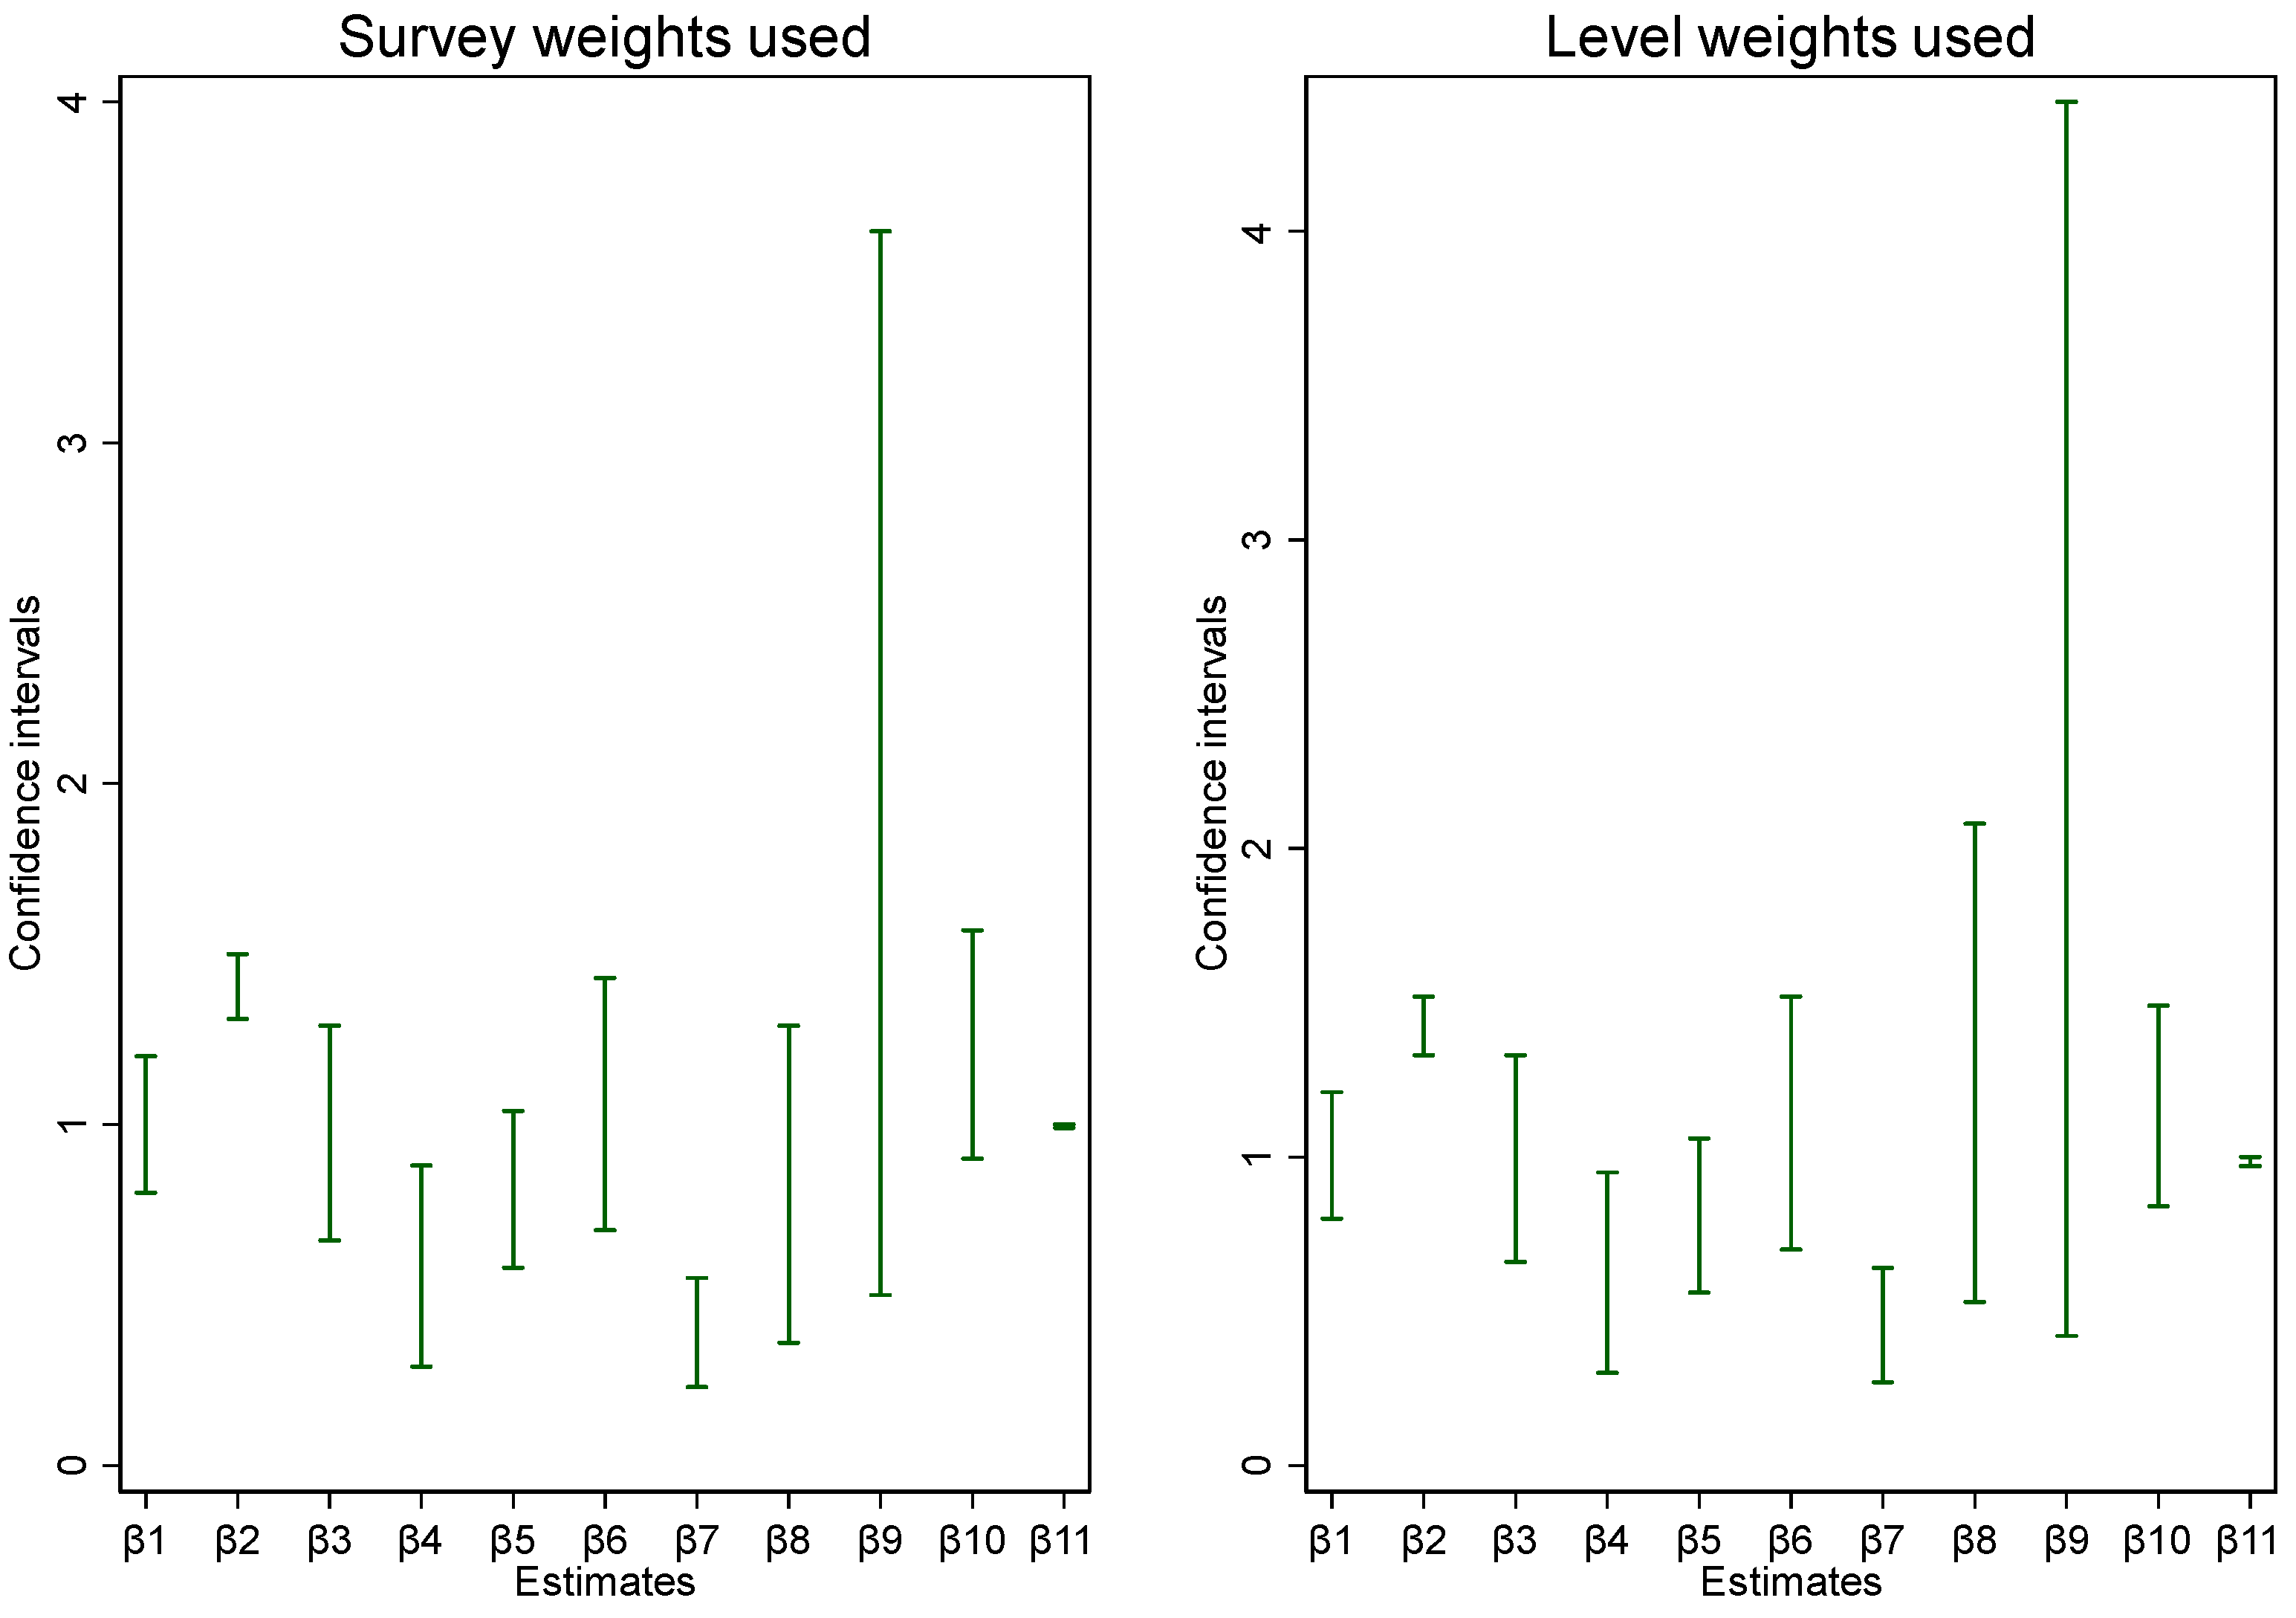

Table 1.
Steps to Approximate Household (HH) and Enumeration Area (EA) Level Weights from Final Household Survey Weights.
Table 1.
Steps to Approximate Household (HH) and Enumeration Area (EA) Level Weights from Final Household Survey Weights.
| Steps | HH and EA weights | |
|---|---|---|
| 1 | Apply the estimated normalization factor to de-normalize the final survey weight | |
| 2 | , | |
| 3 | ||
Table 2.
Comparison of multilevel mixed effects logistic regression model estimates.
| Model estimates | Survey weighted model | Level weighted model | |||||||||
|---|---|---|---|---|---|---|---|---|---|---|---|
| OR | SE | P | (95% CI) | OR | SE | P | (95% CI) | ||||
| β1 | 0.98 | 0.10 | 0.85 | 0.80 | 1.20 | 0.98 | 0.10 | 0.88 | 0.80 | 1.21 | |
| β2 | 1.40 | 0.05 | 0.00 | 1.31 | 1.50 | 1.42 | 0.05 | 0.00 | 1.33 | 1.52 | |
| β3 | 0.92 | 0.16 | 0.63 | 0.66 | 1.29 | 0.94 | 0.17 | 0.72 | 0.66 | 1.33 | |
| β4 | 0.50 | 0.14 | 0.02 | 0.29 | 0.88 | 0.53 | 0.16 | 0.03 | 0.30 | 0.95 | |
| β5 | 0.78 | 0.12 | 0.09 | 0.58 | 1.04 | 0.77 | 0.12 | 0.11 | 0.56 | 1.06 | |
| β6 | 0.99 | 0.18 | 0.96 | 0.69 | 1.43 | 1.03 | 0.20 | 0.87 | 0.70 | 1.52 | |
| β7 | 0.36 | 0.08 | 0.00 | 0.23 | 0.55 | 0.42 | 0.09 | 0.00 | 0.27 | 0.64 | |
| β8 | 0.68 | 0.22 | 0.23 | 0.36 | 1.29 | 1.05 | 0.36 | 0.90 | 0.53 | 2.08 | |
| β9 | 1.35 | 0.68 | 0.55 | 0.50 | 3.62 | 1.37 | 0.82 | 0.60 | 0.42 | 4.42 | |
| β10 | 1.19 | 0.17 | 0.23 | 0.90 | 1.57 | 1.12 | 0.16 | 0.44 | 0.84 | 1.49 | |
| β11 | 0.98 | 0.00 | 0.00 | 0.99 | 1.00 | 0.99 | 0.00 | 0.00 | 0.97 | 1.00 | |
| CI: Confidence interval, OR: Odds ratio, SE: Standard error, P: p-value. | |||||||||||
Table 3.
Deff and Deft values for survey weighted and level weighted model estimates.
| Model estimates | Survey weighted model | Level weighted model | |||
|---|---|---|---|---|---|
| Deff | Deft | Deff | Deft | ||
| β1 | 1.52 | 1.23 | 1.13 | 1.07 | |
| β2 | 1.31 | 1.14 | 1.01 | 1.00 | |
| β3 | 1.32 | 1.15 | 0.95 | 0.97 | |
| β4 | 1.79 | 1.34 | 1.02 | 1.01 | |
| β5 | 1.18 | 1.09 | 1.15 | 1.07 | |
| β6 | 1.58 | 1.26 | 1.42 | 1.19 | |
| β7 | 1.75 | 1.32 | 1.48 | 1.22 | |
| β8 | 1.01 | 1.01 | 1.32 | 1.15 | |
| β9 | 0.91 | 0.95 | 1.14 | 1.07 | |
| β10 | 1.51 | 1.23 | 1.41 | 1.19 | |
| β11 | 1.43 | 1.19 | 1.10 | 1.05 | |
| Deff: Design effect, Deft: Design factor. | |||||
Disclaimer/Publisher’s Note: The statements, opinions and data contained in all publications are solely those of the individual author(s) and contributor(s) and not of MDPI and/or the editor(s). MDPI and/or the editor(s) disclaim responsibility for any injury to people or property resulting from any ideas, methods, instructions or products referred to in the content. |
© 2023 by the authors. Licensee MDPI, Basel, Switzerland. This article is an open access article distributed under the terms and conditions of the Creative Commons Attribution (CC BY) license (http://creativecommons.org/licenses/by/4.0/).
Copyright: This open access article is published under a Creative Commons CC BY 4.0 license, which permit the free download, distribution, and reuse, provided that the author and preprint are cited in any reuse.


