
Submitted:
14 March 2023
Posted:
15 March 2023
You are already at the latest version
Abstract
In this article, we analyse the determinants of Regulatory Quality-RQ for 193 countries in the period 2011-2020. We use a database from ESG-Environment Social Governance of the World Bank. We apply OLS, Panel Data with Fixed Effects and Panel Data with Random Effects. We found that the variables that have the most positive impact on RQ, among others, are “GHG Net Emission”, “Mean Drought Index”, and “Heat Index”. We also found that the variables that have the most negative impact on RQ are among others “Renewable Energy Consumption”, “Voice and Accountability” and “Rule of Law”. Furthermore, we have applied the k-Means algorithm optimized with the Elbow Method and we find the presence of five clusters. In adjunct, we confront eight machine learning algorithms to predict the value of RQ and we found that the best predictor is Polynomial Regression. The predictive level of RQ for the analysed countries is expected to diminish of -1,29%. In the end, we present a network analysis with the Euclidean distance and we found the presence of a structure of seven networks using augmented data.
Keywords:
Analysis of Collective Decision-Making
; General
; Political Processes: Rent-Seeking
; Lobbying
; Elections
; Legislatures
; and Voting Behaviour
; Bureaucracy
; Administrative Processes in Public Organizations
; Corruption
; Positive Analysis of Policy Formulation
; Implementation
1. Introduction-Research Question
In this article, we
estimate the level of RQ i.e., the perception of the ability of governments to promote the development of the private sector. The level of RQ as an index
varies in a range between -2.5 to 2.5. Specifically, we analysed the relationship between RQ and a set of indicators related to the World Bank's
ESG. In particular, RQ is an indicator which is part of the governance section and which has been analysed in its relationships with other variables relating to the environment and the social dimensions. The ESG model has been proposed as a tool for achieving sustainability.
In fact, although the orientation towards the market society and the development of the private sector may seem trivial, we are witnessing a retreat of the private sector following a series of crises that have occurred recently. Covid-19, the Russo-Ukrainian war, inflation, the energy crisis, have once again placed the role of the state and the public economy at the centre, even in Western societies inspired by Anglo-Saxon capitalism. This succession of adverse macro-phenomena has in fact considerably weakened businesses, especially small and medium-sized enterprises, compressed the income of workers and families, and reduced life expectancy together with the size of the share capital of the population.
However, the Western capitalist system needs to invest in the private sector, as the private sector provides important products, services and jobs that are essential for the development of economic, political, and social systems, also in the sense of sustainability. In fact, if it is true that access to the energy transition follows the trend of the Environmental Kuznets Curve, then it is necessary to further strengthen the private sector to ensure that the conditions are created for accessing the green economy.
Hence the need to focus on a set of elements that are not only aimed at a governance dimension, and which are instead also able to grasp aspects relating to the environment and the social dimension. No less important is also the question of social participation in political and democratic issues. In fact, countries that have high levels of RQ, i.e., Western countries, also experience a set of limitations in accessing democracy, as evidenced by growing inequality, abstentionism and violent phenomena such as the assault on the Capitol Hill in the US of the 6 January 2021.
It is therefore necessary to find a new sustainable balance between social, environmental and governance issues, and aim at strengthening private production that has been put to the test by the succession of adverse macro-economic phenomena.
The article continues as follows: the second paragraph contains an analysis of the literature, the third presents the econometric model, the fourth shows the cluster analysis, the fifth analyses the prediction with machine learning algorithms, the sixth implements the network analysis, the seventh concludes. The appendix presents supplementary statistics, metrics and methodologies.
2. Literature Review
In the following part we present a brief literature review, just to introduce the topic. In general, we have verified that RQ has positive effects on economic growth, economic development, financial development, energetic transition, and environmental sustainability.
RQ has no meaning in promoting economic growth in Middle East and Northern African-MENA countries [1]. RQ has a relevant role in promoting financial institutions in African countries [2,3,4]. There is a positive relationship between RQ and environmental degradation in Sub-Saharan African countries [5]. RQ has a positive impact in reducing emissions in Brazil, Russia, India, China, and South Africa, i.e., BRICS countries, in the long run [6]. RQ has a relevant role in Brazil even if not all the laws are effectively implemented in the legal system [7]. RQ has a negative impact on economic development in the short run and a positive one in the long run in the Economic Community of Western African States-ECOWAS [8,9]. RQ has a negative impact on the inverse relationship between non-renewable energy and life expectancy in African countries [10]. RQ is positively associated to the adoption of renewable energies in a panel of 85 countries [11]. RQ has a positive effect in boosting the contribution of Foreign Direct Investments-FDI on the exports of high tech products in developing countries [12]. Historical, institutional and democratic factors can explain the heterogeneity in terms of RQ among European countries [13]. RQ positively affect tourism in India [14]. RQ has a positive impact in promoting the economic performance either in oil either in non-oil developing countries [15]. RQ positively affect the stock market performance in a composite set of 23 countries [16]. Countries with higher levels of RQ recovery faster in case of financial distress [17]. There is a positive relationship between RQ and the ability of multi-Latinas to produce quality accounting reports in the period 2014-2020 for a sample of 77 corporations [18]. RQ promotes financial inclusion and inclusive growth in Nigeria [19]. RQ is associated to a reduction in infant and maternal mortality in Sub Saharan Africa [20]. RQ is an essential tool to promote an increase in per capita income in 35 European countries [21]. RQ has a positive effect in boosting the finance-growth nexus [22]. The low level of RQ in Pakistan is negatively associated to banking financial stability [23]. RQ improves environmental sustainability in a set of 177 countries [24]. RQ has a negative effect in attracting Chinese FDI in Africa [25]. RQ has a positive impact on the reduction of electricity prices in Europe [26]. There is a positive relationship between RQ and Initial Public Offerings-IPOs in Pakistan [27].
In synthesis, we can see that there are positive effects that RQ produces on economic performance and environmental sustainability. Either developed countries either developing countries should create the conditions to improve the level of RQ. The orientation toward private property, economic freedom and the liberalization of private sector have positive on the economic and social development of developed and developing countries.
- Table.
| Synthesis of the Literature Review by Main Themes | |
| RQ , Economic Growth and Development | [1,4,8,12,15,21,25], |
| RQ, Financial Sector and Financial Markets | [2,3,9,16,17,22,23] |
| RQ, Environment and Energy | [5,6,10,11,24,26] |
| Miscellaneous | [7,13,14,18] |
| RQ, Social and Demographic Issues | [19,20] |
3. The Econometric Model for the Estimation of the Value of Regulatory Quality
We have estimated the level of Regulatory Quality in 193 countries in the period 2010-2021 using a set of econometric techniques i.e., Panel Data with Fixed Effects, Panel Data with Random Effects, Pooled OLS. Specifically we have estimated the following equation:
We find that the level of Regulatory Quality is positively associated to the following variables i.e.:
GHG net emissions/removas by LUCF: It is a variable that takes the net emissions of GHG as a reference point considered as net changes of the levels of greenhouse gases in the atmosphere. Countries that have the most the levels of RQ are also the countries that have the greatest levels of GHG. In fact, since these are industrialized western countries, they have high levels of GHG emissions. Since RQ allows to enhance the private sector, it follows that these countries have a more solid industrial system with the development of and industrial system that have a negative impact for the environment. In addition, the countries that have larger levels of RQ have also greater GHG emissions following the greater distribution of polluting cars and means of transport. It follows that the set of industrial production activity and population consumption models in western countries tends to
generate growth in terms of GHG. The green oriented policies that most countries have embraced should reduce the level of GHG.
Mean Drought Index: it is a measure of drought. Countries that have larger levels of RQ also tend to have greater drought levels. However, the growth of drought is a generalized phenomenon connected to the climate change. It is very difficult to evaluate whether the green oriented economic policies that have been designed by Western countries are able to introduce changes in terms of reversal of the phenomenon of drought. However, the reduction of rains, the retreat of glaciers in Europe poses problems both to agriculture, and industry and the population in general. It is very probable that in the future the phenomenon of drought will be even more relevant worldwide by decreeing a condition of difficulty of the countries that could generate food famine and economic and financial crises.
Heat Index 35: is an indicator that considers the average number of days per with a temperature above 35 Celsius degrees. There is a positive relationship between the RQ and the Heat Index 35. It follows that the western countries with high per capita income, which are the same that have high levels of RQ, experience a growing temperature. The number of days in which the temperature grows above 35 degrees tends to increase in countries with high RQ levels. This condition is serious as it involves growth in energy expenditure for air conditioners, with a further aggravation of polluting emissions, a growth in energy consumption and the worsening of global climatic condition. The positive relationship between RQ and Heat Index 35 suggests the urgency of a legislation sensitive to the environmental question in high-income-income countries to counter the adverse effect of the climate change.
School Enrolment primary and secondary, gender parity index: is an indicator that takes into consideration the ratio between girls and boys enrolled in both public and private primary and secondary schools. There is a positive relationship between the RQ and the value of gender equality in primary and secondary schools. Hence the consideration that the countries that have a higher RQ also have the possibility of experiencing greater gender parity. The presence of legislation in favour of the private sector is not only an economic fact, but also have social effects promoting the civil emancipation of female students and workers. In fact, the promotion of the private economy leads to a greater presence of women in the labour market, and therefore society accepts more easily that women can study and train to actively participate in the production of added value at a national level. It follows that even the primary and secondary education sectors are involved in the process of women's emancipation by offering training not only oriented towards work but also towards citizenship, social activism and civil protagonism.
Research and Development Expenditure % of GDP: is a variable that considers spending on research and development as a percentage of GDP. This indicator takes into account either the capital expenditures either the current expenditures in four sectors i.e.: private for-profit sector, government, public education, and private non-profit. Expenditure on Research and Development covers basic research, applied research and experimental development. There is a positive relationship between the value of R&D expenditures and RQ. Indeed, countries that have high RQ levels also tend to have a more entrepreneurially active private sector. To be able to compete, companies need to invest in research and development to produce new goods and services. Furthermore, since many of the countries that have high levels of RQ are also democratic countries, it follows that also the public sector and the non-profit sector, as well as the education sector, are engaged in research and development, to offer new services and products to citizens. This demand for research and development by the private, public and non-profit sectors generates a growth in R&D expenditure as a percentage of GDP, which leads countries leading in RQ to also be world leaders in science and technology.
Annualized Average Growth in per capita real survey mean consumption or income, total population: is a variable that considers the average growth rate of consumption of the population. The rate is considered per capita in relation to the real income of the population. The data is acquired through sample surveys on households relating to income distribution over five-year periods. Average consumption or per capita income is measured on the basis of 2017 PPP purchasing power parity. There is a positive relationship between countries that have high levels of RQ and countries that have high levels of consumption based on per capita income growth rates. This condition derives from the fact that the countries that have high levels of RQ are also countries that have high levels of per capita income, where the labour force is larger, and household consumption tends to grow either in connection with GDP growth either in application of redistributive policies. Therefore, the promotion of a legislation favourable to the private sector increases the possibility of households to consume and raises the standard of living of the population.
Forest Area as percentage of land area: is a variable that considers the forest area without considering the trees that are planted for agricultural production, the trees in parks and urban gardens. There is a positive relationship between the RQ value and the value of forest areas not dedicated to agriculture. This structure is mainly due to the presence among the top countries in terms of RQ of some countries such as Finland, which has an amount of forest areas equal to 73.72%, Sweden with a corresponding value of 68.69%. But, we also have to consider that the average coefficient of the regression is equal to 0,079903 i.e. a value close to zero. This means that even if there is positive relationship between RQ and the degree of forest area as percentage of land, it is a value that is closed to zero.
Energy intensity level of primary energy: is a variable that considers the relationship between energy supply and gross domestic product at purchasing power parity. It is a measure that calculates the relationship between the energy consumed and the gross domestic product. If the ratio grows, it means that an increasing value of energy is required to produce a certain amount of output. Conversely, if the value decreases, it means that fewer energy resources can be used to produce a certain amount of energy. Countries that have an increasing level of RQ also have an increasing level of energy use per amount of value added produced. This positive relationship is because countries that have high levels of RQ are also countries that have highly evolved industrial systems that require the use of large energy sources. Furthermore, they are also countries in which the service sector plays a significant role that is generally located in densely populated areas with a great consumption of energy.
Adjusted savings natural resources depletion: is a variable that calculates the value of the depletion of natural resources, i.e. forests, mineral resources and energy. There is a positive relationship between countries that have high levels of RQ and countries that have high levels of natural resource depletion. This relationship is because the countries that have high levels of RQ are also the countries that exploit their territory more intensely from the point of view of natural resources. This trend obviously highlights the inefficiency of the economic policies put in place to combat climate change, at present. However, it is highly probable that the positive effects of environmental economic policies will occur over a long period of time without considering highly improbable phenomena that could reduce the probability of a real energy transition such as, for example, in the case of conflict, famine or decreases in the international trading. However, this report highlights how difficult it is at present to refer to the energy transition that has taken place in upper-middle income countries.
People using safely managed drinking services as percentage of population: is a variable that considers the percentage of people who drink potable water from improved sources. Improved sources include piped water, boreholes, protected wells, protected springs, packaged water. There is a positive relationship between the percentage of the population drinking potable water from improved sources and RQ. This relationship may be because in countries with a high RQ, there are also more evolved markets, and companies, both public and private, operating in the extraction and distribution of water. This condition makes it possible to increase the percentage of the population that has access to water. However, from a strictly metric point of view, it is necessary to consider that the average of the value estimated with the econometric models for the variable analysed is equal to 0.015 units. This is a small value, close to zero. It therefore follows that the relationship is weakly positive on average and that it could easily change in the future in the presence of even marginal modifications in the markets for water extraction, processing and distribution.
Mortality rate under-5: is an indicator that considers the probability in 1,000 that a new-born will die before reaching the age of five. There is a positive relationship between this indicator and the RQ value. However, it is necessary to consider that the average value deriving from the application of the econometric models tested for the variable of interest is equal to 0.001477. This is evidently a positive value, however close to zero. Therefore, it might be correct to refer to a weak positive relationship between the two variables or to a potential neutrality. In fact, since the countries that have a high level of RQ are also the countries that have the highest levels of health services, it follows that the presence of a positive relationship between the RQ and infant mortality under five has low credibility. However, the metric analysis in this case suggests that the relationship between the two variable is close to zero.
Fertility Rate Total: is a rate that considers the number of children that would be born to a woman if she lived to the end of her childbearing years and gave birth according to average fertility rates calculated at country level. There is a positive relationship between the value of the total fertility rate and the RQ value at the country level. However, also in this case, as in the previous one, the average value deriving from the analysis of the various econometric models proposed is low and basically equal to zero, i.e.: 0.001201. In fact, the countries that have a high RQ, i.e., the Western countries, also have a low birth rate, with a demographic balance in the balance in many countries. Furthermore, very often in countries with a high RQ it is immigrants who keep the birth rate high. However, in the proposed variable it is not possible to distinguish between the birth rate of immigrants and the birth rate of natives. In this sense, therefore, it should be emphasized that this relationship is weakly positive and not perfectly verified for many countries with a high RQ in the western world.
Nitrous Oxide Emissions: Nitrous oxide emissions are emissions
from the combustion of agricultural biomass, industrial activities and
livestock management. There is a positive relationship between the nitrous
oxide value and RQ. This relationship is because countries with a high RQ are
also countries in which a series of activities are widely spread, such as, for
example, breeding and the combustion of agricultural biomass, as well as
industrial emissions. However, the mean value of the econometric relationship
estimated through a set of models is very small and equal to an amount of
0.001201. That is, although this relationship is significant in terms of
p-value, it turns out to be substantially very close to zero from a
quantitative point of view.
We also find that the
level of Regulatory Quality is negatively associate to the following variables:
Energy Use: is a variable that takes into consideration the value of energy
consumption with respect to the development of production, household
consumption and transport systems. However, energy consumption does not depend
only on demand, as it is also sensitive to the price of energy and a series of
climatic, geographical and economic factors. Energy consumption tends to be
growing either in low middle income either high-income countries. The growth in
energy consumption and the growth in energy prices has prompted many
governments to consider energy economic policies as strategic with respect to
industry and households welfare. Energy efficiency makes it possible to reduce
emissions and improve energy security. There is a negative relationship between
countries that have high RQ levels and countries that have a high level of
energy use. This condition is because countries that have high levels of RQ
also have more efficient energy markets in terms of both production and
distribution and also have available technologies that can allow the
application of energy savings. Furthermore, countries that have a high RQ, also
thanks to the development of the private sector, offer their customers, be they
households or businesses, a set of alternative options relating to the
possibility of sourcing energy at affordable prices.
Strength of legal rights index: measures the degree to which
collateral and bankruptcy laws protect the rights of borrowers and creditors
and thereby facilitate lending. The index ranges from zero to 12, with higher
scores indicating these laws are better designed to expand access to credit.
There is a negative relationship between the RQ value and the value of the
legal rights index. This indication indicates that in countries with a high
level of RQ there are no excessively favourable laws towards creditors. This
condition may seem paradoxical. However, it is the improvement in the condition
of the debtors that has allowed the development of the credit system. A
legislation more favourable to debtors can promote deeper culture of risk in
business and economic organizations. Countries that have too strict legislation
on debtors can inhibit the ability of economic operators to invest in business
activity. In this case, the insolvent debtors could look with concern at the
consequences of a failure to repay the loan with a reduction in the investment
in risk capital and in the business activity. The market society is based not
only on easier access to credit but also on the tolerance of the failures of
entrepreneurs and companies.
Renewable Electricity Output: is the share of electricity generated by
renewable energy plants in the total electricity generated by all types of
plants. There is a negative relationship between the RQ value and the value of
renewable electricity output. This relationship indicates that countries that
have high RQ levels have low levels of renewable energy output. In fact, the
percentage of renewable energy output tends to be high for countries with low
per capita income, especially African countries, which also have a low level of
institutional quality. There are however exceptions. In fact, Norway,
Switzerland, Austria and Iceland have high levels of both RQ and of renewable
electricity outputs thanks to the use of hydroelectric and geothermal energy.
The other high-middle-income countries that also have high levels of RQ instead
tend to have a low value of renewable electricity output and consume an energy
mix characterized by high levels of non-renewable energy such as coal and oil.
However, it is probable that with the change in environmental policies at a
global level and the introduction of new technologies for the production of
renewables, there will be a shift in the relationship between RQ and
renewables.
Renewable energy consumption: is the share of renewable energy in
the total final energy consumption. It should be considered that there is a
negative relationship between the consumption of renewable energy and the
global RQ value. This condition is due, as in the case of the previous point,
to the fact that countries with high per capita incomes, which are also
countries with high RQ levels, tend to consume low values of renewable energy
compared to countries low per capita income. Economic growth is an
energy-intensive process, which requires the use and consumption of large
quantities of energy. Since energy efficiency and the continuity of renewables
tends to be variable, then countries with high per capita incomes use energy
mixes in which the non-renewable energy component is significant. It is
probable that the change of technologies that are available for the production
of renewable energy together with the investment in research and development
for sustainable energies could lead in the future to a change in the
relationship between RQ and consumption of renewable energy worldwide.
Voice and Accountability: captures perceptions of the extent
to which a country's citizens are able to participate in the selection of their
government, as well as freedom of expression, freedom of association and
freedom of the media. There is an inverse relationship between the Voice and
Accountability value and the RQ value. This relationship may appear
counterfactual considering that almost all countries that have high levels of
RQ are also democratic countries and therefore should allow a high level of
Voice and Accountability. There are many countries which, although having high
levels of RQ, have low levels in terms of Voice and Accountability with for
example Singapore with respective values of 2.23 and -0.13, United States with
.145 and 0.90, Israel with 0.68 and 1.20, United Arab Emirates with -1.19 and
1.0, and Qatar with -1.17 and 0.86. It therefore follows that the relationship
between RQ and democratic participation can be paradoxical, and even have
negative values, such as those indicated in the econometric analysis
considered.
Rule of Law: captures perceptions of the extent to which officers trust and
respect society's rules, and in particular the quality of contract enforcement,
property rights, police and courts, as well as the likelihood of crime and
violence. There is a negative relationship between the rule of law value and
the RQ value. This is certainly a counterfactual result since generally the two
elements should be closely connected. However, the value of the relationship
turns out to be negative both by controlling for the Random Effects, for the
Fixed Effects and for the Pooled OLS.
- Table.
| Average Value of the Coefficients with Fixed Effects, Random Effects and Pooled OLS. | |
| Variable | Average |
| GHG net emissions/removals by LUCF (Mt of CO2 equivalent) | 452202 |
| Mean Drought Index (projected change, unitless) | 328289 |
| Heat Index 35 (projected change in days) | 205502 |
| School enrolment, primary and secondary (gross), gender parity index (GPI) | 0,34279 |
| Research and development expenditure (% of GDP) | 0,261392 |
| Annualized average growth rate in per capita real survey mean consumption or income, total population (%) | 0,241382 |
| Forest area (% of land area) | 0,079903 |
| Energy intensity level of primary energy (MJ/$2011 PPP GDP) | 0,078297 |
| Adjusted savings: natural resources depletion (% of GNI) | 0,05399 |
| People using safely managed drinking water services (% of population) | 0,015007 |
| Mortality rate, under-5 (per 1,000 live births) | 0,001477 |
| Fertility rate, total (births per woman) | 0,001201 |
| Nitrous oxide emissions (metric tons of CO2 equivalent per capita) | 0,000119 |
| Energy use (kg of oil equivalent per capita) | -6,8E-05 |
| Strength of legal rights index (0=weak to 12=strong) | -0,00372 |
| Renewable electricity output (% of total electricity output) | -0,00469 |
| Renewable energy consumption (% of total final energy consumption) | -0,00873 |
| Voice and Accountability: Estimate | -0,02077 |
| Rule of Law: Estimate | -0,55617 |
4. Rankings and Clusterization with the k-Means Algorithm Optimized with the Elbow Method
There is a great
heterogeneity among countries for the level of RQ. The top ten countries in
2021 are: Singapore with a level of RQ equal to 2,2310 followed by Luxembourg
with 1.9152, Finland with 1.89, Australia with a level of 1.83, Denmark with
1.80, New Zealand with 1.80, Netherlands with 1.75, Sweden with 1.75,
Switzerland with 1.73, Norway with a level of 1.63. In the middle of the
ranking there are the following countries i.e., Turkiye with a level of
-0.0819, Trinidad and Tobago with -0.0854, Brazil with -0.1108, Morocco
-0.1217, Vanuatu with -0.1228, Samoa with a level of -0.1668, Bosnia and
Herzegovina with a level of -0.1786, Ghana with a level of -0.2003, Paraguay
with a level of -0.2077, Mongolia with a level of -0.2086, Mexico with a level of
-0.2307. In the final part of the ranking there are the following countries
i.e. Iran with -1.6223, Syrian Arab Republic with -1.6289, Equatorial Guinea
with -1.7128, Somalia with -1.8172, Libya with -1,9512, South Sudan with
-1.9846, Yemen with -2.0079, Turkmenistan with -2.0188, Venezuela RB with a
level of -2.1957, Eritrea with -2.2687, North Korea with -2.3274. Only 84
countries over 191 have a positive value of RQ. This means that the vast
majority of countries i.e. the 53% of world countries have negative values of
RQ i.e. miss an institutional and legal framework able to promote the
development of the private sector. This result counterfactual since it contrast
with the idea of diffusion of capitalism and market society as a unique
institutional framework for the global economy. There more than 100 countries
in the world economy that have a legislative order that is inefficient in
promoting the private sector and property rights.
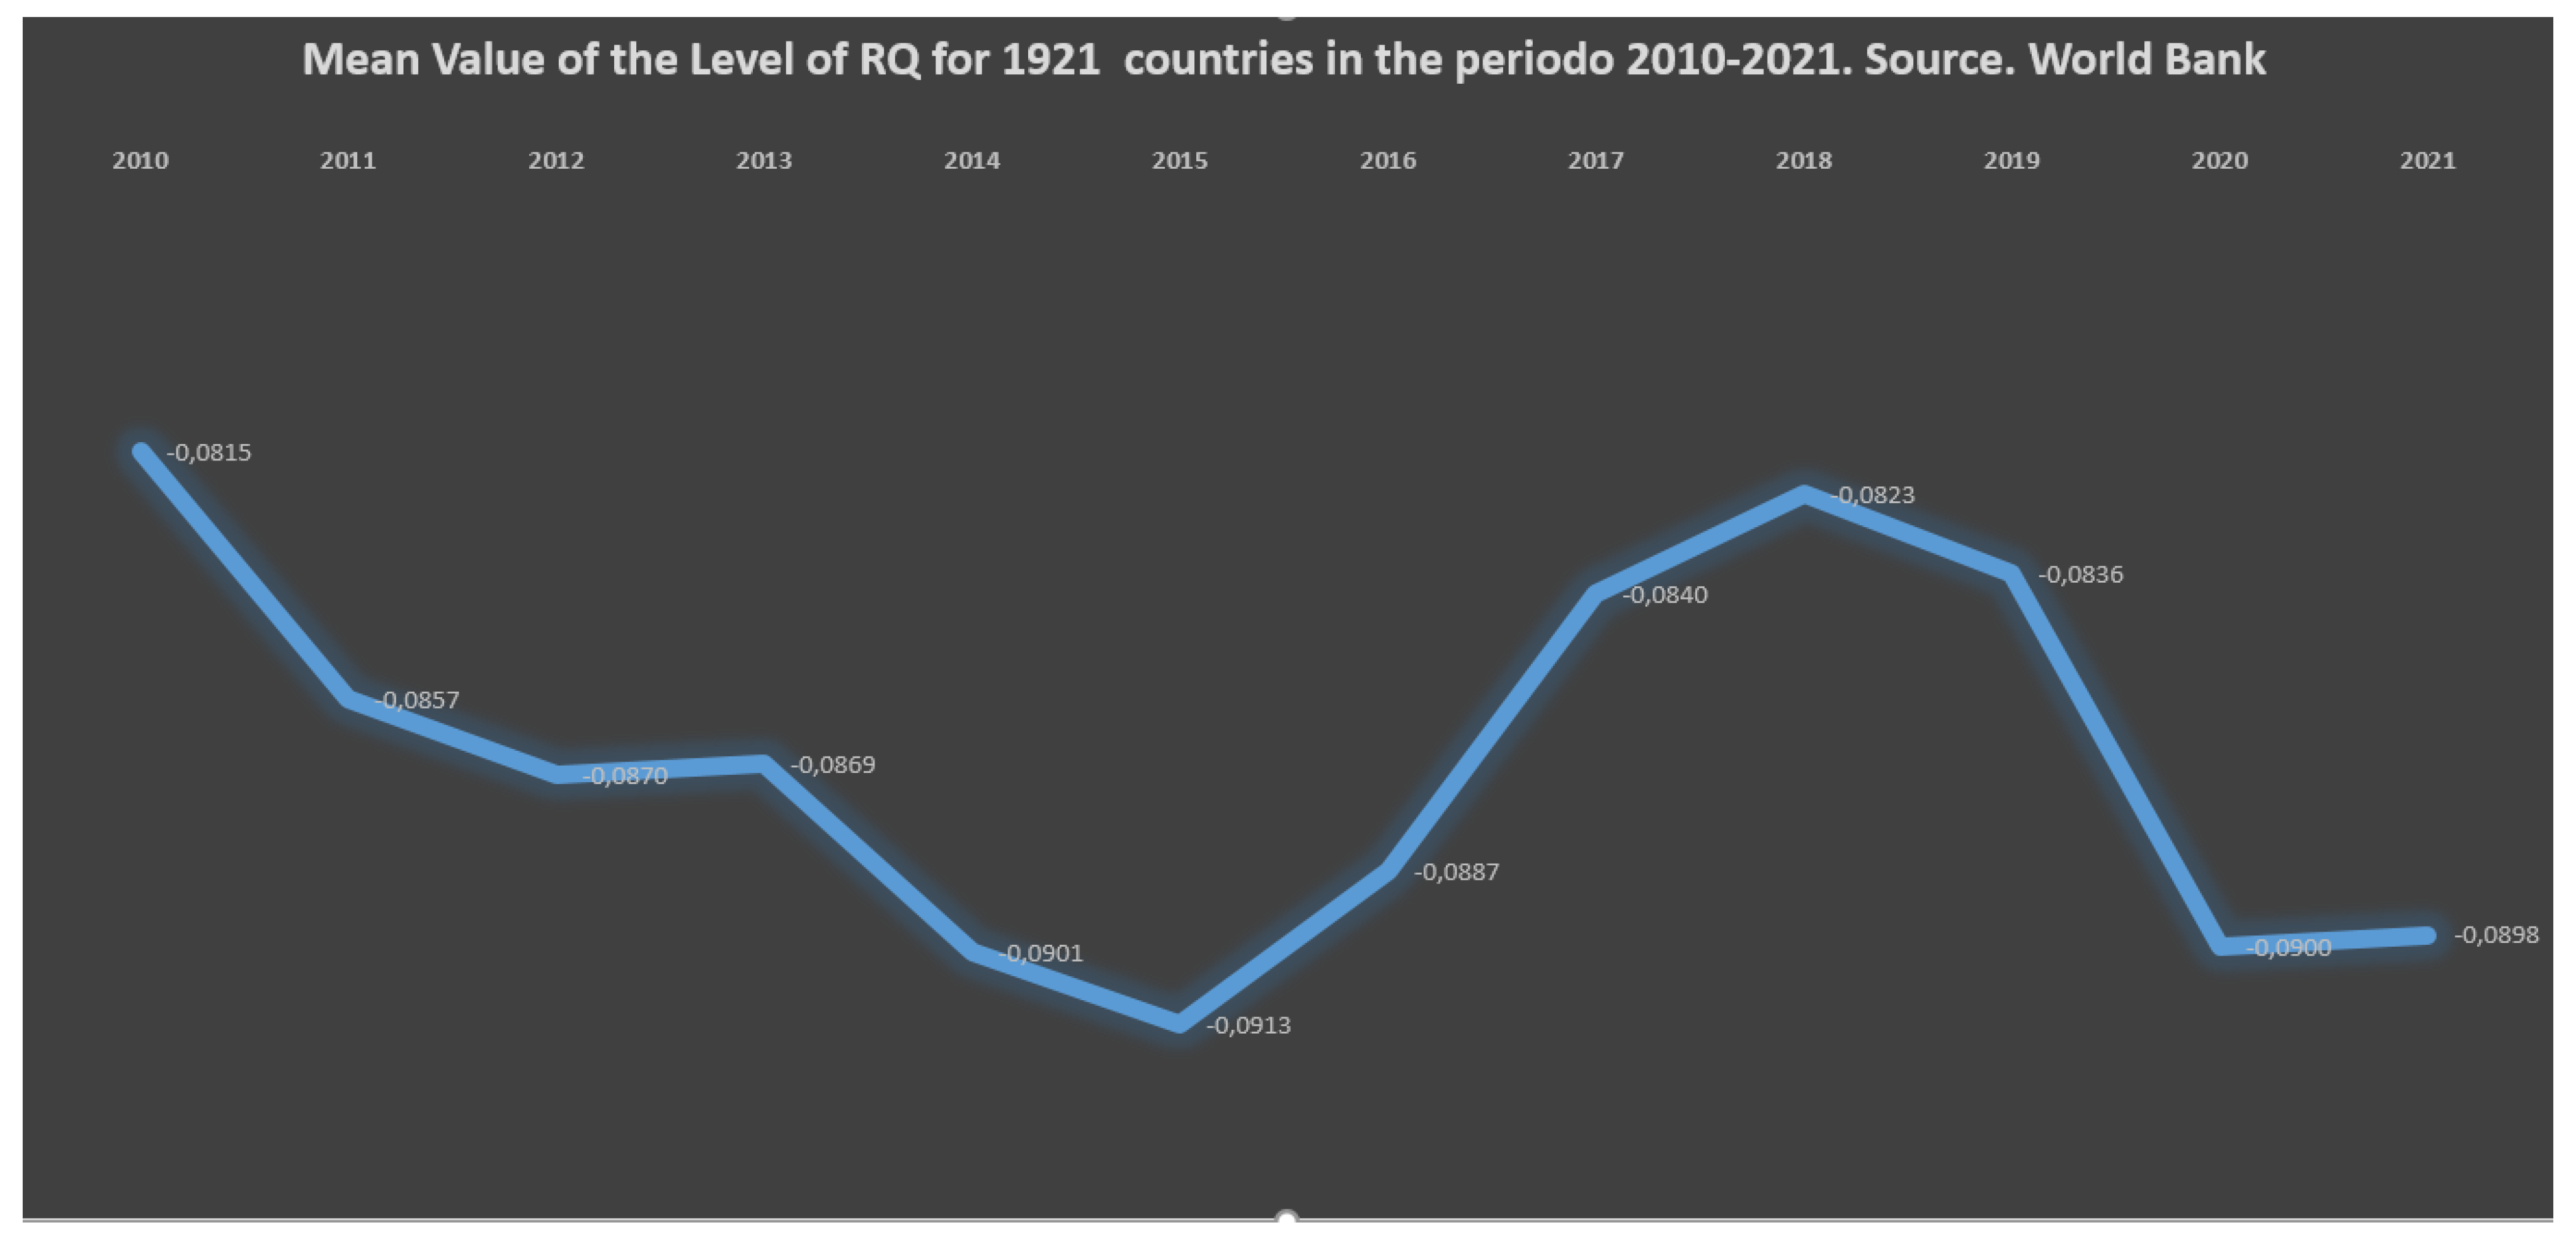
Figure 1.
Mean value of RQ for 191 countries in the period 2010-2021.
If we consider the
percentage variation of RQ in the period 2010-2021 we can see that the first
ten countries are: United Arab Emirates with a level of RQ equal to +218.27%
equal to 0.70 units, the El Salvador with a level of RQ equal to +201.97% equal
to -0.68 units, Indonesia with a level of +178.29% equal of 0.68, Uganda with a
level of +136.86% equal to -0.28 units, Saudi Arabia with a level of +110.26%
equal to 0.18 units, Fiji with a value of +99.20% equal to 0.56 units, Vanuatu
with a level of +84.29% equal to 0.66 units, India with a value of +80.80%
equal to 0.33 units, Georgia with a level of +80.78% equal to 0.47 units,
North Macedonia with a level of +75.42% equal to 0.18 units. In the middle of
the ranking there are Denmark with a percentage variation of -3.47% equal to
-0.07 units, followed by Ireland with -3.47% equal to -0.06 units, and
Micronesia Fed. Sts equal to -4.24% equal to -0.03 units, Eritrea with a level
of -4.88% equal to -0.11 units, followed by Zambia with a level of -5.34% equal
to -0.03 units, Suriname with a level of -5.61% equal to -0.04 units, France
with a level of -5.69% equal to -0.08 units, Algeria with -5.98% equal to -0.07
units, Chad with a level of -6.88% equal to -0.07 units, Benin with a level of
RQ of -7.40% equal to -0.03 units, Iraq with a level of RQ of -8.05% equal to
-0.08 units. In the final part of the ranking we find Serbia with a level of
-179,39%, followed by Seychelles with -211.47% equal to 0.04 units, Yemen Rep.
with -226.08% equal to -1.39 units, Kenya with -226.56% equal to -0.31 units,
Egypt Arab Republic with a level of -243.22% equal to -0.36 units, Mexico with
-247.58% equal to -0.39 units, Cabo Verde with -286.86% equal to 0.42 units,
Tunisia with -345.03% equal to -0.30 units, Ghana with a level of -473.97%
equal to -0.25 units, Lebanon with -4056.57% equal to -0.91 units, Montenegro
with a level of 6037.36% equal to 0.44 units.
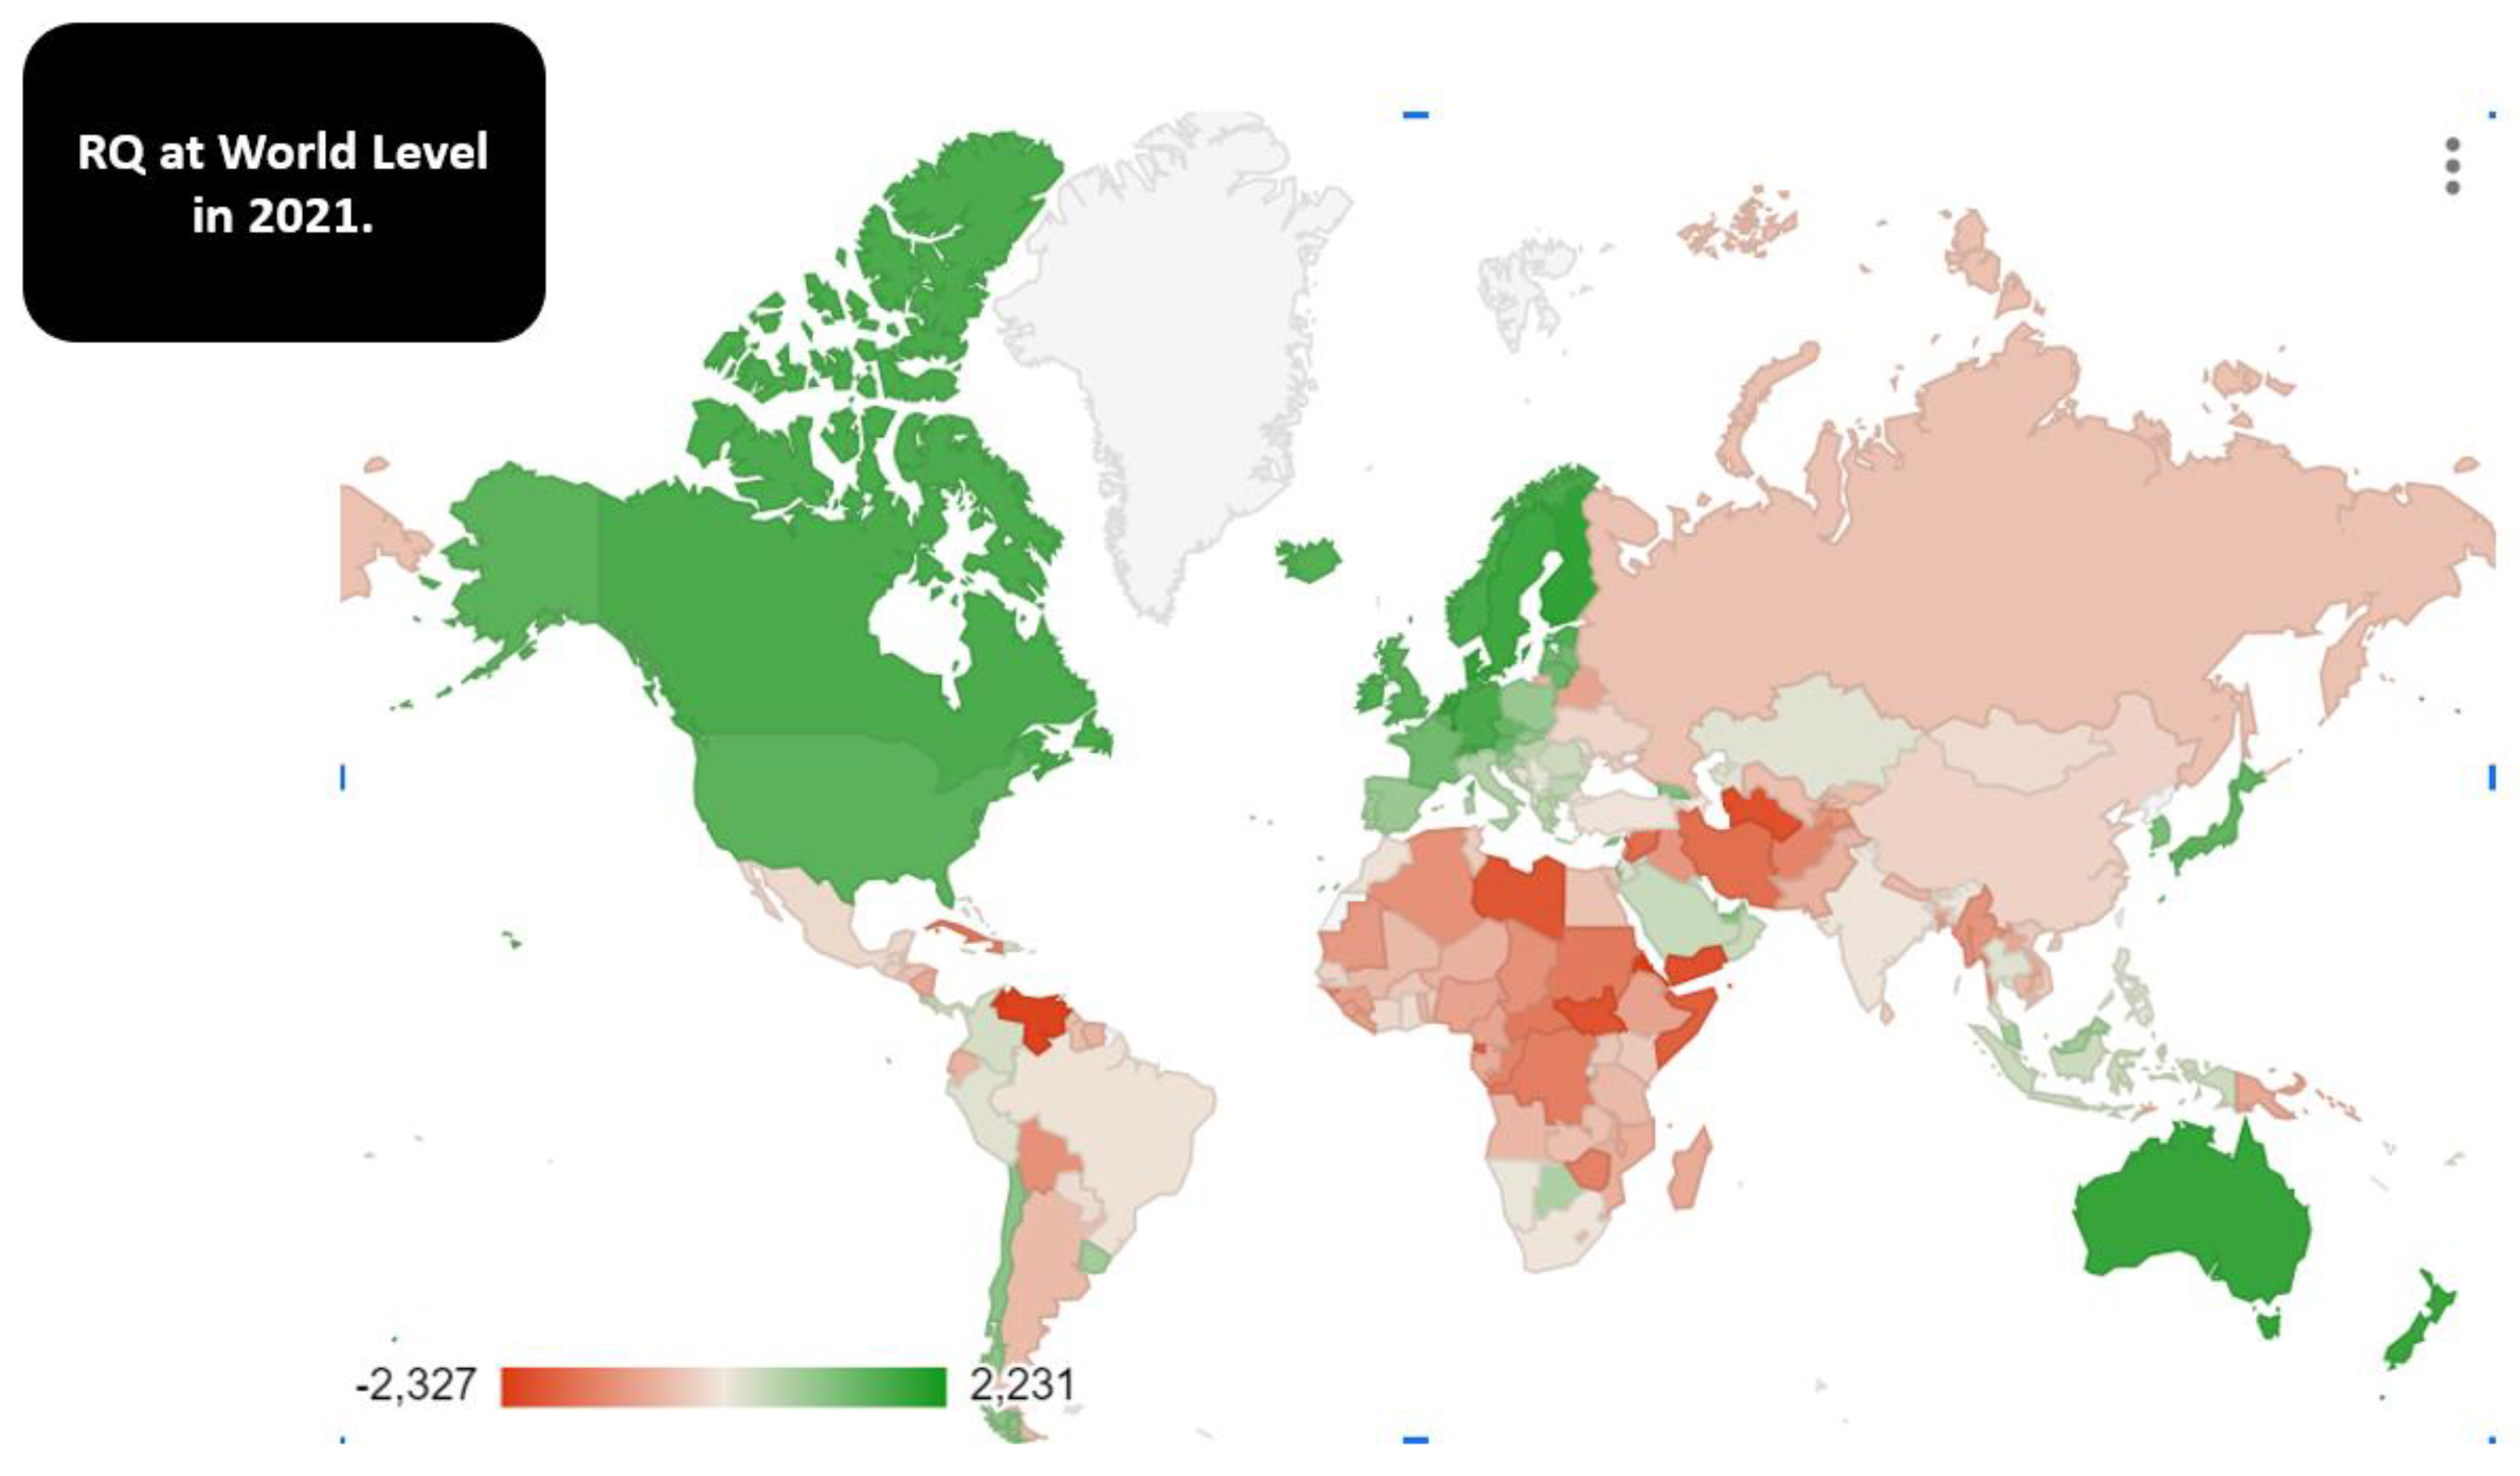
Figure 2.
The map of RQ at world level.
If we consider the mean
value for 191 countries in the period 2010-2021 we can verify a worsening of
the level of RQ in the period 2018-2021. The reduction of the level of RQ
started before Covid-19 in 2018 and continued in the period 2020-2021. The
level of RQ in 2021 during the Covid-19 pandemic reached a low level close to the
absolute minimum of the entire period that was -0.093 in 2015. This result is
coherent with the choices of many governments to improve the public spending
and increase the public control on the private market.
Furthermore we have
applied an unsupervised machine learning technique to verify the presence of
clusters among the data i.e. k-Means algorithms optimized with the Elbow
Method. We find the presence of five clusters as follows:
Cluster 1: Haiti, Yemen
Rep., Myanmar, Comoros, Guinea-Bissau, Afghanistan, Algeria, Central African
Republic, Uzbekistan, Congo rep., South Sudan, Iran, Syrian Arab Republic,
Congo Dem. Rep., North Korea, Cuba, Sudan, Libya, Venezuela, Somalia, Zimbabwe,
Eritrea, Turkmenistan, Equatorial Guinea;
Cluster 2: Italy, Uruguay,
Slovenia, Hungary, Botswana, Qatar, Portugal, Malaysia, Bahrain, Bulgaria,
Costa Rica, Georgia, St. Kittis and Nevis, Slovak Republic, Romania, United
Arab Emirates, Brunei Darussalam, Span, Poland, Barbados, Antigua and Barbuda,
Panama, Peru, Mauritius, Oman, Greece, South Korea, Cyprus, Latvia, Croatia,
North Macedonia, Lithuania;
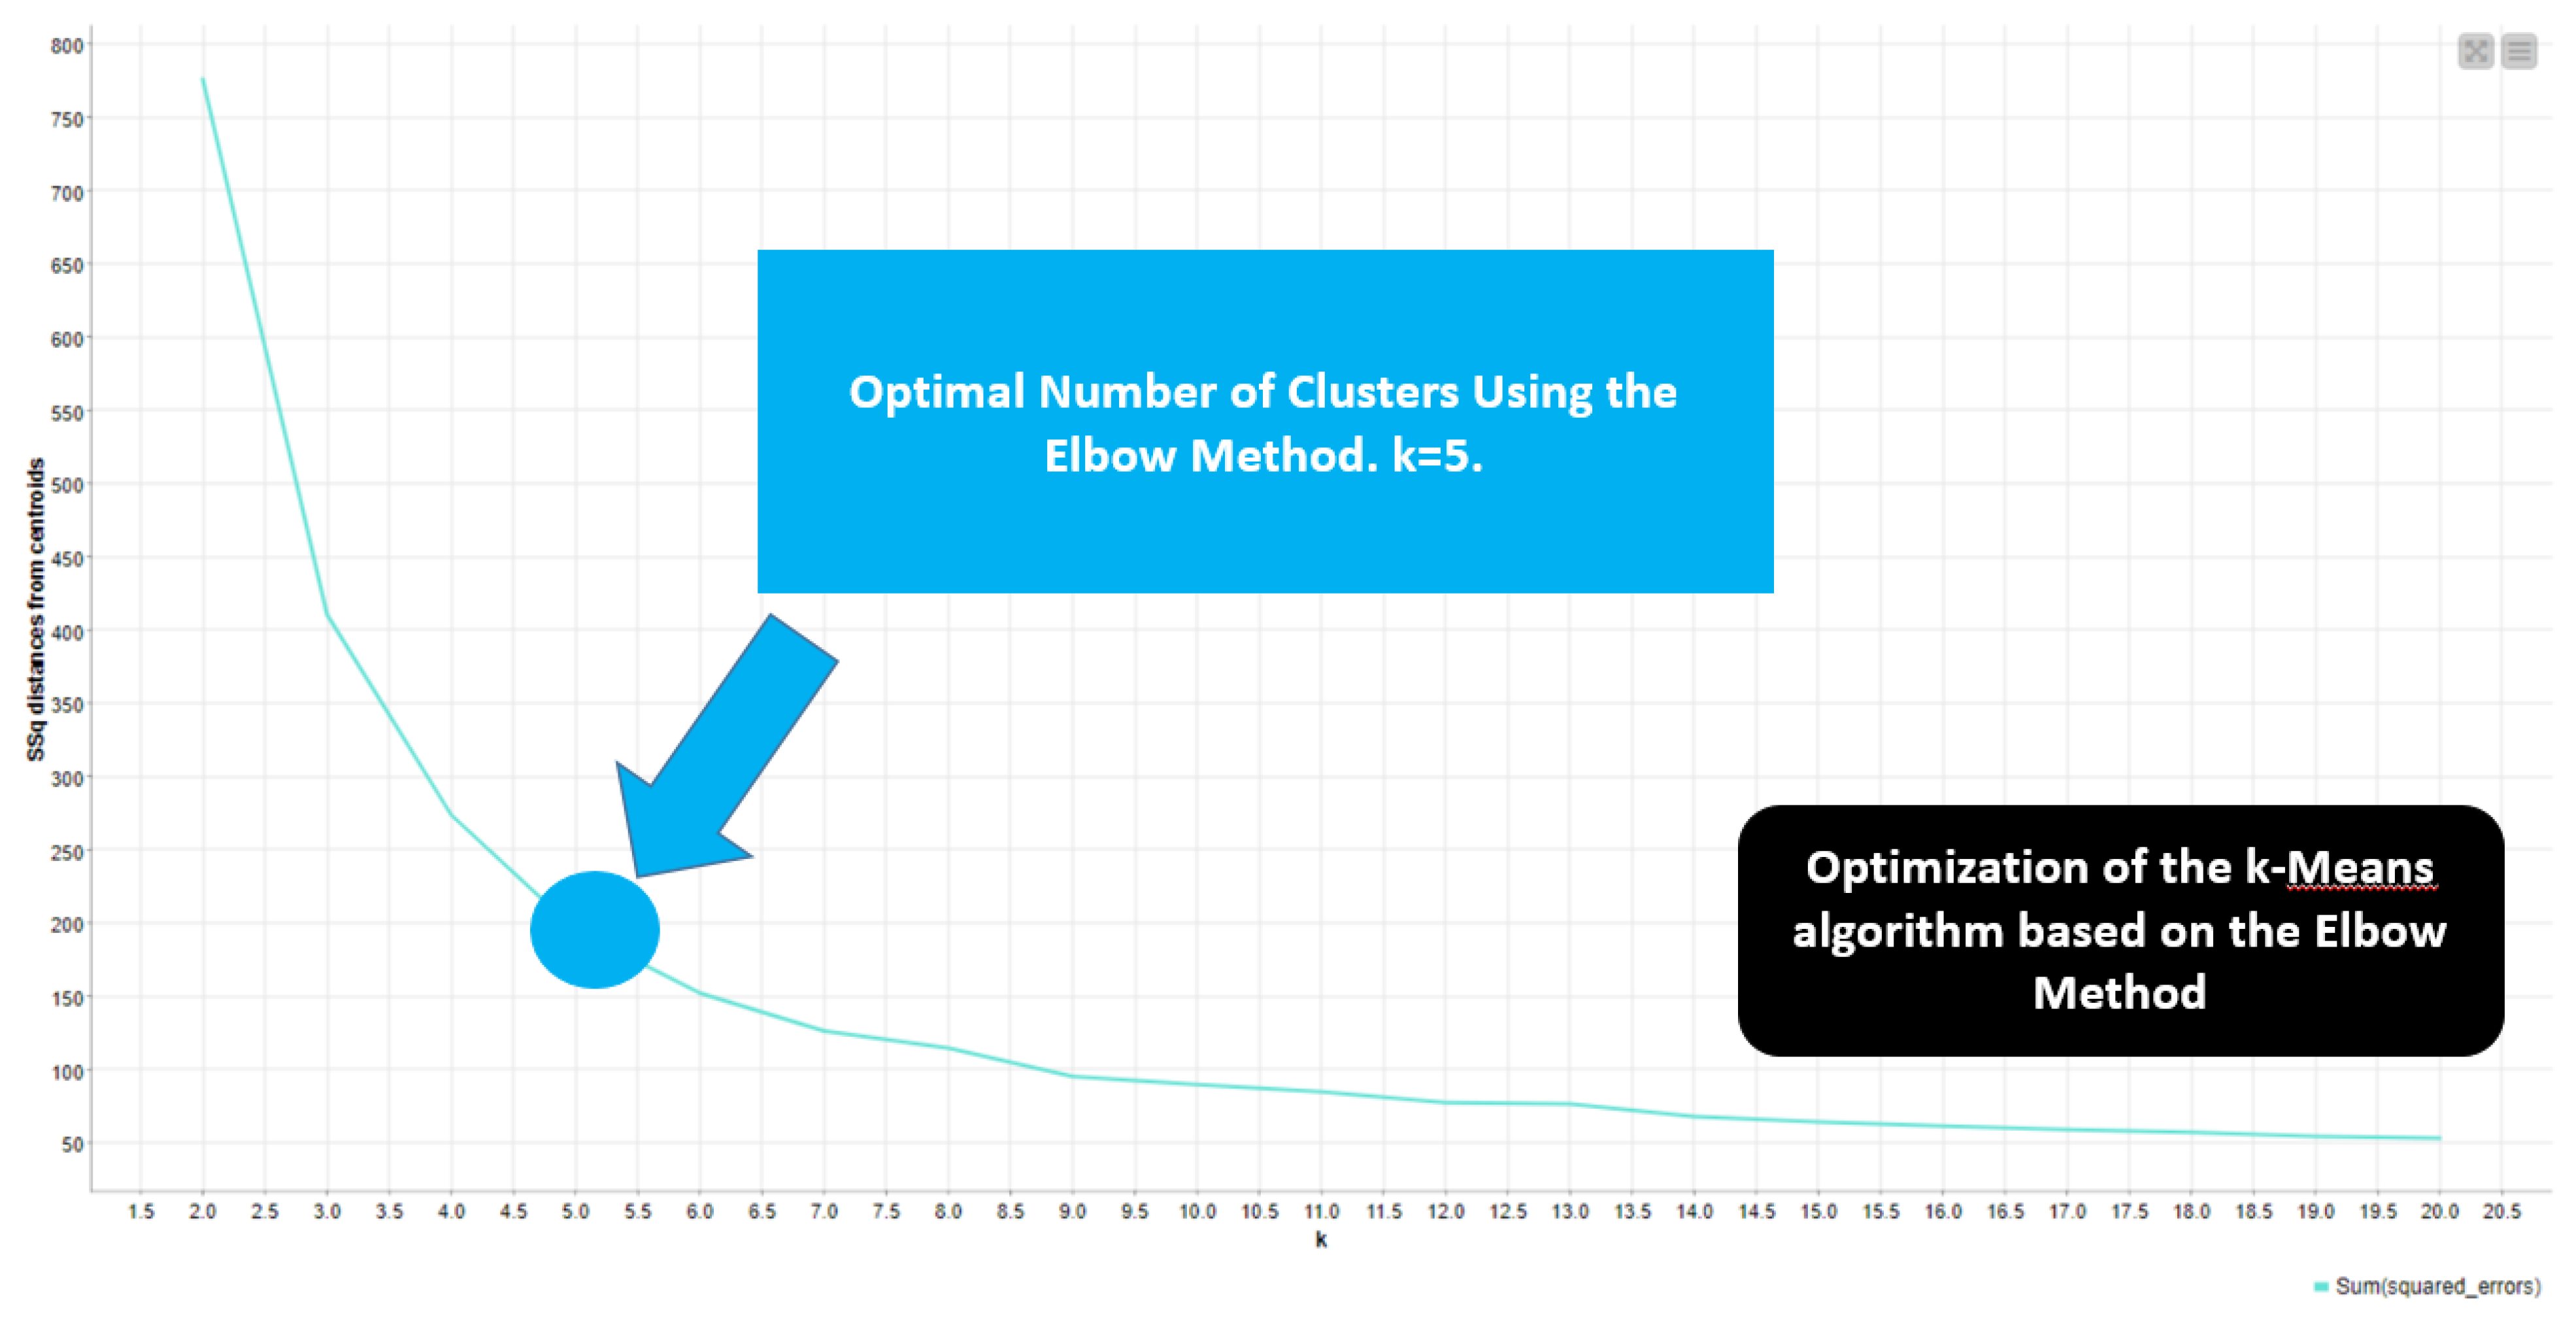
Figure 3.
Optimal number of clusters using the Elbow Method. The number of k is equal to 5.
Cluster 3: Nepal,
Mauritania, Togo, Lao DPR, Malawi, Cameroon, Sierra Leone, Sao Tome and
Principe, Nigeria, Bangladesh, Madagascar, Pakistan, Niger, Djibouti,
Timor-Leste, Guinea, Gabon, Angola, Burundi, Ecuador, Tuvalu, Suriname,
Micronesia Fed Sts., Bhutan, Liberia, Solomon Islands, Mozambique, Mali,
Guyana, Papua New Guinea, Ethiopia, Argentina, Egypt Arab Rep., Kiribati, Cote
d’Ivoire, Nauru, Zambia, Belarus, Tajikistan, Lesotho, Gambia The, Vietnam,
Cambodia, Tanzania, Palau, Vanuatu, Belize, Benin, Nicaragua, Tonga, Marshall
Islands, Iraq, Chad, Maldives, Ukraine, Russian Federation.
Cluster 4: Dominican
Republic, Moldova, Seychelles, Bosnia and Herzegovina, Rwanda, Ghana, Kuwait,
Cabo Verde, Brazil, Serbia, Saudi Arabia, Philippines, Morocco, Namibia,
Thailand, Sri Lanka, Indonesia, Grenada, Jamaica, Kazakhstan, El Salvador, Mongolia,
Senegal, Samoa, Jordan, Paraguay, Trinidad and Tobago, Guatemala, China,
Mexico, Uganda, South Africa, Dominica, Montenegro, the Bahamas, Fiji, Albania,
Turkiye, Armenia, Kenya, Armenia, Kenya, Tunisia, Lebanon, Burkina Faso,
Eswatini, India, Azerbaijan, Kyrgyz Republic, Honduras, Colombia, St. Vincent
and the Grenadines, St. Lucia;
Cluster 5: Canada,
Switzerland, Germany, Norway, United Kingdom, Luxembourg, Australia, Ireland,
Sweden, Finland, Netherlands, Denmark, Estonia, New Zealand, Liechtenstein,
Austria, Singapore, United States, Chile, Belgium, Israel, Iceland, Malta,
Japan, Andorra, France, Czechia.
As we can see, as a
general overview there is a positive relationship between RQ, market societies,
democracies, per capita income, and the level of wellbeing of the population.
However, we do not check for causal relationships. We can only observe that for
countries that have high levels of per capital income, that are democracies and
that recognize the freedoms and rights of the minorities, there is also a
higher level of RQ. Essentially RQ coincides with the western civilization in
the Anglo-Saxon, Scandinavian, European and Japanese-Korean version. This means
that there is a great possibility that the development of a RQ framework is the
result of a certain cultural approach to the institutional building and to the
relationship between political freedom, economic freedom and civil rights.
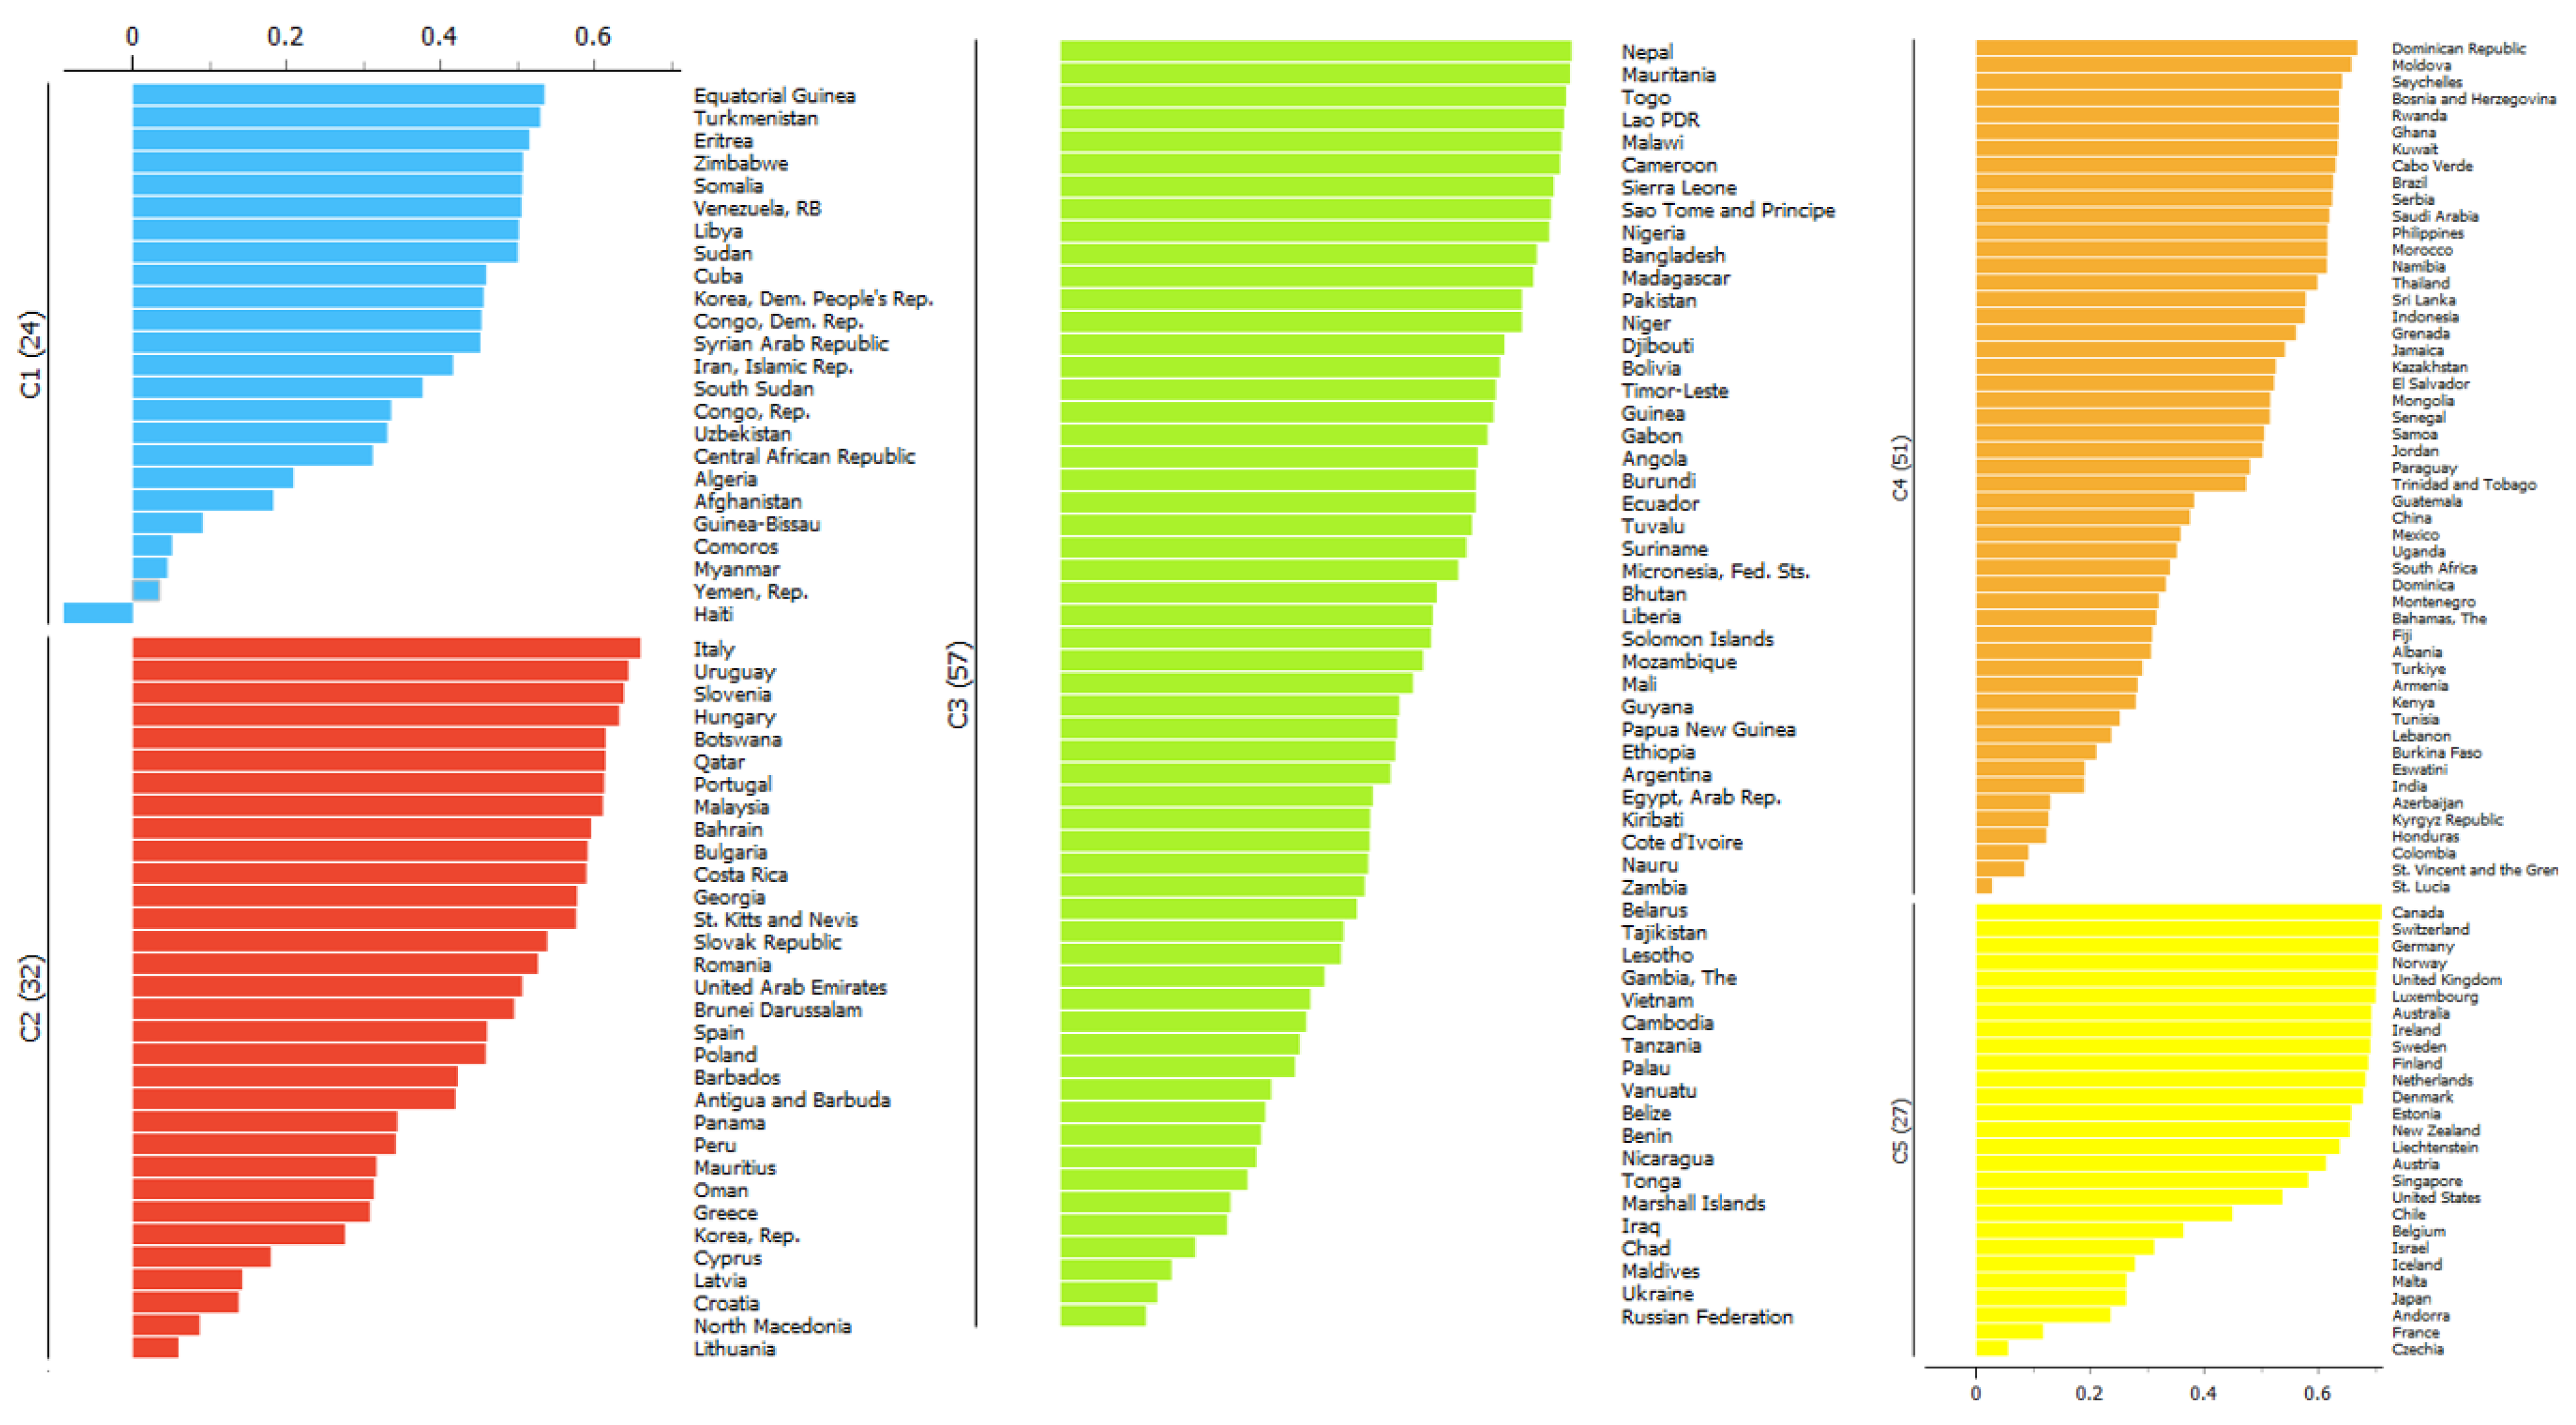
Figure 4.
Clusterization with the k-Means algorithm optimized with the Elbow Method with the indication of the Silhouette Coefficient.
Figure 4.
Clusterization with the k-Means algorithm optimized with the Elbow Method with the indication of the Silhouette Coefficient.
If we consider the level
of median of clusters we find the following order i.e.:
C5=1.5591>C2=0.7225>C4=-0.0596>C3=-0.7619>C1=-1.4779. In the C5
there are countries that have a highest level of per capita income. The vast majority
of countries in C5 are European countries and in general western countries. In
C5, there is also a subset of countries with high per capita income such as
Andorra, Singapore, Liechtenstein, Luxembourg, Switzerland,
Ireland that have developed a specifically legal order that is favourable to
the development of the private sector. RQ can be considered as the output of a
set of elements that capture the ability of a country to promote either
political either economic freedom i.e. a mix of market society and democracy.
In this sense we propose a confrontation between RQ and the Index of Economic
Freedom-IEF. The index of Economic Freedom is realized by the Heritage
Foundation. An index varies in a range between 0 and 100. The IEF considers at
country level the following macro-variables i.e., “Rule of Law”, “Government
Size”, “Regulatory Efficiency” and “Market Openness”. We can express the
definition of Index of Economic Freedom in the following form:
Due to this
characteristic, the IEF is able to represent either democratic issues either
the presence of a pro-market society at country level. We found that there is a
positive relationship between RQ and IEF for countries in C5. Specifically, we
find that the top countries for RQ also have highest values of IEF. For
example, Singapore as a RQ of 2.23 and an IEF of 89.70, the same value for New
Zealand are 1.80 and 83.90, Australia 1.83 and 82.40, Switzerland with 1.73 and
81.90, Ireland with 1.56 and 81.40 and United Kingdom with 1.45 and 78.40. The
positive relationship between RQ and IEF shows that the ability of countries to
orient the institutional framework towards the development of the private
sectors is not independent from the level of democracy and the degree of
economic freedom. Economic freedom is a synthesis between democracy and the
market society oriented to entrepreneurship, innovation and property rights.
Furthermore, economic freedoms and rights have a special role in promoting
either democracy either the production of value added in a market society
creating the conditions for the empowerment of individuals, groups and
communities.
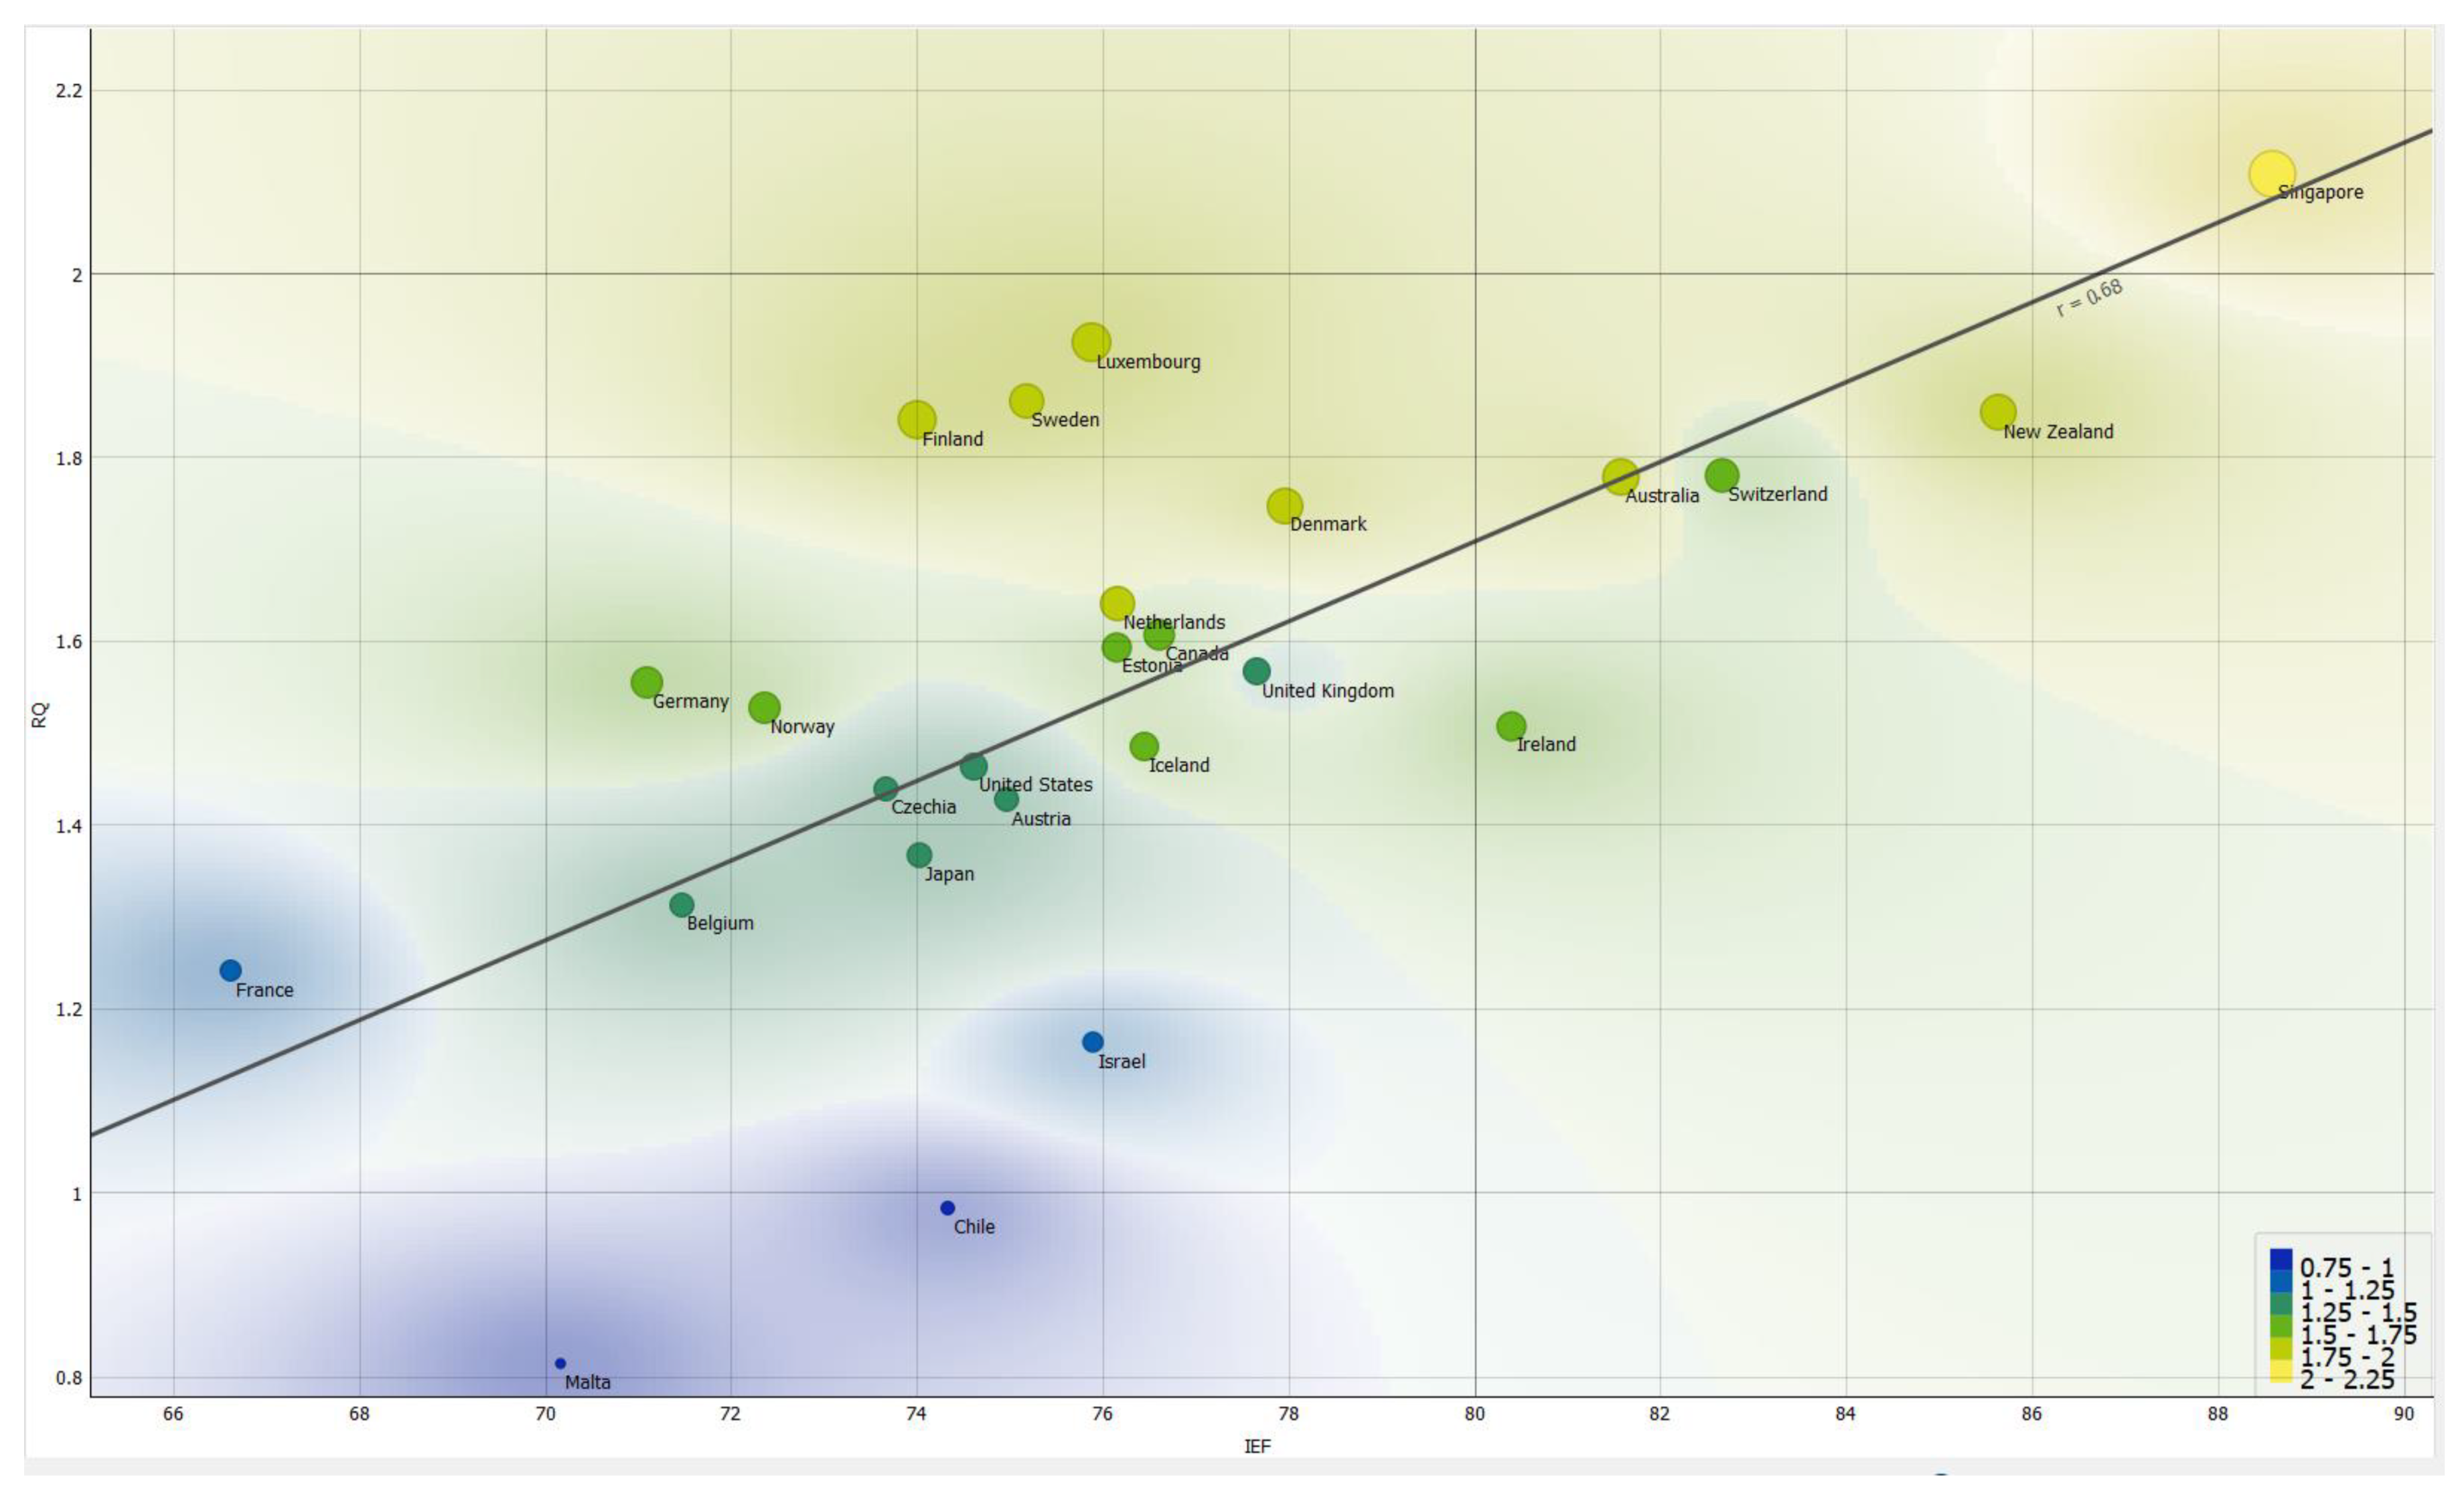
Figure 5.
The positive relationship between RQ and IEF for countries in C5.
If we consider the
relationship between RQ and IEF for the year 2021 for countries in C2, we can
find that there is a positive connection. The increase in the level of economic
freedom is positively associated to the improvement of RQ at national level for
the countries in C2. Countries in C2 are in large part European Countries with
a middle level of per capita income. Furthermore, there are also other
countries that are heterogeneous in the sense of geography among which there is
a sub-group of central and southern American countries such as: Uruguay, Peru,
Panama and Costa Rica. In addition, other countries have not any geographical
connection i.e., Botswana, Oman and South Korea. In these countries, the
increase in the level of economic freedom is positively associated to an
increase in the RQ i.e., an improvement in the ability to generate a political
and institutional framework that is favourable to the private sector and the
empowerment of the market society. We have to consider that the countries in
the C2 are essentially democratic states. This means that for countries that
have a middle income per capita, and that are already functioning democracies,
there is a chance to improve the level of RQ and economic freedom in the same
set of policies. But, it is largely possible that the presence of a culture
that is essentially oriented towards democracy can boost the ability to
generate institutional reforms that can deepen economic freedoms.
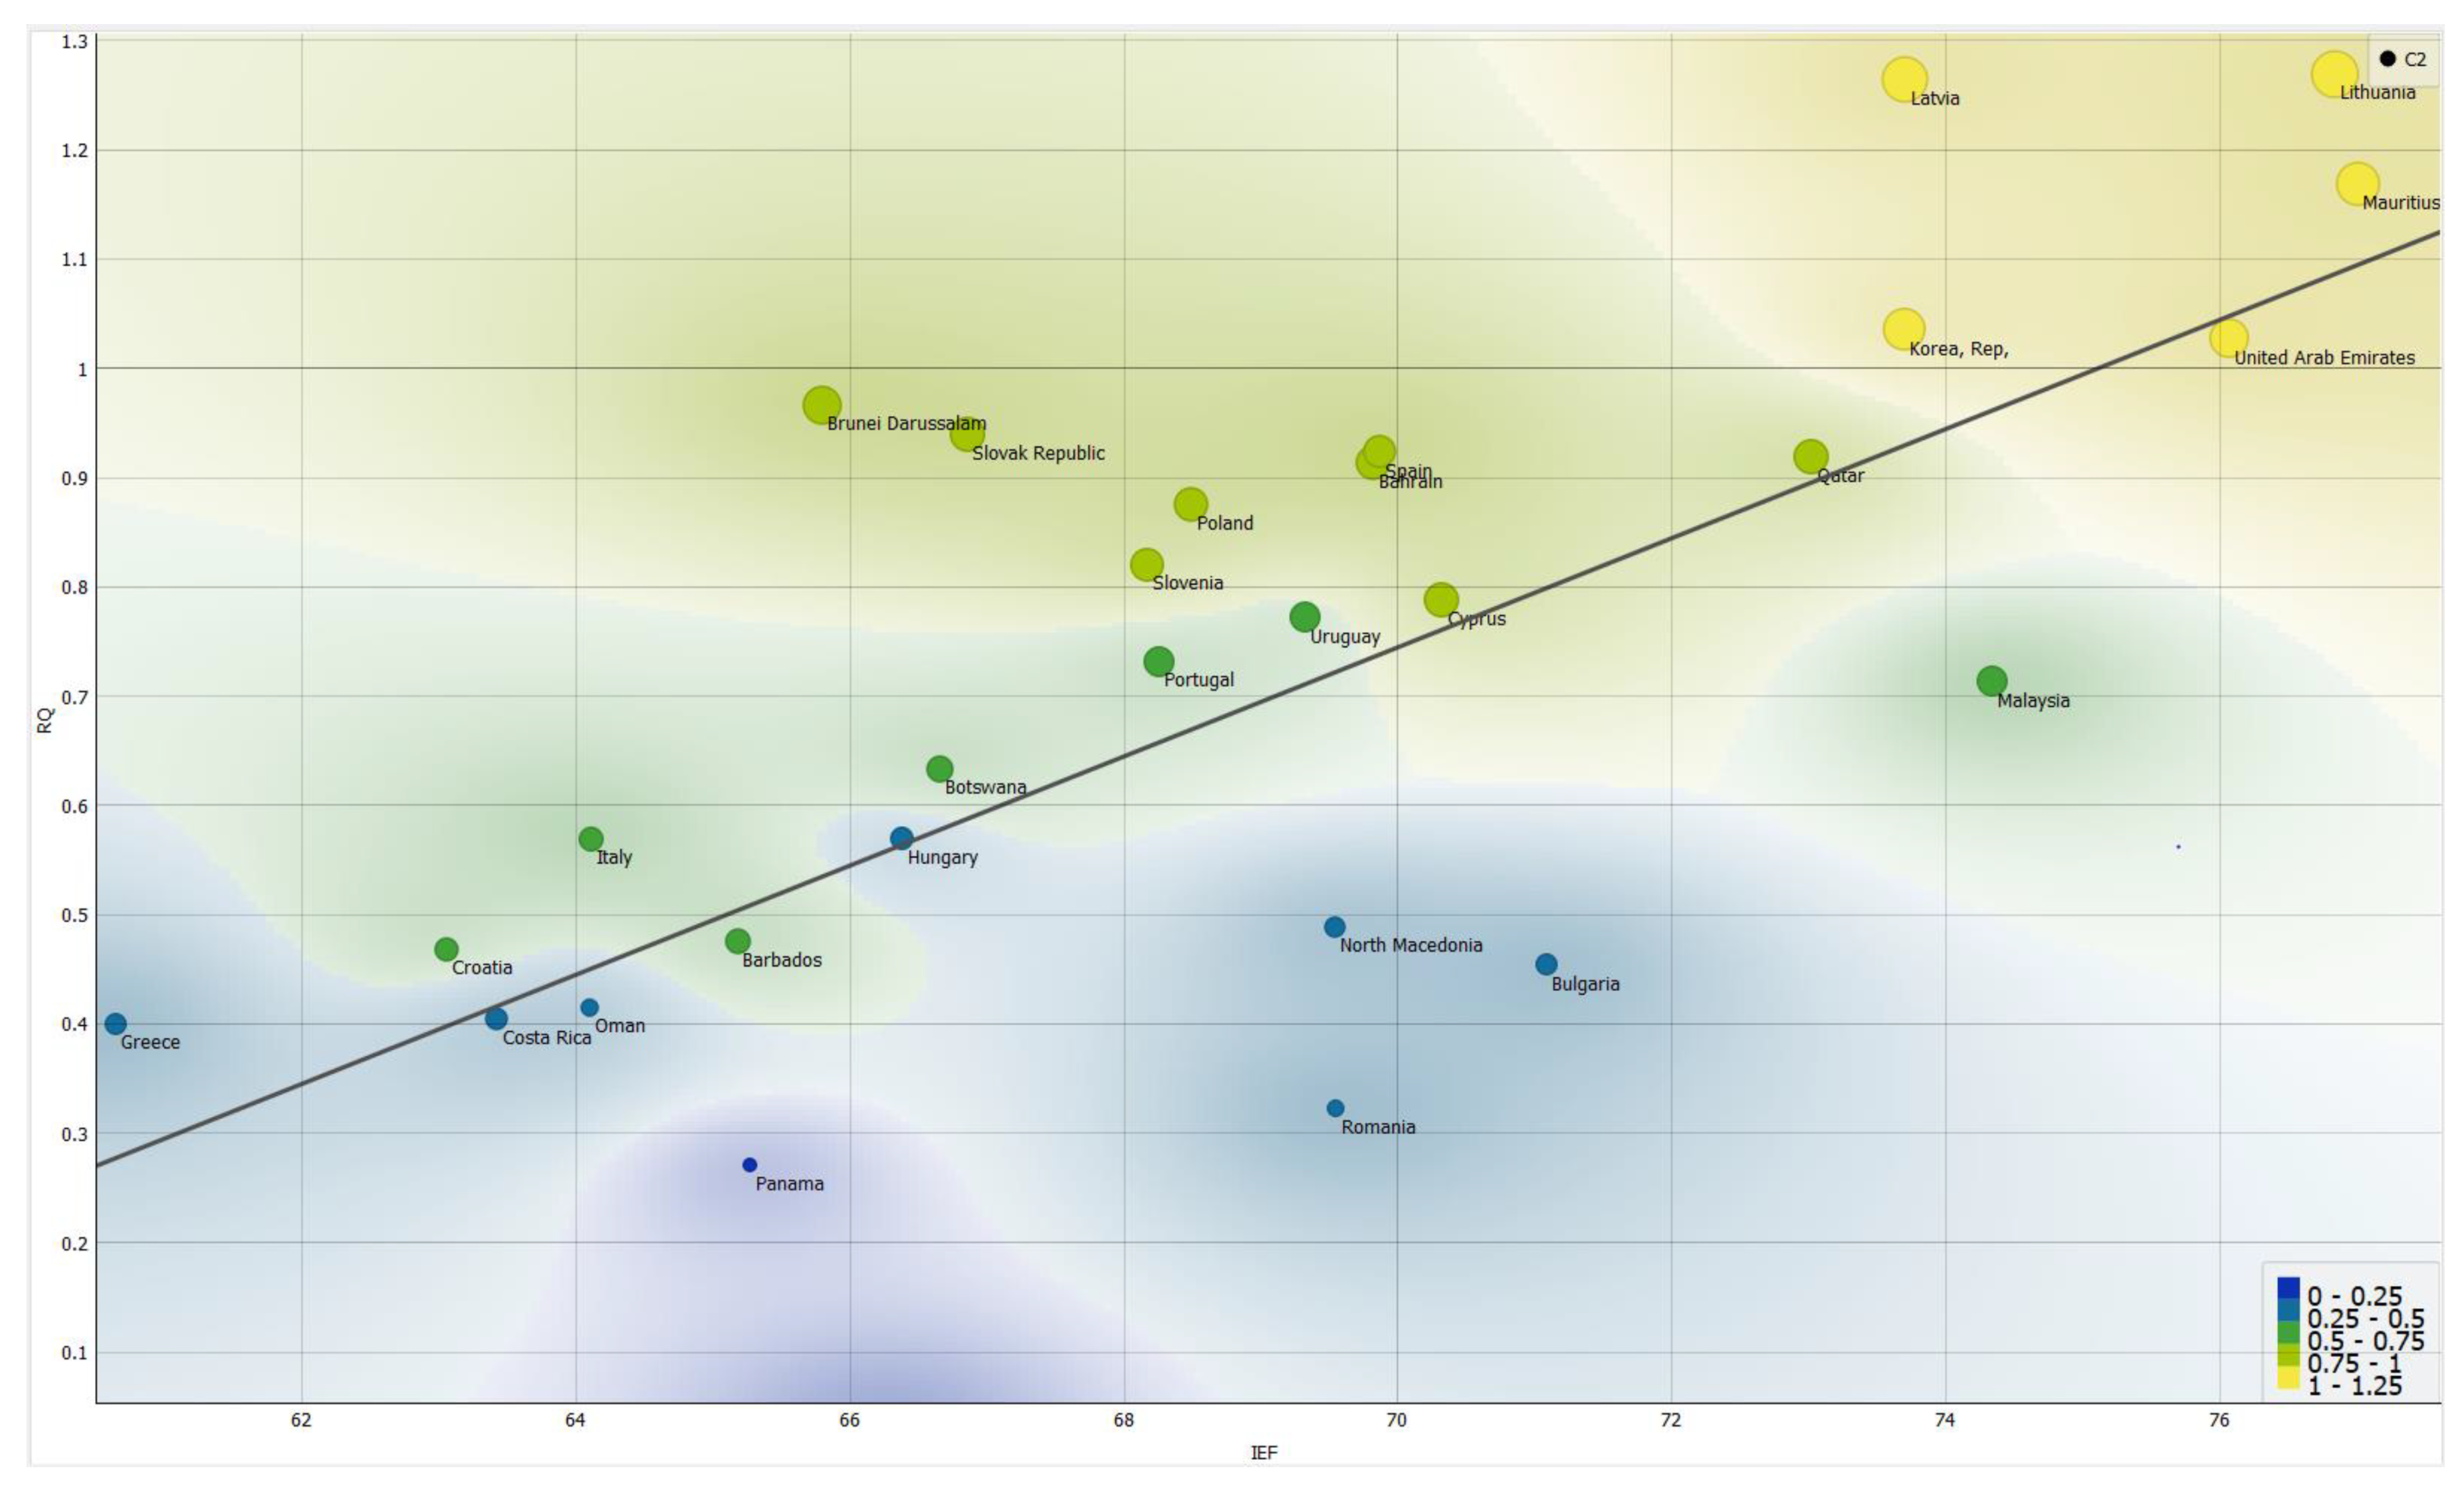
Figure 6.
Relationship between RQ and IEF in C2.
Similar results hold in
the relationship between RQ and IEF for the other clusters as showed in the
appendix. This means that essentially countries that develop deeper economic
freedom also tend to develop an orientation toward the market society
generating a positive effect in promoting property rights.
5. Machine Learning and Predictions for the Prediction of the Future Value of RQ
In the following part we
propose a confrontation among eight different machine learning algorithm for
the prediction of the future value of RQ. The 70% of the data have been used as
learning rate for the algorithms, while the remaining 30% are used for the
prediction. The performance of algorithms is evaluated through the maximization
of R-squared and the minimization of Mean Squared Error, Root Mean Squared
Error, Mean Absolute Error. We found the following order of algorithms in terms
of performance:
- Polynomial Regression with a payoff equal to 5;
- Linear Regression with a payoff equal to 7;
- Random Forest Regression with a payoff equal to 12;
- Simple Regression Tree with a payoff equal to 16;
- Gradient Boosted Tree with a payoff equal to 20;
- ANN-MLP with a payoff equal to 29;
- Tree Ensemble Regression with a payoff equal to 29;
- PNN-Probabilistic Neural Network with a payoff equal to 30.
Polynomial Regression is
the best predictive algorithm based on the minimization of the statistical
errors and the maximization of R-Squared.
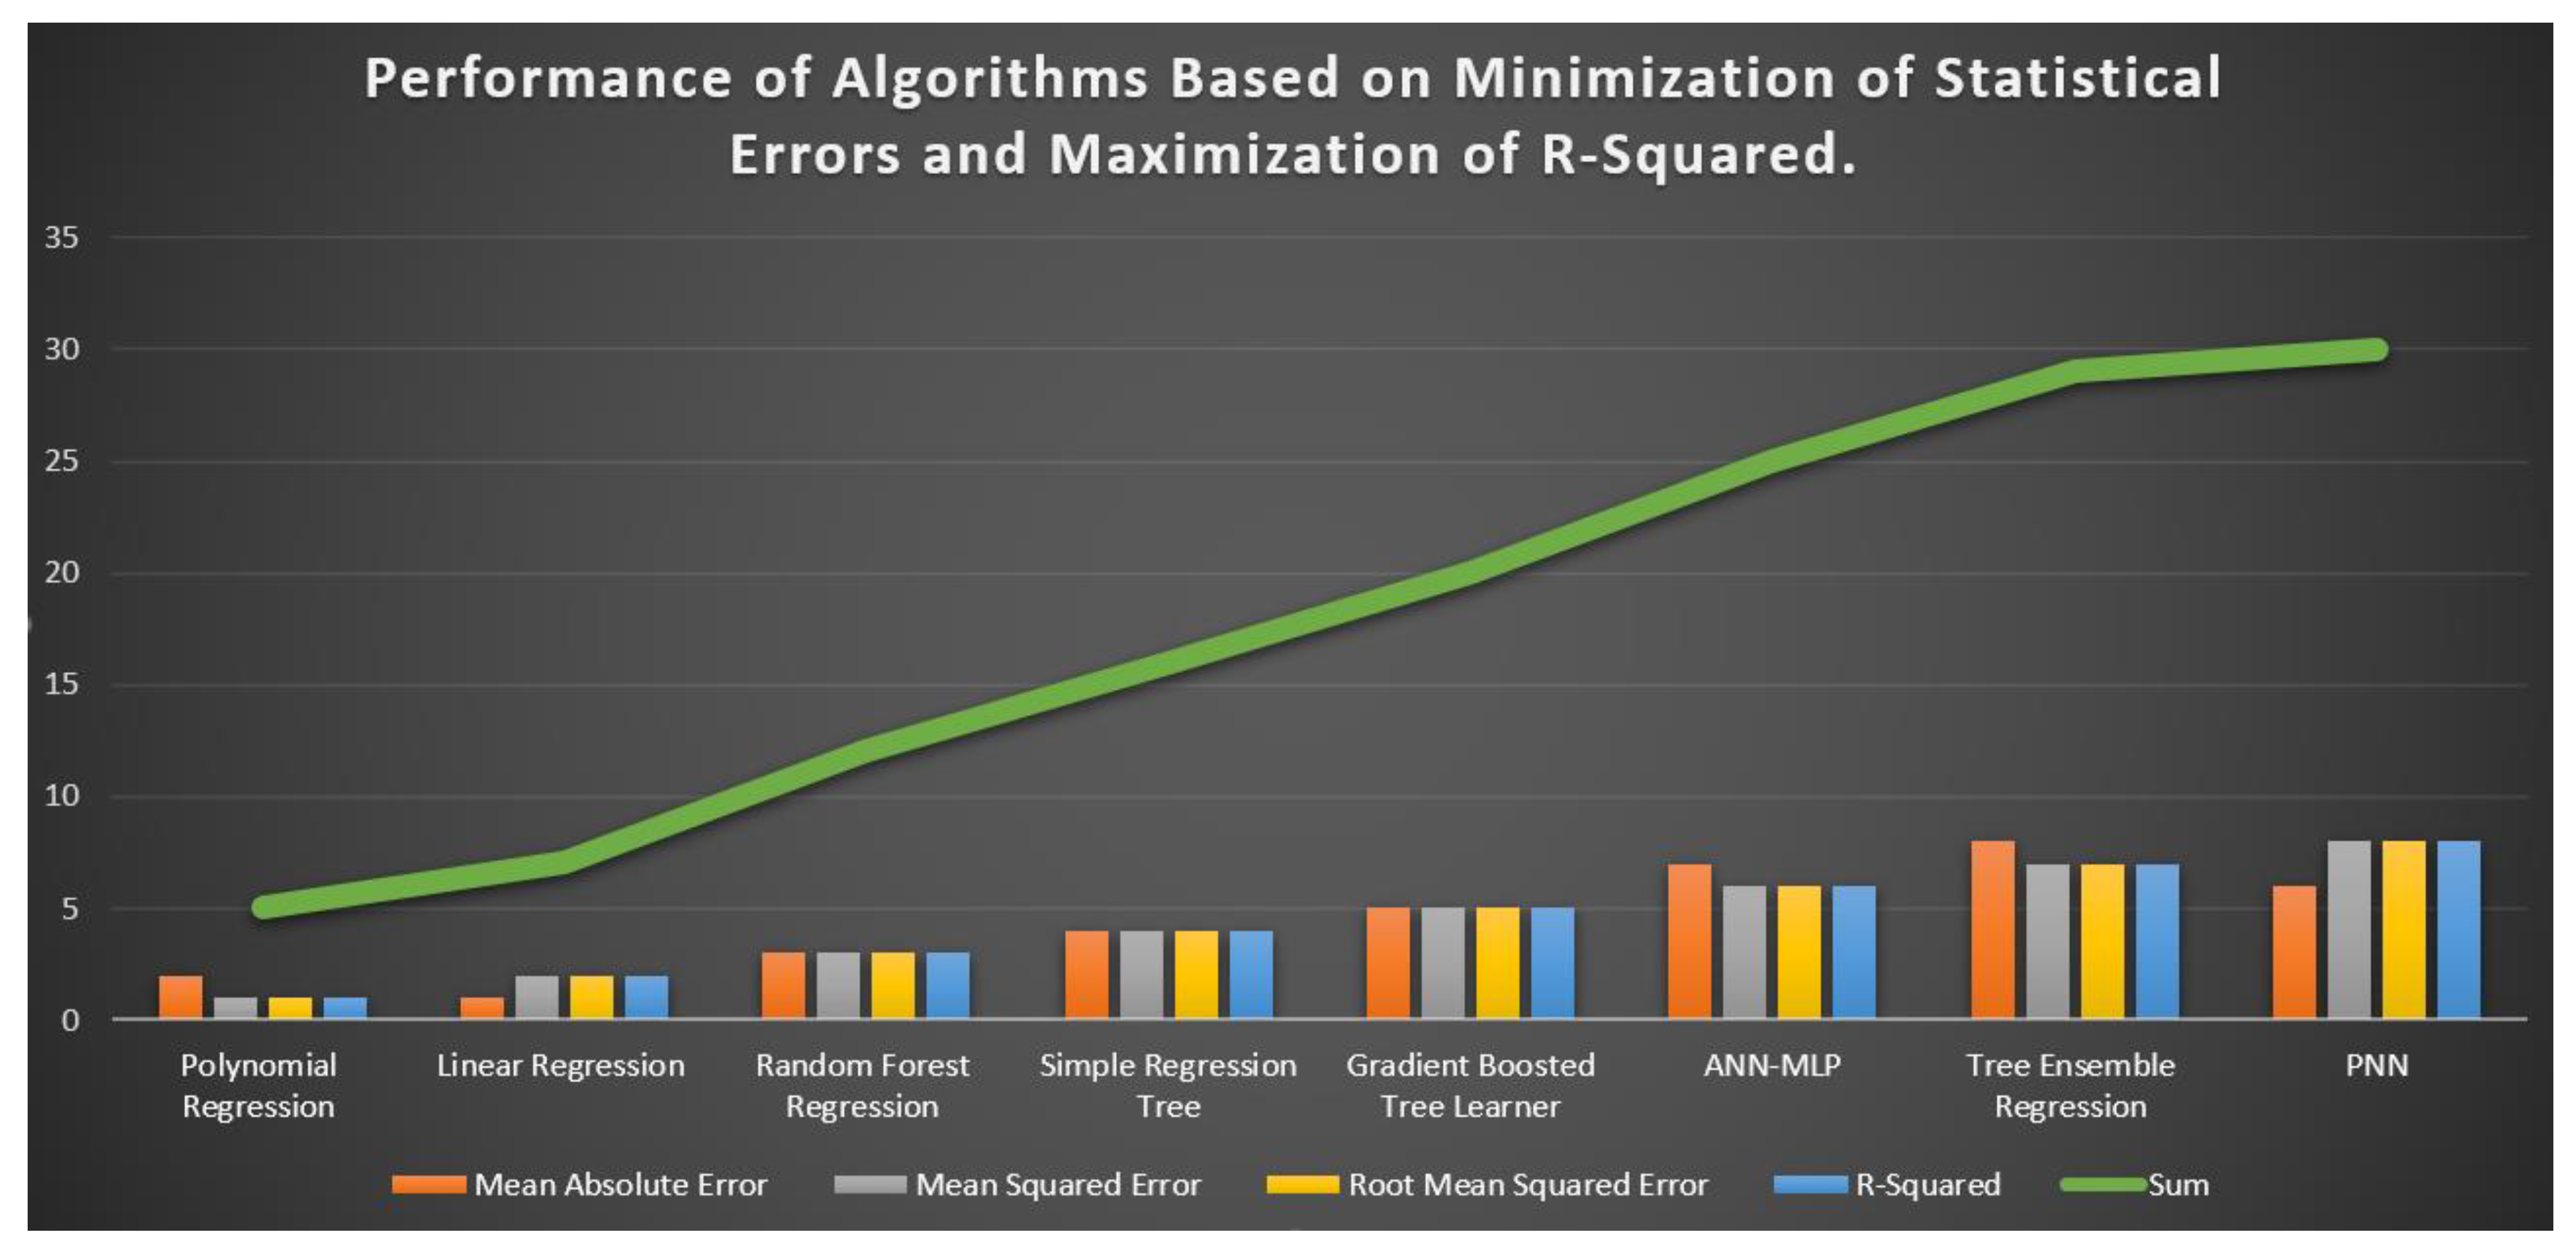
Figure 7.
Performance of Algorithms Based on Minimization of Statistical Errors and Maximization of R-Squared.
Figure 7.
Performance of Algorithms Based on Minimization of Statistical Errors and Maximization of R-Squared.
Through the application of the Polynomial
Regression, we found that 17 countries are “winners” in the sense that they
experiment an increase of the predicted value of RQ, while, on the contrary,
there are 37 countries that are “losers” i.e., countries that have a negative
predictive value in terms of RQ. Among the winners, the best ten performers
are: Iran with +53,15, Myanmar +41,58%, Kyrgyz Republic with 17,11%, Malta with
17,02%, Papua New Guinea with 13,92%, Italy with 11,08%, Ethiopia with +10,15%,
Guinea Bissau with 8,17%, Bulgaria with 5,97%, Tunisia with 5,69%. Among the
losers, the top performers are: Bahrain with -17,00%, Costa Rica with 13,42%,
India -10,51%, Azerbaijan -9,63%, Fiji with -8,78%, Vanuatu with -8,72%,
Bangladesh -8,02%, Georgia -7,36%, Singapore -7,30%, Luxembourg -7,02%. If we
take the average value of the countries for which we have the prediction, we
found that the level of RQ is expected to reduce of -1,29%.
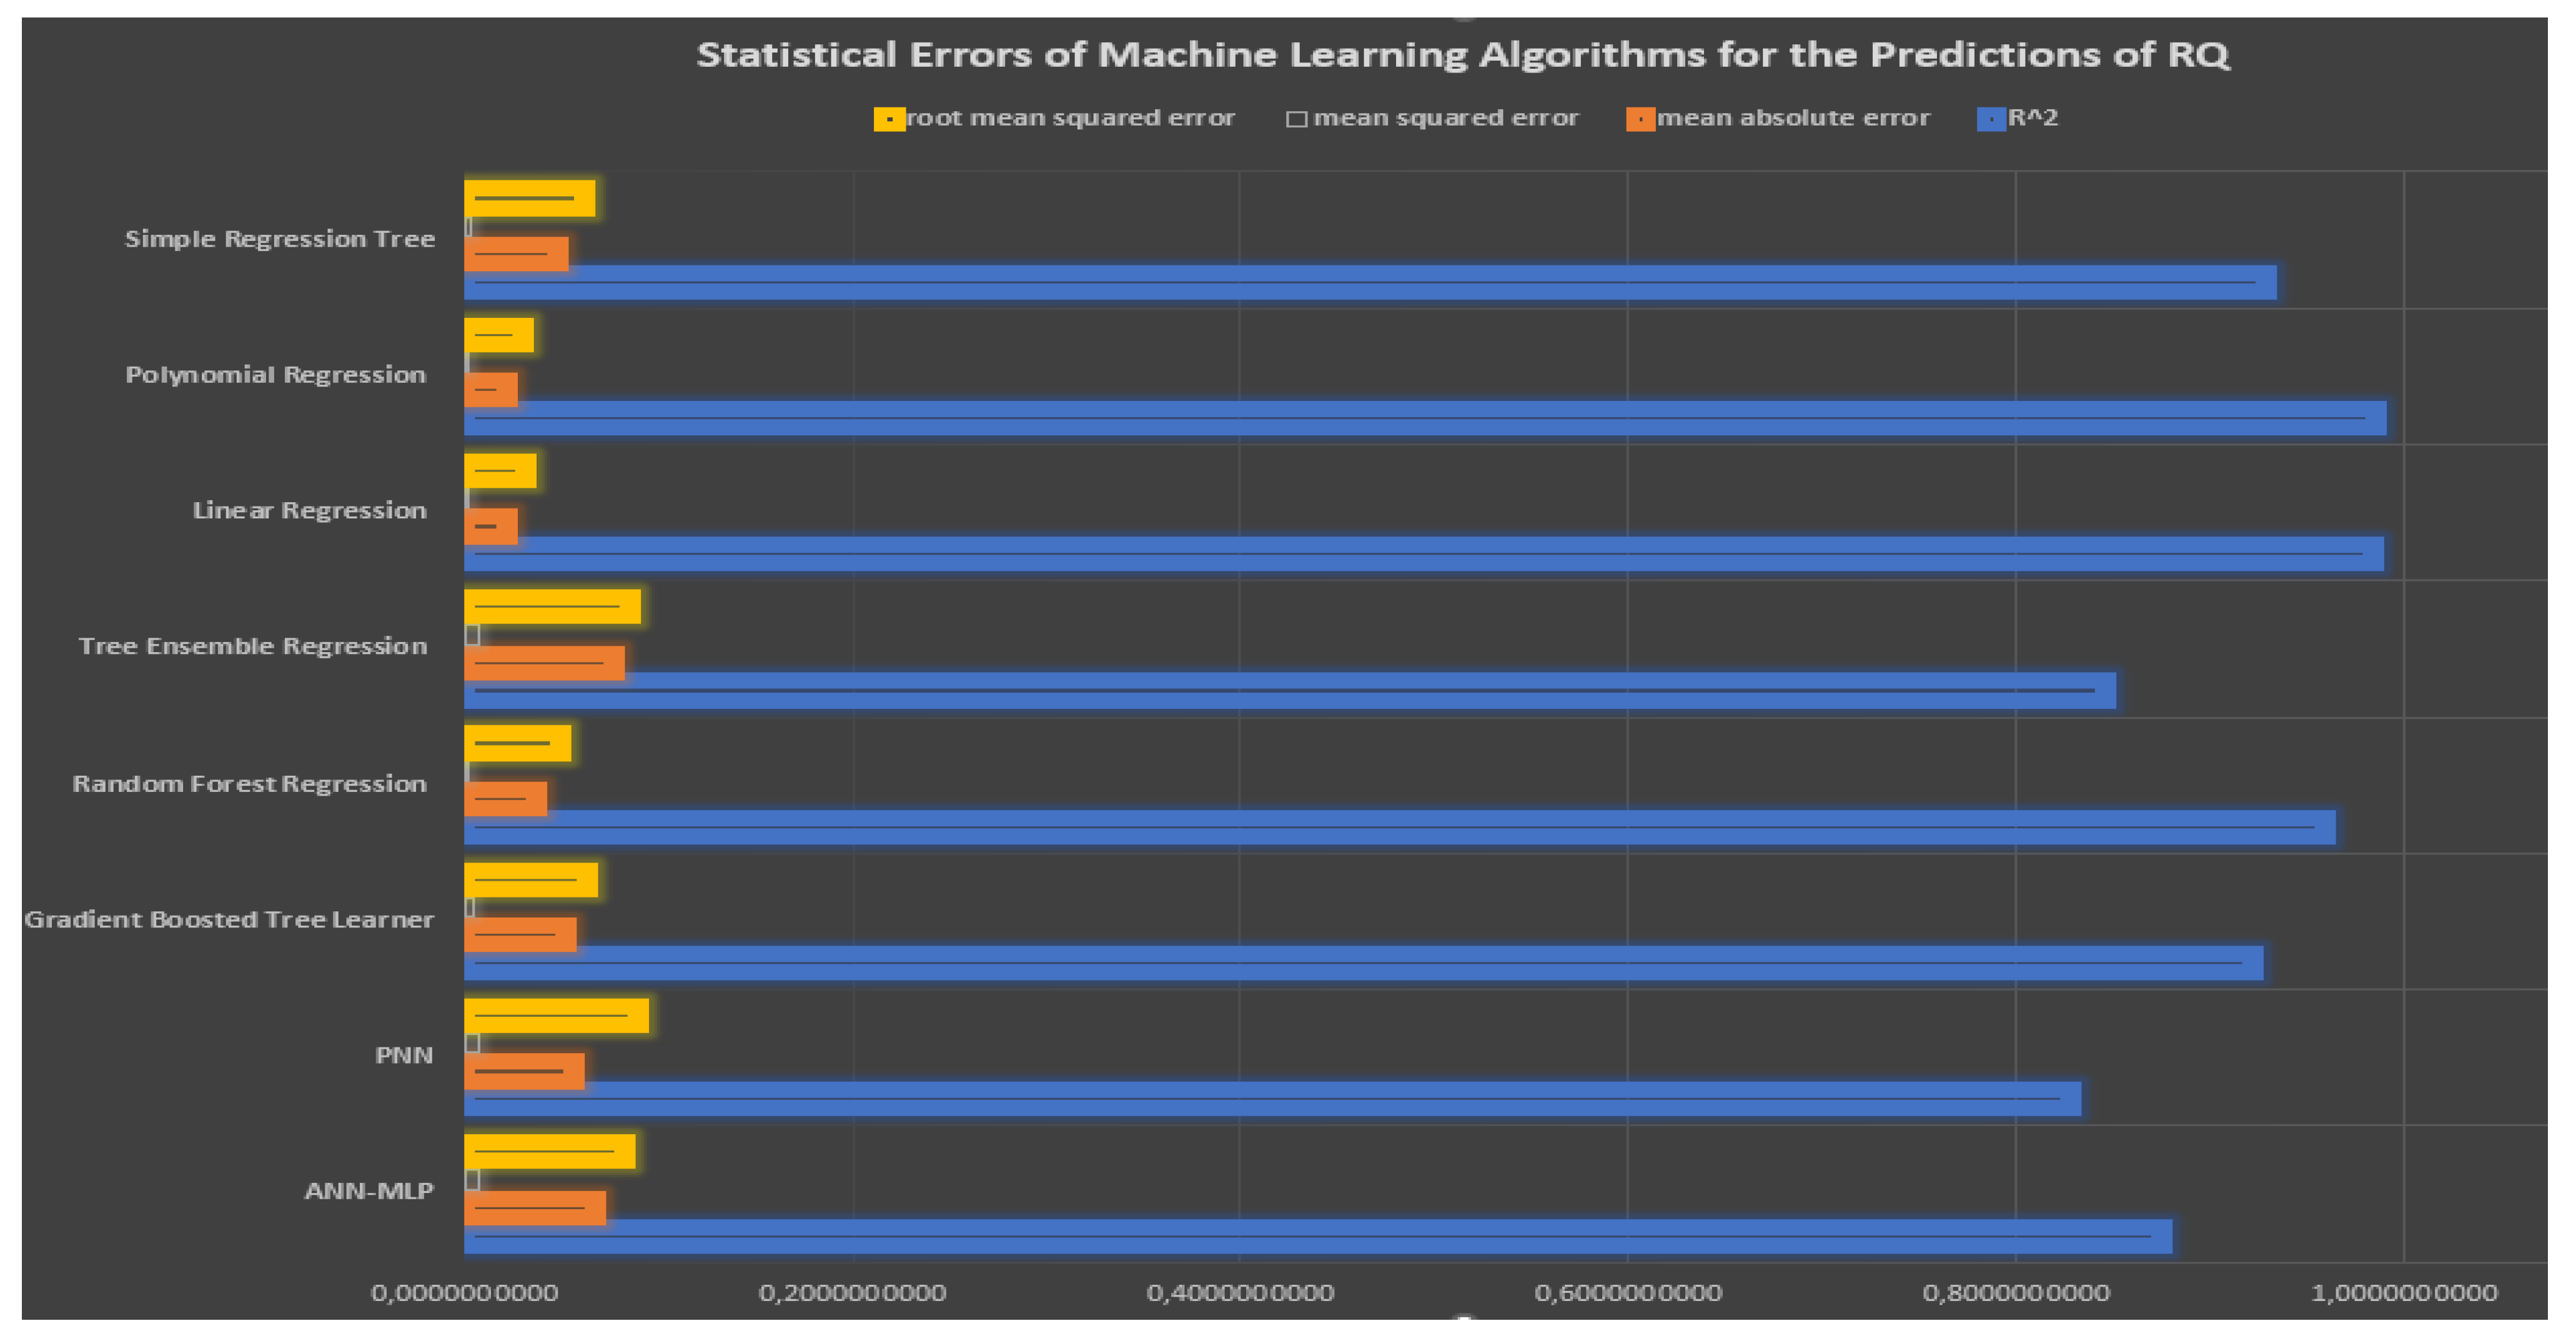
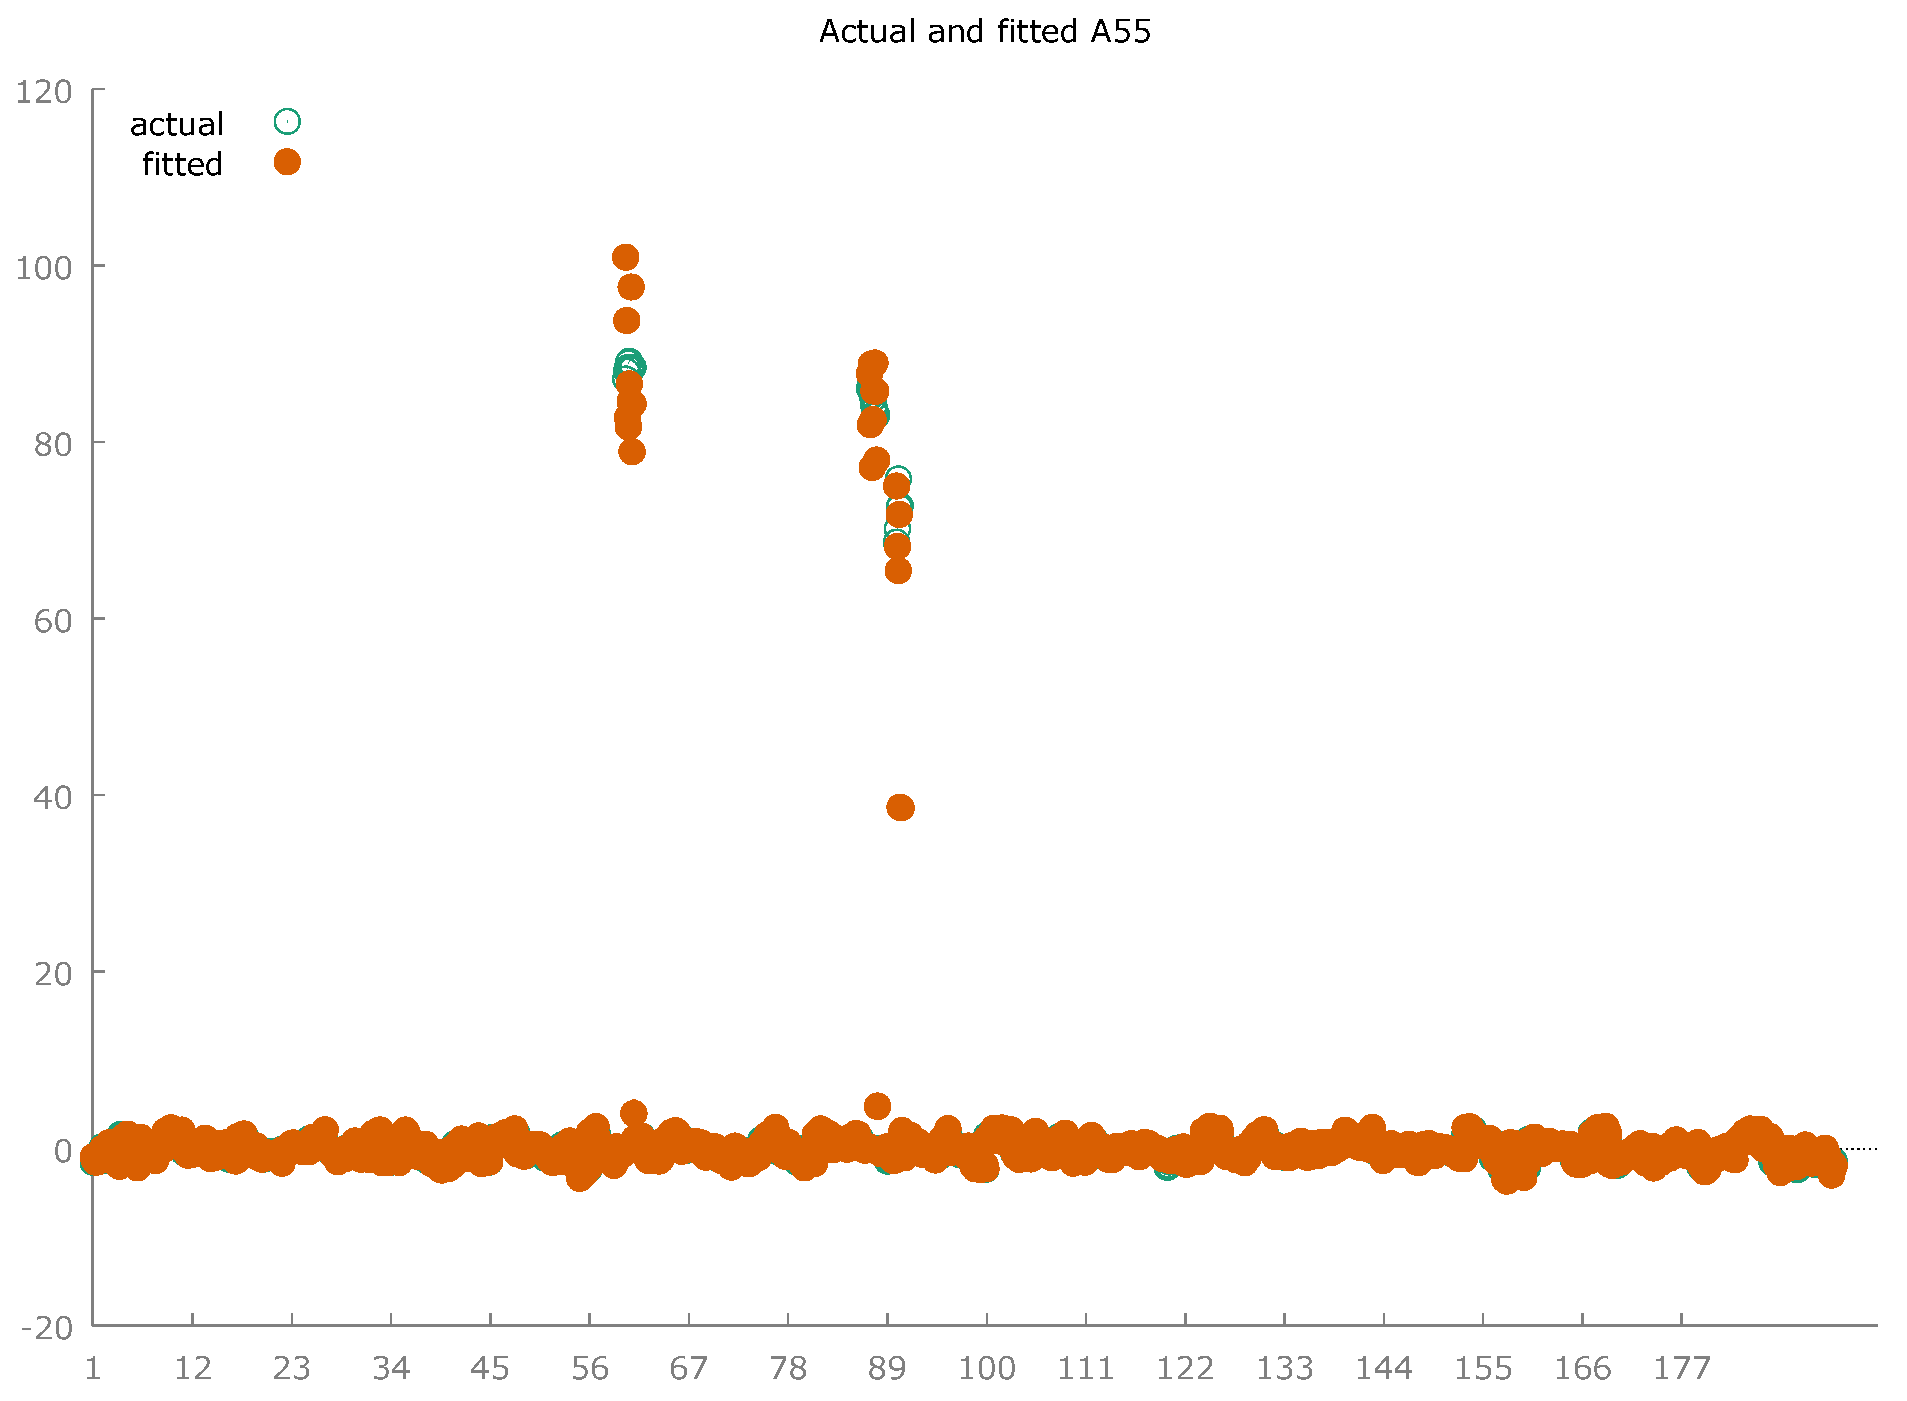
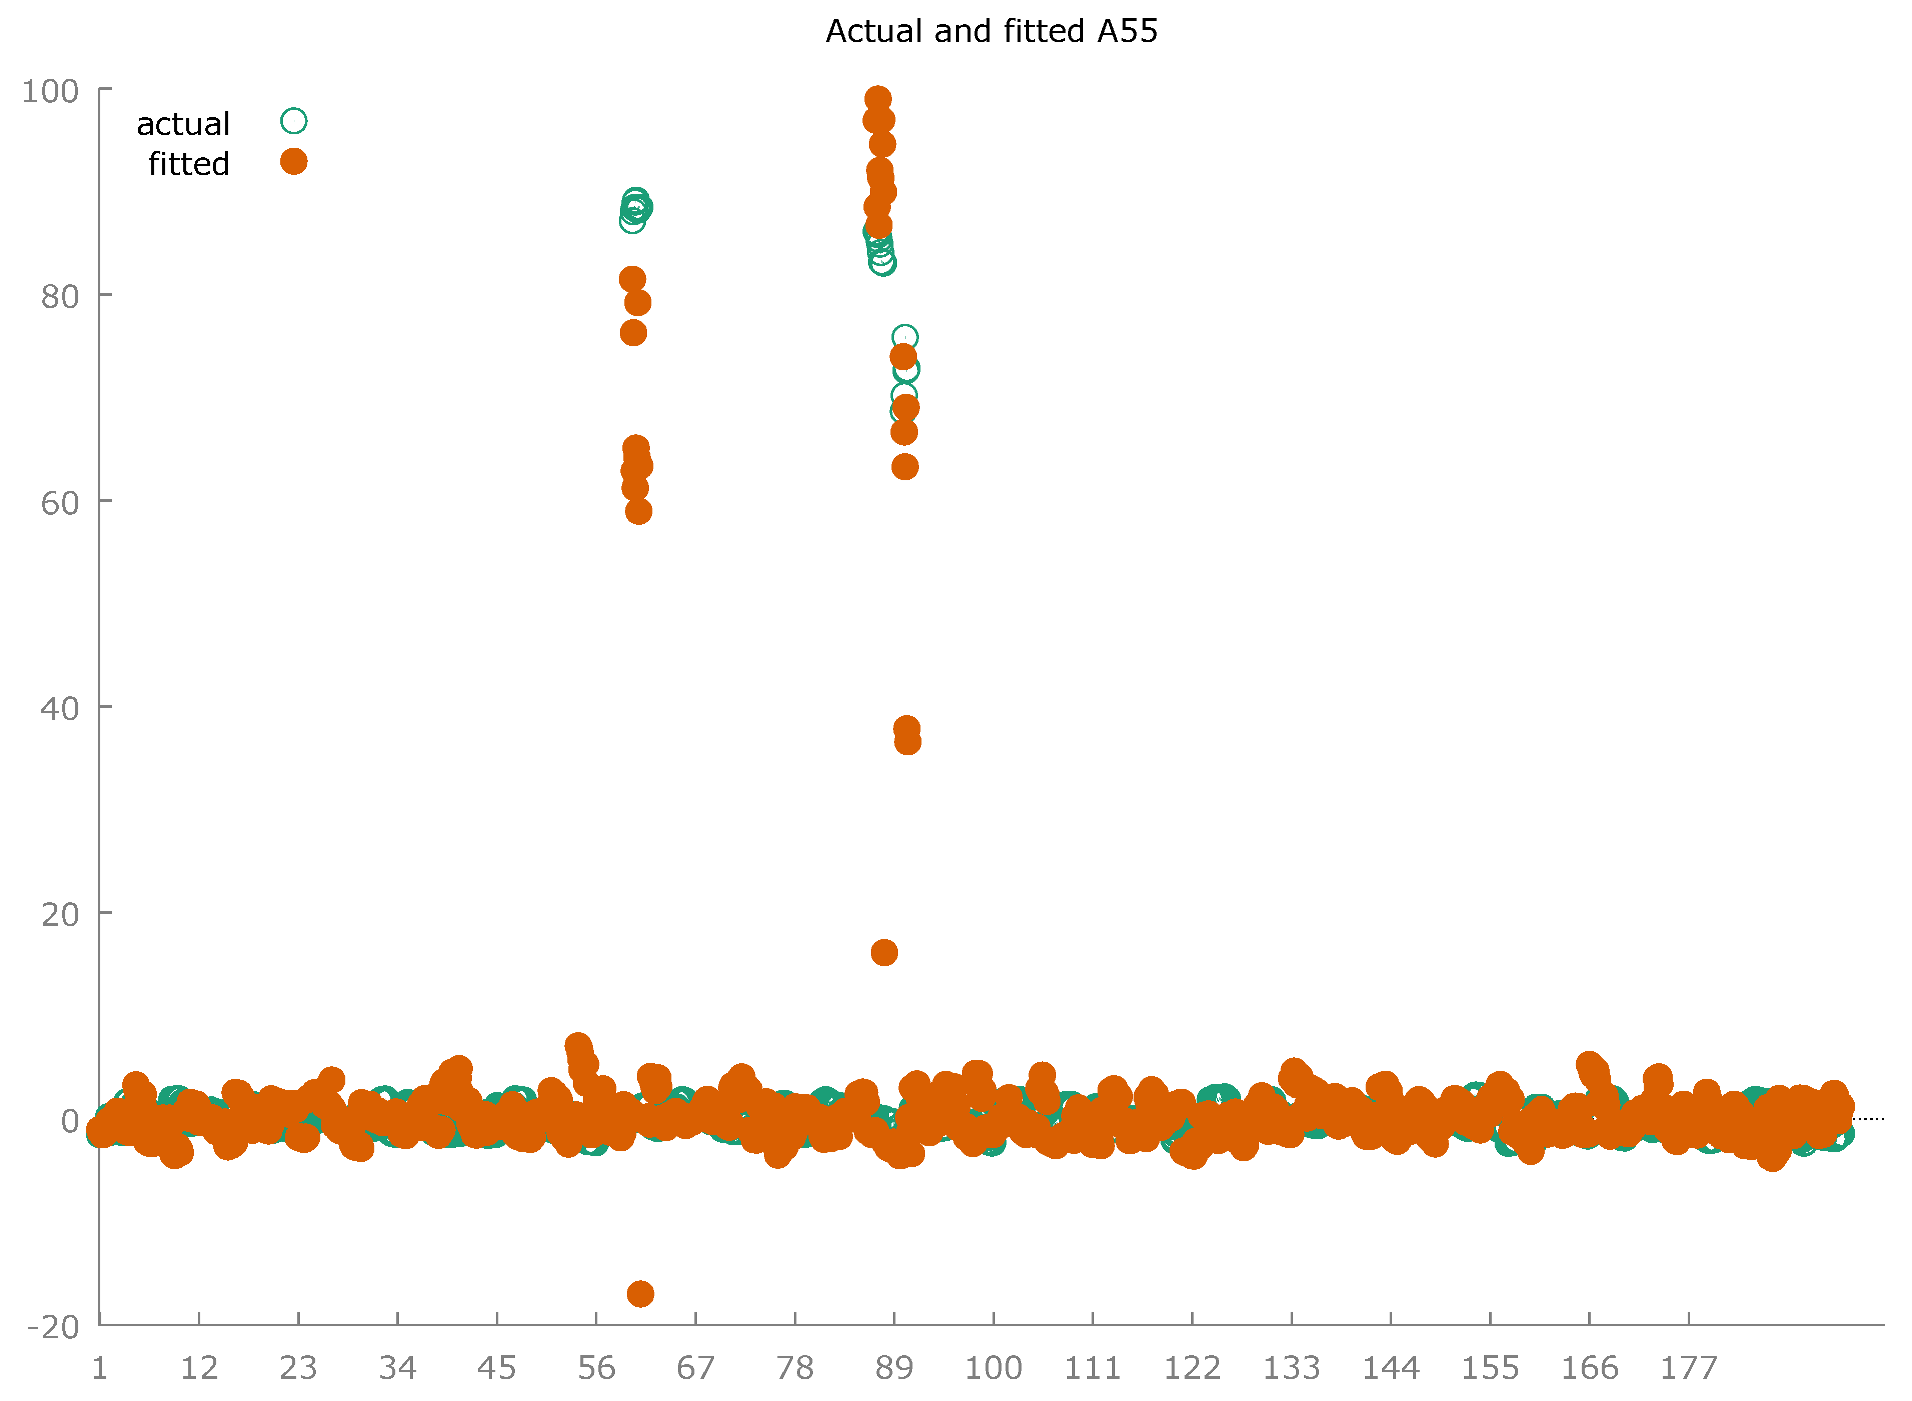
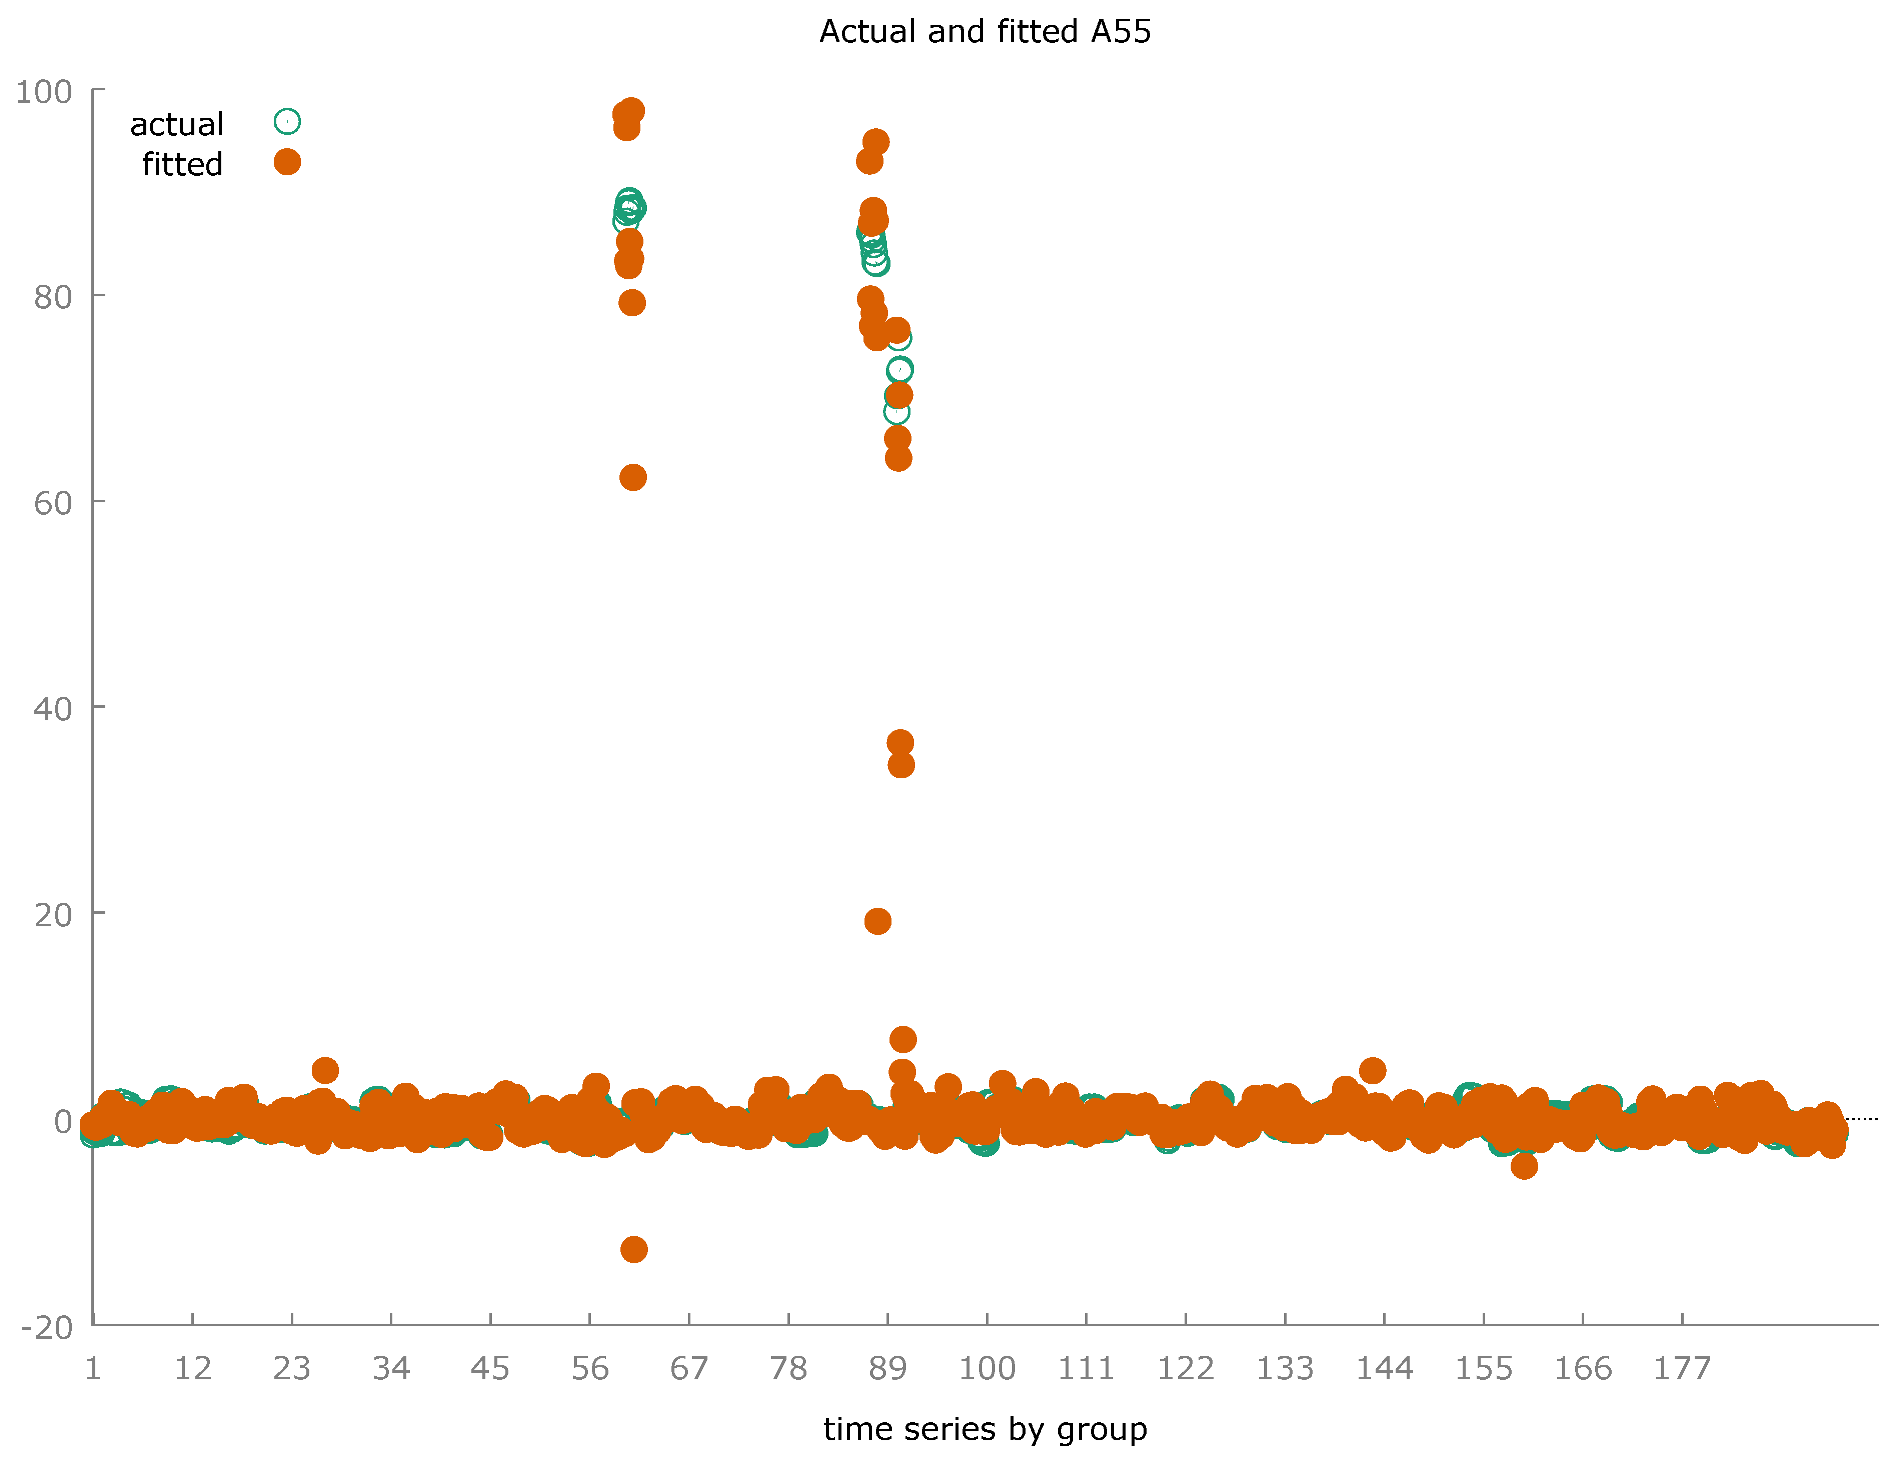
Figure 8.
Statistical Errors of Machine Learning for the Prediction of the Future Level of RQ with the indication of R-squared.
Figure 8.
Statistical Errors of Machine Learning for the Prediction of the Future Level of RQ with the indication of R-squared.
6. Network Analysis with Predicted Values in the Application of the Euclidean Distance
We apply the Euclidean distance in a
network analysis framework to find the presence of connection among the
countries with the estimated values generated in application of the Polynomial
Regression. Network analysis does not determine causal relationships among the
values of RQ in the analyzed countries. However, it implies the presence of
similar characteristics in the historical dataset augmented with the predicted
data. Our analysis led us to the identification of a set of six complex network
structures and a simplified network structure.
There is a network structure composed as
follows:
- ➢
- Bahrain has a connection with Costa Rica in the amount of 0.35 units;
- ➢
- Costa Rica has a connection with Bahrain with an amount of 0.35 units, with Bulgaria with an amount of 0.3 units, and with Antigua and Barbuda with an amount of 0.35 units;
- ➢
- Bulgaria has a connection with Costa Rica amounting to 0.3 units;
- ➢
- Antigua and Barbuda have a connection with Costa Rica in the amount of 0.35 units and with Croatia in the amount of 0.38 units;
- ➢
- Croatia has a connection with Antigua and Barbuda in the amount of 0.38 units, with North Macedonia in the amount of 0.34 units and with Vincent and the Grenadines in the amount of 0.31 units;
- ➢
- North Macedonia has a connection with Croatia amounting to 0.34 units and with Vincent and the Grenadines amounting to 0.31 units;
- ➢
- St. Vincent and the Grenadines have a connection with North Macedonia for the amount of 0.3 units, with Croatia for the amount of 0.31 units and with Armenia for the amount of 0.24 units;
- ➢
- Armenia has a connection with St. Vincent and the Grenadines for the amount of 0.24 units and with Jamaica for the amount of 0.32 units;
- ➢
- Jamaica has a connection with Armenia amounting to 0.32 units and with Saudi Arabia amounting to 0.32 units.
There is a complex network structure
between the following countries namely:
Estonia has a connection with Ireland in
the amount of 0.29 units and with Germany in the amount of 0.3 units;
Ireland has a connection with Estonia in
the amount of 0.29 units and with Germany in the amount of 0.23 units;
Germany has a connection with Estonia for
0.3 units and with Ireland for 0.23 units.
There is a complex network structure
between the following countries namely:
Sao Tome and Principe has a connection with
Algeria for an amount of 0.15 units, with Cameroon for an amount of 0.23 units
with Bangladesh for an amount of 0.2 units;
Algeria has a connection with Sao Tome and
Principe for an amount of 0.15 units, with Cameroon for an amount of 0.31 units
and with Bangladesh for an amount of 0.31 units;
Cameroon has a connection with Sao Tome and
Principe for a value of 0.23 units, with Algeria for an amount of 0.31 units
and with Bangladesh for an amount of 0.14 units;
Bangladesh has a connection with Sao Tome
and Principe for the amount of 0.2 units, with Algeria for the amount of 0.31
units and with Cameroon for the amount of 0.14 units and with Ethiopia for an
amount of 0.3;
Ethiopia have a connection with Bangladesh
equal to an amount of 0.3 units, with Iraq an amount of 0.36 units, with Chad
an amount of 0.37 units;
Chad has a connection with Ethiopia in the
amount of 0.37 units, with Iraq in the amount of 0.25 and with Guinea Bissau in
the amount of 0.3 units;
Guinea Bissau has a connection with Chad in
the amount of 0.3 units and with Iraq in the amount of 0.33 units;
Iraq has a connection with Guinea Bissau
amounting to 0.33 units, with Chad amounting to 0.25 units and with Ethiopia
amounting to 0.36 units.
There is a complex network structure
between the following countries namely:
Senegal has a connection with Paraguay in
the amount of 0.23 units;
Paraguay has a connection with Senegal in
the amount of 0.23 units, with Azerbaijan in the amount of 0.36 units, and with
India in the amount of 0.35 units;
Azerbaijan has a connection with Paraguay
in the amount of 0.36 units and with India in the amount of 0.25 units;
India has a connection with Paraguay amounting
to 0.35 units and with Azerbaijan amounting to 0.25 units.
There is a complex network structure made
up of the following countries:
Turkmenistan has a connection with Somalia
in the amount of 0.36 units, and with Eritrea in the amount of 0.32 units;
Eritrea has a connection with Turkmenistan
in the amount of 0.32 units and with Somalia in the amount of 0.38 units;
Somalia has a connection with Eritrea
amounting to 0.38 units and with Turkmenistan amounting to 0.36 units.
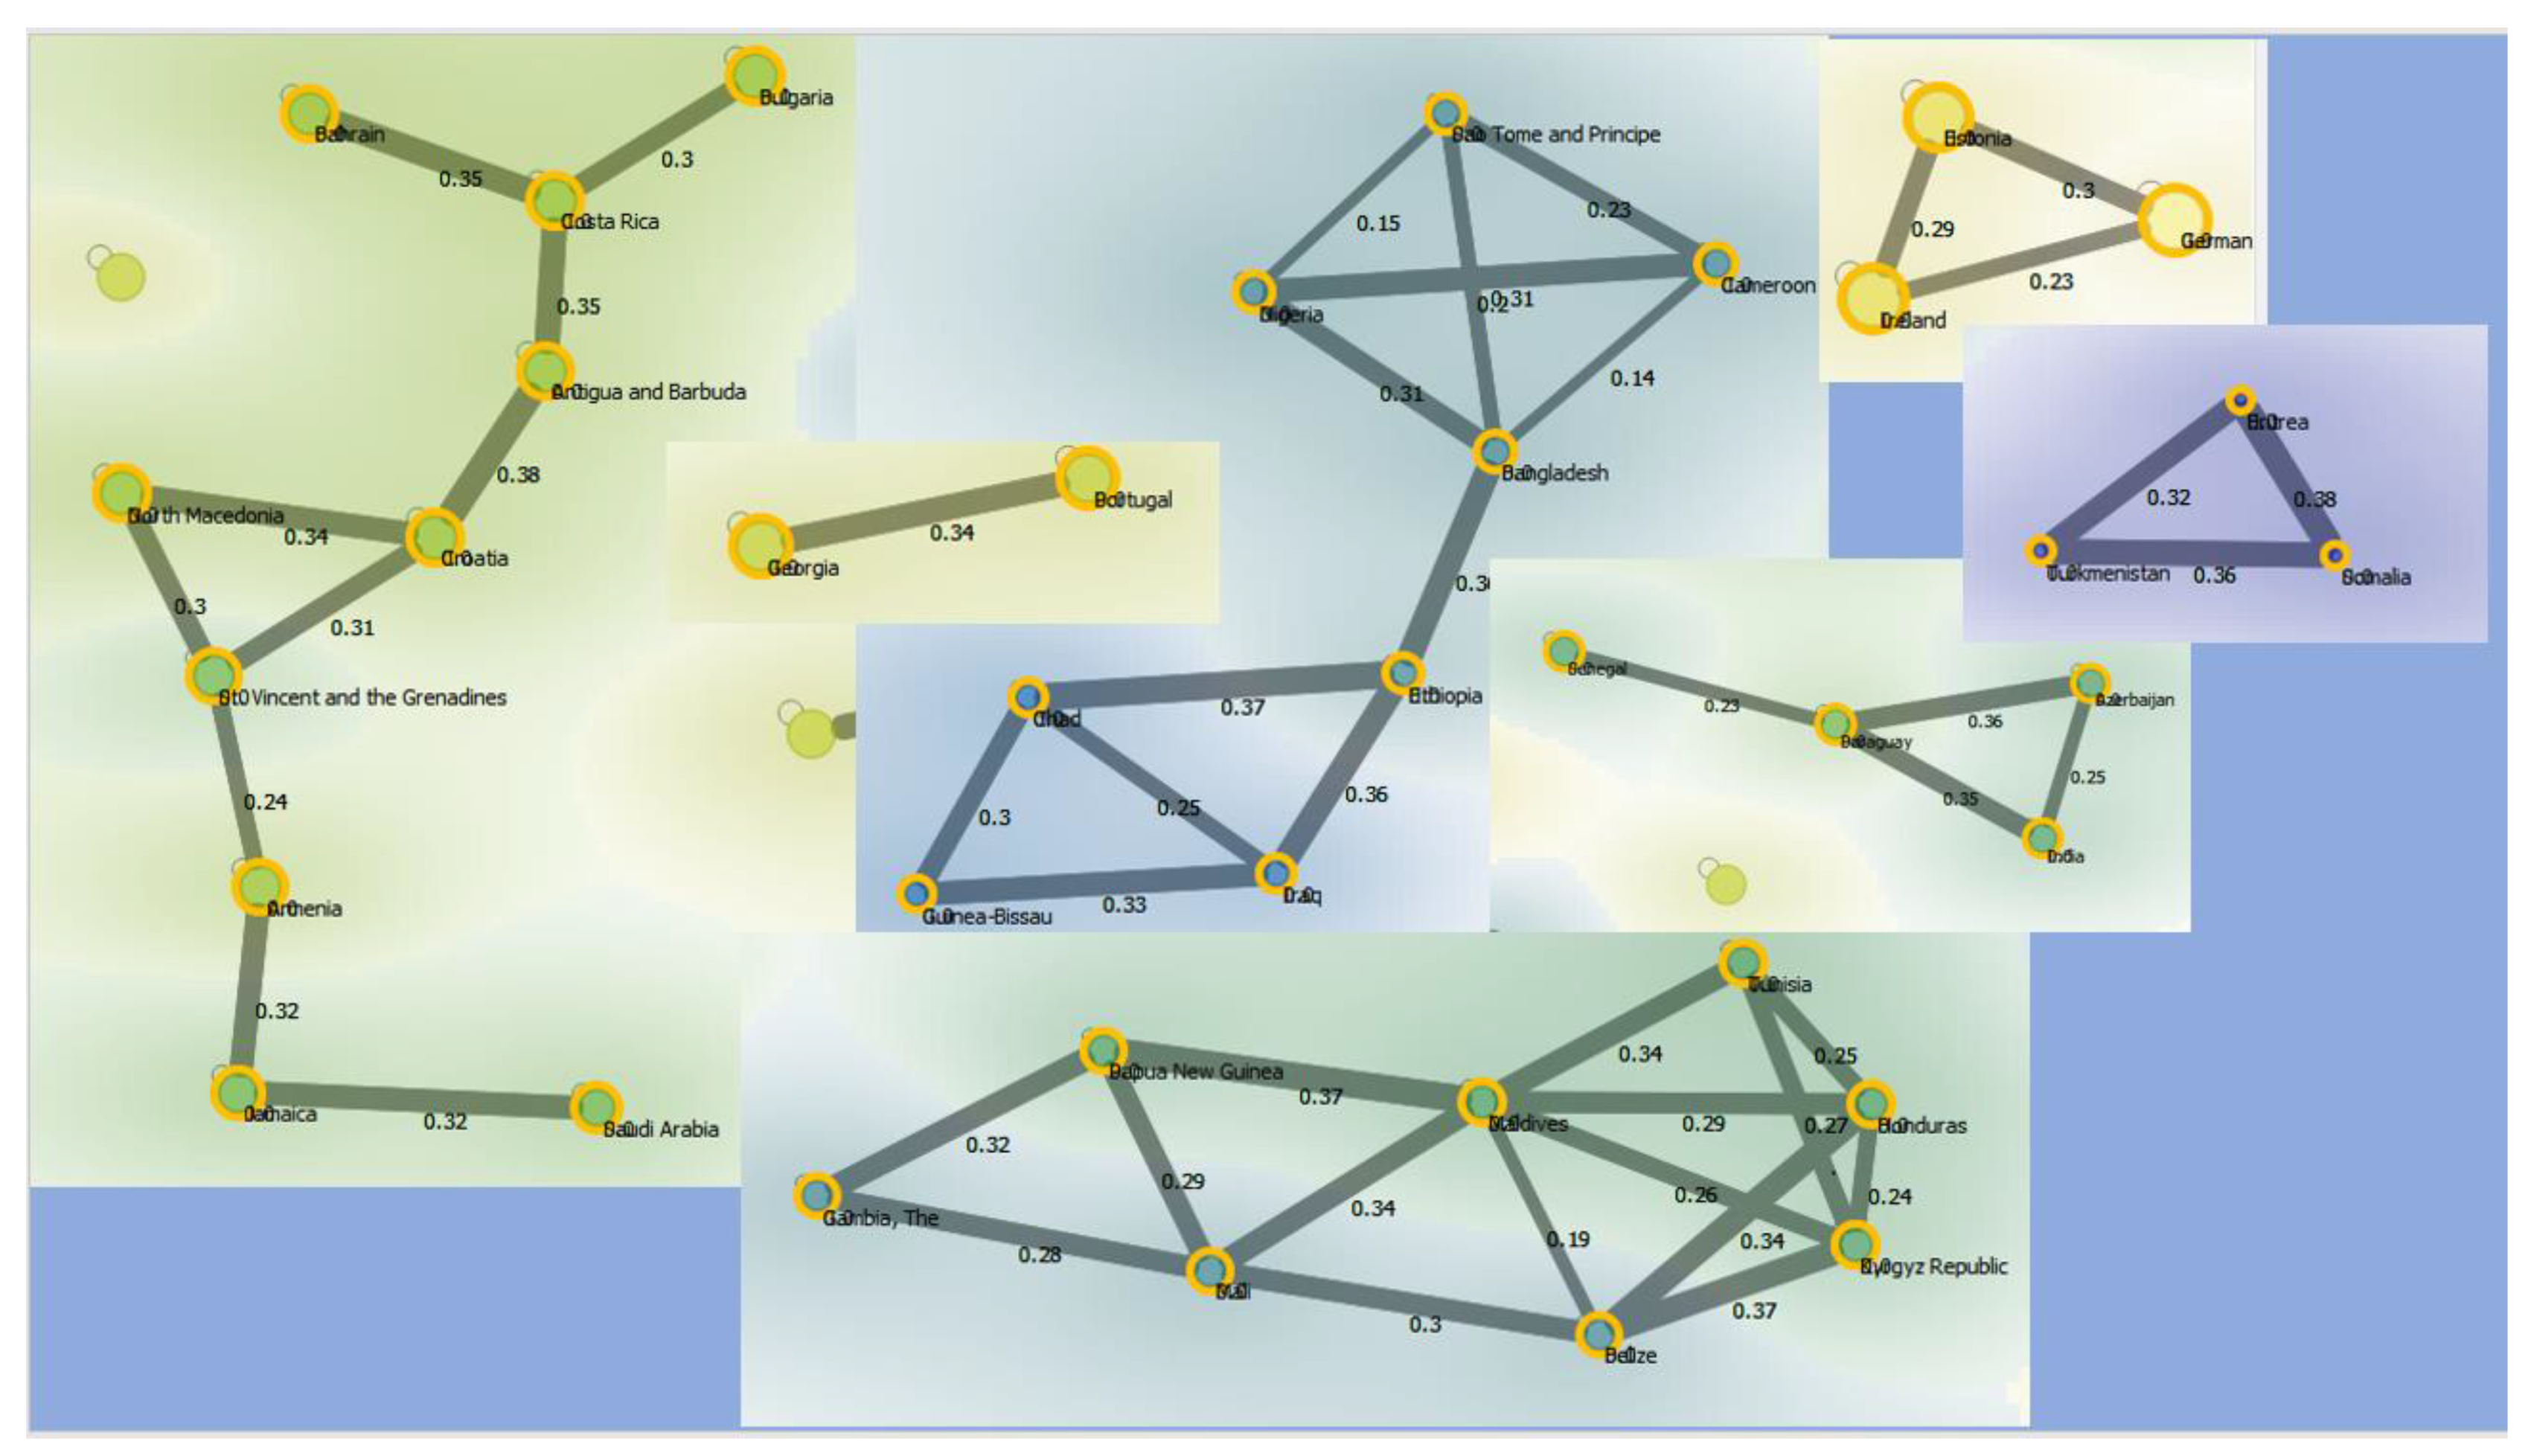
Figure 9.
Structures of Network Analysis with the Euclidean distance.
There is a complex network structure
composed as follows:
The Gambia has a connection with Papua New
Guinea equal to an amount of 0.32 units and with Mali for an amount of 0.28
units;
Papua New Guinea has a connection with
Gambia for the amount of 0.32 units with Mali for the amount of 0.29 units and
with the Maldives for the amount of 0.37 units;
Maldives has a connection with Papua New
Guinea equal to 0.37 units, with Mali with an amount of 0.34 units with Belize
equal to 0.19 units, with Kyrgyz Republic with an amount of 0.34, with Honduras
for an amount of 0.29 units and with Tunisia for an amount of 0.34 units;
Tunisia has a connection with Maldives
amounting to 0.34 units with Kyrgyz Republic amounting to 0.27 units and with
Honduras amounting to 0.25 units;
Honduras has a connection with Tunisia for
an amount of 0.25 units, with the Maldives for an amount of 0.29 units, with
Belize for an amount of 0.34 units, and with Kyrgyz Republic for an amount by
0.24 units;
Kyrgyz Republic has a connection with
Tunisia for the amount of 0.27 units, with Honduras for the amount of 0.24
units, with Belize for the amount of 0.37 units and with the Maldives for the
amount of 0.26 units;
Belize has a connection Maldives amounting
to 0.19 units with Honduras amounting to 0.34 units, Kyrgyz Republic having
0.37 units to Mali amounting to 0.3 unit;
Mali has connections with Gambia amounting
to 0.38 units, with Papua New Guinea amounting to 0.29 units, with Maldives
amounting to 0.34 units and with Belize amounting to by 0.3 units.
There is also a simplified network
structure as indicated below, namely:
Georgia and Portugal have a connection
amounting to 0.34 units.
The application of a network analysis shows
the effects of propagation among countries of the increase of RQ in one
country. For example, if we consider one of the most connected countries, i.e.,
Maldives, we can find that the increase-or decrease- in RQ has positive-or
negative-effects on Papua New Guinea, Mali, Belize, Kyrgyz Republic, Honduras,
and Tunisia. Again, we have to underline the fact that there are not causal
relationships but they simply identify a series of connections that represents
some similarities in the data of analyzed countries.
7. Conclusions
In the article we conducted an analysis of
RQ with respect to a set of variables from the World Bank's ESG dataset. The
results show that the countries that have high levels of RQ are also countries
that suffer for environmental issues with the growth of GHG Emissions, the
increase of drought and temperatures. Furthermore, the fact of developing RQ
does not sufficiently help countries in the transition to the use of renewable
energy, despite the privatization of energy markets, and the development of
technologies for energy sustainability. Finally, contrary to current opinion,
RQ is negatively associated both with the exercise of civil and political
rights and also with the rule of law. A complex picture therefore emerges.
Certainly, the development of the market and the private sector is a precious
ally for the implementation of technologies that can guide the economy towards
environmental sustainability. In addition, the private sector offers many jobs
that help workers and families to access better life opportunities by
overcoming poverty and social inequality. However, evidently the development of
RQ is not sufficient to guarantee the application of ESG models. Furthermore,
the private sector has been hit, worldwide, by a set of adverse factors of a
macro-economic nature, which have reduced the productivity of companies,
disrupted supply chains and cracked trade relations among countries. While on
the one hand the growth of companies and the market would be desirable from an
ESG perspective, on the other hand macro-economic fragility is causing
investment to retreat and could delay the processes of energy transition,
social inclusion and good governance.
Funding
The authors received no financial support for the research, authorship, and/or publication of this article.
Data Availability Statement
The data presented in this study are available on request from the corresponding author.
Acknowledgments
We are grateful to the teaching staff of the LUM University “Giuseppe Degennaro” and to the management of the LUM Enterprise s.r.l. for the constant inspiration to continue our scientific research work undeterred.
Declaration of Competing Interest
The authors declare that there is no conflict of interests regarding the publication of this manuscript. In addition, the ethical issues, including
plagiarism, informed consent, misconduct, data fabrication and/or falsification, double publication.
Software
The authors have used the following software: Gretl for the econometric models, Orange for clusterization and network analysis, and KNIME for machine learning and predictions. They are all free version without licenses.
List of Abbreviations
| List of Abbreviations | |
| RQ | Regulatory Quality |
| ESG | Environmental, Social and Governance |
| C1 | Cluster 1 |
| C2 | Cluster 2 |
| C3 | Cluster 3 |
| C4 | Cluster 4 |
| C5 | Cluster 5 |
| IEF | Index of Economic Freedom |
| GDP | Gross Domestic Product |
| FDI | Foreign Direct Investments |
| ECOWAS | Economic Community of Western African States |
| BRICS | Brazil, Russia, India, China, and South Africa |
| MENA | Middle East and Northern African |
Appendix
Econometric Model to Estimate the Value of Regulatory Quality
| A55 | Regulatory Quality | |
| A3 | Adjusted savings: natural resources depletion (% of GNI) | |
| A8 | Annualized average growth rate in per capita real survey mean consumption or income, total population (%) | |
| A18 | Energy intensity level of primary energy (MJ/$2011 PPP GDP) | |
| A19 | Energy use (kg of oil equivalent per capita) | |
| A20 | Fertility rate, total (births per woman) | |
| A22 | Forest area (% of land area) | |
| A25 | GHG net emissions/removals by LUCF (Mt of CO2 equivalent) | |
| A29 | Heat Index 35 (projected change in days) | |
| A38 | Mean Drought Index (projected change, unitless) | |
| A40 | Mortality rate, under-5 (per 1,000 live births) | |
| A42 | Nitrous oxide emissions (metric tons of CO2 equivalent per capita) | |
| A44 | People using safely managed drinking water services (% of population) | |
| A56 | Renewable electricity output (% of total electricity output) | |
| A57 | Renewable energy consumption (% of total final energy consumption) | |
| A58 | Research and development expenditure (% of GDP) | |
| A59 | Rule of Law: Estimate | |
| A61 | School enrollment, primary and secondary (gross), gender parity index (GPI) | |
| A63 | Strength of legal rights index (0=weak to 12=strong) | |
| A67 | Voice and Accountability: Estimate |
| Fixed-effects, using 1930 observations |
| Included 193 cross-sectional units |
| Time-series length = 10 |
| Dependent variable: A55 |
| Coefficient | Std. Error | t-ratio | p-value | ||
| const | −6.80863 | 0.671195 | −10.14 | <0.0001 | *** |
| A3 | 0.0493771 | 0.0113790 | 4.339 | <0.0001 | *** |
| A8 | 0.159605 | 0.0325540 | 4.903 | <0.0001 | *** |
| A18 | 0.0667865 | 0.00321599 | 20.77 | <0.0001 | *** |
| A19 | −6.81686e-05 | 2.33296e-05 | −2.922 | 0.0035 | *** |
| A20 | 0.00139789 | 0.000172332 | 8.112 | <0.0001 | *** |
| A22 | 0.182940 | 0.0216880 | 8.435 | <0.0001 | *** |
| A25 | 4.70067 | 0.186900 | 25.15 | <0.0001 | *** |
| A29 | 2.35390 | 0.0991927 | 23.73 | <0.0001 | *** |
| A38 | 30.6816 | 2.56390 | 11.97 | <0.0001 | *** |
| A40 | 0.00159721 | 5.48937e-05 | 29.10 | <0.0001 | *** |
| A42 | 0.000109709 | 9.42060e-06 | 11.65 | <0.0001 | *** |
| A44 | 0.0114121 | 0.00133440 | 8.552 | <0.0001 | *** |
| A56 | −0.00545194 | 0.00169749 | −3.212 | 0.0013 | *** |
| A57 | −0.00987582 | 0.00225754 | −4.375 | <0.0001 | *** |
| A58 | 0.261720 | 0.0813550 | 3.217 | 0.0013 | *** |
| A59 | −0.632026 | 0.0251321 | −25.15 | <0.0001 | *** |
| A61 | 0.405291 | 0.0288846 | 14.03 | <0.0001 | *** |
| A63 | −0.00564257 | 0.000459479 | −12.28 | <0.0001 | *** |
| A67 | −0.473416 | 0.0926774 | −5.108 | <0.0001 | *** |
| Mean dependent var | 0.909885 | S.D. dependent var | 9.130740 | |
| Sum squared resid | 3871.433 | S.E. of regression | 1.501151 | |
| LSDV R-squared | 0.975927 | Within R-squared | 0.853979 | |
| LSDV F(211, 1718) | 330.0886 | P-value(F) | 0.000000 | |
| Log-likelihood | −3410.292 | Akaike criterion | 7244.585 | |
| Schwarz criterion | 8424.423 | Hannan-Quinn | 7678.578 | |
| rho | −0.285492 | Durbin-Watson | 2.460710 |
| Joint test on named regressors - |
| Test statistic: F(19, 1718) = 528.812 |
| with p-value = P(F(19, 1718) > 528.812) = 0 |
| Test for differing group intercepts - |
| Null hypothesis: The groups have a common intercept |
| Test statistic: F(192, 1718) = 6.56537 |
| with p-value = P(F(192, 1718) > 6.56537) = 1.76928e-108 |
| Random-effects (GLS), using 1930 observations |
| Using Nerlove's transformation |
| Included 193 cross-sectional units |
| Time-series length = 10 |
| Dependent variable: A55 |
| Coefficient | Std. Error | z | p-value | ||
| const | −3.04605 | 0.535881 | −5.684 | <0.0001 | *** |
| A3 | 0.0588496 | 0.0108366 | 5.431 | <0.0001 | *** |
| A8 | 0.242582 | 0.0295391 | 8.212 | <0.0001 | *** |
| A18 | 0.0765258 | 0.00281520 | 27.18 | <0.0001 | *** |
| A19 | −7.41586e-05 | 2.25470e-05 | −3.289 | 0.0010 | *** |
| A20 | 0.00122736 | 0.000164722 | 7.451 | <0.0001 | *** |
| A22 | 0.0601350 | 0.0123763 | 4.859 | <0.0001 | *** |
| A25 | 4.86007 | 0.177420 | 27.39 | <0.0001 | *** |
| A29 | 2.27903 | 0.0953228 | 23.91 | <0.0001 | *** |
| A38 | 36.2901 | 2.28357 | 15.89 | <0.0001 | *** |
| A40 | 0.00154137 | 5.22898e-05 | 29.48 | <0.0001 | *** |
| A42 | 0.000126329 | 8.82890e-06 | 14.31 | <0.0001 | *** |
| A44 | 0.0169024 | 0.00105183 | 16.07 | <0.0001 | *** |
| A56 | −0.00515810 | 0.00164107 | −3.143 | 0.0017 | *** |
| A57 | −0.00935402 | 0.00216682 | −4.317 | <0.0001 | *** |
| A58 | 0.209746 | 0.0773039 | 2.713 | 0.0067 | *** |
| A59 | −0.583255 | 0.0228707 | −25.50 | <0.0001 | *** |
| A61 | 0.316728 | 0.0232097 | 13.65 | <0.0001 | *** |
| A63 | −0.00421252 | 0.000392716 | −10.73 | <0.0001 | *** |
| A67 | −0.251586 | 0.0845652 | −2.975 | 0.0029 | *** |
| Mean dependent var | 0.909885 | S.D. dependent var | 9.130740 | |
| Sum squared resid | 16057.77 | S.E. of regression | 2.898760 | |
| Log-likelihood | −4783.071 | Akaike criterion | 9606.142 | |
| Schwarz criterion | 9717.447 | Hannan-Quinn | 9647.084 | |
| rho | −0.285492 | Durbin-Watson | 2.460710 |
| 'Between' variance = 25.106 |
| 'Within' variance = 2.00592 |
| theta used for quasi-demeaning = 0.910969 |
| Joint test on named regressors - |
| Asymptotic test statistic: Chi-square(19) = 11122.4 |
| with p-value = 0 |
| Breusch-Pagan test - |
| Null hypothesis: Variance of the unit-specific error = 0 |
| Asymptotic test statistic: Chi-square(1) = 209.475 |
| with p-value = 1.78842e-47 |
| Hausman test - |
| Null hypothesis: GLS estimates are consistent |
| Asymptotic test statistic: Chi-square(19) = 84.0967 |
| with p-value = 3.62174e-10 |
| Pooled OLS, using 1930 observations |
| Included 193 cross-sectional units |
| Time-series length = 10 |
| Dependent variable: A55 |
| Coefficient | Std. Error | t-ratio | p-value | ||
| const | −1.15866 | 0.0913888 | −12.68 | <0.0001 | *** |
| A3 | 0.0537446 | 0.00831782 | 6.461 | <0.0001 | *** |
| A8 | 0.321959 | 0.0337360 | 9.543 | <0.0001 | *** |
| A18 | 0.0915778 | 0.00313273 | 29.23 | <0.0001 | *** |
| A19 | −6.25063e-05 | 2.40161e-05 | −2.603 | 0.0093 | *** |
| A20 | 0.000976609 | 0.000196901 | 4.960 | <0.0001 | *** |
| A22 | −0.00336700 | 0.00187179 | −1.799 | 0.0722 | * |
| A25 | 4.00533 | 0.195159 | 20.52 | <0.0001 | *** |
| A29 | 1.53212 | 0.107622 | 14.24 | <0.0001 | *** |
| A38 | 31.5149 | 1.88046 | 16.76 | <0.0001 | *** |
| A40 | 0.00129145 | 6.28822e-05 | 20.54 | <0.0001 | *** |
| A42 | 0.000119891 | 1.05822e-05 | 11.33 | <0.0001 | *** |
| A44 | 0.0167064 | 0.000833370 | 20.05 | <0.0001 | *** |
| A56 | −0.00344708 | 0.00175677 | −1.962 | 0.0499 | ** |
| A57 | −0.00697072 | 0.00179044 | −3.893 | 0.0001 | *** |
| A58 | 0.312711 | 0.0624635 | 5.006 | <0.0001 | *** |
| A59 | −0.453224 | 0.0239284 | −18.94 | <0.0001 | *** |
| A61 | 0.306351 | 0.0128202 | 23.90 | <0.0001 | *** |
| A63 | −0.00129131 | 0.000296473 | −4.356 | <0.0001 | *** |
| A67 | 0.662681 | 0.0499730 | 13.26 | <0.0001 | *** |
| Mean dependent var | 0.909885 | S.D. dependent var | 9.130740 | |
| Sum squared resid | 6712.025 | S.E. of regression | 1.874606 | |
| R-squared | 0.958264 | Adjusted R-squared | 0.957849 | |
| F(19, 1910) | 2308.105 | P-value(F) | 0.000000 | |
| Log-likelihood | −3941.309 | Akaike criterion | 7922.618 | |
| Schwarz criterion | 8033.923 | Hannan-Quinn | 7963.560 | |
| rho | 0.121039 | Durbin-Watson | 1.613038 |
| List of Variables of the Econometric Model. Source World Bank | |
| Variable | Description |
| Regulatory Quality | Regulatory Quality captures perceptions of the ability of the government to formulate and implement sound policies and regulations that permit and promote private sector development. The variable change in a range between -2.5 and +2.5. |
| Adjusted savings: natural resources depletion | Natural resource depletion is the sum of net forest depletion, energy depletion, and mineral depletion. Net forest depletion is unit resource rents times the excess of roundwood harvest over natural growth. Energy depletion is the ratio of the value of the stock of energy resources to the remaining reserve lifetime (capped at 25 years). It covers coal, crude oil, and natural gas. Mineral depletion is the ratio of the value of the stock of mineral resources to the remaining reserve lifetime (capped at 25 years). It covers tin, gold, lead, zinc, iron, copper, nickel, silver, bauxite, and phosphate. |
| Annualized average growth rate in per capita real survey mean consumption or income, total population (%) | The growth rate in the welfare aggregate of the total population is computed as the annualized average growth rate in per capita real consumption or income of the total population in the income distribution in a country from household surveys over a roughly 5-year period. Mean per capita real consumption or income is measured at 2017 Purchasing Power Parity (PPP) using the Poverty and Inequality Platform (http://www.pip.worldbank.org). For some countries means are not reported due to grouped and/or confidential data. The annualized growth rate is computed as (Mean in final year/Mean in initial year)^(1/(Final year - Initial year)) - 1. The reference year is the year in which the underlying household survey data was collected. In cases for which the data collection period bridged two calendar years, the first year in which data were collected is reported. The initial year refers to the nearest survey collected 5 years before the most recent survey available, only surveys collected between 3 and 7 years before the most recent survey are considered. The coverage and quality of the 2017 PPP price data for Iraq and most other North African and Middle Eastern countries were hindered by the exceptional period of instability they faced at the time of the 2017 exercise of the International Comparison Program. See the Poverty and Inequality Platform for detailed explanations. |
| Energy intensity level of primary energy | Energy intensity level of primary energy is the ratio between energy supply and gross domestic product measured at purchasing power parity. Energy intensity is an indication of how much energy is used to produce one unit of economic output. Lower ratio indicates that less energy is used to produce one unit of output. |
| Energy use (kg of oil equivalent per capita) | In developing economies growth in energy use is closely related to growth in the modern sectors - industry, motorized transport, and urban areas - but energy use also reflects climatic, geographic, and economic factors (such as the relative price of energy). Energy use has been growing rapidly in low- and middle-income economies, but high-income economies still use almost five times as much energy on a per capita basis. Governments in many countries are increasingly aware of the urgent need to make better use of the world's energy resources. Improved energy efficiency is often the most economic and readily available means of improving energy security and reducing greenhouse gas emissions. |
| Fertility rate, total (births per woman) | Total fertility rate represents the number of children that would be born to a woman if she were to live to the end of her childbearing years and bear children in accordance with age-specific fertility rates of the specified year. |
| Forest area (% of land area) | Forest area is land under natural or planted stands of trees of at least 5 meters in situ, whether productive or not, and excludes tree stands in agricultural production systems (for example, in fruit plantations and agroforestry systems) and trees in urban parks and gardens. |
| GHG net emissions/removals by LUCF (Mt of CO2 equivalent) | GHG net emissions/removals by LUCF refers to changes in atmospheric levels of all greenhouse gases attributable to forest and land-use change activities, including but not limited to (1) emissions and removals of CO2 from decreases or increases in biomass stocks due to forest management, logging, fuelwood collection, etc.; (2) conversion of existing forests and natural grasslands to other land uses; (3) removal of CO2 from the abandonment of formerly managed lands (e.g. croplands and pastures); and (4) emissions and removals of CO2 in soil associated with land-use change and management. For Annex-I countries under the UNFCCC, these data are drawn from the annual GHG inventories submitted to the UNFCCC by each country; for non-Annex-I countries, data are drawn from the most recently submitted National Communication where available. Because of differences in reporting years and methodologies, these data are not generally considered comparable across countries. Data are in million metric tons. |
| Heat Index 35 (projected change in days) | Total count of days per year where the daily mean Heat Index rose above 35°C. A Heat Index is a measure of how hot it feels once humidity is factored in with air temperature. |
| Mean Drought Index (projected change, unitless) | Total count of days per year where the daily mean Heat Index rose above 35°C. A Heat Index is a measure of how hot it feels once humidity is factored in with air temperature. |
| Mortality rate, under-5 (per 1,000 live births) | Under-five mortality rate is the probability per 1,000 that a newborn baby will die before reaching age five, if subject to age-specific mortality rates of the specified year. |
| Nitrous oxide emissions (metric tons of CO2 equivalent per capita) | Nitrous oxide emissions are emissions from agricultural biomass burning, industrial activities, and livestock management. |
| People using safely managed drinking water services (% of population) | The percentage of people using drinking water from an improved source that is accessible on premises, available when needed and free from faecal and priority chemical contamination. Improved water sources include piped water, boreholes or tubewells, protected dug wells, protected springs, and packaged or delivered water. |
| Renewable electricity output (% of total electricity output) | Renewable electricity is the share of electrity generated by renewable power plants in total electricity generated by all types of plants. |
| Renewable energy consumption (% of total final energy consumption) | Renewable energy consumption is the share of renewables energy in total final energy consumption. |
| Research and development expenditure (% of GDP) | Gross domestic expenditures on research and development (R&D), expressed as a percent of GDP. They include both capital and current expenditures in the four main sectors: Business enterprise, Government, Higher education and Private non-profit. R&D covers basic research, applied research, and experimental development. |
| Rule of Law: Estimate | Rule of Law captures perceptions of the extent to which agents have confidence in and abide by the rules of society, and in particular the quality of contract enforcement, property rights, the police, and the courts, as well as the likelihood of crime and violence. Estimate gives the country's score on the aggregate indicator, in units of a standard normal distribution, i.e. ranging from approximately -2.5 to 2.5. |
| School enrollment, primary and secondary (gross), gender parity index (GPI) | Gender parity index for gross enrollment ratio in primary and secondary education is the ratio of girls to boys enrolled at primary and secondary levels in public and private schools. |
| Strength of legal rights index (0=weak to 12=strong) | Strength of legal rights index measures the degree to which collateral and bankruptcy laws protect the rights of borrowers and lenders and thus facilitate lending. The index ranges from 0 to 12, with higher scores indicating that these laws are better designed to expand access to credit. |
| Voice and Accountability: Estimate | Voice and Accountability captures perceptions of the extent to which a country's citizens are able to participate in selecting their government, as well as freedom of expression, freedom of association, and a free media. Standard error indicates the precision of the estimate of governance. Larger values of the standard error indicate less precise estimates. A 90 percent confidence interval for the governance estimate is given by the estimate +/- 1.64 times the standard error. |
Appendix 3-Ranking of Countries for the Level of RQ in 2021
| Ranking of Countries for the Level of RQ in 2021. Source WB | |||||
| Rank | Country Name | 2021 | Rank | Country Name | 2021 |
| 1 | Singapore | 2.231 | 97 | Ghana | -0.2003 |
| 2 | Luxembourg | 1.9152 | 98 | Paraguay | -0.2077 |
| 3 | Finland | 1.8981 | 99 | Mongolia | -0.2086 |
| 4 | Australia | 1.8387 | 100 | Mexico | -0.2307 |
| 5 | Denmark | 1.8088 | 101 | Cote d'Ivoire | -0.2564 |
| 6 | New Zealand | 1.8082 | 102 | Ukraine | -0.2782 |
| 7 | Netherlands | 1.7526 | 103 | Tonga | -0.2789 |
| 8 | Sweden | 1.7526 | 104 | Senegal | -0.3121 |
| 9 | Switzerland | 1.7329 | 105 | China | -0.3133 |
| 10 | Norway | 1.6354 | 106 | Guatemala | -0.3152 |
| 11 | Germany | 1.6315 | 107 | El Salvador | -0.3441 |
| 12 | Canada | 1.6172 | 108 | Bhutan | -0.3688 |
| 13 | Ireland | 1.5622 | 109 | Sri Lanka | -0.37 |
| 14 | Estonia | 1.5591 | 110 | Tuvalu | -0.3761 |
| 15 | Liechtenstein | 1.5353 | 111 | Tunisia | -0.3885 |
| 16 | Iceland | 1.5347 | 112 | Vietnam | -0.3982 |
| 17 | United Kingdom | 1.4656 | 113 | Belize | -0.4152 |
| 18 | United States | 1.4517 | 114 | Benin | -0.4315 |
| 19 | Japan | 1.3759 | 115 | Kenya | -0.4454 |
| 20 | Andorra | 1.3625 | 116 | Burkina Faso | -0.4669 |
| 21 | Austria | 1.3487 | 117 | Uganda | -0.4769 |
| 22 | Czechia | 1.3485 | 118 | Kiribati | -0.4826 |
| 23 | Belgium | 1.3425 | 119 | Egypt. Arab Rep. | -0.5066 |
| 24 | Lithuania | 1.2769 | 120 | Guyana | -0.5193 |
| 25 | France | 1.2356 | 121 | Honduras | -0.522 |
| 26 | Latvia | 1.2235 | 122 | Maldives | -0.5228 |
| 27 | Israel | 1.209 | 123 | Russian Federation | -0.5298 |
| 28 | Mauritius | 1.1672 | 124 | Zambia | -0.5529 |
| 29 | Korea. Rep. | 1.0995 | 125 | Kyrgyz Republic | -0.5776 |
| 30 | Georgia | 1.0605 | 126 | Uzbekistan | -0.5812 |
| 31 | United Arab Emirates | 1.0139 | 127 | Eswatini | -0.5826 |
| 32 | Brunei Darussalam | 0.9934 | 128 | Nepal | -0.6167 |
| 33 | Chile | 0.9534 | 129 | Argentina | -0.6181 |
| 34 | Slovak Republic | 0.8742 | 130 | Mali | -0.6216 |
| 35 | Qatar | 0.8635 | 131 | Tanzania | -0.6268 |
| 36 | Cyprus | 0.859 | 132 | Togo | -0.6333 |
| 37 | Bahrain | 0.8491 | 133 | Cambodia | -0.6442 |
| 38 | Poland | 0.84 | 134 | Angola | -0.6626 |
| 39 | Slovenia | 0.8343 | 135 | Ecuador | -0.7028 |
| 40 | Malta | 0.8137 | 136 | Suriname | -0.705 |
| 41 | Spain | 0.811 | 137 | Pakistan | -0.7316 |
| 42 | Portugal | 0.7361 | 138 | Lesotho | -0.7372 |
| 43 | Uruguay | 0.7226 | 139 | Niger | -0.7455 |
| 44 | Malaysia | 0.7224 | 140 | Mozambique | -0.7783 |
| 45 | Botswana | 0.6142 | 141 | Malawi | -0.786 |
| 46 | Barbados | 0.5605 | 142 | Micronesia. Fed. Sts. | -0.786 |
| 47 | St. Kitts and Nevis | 0.5524 | 143 | Timor-Leste | -0.7867 |
| 48 | Italy | 0.5452 | 144 | Gabon | -0.808 |
| 49 | Croatia | 0.502 | 145 | Madagascar | -0.8201 |
| 50 | Hungary | 0.4962 | 146 | Papua New Guinea | -0.8347 |
| 51 | Costa Rica | 0.4564 | 147 | Nicaragua | -0.8359 |
| 52 | Bulgaria | 0.4483 | 148 | Bangladesh | -0.8457 |
| 53 | Greece | 0.4417 | 149 | Solomon Islands | -0.8631 |
| 54 | Montenegro | 0.4306 | 150 | Djibouti | -0.8691 |
| 55 | North Macedonia | 0.4167 | 151 | Gambia. The | -0.8733 |
| 56 | Antigua and Barbuda | 0.3904 | 152 | Lebanon | -0.8828 |
| 57 | Nauru | 0.3896 | 153 | Lao PDR | -0.8875 |
| 58 | St. Lucia | 0.3744 | 154 | Belarus | -0.9192 |
| 59 | St. Vincent and the Grenadines | 0.3359 | 155 | Cameroon | -0.9227 |
| 60 | Saudi Arabia | 0.3357 | 156 | Ethiopia | -0.9281 |
| 61 | Oman | 0.3298 | 157 | Sao Tome and Principe | -0.9299 |
| 62 | Romania | 0.309 | 158 | Nigeria | -0.9326 |
| 63 | Indonesia | 0.2982 | 159 | Liberia | -0.9502 |
| 64 | Grenada | 0.2919 | 160 | Guinea | -0.9643 |
| 65 | Dominica | 0.2836 | 161 | Sierra Leone | -0.9649 |
| 66 | Cabo Verde | 0.2736 | 162 | Burundi | -0.9843 |
| 67 | Colombia | 0.2201 | 163 | Mauritania | -1.0552 |
| 68 | Jamaica | 0.1958 | 164 | Marshall Islands | -1.1065 |
| 69 | Albania | 0.1928 | 165 | Iraq | -1.1122 |
| 70 | Palau | 0.1927 | 166 | Tajikistan | -1.1258 |
| 71 | Panama | 0.1926 | 167 | Myanmar | -1.1309 |
| 72 | Kuwait | 0.1748 | 168 | Bolivia | -1.1539 |
| 73 | Jordan | 0.1507 | 169 | Chad | -1.155 |
| 74 | Armenia | 0.1452 | 170 | Algeria | -1.1709 |
| 75 | Thailand | 0.0941 | 171 | Comoros | -1.2475 |
| 76 | Kazakhstan | 0.0899 | 172 | Guinea-Bissau | -1.2583 |
| 77 | Dominican Republic | 0.0891 | 173 | Haiti | -1.3187 |
| 78 | Peru | 0.0826 | 174 | Afghanistan | -1.338 |
| 79 | Philippines | 0.0765 | 175 | Congo. Rep. | -1.3546 |
| 80 | Rwanda | 0.071 | 176 | Zimbabwe | -1.3725 |
| 81 | Bahamas. The | 0.0641 | 177 | Congo. Dem. Rep. | -1.4229 |
| 82 | Serbia | 0.0521 | 178 | Cuba | -1.4434 |
| 83 | Seychelles | 0.0197 | 179 | Sudan | -1.4654 |
| 84 | Moldova | 0.0139 | 180 | Central African Republic | -1.4903 |
| 85 | Fiji | -0.005 | 181 | Iran. Islamic Rep. | -1.6223 |
| 86 | Namibia | -0.005 | 182 | Syrian Arab Republic | -1.6289 |
| 87 | Azerbaijan | -0.06 | 183 | Equatorial Guinea | -1.7128 |
| 88 | South Africa | -0.073 | 184 | Somalia | -1.8172 |
| 89 | India | -0.079 | 185 | Libya | -1.9512 |
| 90 | Turkiye | -0.082 | 186 | South Sudan | -1.9846 |
| 91 | Trinidad and Tobago | -0.085 | 187 | Yemen. Rep. | -2.0079 |
| 92 | Brazil | -0.111 | 188 | Turkmenistan | -2.0188 |
| 93 | Morocco | -0.122 | 189 | Venezuela. RB | -2.1957 |
| 94 | Vanuatu | -0.123 | 190 | Eritrea | -2.2687 |
| 95 | Samoa | -0.167 | 191 | Korea. Dem. People's Rep. | -2.3274 |
| 96 | Bosnia and Herzegovina | -0.179 | |||
Appendix 5-Ranking of Countries for level of percentage variation of RQ in the period 2010-2021
| Ranking of Countries for RQ Percentage Variation between 2010-2021 | |||||
| Rank | Country Name | 2010 | 2021 | Var Ass | Var per |
| 1 | United Arab Emirates | 0.32 | 1.01 | 0.70 | 218.27 |
| 2 | El Salvador | 0.34 | -0.34 | -0.68 | 201.97 |
| 3 | Indonesia | -0.38 | 0.30 | 0.68 | 178.29 |
| 4 | Uganda | -0.20 | -0.48 | -0.28 | 136.86 |
| 5 | Saudi Arabia | 0.16 | 0.34 | 0.18 | 110.26 |
| 6 | Fiji | -0.56 | 0.00 | 0.56 | 99.20 |
| 7 | Vanuatu | -0.78 | -0.12 | 0.66 | 84.29 |
| 8 | India | -0.41 | -0.08 | 0.33 | 80.80 |
| 9 | Georgia | 0.59 | 1.06 | 0.47 | 80.78 |
| 10 | North Macedonia | 0.24 | 0.42 | 0.18 | 75.42 |
| 11 | Cote d'Ivoire | -0.93 | -0.26 | 0.67 | 72.31 |
| 12 | Tuvalu | -1.15 | -0.38 | 0.78 | 67.38 |
| 13 | Iceland | 0.92 | 1.53 | 0.61 | 66.70 |
| 14 | Kiribati | -1.32 | -0.48 | 0.84 | 63.39 |
| 15 | Uzbekistan | -1.54 | -0.58 | 0.96 | 62.17 |
| 16 | Thailand | 0.06 | 0.09 | 0.03 | 52.30 |
| 17 | Tonga | -0.58 | -0.28 | 0.30 | 51.87 |
| 18 | Myanmar | -2.24 | -1.13 | 1.11 | 49.62 |
| 19 | Mauritius | 0.80 | 1.17 | 0.37 | 45.54 |
| 20 | Qatar | 0.60 | 0.86 | 0.27 | 44.73 |
| 21 | Paraguay | -0.36 | -0.21 | 0.15 | 42.56 |
| 22 | Colombia | 0.16 | 0.22 | 0.06 | 39.95 |
| 23 | Ukraine | -0.45 | -0.28 | 0.18 | 38.79 |
| 24 | Samoa | -0.27 | -0.17 | 0.10 | 38.07 |
| 25 | Angola | -1.06 | -0.66 | 0.40 | 37.50 |
| 26 | Ecuador | -1.12 | -0.70 | 0.42 | 37.48 |
| 27 | Vietnam | -0.63 | -0.40 | 0.23 | 36.99 |
| 28 | Japan | 1.02 | 1.38 | 0.36 | 35.34 |
| 29 | Lithuania | 0.96 | 1.28 | 0.32 | 32.99 |
| 30 | Latvia | 0.93 | 1.22 | 0.30 | 31.77 |
| 31 | Zimbabwe | -2.00 | -1.37 | 0.63 | 31.44 |
| 32 | Timor-Leste | -1.11 | -0.79 | 0.32 | 29.16 |
| 33 | Togo | -0.89 | -0.63 | 0.25 | 28.63 |
| 34 | Solomon Islands | -1.20 | -0.86 | 0.34 | 28.22 |
| 35 | Singapore | 1.78 | 2.23 | 0.45 | 25.09 |
| 36 | Belarus | -1.19 | -0.92 | 0.27 | 22.64 |
| 37 | Somalia | -2.30 | -1.82 | 0.48 | 21.03 |
| 38 | Uruguay | 0.60 | 0.72 | 0.12 | 20.57 |
| 39 | Korea. Rep. | 0.92 | 1.10 | 0.18 | 19.73 |
| 40 | Bahrain | 0.71 | 0.85 | 0.14 | 19.25 |
| 41 | Mongolia | -0.26 | -0.21 | 0.05 | 19.17 |
| 42 | Nepal | -0.76 | -0.62 | 0.15 | 19.04 |
| 43 | Malaysia | 0.61 | 0.72 | 0.11 | 18.18 |
| 44 | Lesotho | -0.63 | -0.74 | -0.11 | 16.99 |
| 45 | Argentina | -0.74 | -0.62 | 0.13 | 16.80 |
| 46 | Luxembourg | 1.67 | 1.92 | 0.24 | 14.42 |
| 47 | Guyana | -0.61 | -0.52 | 0.09 | 14.21 |
| 48 | Cuba | -1.67 | -1.44 | 0.23 | 13.67 |
| 49 | Lao PDR | -1.02 | -0.89 | 0.13 | 12.65 |
| 50 | Estonia | 1.39 | 1.56 | 0.17 | 12.31 |
| 51 | Burundi | -1.12 | -0.98 | 0.14 | 12.30 |
| 52 | Afghanistan | -1.52 | -1.34 | 0.18 | 11.77 |
| 53 | Barbados | 0.51 | 0.56 | 0.06 | 10.84 |
| 54 | Comoros | -1.40 | -1.25 | 0.15 | 10.63 |
| 55 | Marshall Islands | -1.24 | -1.11 | 0.13 | 10.54 |
| 56 | Kuwait | 0.16 | 0.17 | 0.02 | 10.36 |
| 57 | Slovenia | 0.76 | 0.83 | 0.08 | 9.87 |
| 58 | Guinea | -1.06 | -0.96 | 0.10 | 9.02 |
| 59 | Liberia | -1.04 | -0.95 | 0.09 | 8.65 |
| 60 | Australia | 1.70 | 1.84 | 0.14 | 8.42 |
| 61 | Norway | 1.51 | 1.64 | 0.12 | 8.16 |
| 62 | Congo. Dem. Rep. | -1.55 | -1.42 | 0.13 | 8.09 |
| 63 | St. Lucia | 0.35 | 0.37 | 0.03 | 7.73 |
| 64 | Grenada | 0.27 | 0.29 | 0.02 | 7.22 |
| 65 | Austria | 1.45 | 1.35 | -0.10 | 7.02 |
| 66 | Switzerland | 1.62 | 1.73 | 0.11 | 6.91 |
| 67 | Botswana | 0.58 | 0.61 | 0.04 | 6.20 |
| 68 | Sweden | 1.66 | 1.75 | 0.10 | 5.82 |
| 69 | Iran. Islamic Rep. | -1.71 | -1.62 | 0.09 | 5.09 |
| 70 | Korea. Dem. People's Rep. | -2.45 | -2.33 | 0.12 | 4.83 |
| 71 | Belgium | 1.28 | 1.34 | 0.06 | 4.65 |
| 72 | Canada | 1.69 | 1.62 | -0.08 | 4.50 |
| 73 | St. Vincent and the Grenadines | 0.32 | 0.34 | 0.01 | 4.43 |
| 74 | Czechia | 1.30 | 1.35 | 0.05 | 3.95 |
| 75 | Germany | 1.57 | 1.63 | 0.06 | 3.87 |
| 76 | Croatia | 0.49 | 0.50 | 0.01 | 2.56 |
| 77 | Portugal | 0.72 | 0.74 | 0.02 | 2.53 |
| 78 | China | -0.32 | -0.31 | 0.01 | 2.38 |
| 79 | Turkmenistan | -2.06 | -2.02 | 0.04 | 2.07 |
| 80 | Senegal | -0.32 | -0.31 | 0.01 | 1.74 |
| 81 | Netherlands | 1.73 | 1.75 | 0.02 | 1.36 |
| 82 | Finland | 1.87 | 1.90 | 0.03 | 1.33 |
| 83 | Liechtenstein | 1.53 | 1.54 | 0.01 | 0.66 |
| 84 | United States | 1.44 | 1.45 | 0.01 | 0.55 |
| 85 | New Zealand | 1.81 | 1.81 | 0.00 | -0.23 |
| 86 | Israel | 1.21 | 1.21 | -0.01 | -0.48 |
| 87 | Bangladesh | -0.86 | -0.85 | 0.01 | -1.39 |
| 88 | Morocco | -0.12 | -0.12 | 0.00 | -1.81 |
| 89 | Andorra | 1.39 | 1.36 | -0.03 | -1.94 |
| 90 | Denmark | 1.87 | 1.81 | -0.07 | -3.47 |
| 91 | Ireland | 1.62 | 1.56 | -0.06 | -3.47 |
| 92 | Micronesia. Fed. Sts. | -0.75 | -0.79 | -0.03 | -4.24 |
| 93 | Eritrea | -2.16 | -2.27 | -0.11 | -4.88 |
| 94 | Zambia | -0.52 | -0.55 | -0.03 | -5.34 |
| 95 | Suriname | -0.67 | -0.71 | -0.04 | -5.61 |
| 96 | France | 1.31 | 1.24 | -0.08 | -5.69 |
| 97 | Algeria | -1.10 | -1.17 | -0.07 | -5.98 |
| 98 | Chad | -1.08 | -1.16 | -0.07 | -6.88 |
| 99 | Benin | -0.40 | -0.43 | -0.03 | -7.40 |
| 100 | Iraq | -1.03 | -1.11 | -0.08 | -8.05 |
| 101 | Congo. Rep. | -1.25 | -1.35 | -0.10 | -8.18 |
| 102 | Sao Tome and Principe | -0.85 | -0.93 | -0.08 | -8.80 |
| 103 | Sudan | -1.34 | -1.47 | -0.12 | -8.96 |
| 104 | Ethiopia | -0.85 | -0.93 | -0.08 | -9.43 |
| 105 | Brunei Darussalam | 1.11 | 0.99 | -0.12 | -10.35 |
| 106 | Equatorial Guinea | -1.55 | -1.71 | -0.16 | -10.61 |
| 107 | Tajikistan | -1.01 | -1.13 | -0.12 | -11.43 |
| 108 | Guinea-Bissau | -1.12 | -1.26 | -0.14 | -11.98 |
| 109 | Slovak Republic | 1.00 | 0.87 | -0.13 | -12.51 |
| 110 | United Kingdom | 1.73 | 1.47 | -0.27 | -15.31 |
| 111 | Jamaica | 0.23 | 0.20 | -0.04 | -16.28 |
| 112 | Albania | 0.23 | 0.19 | -0.04 | -17.37 |
| 113 | Poland | 1.02 | 0.84 | -0.18 | -17.90 |
| 114 | Dominica | 0.35 | 0.28 | -0.06 | -18.42 |
| 115 | Pakistan | -0.61 | -0.73 | -0.12 | -19.28 |
| 116 | Costa Rica | 0.59 | 0.46 | -0.13 | -22.12 |
| 117 | Cameroon | -0.75 | -0.92 | -0.17 | -22.54 |
| 118 | Malawi | -0.64 | -0.79 | -0.15 | -23.30 |
| 119 | Belize | -0.34 | -0.42 | -0.08 | -23.71 |
| 120 | Mauritania | -0.84 | -1.06 | -0.21 | -25.17 |
| 121 | Nigeria | -0.74 | -0.93 | -0.19 | -25.44 |
| 122 | Oman | 0.44 | 0.33 | -0.11 | -25.52 |
| 123 | Sierra Leone | -0.76 | -0.96 | -0.20 | -26.84 |
| 124 | Central African Republic | -1.16 | -1.49 | -0.33 | -28.15 |
| 125 | Haiti | -1.03 | -1.32 | -0.29 | -28.25 |
| 126 | Mali | -0.48 | -0.62 | -0.14 | -28.51 |
| 127 | Djibouti | -0.68 | -0.87 | -0.19 | -28.51 |
| 128 | Spain | 1.16 | 0.81 | -0.35 | -29.98 |
| 129 | Cambodia | -0.49 | -0.64 | -0.15 | -31.20 |
| 130 | Greece | 0.64 | 0.44 | -0.20 | -31.29 |
| 131 | Niger | -0.56 | -0.75 | -0.18 | -32.04 |
| 132 | Chile | 1.42 | 0.95 | -0.46 | -32.63 |
| 133 | Bulgaria | 0.68 | 0.45 | -0.23 | -34.11 |
| 134 | Jordan | 0.23 | 0.15 | -0.08 | -34.37 |
| 135 | Madagascar | -0.61 | -0.82 | -0.22 | -35.43 |
| 136 | Tanzania | -0.46 | -0.63 | -0.16 | -35.57 |
| 137 | Maldives | -0.38 | -0.52 | -0.14 | -36.13 |
| 138 | Italy | 0.89 | 0.55 | -0.35 | -39.04 |
| 139 | Antigua and Barbuda | 0.64 | 0.39 | -0.25 | -39.28 |
| 140 | Cyprus | 1.42 | 0.86 | -0.56 | -39.55 |
| 141 | Venezuela. RB | -1.56 | -2.20 | -0.63 | -40.47 |
| 142 | Malta | 1.43 | 0.81 | -0.62 | -43.04 |
| 143 | Bolivia | -0.80 | -1.15 | -0.36 | -44.73 |
| 144 | Armenia | 0.27 | 0.15 | -0.12 | -46.03 |
| 145 | Papua New Guinea | -0.57 | -0.83 | -0.27 | -46.54 |
| 146 | Eswatini | -0.40 | -0.58 | -0.19 | -46.85 |
| 147 | Sri Lanka | -0.25 | -0.37 | -0.12 | -49.06 |
| 148 | Bosnia and Herzegovina | -0.12 | -0.18 | -0.06 | -49.51 |
| 149 | Libya | -1.30 | -1.95 | -0.65 | -50.29 |
| 150 | Hungary | 1.01 | 0.50 | -0.52 | -51.09 |
| 151 | St. Kitts and Nevis | 1.14 | 0.55 | -0.59 | -51.56 |
| 152 | Romania | 0.67 | 0.31 | -0.36 | -54.05 |
| 153 | Panama | 0.47 | 0.19 | -0.28 | -59.21 |
| 154 | Bhutan | -1.16 | -0.37 | 0.79 | -68.18 |
| 155 | Russian Federation | -0.31 | -0.53 | -0.22 | -70.63 |
| 156 | Mozambique | -0.45 | -0.78 | -0.33 | -71.65 |
| 157 | Peru | 0.39 | 0.08 | -0.31 | -78.97 |
| 158 | Gambia. The | -0.48 | -0.87 | -0.39 | -81.73 |
| 159 | Guatemala | -0.17 | -0.32 | -0.14 | -83.00 |
| 160 | Azerbaijan | -0.39 | -0.06 | 0.33 | -84.82 |
| 161 | Gabon | -0.44 | -0.81 | -0.37 | -85.53 |
| 162 | Bahamas. The | 0.55 | 0.06 | -0.49 | -88.32 |
| 163 | Syrian Arab Republic | -0.86 | -1.63 | -0.77 | -90.45 |
| 164 | Namibia | 0.21 | 0.00 | -0.22 | -102.18 |
| 165 | Moldova | -0.13 | 0.01 | 0.15 | -110.49 |
| 166 | Honduras | -0.25 | -0.52 | -0.28 | -111.69 |
| 167 | Trinidad and Tobago | 0.54 | -0.09 | -0.63 | -115.83 |
| 168 | South Africa | 0.45 | -0.07 | -0.52 | -116.42 |
| 169 | Kyrgyz Republic | -0.26 | -0.58 | -0.32 | -120.98 |
| 170 | Palau | -0.87 | 0.19 | 1.07 | -122.07 |
| 171 | Burkina Faso | -0.21 | -0.47 | -0.26 | -124.09 |
| 172 | Turkiye | 0.31 | -0.08 | -0.40 | -126.17 |
| 173 | Rwanda | -0.24 | 0.07 | 0.31 | -129.60 |
| 174 | Kazakhstan | -0.28 | 0.09 | 0.37 | -131.75 |
| 175 | Philippines | -0.22 | 0.08 | 0.29 | -135.52 |
| 176 | Nauru | -1.05 | 0.39 | 1.44 | -137.22 |
| 177 | Brazil | 0.25 | -0.11 | -0.36 | -144.93 |
| 178 | Nicaragua | -0.30 | -0.84 | -0.53 | -176.44 |
| 179 | Dominican Republic | -0.12 | 0.09 | 0.21 | -176.81 |
| 180 | Serbia | -0.07 | 0.05 | 0.12 | -179.39 |
| 181 | Seychelles | -0.02 | 0.02 | 0.04 | -211.47 |
| 182 | Yemen. Rep. | -0.62 | -2.01 | -1.39 | -226.08 |
| 183 | Kenya | -0.14 | -0.45 | -0.31 | -226.56 |
| 184 | Egypt. Arab Rep. | -0.15 | -0.51 | -0.36 | -243.22 |
| 185 | Mexico | 0.16 | -0.23 | -0.39 | -247.58 |
| 186 | Cabo Verde | -0.15 | 0.27 | 0.42 | -286.86 |
| 187 | Tunisia | -0.09 | -0.39 | -0.30 | -345.03 |
| 188 | Ghana | 0.05 | -0.20 | -0.25 | -473.97 |
| 189 | Lebanon | 0.02 | -0.88 | -0.91 | -4056.57 |
| 190 | Montenegro | -0.01 | 0.43 | 0.44 | -6037.36 |
Appendix 6- Graphical Results of the Clusterization with the application of the k-Means algorithm optimized with the Elbow Method
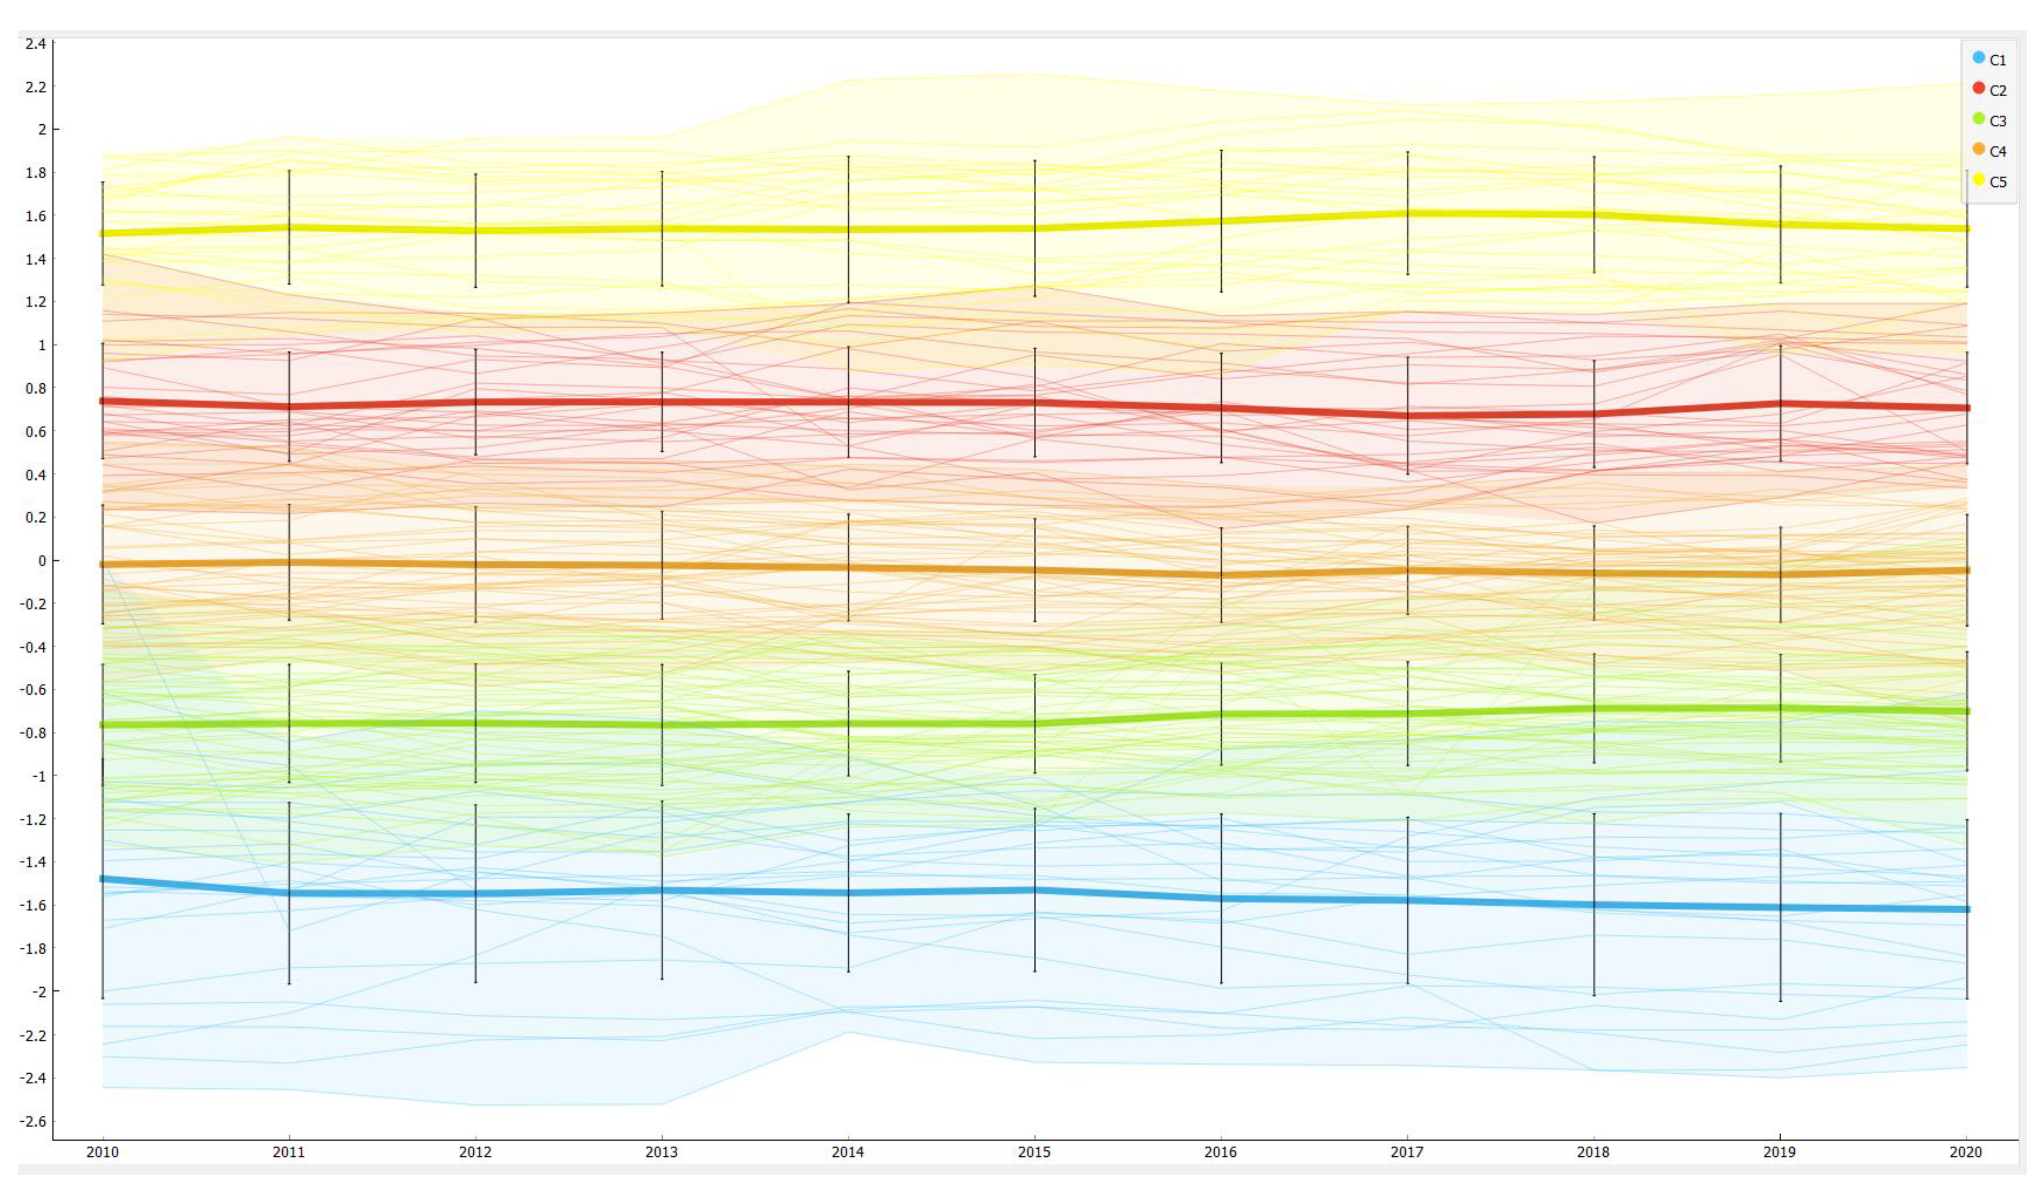
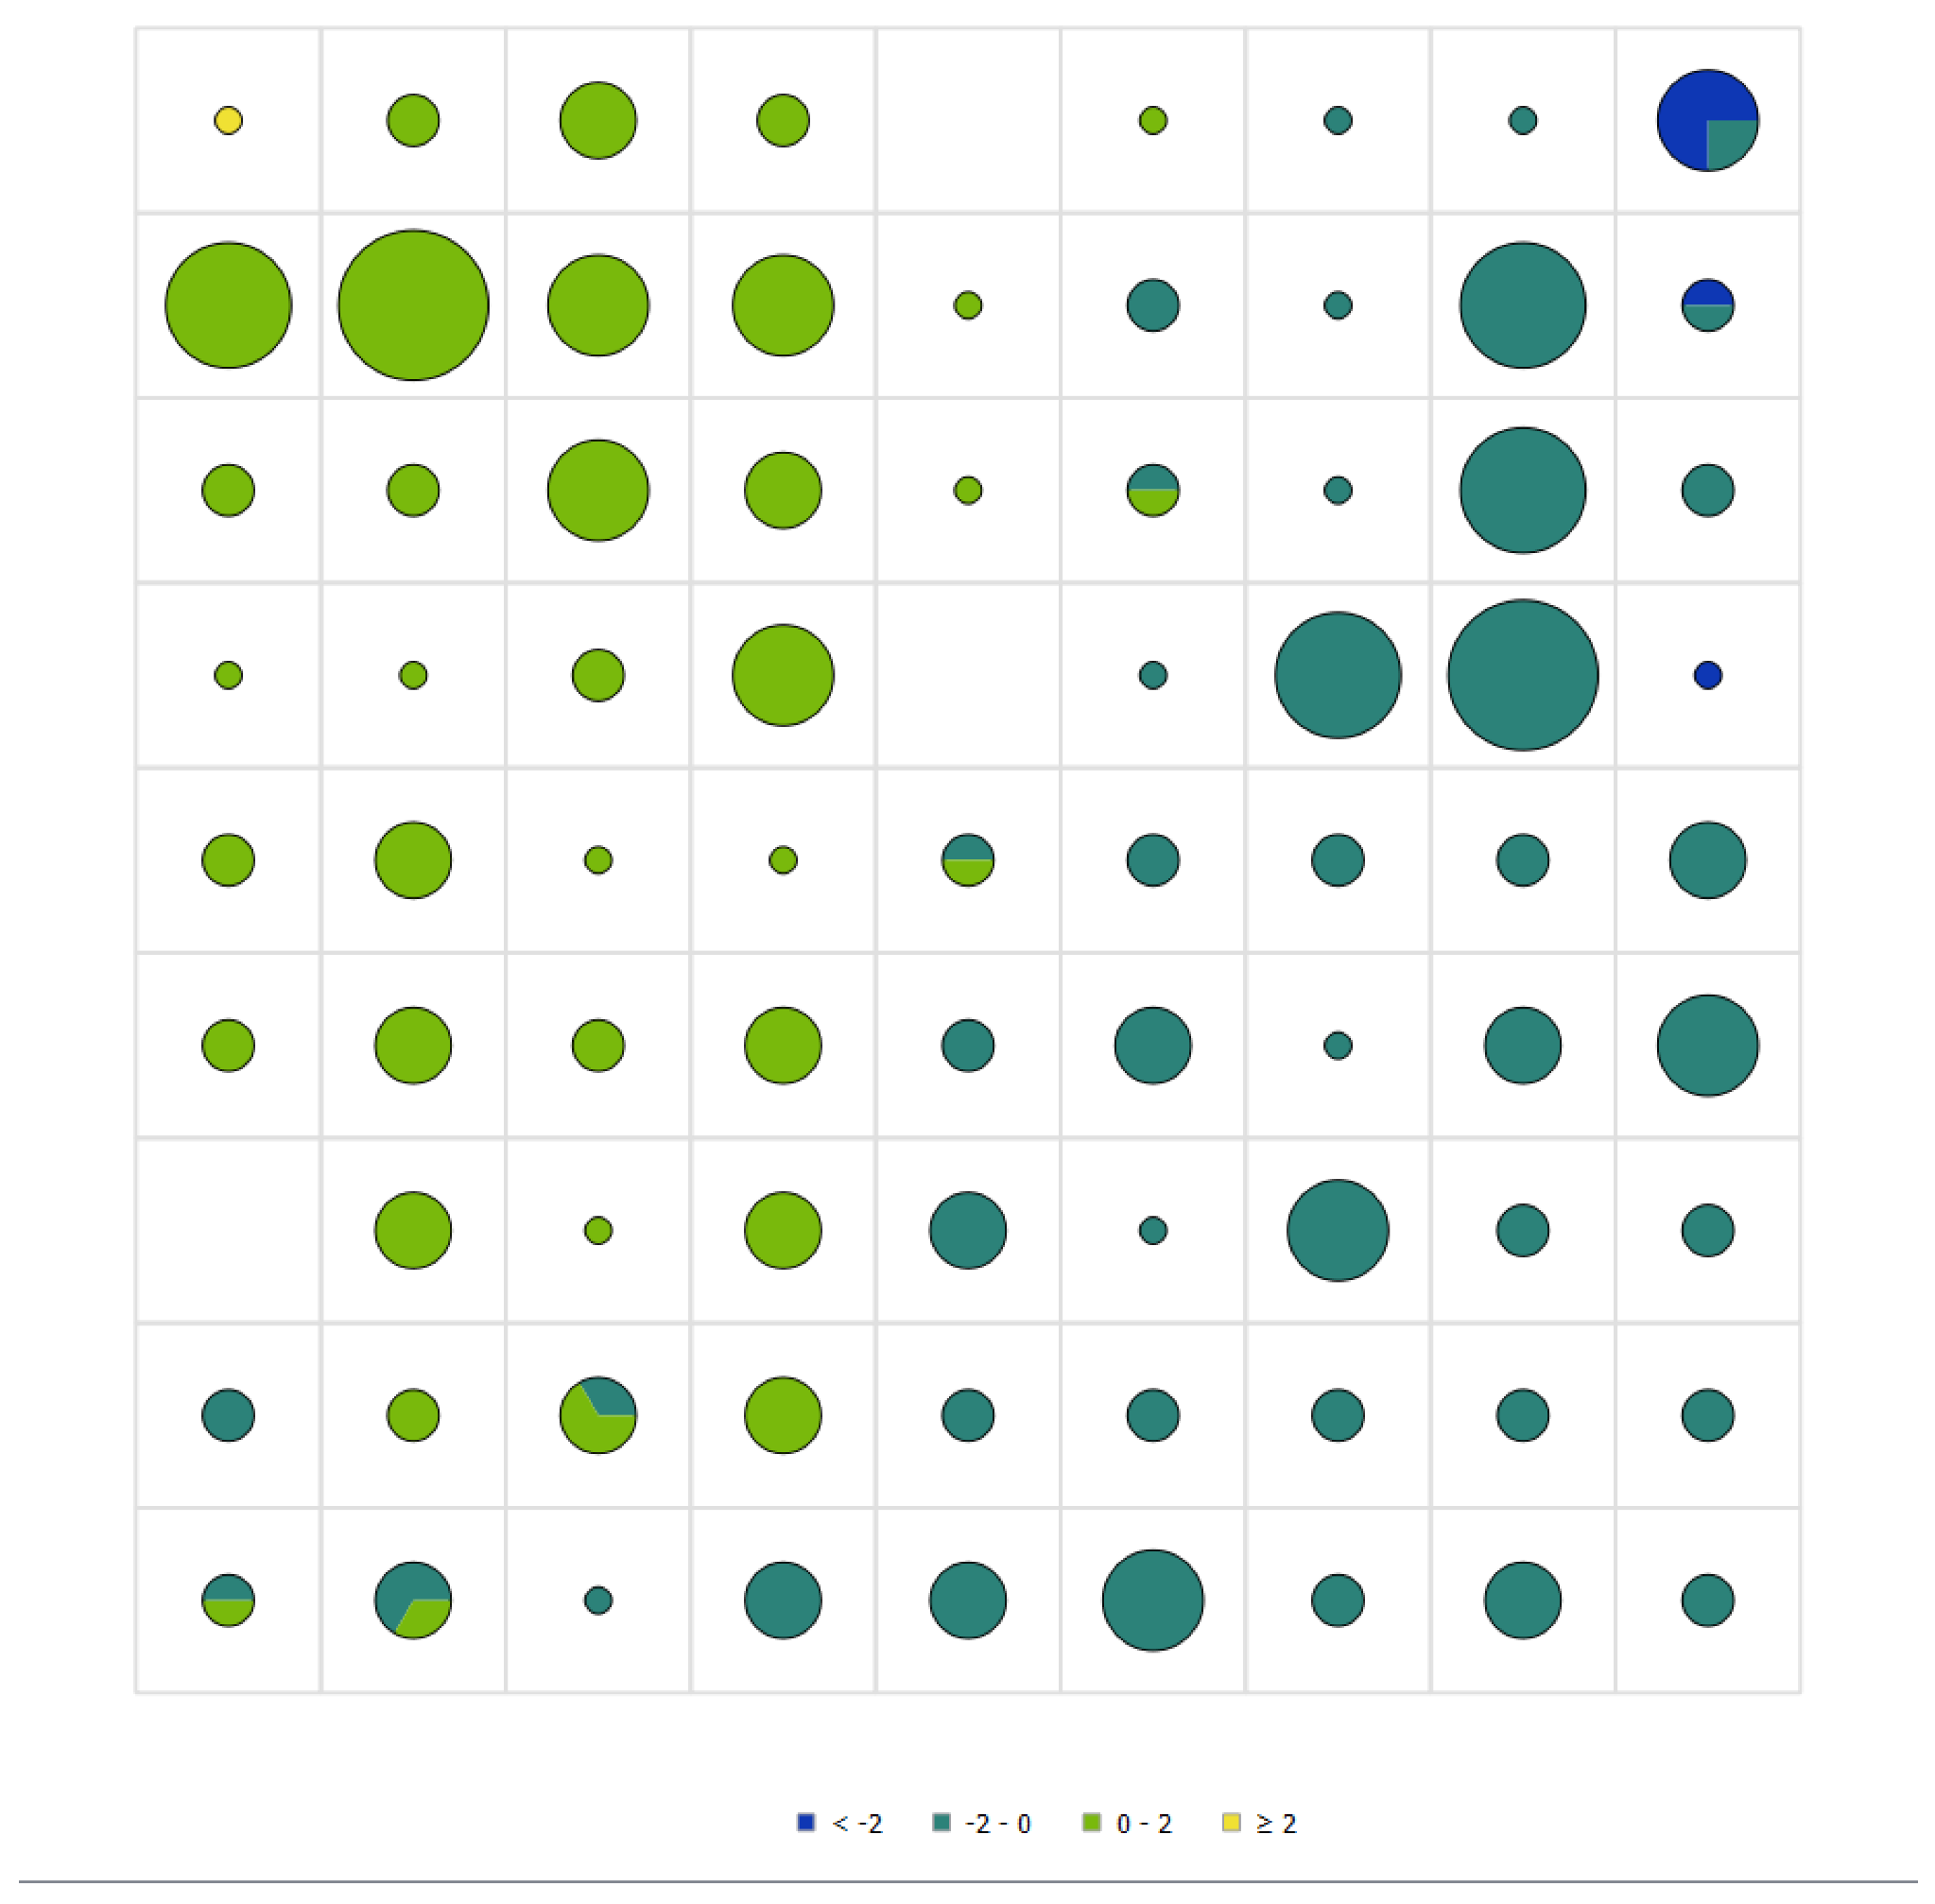
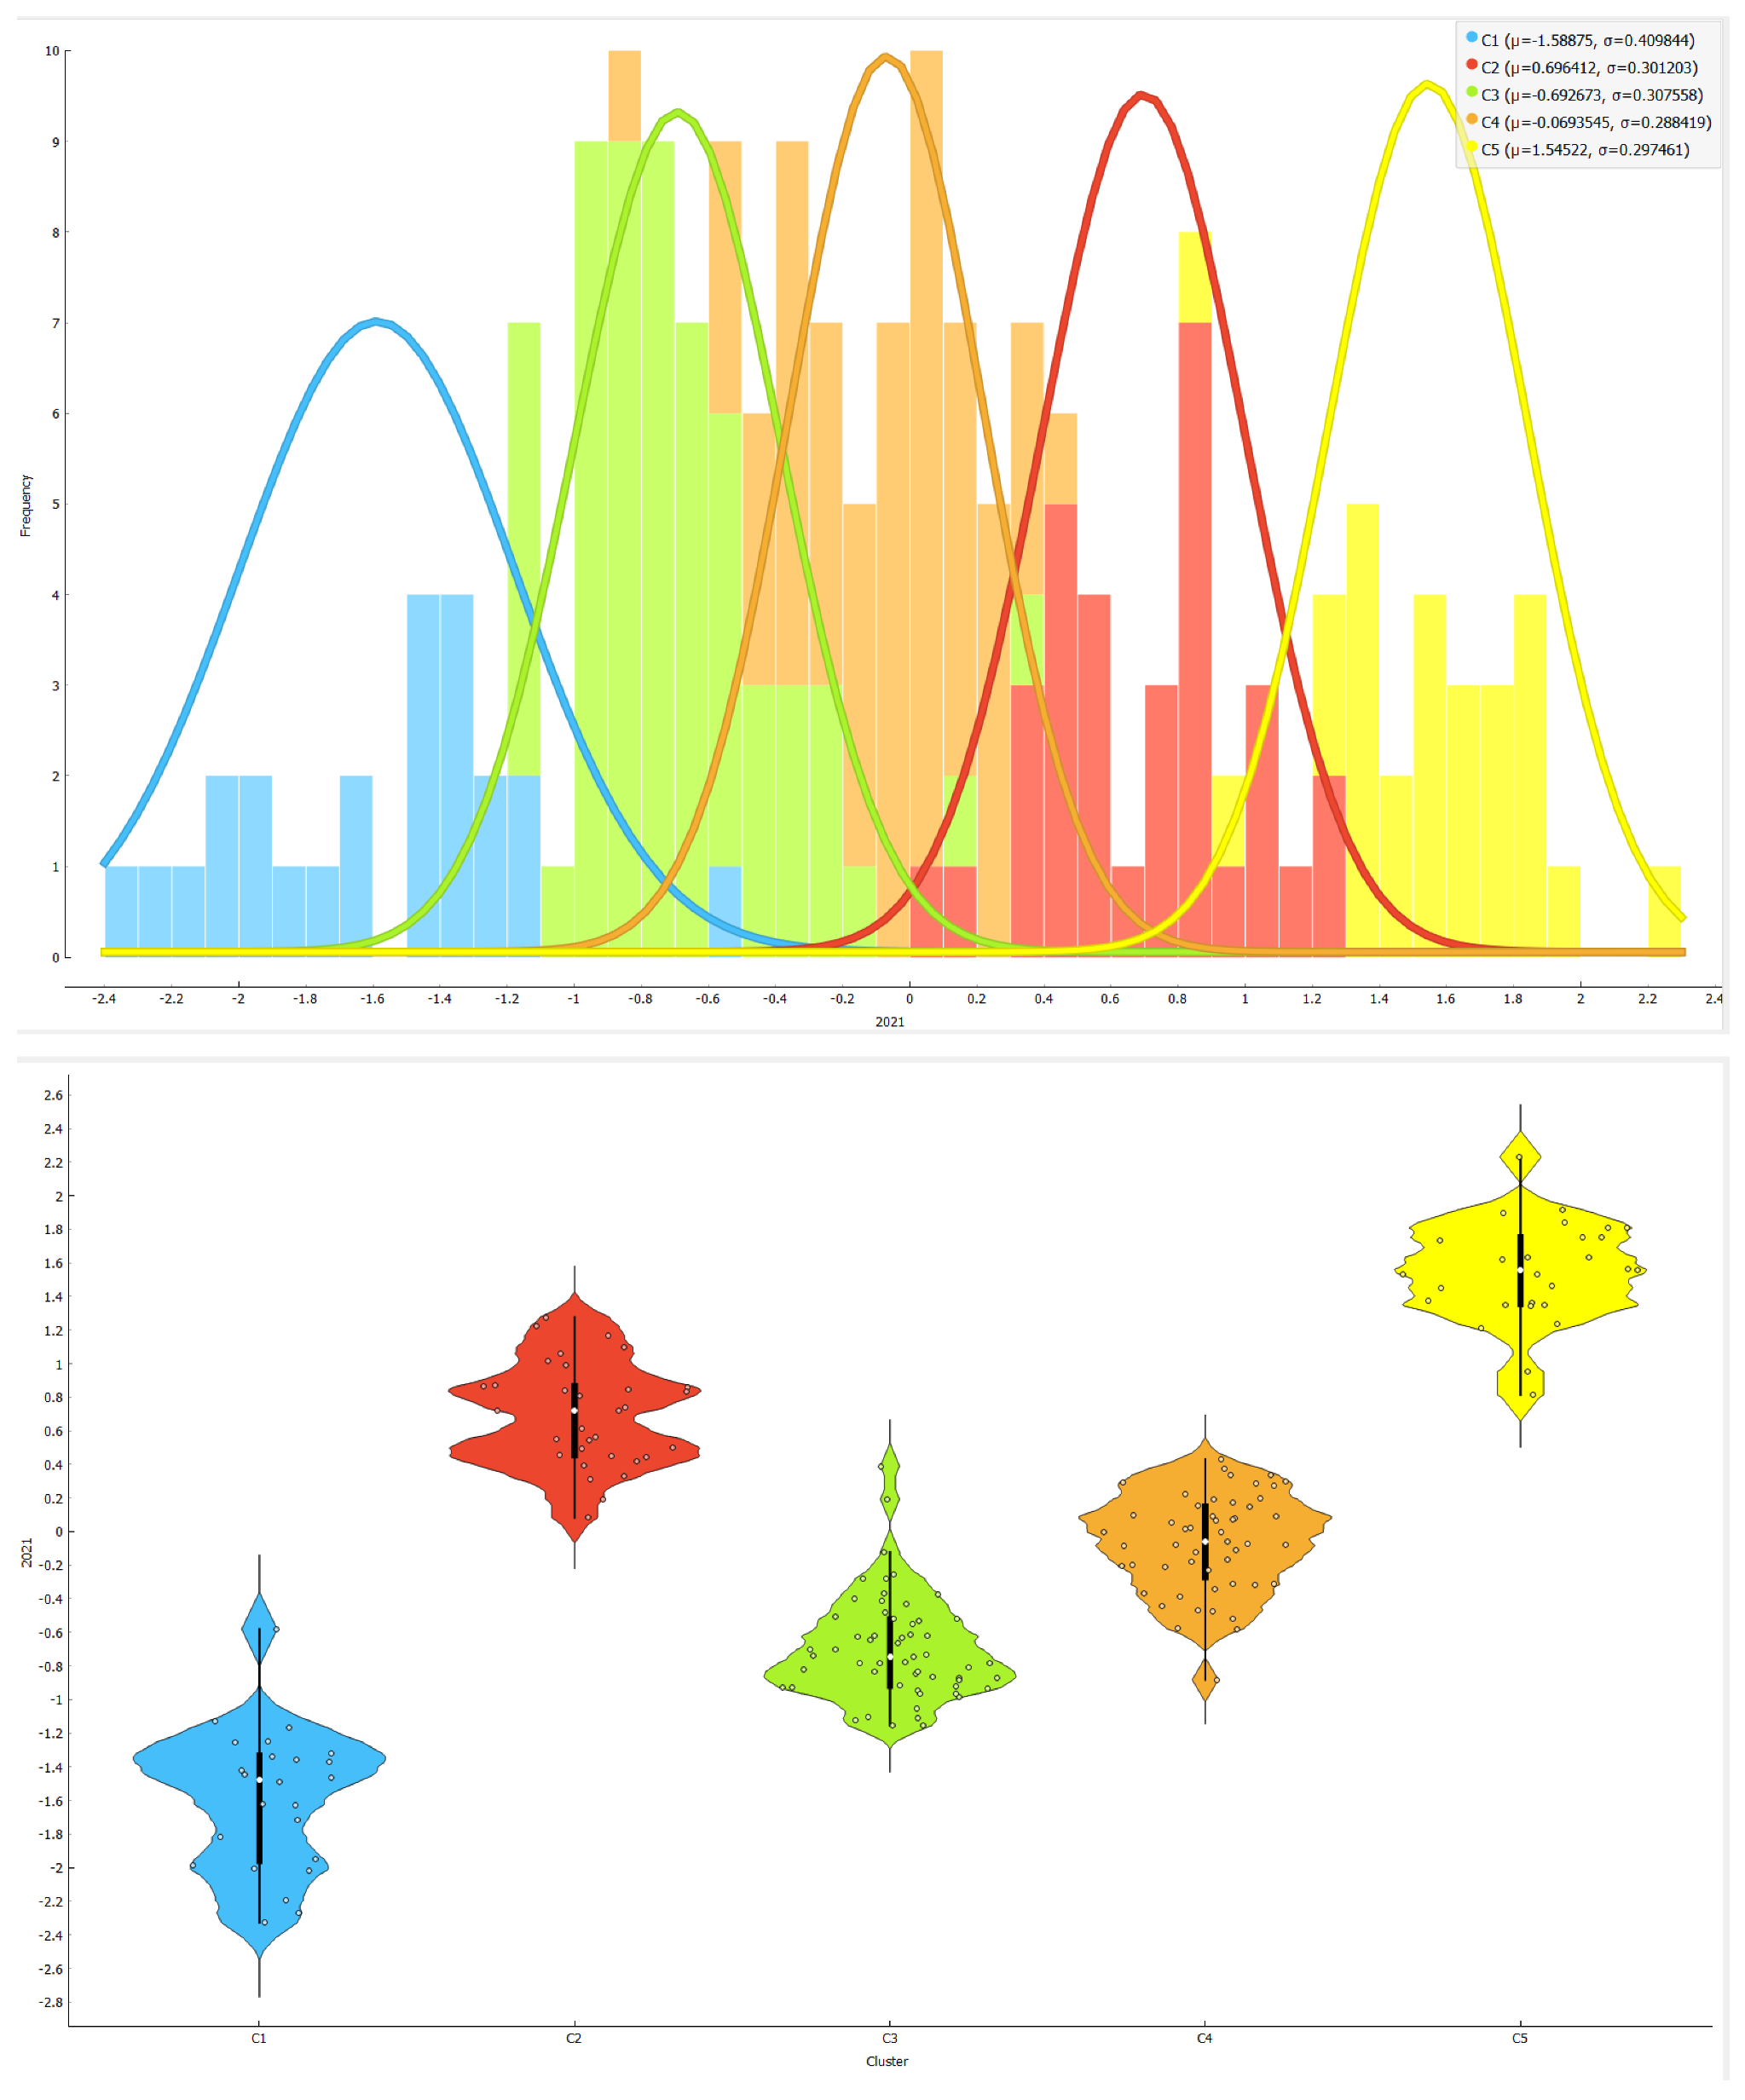
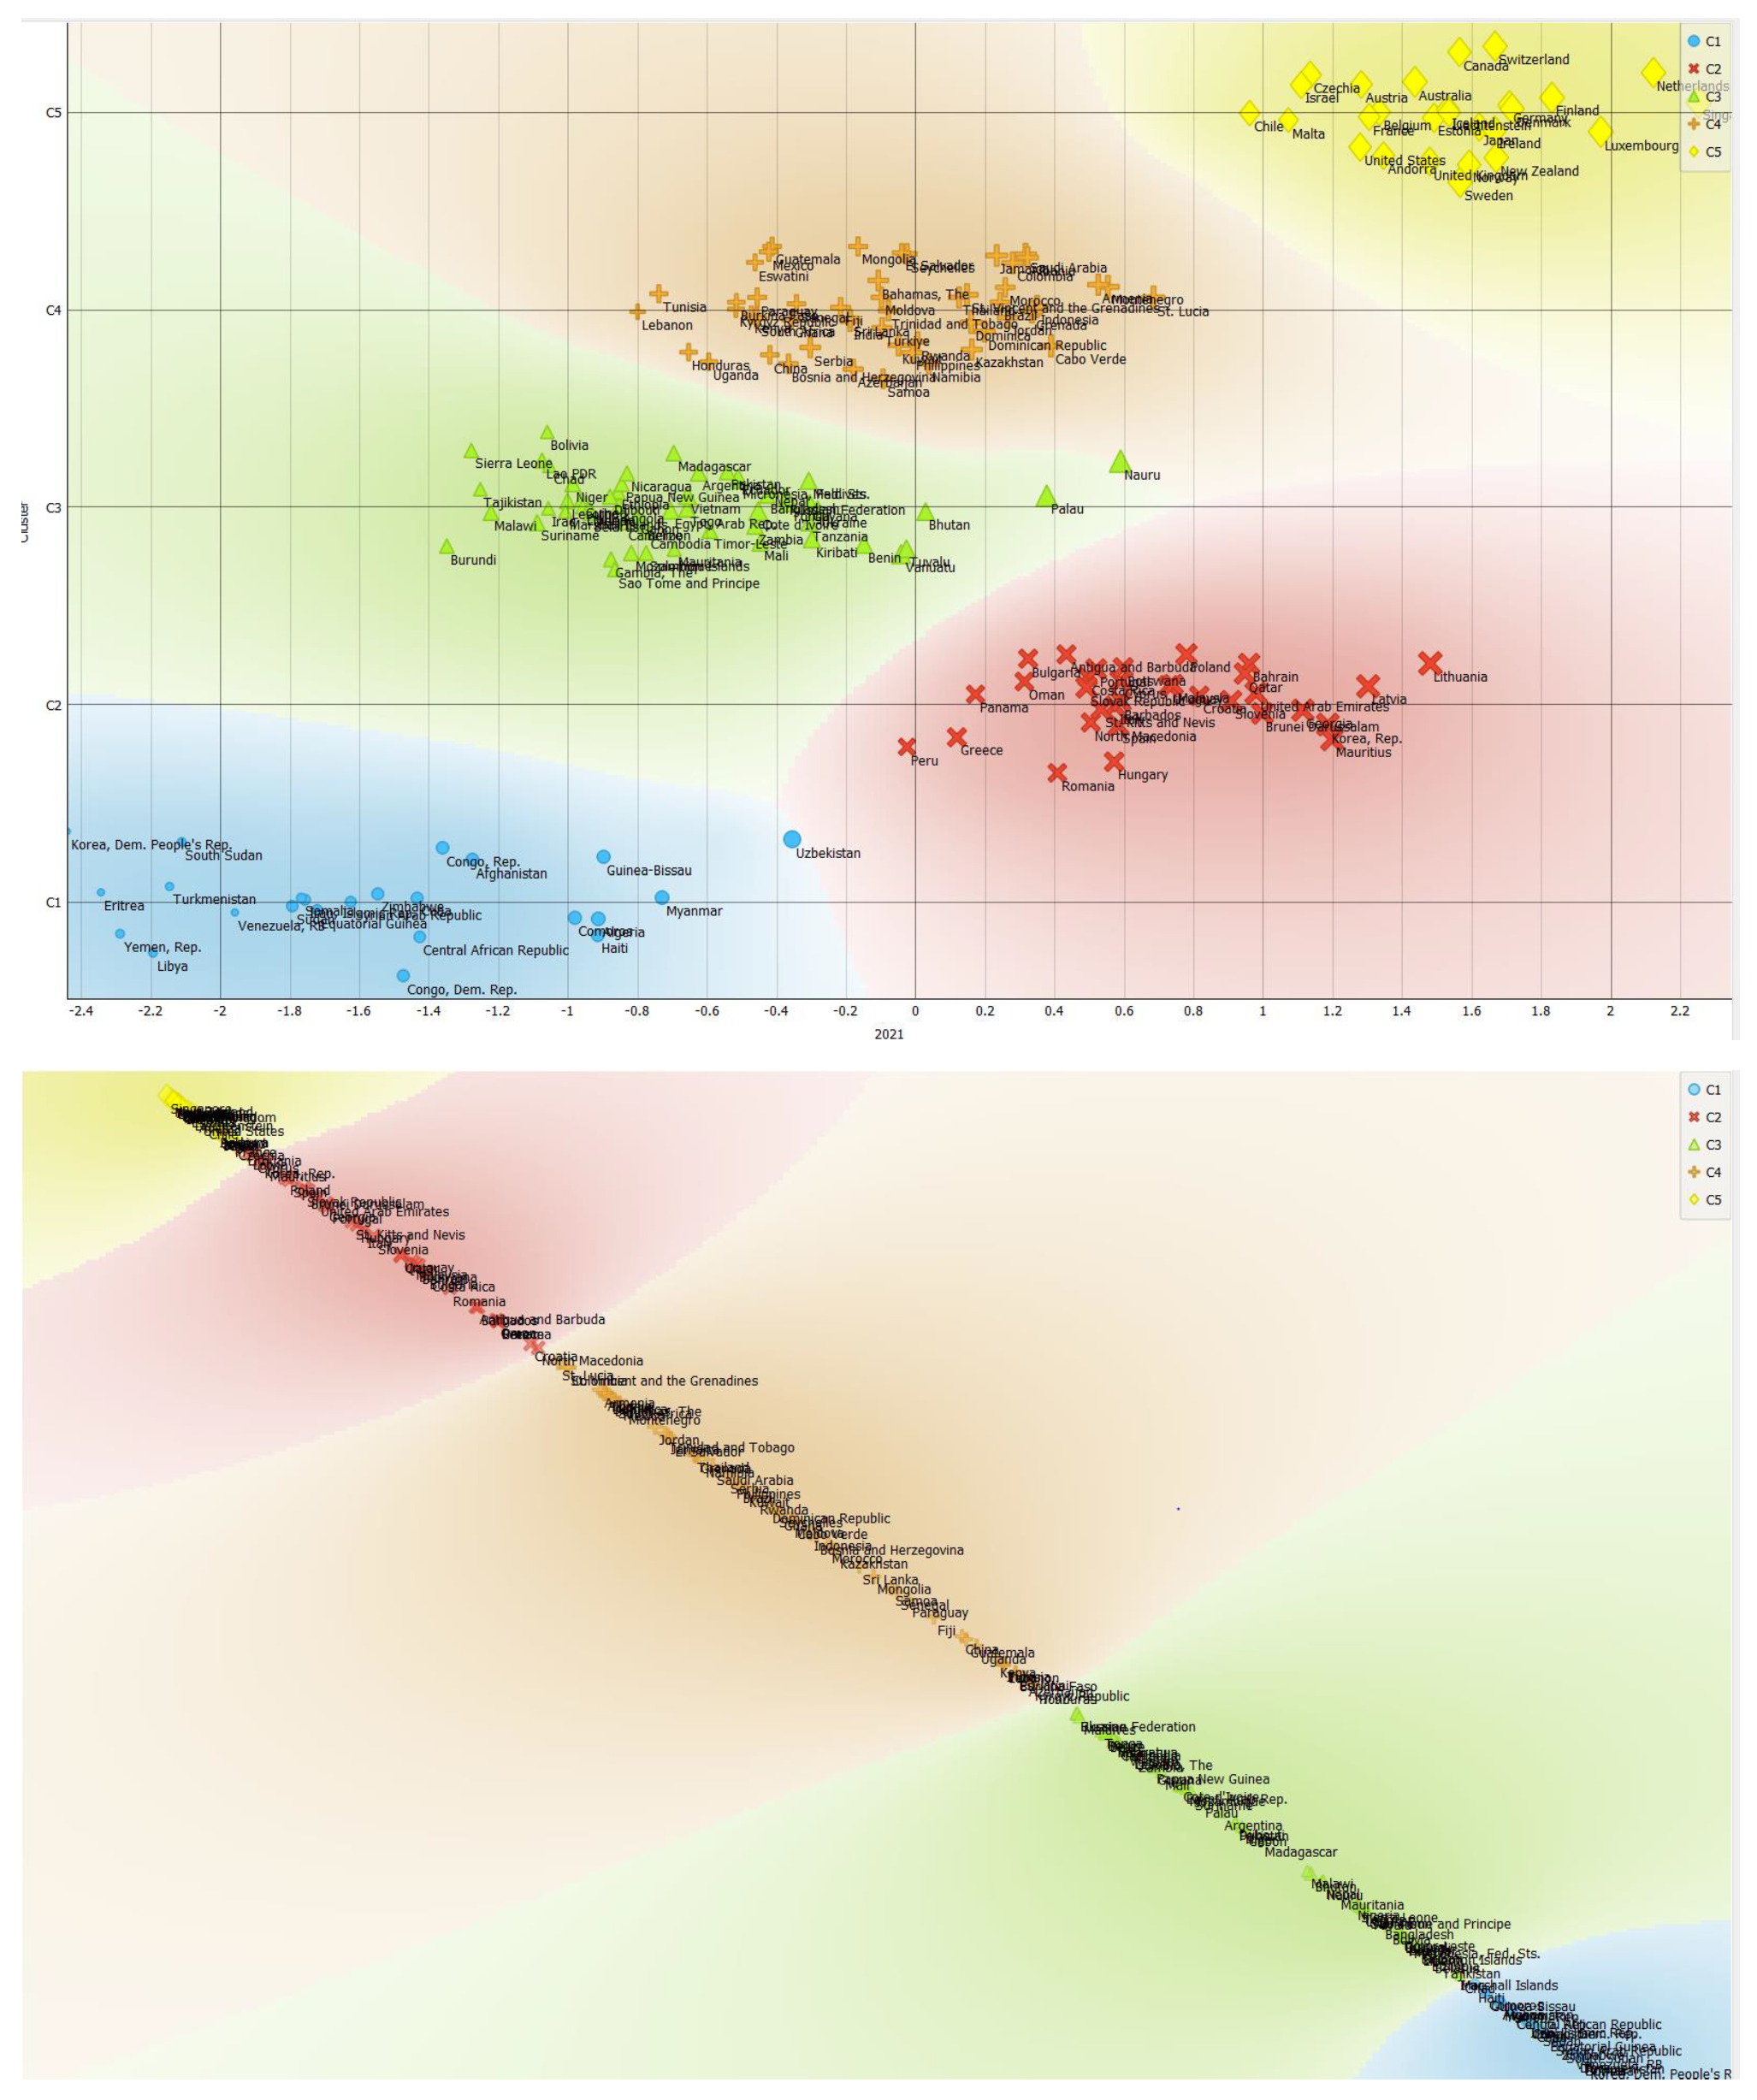
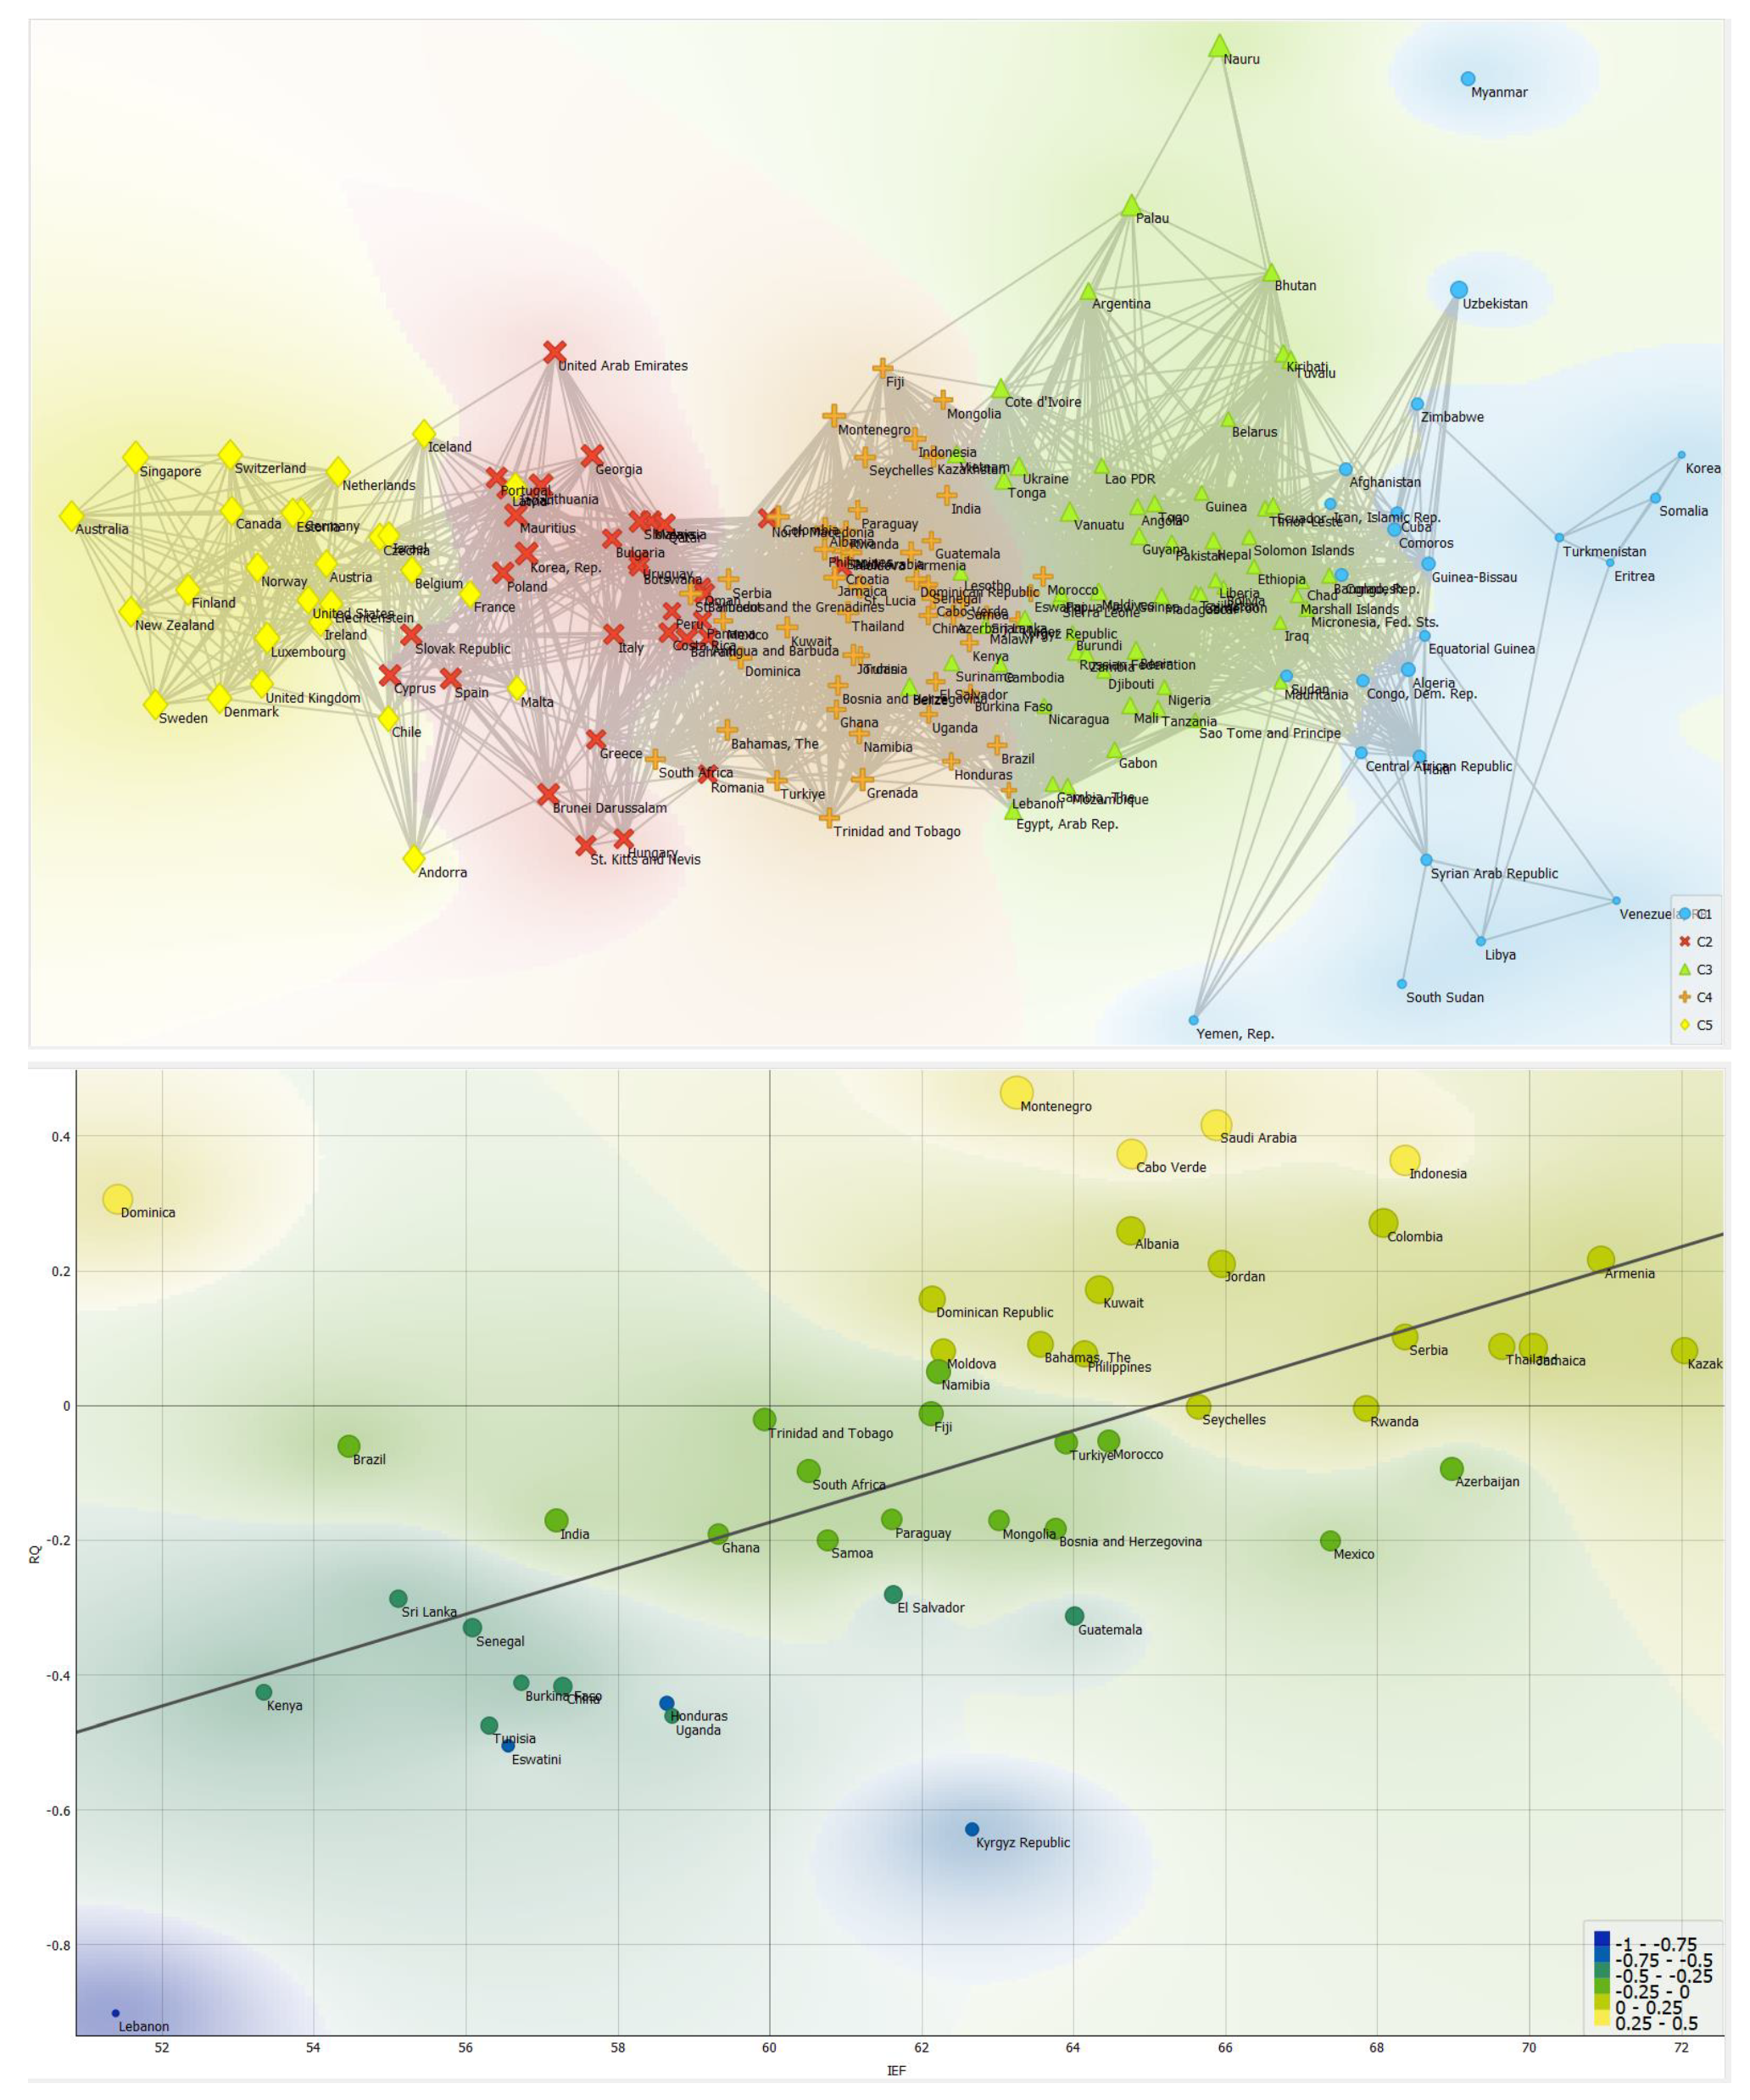
Relationship between RQ and IEF in C4.
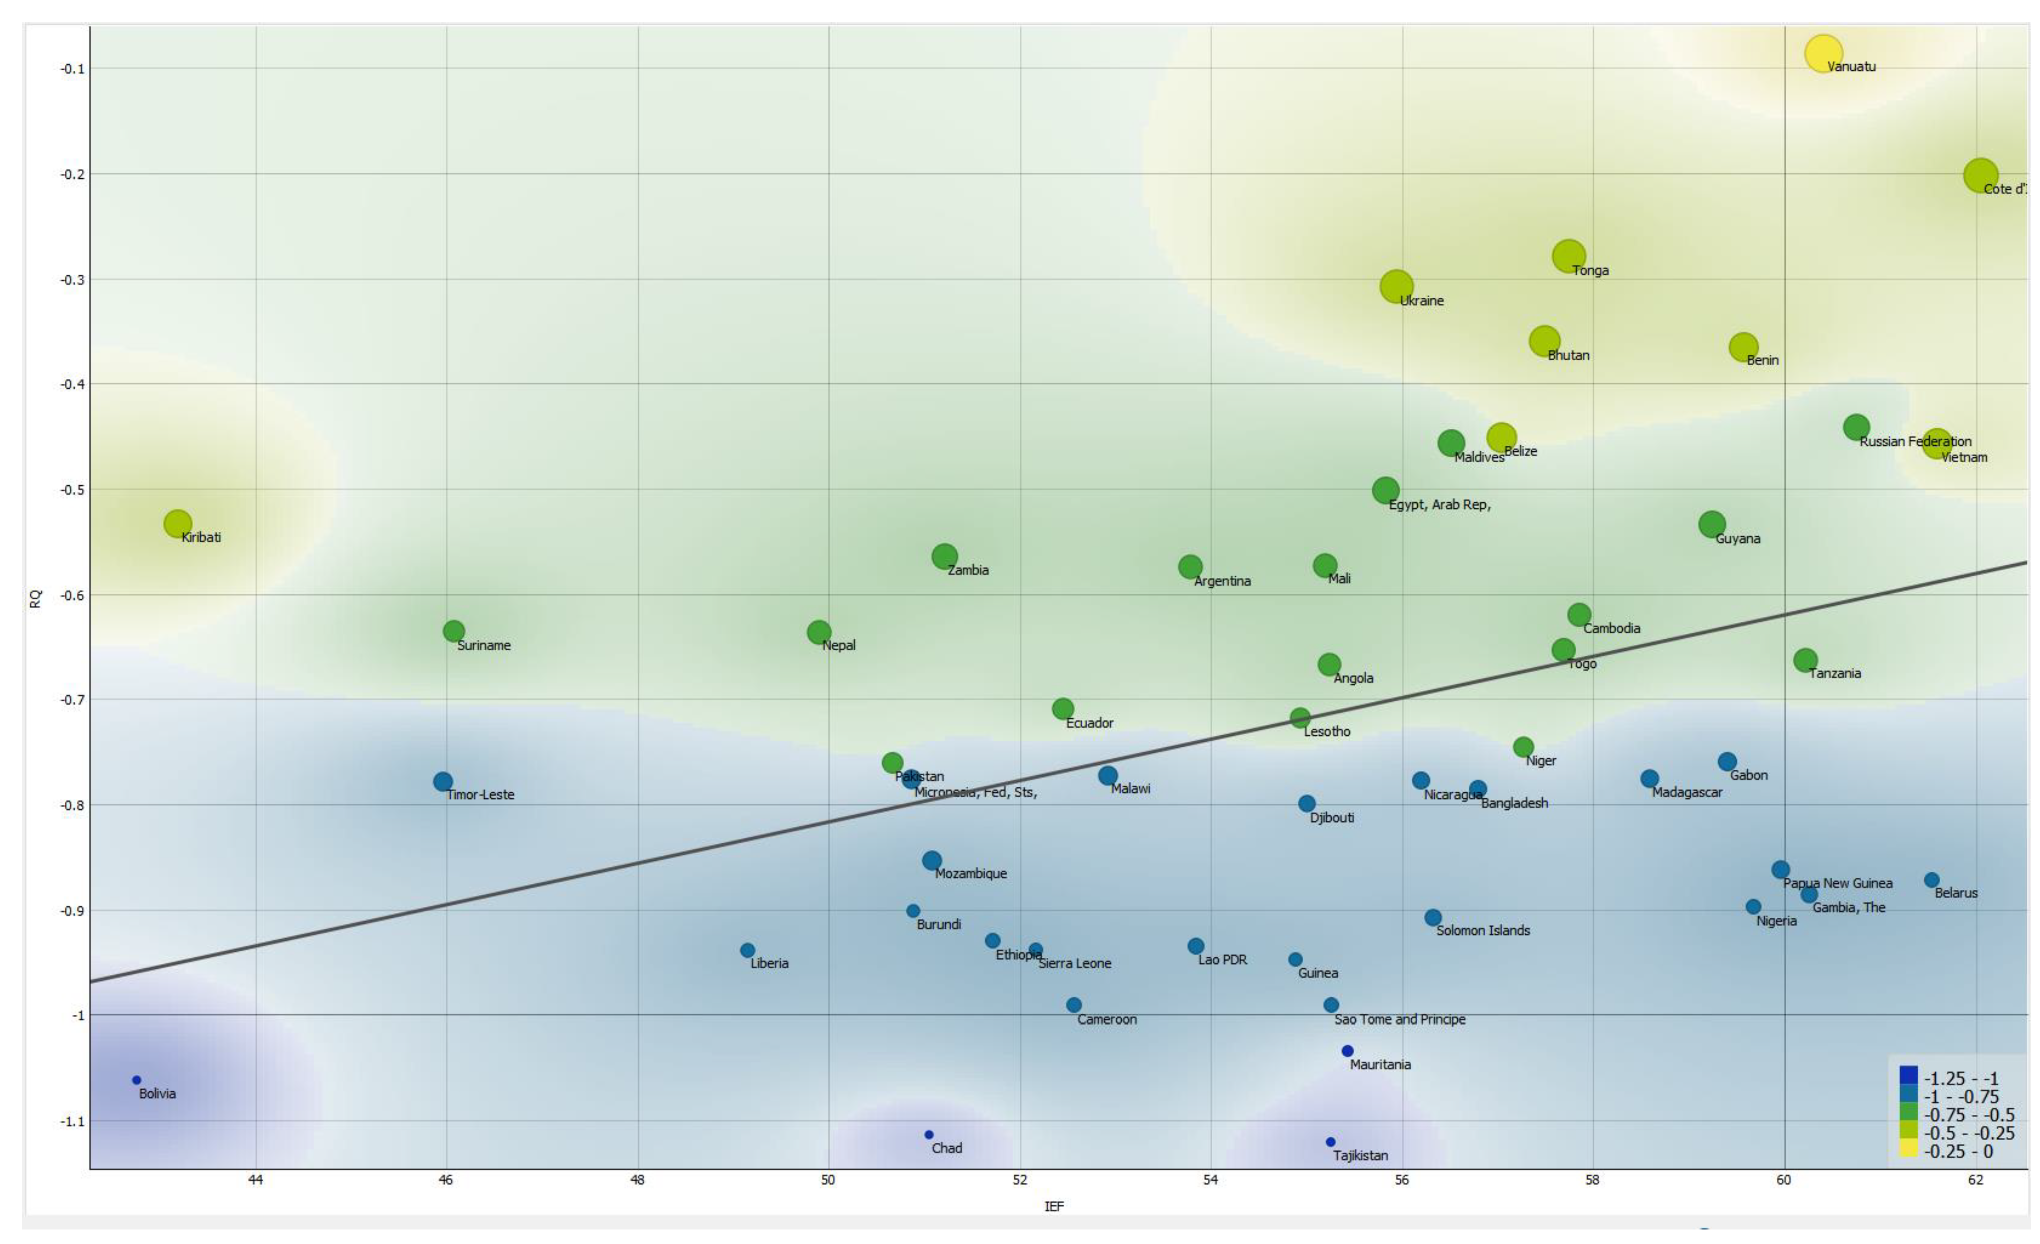
Relationship between RQ and IEF for C3.
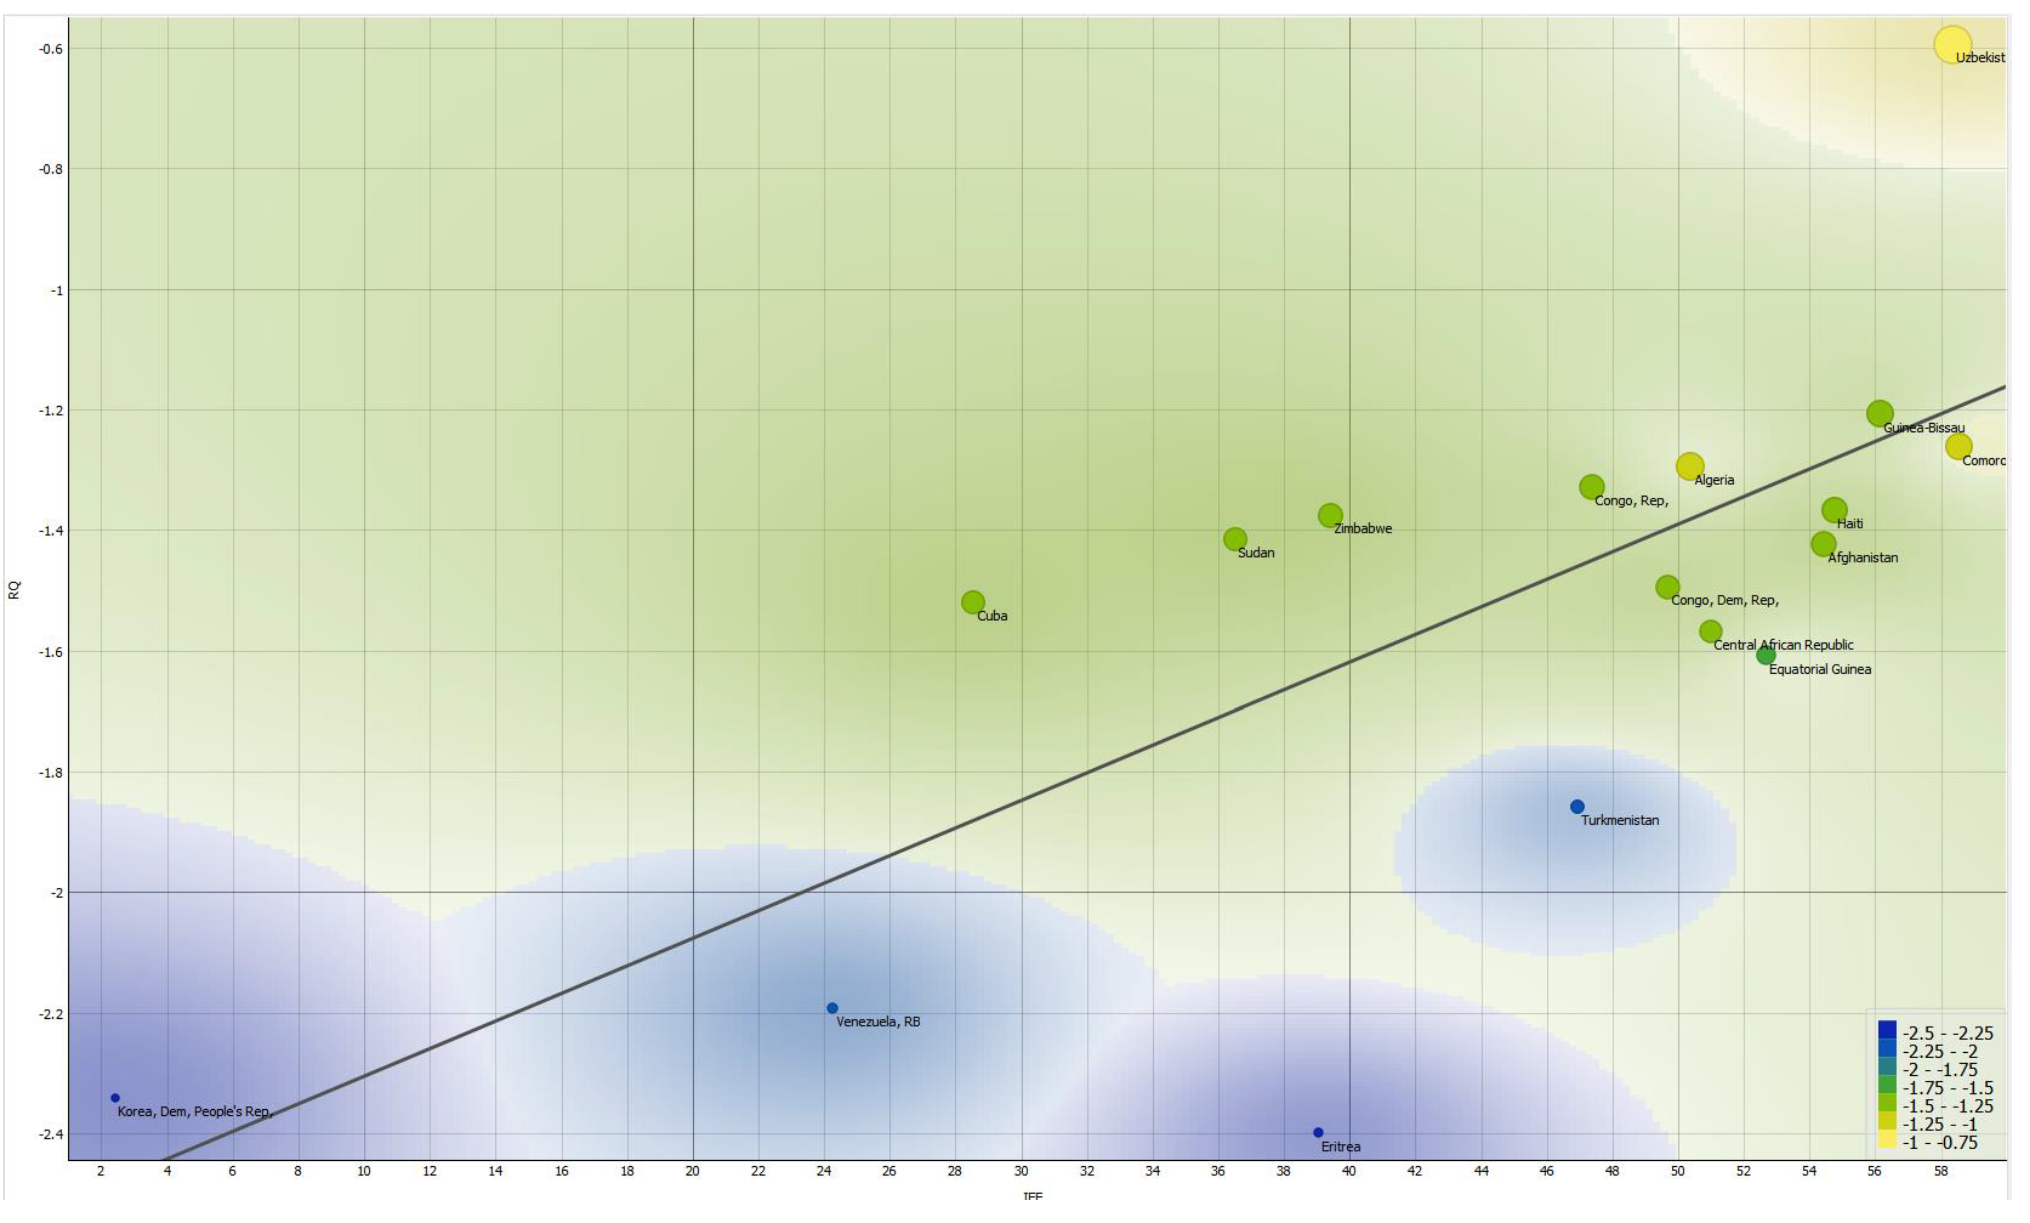
Relationship between RQ and IEF in C1.
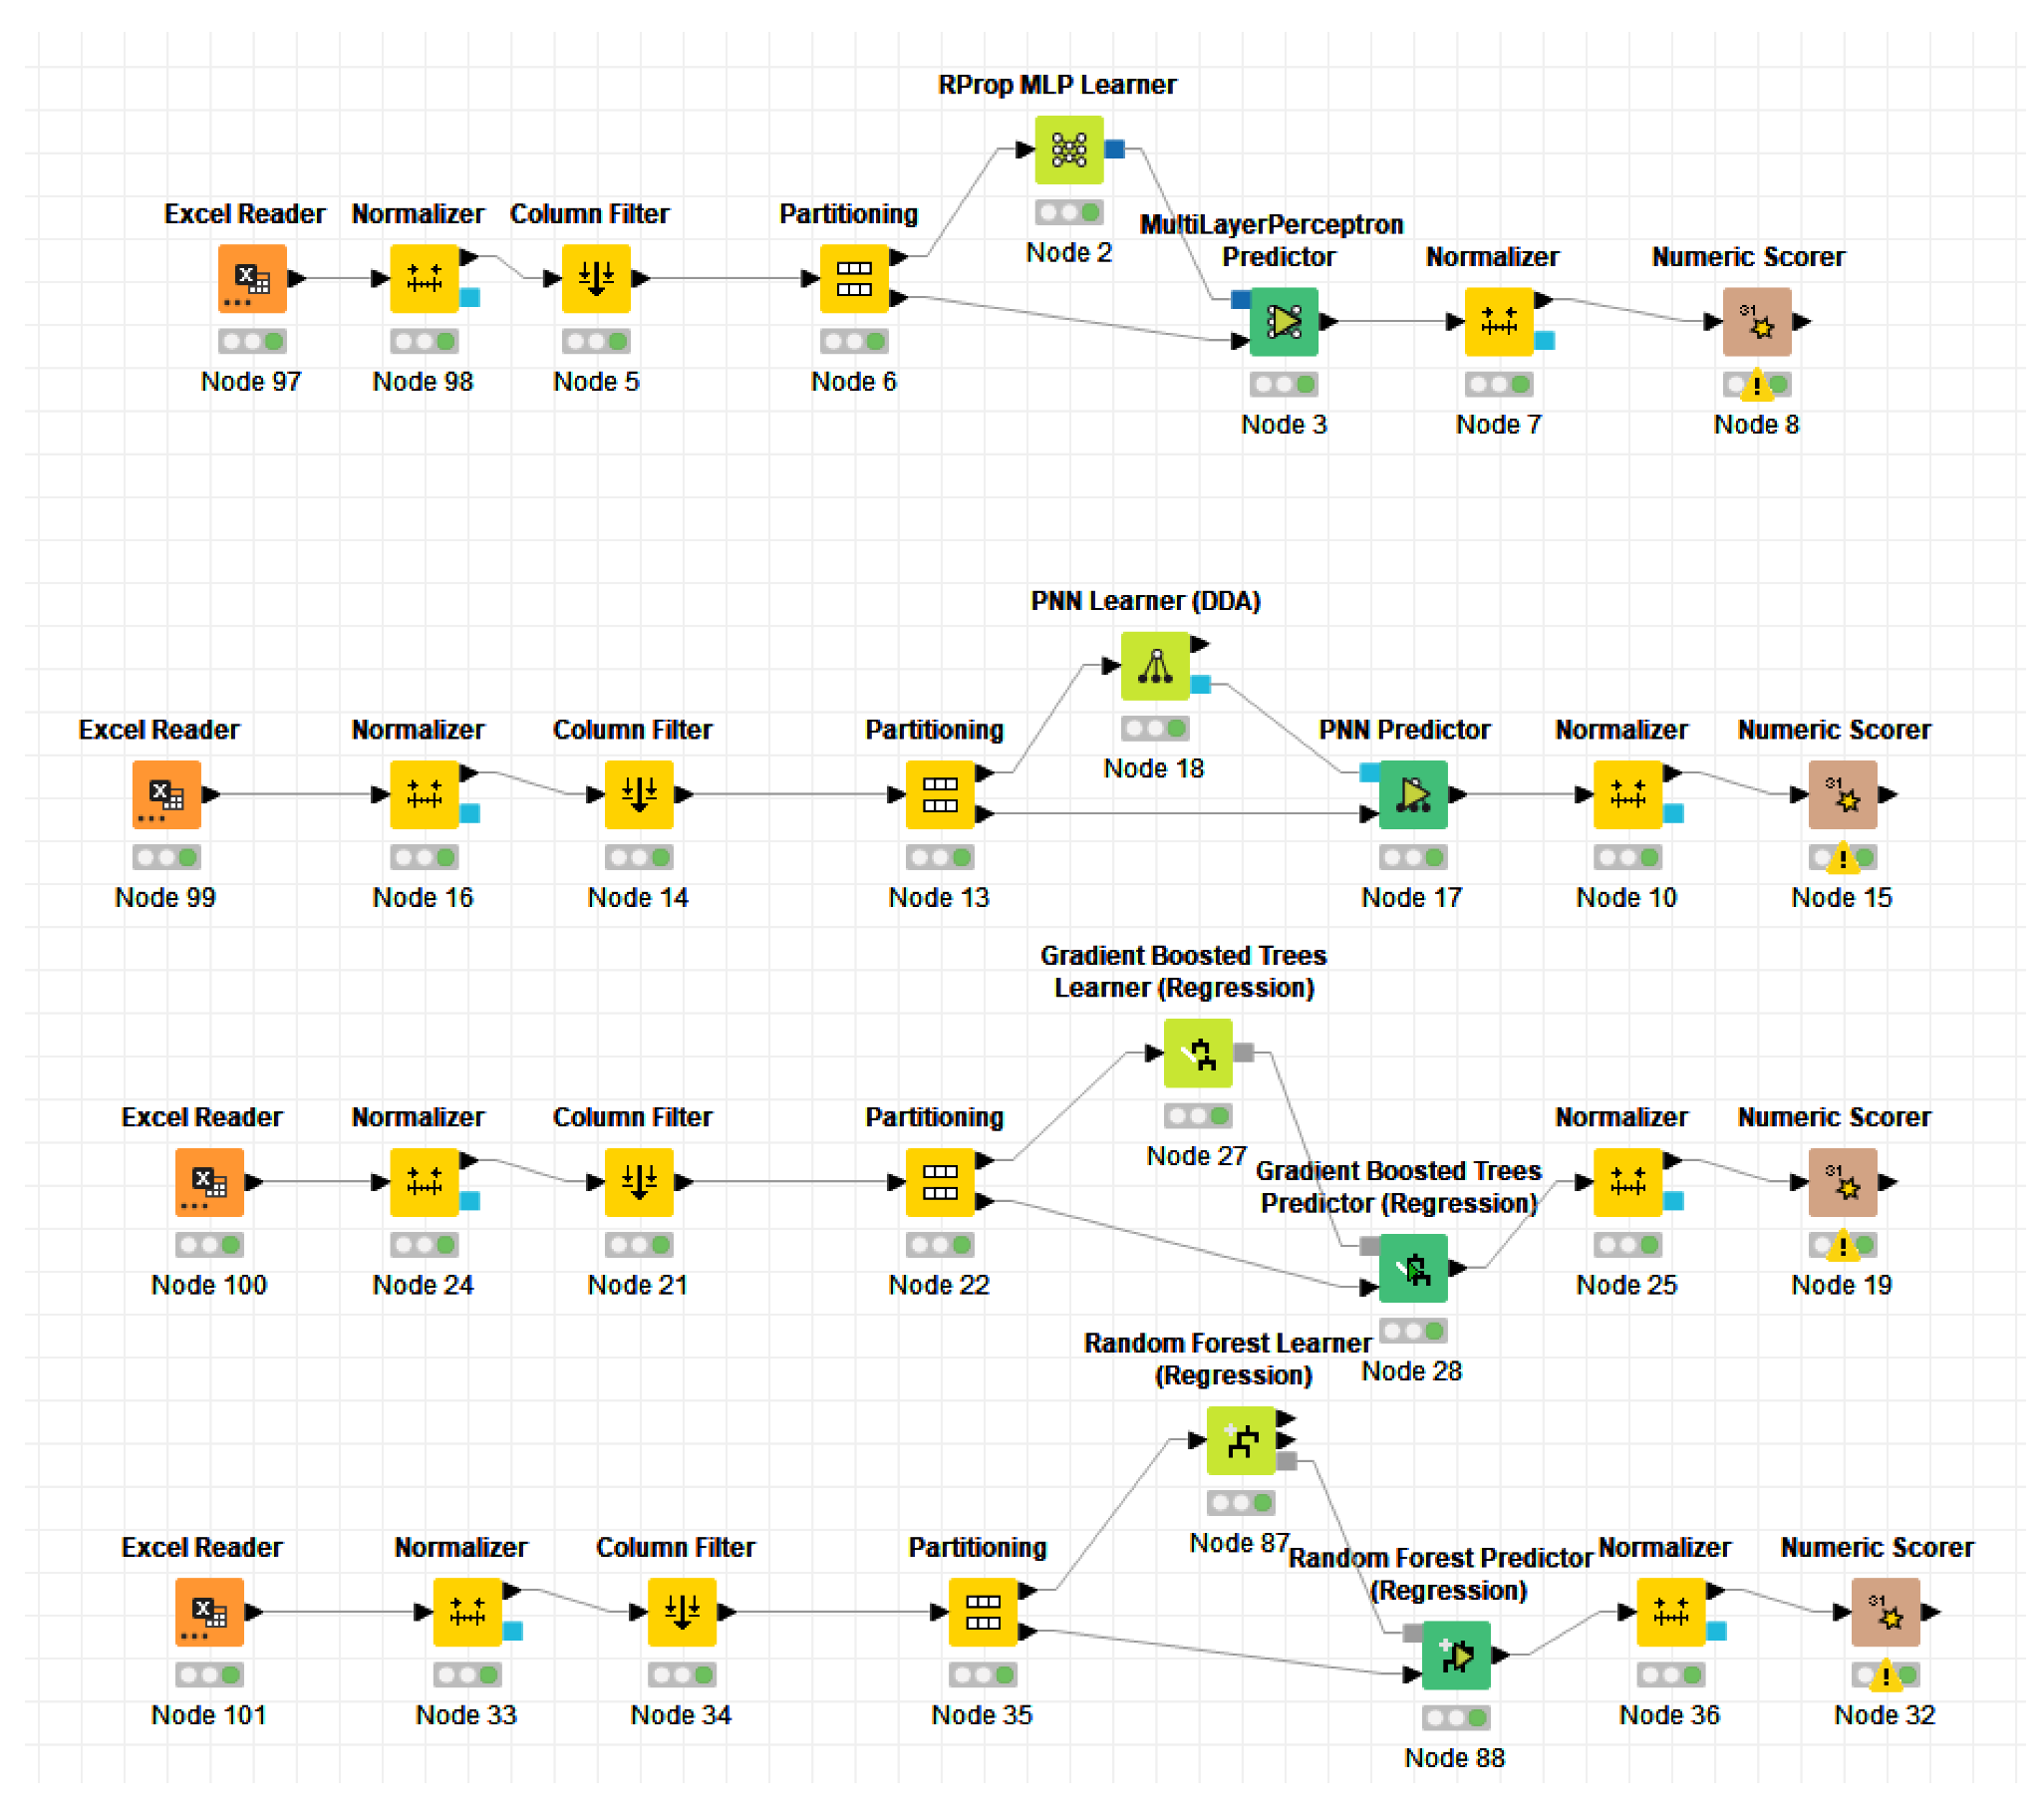
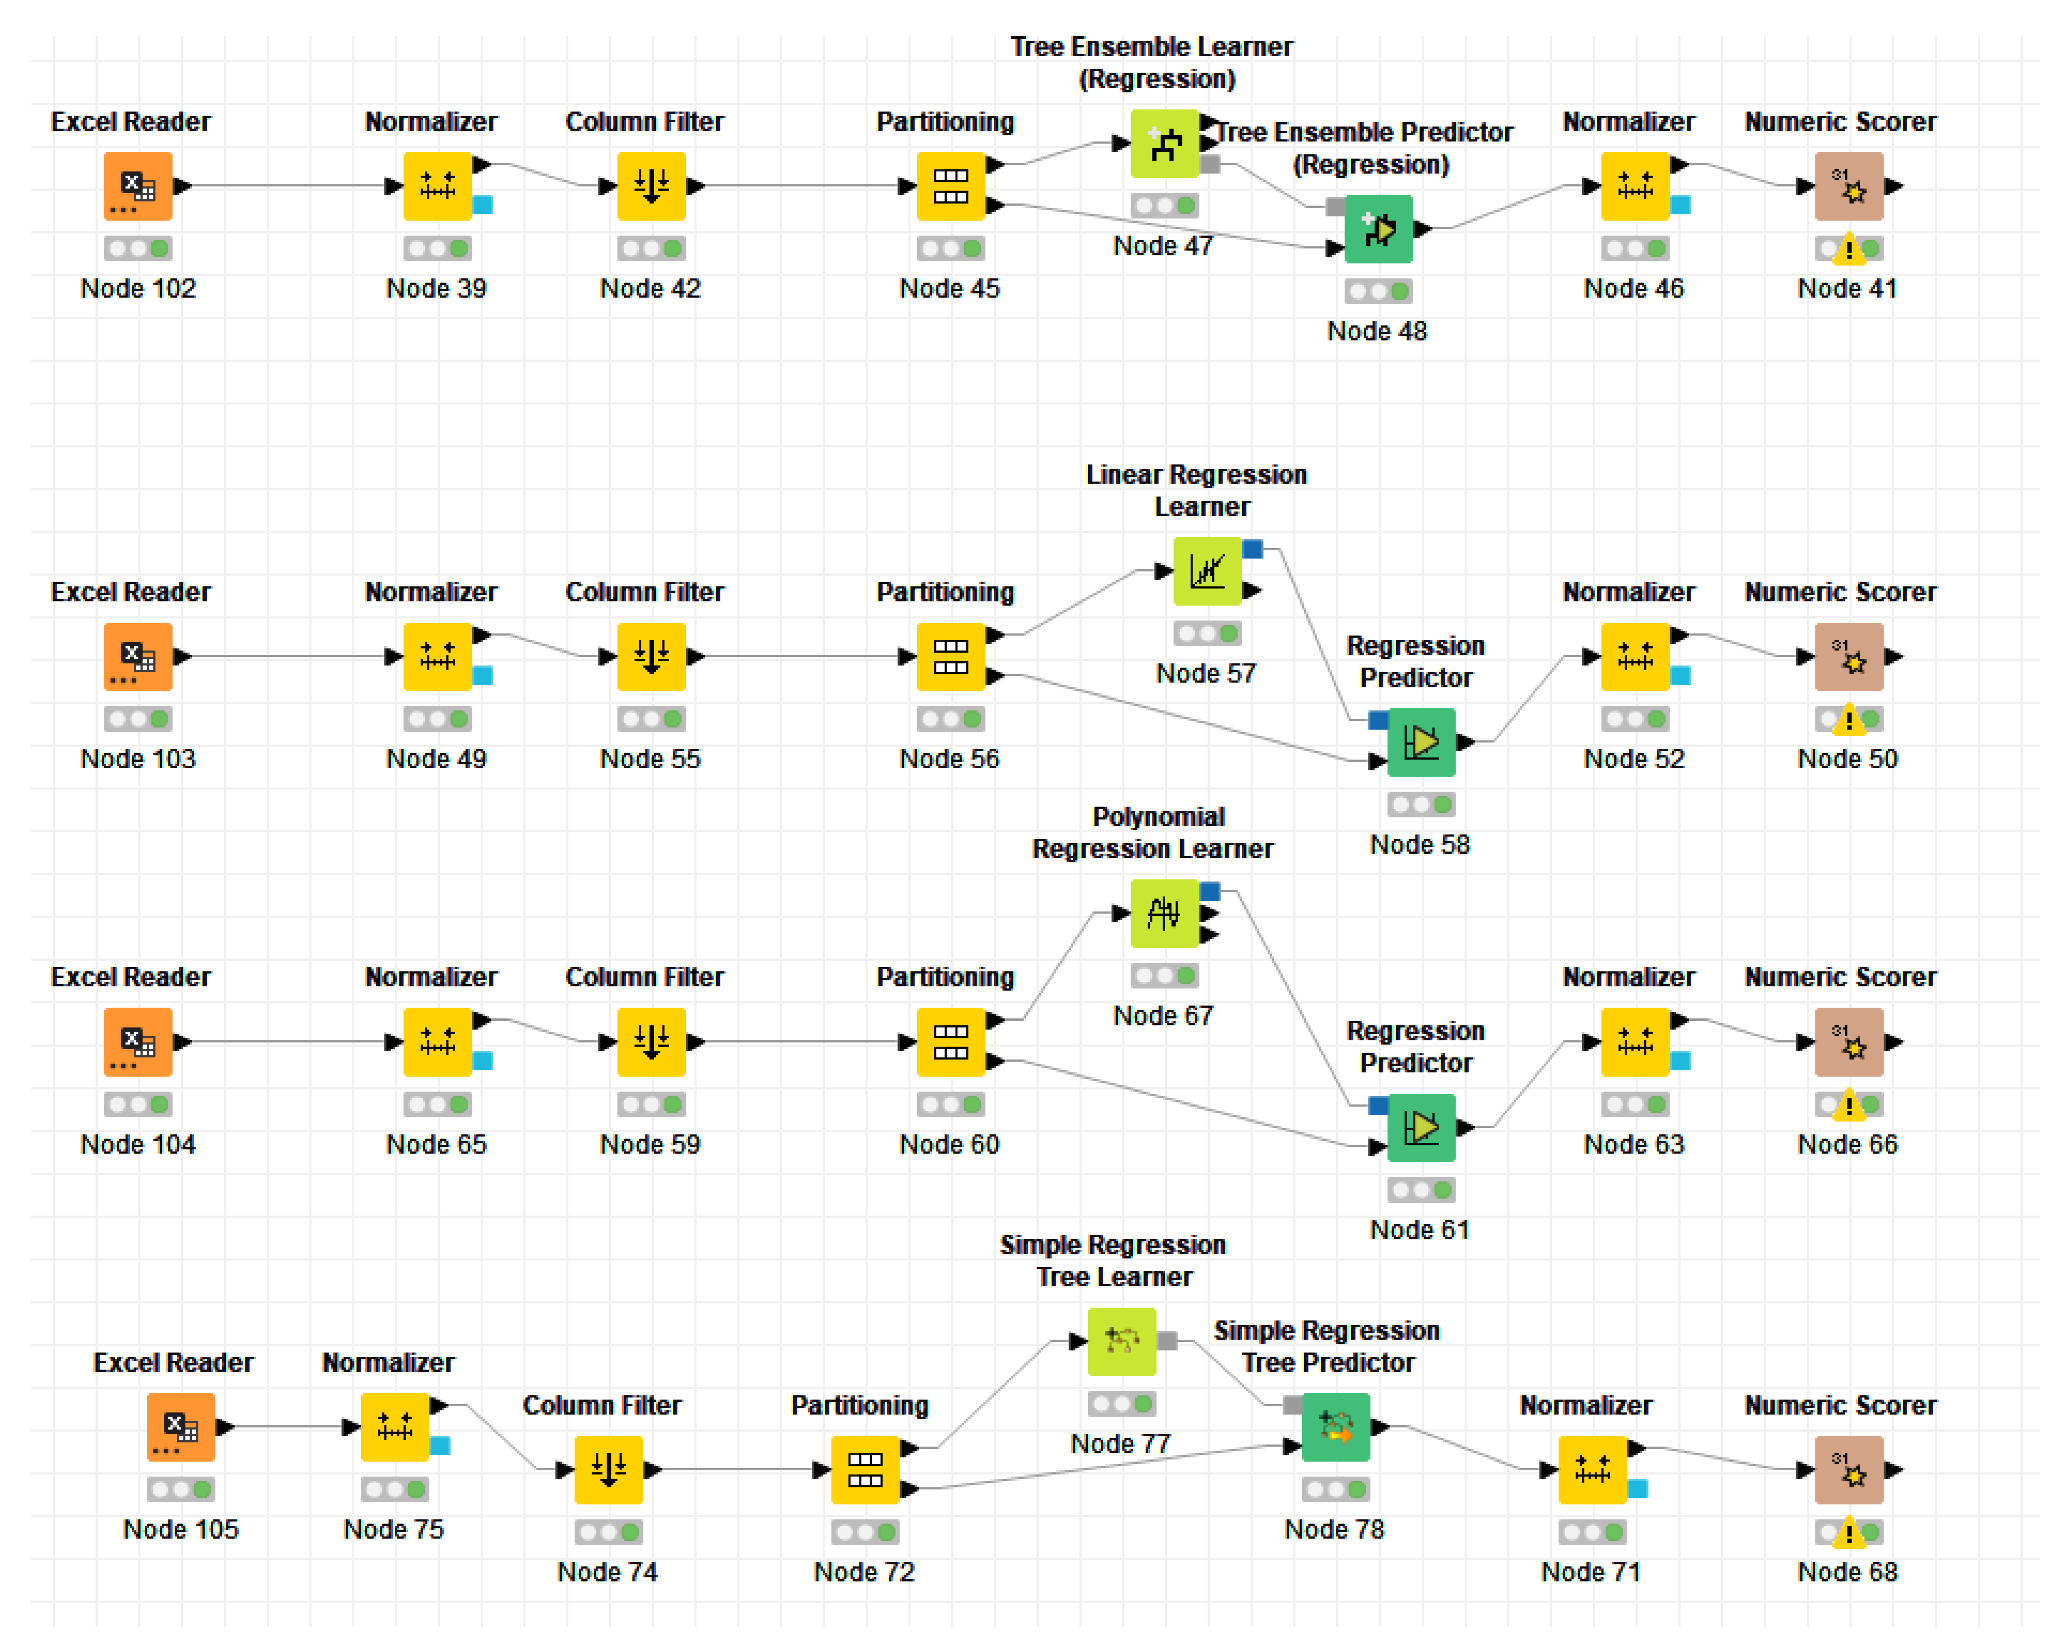
References
- M. A. Destek, F. Adedoyin, F. V. Bekun e S. Aydin, «Converting a resource curse into a resource blessing: The function of institutional quality with different dimensions,» Resources Policy, n. 103234, p. 80, 2023.
- B. Sanga e M. Aziakpono, «The effect of institutional factors on financial deepening: Evidence from 50 African countries,» Journal of Business and Socio-Economic Development, 2022.
- R. Abaidoo e E. K. Agyapong, «Financial development and institutional quality among emerging economies,» Journal of Economics and Development, 2022.
- J. O. Afolabi, «The Impact of Governance on Economic Development in West Africa: A system GMM dynamic panel approach,» Acta Universitatis Danubius. Œconomica, vol. 15, n. 3, pp. 217-231, 2019.
- C. E. Yameogo, J. A. Omojolaibi e R. O. Dauda, «Economic globalisation, institutions and environmental quality in Sub-Saharan Africa,» Research in Globalization, vol. 3, n. 100035, 2021.
- F. F. Adedoyin, M. I. Gumede, F. V. Bekun, M. U. Etokakpan e D. Balsalobre-Lorente, «Modelling coal rent, economic growth and CO2 emissions: does regulatory quality matter in BRICS economies?,» Science of the Total Environment, vol. 710, n. 136284, 2020.
- M. Abreu, I. Soares e S. Silva, «Governance quality and environmental policy on emergent, resource-rich economies: The case of Brazil,» Energy Reports, vol. 8, pp. 70-75, 2022.
- H. O. R. Ogwuru, D. O. Okolie e J. I. Okolie, «Economic openness, institutional quality and per capita income: Evidence from the Economic Community of West African States (ECOWAS),» Research Papers in Economics and Finance, vol. 6, n. 2, pp. 50-67, 2022.
- F. Li, M. Appiah e B. Korankye, «Financial development and economic sustainability in ECOWAS countries: The role of institutional quality,» ETIKONOMI, vol. 19, n. 1, pp. 41-50, 2020.
- R. L. Ibrahim e K. B. Ajide, «The role of income level and institutional quality in the non-renewable energy consumption and life expectancy nexus: evidence from selected oil-producing economies in Africa,» OPEC Energy Review, vol. 45, n. 3, pp. 341-364, 2021.
- F. Yahya e M. Rafiq, «Unraveling the contemporary drivers of renewable energy consumption: Evidence from regime types,» Environmental Progress & Sustainable Energy, vol. 5, n. 13178., p. 38, 2019.
- S. ÖZSOY, «The impact of foreign direct investment on export of high-technology products: The role of financial development and regulatory quality,» Balıkesir Üniversitesi Sosyal Bilimler Enstitüsü Dergisi, vol. 23, n. 44, pp. 959-975, 2020.
- A. Stojkov e, F. Besimi, «Rule of Law and Regulatory Quality in Central, Eastern and South Eastern Europe During the Transition».
- A.R. Mushtaq, A. A. Thoker e A. A. Bhat, «Does institutional quality affect tourism demand? Evidence from India,» Journal of Hospitality and Tourism Insights, vol. 4, n. 5, pp. 622-638, 2021.
- R. RANJPOUR, A. KAZEROONI, M. B. BEHESHTI e A. GHORBANI, «STUDYING THE WEIGHT IMPORTANCE OF THE GOVERNMENT EFFECTIVENESS AND REGULATORY QUALITY AS COMPONENTS OF GOVERNANCE IN INFLUENCING THE ECONOMIC PERFORMANCE OF DEVELOPING COUNTRIES (COMPARATIVE COMPARISON OF OIL AND NON-OIL DEVELOPING COUNTRIES),» Journal of Critical Reviews, vol. 7, n. 1, 2020.
- I. Boadi e, H. Amegbe, «The link between quality of governance and stock market performance: International level evidence,» European Journal of Government and Economics, vol. 6, n. 1, pp. 78-101, 2017.
- F. Curti e A. Mihov, «Fraud recovery and the quality of country governance,» Journal of Banking & Finance, vol. 87, pp. 446-461, 2018.
- D. A. Correa-Mejía, «Impact of corporate governance and institutional context on multilatinas’ reporting quality,» Corporate Governance: The International Journal of Business in Society, 2022.
- R. O. Raji, «Testing the Relationship between Financial Inclusion, Institutional Quality and Inclusive Growth for Nigeria,» Daengku: Journal of Humanities and Social Sciences Innovation, vol. 1, n. 1, pp. 18-28, 2021.
- C. O. Iheonu, S. A. Agbutun, C. M. Omenihu, G. I. Ihedimma e V. N. Osuagwu, «The impact of governance quality on mortality rates in sub Saharan Africa,» African Population Studies, vol. 33, n. 1, 2019.
- L. Glawe e H. Wagner, «The role of institutional quality for economic growth in Europe,» SSRN, n. 3375215, 2019.
- C. C. Lee, G. Olasehinde-Williams e I. Olanipekun, «Financial systems, regulatory quality, and economic growth,» The Journal of International Trade & Economic Development, vol. 30, n. 2, pp. 246-274, 2021.
- H. W. Kamran, S. B. bin Mohamed Arshad e A. Omran, « Country governance, market concentration and financial market dynamics for banks stability in Pakistan,» Research in World Economy, vol. 10, n. 2, pp. 136-146, 2019.
- S. Handoyo e F. K. Fitriyah, «Control of corruption, regulatory quality, political stability and environmental sustainability: a cross-national analysis,» Journal of Accounting Auditing and Business, vol. 1, n. 2, pp. 28-38, 2018.
- S. Shan, Z. Lin, Y. Li e Y. Zeng, «Attracting Chinese FDI in Africa: The role of natural resources, market size and institutional quality,» Critical perspectives on international business, 2018.
- A. Kaller, S. Bielen e W. Marneffe, « The impact of regulatory quality and corruption on residential electricity prices in the context of electricity market reforms,» Energy Policy, vol. 123, pp. 514-524, 2018.
- W. Mehmood, R. Mohd-Rashid, A. H. Ahmad e A. H. Tajuddin, «IPO initial return in Pakistan: Influence of country-level institutional quality,» South Asian Journal of Business Studies, 2021.
Disclaimer/Publisher’s Note: The statements, opinions and data contained in all publications are solely those of the individual author(s) and contributor(s) and not of MDPI and/or the editor(s). MDPI and/or the editor(s) disclaim responsibility for any injury to people or property resulting from any ideas, methods, instructions or products referred to in the content. |
© 2023 by the authors. Licensee MDPI, Basel, Switzerland. This article is an open access article distributed under the terms and conditions of the Creative Commons Attribution (CC BY) license (http://creativecommons.org/licenses/by/4.0/).
Copyright: This open access article is published under a Creative Commons CC BY 4.0 license, which permit the free download, distribution, and reuse, provided that the author and preprint are cited in any reuse.


