
Submitted:
22 February 2023
Posted:
01 March 2023
You are already at the latest version
Preprints on COVID-19 and SARS-CoV-2
Abstract
The overall objective of this mixed-method digital-based observational study was to determine the mental health impact among CTU staff working during the COVID-19 pandemic. The Qualtrics Core XM platform was used to deploy the questionnaire where a quantitative analysis was conducted. The qualitative part of the study used the Microsoft Teams digital application to complete the interviews. Various validated mental health assessments were administered: Vancouver Index of Acculturation (VIA), Hospital Anxiety and Depression Scale (HADS), Insomnia Severity Index (ISI), Pandemic Stress Index (PSI), Burnout Assessment Tool-12 (BAT-12), General Self Efficacy Scale (GSE) and The Everyday Discrimination Scale (EDS). A total of 485 participants took part, of which 73.4% were female and 70.1% of the sample were white British. A high prevalence of anxiety, exhaustion and depression were identified across all participants. A significant mental health impact was identified among the CTU workforce where wellbeing was compromised during the course of the COVID-19 pandemic.
Keywords:
COVID-19
; Clinical trials
; Mental health
; Vaccination
; CTU workforce
1. Introduction
The World Health Organization (WHO) declared the outbreak of the COVID-19 pandemic on 11th of March 2020 which impacted the clinical research workforce significantly [1]. Lockdown, face masks, social distancing and various other measures were used to manage the spread of the virus [2]. While much of the spotlight was on incidence and prevalence of COVID-19, the impact on conducting scientific research was significant. Existing clinical trials were paused especially within the UK and COVID-19 research was prioritised [3,4]. In the UK, the clinical trial profession as a whole has a number of staffing groups with a variety of job titles. Industry, academia, and the NHS struggle to recruit and retain clinical trial staff. As of Nov 2022, Indeed indicated almost 3,500 unfilled clinical trial positions nationally [5]. Whilst this could be due to a variety of reasons including short term contracts, workload acumen, issues with salaries for the expected job specification, and lack of flexibility for hybrid working, a higher vacancy rate impacts on the existing clinical trial workforce as they would be required to cover a larger volume of work.
According to the National Institute for Health Research (NIHR), new clinical trials, even for complex and urgent areas such as cancer, were suspended in the UK, and staff were redeployed [6,7]. Clinical trials units (CTUs) are specialist units that play a key role in study design, conduct, analysis, and subsequent publication. CTUs house expert clinical research staff, including clinical trialists, statisticians, epidemiologists, methodologists, quality assurance and trial management staff that have experience to setup, manage and deliver clinical trials. Some CTUs deliver a diverse array of studies, whilst others specialise in either a specific clinical area or a type of intervention such as investigational medicinal products, medical devices and complex interventions. CTUs are legally responsible for maintaining adherence to all compliance procedures regardless of their embodiment within an academic or NHS organisation. The CTUs played an essential role during the pandemic in the UK. The Management of Health and Safety at Work Regulations (1999 as amended) requires employers to ensure the work environment is, as far as reasonably practicable, safe and without risks to health. The COVID-19 pandemic introduced an unforeseen risk that had not been considered previously.
Some countries have reported challenges to manage their research during the pandemic, facing challenges that include physical violence perpetrated towards members of the medical staff, unreliable therapies, and prejudice amongst ethnic minorities health workers in frontlines against the virus [4,8,9]. However, the impact on the CTU workforce has not been explored. Hence, this study explores the COVID-19 impact with an aim to report the challenges and develop strategies to better develop pandemic frameworks in the future.
2. Materials and Methods
The CTU workforce in the UK is approximated around 25,000 although some staff have shared roles with multiple departments spanning across academic and NHS organisations. We designed a mixed methods observational-digital study to explore the experiences of CTU staff within the UK. The survey was deployed digitally via the NIHR, UKTMN, social media and the UK CRC.
2.1. Aims
The primary aim of the study was to determine the mental health impact due to the challenges faced by the clinical trial workforce whilst delivering clinical research during the COVID-19 pandemic. The secondary aim of the study was to determine the impact on staff wellbeing that would aid to propose a suitable pandemic preparedness framework for clinical trial units and staff conducting studies during a pandemic.
2.2. Eligibility Criteria
All participants that were 18 years and above, employed within a CTU in the UK were eligible to participate in the study. Participants also required to have access to a smartphone, tablet, or computer to complete the survey online, and willing to provide informed e-consent.
2.3. Data Collection and Extraction
Quantitative data was collected through an online questionnaire using the Qualtrics Core XM platform. The sample size comprised of 485 participants.
A random subgroup of the sample was invited to take part in semi-structured interviews. All interviews were conducted via a secure online facility (password protected teams teleconference), audio-recorded and transcribed in full. Data collection and analysis were integrated with a process based on framework methodology used to analyse the data including development of a coding frame based on identified key themes and detailed coding of transcripts.
2.4. Outcome Measures
Quantitative measures were used to evaluate mental health impact byway of validated questionnaires. For the purpose of this study, we used Vancouver Index of Acculturation (VIA), Hospital Anxiety and Depression Scale (HADS), Insomnia Severity Index (ISI), Pandemic Stress Index (PSI), Burnout Assessment Too-12 (BAT-12), General Self Efficacy Scale (GSE) and The Everyday Discrimination Scale (EDS). Table 1 displays the ssummary of validated questionnaires including cut-off scores, construct of questionnaires, analytic rationale, and dimensions. Cut-off scores were used to ensure the erroneous decisions for each mental health assessment completed by all study participants could be unified for the purpose of the analysis.
2.5. Analysis Plan
2.5.1. Quantitative
The analysis focused on 9 questionnaires with 14 dimensions. Participants were divided into several subgroups based on age, gender, ethnicity, role, and length of service. Mean and standard deviation scores on 14 dimensions were calculated. ANOVA and t-tests were applied to check the difference in means between different subgroups.
A correlation heat-map was used to demonstrate the correlation between each questionnaire based on Spearman correlation. An item-total correlation was calculated to focus on the core items. Total item correlation in this instance refers to the correlation coefficient summarised between each specific item and other items, which is the quantification of the importance of specific item. Linear regression was used to investigate the mental health impact during the pandemic.
2.5.2. Qualitative
Transcripts were analysed using thematic and content analysis. Two experienced qualitative researchers independently reviewed transcripts and conduct analyses. A coding framework was developed to capture key themes with each coded theme subjected to detailed analyses to identify subthemes and illustrative quotes.
3. Results
3.1. Quantitative
A sample of 485 staff members completed the questionnaire, as outlined in Figure 1. Key characteristics of the sample are indicated in Table 2 including all sexes, ages, and geographies. 257 participants did not disclose their professional category and job title, whilst 60 and 228 participants reported these, respectively.
3.2. Age
Of 485 respondents, more than half (50.7%) were aged between 35-54 years. In the sample, 2.3% were young adults aged between 18-24 years. Cognitive impairment, one of the four dimensions measured by BAT-12, showed significant differences between age groups. People aged between 18-24 and 35-54 years scored higher compared to other groups. The young adult group scored the highest scores for cognitive impairment, depression, and daily discrimination. The elderly group, aged over 65 years of age had the highest scores for heritage, mainstream, and GSE and the lowest score for everyday discrimination. People aged 45-54 years had the highest anxiety with a score of 11 or over (proportion of 45.1%), while people aged 25-34 years had the lowest anxiety proportion of 39.6%. Table 3a displays the anxiety proportion for people aged 18-24, 25-34, 35- 44, 45-54, 55-64, 65 years and over were 40.0%, 39.6%, 40.0%, 45.1%, 44.4%, and 43.8%, respectively. However, the p-value (0.8092) indicated the anxiety level was independent to age statistically.

Table 3a.
Contingency table of anxiety level and age.
| Anxiety level | 18 - 24 | 25 - 34 | 35 - 44 | 45 - 54 | 55 - 64 | 65 and over |
| Abnormal | 2 | 21 | 34 | 37 | 20 | 7 |
| Borderline abnormal | 3 | 27 | 37 | 31 | 17 | 5 |
| Normal | 0 | 5 | 14 | 14 | 8 | 4 |
| Total | 5 | 53 | 85 | 82 | 45 | 16 |
|
Chi-Squared Test: .8092 |
||||||
Note: 0-7 = Normal, 8-10 = Borderline abnormal (borderline case), 11-21 = Abnormal (case).
3.3. Gender
Approximately 73.4% of the participants were female and 15.5% were male. Anxiety level was measured by anxiety score, which is the summation of the odds items within the HADS questionnaire. Male participants had a lower averaged anxiety score of 9.2 in comparison to female, 10.4 as shown in Table 4. Of the total 356 female respondents, 237 completed the anxiety questionnaire, thus there was a 33.4% of missingness. Of these 237 women, 110 (46.4%) had an anxiety score of 11 or higher and, 92 (38.8%) reported an anxiety score of 8 to 10. In comparison, of the total 75 male respondents, 48 completed anxiety questionnaires. Of these 48 participants, 9 (18.8%) had an anxiety score of 11 or higher and, 29 (60.4%) had a score of 8-10. The Chi-square test indicated a p-value of 0.001808 suggesting levels of anxiety appears to be similar across the genders (Table 3b).
Table 3b.
Contingency table of anxiety level and gender.
| Anxiety level | Male | Female |
| Abnormal | 9 | 110 |
| Borderline abnormal | 29 | 92 |
| Normal | 10 | 35 |
| Total | 48 | 237 |
|
Chi-Square Test 0.001808* |
Note: 0-7 = Normal, 8-10 = Borderline abnormal (borderline case), 11-21 = Abnormal (case).
Table 4 also shows men scored significantly lower than women on the dimension of exhaustion (7.8 and 8.7, respectively). Women appear to be less influenced by mainstream and heritage cultures in comparison to men as per the low scores observed from the VIA questionnaire.
Table 4.
The prevalence of burnout (BAT-12), anxiety and depression (HADS), everyday discrimination, insomnia (ISI) and wellbeing using emotion, optimism and work satisfaction (GSE) among genders and age groups.
Table 4.
The prevalence of burnout (BAT-12), anxiety and depression (HADS), everyday discrimination, insomnia (ISI) and wellbeing using emotion, optimism and work satisfaction (GSE) among genders and age groups.
| BAT-12 | HADS | Everyday discrimination | ISI | GSE | VIA | |||||||
|---|---|---|---|---|---|---|---|---|---|---|---|---|
| Variable | N | Exhaustion | Mental distance | Cognitive impairment | Emotional impairment | Anxiety | Depression | Heritage | Mainstream | |||
| Gender | ||||||||||||
| Female | 356 | 8.7 (2.7) | 7.3 (2.9) | 8.1 (2.4) | 5.5 (2.4) | 10.4 (2.6) | 8.4 (1.7) | 0.8 (0.7) | 8.1 (5.8) | 3.0 (0.5) | 6.44 (1.47) | 6.60 (1.44) |
| Male | 75 | 7.8 (2.7) | 7.5 (2.6) | 7.9 (2.8) | 5.2 (2.1) | 9.2 (2.5) | 8.4 (1.5) | 0.8 (0.6) | 6.7 (6.1) | 3.1 (0.4) | 5.99 (1.46) | 6.20 (1.56) |
| T-test | 0.041* | 0.607 | 0.667 | 0.445 | 0.002* | 0.986 | 0.965 | 0.149 | 0.548 | 0.060* | 0.092* | |
| Age | ||||||||||||
| 18 - 24 | 11 | 10.2 (4.3) | 7.7 (3.3) | 8.3 (3.3) | 5.7 (2.4) | 10.4 (2.7) | 9.5 (2.9) | 0.9 (0.7) | 10.2 (8.1) | 2.8 (0.6) | 6.21 (1.05) | 6.09 (1.58) |
| 25 - 34 | 90 | 8.7 (2.8) | 7.2 (2.8) | 7.7 (2.5) | 5.4 (2.5) | 9.8 (2.4) | 8.2 (1.6) | 0.7 (0.7) | 7.7 (6.6) | 3.1 (0.4) | 6.38 (1.49) | 6.65 (1.27) |
| 35 - 44 | 131 | 8.6 (2.7) | 7.6 (3.0) | 8.6 (2.6) | 5.4 (2.4) | 9.7 (3.2) | 8.1 (1.7) | 0.8 (0.7) | 6.8 (5.7) | 3.0 (0.5) | 6.31 (1.46) |
6.44 (1.44) |
| 45 - 54 | 115 | 8.8 (2.6) | 7.8 (2.8) | 8.2 (2.5) | 5.9 (2.7) | 10.4 (2.7) | 8.6 (1.6) | 0.9 (0.7) | 8.6 (5.5) | 3.0 (0.5) | 6.27 (1.45) | 6.41 (1.53) |
| 55 - 64 | 70 | 7.8 (2.7) | 6.9 (2.8) | 7.3 (2.2) | 5.0 (2.0) | 9.8 (2.4) | 8.9 (1.6) | 0.6 (0.6) | 8.2 (5.6) | 3.1 (0.4) | 6.38 (1.67) | 6.64 (1.54) |
| > 64 | 21 | 8.1 (3.2) | 5.7 (2.2) | 7.1 (2.4) | 5.2 (1.7) | 9.7 (3.2) | 9.0 (1.6) | 0.5 (0.4) | 8.6 (6.2) | 3.3 (0.4) | 7.51 (1.37) | 7.80 (1.47) |
| ANOVA | 0.276 | 0.147 | 0.042* | 0.521 | 0.699 | 0.016* | 0.054* | 0.376 | 0.070* | 0.213 | 0.089* | |
| Ethnicity | ||||||||||||
| White British | 340 | 8.5 (2.6) | 7.3 (2.8) | 8.2 (2.4) | 5.4 (2.3) | 10.1 (2.5) | 8.5 (1.7) | 0.7 (0.6) | 7.9 (5.9) | 3.0 (0.4) | 6.25 (1.50) | 6.52 (1.49) |
| Other ethnicity | 67 | 8.8 (3.0) | 7.2 (3.1) | 7.8 (2.8) | 5.7 (2.8) | 10.9 (2.8) | 8.2 (1.7) | 0.9 (0.8) | 8.4 (5.8) | 3.0 (0.6) | 6.78 (1.30) | 6.59 (1.29) |
| T-test | 0.562 | 0.806 | 0.403 | 0.460 | 0.078* | 0.193 | 0.223 | 0.638 | 0.570 | 0.020* | 0.751 | |
| Length of service | ||||||||||||
| Less than 1 year | 50 | 7.7 (2.9) | 5.8 (2.3) |
7.0 (2.5) | 4.7 (2.1) | 9.7 (2.3) |
8.4 (1.8) | 0.7 (0.6) | 7.7 (6.6) |
3.1 (0.4) | 6.36 (1.81) |
6.39 (1.76) |
| 1 to 5 years | 192 | 8.7 (2.7) | 7.9 (2.8) |
8.2 (2.3) | 5.6 (2.5) | 10.2 (2.7) | 8.4 (1.7) | 0.8 (0.7) | 7.9 (5.9) |
3.0 (0.4) | 6.35 (1.36) |
6.57 (1.34) |
| 6 to 10 years | 105 | 8.7 (2.7) | 7.3 (2.9) |
8.3 (2.7) | 5.6 (2.5) | 10.7 (2.7) | 8.5 (1.6) | 0.8 (0.7) | 7.8 (5.6) |
3.1 (0.5) | 6.37 (1.56) |
6.52 (1.58) |
| 11 to 15 years | 47 | 8.8 (2.9) | 7.2 (2.7) |
8.1 (2.6) | 5.3 (2.6) | 9.8 (2.0) |
8.4 (1.9) | 0.7 (0.5) | 8.3 (6.2) |
3.1 (0.6) | 6.17 (1.41) |
6.23 (1.42) |
| 16 to 20 years | 7 | 9.3 (1.3) | 8.0 (1.4) |
7.8 (2.1) | 6.3 (0.6) | 12.2 (3.6) | 8.6 (0.9) | 0.8 (0.2) | 6.6 (2.9) |
3.0 (0.2) | 7.12 (2.00) |
7.62 (1.43) |
| Over 21 years | 10 | 6.6 (3.8) | 3.4 (0.9) |
4.6 (1.8) | 4.0 (1.4) | 8.8 (2.7) |
9.5 (0.8) | 0.4 (0.4) | 9.3 (6.8) |
3.0 (0.3) | 6.72 (1.59) |
6.76 (1.57) |
| ANOVA | 0.329 | <0.001* | 0.008* | 0.363 | 0.106 | 0.744 | 0.690 | 0.978 | 0.830 | 0.852 | 0.504 | |
| Professional groups | ||||||||||||
| Trial management | 127 | 8.4 (2.5) | 7.4 (2.8) |
8.4 (2.8) | 5.4 (2.3) | 7.9 (4.3) |
4.8 (3.6) | 0.8 (0.7) | 7.1 (5.5) |
3.1 (0.5) | ||
| Quality assurance | 8 | 9.0 (1.9) | 7.1 (1.8) |
8.7 (2.0) | 4.4 (1.3) | 8.7 (4.6) |
3.5 (4.0) | 0.9 (0.6) | 10.3 (8.3) | 3.0 (0.2) | ||
| Database management | 34 | 8.5 (3.0) | 7.2 (3.0) |
8.3 (2.3) | 6.1 (2.7) | 8.0 (3.9) |
5.3 (4.0) | 0.7 (0.6) | 9.1 (6.9) |
2.8 (0.6) | ||
| Doctor/Nur se | 34 | 8.8 (3.1) | 7.1 (2.9) |
7.7 (2.6) | 6.2 (3.0) | 8.9 (4.2) |
5.9 (4.3) | 0.9 (0.8) | 8.5 (5.7) | 3.0 (0.3) | ||
| Statistician | 29 | 9.2 (3.1) | 7.8 (2.8) |
7.8 (2.5) | 5.4 (2.7) | 8.6 (4.4) |
6.1 (4.7) | 0.5 (0.7) | 6.5 (5.2) | 3.1 (0.4) | ||
| ANOVA | 0.851 | 0.965 | 0.723 | 0.364 | 0.820 | 0.480 | 0.409 | 0.368 | 0.209 | |||
Note. Significant values (with p-value less than 0.1) are marked in red.
3.4. Mental health Assessment
3.4.1. Length of Service
The BAT-12 scores appeared to increase with the length of service as indicated in Table 4. Thus, elevated exposure to exhaustion, mental distance, cognitive, and emotional impairment were observed to be common within this group. The ANOVA test showed statistically significant scores between cognitive impairment and mental distance among different lengths of service groups (less than 1 year, 1 to 5 years, 6 to ten years, 11 to 15 years, 16 to 20 years, over 21 years) with p-values of 0.008 and less than 0.001 respectively. P-values were not significant within the exhaustion and emotional impairment dimensions with 0.329 and 0.363, respectively. A trend analysis indicates the overall exhaustion and emotional impairment levels increased with the length of service ranges from less than a year to 20 years. There appears to be a large variation within the data. We excluded the data for the group of over 21 years since the sample size is rather small and it is treated as an outlier.
3.4.2. Well-Being
The pooled data listed in Table 2, indicated 25.8% of respondents suffered from long-term conditions and 3.9% from disabilities. Participants who had an existing mental health condition prior to the pandemic (28.2%), believed their disease did not worsen, thus a lack of a notable change in their wellbeing was reported. Approximately, 10.9% of participants with mental health conditions felt better since the pandemic began. Participants that had no mental health problems before (43.1%) reported that their wellbeing worsened since the pandemic began. In 36.3% of participants, physical health conditions did not change since the beginning of the pandemic began whilst 13.4% of participants felt there were improvements. Approximately 32.8% of participants reported their physical condition worsened since the pandemic began.
Of the trial management participants, 28.3% suffered from long-term conditions which is slightly higher than CTU staff. Clinical trials reported their mental health and physical health conditions worsened since the pandemic began, in comparison to other professional groups with 49.6% and 35.4%, respectively. These participants also had higher use of medications for their mental and physical conditions; 15.7% and 25.2%, respectively, as shown in Table 5.
In comparison, the remaining participants had a lower percentage of medication use for mental and physical health with 12.6% and 19.8, respectively. The cognitive impairment level is relatively higher among the clinical trialist group with an average impairment score of 8.40 compared to the rest of study participants (7.93).
3.4.3. Professional Group Outcomes
Five different professional groups with acceptable sample size (ranging from 8 to 127, mean 46.4) were considered in the analysis (trial management, quality assurance, database management, doctor/nurse, statistician). Statisticians had the highest level of exhaustion, mental distance, and depression whilst quality assurance staff had the highest level of cognitive impairment. Nurses and doctors appeared to have the highest scores for anxiety and emotional impairment. Although, this has clinical significance in relation to the wellbeing of staff, an overall statistical significance could not be determined based on limited professional group sample sizes. The demographic characteristics and their association with burnout, HADS, everyday discrimination, ISI and GSE is indicated in Table 4.
Approximately, 28.3% of participants working in trial management suffered from long-term conditions, which is slightly higher than that of the study population (Table 5a). On the other hand, a high proportion of clinical trialists felt their mental and physical health had worsened since the pandemic began in comparison to other professional groups, 49.6% and 35.4%, respectively (Table 5b).
Table 5a.
Key characteristics of Trial Management participants.
| Demographics - Questionnaire respondents (N = 127) | |||||
|---|---|---|---|---|---|
| Variables | N(%) | Variables | N(%) | ||
| Age |
18 - 24 1 (0.8%) 25 - 34 23 (18.1%) 35 - 44 46 (36.2%) 45 - 54 35 (27.6%) 55 - 64 17 (13.4%) 65 and over 5 (3.9%) |
Religion | Christian 33 (26.0%) Muslim 7 (5.5%) Hindu 1 (0.8%) Buddhist 1 (0.8%) No religion 83 (65.4%) Other 1 (0.8%) Not available 1 (0.8%) |
||
| Gender |
Female 105 (82.7%) Male 22 (17.3%) |
Ethnicity |
Asian 2 (1.6%) Indian 1 (0.8%) Bangladeshi 2 (1.6%) Pakistani 2 (1.6%) White & Asian 1 (0.8%) White & Caribbean 1 (0.8%) White British 100 (78.7%) Other background 11 (8.7%) Not available 7 (5.5%) |
||
| Nationality |
United Kingdom 77 (60.6%) Not available 50 (39.4%) |
||||
| Health and wellbeing | |||||
| Suffer from any long- term conditions | Yes 36 (28.3%) No 83 (65.4%) Prefer not to say 1 (0.8%) Not available 7 (5.5%) |
Suffer from any disabilities | Yes 5 (3.9%) No 113 (89.0%) Prefer not to say 2 (1.6%) Not available 7 (5.5%) |
||
| Taking medication for any mental health condition | Yes 20 (15.7%) No 100 (78.7%) Not available 7 (5.5%) |
Taking medication for any physical condition | Yes 32 (25.2%) No 86 (67.7%) Prefer not to say 2 (1.6%) Not available 7 (5.5%) |
||
|
Mental health rating since the pandemic began |
Much better 2(1.6%) Somewhat better 9 (7.1%) About the same 45 (35.4%) Somewhat worse 54 (42.5%) Much worse 9 (7.1%) Not available 8 (6.3%) |
Physical health rating since the pandemic began | Much better 3 (2.4%) Somewhat better 13 (10.2%) About the same 58 (45.7%) Somewhat worse 39 (30.7%) Much worse 6 (4.7%) Not available 8 (6.3%) |
||
|
Test positive for COVID-19 in the past 12 months |
Yes 12 (9.4%) No 107 (78.7%) Not available 8 (6.3%) |
||||
Table 5b.
Characteristics of Quality Assurance participants.
| Demographics | Questionnaire respondents (N = 8) | ||
|---|---|---|---|
| Variables | N(%) | Variables | N(%) |
| Age | 25 - 34 2 (25.0%) 35 - 44 2 (25.0%) 45 - 54 3 (37.5%) 55 - 64 1 (12.5%) |
Religion | Christian 3 (37.5%) No religion 5 (62.5%) Female 6 (75.0%) Male 2 (25.0%) |
| Gender | |||
| Nationality Health and wellbeing Suffer from any long-term conditions |
United Kingdom 7 (87.5%) Not available 1 (12.5%) |
Ethnic Suffer from any disabilities |
White British 8 (100.0%) No 8 (100.0%) |
| Yes 2 (25.0%) No 6 (75.0%) | |||
|
Taking medication for any mental health condition Mental health rating since the pandemic began Test positive for COVID-19 in the past 12 months |
Yes 1 (12.5%) No 7 (87.5%) |
Taking medication for any physical condition Physical health rating since the pandemic began |
Yes 2 (25.0%) No 6 (75.0%) Somewhat better 2 (25.0%) About the same 5 (62.5%) Somewhat worse 1 (12.5%) |
| Somewhat better 1 (12.5%) About the same 3 (37.5%) Somewhat worse 2 (25.0%) Much worse 2 (25.0%) | |||
| No 8 (100.0%) |
3.4.4. Ethnicity
In terms of ethnicity and race, 70.1% of the respondents were white British and 13% were of ethnic minorities (African, Asian, Bangladeshi and Indian descent). Ethnic minorities were grouped for the purpose of conducting meaningful analysis to evaluate their mental health outcomes. T-tests showed anxiety levels of White British participants were significantly lower in comparison to ethnic minorities as indicated in Table 4. Participants from ethnic minority groups believed that the outside world may be more afraid of them (p = 0.015) or that people acted like they were more dishonest than White British (p = 0.054). Table 6 presents the mean (SD) and item correlations for the ISI scores.
Table 6.
Mean (SD), item-total correlations for the ISIS.
| Severity | Mean (SD) | Item-total r |
|---|---|---|
| Initial (Difficulty falling asleep) sleep onset | 0.99 (1.10) | 0.5456 |
| Middle (Difficulty staying asleep) sleep maintenance | 1.18 (1.12) | 0.7461 |
| Terminal (Problem waking up too early) | 1.16 (1.19) | 0.6095 |
| Satisfaction | 1.87 (1.20) | 0.7554 |
| Interference | 1.08 (1.02) | 0.7758 |
| Noticeability | 0.90 (1.00) | 0.7232 |
| Distress (Worried) | 0.70 (0.84) | 0.7579 |
| Total | 7.88 (5.86) |
3.4.5. Heat-Map Correlation
Based on the heatmap, heritage and mainstream scores were highly associated with each other based on the spearman correlation score of 0.8. Anxiety level showed a strong correlation with levels of depression, insomnia, exhaustion, emotional impairment, and cognitive impairment where the spearman correlation greater than 0.4. GSE and everyday discrimination showed a correlation with the four dimensions of BAT-12 although the spearman correlation was less than -0.4 and over 0.3, respectively, as illustrated in Figure 2.
3.4.6. Linear Regression
To investigate whether long term exposure to high level stressful environment has influence staff mental health, anxiety, depression and burn out scores were combined (denoted by y) and plotted it against the length of service (using the mid-point for each group, denoted by x) in Figure 3. The overall score increased along the length of service. except for the group with over 21years length of employment.
Item-Total Correlations of ISI
Means and standard deviations for the ISI and sleep diary measures are reported in Table 7. The ISI average total score was 7.8 8 (SD 5.86). The internal consistency of the ISI was estimated with a Cronbach alpha coefficient and by the item-total correlations. The internal consistency, (i.e., degree of consistency or homogeneity of the items within a scale) of the ISI was 0.74. The item-total correlations varied from a low of 0.55 (initial) to a high of 0.78 (interference) with an average of 0.70.
Table 7.
Summary Table of Outcome Measures.
| Scale information | |||
|---|---|---|---|
| Vancouver Index of Acculturation (VIA) | |||
| Heritage score | 6.36 / 9 (1.48) | Mainstream score | 6.53 / 9 (1.47) |
| Hospital Anxiety and Depression Scale (HADS) | |||
| Anxiety score | 10.24 / 21 (2.60) | Depression score | 8.46 / 21 (1.69) |
| Insomnia Severity Index (ISI) | |||
| Insomnia score | 7.88 / 28 (5.86) | ||
| Pandemic Stress Index (PSI) | |||
| Behavioral experiences during COVID-19 | No changes to my life or behaviour | 3 (0.62%) | |
| Practicing social distancing | 278 (57.32%) | ||
| Isolating or quarantine yourself | 154 (31.75%) | ||
| Caring for someone at home | 43 (8.87%) | ||
| Working from home | 268 (55.26%) | ||
| Not working | 8 (1.65%) | ||
| A change in use of healthcare services | 107 (22.06%) | ||
| Following media coverage related to COVID-19 | 233 (48.04%) | ||
| Changing travel plans | 207 (42.68%) | ||
| Impact of COVID-19 on day-to-day life | Not at all | 4 (0.82%) | |
| A little | 50 (10.31%) | ||
| Much | 66 (13.61%) | ||
| Very Much | 93 (19.18%) | ||
| Extremely | 65 (13.40%) | ||
| Physical and mental experiences during COVID-19 | Being diagnosed with COVID-19 | 40 (8.25%) | |
| Fear of getting COVID-19 | 135 (27.84%) | ||
| Fear of giving COVID-19 to someone else | 185 (38.14%) | ||
| Worrying about friends, family, partners, etc. | 236 (48.66%) | ||
| Stigma or discrimination from other people | 23 (4.74%) | ||
| Personal financial loss | 41 (8.45%) | ||
| Frustration or boredom | 160 (32.99%) | ||
| Not having enough basic supplies | 24 (4.95%) | ||
| More anxiety | 151 (31.13%) | ||
| More depression | 70 (14.43%) | ||
| More sleep, less sleep, or other changes to your normal sleep pattern | 115 (23.71%) | ||
| Increased alcohol or other substance use | 79 (16.29%) | ||
| A change in sexual activity | 43 (8.87%) | ||
| Loneliness | 106 (21.86%) | ||
| Confusion about what COVID-19 is, how to prevent it, or why social distancing/isolation/quarantines are needed | 24 (4.95%) | ||
| Feeling that I was contributing to the greater good by preventing myself or others from getting COVID-19 | 167 (34.43%) | ||
| Getting emotional or social support from family, friends, partners, a counsellor, or someone else | 89 (18.35%) | ||
| Getting financial support from family, friends, partners, an organisation, or someone else | 10 (2.06%) | ||
| Other difficulties or challenges | 49 (10.10%) | ||
| General Self Efficacy Scale (GSE) | |||
| Average self efficacy score | 3.04 / 4 (0.46) | ||
| Burnout Assessment Tool-12 (BAT-12) | |||
| Exhaustion score | 8.57 / 15 (2.75) | Cognitive impairment score | 8.05 / 15 (2.51) |
| Mental distance score | 7.33 / 15 (2.86) | Emotional impairment score | 5.46 / 15 (2.42) |
| The Everyday Discrimination Scale (EDS) | |||
| Average discrimination score | 0.77 / 5 (0.65) | ||
3.5. Geographical
Of the 485 respondents, 137 disclosed their longitude and latitude, accounting for about 59% of the sample. The majority of respondents were from England, mostly concentrated in the central and southern parts of England, including Southampton, Bristol, London, Oxford, and Birmingham. Scotland had the second largest number of respondents primarily from Edinburgh, Glasgow, and Dundee.
3.6. Qualitative
For the qualitative part of the study, 6 participants (4 women and 2 men) consented and completed interviews (Supplementary Document 1). Their interview durations ranged from 26 to 54 minutes. Respondents included a senior statistician, research nurses and trials managers. Participants rated their work-related stress levels between 3 and 6. Two participants felt things had worsened since the beginning of the COVID-19 pandemic, whilst one reported there had been improvements and another claimed things had returned to pre-COVID-19 levels. There was a general sense that the job came with periods of high pressure that exacerbated stress levels, however this was unrelated to COVID-19.
Participants reported pre-COVID-19 related daily work issues associated with clinical trials they were working on, office environment, and the commute. Differing views were reported on the perceived effectiveness of open plan offices in terms of noise, distractions and challenges associated with some processes required for clinical trials management.
There were also tasks that could no longer be completed as before due to changes to workforce availability. Research nurses redeployed to support COVID-19 patients in frontline services meant recruitment activities to most clinical studies were paused. Others transitioned to an ‘on-line’ or ‘telephone’ mode of delivery of services where possible.
Some of the emergent themes are illustrated by verbatims quotes below:
‘now you have a bit more spare time and are not being pestered by colleagues all of the time on the office, it helps’ [P, 002];
… ‘things went very scary, very high for every area of life for everybody …. This is how we operate now, there’s certainly an acceptance so not very high but the bar is set a lot lower now’ [P, 003].
At the height of COVID, there was an overwhelming sense of things being beyond individual control as highlighted by these quotes:
‘it was awful….. in terms of your day, your day wasn’t your own … the adrenalin kicked in because everyone was going into survival mode …’ [P 003].
Similarly, ‘mostly things that are out of my control ….. things that are out of my hand that are stressful … such as recruitment levels, trying to get that sorted’ [P 001]
‘… the whole situation was intensely stressful’ [P 006].
3.6.1. Work-Life Balance
For some home-working and managing childcare was challenging during this period, as expressed by this respondent:
‘I was home-schooling on my own, trying to work at home. That was the most stressful point I think because it’s virtually impossible with a five year-old to home school and work at the same time, so I was working evenings and weekends and it was just constant and then, because we were in lockdown we didn’t see anyone, we didn’t go anywhere, we were totally isolated.’ [P 006].
‘I wouldn’t say it was all plain sailing because that’s not the case [P 003
‘… nobody had an escape plan, nobody had down time but 10, 11 o’clock at night emailing isn’t ideal’ [P 003].
‘I respond to emails any time e.g. at 11pm, I can give a quick answer and it’s done. It’s good and bad. I’m quite responsive with people, I’m not a stickler with hours. [P, 004].
‘There is an expectation to work more from one person who wants to have meetings at 6-7 in the evening. As such as lockdown was done, I didn’t want to do that anymore’ [P, 002].
3.6.2. Information Technology (IT) and Remote/Hybrid Working
‘I used to have two meetings a week on zoom and there was a time when there were 7 (meetings) a day’ [P, 003].
‘You bounce from meeting to meeting rather than doing it physically’ [P, 001].
There were positives, however with some respondents saying:
‘I do think your true self comes out, everyone’s much more relaxed in a zoom environment than we were before, because you have to be. That’s the norm and it’s taken the pressure off.’ [P, 003].
‘… being able to jump into a meeting easily, no distractions ..’ [P, 002]’
‘The university have gone down a blended approach … giving people the flexibility …. People being more responsible for their own workloads … getting more out of people’ [P ,003].
3.6.3. Changes to the Workplace
‘It was quite hard because it’s a big open plan office which is why we’re not sort of back in the office yet because they’re trying to work out ventilation and hot-desking and stuff…… a key part of what helps me do my work is a big pair of noise-cancelling headphones because it’s too loud and I get distracted really easily’ [P, 004].
‘Technically, we’re back but not everyone is yet. All the desks have moved. Having to travel again is weird. There are no face-to-face meetings, just getting back to being back close to people on the commute again’. [P, 005].
There were also positive experiences, however ‘I didn’t realise till I started to go back in just how refreshing it is to have, like, even a laugh with someone in your office. Just to have that two minutes’ [P, 005]
3.6.4. Communication
‘The biggest problem was in the communication …. We realised no-one’s coming back full-time and had to adapt to different ways of working and communicating’ [P, 005].
‘In the early days, the doors were just closed. That was it, just closed’ [P, 003].
3.6.5. Administration
‘Basically you’ve got to apply to work, to use anywhere and get approval, use the clinic rooms for studies’ [P, 006].
3.6.6. Staff Redeployment, Recruitment, and Shortages
‘We were briefly redeployed again, which was very stressful. Having to go to a new area and work with strangers on something I really didn’t know a lot about, which was stressful’ [P, 006].
‘The inability to recruit other members and roles as they might be attracted to other sectors … no lack of money, just lack of staff’ [P, 002].
Overall, there was a sense of uncertainty despite the pandemic status in the UK changing. There were mixed views on the desirability of office working and returning to a pre-COVID-19 working style.
4. Discussion
Based on the collective findings, the negative mental health impact on the CTU workforce due to the COVID-19 pandemic is evident. Experiences of stress and burnout were of varying degrees when comparing those with and without a pre-existing mental illness or a physical condition. Previous studies found that the majority of healthcare workers recruited experienced some for of psychological distress throughout the pandemic [10]. Increases levels of stress, anxiety, depression and insomnia were experienced by all healthcare staff [11]. Future clinical reviews would be beneficial for the CTU workforce.
Moreover, COVID-19 has demonstrated the importance of diversity and the disproportionate impact that minority populations endured [12]. Based on the study results, there appears to be under representation of ethnic minorities in CTU staff despite around 45% of the NHS workforce constituting of ethnic minority staff [16]. Studies have found an ethnic bias more prominently present throughout the COVID-19 pandemic which has disadvantaged minority groups [12,13,14]. Adequate representation could have facilitated more meaningful conclusions about the impact of COVID-19 on the mental health of CTU staff from minority ethnic groups within this study. A better understanding would help to improve the provision for minority ethnic staff in other NHS profession groups.
The mental health impact identified may result in increased sickness absences. This would also have a negative impact on performance and efficiency. Whilst this study cannot determine the precise medium and long-term effects of increased sickness absences at an individual and organisational level, a negative impact can be determined if the overall wellbeing remains the same. Findings from previous studies have shown that sickness absence was significantly higher throughout and post-pandemic [15].
It appears, there is significant variability in experiences and opinions around lived experience professionally and personally during the pandemic. Participants reflected powerful insights into the impact of COVID-19 whilst working to deliver COVID-19 research in a CTU environment. Similar to these findings, studies have revealed that healthcare professionals report mild anxiety and depression in higher proportions compared to the public [16,17,18]. A scoping review looking at the effects of COVID-19 on healthcare staff globally found that employees from all domains of healthcare experienced increased levels of depression, anxiety, and stress [19].
4.1. Limitations
Enrolment of participants could have been increased with less pressure on the CTU workforce. Furthermore, there were numerous observational and vaccine-related interventional studies during this period that could have resulted in this study competing with other portfolio studies for staff recruitment and participation. There is already a lack of representation for ethnic minorities within clinical research and the same issue seems to have arisen within this study. As minority ethnic groups were the most impacted by the pandemic, it would have been insightful to focus recruiting higher proportions of CTU staff from these groups.
There were considerable challenges to increase participants for the qualitative component of the study. Longitudinal data collection could be a useful step as it would enable to continual assessment of findings to aid CTU workforce and employers make quality improvements.
5. Conclusions
This study indicates the substantial personal impact the CTU workforce have encountered during the pandemic. Viability of sustainable clinical trial conduct is based on multi-professional involvement in CTU settings thus, it would be in the interest of all healthcare professionals to improve the support systems available to better manage working conditions especially as part of pandemic preparedness.
Recommendations to inform ‘Future Preparedness’ in supporting the CTU workforce in delivering pandemic and non-pandemic research include ensuring continuity and clarity of communication via different media, providing opportunities for flexibility in working hours, within reasonable constraints and ensuring staff are not pressured into work during times they would not usually do so. Additionally, it would be appropriate to include opportunities for collaborative problem-solving via different media as per the needs of individual team members and maintaining consistency, where possible, in frequency and content of contact so that staff feel supported in different aspects of their working roles. Finally, contingency planning of supplies of necessary equipment for effective home working should be considered in line with all relevant health and safety legislation to ensure the wellbeing of CTU workforce as they lead in the delivery of cutting edge innovative clinical trials that will be tomorrow’s interventions.
Supplementary Materials
Document S1: Qualitative Interview Extended Content.
Author Contributions
GD and PP developed the study protocol and embedded this within the EPIC project’s work-package 3. The Chief Investigator of this study is PP and Principal Investigator GD. GD, JT and JQS designed and completed the statistical analysis. The qualitative analysis was completed by KBK, PP and GD. All authors critically appraised and commented on previous versions of the manuscript. All authors read and approved the final manuscript. All authors have read and agreed to the published version of the manuscript.”.
Funding
This work was funded by the NIHR.
Institutional Review Board Statement
HRA REC approval (21/HRA/2348) was obtained prior to the study initiation.
Informed Consent Statement
Informed consent was obtained from all participants involved in the study. Informed consent has been obtained from all participants to publish this paper.
Data Availability Statement
The authors will consider sharing the dataset gathered upon receipt of reasonable requests.
Acknowledgments
The authors acknowledge support from Southern Health NHS Foundation Trust.
Conflicts of Interest
PP has received research grant from Novo Nordisk, and other, educational from Queen Mary University of London, other from John Wiley & Sons, other from Otsuka, outside the submitted work. SR reports other from Janssen, Lundbeck and Otsuka outside the submitted work. All other authors report no conflict of interest. The views expressed are those of the authors and not necessarily those of the NHS, the National Institute for Health Research, the Department of Health and Social Care or the Academic institutions.
References
- WHO. Director-General’s opening remarks at the media briefing on COVID-19 – 11 March 2020. Available online: WHO Director-General’s opening remarks at the media briefing on COVID-19 - 11 March 2020.. (accessed on 12 October 2022).
- Coronavirus Legislation. Available online: Coronavirus Legislation. (accessed on 12 October 2022).
- Mitchell, E.J.; Ahmed, K.; Breeman, S.; Cotton, S.; Constable, L.; Ferry, G.; Goodman, K.; Hickey, H.; Meakin, G.; Mironov, K.; Quann, N. It is unprecedented: trial management during the COVID-19 pandemic and beyond. Trials 2020, 21, 1–7. [Google Scholar] [CrossRef] [PubMed]
- Bhatt, A. Clinical trials during the COVID-19 pandemic: Challenges of putting scientific and ethical principles into practice. Perspect. Clin. Res. 2020, 11, 59. [Google Scholar] [CrossRef] [PubMed]
- Clinical Trial Jobs in United Kingdom. Available online: Clinical Trial Jobs in United Kingdom - 2022 | Indeed.com. (accessed on 12 October 2022).
- Urgent public health COVID-19 studies. Available online: https://www.nihr.ac.uk/covid-studies/ (accessed on 12 October 2022).
- Thornton, J. Clinical trials suspended in UK to prioritise covid-19 studies and free up staff. BMJ 2020, 368, m1172. [Google Scholar] [CrossRef] [PubMed]
- Bitencourt, M.R.; Alarcão, A.C.; Silva, L.L.; Dutra, A.D.; Caruzzo, N.M.; Roszkowski, I.; Bitencourt, M.R.; Marques, V.D.; Pelloso, S.M.; Carvalho, M.D. Predictors of violence against health professionals during the COVID-19 pandemic in Brazil: A cross-sectional study. PLoS One 2021, 16, e0253398. [Google Scholar] [CrossRef] [PubMed]
- Jesuthasan, J.; Powell, R.A.; Burmester, V.; Nicholls, D. ‘We weren’t checked in on, nobody spoke to us’: an exploratory qualitative analysis of two focus groups on the concerns of ethnic minority NHS staff during COVID-19. BMJ Open 2021, 11, e053396. [Google Scholar] [CrossRef] [PubMed]
- Tam, C.W.; Pang, E.P.; Lam, L.C.; Chiu, H.F. Severe acute respiratory syndrome (SARS) in Hong Kong in 2003: stress and psychological impact among frontline healthcare workers. Psychol. Med. 2004, 34, 1197–204. [Google Scholar] [CrossRef] [PubMed]
- Lai, J.; Ma, S.; Wang, Y.; Cai, Z.; Hu, J.; Wei, N.; Wu, J.; Du, H.; Chen, T.; Li, R.; Tan, H. Factors associated with mental health outcomes among health care workers exposed to coronavirus disease 2019. JAMA Netw. Open 2020, 3, e203976. [Google Scholar] [CrossRef] [PubMed]
- Phiri, P.; Delanerolle, G.; Al-Sudani, A.; Rathod, S. COVID-19 and black, Asian, and minority ethnic communities: a complex relationship without just cause. JMIR Public Health Surveill. 2021, 7, e22581. [Google Scholar] [CrossRef] [PubMed]
- Phiri, P.; Rathod, S.; Elliot, K.; Delanerolle, G. The Impact of COVID-19 on the mental wellbeing of healthcare staff. EJPMR 2020, 7, 66–71. [Google Scholar]
- Delanerolle, G.; Rathod, S.; Elliot, K.; Ramakrishnan, R.; Thayanandan, T.; Sandle, N.; Haque, N.; Raymont, V.; Phiri, P. Rapid commentary: Ethical implications for clinical trialists and patients associated with COVID-19 research. World J. Psychiatry 2021, 11. [Google Scholar] [CrossRef]
- Freedom to Speak Up Review. Available online: http://freedomtospeakup.org.uk/the-report/ (accessed on 12 October 2022).
- Khorasanee, R.; Grundy, T.; Isted, A.; Breeze, R. The effects of COVID-19 on sickness of medical staff across departments: A single centre experience. Clin. Med. 2021, 21, e150. [Google Scholar] [CrossRef] [PubMed]
- Rathod, S.; Pallikadavath, S.; Young, A.H.; Graves, L.; Rahman, M.M.; Brooks, A.; Soomro, M.; Rathod, P.; Phiri, P. Psychological impact of COVID-19 pandemic: Protocol and results of first three weeks from an international cross-section survey-focus on health professionals. J. Affect. Disord. Rep. 2020, 1, 100005. [Google Scholar] [CrossRef] [PubMed]
- Hall, H. The effect of the COVID-19 pandemic on healthcare workers’ mental health. Jaapa 2020, 33, 45–8. [Google Scholar] [CrossRef] [PubMed]
- Shreffler, J.; Petrey, J.; Huecker, M. The impact of COVID-19 on healthcare worker wellness: a scoping review. West. J. Emerg. Med. 2020, 21, 1059. [Google Scholar] [CrossRef] [PubMed]
Figure 1.
CONSORT Flow Diagram showing recruitment of participants.
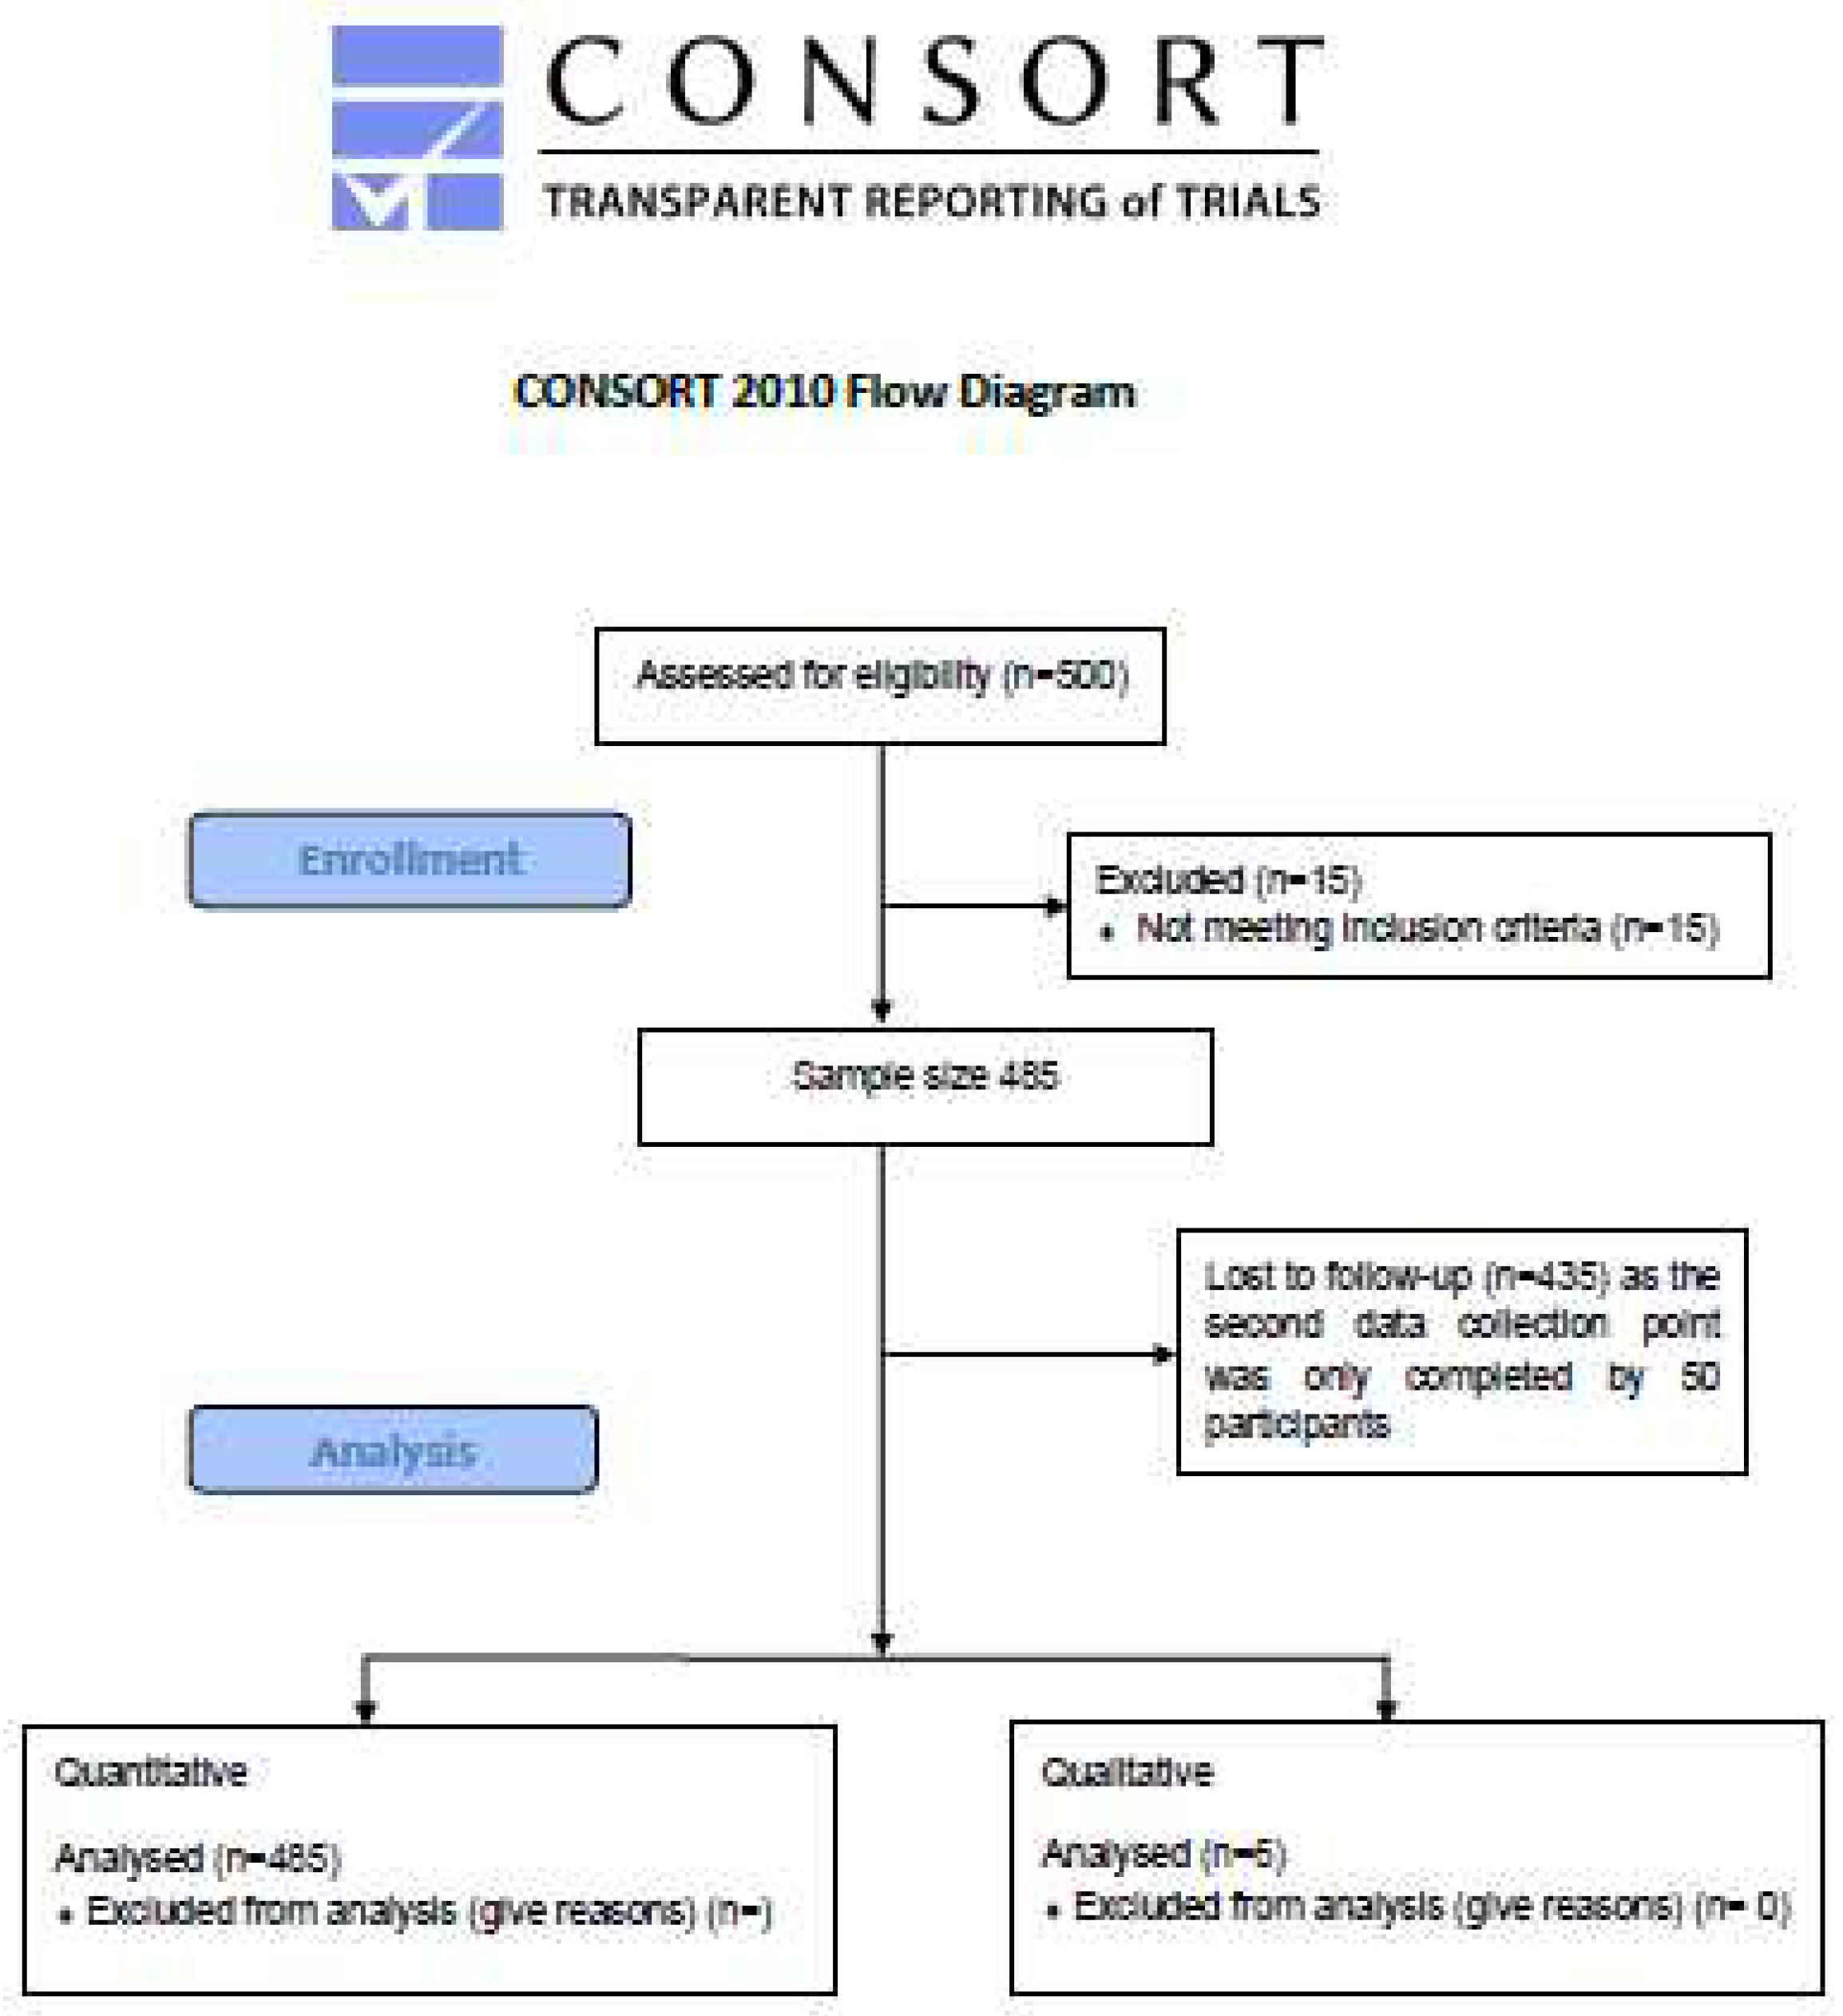
Figure 2.
Heatmap correlation of assessment scores.
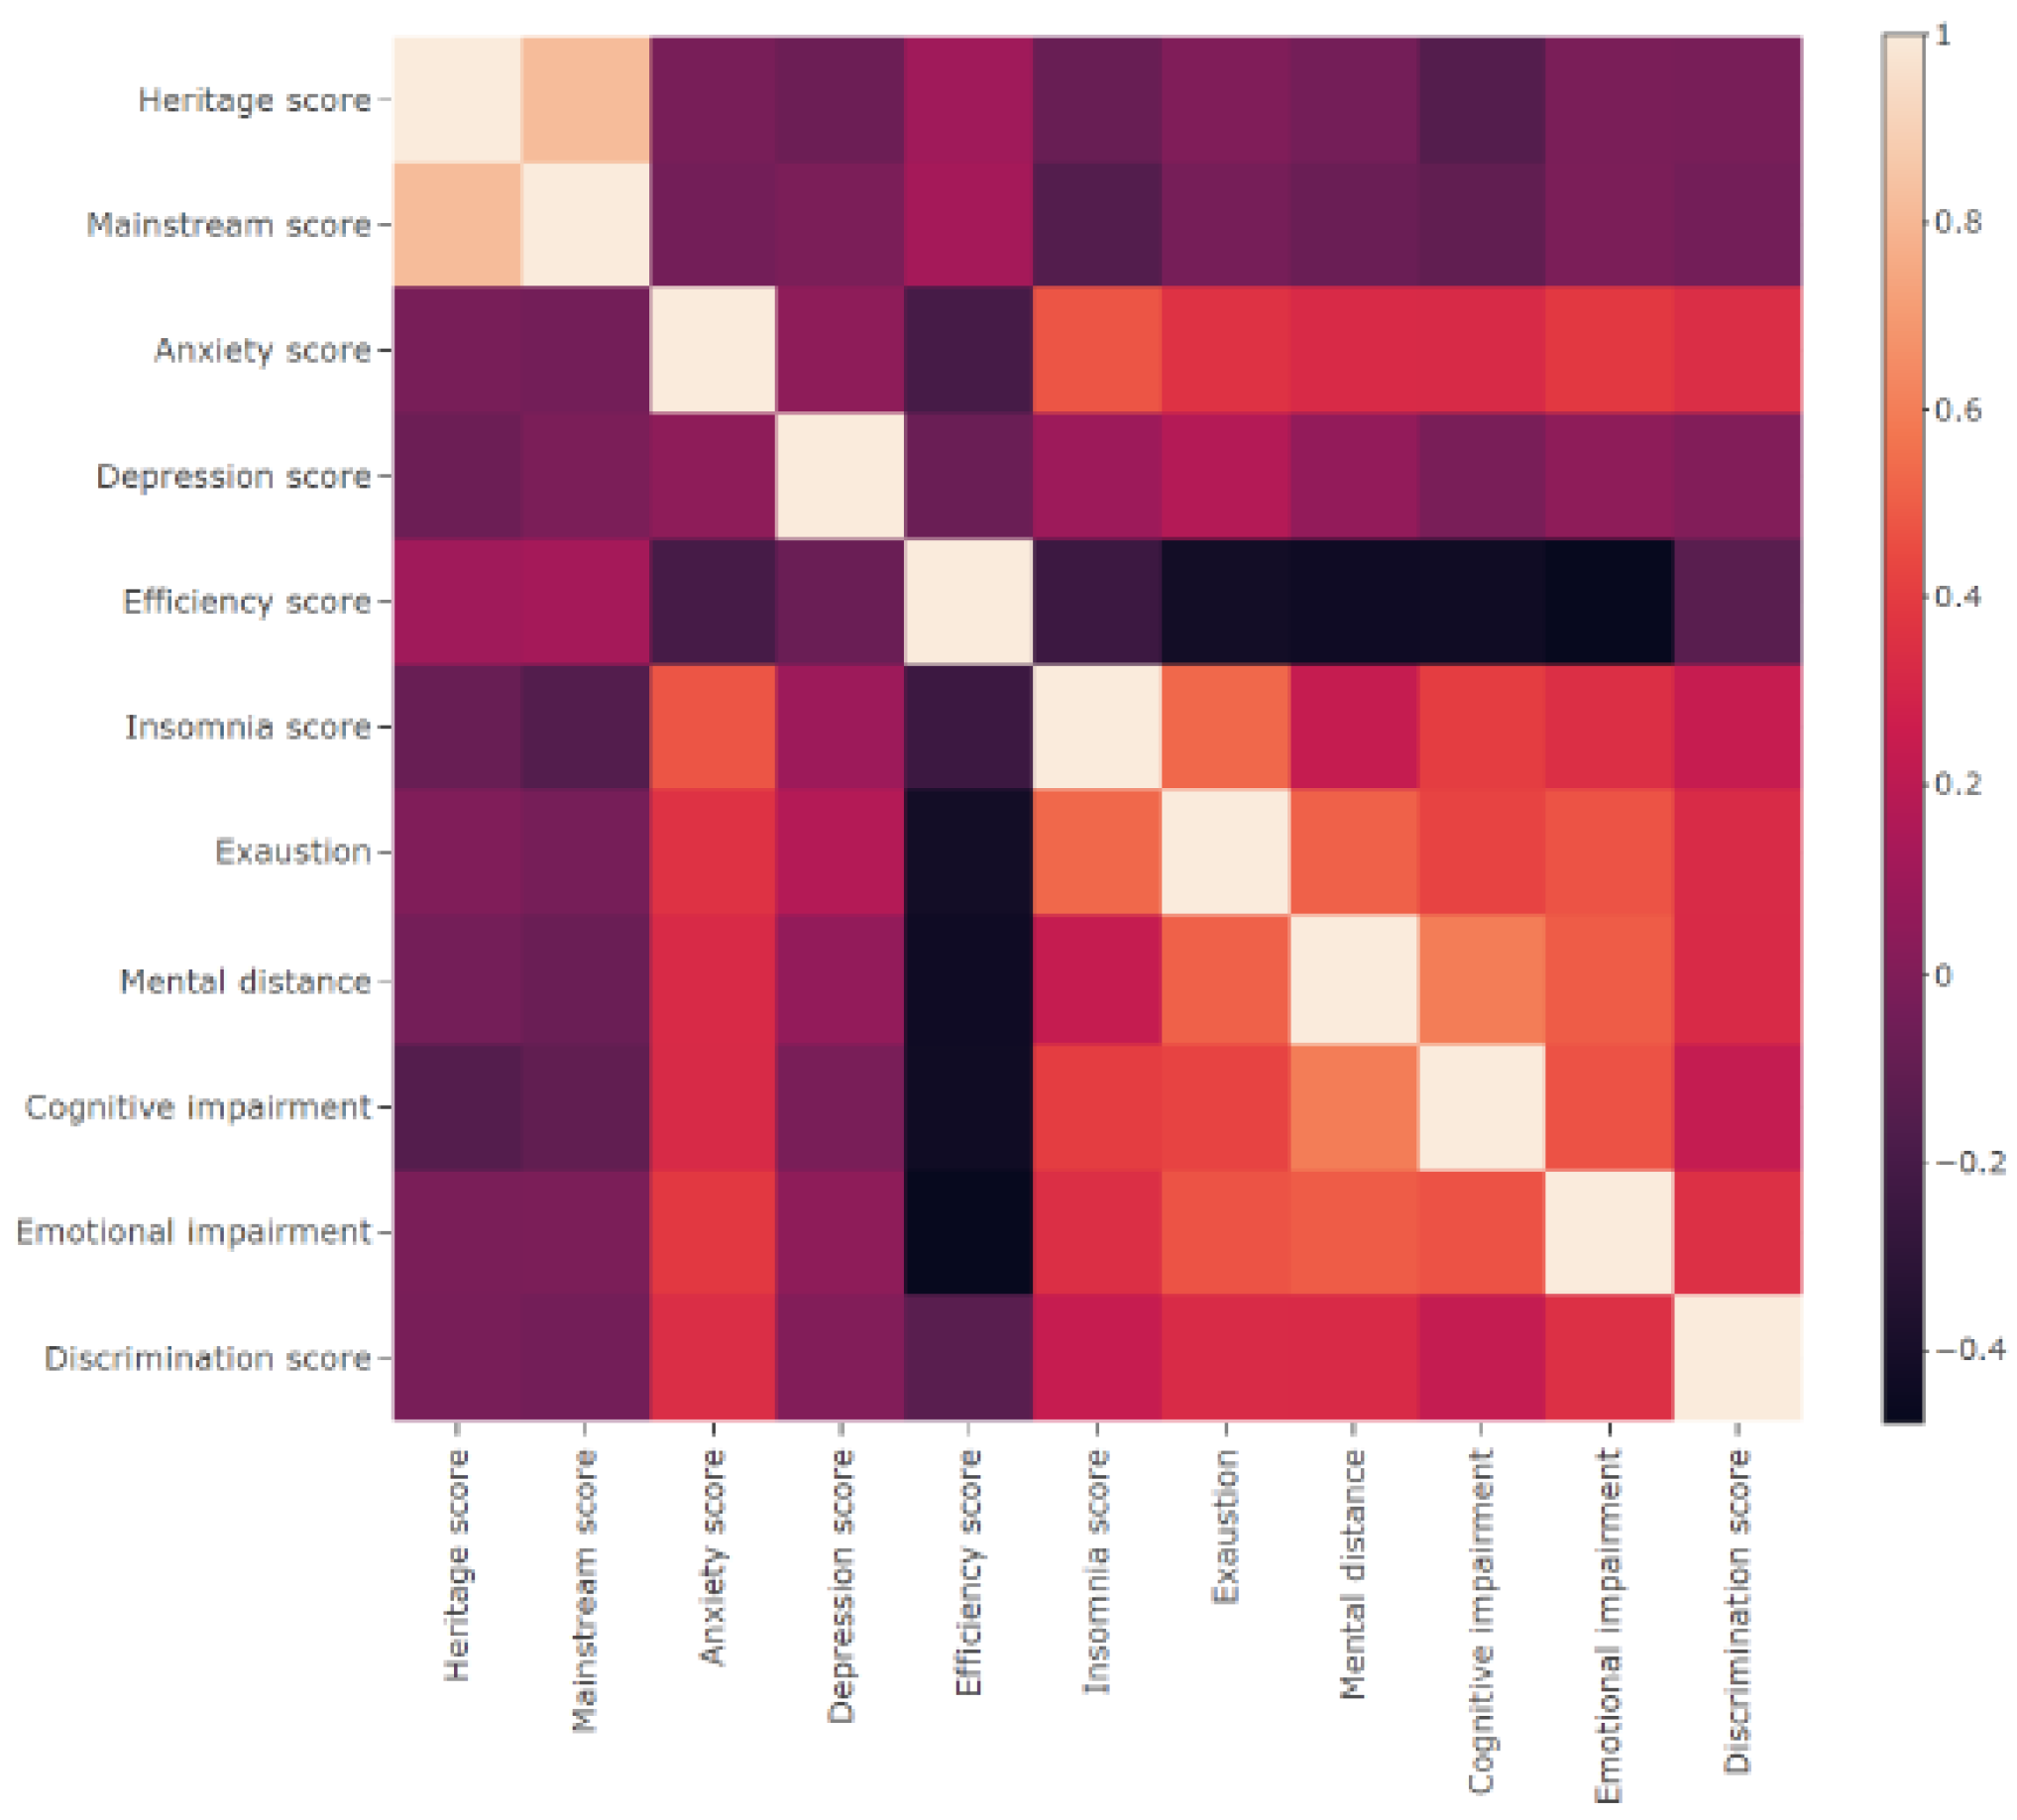
Figure 3.
Linear Regression of assessment scores against length of service.
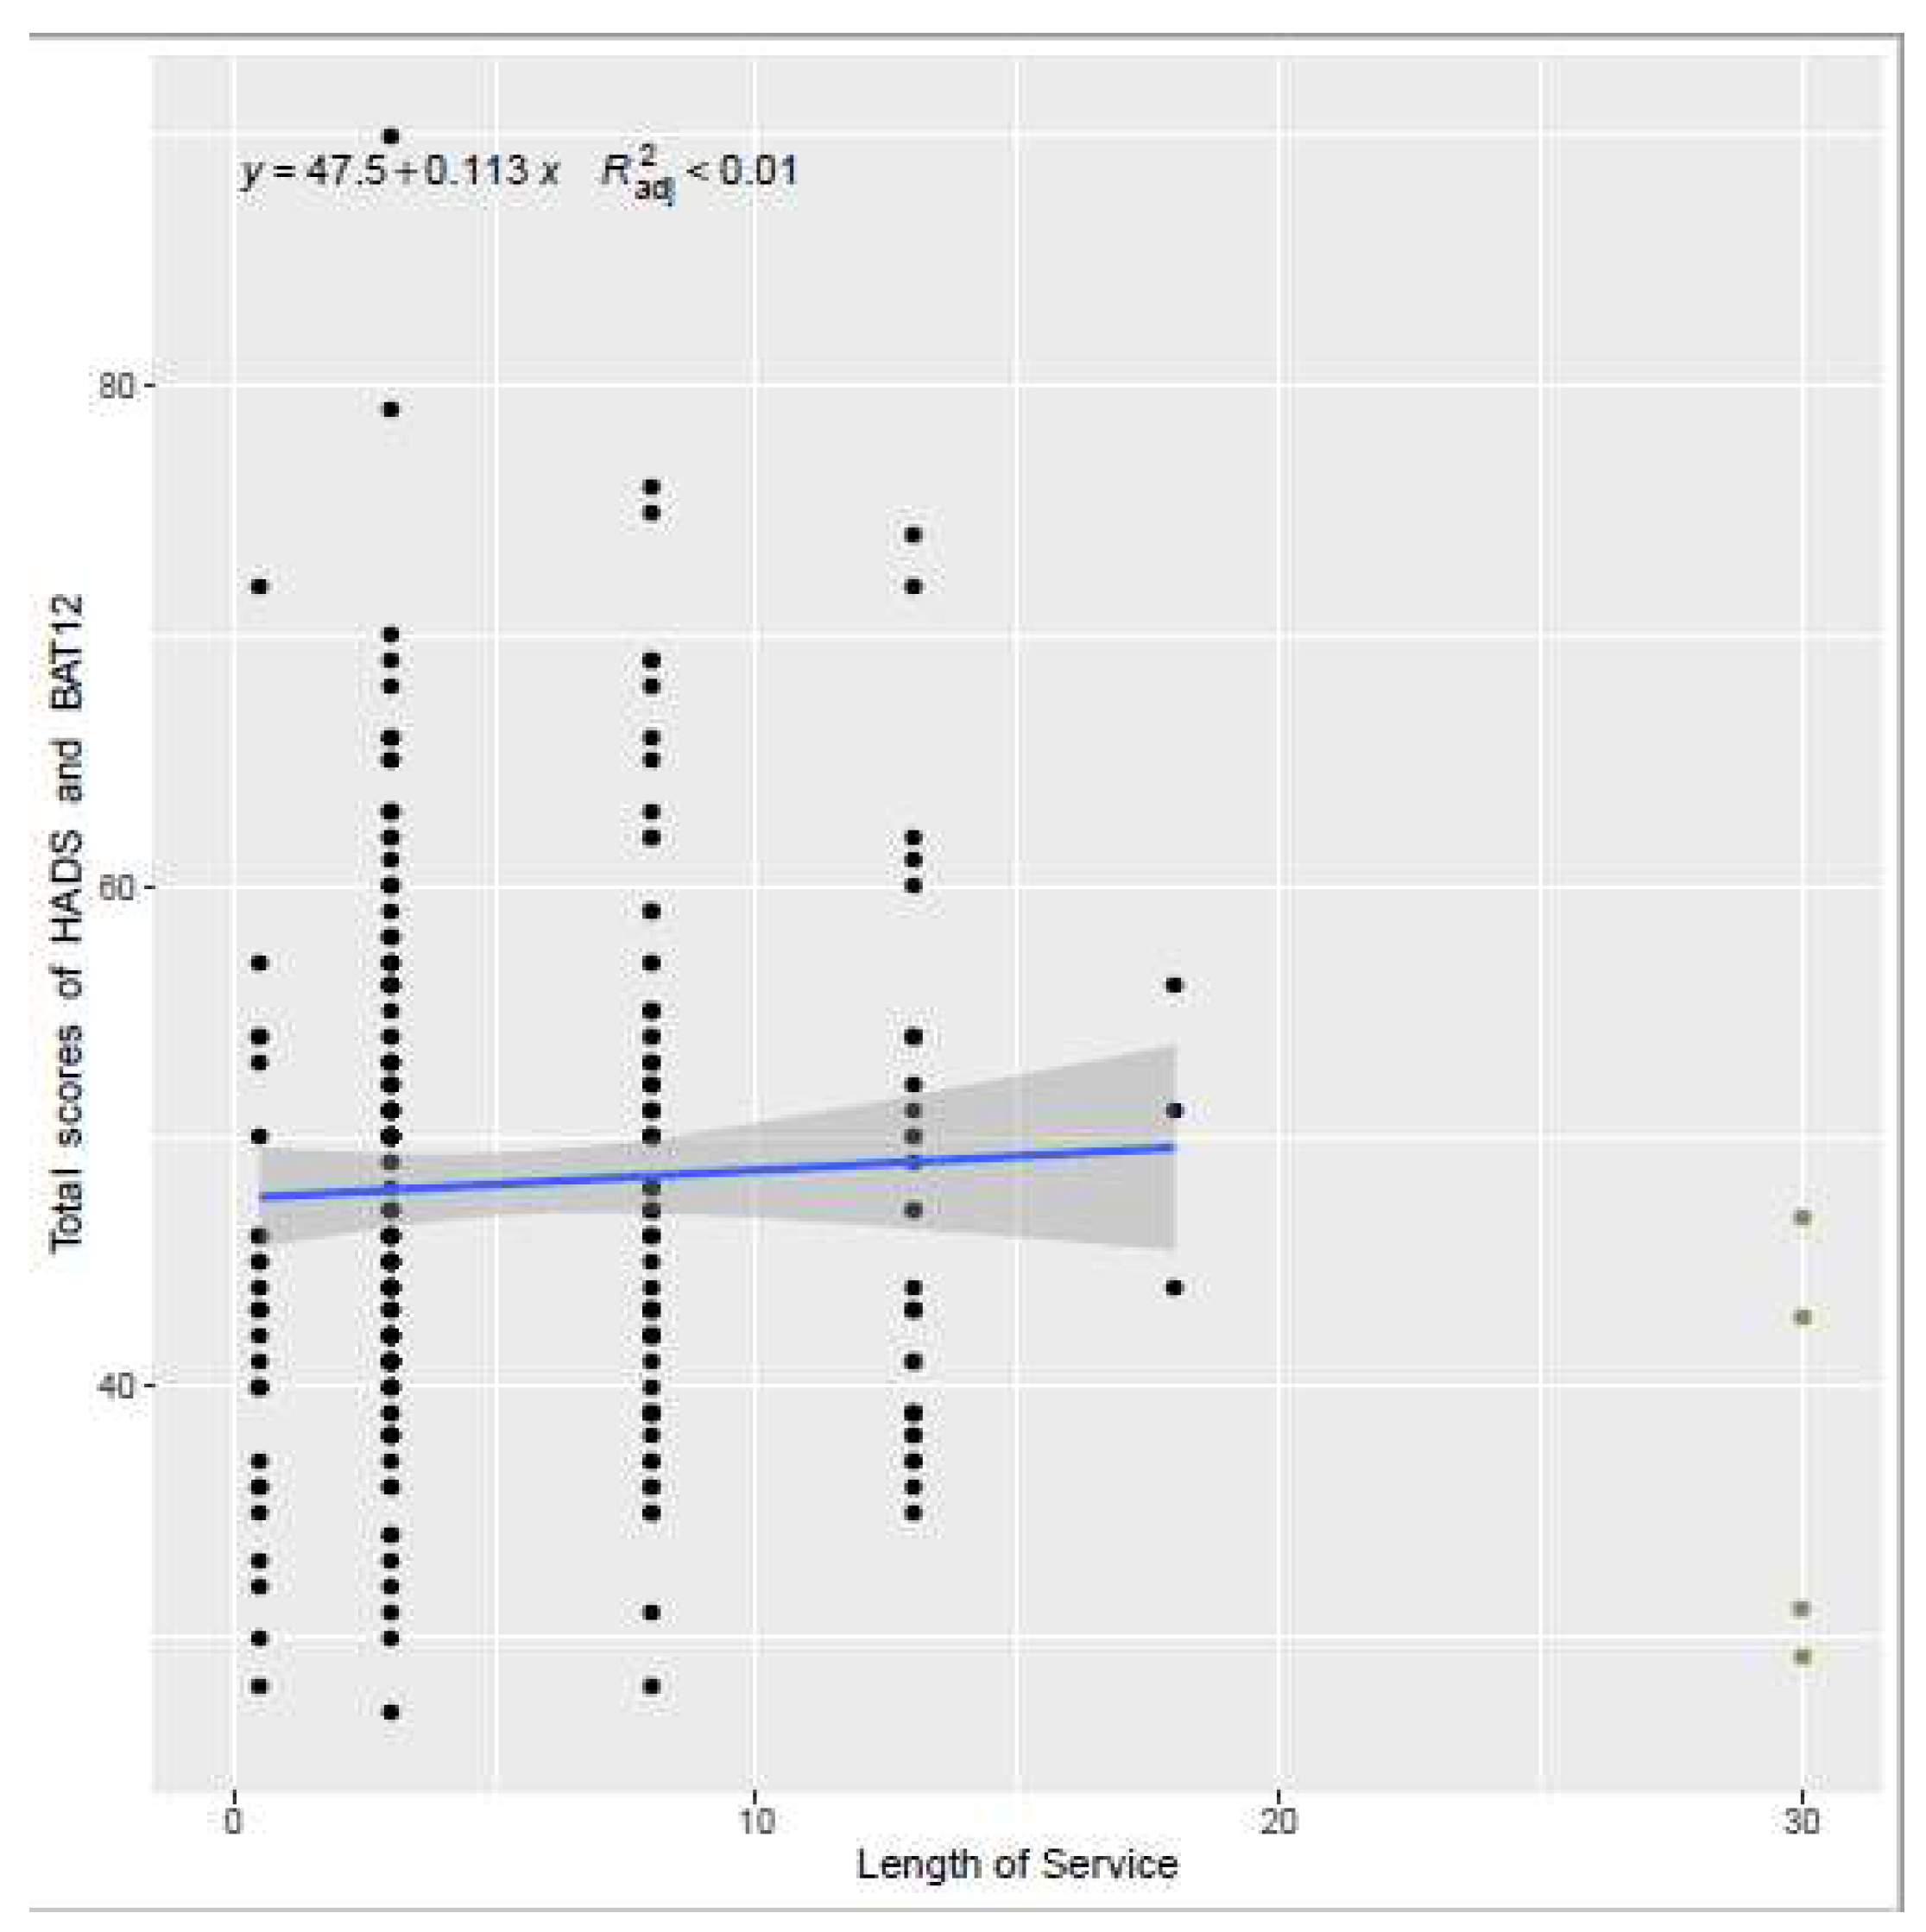
Table 1.
Summary of validated questionnaires.
| Questionnaire | Cut-off scores | Construct | Analytic Rationale | Dimensions |
| Demographic information | None | Equity issues | Moderator | One dimension |
| Hospital Anxiety and Depression Scale (HADS) | A total score of 11 or higher indicates the probable presence of the mood disorders, with a score of 8 to 10 being just suggestive of the presence of the respective state. | Psychological impact - Anxiety & Depression | Outcome measure |
Anxiety score (odd items) Depression score (even items) |
|
General Self-Efficacy (GSE) |
None |
Assessment of general self-efficacy |
Moderator | One dimension |
|
Pandemic Stress Index (PSI) |
None | Psychological impact | Outcome measure | One dimension |
| Insomnia Severity Index (ISI) |
A score of: 0-7 is indicative of no insomnia; 8-14 indicative of a subthreshold insomnia; 15-21 moderate insomnia; 22-28 is indicative of severe insomnia. |
Psychological impact - Sleep Quality | Outcome measure | One dimension |
|
Vancouver Index of Acculturation (VIA) |
None | Disadvantages and equity issues - cultural context | Moderator or mediator |
Heritage score Mainstream score |
| Burnout Assessment Tool (BAT-12) | None | Psychological impact | Moderator |
Exhaustion score Mental distance score Cognitive impairment score Emotional score impairment |
|
The Everyday Discrimination Scale (EDS) |
None | Workplace and occupational | Moderator or mediator | One dimension |
| AHRQ Patient safety culture survey | None | Workforce and occupational | Moderator or mediator | One dimension |
Table 2.
Demographic Characteristics of the Sample.
| Demographics - Questionnaire respondents (N = 485) | |||||
|---|---|---|---|---|---|
| Variables | N(%) | Variables | N(%) | ||
| Age |
18 - 24 11 (2.3%) 25 - 34 90 (18.6%) 35 - 44 131 (27.0%) 45 - 54 115 (23.7%) 55 - 64 70 (14.4%) 65 and over 21 (4.3%) Not available 47 (9.7%) |
Religion | Christian 135 (27.8%) Muslim 9 (1.9%) Hindu 1 (0.2%) Jewish 1 (0.2%) Buddhist 2 (0.4%) Sikh 2 (0.4%) No religion 268 (55.3%) Other 13 (2.7%) Not available 54 (11.1%) |
||
| Gender | Female 356 (73.4%) Male 75 (15.5%) Other 2 (0.4%) Prefer not to say 5 (1.0%) Not available 47 (9.7%) |
Ethnicity | African 1 (0.2%) Asian 8 (1.6%) Bangladesh 2 (0.4%) Black 2 (0.4%) Indian 5 (1.0%) Pakistani 4 (0.8%) White & Asian 3 (0.6%) White & Black African 3 (0.6%) White & Caribbean 2 (0.4%) White British 340 (70.1%) White Irish 3 (0.6%) Other background 34 (7.0%) Prefer not to say 6 (0.6%) Not available 72 (14.8%) |
||
| Nationality | United Kingdom 265 (54.6%) Not available 220 (45.4%) |
||||
| Healthcare professional |
Yes 60 (12.4%) No 379 (78.1%) Not available 46 (9.5%) |
||||
| Job title |
Administration / Management 193 (39.8%) Attending / Staff physician 2 (0.4%) Physician assistant / Nurse practitioner 3 (0.6%) Registered nurse 25 (5.1%) Unit assistant / Clerk / Secretory 5 (1.0%) Other 208 (42.9%) Not available 49 (10.1%) |
Professional group (Healthcare professional = Yes N = 60) |
Academic research 5 (8.3%) Allied Health Professional 4 (6.7%) Allied Health Professional by training 4 (6.7%) Clinical Trialist 5 (8.3%) Doctor 4 (6.7%) Nurse 31 (51.7) Other 6 (10.0%) |
||
| Health and wellbeing | |||||
|
Suffer from any long-term conditions |
Yes 125 (25.8%) No 277 (57.1%) Prefer not to say 7 (1.4%) Not available 76 (15.7%) |
Suffer from any disabilities |
Yes 19 (3.9%) No 384 (79.1%) Prefer not to say 3 (0.6%) Not available 79 (16.3%) |
||
|
Taking medication for any mental health condition |
Yes 65 (13.4%) No 337 (69.5%) Prefer not to say 6 (1.2%) Not available 77 (15.9%) |
Taking medication for any physical condition | Yes 103 (21.2%) No 297 (61.2%) Prefer not to say 5 (1.0%) Not available 80 (16.5%) |
||
|
Mental health rating since the pandemic began |
Much better 15 (3.1%) Somewhat better 38 (7.8%) About the same 137 (28.2%) Somewhat worse 173 (35.7%) Much worse 36 (7.4%) Not available 86 (17.7%) |
Physical health rating since the pandemic began |
Much better 19 (3.9%) Somewhat better 46 (9.5%) About the same 176 (36.3%) Somewhat worse 141 (29.1%) Much worse 18 (3.7%) Not available 85 (17.5%) |
||
|
Test positive for COVID-19 in the past 12 months |
Yes 51 (10.5%) No 350 (72.2%) Not available 84 (17.3%) |
||||
Disclaimer/Publisher’s Note: The statements, opinions and data contained in all publications are solely those of the individual author(s) and contributor(s) and not of MDPI and/or the editor(s). MDPI and/or the editor(s) disclaim responsibility for any injury to people or property resulting from any ideas, methods, instructions or products referred to in the content. |
© 2023 by the authors. Licensee MDPI, Basel, Switzerland. This article is an open access article distributed under the terms and conditions of the Creative Commons Attribution (CC BY) license (http://creativecommons.org/licenses/by/4.0/).
Copyright: This open access article is published under a Creative Commons CC BY 4.0 license, which permit the free download, distribution, and reuse, provided that the author and preprint are cited in any reuse.


