Submitted:
21 February 2023
Posted:
22 February 2023
You are already at the latest version
Abstract
Minimum miscibility pressure (MMP) and oil swelling are two important factors of carbondioxide (CO2) gas displacement mechanism occurred in the reservoir relate to application of CO2 injection in the field to enhance oil recovery. In this paper determination of minimum miscibility pressure (MMP) between crude oil samples with carbondioxide gas conducted using two methods, i.e. correlation methods and laboratory experiment using slimtube. While, determination of swelling factor was conducted using PVT cell, where recombined fluid injected and conditionally at the reservoir temperature. The results of MMP using empirical equation (2807 Psig) and Holm & Josendal correlation (2750 Psig) is more approximate to the result of laboratory analysis (2805 Psig). The result of swelling test during injection CO2 gas processes until 46.82% mole, shows that bubble point pressure is increasing gradually from 410 psig through 2200 psig, and swelling factor was also increase from 1.0 through 1.442. Based on the value of fracture pressure of Layer F in the KHL Field is 2200 Psig and MMP is 2805 Psig, hence the application of CO2 gas injection in the field only could be conducted as immiscible flooding.
Keywords:
minimum miscibility pressure (MMP)
; swelling factor
; carbondioxide (CO2)
; slimtube
1. Introduction
The injection of carbon dioxide (CO2) is very effective for increasing oil recovery and it is a proven technology in the enhanced oil recovery (EOR). The success of this CO2 injection depends heavily on several parameters, such as the injection pressure, oil swelling, wettability, interface tension, rock permeability, viscosity ratio, oAPI of oil, fluid saturation, and reservoir heterogeneity [1]. Some research about CO2 has been done by previous researchers both in terms of feasibility studies, [2,3,4,5,6], technical studies [7,8] and laboratory experiments [9]. From those studies, it can be concluded that the main factors causing success in CO2-EOR include the decrease in oil viscosity [8,9,10,11], oil volume expansion [1,12,13,14], oil extraction and evaporation [9,15,16], injection pressure [1,16,17,18,19], and solution gas drive [17,20].
Based on reservoir characteristic parameters in the initial screening criteria and CO2 source availability in the field, it is recommended for Layer F of KHL Field be chosen for CO2 injection implementation [2]. In order to support the feasibility of applying CO2 gas injection, it is necessary to determine the minimum miscible pressure (MMP) and swelling factor between oil samples from Layer F with CO2 gas as the fluid to be injected. If the miscibility condition is achieved in the injection or pressurization process above minimum miscibility pressure, then the pressurization will be efficient and an optimal increase of oil recovery is obtained, however, pressurization below the minimum miscibility pressure can still increase oil recovery significantly.
The study presented in this paper is a laboratory study related to the application of CO2 flooding in Layer F of KHL Oil Field, including determination of the minimum miscible pressure (MMP), swelling test analysis to determine the swelling factor and observation of oil recovery increase at several injection pressures below and above MMP using continuous CO2 gas injection method. This laboratory study was conducted at PPPTMGB "Lemigas" Jakarta.
2. Basic Concept and Methods
The CO2 injection (well known as miscible CO2 injection) is performed by injecting CO2 into a reservoir through injection well to displaced oil in the reservoir to the production wells. CO2 is a stable molecule where one carbon atom binds two oxygen atoms. The molecular weight of CO2 is 44.01, with 87.8 0F of critical temperature and 1071 Psia of critical pressure [12]. There are several reason why CO2 is used as injected gas: easy to obtained and relatively affordable compared to other gas; CO2 is miscible in oil and water; CO2 injection could produce 60 - 90 % of OOIP [1], and CO2 can act as “flooding agent” - a miscible substance that can act as displacing fluid [9,21].
Stalkup, Jr., [1] states that the mechanism of CO2 injection in the reservoir is that oil swelling (since CO2 is very easy to miscible in oil), reduces oil viscosity (more effective than N2 or CH4), reduces the interfacial tension between oil and CO2/oil phase at the miscible area, and create miscibility when the injection pressure is high enough (greater than minimum miscibility pressure/MMP).
CO2 source used in the injection process is an important parameter to be considered regarding the injection volume required for the CO2 injection program. The available CO2 source must be relatively pure since some gas component such as methane can increase the minimum miscible pressure, and the other gas component such as hydrogen sulfide is dangerous, smells, and causes a serious environmental problem. The best CO2 source can be the CO2 that is produced from a production well or the CO2 that is produced from a gas factory. The other sources are the stock gas from coal-fired; acid gas separation of oil fields - as exhaust gas from power plants; limestone calcination facilities; and waste products from cement factories. The gas released from an ammonia plant can be the other alternative [1,9].
2.1. Screening Criteria
Screening criteria for selecting the best EOR method for an oil field is based on the "Implemented Technology Case", which is the current implied technology or at least has been proven applicable in an oil field [22]. The technology includes thermal methods, chemical injection, and miscible displacement as shown in Table 1.
When Table 1 is used, there will be several EOR methods that are applicable in one oil reservoir. To determine which one is the best method to be performed (the method that economically gives the optimum oil recovery), further research of laboratory study, mathematical model (simulation), and pilot test on the field is required. Table 1 will give options on the homogenous reservoir [22]. For a heterogenous reservoir with fractures, faults, lateral discontinuity, or an oil reservoir with a gas cap; further study is required to find the impact of the reservoir heterogeneity on each EOR method [9].
According to Taber, J.J., Martin, F.D., and Seright, R.S., [22], the parameters that influence the selection of the EOR method can be divided into 2 (two) groups: oil physical properties (oil gravity, oil viscosity, and oil composition) and reservoir characteristic (oil saturation, reservoir lithology, net sand thickness, porosity, permeability, reservoir depth, and reservoir temperature). Meanwhile, the reservoir water brine properties such as salinity and solids content are used as a supportive parameter.
2.2. Minimum Miscible Pressure
Minimum miscible pressure (MMP) is the minimum displacement pressure where gas can be dissolved in the displaced oil through a multi-contact mechanism or dynamic miscibility process. In the dynamic miscibility process, the injected gas will vapourize the intermediate component of hydrocarbon in the crude oil based on vaporizing gas drive mechanism [1].
The minimum miscible pressure can be obtained in three ways, i.e. using the equation of state, correlations, and performing laboratory experiments [1]. The MMP can be determined empirically with the equation presented by Stalkup, Jr., [1] as follows:
where:
MMP = -329.558 + (7.727 x MW x 1.005T) – (4.377 x MW)
T = 0.015 Depth + 77.45
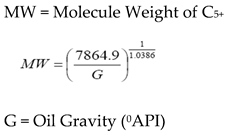
The correlations between oil and gas in MMP determination has been developed by several researchers such as Holm and Josendal [17], Yellig and Metcalfe [18], Mungan [19], Yellig [16] also Stalkup, Jr., [1]. The MMP determination using correlations are shown in Figure 1, Figure 2, Figure 3 and Figure 4.
These correlations describe the relationship between the MMP with the temperature, light fluid components (C1, N2, CO2), intermediate components (C2-C6), C5-C30 contain, impurities (N2 and H2S), C7+ molecule weight, oil molecule weight, oil density, and the oil type (aromatic, naphthenic, paraffinic). It can be concluded that every correlation has a different variable. Therefore, to choose the correlation used, its better use the same oil composition and the oil type as used in the correlation.
The MMP can also be determined by performing laboratory experiments using Slimtube [1]. The Slimtube as shows in Figure 5, describes a stable and low dispersion displacement process, where the oil displacement is rely on phase behavior. The crude oil is put in the Slimtube and then displaced by gas at a certain pressure. After the displaced volume reaches 1.2 of the gas pore volume, the oil production is calculated as the recovery factor. If the addition of higher-pressure results in a relatively very small increase in oil production, then the pressure can be defined as the minimum miscible pressure.
This research uses a slimtube containing quartz sand with a length of 1890 cm, tube diameter of 0.639 cm, porosity of 25.7%, a permeability of 15.803 darcy, and a pore volume of 155.838 cc at 120 ºC. Furthermore, the Slimtube is filled with crude oil with the composition of H2S, CO2, N2, C1, C2, C3, i-C4, n-C5, C6, and C7+, with variations of displacement pressure is 1200, 1300, 1380, 1400, 1500 Psig. The result of oil recovery from CO2-oil displacement at each pressure is shown in Figure 6.
Figure 6 shows that the oil recovery when the displacement pressure is below MMP will increase along with the increase of displacement pressure. The phenomena occurs both in the oil recovery at breakthrough, displacement of 1.2 pore volume (PV) and blowdown. Furthermore, for displacement at and above TTM, the increase in displacement only resulted in a relatively small increase in oil recovery. This occurs at breakthrough, 1.2 pore volume, and at blowdown. Therefore, it can be decided that the magnitude of TTM is 1380 Psig. After this pressure, the addition of pressure only increases the oil recovery slightly.
2.3. Swelling Factor
The presence of CO2 gas dissolved in oil will increase the volume of oil. This increase in volume is expressed by a quantity called the swelling factor, which is "The ratio of the volume of oil that has been filled with CO2 to the initial oil volume before being filled with CO2, if the magnitude of this swelling factor is more than one, it indicates the presence of expansion”. Simon and Graue [13] said that the swelling factor is influenced by the mole fraction of CO2 dissolved in the oil (XCO2) and the size of the oil molecules formulated by the ratio of molecular weight density (M/ρ). Particularly, the results of Wellker and Dunlop [12] showed that the swelling factor is also influenced by pressure and temperature as shows in Figure 7.
3. Results and Discussion
3.1. Screening Criteria of F Layer
The mapping of Layer F of KHL Field is carried out to evaluate the feasibility of the CO2 flooding application. The crucial part is reservoir characterization of reservoir rock physics, reservoir fluid physics and chemistry, and reservoir conditions. This characterization served as a discretion and input for laboratory studies and reservoir simulation of applied CO2 injection in Layer F, either during pilot project and full-scale application [2].
Based on EOR screening criteria Taber, J. J., Martin, F. D., and Seright, R.S. [22] in Table 1, for Layer F of KHL Field, when adjusted with the most affecting factors and parameters in EOR method screening (oil characteristics and reservoir characteristics), then EOR method using CO2 gas injection is appropriate, or considered to be feasible for field application. Screening results of Layer F is shown in Table 2.
CO2 injection is commonly carried out with injecting a certain amount of CO2 (30% or more than hydrocarbon PV) into the reservoir. CO2 is not instantly mixed with oil during the first contact, but after going through gradual contacts or multiple contacts. CO2 extracts light-to-medium hydrocarbon components; and if the pressure is high enough, it would form a mixture to displace oil films from the rocks. Over the depths less than 1,800 ft, reservoir is considered not qualified to meet the technical screening criteria of miscible CO2 injection.
Furthermore, oil reservoirs with API gravity greater than 22 oAPI, is qualified to meet the technical screening criteria of immiscible CO2 injection with the injection pressure is set to be less than minimum miscible pressure (MMP). Immiscible CO2 flooding is commonly less effective, yet it would still gain more oil recovery than water injection. Besides, CO2 gas source with exceptional quality is paramount, which has minimal-to-no content of water (H2O) nor dry gas.
3.2. Minimum Miscibility Pressure Determination (MMP)
Minimum Miscibility Pressure (MMP) is referred as the lowest pressure where gas is soluble with oil. Minimum miscibility pressure determination of Well J-108 using CO2 gas is carried out with 3 (three) methods, namely using empirical equation, correlation, and laboratory experiments using slimtubes. Oil samples are taken from Well J-108, operating at Layer F (depth: 3927 ft) which has reservoir pressure of 1706 psig, temperature of 201 0F, formation fracture pressure of 2200 psig, with API gravity of 34.29 0API.
Minimum miscibility pressure determined from empirical equation (Equation 1) obtained a value of 2807 psig, whereas the one determined from several correlations, namely Cronquist’s correlation [1], Yellig and Metcalfe correlation [18], and Holm and Josendal correlation [17] is shown in Table 3.
The next step is an experimentation of MMP determination in PPPTMGB ”Lemigas” laboratory carried out by using a slimtubes with 1890 cm in length and 0.64 cm in diameter, filled to the brim with quartz sands which has a permeability around 1 Darcy, then put inside a heater oven. MMP determination using slimtubes in a laboratory is shown in Figure 8 and carried out with procedures as follows:
- Saturating slimtubes with 160 cc of dead oil at similar pressure conditions as when determining MMP.
- Slimtubes then injected with recombined fluids from the oil sample from Well J-108 at the pressure above bubble-point pressure.
- Then, injecting CO2 at similar pressure into the slimtubes. Write down or measure all crucial parameters that occurred during the experiment.
- Injection then stopped after 1.2 PV of injected CO2 is achieved.
- Next step is cleaning out the slimtubes, then all procedures above is repeated with higher injection pressure, and write down or measure all crucial parameters that occurred during the experiment.
- The experiment is concluded when adding more injection pressure does not result in a significant increase of incremental oil recovery.
- Pressure where it does not result in a significant increase of incremental oil recovery can be determined as Minimum Miscibility Pressure (MMP).
- In this experiment, CO2 gas injection is carried out at reservoir temperature of 940C for a variety of injection pressure, which are 2300, 2650, 2750, and 3250 psig.
From this laboratory experiment using slimtubes, we obtained CO2 gas MMP value of 2805 psig with the oil sample from Well J-108. Summary of oil recovery measurement results using slimtubes for a variety of CO2 injection pressure is shown in Table 4 and graphically shown in Figure 9.
Based on Table 4 and Figure 9, we observed that oil recovery when the injection pressure is below MMP, would increase along with the increase of injection pressure. This occurs either in oil recovery at breakthrough, and when injected up to 1.2 pore volume (PV). Then when the injection pressure is already at or above the MMP, adding more injection pressure would only result in relatively minor increase in oil recovery. Hence, in this case, we can conclude that the value of MMP is 2805 psig.
Furthermore, based on the results of MMP determination using empirical equation, it is found at the value of 2807 psig, and from Holm & Josendal Correlation (1974) is found at the value of 2750 psig. Then, it is concluded that the assumptions used in those 2 methods of determining MMP matched the reservoir characteristics of Layer F, since it has the exact same composition and oil type with the sample used in lab experiment. This can be observed from the results of MMP determination based on correlation and empirical equation mimicked the laboratory experiment using slimtubes which resulted in 2805 psig.
3.3. Swelling Test
Swelling test is carried out using PVT cell, where recombined fluids are injected and conditioned at reservoir temperature of 201OF. Then, an analysis of pressure-volume relationship is carried out to determine bubble-point pressure from various levels of pressure up until bubble-point pressure of 410 psig is achieved. Next step, a certain amount of CO2 is injected into the PVT cell, CO2 volume is then recorded, then repeating the same pressure-volume analysis to determine bubble-point pressure. This process is repeated 4 (four) times, with adding the amount of injected CO2. Injected CO2 volume increase surely would increase the oil swelling occurrence, as it would on bubble-point pressure. This injection process is then continued up to the point where the bubble-point pressure is on the verge of minimum miscible pressure. Results of this swelling test is tabulated in Table 5 for swelling factor and CO2 solubility. Changes in reservoir fluid composition during CO2 injection is shown in Table 6. A correlation between swelling factor and saturation pressure is shown graphically in Figure 10, whereas a correlation between saturation pressure and injected CO2 mole percentage is shown in Figure 11.
From Table 5 its shows that during CO2 injection up to 46.82% mole, bubble-point pressure increased gradually from 410 psig to 2200 psig, and swelling factor also increased from 1.0 to 1.442. With the increase of CO2 injection and saturation pressure, followed by the increasing amount of CO2 soluble in oil; would cause a decrease in oil density, so then oil volume expansion would occur more, indicated by the increase of swelling factor number, as shown in Figure 10. This also meant that the bigger the amount of CO2 dissolved in hydrocarbon, would incur an increase of CO2 concentration (% mol) and changes in fluid composition, mainly the amount of C7+ would decrease, as shown in Table 6 and Figure 11.
4. Conclusions
Based on the results of the analysis and discussion that has been thoroughly executed, the conclusions can withdraw as follows:
- The magnitude of the minimum miscible pressure (MMP) between J-108 oil and CO2 gas based on the empirical equation is 2807 Psig; Cronquist correlation is 2301 Psig; Yellig and Metcalfe is 2490 Psig; Holm and Josendal is 2750 Psig, while based on measurements in the laboratory using a slimtube is 2805 Psig.
- Factors that affect the miscibility of CO2 gas with oil are CO2 purity, oil composition, temperature, and depth.
- The swelling test during the CO2 gas injection process up to 46.82% mole and bubble pressure conditions increased gradually from 410 Psig to 2200 Psig, it was found that the swelling factor increased from 1.0 to 1.442.
- Based on the magnitude of the formation fracture pressure in the Layer F of 2200 Psig and MMP of 2805 Psig, in its application in the Layer F of KHL Field, CO2 gas injection can only be implemented in an immiscible flooding.
Author Contributions
Conceptualization, D.K; methodology, D.K, and HYD; validation, D.K., HYD. and L.A.Y.; formal analysis, D.K, and HYD; investigation, D.K., HYD, and L.A.Y; resources, D.K and L.A.Y; data curation, D.K, HYD, and L.A.Y; writing—original draft preparation, D.K.; writing—review and editing, D.K.; visualization, D.K, and HYD; supervision, L.A.Y.; project administration, HYD. All authors have read and agreed to the published version of the manuscript.
Funding
This research received no external funding.
Data Availability Statement
The data presented in this study are available upon request from the corresponding author.
Acknowledgments
The authors would like to thanks the Petroleum Engineering Department, Faculty of Mineral Technology Universitas Pembangunan Nasional "Veteran" Yogyakarta for their support and PPPTMGB "Lemigas" Jakarta for helping and facilitating the implementation of research in the laboratory.
Conflicts of Interest
The authors declare no conflict of interest.
References
- Stalkup, F.I. Jr., Miscible Displacement. Monograph Series, Volume 8, Society of Petroleum Engineers (SPE) of AIME, Dallas, Texas, USA, 1983.
- LPPM UPN “Veteran” Yogyakarta., Feasibility study of CO2 flooding in Pertamina EP Region Jawa. Yogyakarta, 2011.
- Muslim, A., et al., Opportunities and challenges of CO2 flooding implementation in Indonesia. SPE Asia Pacific Oil and Gas Conference and Exhibition, 2013.
- Chae, K.S., and Lee, J.W., Risk analysis and simulation for geologic storage of CO2. Proceedings of the World Congress on Advances in Civil, Environmental, and Materials Research, Incheon, Korea, 2015.
- Lee, Y.L. et al., Overview of CO2-EOR operation plan of Meruap Field. Proceedings of the World Congress on Advances in Civil, Environmental, and Materials Research, Incheon, Korea, 2015.
- Abdurrahman, M., et al., EOR in Indonesia: past, present, and future. International Journal of Oil, Gas and Coal Technology 16.3, 2017, p. 250-270.
- Suarsana, I.P., Producing high CO2 gas content reservoirs in Pertamina Indonesia using multi stage cryogenic process. SPE Asia Pacific Oil and Gas Conference and Exhibition. Society of Petroleum Engineers, 2010.
- Rostami, A., et al., Modeling of CO2 solubility in crude oil during carbon dioxide enhanced oil recovery using gene expression programming. Journal of Fuel 210, 2017, p. 768-782. [CrossRef]
- Abdassah, D., Siregar, S., and Kristanto, D., The potential of carbon dioxide gas injection application in improving oil recovery. Society of Petroleum Engineers International Oil and Gas Conference, China, 2000.
- Miller, J.S., and Ray, A.J., A laboratory study to determine physical characteristics of heavy oil after CO2 saturation. SPE/DOE Enhanced Oil Recovery Symposium. Society of Petroleum Engineers, 1981.
- Barclay, T.H., and Srikanta, M., New correlations for CO2-Oil solubility and viscosity reduction for light oils. Journal of Petroleum Exploration and Production Technology, 2016. p. 815-823.
- Wellker, J.R., and Dunlop, D.P., Physical properties of carbonate oil. Society of Petroleum Engineers (SPE) of AIME, August. Dallas, Texas, USA, 1963.
- 13. Simon, R and Graue, G.D., Generalized correlation for predicting solubility swelling and behaviour CO2-Crude oil system. Society of Petroleum Engineers (SPE) of AIME, January, Dallas, Texas, USA, 1965.
- Emera, M., and Sarma, H.K., A genetic algorithm-based model to predict CO2-oil physical properties for dead-live oil. International Petroleum Conference of Canada. Petroleum Society of Canada, 2006. [CrossRef]
- Leach, M.P., and Yellig, W.F., Compositional model studies CO2 oil displacement mechanisms. Journal of Society of Petroleum Engineers 21.01, 1981, p. 89-97. [CrossRef]
- Yellig, W.F., Carbon dioxide displacement of West Texas reservoir oil. Society of Petroleum Engineers Journal 22.06, 1982. p. 805-815. [CrossRef]
- Holm, L.W., and Josendal, V.A., Mechanisms of oil displacement by carbondioxide. Journal of Petroleum Technology 26.12, 1974, p. 419-427.
- Yellig, W.F., and Metcalfe, R., Determination and prediction of CO2 minimum miscibility pressure. Society of Petroleum Engineers (SPE) of AIME 7477, 1980. [CrossRef]
- Mungan, N., Carbon dioxide displacement fundamentals, Society of Petroleum Engineers of AIME, Dallas, Texas, USA, 1981.
- Sohrabi, M, and Alireza, E., Novel Insights into the Pore-Scale Mechanisms of Enhanced Oil Recovery by CO2 Injection. SPE Europec/EAGE Annual Conference. Society of Petroleum Engineers, 2012.
- Klins, M.A., Carbondioxide flooding: Basic mechanisms and project design. Reidel Publishing Company, Boston, USA, 1984.
- Taber, J.J., Martin, F.D., and Seright, R.S., EOR screening criteria revisited-Part 1: Introduction to screening criteria and enhanced oil recovery field projects. Society of Petroleum Engineers Reservoir Engineering, August, Tulsa, Oklahoma, 1997.
Figure 1.
Temperature vs minimum miscible pressure correlation of Yellig and Metcalfe [18].
Figure 1.
Temperature vs minimum miscible pressure correlation of Yellig and Metcalfe [18].
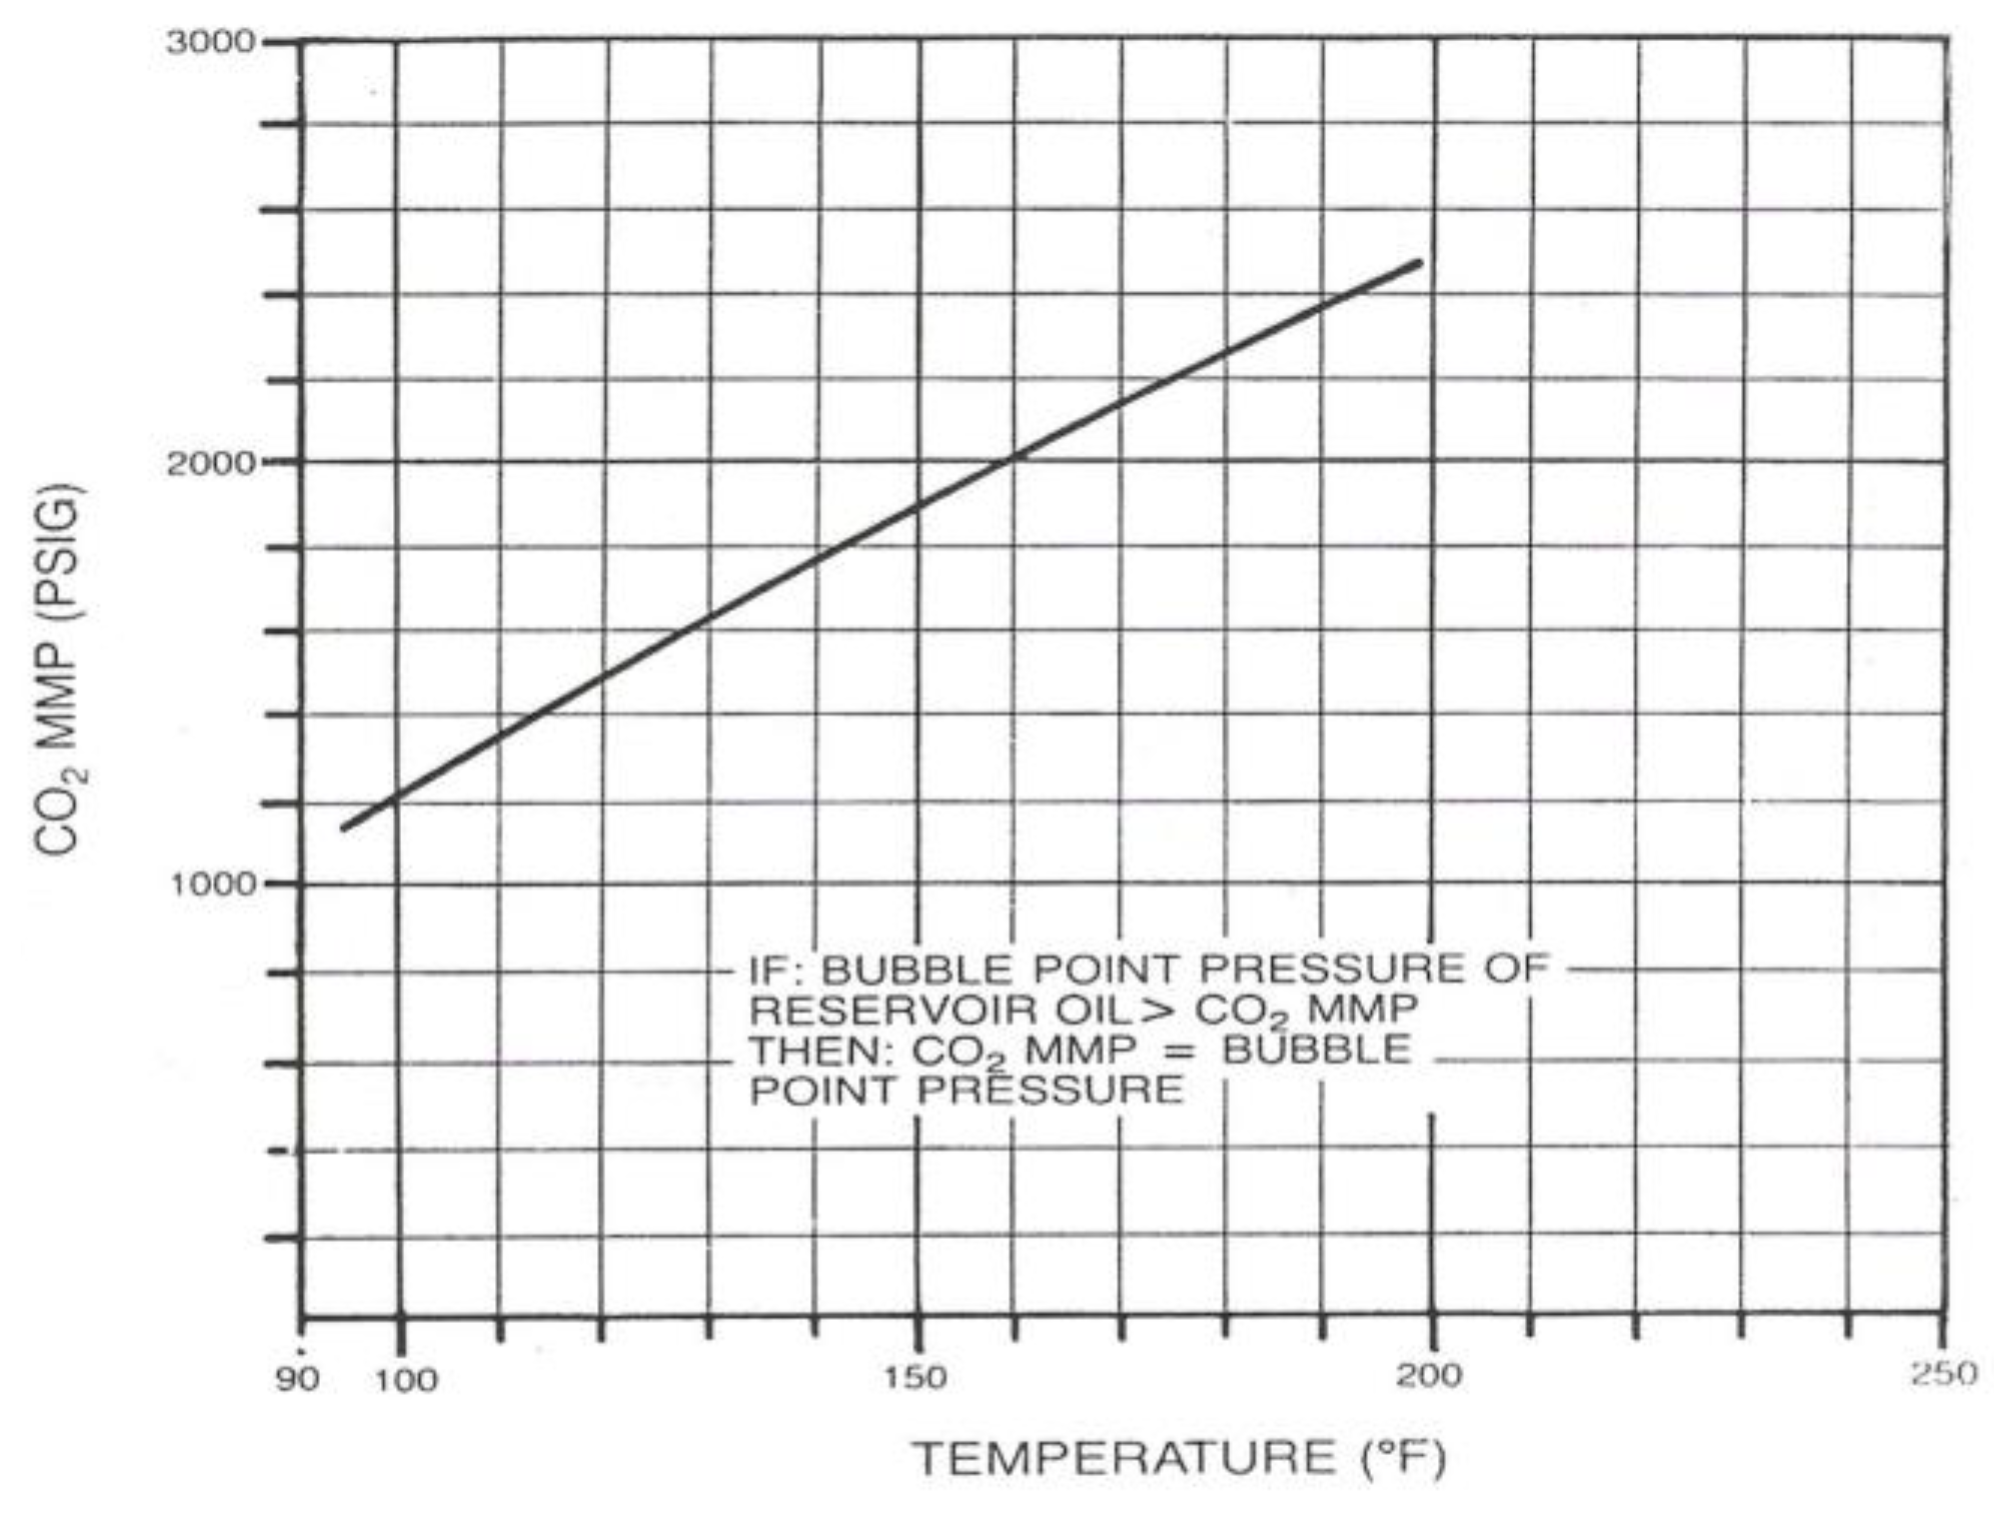
Figure 2.
Minimum miscible pressure correlation of CO2 injection as a function of temperatur from Mungan [19].
Figure 2.
Minimum miscible pressure correlation of CO2 injection as a function of temperatur from Mungan [19].
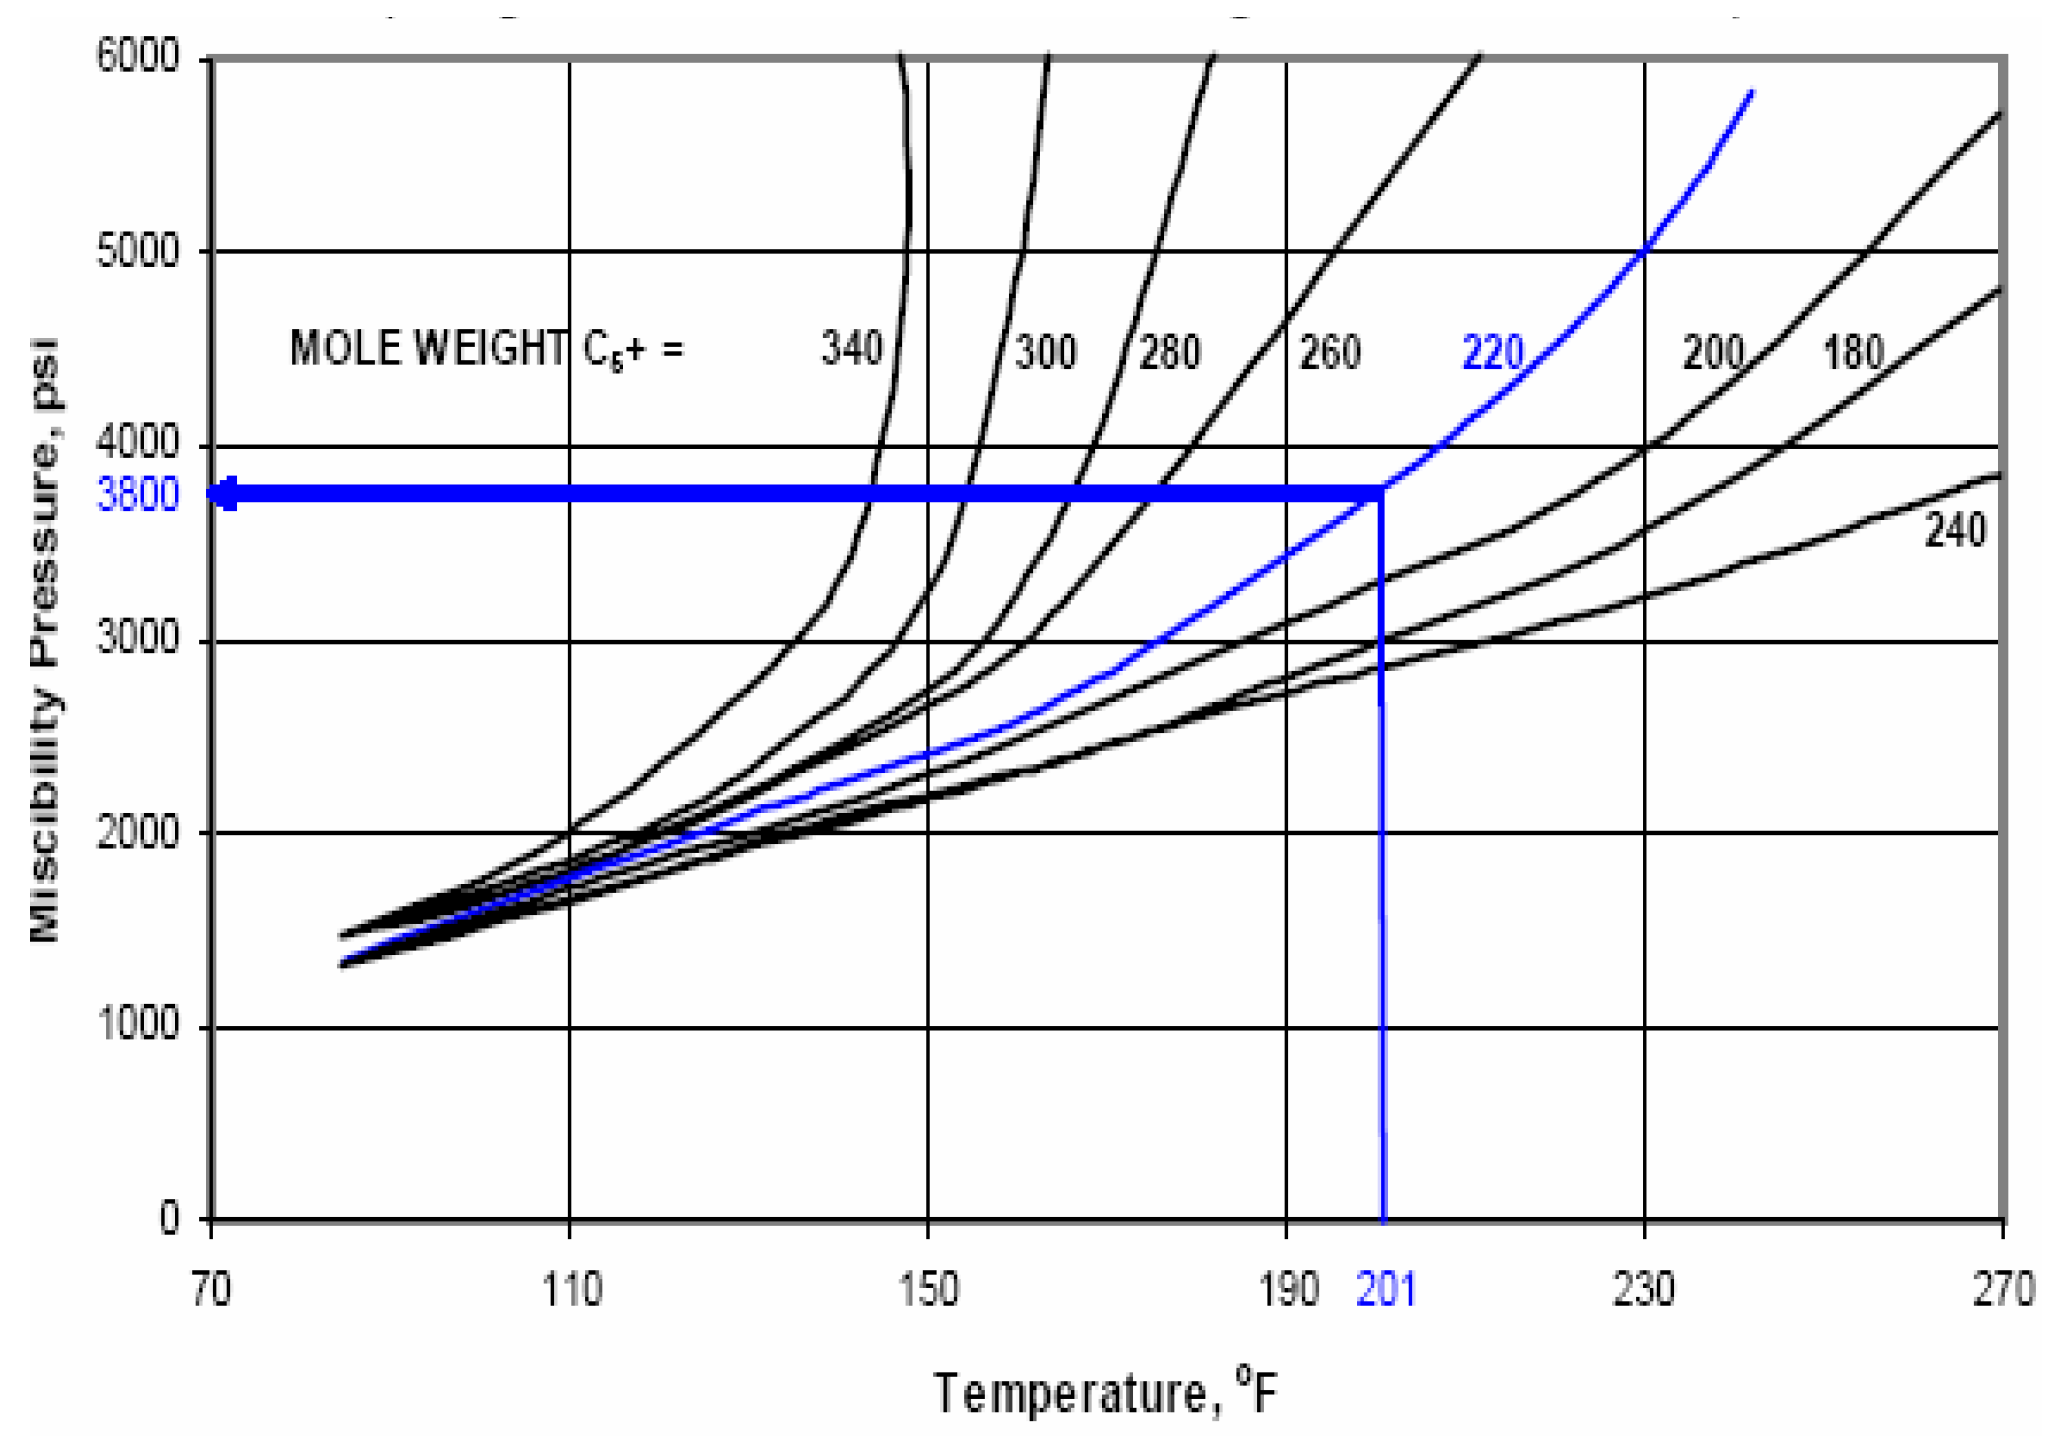
Figure 3.
Minimum miscible pressure correlation of CO2 injection from Holm & Josendal [17] and Yellig [16].
Figure 4.
Minimum miscible pressure correlation of CO2 injection from Holm, Josendal, and Mungan [1].
Figure 4.
Minimum miscible pressure correlation of CO2 injection from Holm, Josendal, and Mungan [1].
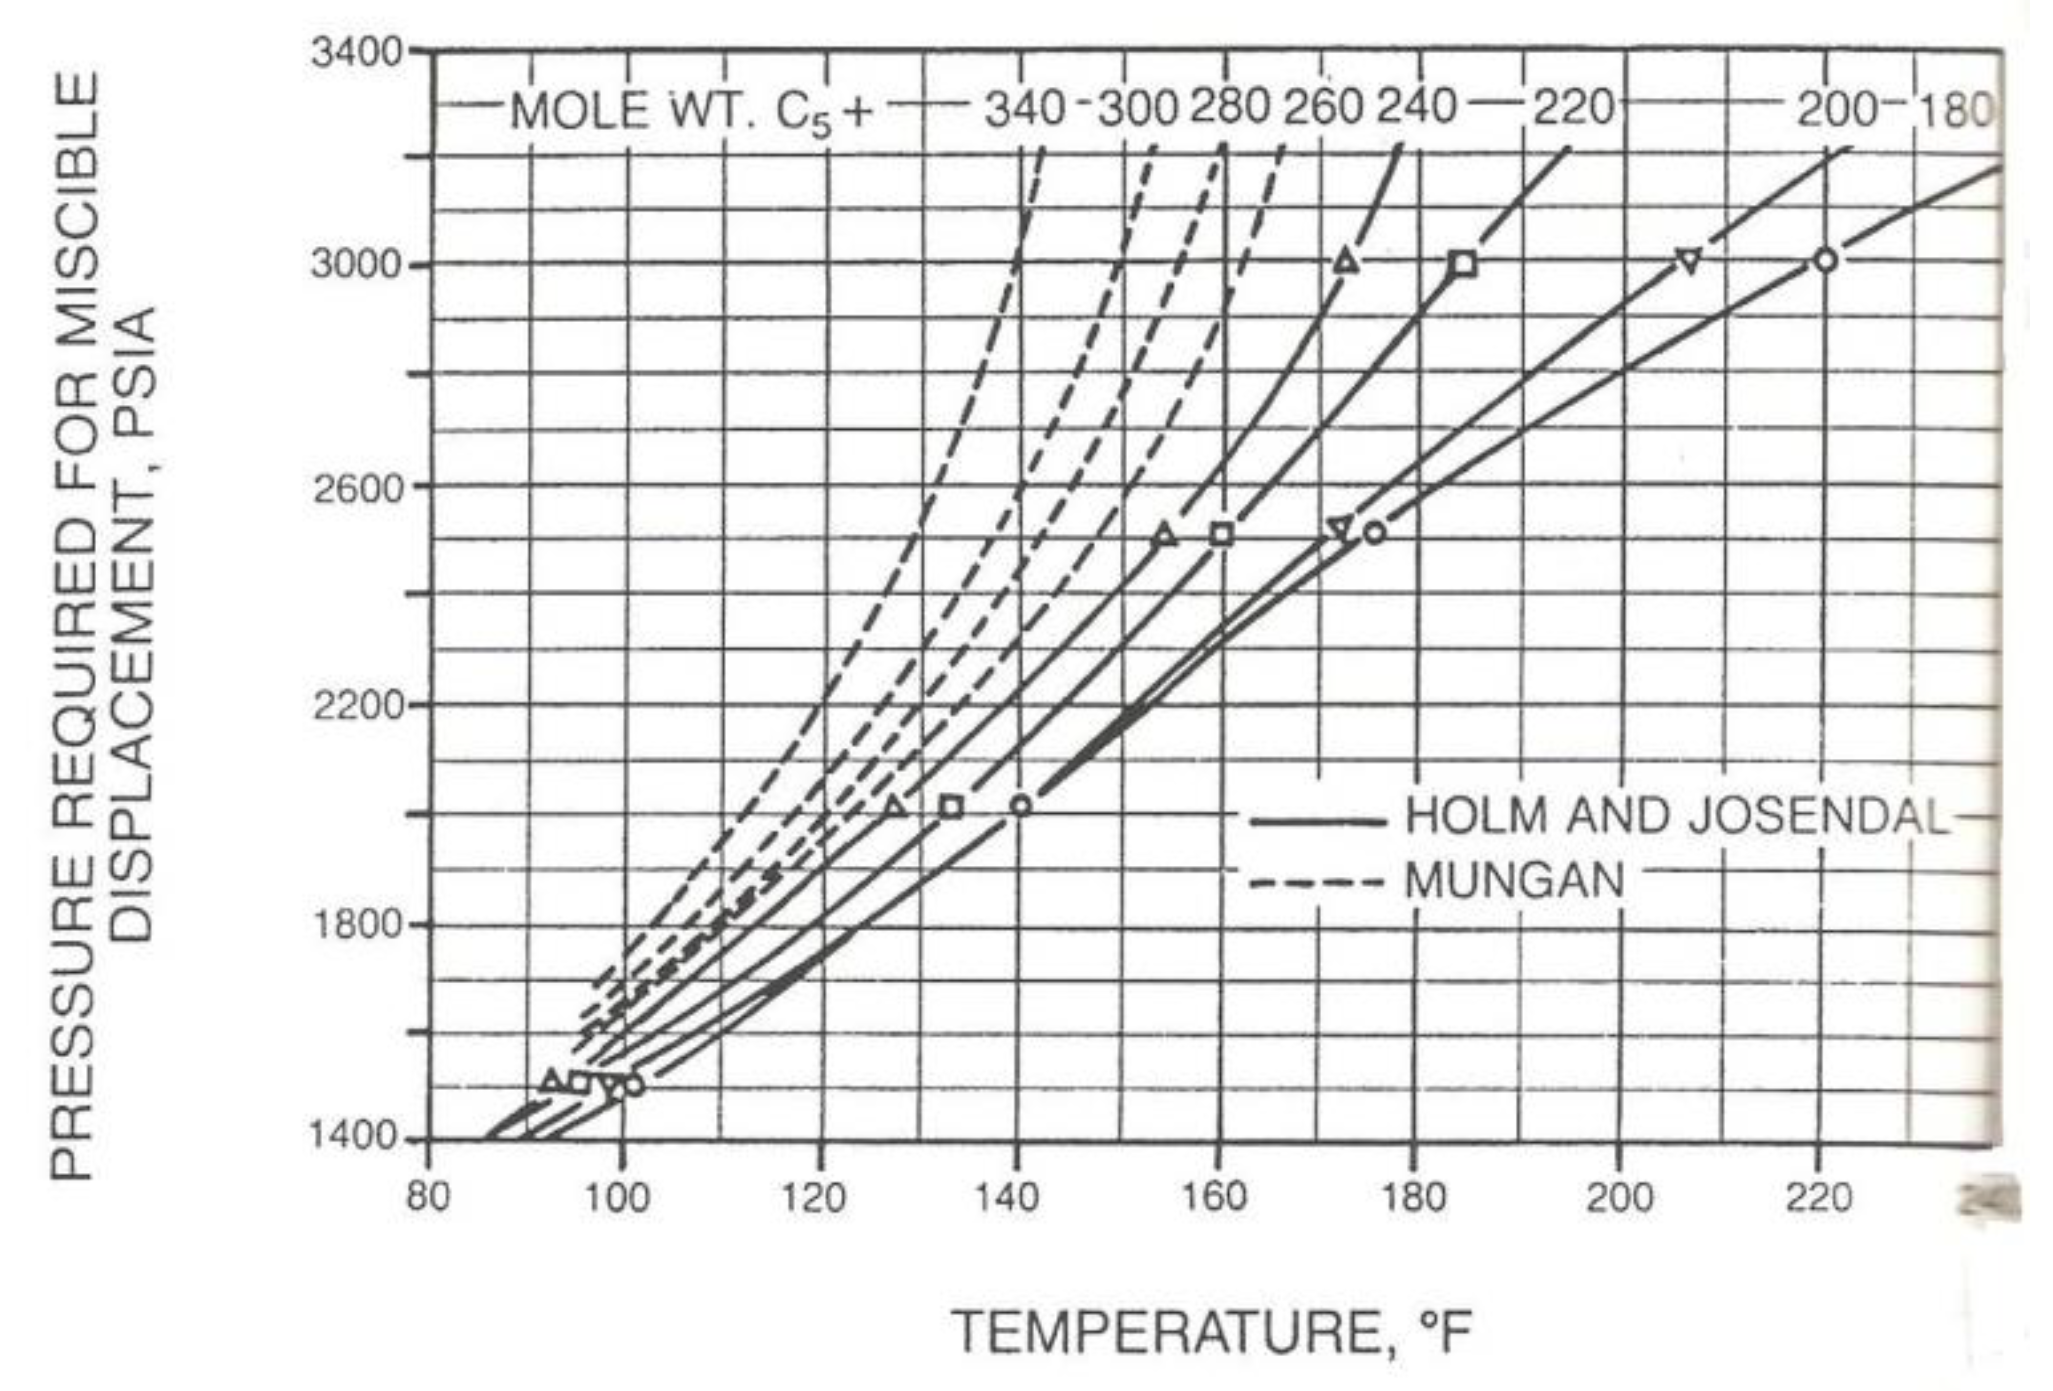
Figure 5.
Schematic of Slimtube apparatus [1].
Figure 5.
Schematic of Slimtube apparatus [1].
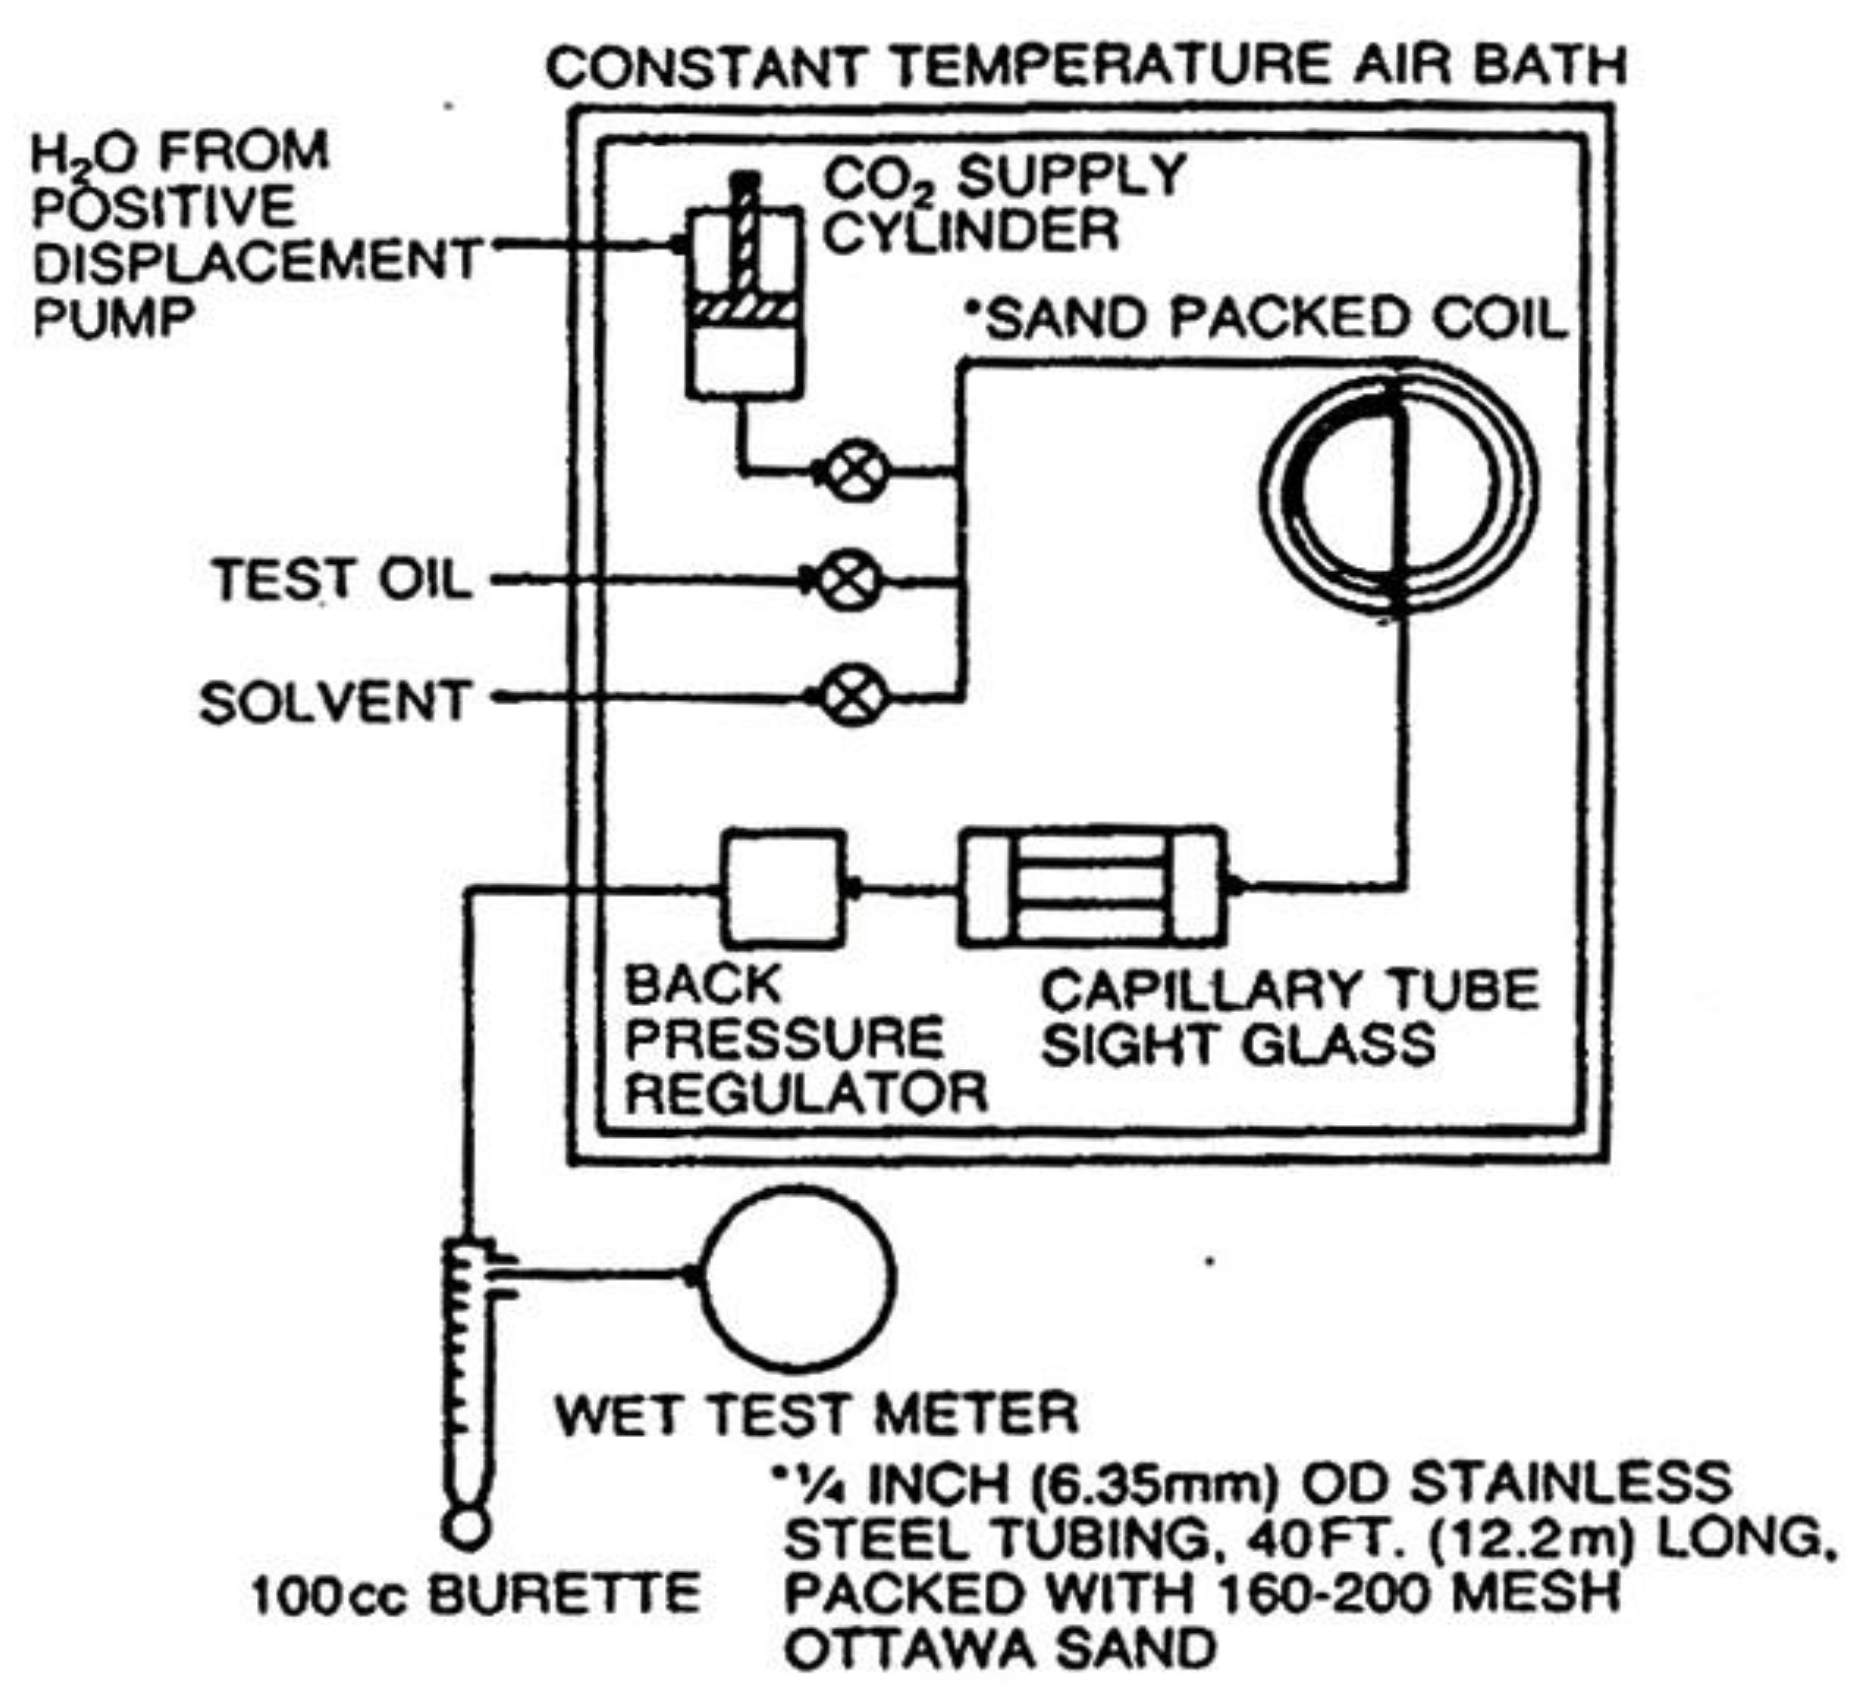
Figure 6.
MMP determination on CO2-Oil displacement [1].
Figure 6.
MMP determination on CO2-Oil displacement [1].
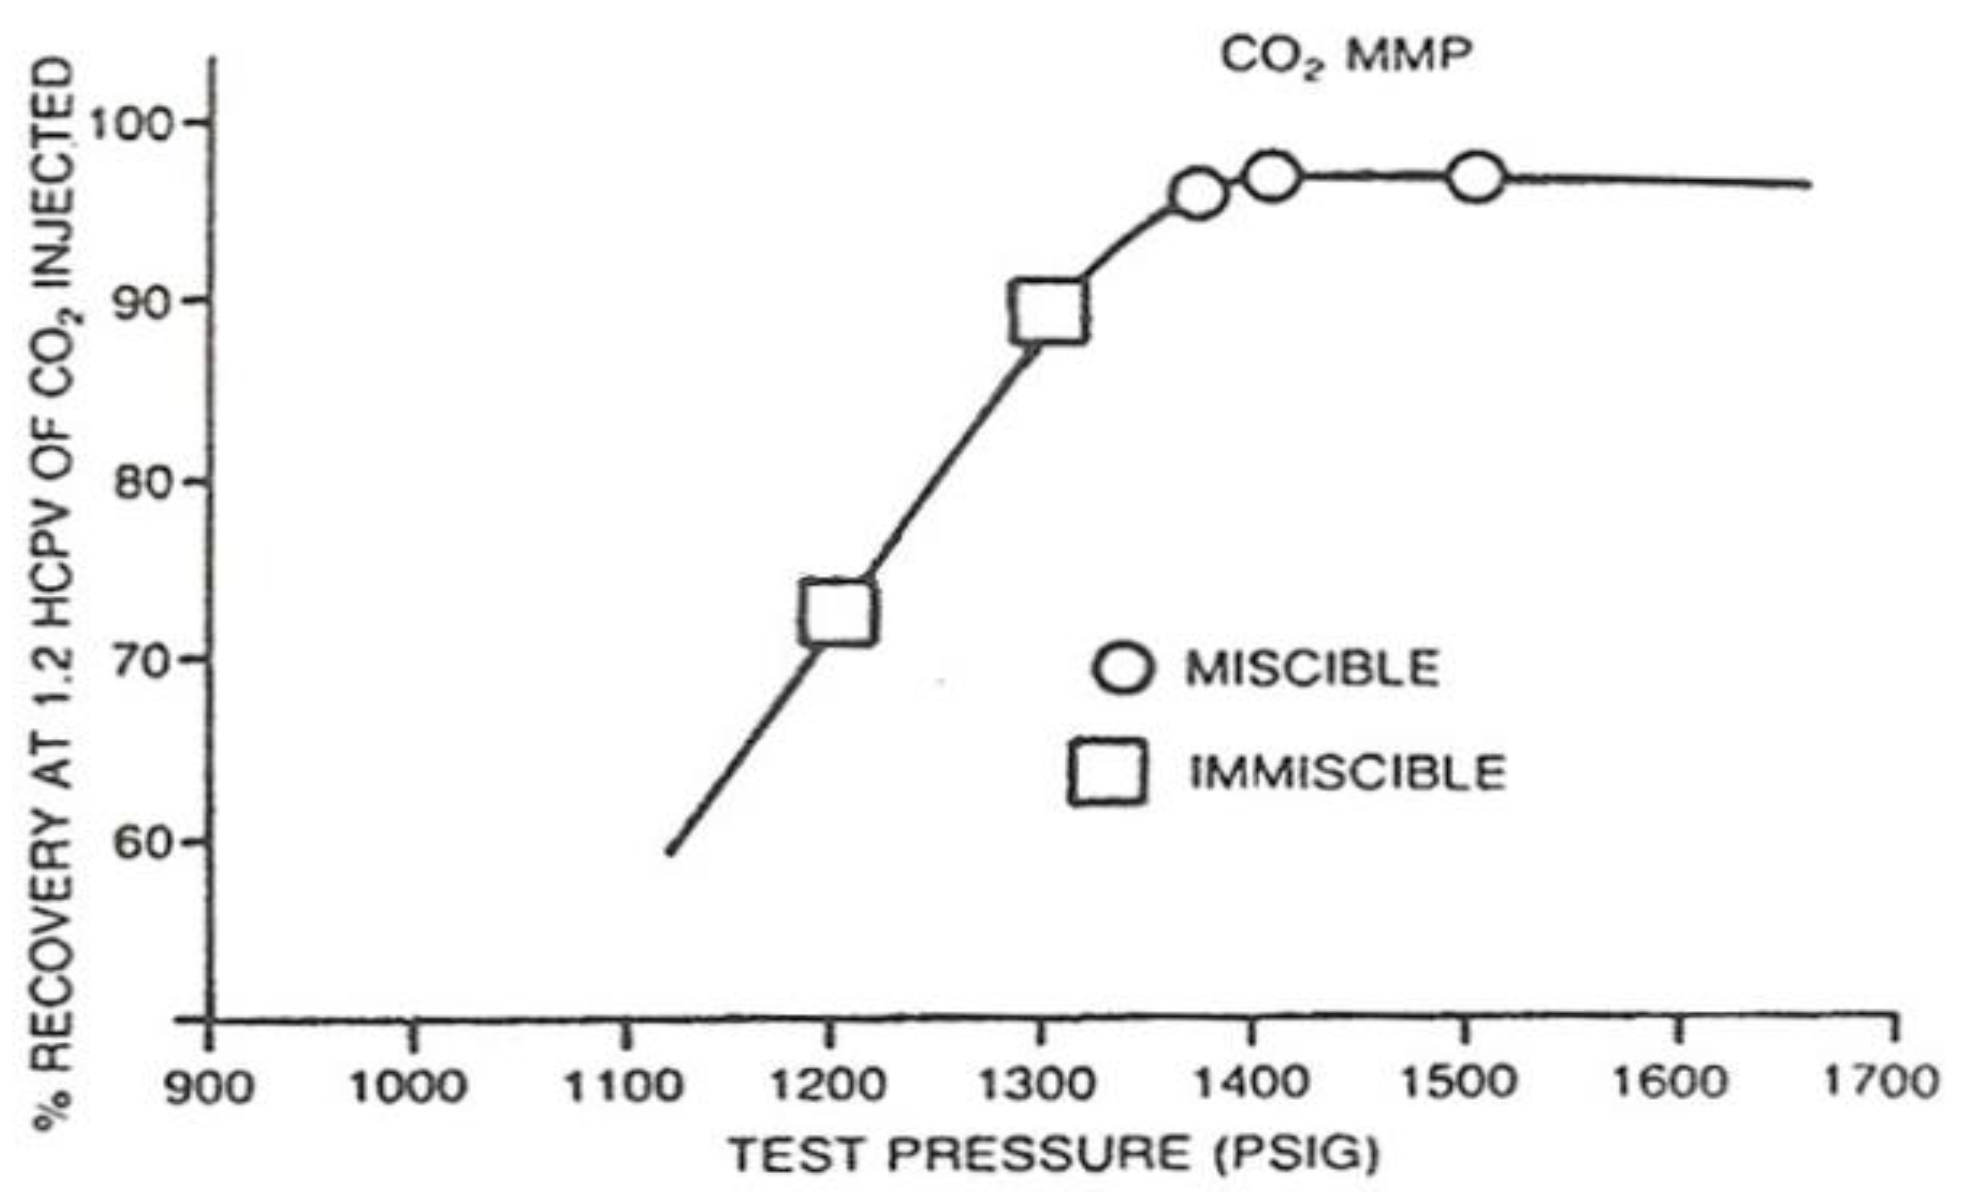
Figure 7.
Swelling factor vs CO2 mole fraction [12].
Figure 7.
Swelling factor vs CO2 mole fraction [12].
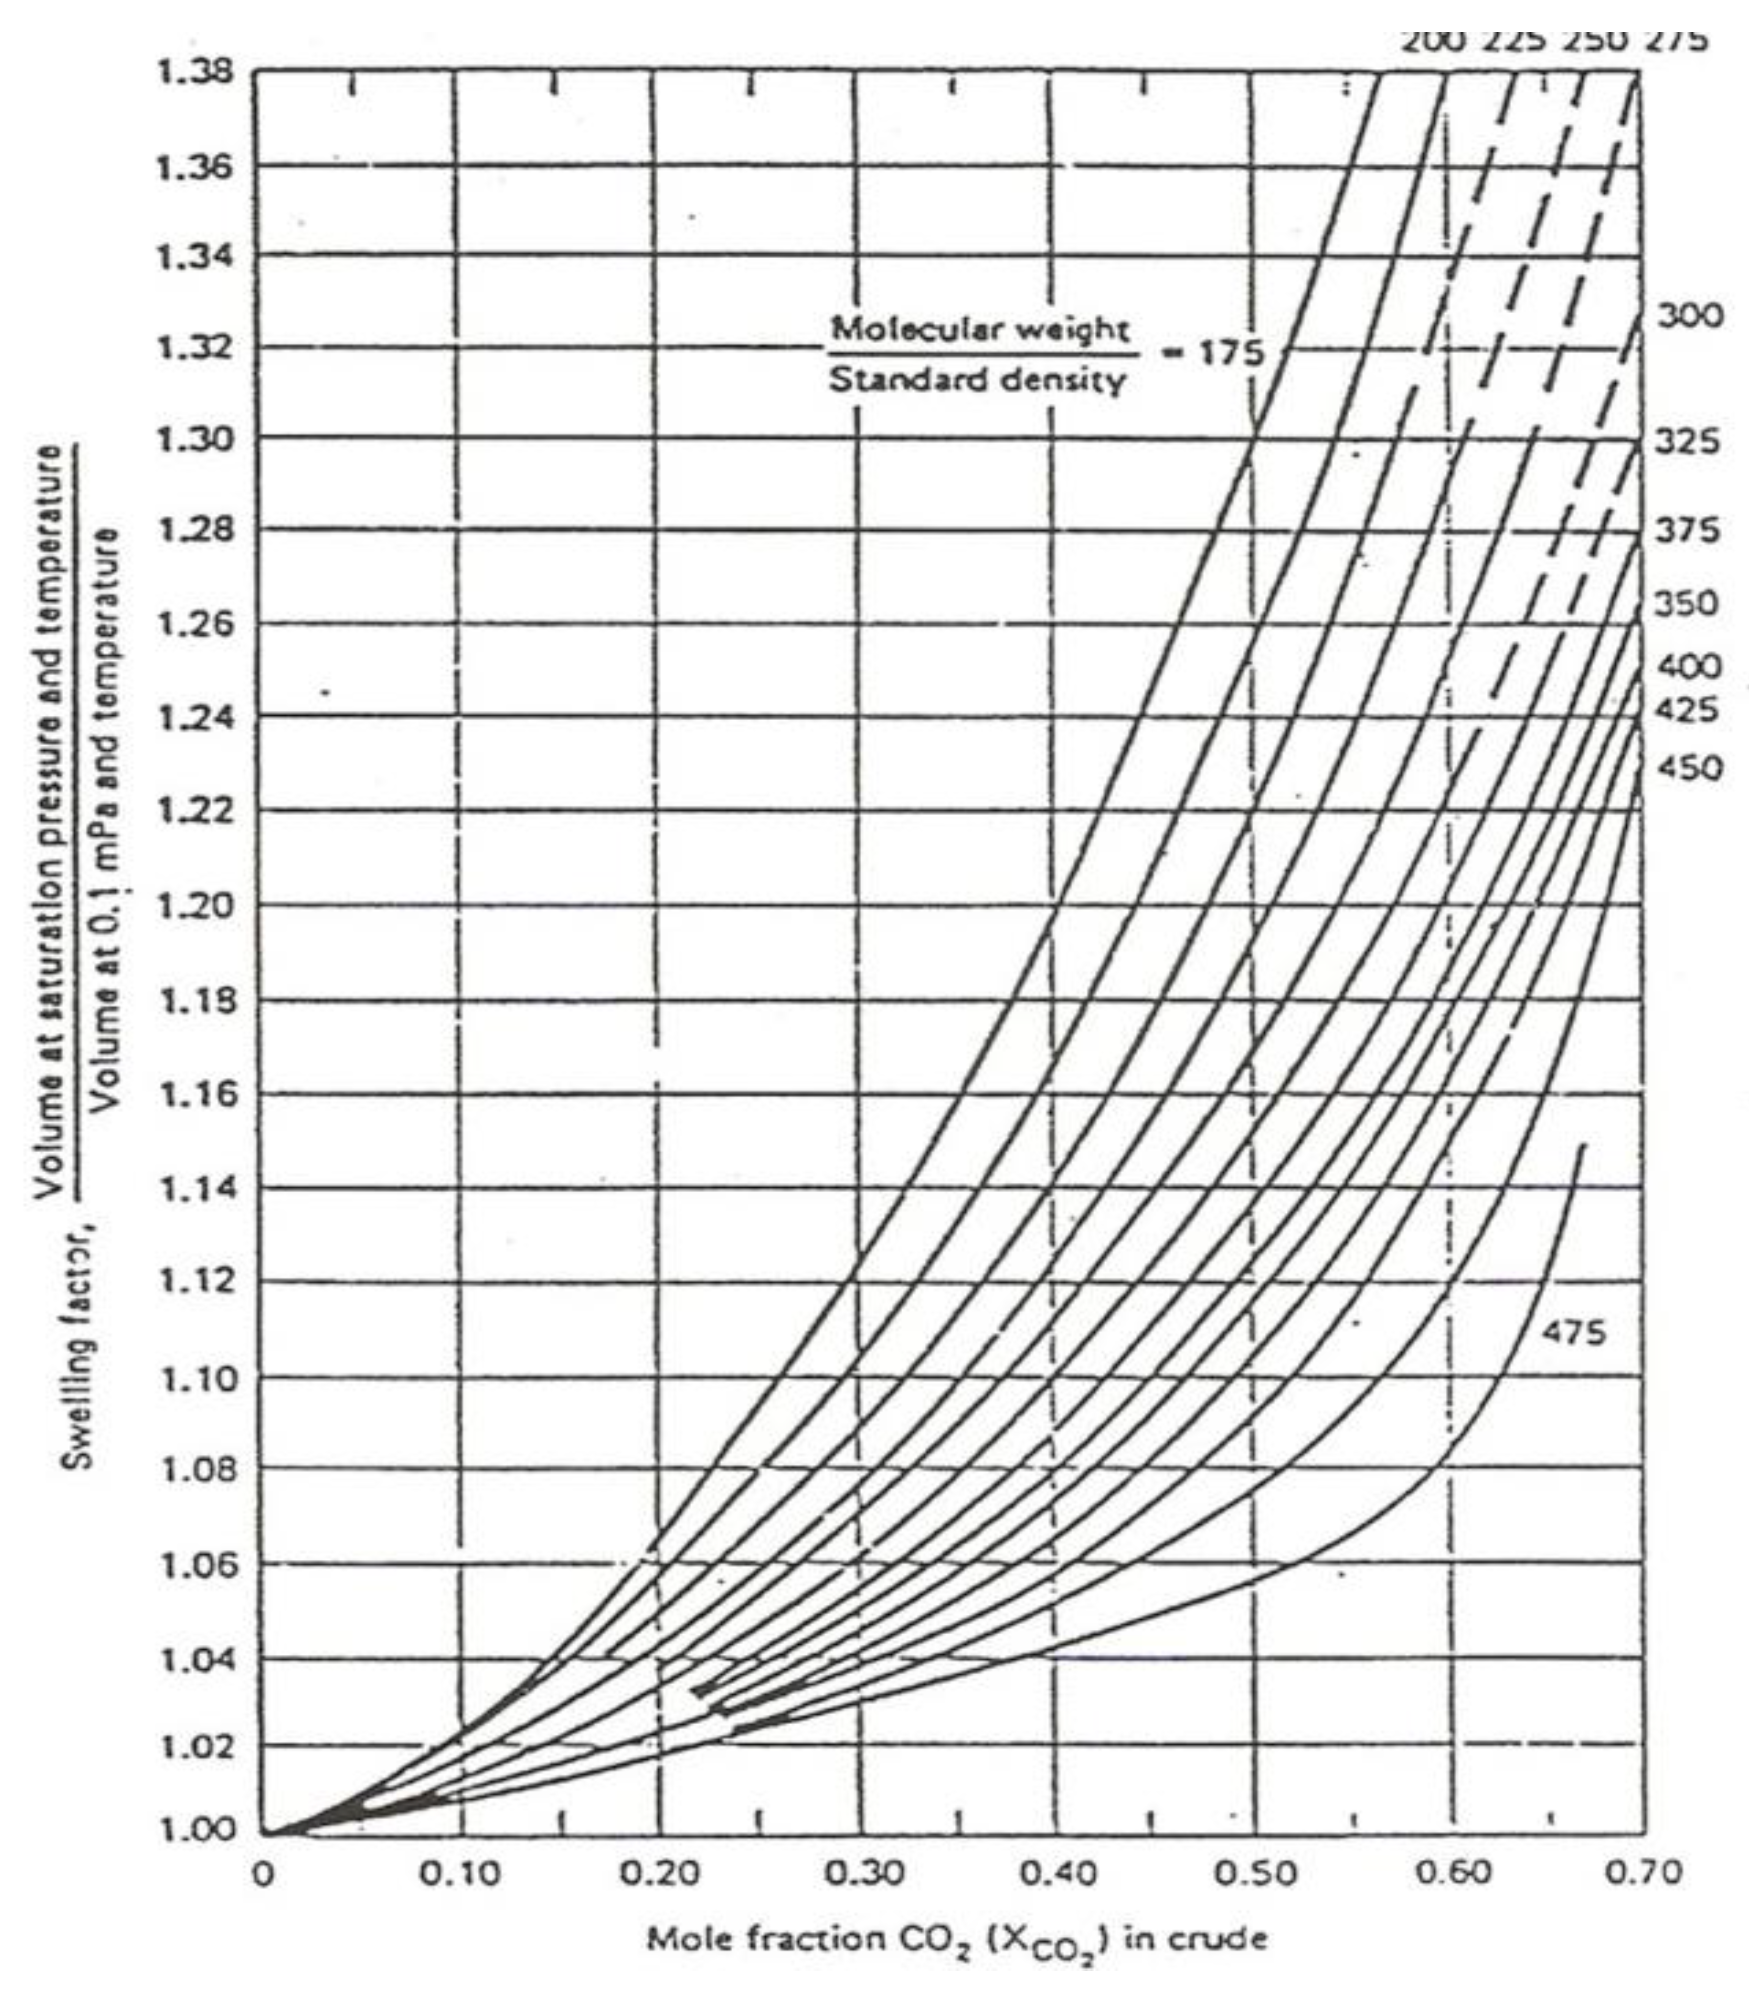
Figure 8.
MMP determination apparatus in laboratory using slimtubes.
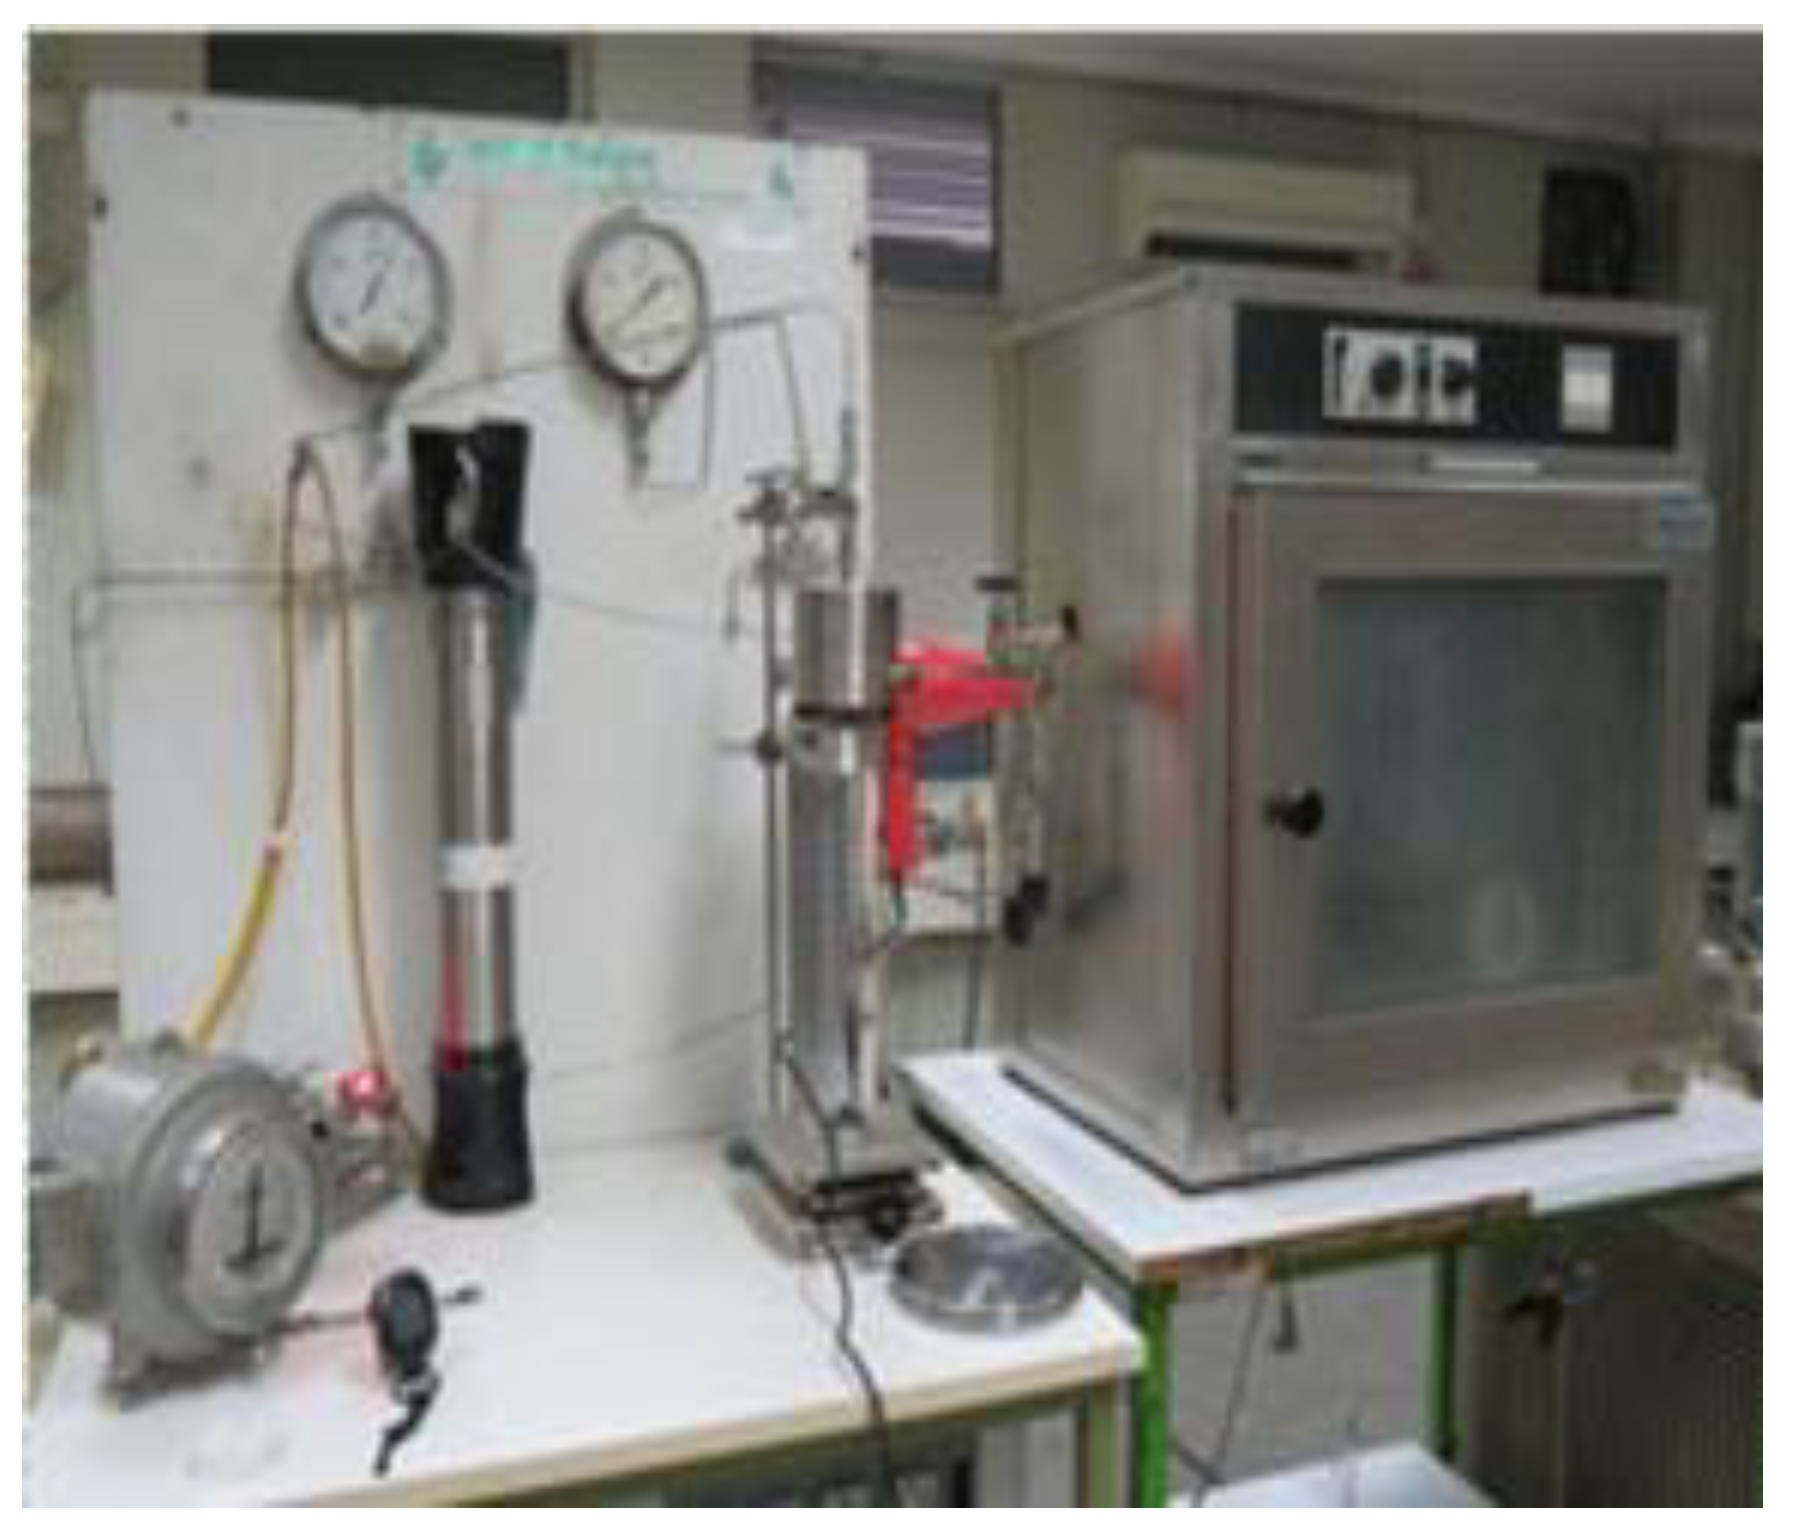
Figure 9.
Plot of MMP tetermination results using slimtubes in laboratory.
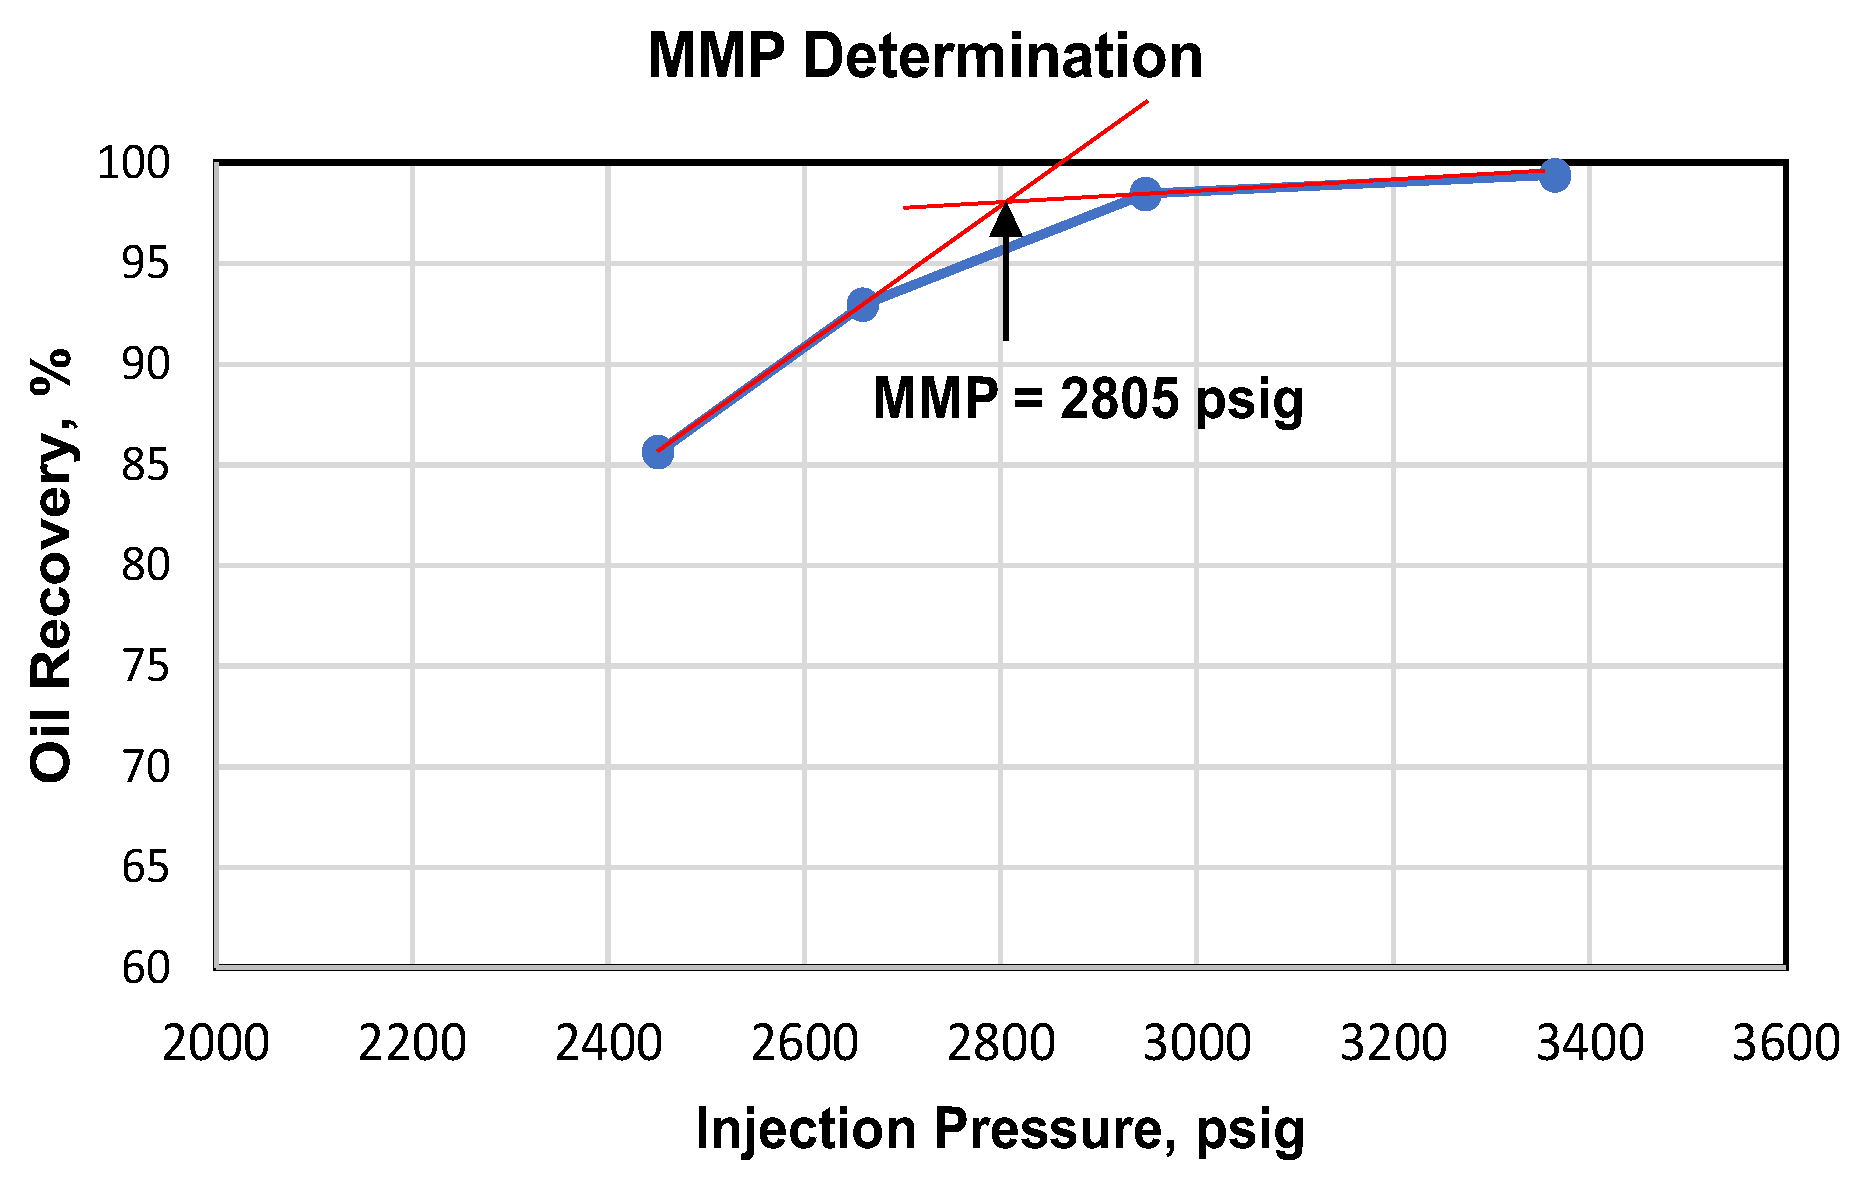
Figure 10.
Correlation results of swelling factor to saturation pressure.
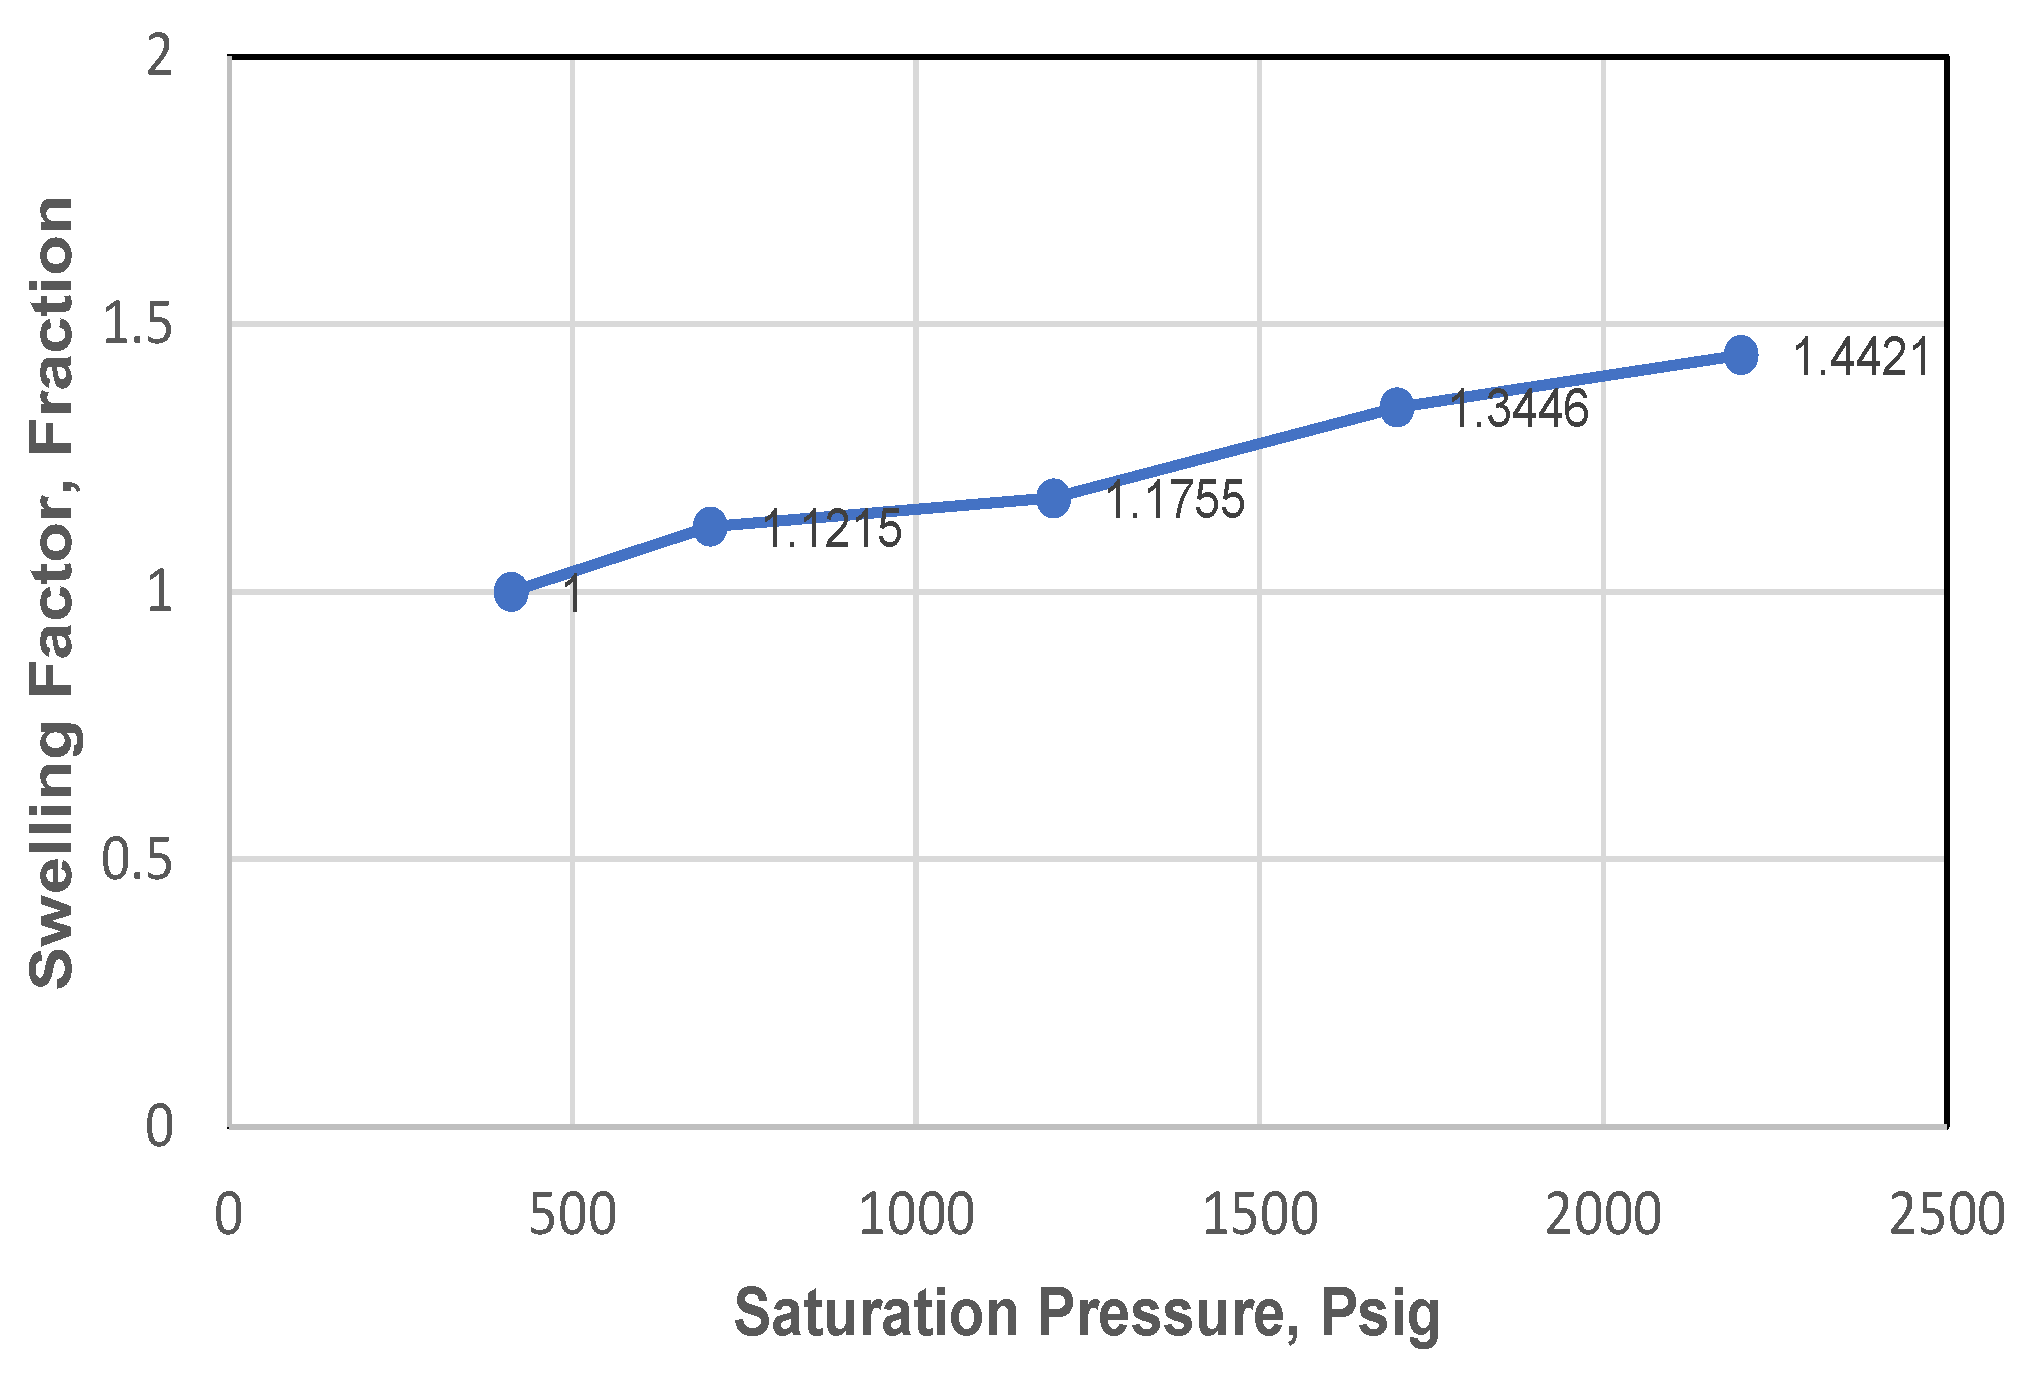
Figure 11.
Correlation results of saturation pressure vs injected CO2 mol %.
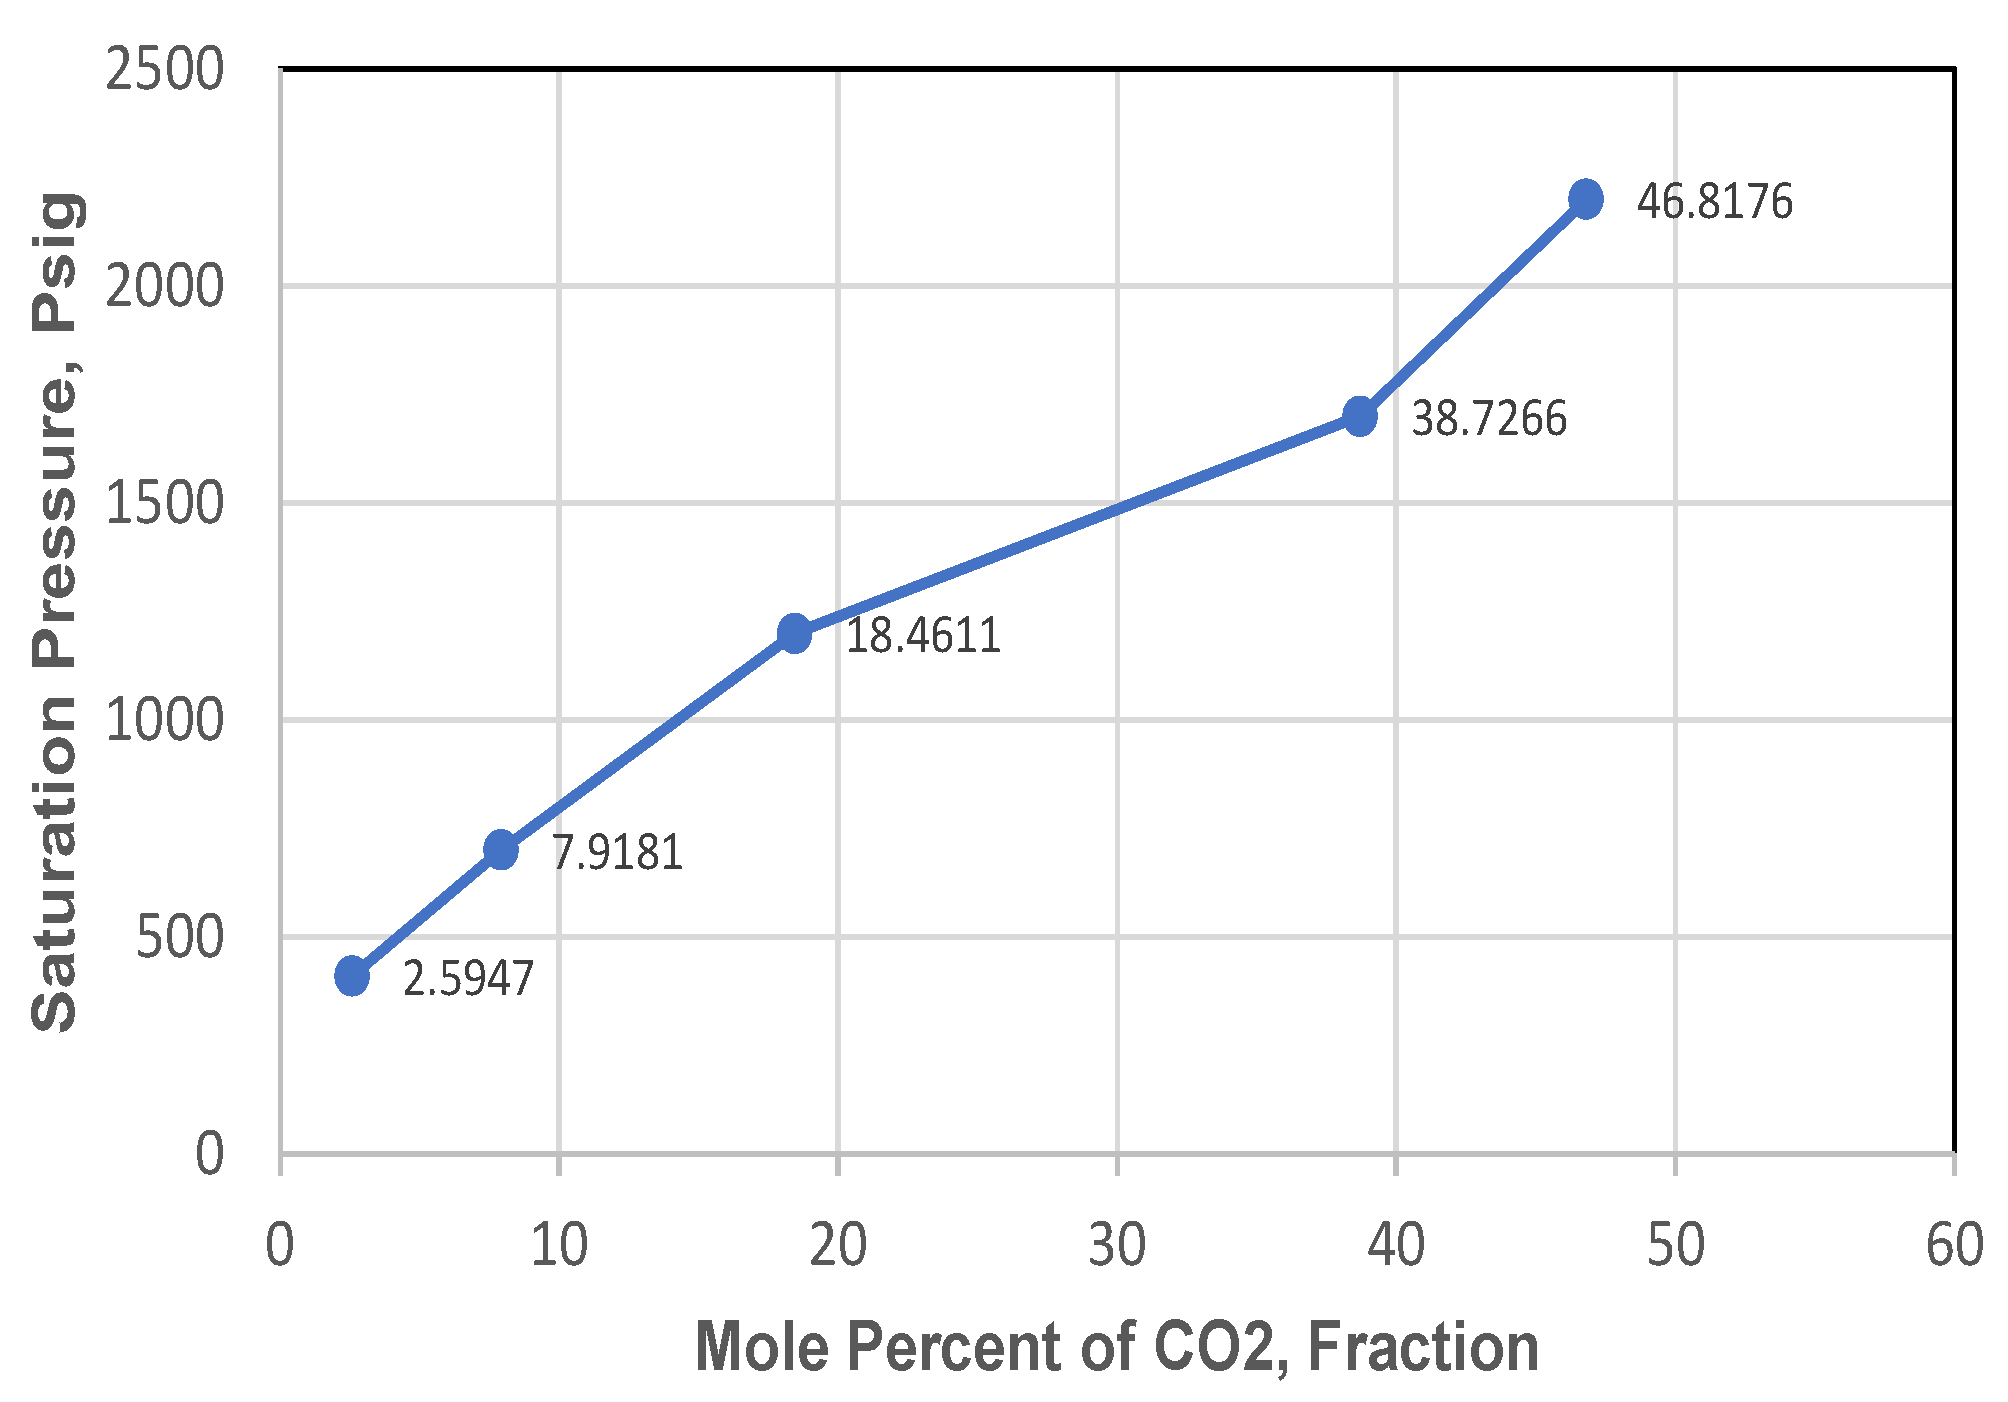

Table 1.
Screening Criteria of EOR Methods [22].
Table 1.
Screening Criteria of EOR Methods [22].
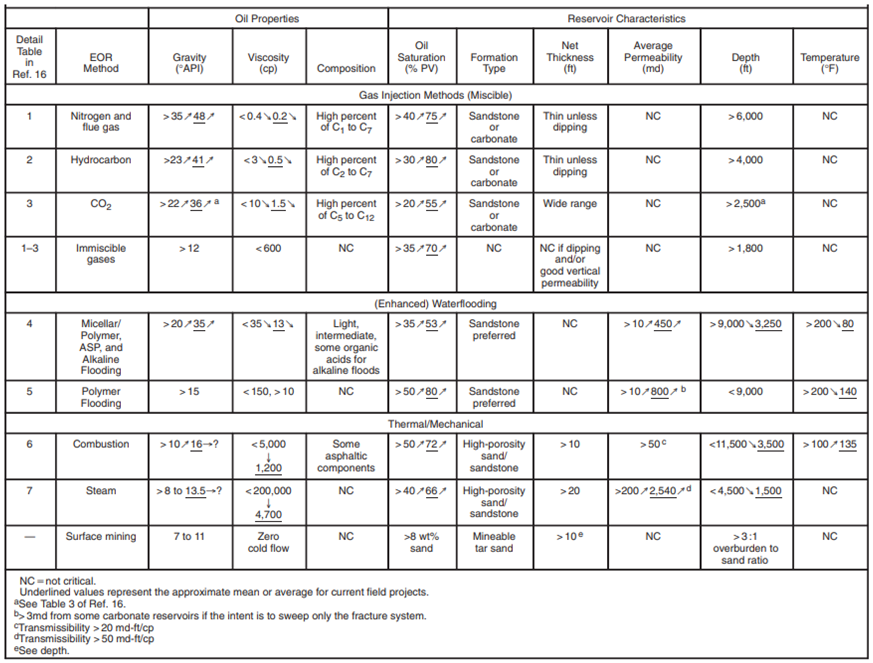
Table 2.
Screening criteria result of CO2 flooding in Layer F of KHL Field based on Taber, J. J., Martin, F. D., dan Seright, R.S. [22].
Table 2.
Screening criteria result of CO2 flooding in Layer F of KHL Field based on Taber, J. J., Martin, F. D., dan Seright, R.S. [22].
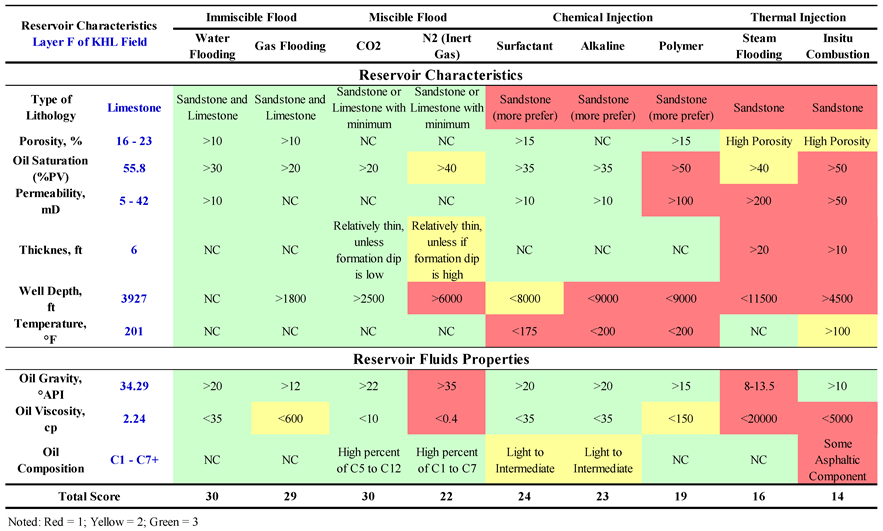
Table 3.
MMP determination results based on correlations.
| Correlations | Minimum Miscibility Ptessure, Psig |
|---|---|
| Cronquist (Stalkup, 1983) Yellig & Metcalfe (1980) Holm & Josendal (1974) |
2301 2490 2750 |
Table 4.
Oil recovery results using slimtubes in laboratory.
| Injection Pressure, Psig | Oil Recovery prior to Breakthrough, % |
Total Oil Recovery, % |
|---|---|---|
| 2451.02 | 78.45 | 85.64 |
| 2659.52 | 80.27 | 92.96 |
| 2947.55 | 96.62 | 98.47 |
| 3364.98 | 97.04 | 99.41 |
Table 5.
Experiment results of oil swelling test.
| Reservoir System | CO2 Injection, SCF/STB | Saturation Pressure, psig | CO2 Solubility, SCF/BBL Reservoir *) | Swelling Factor, Fraction **) |
|---|---|---|---|---|
| Original Reservoir Oil | 0.00 | 410 | 0.00 | 1.00 |
| CO2 / Oil System I | 104.61 | 700 | 130.35 | 1.1215 |
| CO2 / Oil System II | 219.39 | 1200 | 253.22 | 1.1755 |
| CO2 / Oil System III | 556.74 | 1700 | 615.22 | 1.3446 |
| CO2 / Oil System IV | 763.83 | 2200 | 836.77 | 1.4421 |
*) at current reservoir condition; **) Ratio of volume at saturation pressure.
Table 6.
Experiment results of changes in reservoir fluids composition.
| Components | Original Reservoir Oil Mol % | CO2 / Oil System I Mol % |
CO2 / Oil System II Mol % |
CO2 / Oil System III Mol % |
CO2 / Oil System IV Mol % |
|---|---|---|---|---|---|
| Hydrogen Sulfide (H2S) Carbon Dioxide (CO2) Nitrogen (N2) Methane (C1) Ethane (C2) Propane (C3) Iso-Butane (i-C4) n-Butane (n-C4) Iso-Pentane (i-C5) n-Pentane (n-C5) Hexane (C6) Heptane plus (C7+) |
0.0000 2.5947 0.2457 4.8792 0.5293 0.8971 0.3658 0.6585 0.6642 0.6722 2.2972 86.1961 |
0.0000 7.9181 0.3793 4.3542 0.4859 1.5529 0.6937 1.6353 1.3658 1.7831 3.4126 76.4191 |
0.0000 18.4611 0.3359 3.8557 0.4303 1.3751 0.6142 1.4480 1.2094 1.5790 3.0218 67.6695 |
0.0000 38.7266 0.2524 2.8974 0.3233 1.0333 0.4616 1.0881 0.9088 1.1865 2.2708 50.8512 |
0.0000 46.8176 0.2191 2.5148 0.2806 0.8969 0.4006 0.9445 0.7888 1.0299 1.9710 44.1362 |
| Total | 100.0000 | 100.0000 | 100.0000 | 100.0000 | 100.0000 |
Disclaimer/Publisher’s Note: The statements, opinions and data contained in all publications are solely those of the individual author(s) and contributor(s) and not of MDPI and/or the editor(s). MDPI and/or the editor(s) disclaim responsibility for any injury to people or property resulting from any ideas, methods, instructions or products referred to in the content. |
© 2023 by the authors. Licensee MDPI, Basel, Switzerland. This article is an open access article distributed under the terms and conditions of the Creative Commons Attribution (CC BY) license (http://creativecommons.org/licenses/by/4.0/).
Copyright: This open access article is published under a Creative Commons CC BY 4.0 license, which permit the free download, distribution, and reuse, provided that the author and preprint are cited in any reuse.


