
Submitted:
13 February 2023
Posted:
20 February 2023
You are already at the latest version
Abstract
Background: The hypothesis is that a hypoxic-hyperoxic preconditioning (HHP) is associated with a protective effect on myocardial function by reducing endothelial damage and a beneficial effect on postoperative outcome in patients undergoing cardiac surgery with cardiopulmonary bypass (CPB). Methods: Patients (n=120) were randomly assigned to an HHP and a control group. A safe inhaled oxygen fraction for the hypoxic preconditioning phase (10-14% oxygen for 10 minutes) was determined by measuring the anaerobic threshold. At hyperoxic phase, 75-80% oxygen fraction was used during 30 minutes. Results: The cumulative frequency of postoperative complications was 14 (23.3%) in the HHP vs 23 (41.1%), p=0.041. The nitrate decreased after surgery by up to 20% in the HHP group and up to 38% in the control group. Endothelin-1 and nitric oxide metabolites were stable in HHP but remained low more than 24 h in control group. The endothelial damage markers appeared to be predictors of postoperative complications. Conclusion: The HHP with individual parameters based on the anaerobic threshold is a safe procedure, it can reduce the frequency of postoperative complications. The endothelial damage markers appeared to be predictors of postoperative complications.
Keywords:
oxygen transport
; cardioprotection
; hypoxic-hyperoxic preconditioning
; ischemia-reperfusion injury
; cardiopulmonary bypass
; endothelial damage markers
1. Introduction
Coronary artery bypass grafting (CABG) with cardiopulmonary bypass (CPB) is a common surgical procedure for patients with coronary artery diseases. The heavy burden of myocardial ischemia-reperfusion injury (IRI) thus induces cardiomyocyte injury, which can paradoxically reduce the beneficial effect of CABG [1,2]. A systemic inflammation, endothelial cells damage appeared during CPB [3,4,5].
Preconditioning by moderate hypoxia or hyperoxia serves as an effective drug-free method to increase the organism's resistance to negative effects including IRI [6,7,8,9]. Decreased oxygen delivery followed hypoxia is opposed a combination of the increased regional blood flow and the enhanced functional capillary density [10]. A recent study has pointed out an important role of hypoxia and hyperoxia signaling in the organ protection, including heart, lungs, kidneys and gut mucosa [11,12,13]. The interval hypoxic-hyperoxic training increases the tolerance of patients with ischemic heart disease [14]. However, the mechanism of implementation of the protective effect of any type of preconditioning remains unclear.
IRI characterized by endothelial dysfunction, which is associated with insufficient production of nitric oxide (NO), vascular tone dysregulation, and continious vasoconstriction [15]. An elevated endothelin-1 (ET-1) level closely associated with the severity of tissue damage and with the incidence of arrhythmias in case of acute myocardial infarction [16]. On-pump CABG is strongly associated with the ET-1 overproduction [17]. NO is a pivotal molecule in the pathophysiology of oxidative stress, and, in particular, in the process of IRI [18]. The asymmetric dimethylarginine (ADMA) levels in plasma is a marker for endothelial dysfunction associated with the increased risk of cardiovascular adverse events [19,20]. Recent studies have pointed out that endothelial dysfunction in chronic heart failure patients of New York Heart Association (NYHA) class II–III have been associated with reduced exercise hyperemia, impaired functional capacity, and increased incidence of hospitalization, or death [21].
We hypothesized that a HHP based on changes in inspiratory oxygen fraction (FiO2) is associated with a protective effect on myocardial function by reducing the endothelial damage and a beneficial effect on postoperative outcome in patients undergoing CABG with CPB.
2. Materials and Methods
2.1. Study Design
A prospective randomized study in parallel groups included consecutively hospitalized patients (n=130) who were scheduled for coronary surgery with CPB (Figure 1).
At the beginning of the operation, patients in the study group (n=60) underwent hypoxic-hyperoxic preconditioning (HHP). In the control group (n=60) the patient's ventilation parameters were established according to the blood gas analysis to maintain normoxia and normocapnia. The study was approved by the Committee on biomedical ethics (June 2015) of Cardiology Research Institute (ClinicalTrials.gov ID: NCT05354648; principal investigator, Irina Mandel; date of registration, April 26, 2022; full protocol available on request). In compliance with the principles of the Declaration of Helsinki, written informed consent was obtained from each patient.
The inclusion criteria: the need for primary coronary artery bypass grafting.
The exclusion criteria: age over 75 years, urgent surgery, diabetes mellitus, acute exacerbation of a any chronic disease one week before surgery, malignancy, aortic regurgitation, intraaortic balloon pump (IABP) or high doses of catecholamines before surgery, carotid artery stenosis >70%, paced heart rhythm, NYHA functional class IV, off-pump surgery, known history of obstructive sleep apnea and a history of an acute coronary event, or stroke within 3 months preceding the study.
2.2. The anaerobic threshold measurement
A safe inhaled oxygen fraction for the hypoxic preconditioning phase (10-14% oxygen for 10 minutes) was determined by measuring the anaerobic threshold. The anaerobic threshold was determined using a "Cardiovit AT-104 PC Ergo-Spiro" (SCHILLER, Switzerland): after calibration, the spirometer was connected to the patient using a face mask, and the procedure for measuring the oxygen consumption volume (VO2) and the carbon dioxide release volume (VCO2) was performed while breathing room air (21% oxygen). After that, using a hypoxicator, the oxygen content in the inhaled gas mixture was lowered by 2% (i.e., to 19%, followed by 17%, 15%, etc) and the measurement of VO2 and VCO2 was repeated. The inspired O2 lowered incrementally until the anaerobic threshold was attained. The anaerobic threshold was determined at the moment of the intersection of the curves of oxygen consumption and carbon dioxide release. After determining the anaerobic threshold, the percentage of oxygen in the inhaled hypoxic gas mixture was recorded, corresponding to the moment the anaerobic threshold was reached. If the inspired O2 at anaerobic threshold was >14%, a 14% O2 gas mixture was used during hypoxic preconditioning. If the inspired O2 at anaerobic threshold was between 10 and 14%, the patient breathed 12% O2 gas during hypoxic conditioning, and if the anaerobic threshold O2 concentration was <10%, the patient was given 10% O2 gas during hypoxic preconditioning.
The second determination of the anaerobic threshold at the beginning of the operation on the background of anesthesia, mechanical ventilation, and myoplegia was carried out according to a specially developed method (please see the Supplementary materials and Figure S1, describing this technique). The data obtained were compared with the classical method of measuring the anaerobic threshold during ergospirometry carried out 72 hours before the operation.
2.3. Anesthesia and hypoxic-hyperoxic preconditioning procedure
Anesthesia was induced during the patient's spontaneous breathing with a 6–8% sevoflurane at a fresh gas flow of 8 l/min. Induction of anesthesia with sevoflurane instead of propofol was chosen due to a known anti-preconditioning effect of propofol. All patients were intubated and mechanicaly ventilated (Primus anesthesia workstation, Dräger Medical, Lübeck, Germany) with a tidal volume based on 6 ml/kg of ideal body weight, respiratory rate, positive end-expiratory pressure (PEEP) 5-8 cm H2O, and FiO2 to achieve the target values of PaO2 80-120 mmHg and PaCO2 35-45 mm Hg. Anesthesia was maintained by a low-flow technique with sevoflurane 1 MAC, fentanyl infusion of 1-3 μg/kg/h, and muscle relaxation with 0.3-0.4 mg/kg/h rocuronium bromide, propofol infusion of 2-3 μg/kg/h during CPB. There were no ventilation during CPB.
The oxygen saturation by a finger pulse oximeter (SpO2), and capnography were monitored continuously. The radial artery was catheterized (20-G Arteriofix; B. Braun Melsungen AG) for invasive monitoring of blood pressure and obtaining samples. The right internal jugular vein was catheterized (7F Certofix; B. Braun Melsungen AG). The Swan-Ganz catheter was used to monitor the pulmonary artery pressure and cardiac index. The bladder was catheterized. Arterial and venous blood gases were measured every 10 minutes after the mechanical ventilation beginning, during preconditioning procedure, and untill CPB begins, followed by every 30 minutes. Acid–base status, and plasma ionogram (pH, bicarbonate, lactate, glucose, sodium, potassium, ionized calcium) were measured. The depth of anesthesia was controlled by the bispectral index (a target levels: 40 - 60).
HHP was administered to anesthetized, catheterized, and mechanically ventilated patients before CPB. HHP includes two phases: a hypoxic phase for 10 min and a hyperoxic phase for 30 minutes. In a respiratory circuit, a gas mixture with a FiO2 10-14% was created, based on the level of the anaerobic threshold, by supplying air at a rate of 200 ml/min and nitrogen until the required oxygen concentration was reached in the closed circuit. The decrease in FiO2 to 10-14% occurred gradually over 2-3 minutes, this concentration was maintained for 10 minutes, then FiO2 was increased up to 75-80%, after that the initial parameters of the gas mixture were established until the CPB started.
A gas mixture with FiO2 10-14% provided a decrease in the patient's PaO2 up to 47-52 mm Hg, and a decrease of SpO2 up to 85-87%, which is known as a safe and sufficient level for aerobic metabolism [32]. Brain regional O2 saturation (rSO2) we monitored with cerebral oximeter INVOS Somanetics. It was not allowed to fall below the threshold level of 45%.
Patients of control group were ventilated with following parameters: tidal volume based on 6 ml/kg of ideal body weight, PEEP 5-8 cm H2O, FiO2 (21-25%), and the corresponding respiratory rate to maintain PaO2 80-120 mm Hg and PaCO2 35-45 mm Hg.
2.4. Perioperative monitoring
All surgical procedures were performed according to the standard anesthetic protocol using sevoflurane, fentanyl, and muscle relaxants with normothermic CPB (Stockert Instrumente GmbH-DIDECO S.p.A., Germany-Italy) with a perfusion rate of 2.5 l/min∙m2. CPB connection was carried out following the standard technique according to the aorta-to-right atrium scheme. Heparin (3 mg/kg) was used before CPB in all patients; activated clotting time was maintained at the level of>500 seconds. Mean arterial pressure during CPB was maintained at 60 - 80 mm Hg; nasopharyngeal temperature was 35.5 - 36.6 C; and hemoglobin level was maintained above 80 g/L. For the prime volume 500 mL of 4% modified gelatin solution (Gelofusine; B. Braun Melsungen AG, Melsungen, Germany) and 500 mL of balanced crystalloid solution (Sterofundin Iso; B. Braun Melsungen AG) were used. Tranexamic acid (2 mg/kg/h) was used as an antifibrinolytic drug in all patients. Myocardial protection was provided by perfusion of the ascending aorta or coronary artery (in cases of aortic insufficiency) with a cold (5C-8C) crystalloid solution (Custodiol HTK-Bretschneider; Dr Franz Kohler Chemie GmbH, Bensheim, Germany) at a dose of 3 mL/kg for 6-8 minutes. Heparin was neutralized by administering protamine sulfate at a 1:1 ratio.
Vasoactive-inotropic score (VIS) was calculated as follows: (dobutamine mkg/kg/min * 1 + dopamine mkg/kg/min * 1) + 100 * (epinephrine mkg/kg/min + norepinephrine mkg/kg/min). VIS values were calculated immediately as well as 6 hours after surgery. Only dopamine (at a dose of 2-7 mkg/kg/min) and norepinephrine (at a dose of 0.1-0.5 mg/kg/min) were used for hemodynamic support (to maintain a mean arterial blood pressure of 60-80 mm Hg) in postperfusion, and postoperative period. Physicians titrate vasoactive drugs were blinded to the treatment or control group.
Standard anesthesia monitoring was applied including continuous electrocardiography analysis, invasive monitoring of arterial pressure and vena cava pressure, pulse oximetry, capnography, nasopharyngeal thermometry, and cardiac index by thermodilution using a Swan-Ganz catheter using the Infinity Delta XL monitor (Draeger AG).
The duration of mechanical ventilation (MV), and length of stay in the intensive care unit (ICU) were recorded.
2.5. The weaning procedure from mechanical ventilation
The criteria for extubation were as follows: PaO2/FiO2 ratio >300, SpO2 > 92%, a negative inspiratory force of less than -20 cmH2O, the absence of exhaustion, agitation, hypertension and tachycardia, a withdrawal of sedation, if any.
2.6. Oxygen transport characteristics
Blood analysis: arterial oxygen tension (paO2), mixed venous oxygen tension (pvO2), arterial oxygen saturation (SaO2), mixed venous oxygen saturation (SvO2), arterial carbon dioxide tension (paCO2), mixed venous carbon dioxide tension (pvCO2), blood lactate, hemoglobin, creatinine, and glucose levels were measured with Stat Profile CCX (Nova Biomedical, Waltham, MA, USA) initially (immediately after intubation of the trachea) and every 10 min of the preconditioning procedure followed by every 30 min during surgery.
2.6.1. Oxigen balance formulas
An arterial oxygen content (CaO2) was determined by the formula:
(0.0134 × Hb (g/l) × SaO2) + 0.0031 × PaO2,
A venous oxygen content (CvO2) was determined by the formula:
(0.0134 × Hb (g/l) × SvO2) + 0.0031 × PvO2,
The arterio-venous difference (C(a-v)O2) in the oxygen content in the blood was determined by the formula:
CaO2-CvO2,
Cardiac index (CI) was calculated as the cardiac output divided by the body surface area.
The oxygen delivery index (IDO2) was determined by the formula:
CaO2 × CI,
The oxygen consumption index (IVO2) was determined by the formula:
(C(a-v)O2) × CI,
An oxygen extraction index was calculated as:
IEO2=IVO2/IDO2×l00,
We calculated central venous-to-arterial carbon dioxide difference (ΔPCO2, the normal ratio is below 6 mm Hg), and central venous-to-arterial carbon dioxide difference/arterial-venous oxygen content difference ratio (ΔPCO2/Ca-vO2, a cutoff point 1.8) as an additional indicator of perfusion quality and anaerobic metabolism.
2.7. Endothelial Damage Markers
The endothelial damage assessment included the determination of ET-1 (fmol/mL), ADMA (μmol/L), endogenous nitrite (NO2−), and nitrate (NO3−), and the total concentration of nitric oxide metabolites (NOx total, μmol/L). The study was conducted within the following three steps: baseline, 24 h before surgery, end of the surgery, and 24 hours after surgery. The levels of ET-1 in plasma were determined by the Biomedica test system (Austria), using a solid-phase enzyme-linked immunosorbent assay with an absorption peak of 450 nm. The sensitivity limit is 0.02 fmol/mL (0.05 pg/mL). The levels of nitric oxide metabolites (nitrites and nitrates) in plasma were determined by the R&D Systems Parameter Total NO/Nitrite/Nitrate Kit (Minneapolis, MN, USA) via the enzyme colorimetric method. Samples of one patient were measured with the same kit to avoid inter-test variations.
2.8. Cardiac Troponin T
Cardiac Troponin T was determined before and 12 hours after surgery (Troponin Ths STAT immunoassay by Cobas e 411 analyzer, Roche Diagnostics International Ltd., Germany). The upper reference limit for cTnT, defined as the 99th percentile of healthy participants, is 140 pg/ml. We used the Third Universal Definition of myocardial infarction (MI) that has been defined MI (Type 5 MI) as a 10-times elevation of cardiac troponin during the first 48 hours after CABG; a 7-times elevation for perioperative myocardial injury [22].
2.9. Intragastric pH-metry
Intragastric pH-metry was carried out using a portable acidogastrometer "AGM-03" (NPP "Istok-System", Russia). Acidogastrometer "AGM-03" is equipped with the three-channel probe, which was inserted in the body of the stomach and its antrum. Intragastric pH (pHg) was measured during surgery (including HHP) and in the early postoperative period. A risk of gut ischemia was predicted with the pHg less than 4.0.
2.10. Outcomes
The primary endpoint was the rate of postoperative complications (composite of death, acute myocardial infarction, need for pacemaker, intraaortic baloon pump, revision of the surgical wound for bleeding, acute kidney injury, delirium, pneumonia, mediastinitis, stress ulcers of the gastrointestinal tract) during 60 days after surgery.
The secondary endpoints were the length of MV and vasoactive inotropic score (VIS) immediately as well as 6 h after surgery, spontaneous sinus rhythm recovery during 14 days after surgery, cTnT 12 h after surgery, and endothelial damage markers (ET-1, NOx total, NO2−, NO3−, ADMA) at 24 h before surgery, end of the surgery, 24 h after surgery.
2.11. Statistical Analysis
Descriptive statistics were used for demographic, laboratory, and clinical parameters for each arm. Continuous and categorical variables were presented as median (Inter-quartile range, IQR), number, and percent (%), as appropriate. A comparison of quantitative characteristics between groups was performed using the Mann-Whitney U test. A comparison of the dynamics of quantitative characteristics in each group was performed using Wilcoxon’s test. The χ2 tests (2×2) or Fisher’s exact test (if there were fewer than 10 observations) were performed to assess the significance of the differences between the characteristics according to the categorical variables. Differences were considered significant at p < 0.05. ROC analysis was performed to assess the predictive performance of the variables independently associated with postoperative complications.
The SPSS for Mac v28 (IBM, USA) was used. The pilot trial was reported according to the Consolidated Standards of Reporting Trials (CONSORT) reporting guidelines.
Sample size calculation was carried out for the study with 130 patients randomized in the proportion of 1:1. Due to the lack of a unified protocol, we developed our protocol of preconditioning, which allows us to simulate the phenomenon of hypoxic-hyperoxic preconditioning in animals and humans [46,47]. The sample size calculation was based on our previous results [46]. The proportion of participants treated with HHP that could meet the criteria for an ischemia-reperfusion injury is estimated at 25% (with 95 % CIs), and the proportion of participants not treated with HHP could be 42%. According to these assumptions, the estimated final sample size for our study was 54 patients in each arm. We have added 17% to prevent data loss. So, we included 65 patients in each arm. We used a computer-generated permuted block (1:1 allocation) randomization sequence (http://sealedenvelope.com). All patients and data analysts were blinded.
3. Results
3.1. Preoperative characteristics of the patients
The demografic and clinical characteristics of the patients are presented in Table 1.
3.2. Intraoperative characteristics of the patients
The duration of the operation in the HHP group was median 280 [IQR 246; 360] minutes, and 280 [250; 330] minutes in the control group, p=0.674. The duration of CPB in the HHP group was 112 [93; 167], and 110 [96; 141] minutes in the control group (p=0.541), duration of myocardial ischemia 80 [69; 125], and 80 [71; 110] minutes (p=0.860), respectively. The intraoperative and postoperative characteristics presented in Table 2.
Intragastric pH decreased during CPB, followed by normalization at the end of the surgery in most cases, equally in both groups. Besides, we observed a moderate negative correlation between pHg (at the end of surgery and 6 h after surgery) and CPB, and surgery duration. Also, low pHg was in conjunction with the heart rhythm restoration after CPB through the VF and need for a pacemaker (Table 3).
3.3. Oxygen balance characteristics during hypoxic-hyperoxic preconditioning
The anaerobic threshold was achieved at FiO2 9 [8; 11]% in both groups, p=0.863. The anaerobic threshold in 86.7% of patients in HHP group of patients was reached at FiO2 <10% (high threshold), so the hypoxic phase was carried out at 10% oxygen in the inhaled gas mixture, in 10% (n=6) patients the anaerobic threshold was moderate, so FiO2 12% was used, in 3.3% (n=2) the anaerobic threshold was low, and FiO2 14% was used. According to cerebral oximetry, rSO2 changed insignificantly. The dynamics of oxygen balance characteristics, rSO2, blood glucose, and lactate leves during the HHP are presented in Table S1. The dynamics of oxygen delivery and consumption during the HHP are presented in Figure 2.
3.4. The Dynamics of Endothelial damage markers in Blood Plasma
The dynamics of endothelial damage markers during the perioperative period are presented in Table 4.
3.4.1. The endothelial damage markers as predictors of postoperative complications
We observed statistically significant differences in ET-1 production and nitric oxide metabolites imbalance in patients with postoperative complications compared with noncomplicated patients (Table 5).
The ET-1 concentration decreased 24 h after surgery in both groups. The NO2 total concentration decreased in both groups, but it was 15% higher in the HHP group at the end of the operation. The nitrate concentration decreased after surgery by up to 20% in the HHP group and up to 38% in the control group. The initial values were restored 24 h after surgery in the HHP group and remained below initial levels in the control group. The endothelial damage markers appeared to be predictors of postoperative complications (Figure 3).
3.5. Heart rhythm restoration after cardiopulmonary bypass
Before surgery sinus rhythm was recorded (Holter monitoring) in 81.7% of patients in the HHP group (n=49), and in 89.3% of patients in the control group (n=50), p=0.247. Four patients in each group developed atrial fibrillation (p=0.920). A polytopic ventricular extrasystoles developed in 7 (11.7%) patients in the HHP group, and 2 (3.6%) patients in the control group, p=0.104.
In the postperfusion period, during the conversion from the CPB to physiological circulation, spontaneous sinus rhythm recovery was observed in 34 (56.7%) patients of the HHP group, in 18 patients (32.1%) in the control group, p=0.008 (Figure 4).
3.6. The characteristics of the postoperative period
The characteristics of the postoperative period are presented in Table 6.
3.7. Relationship between the ΔPCO2, the P(v-a)CO2/C(a-v)O2 ratio and outcome in the HHP group
The ΔPCO2 after 30 minutes of hyperoxia could serve as a predictor of VF in the postperfusion period (Figure 5A). The ΔPCO2/C(a-v)O2 ratio after 10 minutes of hyperoxia appeared to be a predictor of postoperative complications in subgroup of patients with chronic heart failure with redused ejection fraction (Figure 5B).
No harms or unintended effects were observed in either group throughout the trial.
4. Discussion
The major finding of our study is lower complication rate, more frequent spontaneous sinus rhythm recovery, lower VIS, and shorter MV in preconditioned patients.
A comparative analysis of the effectiveness of the HHP in patients undergoing coronary surgery with CPB was conducted. An oxygen transport characteristics were evaluated to control the safety of the procedure. The anaerobic threshold measurement before surgery made it possible to individually select a safely acceptable level of hypoxemia.
Helmerhorst H. called the «pseudohypoxic» reaction of the body to a decrease in the oxygen content in the respiratory mixture from 70% to 21% [23]. M. Rocco et al. studied «normobaric oxygen paradox»: «the relative hypoxia, obtained after a period of hyperoxia, acts as a hypoxic trigger able to significantly increase the erythropoietin or hemoglobin levels» [24]. We provided an analog of such reaction, during the HHP.
The possible mechanism of hypoxic and hyperoxic combination could be a vessel training (vasodilation and vasoconstriction in turn).
One of the signs of tissue hypoxia is the dependence of O2 consumption on its delivery [25,26,27]. The oxygen delivery system has approximately a threefold reserve of compensatory capabilities, which are used in critical illness to maintain oxygen consumption at a level corresponding to the metabolic needs of the body [18]. However, as soon as compensation in the form of increased O2 extraction from the blood reaches its limit, a further decrease in O2 delivery leads to a decrease in O2 consumption. In these circumstances, oxygen consumption is directly dependent on delivery. This so-called critical level of O2 delivery is 330–350 ml/min/m2 [27,28]. According to our data, in the hypoxic phase, oxygen delivery did not reach a critical level. In addition, we did not notice any signs of coronary blood flow insufficiency (there were no changes in the ST segment, cardiac output and hemodynamics were stable). We associate the phenomenon of O2 consumption reduction in the process of hyperoxia with the resulting vasoconstriction, similar data were obtained in the works of Mallat J. et al. for vasoconstriction associated with hypocapnia [29].
We suggest that increased levels of ROS during hyperoxia enhanced and prolonged the effect of hypoxic phase of preconditioning procedure, the protective mechanism of which is realized through the pseudohypoxic pathway. In experimental studies, exposure to hyperoxia for a limited time before ischemia induces a low-grade systemic oxidative stress, that evokes a preconditioning-like effect on the myocardium, reduces the infarction area, and heart rhythm abnormalities [13,30,31,32]. Among patients with ST-segment elevation myocardial infarction undergoing percutaneous coronary intervention, infusion of supersaturated oxygen into the left anterior descending artery infarction area results in a significant reduction in infarction size [33,34,35,36].
Intragastric pH decreased during CPB, followed by normalization at the end of the surgery or later. Besides, we observed a moderate negative correlation between pHg (immediately and 6 h after surgery) and CPB duration. So, this could be the effect of altered perfusion of gut mucosa, and systemic inflammatory reaction during CPB [37,38].
However, we noted an important shift in the response of the oxygen transport system and microcirculation to hypoxic, and hyperoxic exposures. Thus, during the hypoxiс phase, there was an increase of VO2 with a regular decrease of PvО2 and SvO2, as well as an increase in tissue perfusion, assessed using ΔPCO2 and ΔPCO2/C(a-v)O2.
On the contrary, during the hyperoxic phase, opposite changes in PvО2 and SvO2 were noted after 10 minutes of hyperoxia, apparently because of decrease in the tissue perfusion. These changes reached the initial level after the return of normoxia.
We found that the ΔPCO2 after 30 minutes of hyperoxia can serve as a predictor of VF in the post-CPB period. Thus, this may be a kind of «stress-test» for the adaptive potential of the vessels, where an increase in ΔPCO2 could be a sign of transient vasoconstriction and hypoperfusion due to hyperoxia, coinciding with a better heart rhythm recovery after CPB. And vice versa, if ΔPCO2 did not change in response to hyperoxia, this could be an indicator of the low adaptive potential of the microcirculation. The ΔPCO2 gap appeared to be an indicator of damaged tissue perfusion, whether as the result of a decreased cardiac output, or microcirculatory pathology. It has been observed in patients with circulatory shock that ventilation at 100% inspired oxygen fraction for 5 minutes increased PvCO2, and hence the ΔPCO2 gap, independent of changes in the hemodynamic status [40]. While this observation may be explained by a lower CO2 affinity of hemoglobin due to elevated PvO2 (Haldane effect), it may also reflect some impairment in microcirculatory blood flow, owing to the vasoconstrictive effects of hyperoxia [39].
According to Monnet H. and Mallat J., early markers of tissue hypoxia are not only the level of lactate and SvO2 but the ratio ΔPCO2/C(a-v)O2, at which the value of this marker is more than 1.8 was associated with the development of anaerobic metabolism and the emergence of dependence of oxygen consumption and delivery [29,40]. This indicator is analogous to the respiratory quotient (RQ), ie the ratio of total CO2 production (VCO2) to oxygen consumption (VO2). ΔPCO2 (like VCO2) characterizes the relationship between hemodynamics and metabolic processes in the body [39,41,42]. During tissue hypoxia VCO2 increases due to production of CO2 from bicarbonate, thus, along with VO2 decrease, RQ and it’s surrogate (ΔPCO2/C(a-v)O2) increase [29,40]. According to our data, the elevation of ΔPCO2/C(a-v)O2 was observed after 10 minutes of hyperoxia and lasted up to 30 minutes. These changes might be an indicator of transient vasoconstriction.
According to our data, the ΔPCO2/C(a-v)O2 ratio after 10 minutes of hyperoxia could serve as an indicator of postoperative complications in patients with chronic heart failure (CHF). If the ΔPCO2/C(a-v)O2 ratio increased in response to hyperoxia, this could be an indicator of a low adaptive capacity of the vessels. Recently, an opposite vascular reaction to hyperoxia in heart failure by vasodilation due to the inhibition of augmented tonic activity of peripheral chemoreceptors has been described, where patients were exposed to 100% oxygen for 1 min [43]. These differences could be explained by the following: in the mentioned study the length of exposure was shorter, and there were 33% of diabetic patients among participants. So, the vascular reaction could be variable and/or altered not due to peripheral chemoreceptors only, but due to diabetic microangiopathy. Another recent prospective observational study has shown that elevated ΔPCO2 and ΔPCO2/C(a-v)O2 were common phenomena after CPB, and cannot be used as reliable indicators to predict the occurrence of organ dysfunction at 48h after CBP due to the pathophysiological process that occurs after CBP [44].
We suggest, that patients suffering from CHF have microvascular abnormalities and endothelial dysfunction, so their vessels react to hyperoxia much quicker (in ten minutes), and even light vasoconstriction will provoke essential hypoperfusion. Thus, the ΔPCO2 and the ΔPCO2/C(a-v)O2 as a response to hyperoxia in a test-like mode may predict complications.
Several clinical trials described an impaired endothelium-dependent relaxation of peripheral arteries in patients with CHF, most probably due to depressed availability of nitric oxide. In CHF, impaired endothelium-dependent dilation could be attributed to decreased activity of the L-arginine-NO synthetic pathway, increased degradation of NO by ROS, and hypo-responsiveness in vascular smooth muscle [21,45].
We observed regular changes in ET-1 and NO metabolites in the perioperative period. A few changes were in conjunction with preconditioning: less reduction of nitrate concentration at the end of the surgery, and stabilization of NO metabolites at 24 h after surgery as compared to the control group. Contrary to our recent experimental study, where we have found that HHP had an infarct-limiting effect, balanced NO metabolites, and reduced ET-1 hyperproduction in the simulation of IRI under the conditions of CPB [47]. Besides, we observed statistically significant differences in ET-1 production and NO metabolites imbalance in patients with postoperative complications compared with noncomplicated patients. The mechanisms of vasoconstriction and vasodilation was described by Vignon-Zellweger et al. [48]. ET-1 is a strong vasoconstrictor that induced the production of NO (vasodilator); ET-1 was overexpressed in heart failure, but may prevent apoptosis and restore cardiac function in surgical stress [48]. So, ET-1 and NO metabolites might be independent predictors of postoperative complications.
Several limitations of the current study warrant consideration. This is a single-center study only without mortality. The follow-up period is quite short. A high-risk patients or patients with comorbidities could add a confounding factor to the study. It would be interesting to compare HHP with a remote ischemic preconditioning, the outcomes of which on the heart and the kidney has been investigated extensively in cardiovascular surgery, but clinically some controversy exists regarding its effectiveness.
5. Conclusions
In conclusion, HHP before the main stage of coronary surgery, based on the individual selection of parameters using the anaerobic threshold, is a safe procedure, it can reduce the frequency of postoperative complications, the mechanical ventilation time and the vasoactive-inotropic score. The ΔPCO2 after 30 minutes of hyperoxia could be a predictor of ventricle fibrillation in the post-CPB period. The ΔPCO2/C(a-v)O2 ratio after 10 minutes of hyperoxia can serve as a predictor of postoperative complications in patients with chronic heart failure. The endothelial damage markers appeared to be predictors of postoperative complications.
Supplementary Materials
The following supporting information can be downloaded at the website of this paper posted on Preprints.org, Supplementary materials 1: The intraoperative anaerobic threshold measurement technique; Figure S1: Scheme for calculating the power of the anaerobic threshold; Table S1: Dynamics of oxygen balance characteristics during hypoxic-hyperoxic preconditioning.
Author Contributions
Conceptualization, I.A.M., and Y.K.P.; Methodology, I.A.M., and I.V.S.; Software, S.L.M.; Validation, I.A.M., Y.K.P., and V.M.S.; Formal Analysis, I.A.M., and S.L.M.; Investigation, I.A.M., S.L.M.; Resources, Y.K.P., V.M.S., I.V.S., and Y.S.S.; Data Curation, I.V.S., Y.S.S; Writing—Original Draft Preparation, I.A.M.; Writing—Review & Editing, Y.K.P., and A.I.Y.; Supervision, V.M.S., and I.V.S.; Project Administration, V.M.S, A.G.Y. All authors have read and agreed to the published version of the manuscript.
Funding
This research received no external funding.
Institutional Review Board Statement
The study was conducted in accordance with the Declaration of Helsinki, and approved by the Institutional Review Board of Cardiology Research Institute (#134, 11th of June 2015) for studies involving humans.
Informed Consent Statement
Informed consent was obtained from all subjects involved in the study.
Data Availability Statement
The datasets analyzed during the current study are available from the corresponding author on reasonable request.
Conflicts of Interest
The authors declare no conflict of interest.
References
- Deng, Q.W.; Xia, Z.Q.; Qiu, Y.X.; Wu, Y.; Liu, J.X.; Li, C.; Liu, K.X. Clinical benefits of aortic cross-clamping versus limb remote ischemic preconditioning in coronary artery bypass grafting with cardiopulmonary bypass: A meta-analysis of randomized controlled trials. J. Surg. Res. 2015, 193, 52–68. [Google Scholar] [CrossRef]
- Fischesser, D.M.; Bo, B.; Benton, R.P.; Su, H.; Jahanpanah, N.; Haworth, K.J. Controlling Reperfusion Injury With Controlled Reperfusion: Historical Perspectives and New Paradigms. J Cardiovasc Pharmacol Ther. 2021 Nov;26(6):504-523. [CrossRef]
- Hancock, J.T. A Brief History of Oxygen: 250 Years on. Oxygen 2022, 2, 31–39. [Google Scholar] [CrossRef]
- Plicner, D.; Stolin ́ski, J.; Wa ̨sowicz, M.; Gawe ̨da, B.; Hymczak, H.; Kapelak, B.; Drwiła, R.; Undas, A. Preoperative values of inflammatory markers predict clinical outcomes in patients after CABG, regardless of the use of cardiopulmonary bypass. Indian Heart J. 2016, 68 (Suppl. S3), S10–S15. [Google Scholar] [CrossRef]
- Hausenloy, D.J.; Chilian, W.; Crea, F.; Davidson, S.M.; Ferdinandy, P.; Garcia-Dorado, D.; van Royen, N.; Schulz, R.; Heusch, G. The coronary circulation in acute myocardial ischaemia/reperfusion injury: a target for cardioprotection. Cardiovasc Res. 2019 Jun 1;115(7):1143-1155. [CrossRef]
- Xu, K.; Lamanna, J.C. Short-term hypoxic preconditioning improved survival following cardiac arrest and resuscitation in rats. Adv. Exp. Med. Biol. 2014, 812, 309–15. [Google Scholar] [CrossRef]
- Petrosillo, G.; Di Venosa, N.; Moro, N.; Colantuono, G.; Paradies, V.; Tiravanti, E.; et al. In vivo hyperoxic preconditioning protects against rat-heart ischemia/reperfusion injury by inhibiting mitochondrial permeability transition pore opening and cytochrome c release. Free Radic. Biol. Med. 2011, 50, 477–83. [Google Scholar] [CrossRef] [PubMed]
- Sanada, S.; Komuro, I.; Kitakaze, M. Pathophysiology of myocardial reperfusion injury: Preconditioning, postconditioning, and translational aspects of protective measures. Am. J. Physiol. Heart Circ. Physiol. 2011, 301, H1723–H1741. [Google Scholar] [CrossRef] [PubMed]
- Tähepõld, P.; Ruusalepp, A.; Li, G.; Vaage, J.; Starkopf, J.; Valen, G. Cardioprotection by breathing hyperoxic gas-relation to oxygen concentration and exposure time in rats and mice. Eur. J. Cardiothorac. Surg. 2002, 6, 987–994. [Google Scholar] [CrossRef] [PubMed]
- Parthasarathi, K.; Lipowsky, H.H. Capillary recruitment in response to tissue hypoxia and its dependence on red cell deformability. J. Am. Physiol. 1999, 277, H2145–H2157. [Google Scholar] [CrossRef] [PubMed]
- Yuan, X.; Lee, J.W.; Bowser, J.L.; Neudecker, V.; Sridhar, S.; Eltzschig, H.K. Targeting Hypoxia Signaling for Perioperative Organ Injury. Anesth. Analg. 2018, 126, 308. [Google Scholar] [CrossRef] [PubMed]
- Maslov, L.N.; Lishmanov, Y.B.; Krylatov, A.V.; Sementsov, A.S.; Portnichenko, A.G.; Podoksenov, Y.K.; et al. Comparative analysis of early and delayed cardioprotective and antiarrhythmic efficacy of hypoxic preconditioning. Bull. Exp. Biol. Med. 2014, 2014 156, 746–749. [Google Scholar] [CrossRef]
- Kopterides, P.; Kapetanakis, T.; Siempos, I.I.; Magkou, C.; Pelekanou, A.; Tsaganos, T.; et al. A Short-term administration of a high oxygen concentration is not injurious in an ex-vivo rabbit model of ventilator-induced lung injury. Anesth. Analg. 2009, 2009 108, 556–564. [Google Scholar] [CrossRef]
- Glazachev, O.; Kopylov, P.; Susta, D.; Dudnik, E.; Zagaynaya, E. Adaptations following an intermittent hypoxia-hyperoxia training in coronary artery disease patients: A controlled study. Clin. Cardiol. 2017, 40, 370–376. [Google Scholar] [CrossRef] [PubMed]
- Rodriguez-Pascual, F.; Busnadiego, O.; Lagares, D.; Lamas, S. Role of endothelin in the cardiovascular system. Pharmacol. Res. 2011, 63, 463–472. [Google Scholar] [CrossRef] [PubMed]
- Kolettis, T.M.; Barton, M.; Langleben, D.; Matsumura, Y. Endothelin in coronary artery disease and myocardial infarction. Cardiol. Rev. 2013, 21, 249–256. [Google Scholar] [CrossRef]
- Dorman, B. H.; Kratz, J. M.; Multani, M. M.; Baron, R.; Farrar, E.; Walton, S.; Payne, K.; Ikonomiois, J.; Reeves, S.; Mukherjee, R.; Spinale, F. G.; Spinale, F.G. A prospective, randomized study of endothelin and postoperative recovery in off-pump versus conventional coronary artery bypass surgery. J. Cardiothorac. Vasc. Anesth. 2004, 18, 25–29. [Google Scholar] [CrossRef] [PubMed]
- Lincoln, J.; Hoyle, C.H.V.; Burnstock, G. Nitric Oxide in Health and Disease. In Biomedical Research Topics (1) American Scientist; Cambridge University Press: Cambridge, UK, 1997; p. 363. ISBN 9780521559775. [Google Scholar]
- Schwedhelm, E.; Boger, R.H. The role of asymmetric and symmetric dimethylarginines in renal disease. Nat. Rev. Nephrol. 2011, 7, 275–285. [Google Scholar] [CrossRef] [PubMed]
- Konya, H.; Miuchi, M.; Satani, K.; Matsutani, S.; Yano, Y.; Tsunoda, T.; Ikawa, T.; Matsuo, T.; Ochi, F.; Kusunoki, Y.; Tokuda, M.; Katsuno, T.; Hamaguchi, T.; Miyagawa, J.; Namba, M. Asymmetric dimethylarginine, a biomarker of cardiovascular complications in diabetes mellitus. World J. Exp. Med. 2015, 5, 110–119. [Google Scholar] [CrossRef] [PubMed]
- Shechter M, Matetzky S, Arad M, Feinberg MS, Freimark D. Vascular endothelial function predicts mortality risk in patients with advanced ischaemic chronic heart failure. Eur J Heart Fail. Jun;11(6):588-93. [CrossRef]
- Thielmann M, Sharma V, Al-Attar N, Bulluck H, Bisleri G, Bunge JJH, Czerny M, Ferdinandy P, Frey UH, Heusch G, et al. ESC Joint Working Groups on Cardiovascular Surgery and the Cellular Biology of the Heart Position Paper: Perioperative myocardial injury and infarction in patients undergoing coronary artery bypass graft surgery. Eur Heart J. 2017; 14;38(31):2392-2407. [CrossRef]
- Helmerhorst, H.J.F.; Schultz, M.J.; van der Voort, P.H.; deJonge, E.; van Westerloo, D.J. Bench-to-bedside review: The effects of hyperoxia during critical illness. Crit. Care 2015, 19, 284. [Google Scholar] [CrossRef] [PubMed]
- Rocco, M.; D’Itri, L.; De Bels, D.; Corazza, F.; Balestra, C. The “normobaric oxygen paradox”: A new tool for the anesthetist? Minerva Anestesiol 2014, 80, 366–372. [Google Scholar] [PubMed]
- Guyton, A.C.; Hall, J.E. Textbook of Medical Physiology. New York: Elsevier; 2006.
- Schumacker, P.T.; Cain, S.M. The concept of a critical oxygen delivery. Intensive Care Med. 1987; 13: 223-9. [CrossRef]
- Nikolaenko, E.M. Critical level of oxygen transport in the early period after prosthetic heart valves surgery. Anesteziologiya-reanimatologiya. 1986; 31(1): 26-30. (in Russian). [PubMed]
- Komatsu, T.; Shibutani, K.; Okamoto, K.; Kumar, V.; Kubal, K.; Sanchala, V.; & Lees, D. E. Critical level of oxygen delivery after cardiopulmonary bypass. Crit Care Med. 1987; 15(3): 194-7. [CrossRef]
- Mallat, J.; Mohammad, U.; Lemyze, M.; Meddour, M.; Jonard, M.; Pepy, F.; Gasan, G.; Barrailler, S.; Temime, J.; Vangrunderbeeck, N.; Tronchon, L.; Thevenin, D. Acute hyperventilation increases the central venous- to-arterial PCO2 difference in stable septic shock patients. Ann. Intensive Care. 2017; 7(1): 31. [CrossRef]
- Tsutsumi, Y.M.; Yokoyama, T.; Horikawa, Y.; Roth, D.M.; Patel, H.H. Reactive oxygen species trigger ischemic and pharmacological postconditioning: In vivo and in vitro characterization. Life Sci. 2007, 81, 1223–1227. [Google Scholar] [CrossRef]
- Garlid, A.O.; Jaburek, M.; Jacobs, J.P.; Garlid, K.D. Mitochondrial reactive oxygen species: Which ROS signals cardioprotection? Am. J. Physiol. Heart Circ. Physiol. 2013, 305, H960–H968. [Google Scholar] [CrossRef] [PubMed]
- Young, R.W. Hyperoxia: A review of the risks and benefits in adult cardiac surgery. J. Extra-Corpor. Technol. 2012, 44, 241. P: PMCID, 4557. [Google Scholar] [PubMed]
- Yellon, D.; Alkhulaifi, A.M.; Pugsley, W. B Preconditioning the human myocardium. Lancet. 1993; 342: 276-7. [CrossRef]
- Kolár, F.; Jezková, J.; Balková, P.; Breh, J.; Neckár, J.; Novák, F.; Nováková, O.; Tomásová, H.; Srbová, M.; Ost'ádal, B.; Wilhelm, J.; & Herget, J. Role of oxidative stress in PKC-delta upregulation and cardiopro- tection induced by chronic intermittent hypoxia. Am. J. Physiol. Heart Circ. Physiol. 2007; 292(1): H224-30. [CrossRef]
- Kloner RA, Creech JL, Stone GW, O'Neill WW, Burkhoff D, Spears JR. Update on Cardioprotective Strategies for STEMI: Focus on Supersaturated Oxygen Delivery. JACC Basic Transl Sci. 2021 Oct 27;6(12):1021-1033. [CrossRef]
- Crestanello, J.A.; Lingle, D.M.; Kamelgard, J.; Millili, J.; Whitman, G.J. Ischemic preconditioning decreases oxidative stress during reperfusion: a chemiluminescence study. J. Surg. Res. 1996; 65(1): 53-8. [CrossRef]
- Plestis KA, Gold JP. Importance of blood pressure regulation in maintaining adequate tissue perfusion during cardiopulmonary bypass. Semin Thorac Cardiovasc Surg. 2001 Apr;13(2):170-5. [CrossRef]
- Ohri, SK. Systemic inflammatory response and the splanchnic bed in cardiopulmonary bypass. Perfusion. 1996 May;11(3):200-12. [CrossRef]
- Ltaief, Z.; Schneider, A.G.; Liaudet, L. Pathophysiology and clinical implications of the veno-arterial PCO2 gap. Crit Care. [CrossRef]
- Monnet, X.; Julien, F.; Ait-Hamou, N.; Lequoy, M.; Gosset, C.; Jozwiak, M.; Persichini, R.; Anguel, N.; Richard, C.; & Teboul, J. L. Lactate and venoarterial carbon dioxide difference/ arterial-venous oxygen difference ratio, but not central venous oxygen saturation, predict increase in oxygen consumption in fluid responders. Crit Care Med. 2013; 41(6): 1412-20. [CrossRef]
- Mekontso-Dessap, A.; Castelain, V.; Anguel, N.; Bahloul, M.; Schauvliege, F.; Richard, C.; & Teboul, J. L. Combination of venoarterial PCO2 difference with arteriovenous O2 content difference to detect anaerobic metabolism in patients. Intensive Care Med. 2002; 28(3): 272-7. [CrossRef]
- Habicher, M.; von Heymann, C.; Spies, C.D.; Wernecke, K.D.; Sander, M. Central Venous-Arterial pCO2 and pH Difference Identifies Microcirculatory Hypoperfusion in Cardiac Surgical Patients with Normal Central Venous Oxygen Saturation: A Retrospective Analysis. J. Cardiothorac. Vasc. Anesth. 2015; 29(3): 646-55. [CrossRef]
- Tubek, S.; Niewinski, P.; Paleczny, B.; et al. Acute hyperoxia reveals tonic influence of peripheral chemoreceptors on systemic vascular resistance in heart failure patients. Sci Rep, 2021; 11, 20823. [Google Scholar] [CrossRef]
- Zhang S, Zheng D, Chu X-Q, Jiang Y-P, Wang C-G, Zhang Q-M, Qian L-Z, Yang W-Y, Zhang W-Y, Tung T-H & Lin R-H. ΔPCO2 and ΔPCO2/C(a−cv)O2 Are Not Predictive of Organ Dysfunction After Cardiopulmonary Bypass Front. Cardiovasc. Med. 2021; 8:759826. [CrossRef]
- Borges JP, Mendes FSNS, Lopes GO, Sousa AS, Mediano MFF, Tibiriçá E. Is endothelial microvascular function equally impaired among patients with chronic Chagas and ischemic cardiomyopathy? Int J Cardiol. 2018; 15;265:35-37. [CrossRef]
- Hypoxic-hyperoxic preconditioning: a novel technique for myocardial protection against ischemia-reperfusion injury in coronary surgery / I.A. Mandel S.L. Mikheev Y.K. Podoksenov Y.S. Svirko I.V. Suhodolo V.M. Shipulin // European Heart Journal, Volume 38, Issue suppl_1, 1 August 2017, ehx493.P5809. [CrossRef]
- Mandel, I.A.; Podoksenov, Y.K.; Suhodolo, I.V.; An, D.A.; Mikheev, S.L.; Podoksenov, A.Y.; Svirko, Y.S.; Gusakova, A.M.; Shipulin, V.M.; Yavorovskiy, A.G. Influence of Hypoxic and Hyperoxic Preconditioning on Endothelial Function in a Model of Myocardial Ischemia-Reperfusion Injury with Cardiopulmonary Bypass (Experimental Study). Int. J. Mol. Sci. 2020 Jul 27;21(15):E5336. [CrossRef]
- Vignon-Zellweger, N.; Heiden, S.; Miyauchi, T.; Emoto, N. Endothelin and endothelin receptors in the renal and cardiovascular systems. Life Sci. 2012, 91, 490–500. [Google Scholar] [CrossRef] [PubMed]
Figure 1.
Flowchart of patient enrollment.
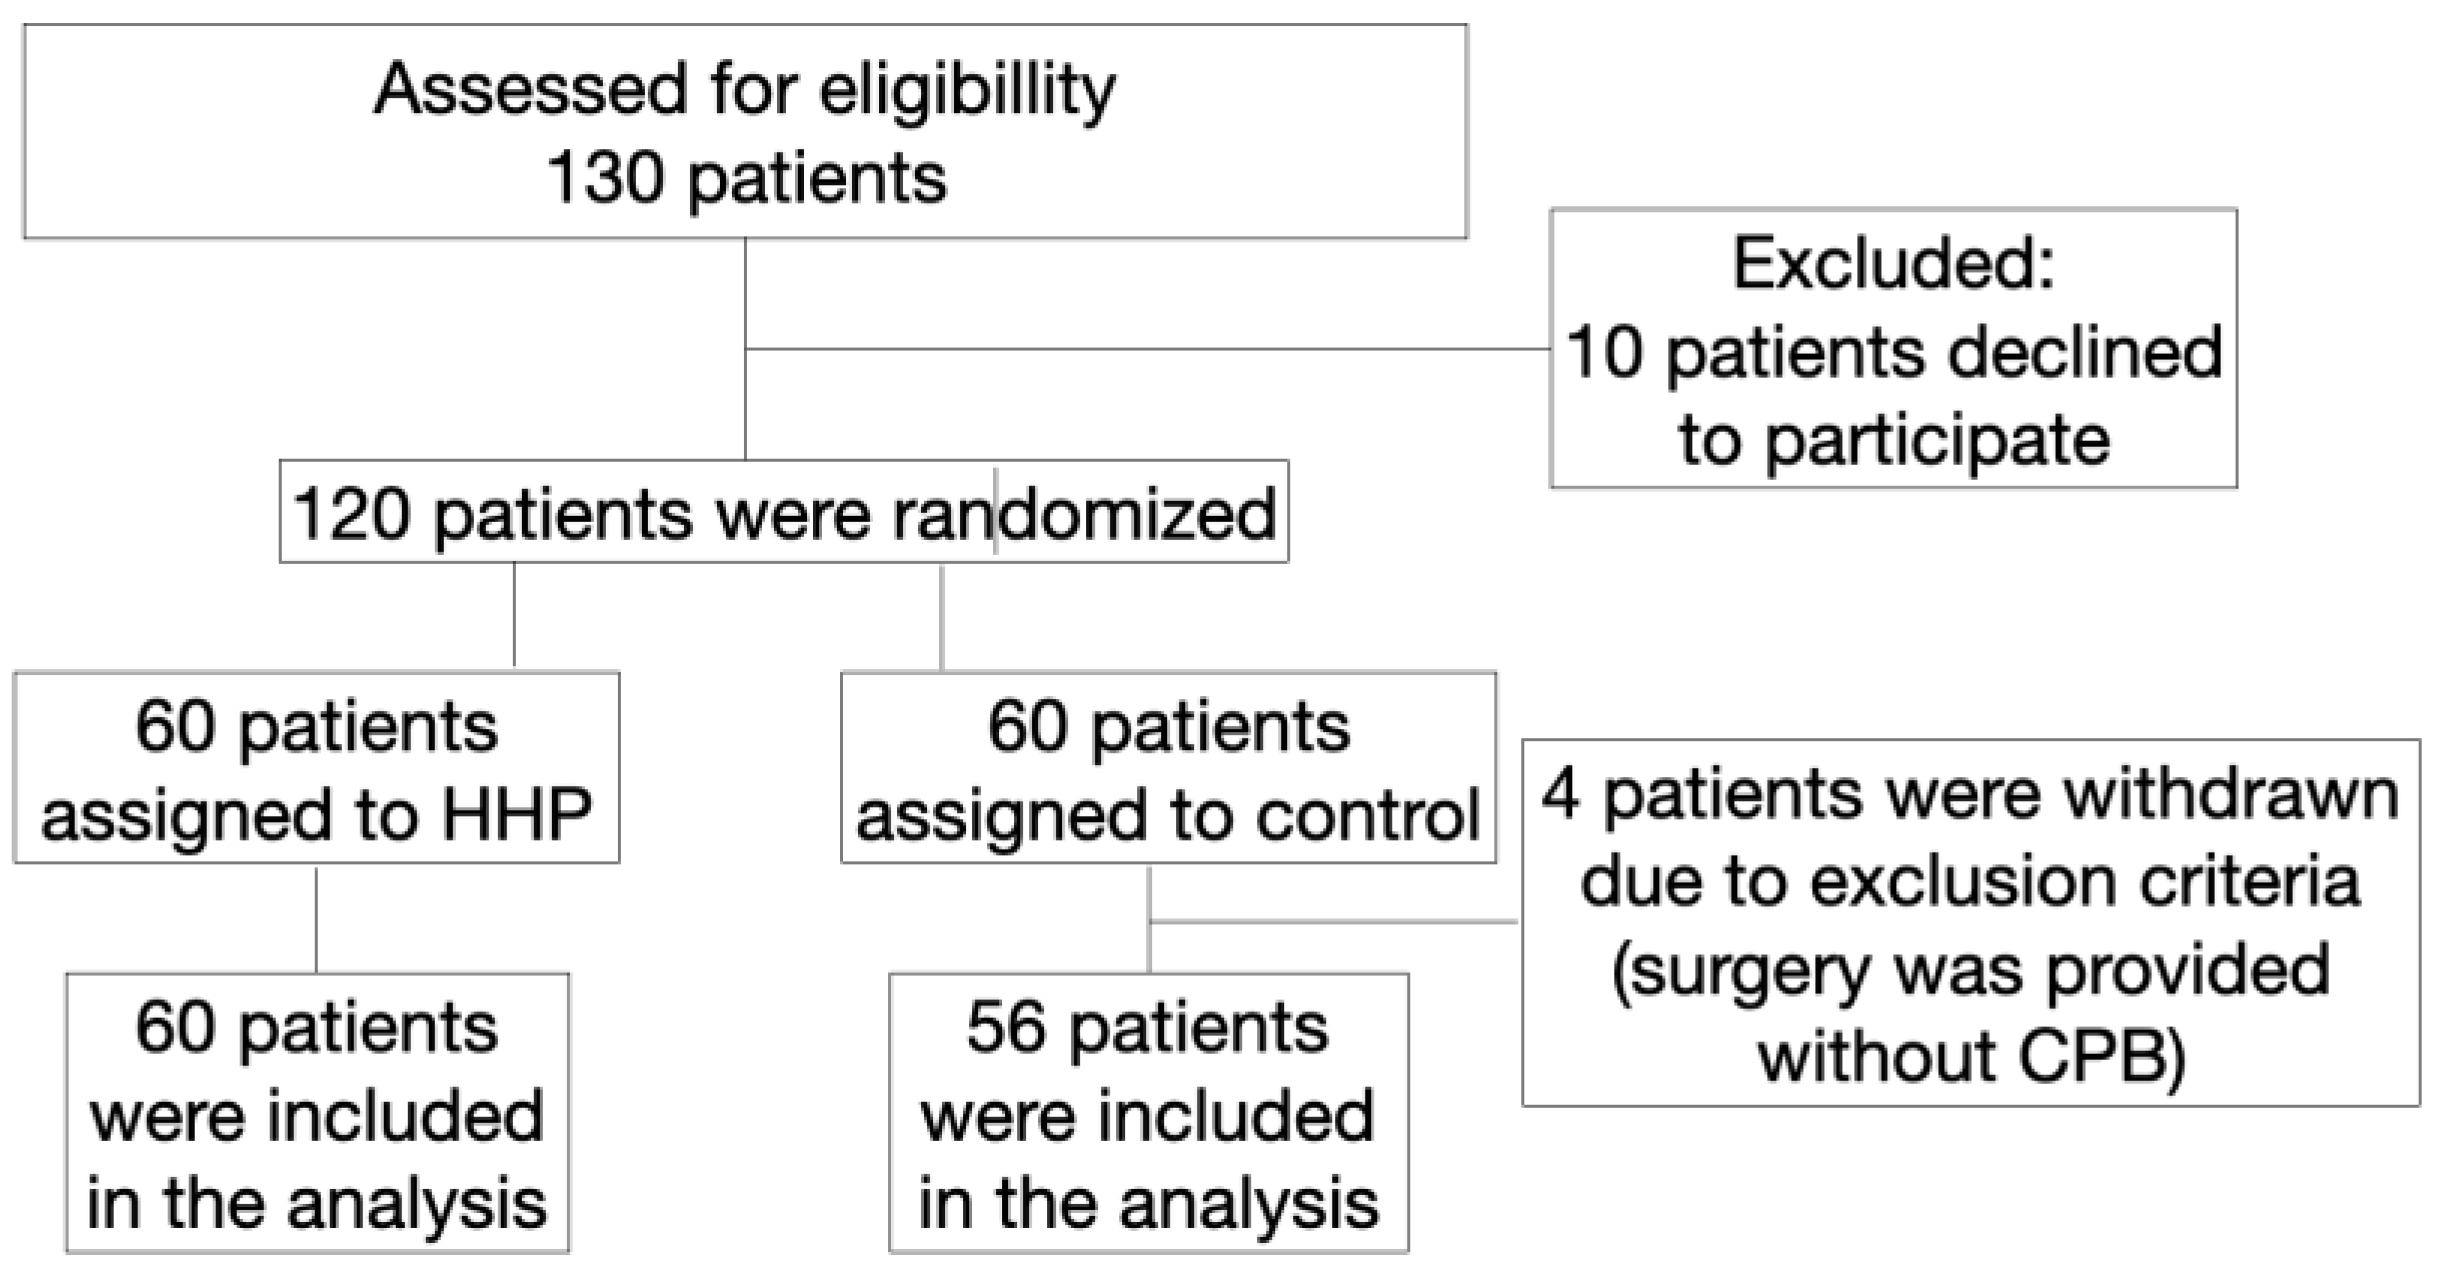
Figure 2.
The dynamics of oxygen consumption. (a) and oxygen delivery (b) indices during the hypoxic-hyperoxic preconditioning. * - p < 0.05 comparing to the baseline.
Figure 2.
The dynamics of oxygen consumption. (a) and oxygen delivery (b) indices during the hypoxic-hyperoxic preconditioning. * - p < 0.05 comparing to the baseline.
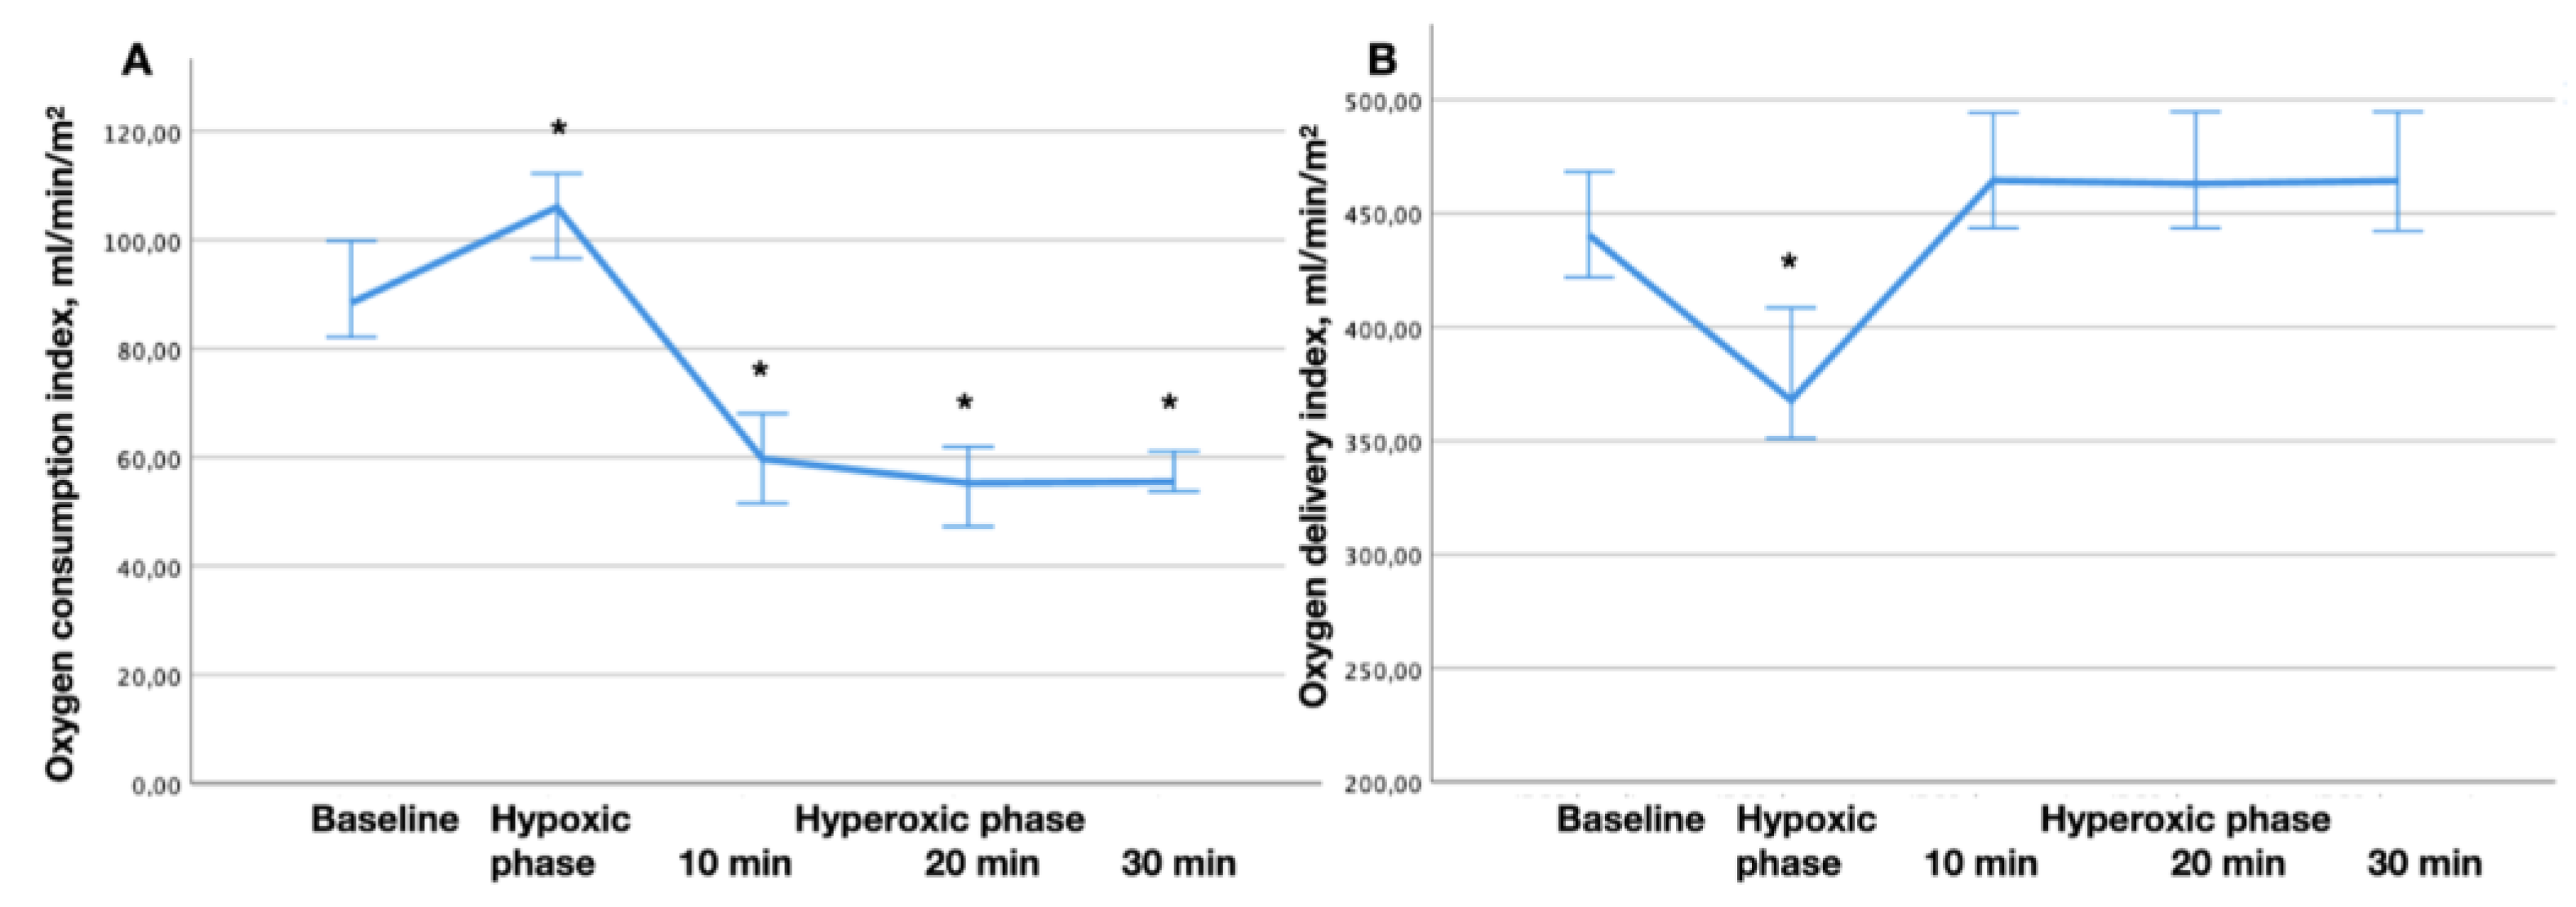
Figure 3.
Receiver operating characteristic curves for endothelin-1 and nitric oxide metabolites for prediction of postoperative complications. (a) AUC for ET-1 before surgery is 0.70 (95% Confidence interval (CI) 0.543; 0.856), p=0.020. The cut-off is 0.759 fmol/ml, sensitivity - 78%, specificity - 53%; AUC for ET-1 at the end of surgery is 0.67 (95% CI 0.499; 0.832), p=0.054. The cut-off is 0.710 fmol/ml, sensitivity - 78%, specificity - 66%. (b) AUC for NO2.total 24 h after surgery is 0.71 (95% CI 0.540; 0.872), p=0.023. The cut-off is 8.166 µmol/l, sensitivity - 82%, specificity - 52%; AUC for NO3.endo 24 h after surgery is 0.73 (95% CI 0.579; 0.883), p=0.007. The cut-off is 7.322 µmol/l, sensitivity - 83%, specificity - 52%. (c) AUC for NO2.endo at the end of surgery is 0.77 (95% CI 0.625; 0.920), p=0.002. The cut-off is 0.768 µmol/l, sensitivity - 81%, specificity - 66%.
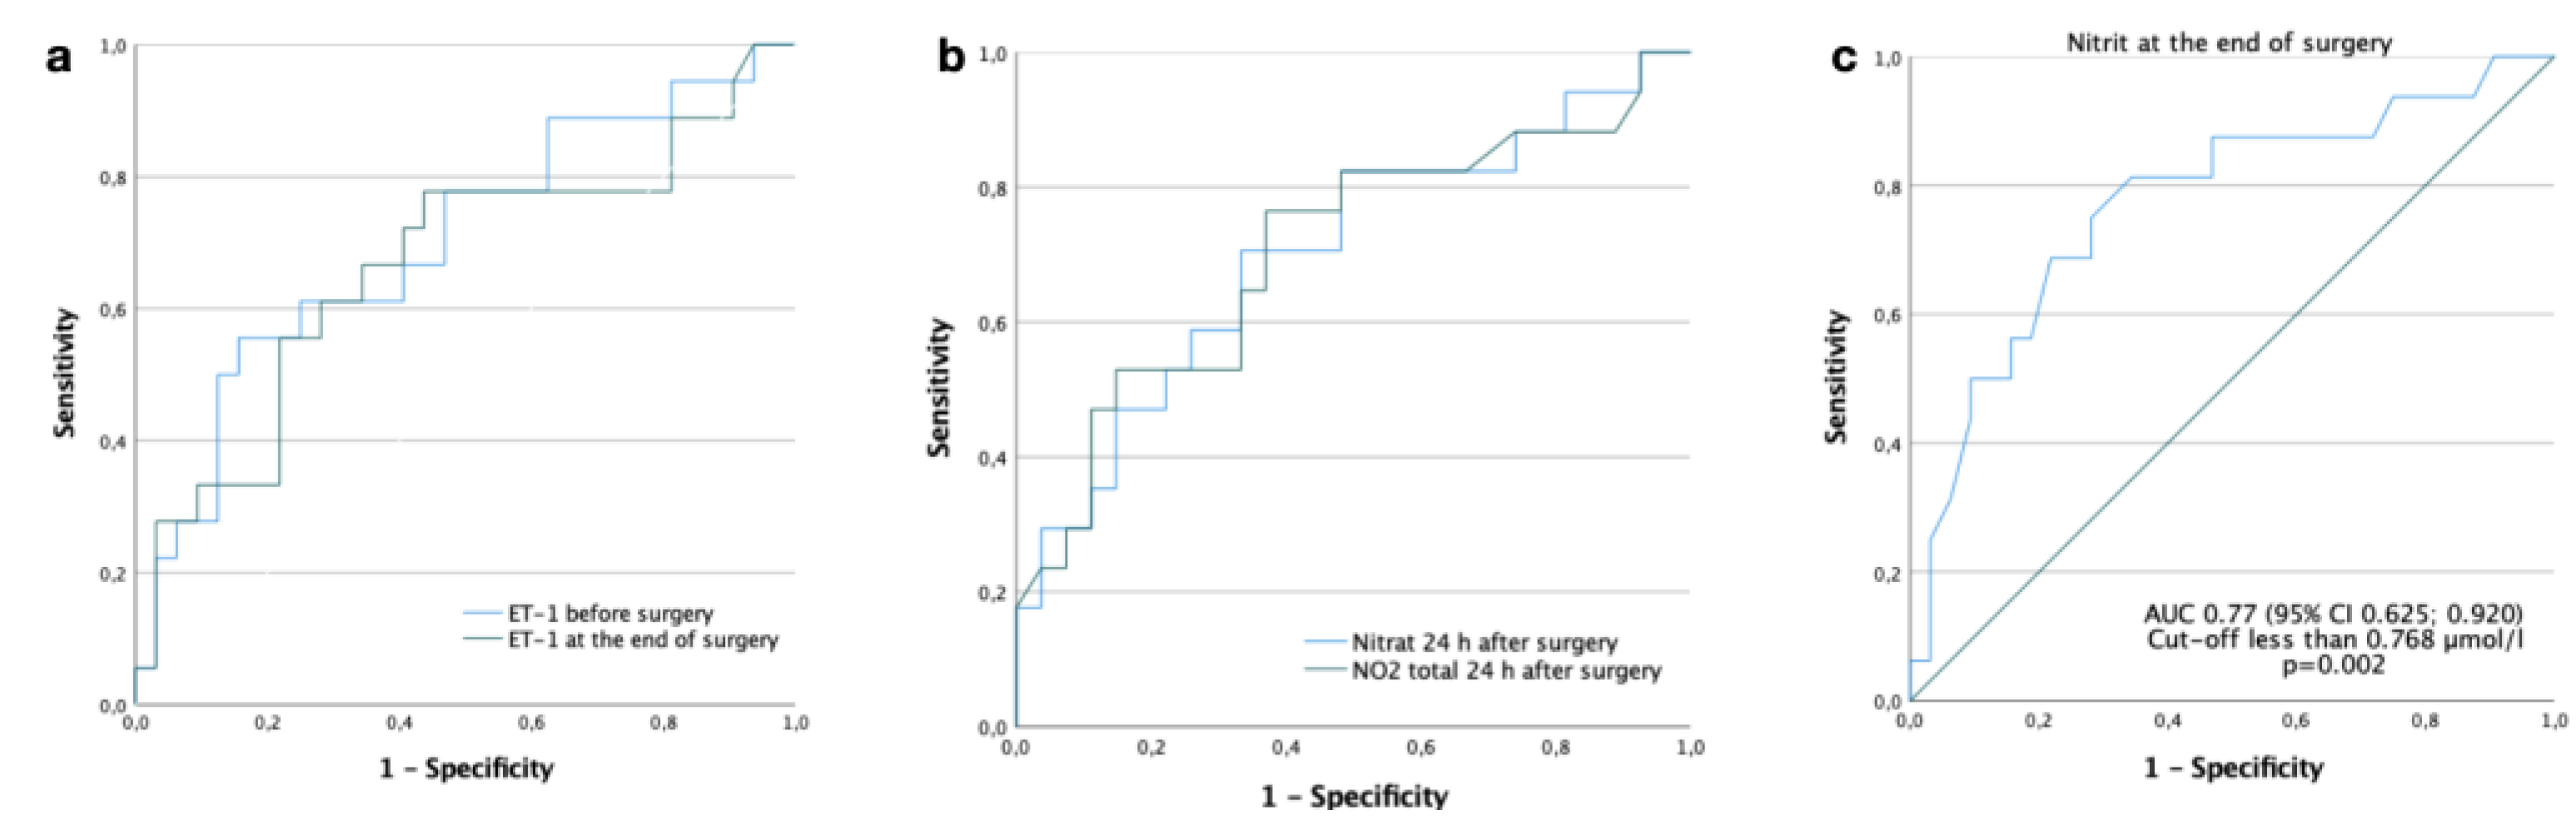
Figure 4.
Heart rhythm recovery. The HHP group (a) and the control group (b) in the postperfusion period. Types of rhythm recovery: (Blue) spontaneous sinus rhythm recovery; (Green) ventricular fibrillation (VF) after aorta declamping, sinus rhythm recovery after defibrillation; (Red) ventricular fibrillation after aorta declamping, atrioventricular blockade after defibrillation, the need for temporary pacing. * - p=0.008 between groups.
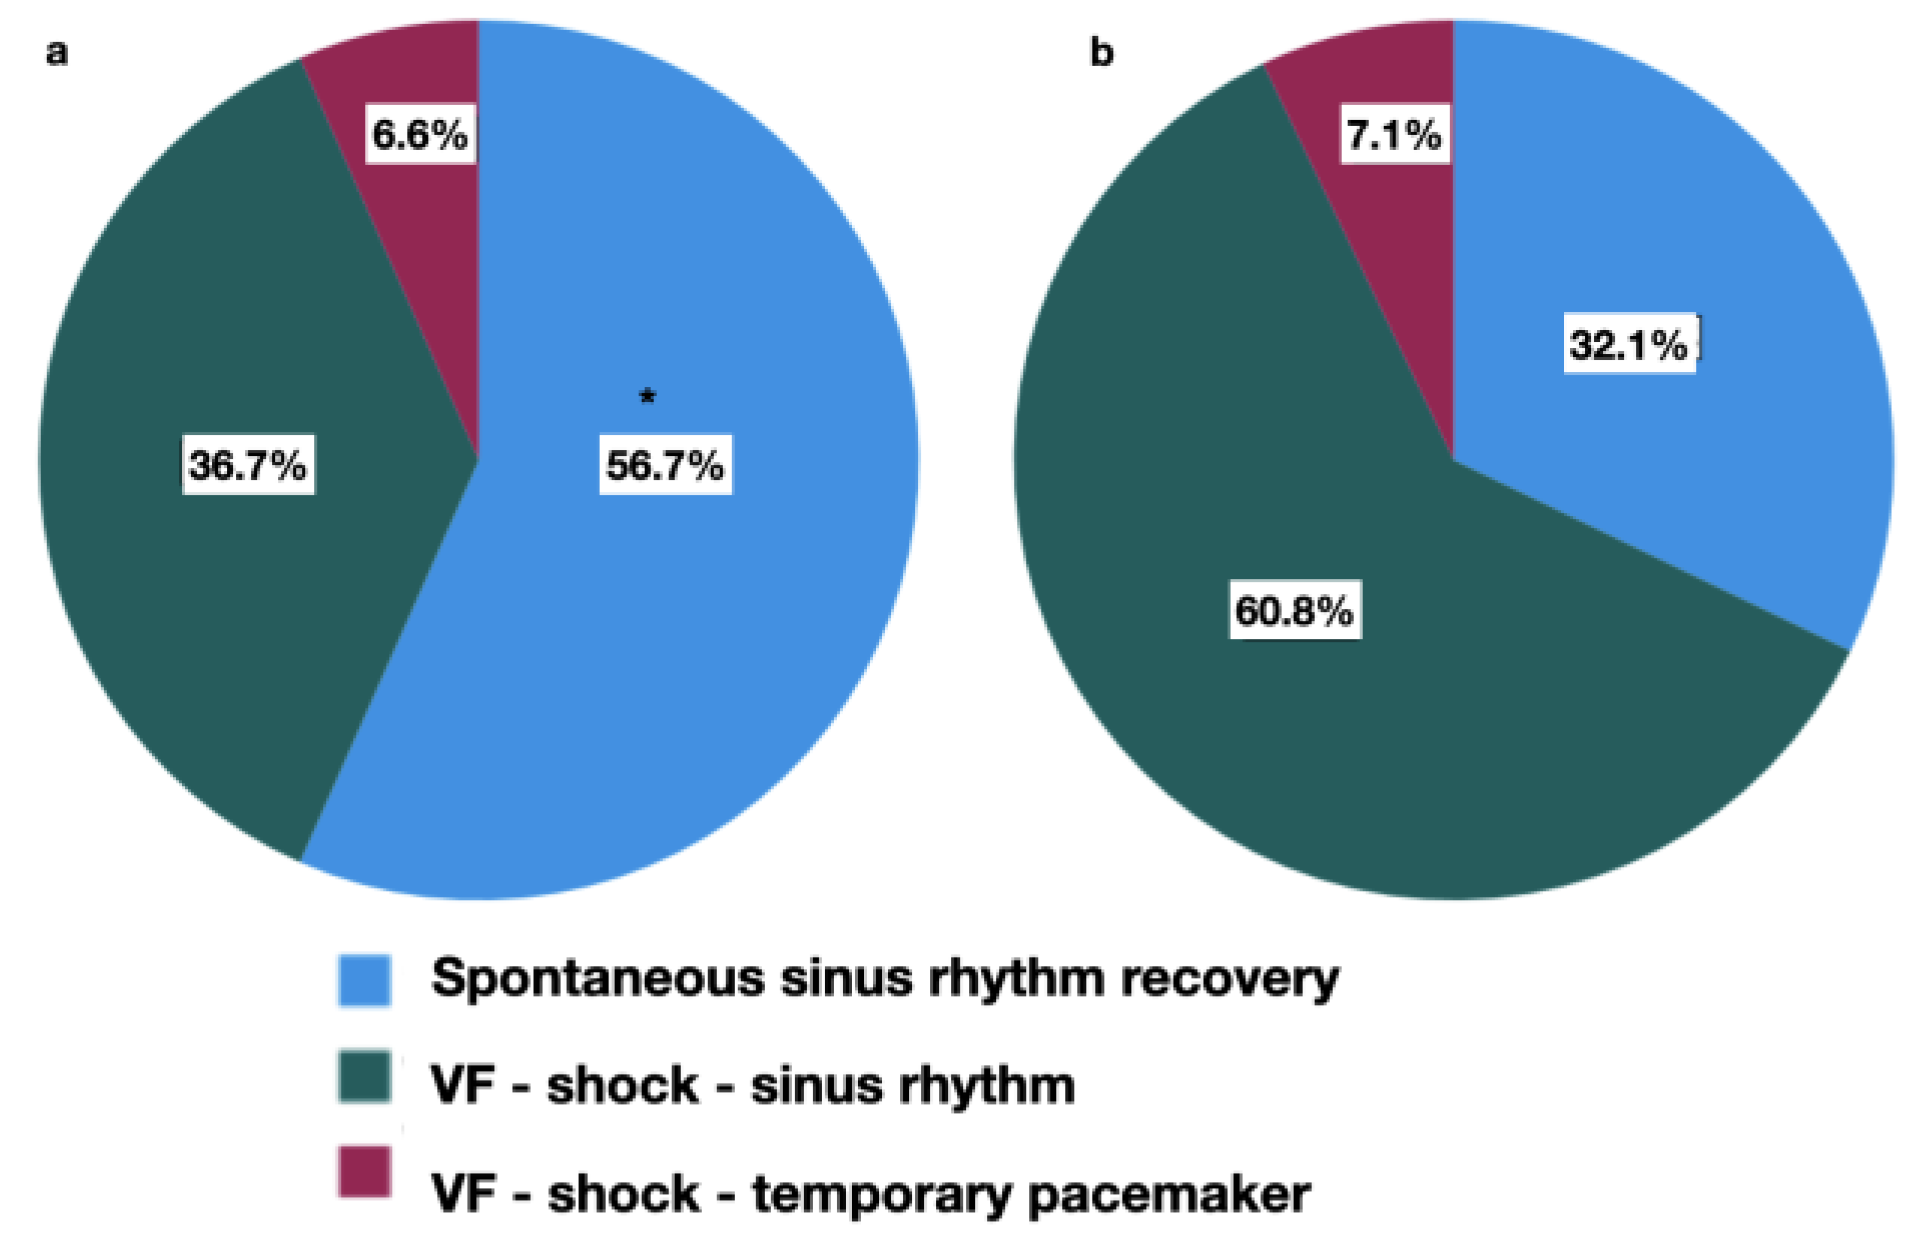
Figure 5.
Prediction of complcations after surgery by ΔPCO2 and C(a-v)O2 monitoring (ROC curves). (a) ΔPCO2 after 30 minutes of hyperoxia for prediction of ventricular fibrillation after CPB; (b) ΔPCO2/C(a-v)O2 after 10 minutes of hyperoxia for preditcion of postoperative complications in chronic heart failure patients.

Table 1.
Demographic and clinical characteristics of the patients.
|
Table 2.
Dynamics of perioperative parameters.
 |
Table 3.
Correlation between the intragastric pH level and CPB and surgery duration, and type of postperfusion rhythm recovery.
Table 3.
Correlation between the intragastric pH level and CPB and surgery duration, and type of postperfusion rhythm recovery.
 |
Table 4.
Characteristics of endothelin-1, nitric oxide metabolites, and ADMA concentrations in the perioperative period.
Table 4.
Characteristics of endothelin-1, nitric oxide metabolites, and ADMA concentrations in the perioperative period.
 |
Table 5.
Characteristics of endothelin-1, nitric oxide metabolites, and ADMA concentrations in patients with or without postoperative complications.
Table 5.
Characteristics of endothelin-1, nitric oxide metabolites, and ADMA concentrations in patients with or without postoperative complications.
 |
Table 6.
Characteristics of the postoperative period.
 |
Disclaimer/Publisher’s Note: The statements, opinions and data contained in all publications are solely those of the individual author(s) and contributor(s) and not of MDPI and/or the editor(s). MDPI and/or the editor(s) disclaim responsibility for any injury to people or property resulting from any ideas, methods, instructions or products referred to in the content. |
© 2023 by the authors. Licensee MDPI, Basel, Switzerland. This article is an open access article distributed under the terms and conditions of the Creative Commons Attribution (CC BY) license (http://creativecommons.org/licenses/by/4.0/).
Copyright: This open access article is published under a Creative Commons CC BY 4.0 license, which permit the free download, distribution, and reuse, provided that the author and preprint are cited in any reuse.


