
Submitted:
02 May 2023
Posted:
04 May 2023
You are already at the latest version
Abstract
The purpose of this work was to evaluate a novel methodology developed by Digital Blood Corporation (DBC) to calculate critical blood values using four non-invasive measured values as input. The values obtained using a point-of-care testing (POCT) device were utilized for comparison and reference. Radial arterial blood was collected for the POCT comparator analysis using the Abbott i-STAT® device. The non-invasive methodology from DBC requires four parameters to be directly measured: temperature, hemoglobin, pO2, and pCO2. Subsequently, sodium, potassium, chloride, ionized calcium, total carbon dioxide, pH, bicarbonate, and oxygen saturation are calculated using an algorithm. The agreement between the POCT and DBC’s methodology was analyzed using Bland-Altman difference plots. For a second data set, pO2 and pCO2 values collected with the POCT were used as input for DBC’s algorithm to test its robustness. Data from 37 healthy ambulatory individuals, mean age: 42.4 + 13 years; range: 18-64 years, were included in the primary analysis. In the case of the non-invasive gained four input values the greatest variation between POCT and DBC’s approach was observed for pO2 and consequently for algorithm values that depend upon pO2 precision. Replacing transcutaneous pO2 and pCO2 with POCT values demonstrates the principal ability of DBC’s algorithm to predict the additional 8 blood values in sufficient agreement with a standard POCT device in healthy patients. The algorithm developed by DBC appears to be robust in the case of healthy patients but does need the four measured input values with preciseness comparable to a POCT device to give reliable and clinically relevant results. The present study thus serves as a proof of concept to facilitate future study and further development of this methodology into a non-invasive device.
Keywords:
non-invasive
; point-of-care testing
; blood values
; Radial arterial blood
; blood gas
; transcutaneous
; algorithm
1. Introduction
Blood gas measurement is a monitoring or diagnostic test that is used to determine the levels of partial pressures of oxygen (pO2) and carbon dioxide (pCO2) circulating in the blood [1]. These values can be used to calculate several biomedical parameters including bicarbonate levels and electrolytes [2,3]. In humans, pO2 and pCO2 can be measured either by invasive or non-invasive techniques. Invasive methods involve obtaining a sample of blood directly from an artery, such as the radial artery in the wrist, while non-invasive methods, primarily, use transcutaneous devices to measure the oxygen and carbon dioxide levels via skin [4]. The arterial blood gas (ABG) requires specialized devices and expertise to analyze the results. In contrast, transcutaneous non-invasive methods do not involve the withdrawal of blood samples and use sensors that are placed on the skin to measure the amount of oxygen and carbon dioxide in the blood. In addition, capnography is a non-invasive method that measures carbon dioxide in the exhaled air. The agreement between gas level in the exhaled air and ABG was high [5]. Blood gas measurements can be used to assess the acid-base balance and to detect respiratory or metabolic disorders of the patient, especially, in emergency situations [6]. The results of the test are used to determine the oxygenation status and to guide treatment decisions, such as the use of oxygen therapy, mechanical ventilation, or pharmacological interventions.
Transcutaneous devices employ sensors which are placed on the skin (e.g., arms, forehead, earlobe) to measure pO2 and pCO2 levels. Interestingly, the technology in the sensors for transcutaneous devices are fast evolving. For example, oxygen diffusion and pH-sensitive changes in voltage are used in transcutaneous devices [7]. As oxygen diffuses through the membrane, it causes a change in the LED’s light intensity which is then detected by the photodiode. The transcutaneous pO2 levels are measured using the principle of oxygen diffusion where the sensor is made up of a membrane that is permeable to oxygen and has a light-emitting diode (LED) on one side and a photodiode on the other side [4,8]. Similarly, transcutaneous pCO2 measurement uses the principle of pH changes caused by the presence of CO2. The sensor is composed of a pH-sensitive electrode which changes its voltage as per the skin pH and this voltage is then converted to pCO2 [4]. These sensors subsequently utilize this information to calculate the amount of O2 or CO2 in the blood.
The use of algorithms to calculate different blood values from pO2 and pCO2 is a common approach in blood gas measurements. Mathematical equations are used to calculate and convert arterial or transcutaneous oxygen and carbon dioxide measurements into electrolyte and mineral levels. One example of an algorithm used for this purpose is the Stewart approach which includes pCO2, bicarbonate level and pH in the equation [9]. Similarly, base excess (BE) algorithm derived from Siggaard-Andersen equation involves pCO2 and pH values to calculate the metabolic component of the acid-base balance in the blood and detect metabolic acidosis or alkalosis [10,11]. In Fick’s principle is employed to derive oxygen content in the blood using pO2 and hemoglobin values [12]. The accuracy of these algorithms may vary depending on the patient physiology, the device used, and the environment.[13]
The accuracy of the transcutaneous non-invasive measurements can be affected by several factors including skin perfusion, skin condition, patient movement, temperature, environmental factors, and potentially other health conditions of the patient [6,14,15]. Since these devices rely on the diffusion of oxygen and carbon dioxide through the skin, poor skin perfusion will not allow accurate measurements [16]. Similarly, factors such as dry or oily skin, eczema, and psoriasis can affect the accuracy of transcutaneous measurements because they can alter the ability of the skin to diffuse oxygen and carbon dioxide. Environmental factors such as temperature and humidity can affect the accuracy of the measurement [17,18]. Patients with certain conditions such as obesity or peripheral edema may have difficulty in placing the device properly, this can affect the accuracy of the measurement [19]. In spite of the limitations of transcutaneous measurements, this non-invasive method is attractive and amenable to daily use in sports and healthcare setup.
In emergency settings, blood draws are performed to assess critical values and optimize care. There are several point-of-care testing (POCT) devices for measuring critical laboratory values, but real-time utility can be cumbersome considering need for blood draws, multiple cartridges, and potential for delays in obtaining results. Digital Blood Corporation (DBC; Fort Lauderdale, FL) developed and successfully patented [20] a system for non - invasive real-time and continuous examination of a patient’s blood environment parameters that includes having at least four user-input sensors operably configured to measure and hemoglobin content and partial pressure of O2 and CO2 in a patient’s, blood as well as the body temperature.
The objective of this study was to assess the methodology to predict critical blood values using DBC’s algorithm in human subjects and compare the values obtained using an established POCT device. For this purpose, a set of eleven blood values was selected for calculation with DBC’s proprietary algorithm and software using four non-invasive core measurements (pO2, pCO2, Hb, T) and for a second data set using the pO2 and pCO2 values from the POCT device to estimate the deviation and error resulting from transcutaneous measurements. In addition, a comfort assessment comparing the invasive and non-invasive methods was administered among the study participants.
2. Materials and Methods
2.1. Study Design and Methods
After approval from the Institutional Review Board of Larkin University (Miami, FL), a study was conducted in healthy ambulatory individuals aged 18-64 years from June to November 2021. Informed consent was obtained from all subjects involved in the study. Individuals had to be adults aged 18-70 years and fluent in English or Spanish to be included; patients with diagnosed blood disorders (including but not limited to hemophilia and uncontrolled coagulation disorders) were excluded from the study. When approximately 50% of the subjects had completed the study, an interim analysis of the quantitative/qualitative data was conducted. Adverse events were monitored by the investigators on an ongoing basis throughout the study per IRB requirements. Based on the literature review and prior experience investigators have with POCT devices, no serious side effects were anticipated and indeed were not observed. Participants were asked about their comfort level and reminded that they can stop at any time despite this being covered during the consent portion of the study. Given that analysis with both devices takes less than 5-10 minutes to receive results, no deleterious side effects were anticipated, nor have they been observed. There is a potential for excessive bleeding but that is rare as the POCT device uses a finger stick similar to the lancets used in common glucometers for routine monitoring of blood glucose. However, to be overly cautious, patients on anticoagulants such as warfarin, low molecular weight heparins (e.g., enoxaparin), direct thrombin inhibitors (dabigatran), or factor Xa inhibitors (e.g., apixaban) were excluded. Aspirin at doses equal to or less than 325 mg daily was acceptable. A comfort level questionnaire encompassing six areas, such as, emotion, attachment, harm, perceived change, movement, and anxiety, was administered for DBC and i-STAT methodologies. Study participants completed one questionnaire for each device and identified their experience within a scale of zero to ten. The details of the questionnaire are available in the supplemental Figure 1.
2.2. Blood Collection and Transcutaneous Measurements
Radial arterial blood was collected for the POCT comparator analysis using the Abbott i-STAT® device (i.e., EG7+ and CHEM8+ cartridges). The four parameters directly measured for DBC’s algorithm included temperature and hemoglobin via Masimo Rad-57 device, and partial pressures of oxygen (pO2) and carbon dioxide (pCO2) via TINA TCM4 radiometer. While arterial blood was being collected for the i-STAT®, the DBC values were also obtained. Using these values, the algorithm calculated sodium, potassium, chloride, ionized calcium (iCa), total carbon dioxide (TCO2), pH, bicarbonate, and oxygen saturation (SO2). To be able to estimate the error resulting from the accuracy of transcutaneous pO2 and pCO2 measurements, additional sets of values were recalculated using pO2 and pCO2 values determined by the i-STAT®.
2.3. Data Analyses
Validation of a new method for application to medical practice requires comparison with gold standard techniques. As correlation analysis may lead to incorrect or debated results in comparison of two methods of measuring the same variable, and the Pearson correlation coefficient is not the correct tool for assessing method agreement [13], Bland–Altman analysis [21] has been applied as the most appropriate way of determining the limits of agreement between measurements [22].
3. Results and Discussion
Data from 37 participants (mean age: 42.4 ± 13 years; range: 18-64 years) were included in the primary analysis. Participants were predominantly male (65%), and consisted of White (75%), Black (22%), and Asian (3%) (Table 1). Forty percent of the participants identified themselves as Hispanic. The demographic data of the study participants have been summarized in Table 1. Both methods were analyzed using Bland-Altman plots [21]. For assessing the agreement between two quantitative methods of measurement, correlation coefficient and regression technique that studies the relationship between one variable and another, not the differences, are often inadequate and can be misleading when assessing agreement, because they evaluate only the linear association of two sets of observations [22]. Bland-Altman plots represent an alternative analysis, based on the quantification of the agreement between two quantitative measurements by studying the mean difference and constructing limits of agreement. These statistical limits are calculated by using the mean and the standard deviation(s) of the differences between two measurements. The resulting graph shows the difference of the two paired measurements is plotted against the mean of the two measurements. Thus, the Bland Altman plot defines two important differences, bias and 95% limits of agreement. The average bias, or the average of the differences, is computed as the value determined by one method minus the value determined by the other method. If we observe a value other than zero, the two methods systematically produce different results, though you can’t tell only from the graph itself which method is better or worse. In our case we defined the i-STAT as the gold standard that we compare the DBC approach to. If on the contrary the average bias is close to zero, DBC’s approach is producing similar results as the standard POCT device, although the average doesn’t tell the standard deviation (SD).
The standard deviation of the differences between the two methods (labeled as the SD of bias) is used to calculate the 95% limits of agreement, computed as the bias plus or minus 1.96 times its SD. 95% of the differences between the two methods would be expected to be within the range of values described by the 95% limits of agreement. The limits of agreement include both systematic (bias) and random error (precision) and provide a useful measure for comparing the likely differences between individual results measured by two methods. For interpreting the Bland-Altman results the following questions are addressed:
1) How big is the average discrepancy between the POCT and DBC’s approach (the bias)? This is interpreted clinically, not statistically, and addresses if the discrepancy is large enough to be important clinically.
2) How wide are the limits of agreement between the POCT and DBC’s approach? Wide limits as defined clinically, indicate ambiguous results while narrow limits and a tiny bias indicate that the two methods are essentially equivalent.
3) Can a trend be observed in the data? Does the difference between the two methods tend to get larger or smaller as the average increases?
4) Is the variability consistent across the graph or does the scatter around the bias line get larger or smaller as the average gets higher?
Figure 1, first panel shows the Bland-Altman plot for sodium. The following plotted points are beyond the limits of agreement: 1, 6, 10. As 95% of the data points should be in the confidence interval, 2-3 data point outliers outside the interval would be acceptable given our sample size of 37. The average bias, or the average of the differences, is computed as the value determined by one method minus the value determined by the other method. If one method is sometimes higher, and sometimes the other method is higher, the average of the differences will be close to zero. If it is not close to zero, this indicates that the two assay methods are systematically producing different results. This seems to be the case for sodium on a first glance, however a closer look allows to re-evaluate. A systematic shift by ~3 is not that drastically given the fact that a normal blood sodium level is between 135 and 145 milliequivalents per liter (mEq/L) and severe hyponatremia occurs when levels drop below 125 mEq/L [23]
The second panel shows potassium and only one data point is outside the limits of agreement. Given our sample size of 37 the one data point outside the interval is perfectly acceptable as >95% of the data points are in the confidence interval. Normally, the blood potassium level is 3.6 to 5.2 millimoles per liter (mmol/L). A very low potassium level (less than 2.5 mmol/L) can be life-threatening and requires urgent medical attention [24]. The DBC data range fells well into that interval while the i-STAT shows an average of 3.79 mmol/L, so at the lower limit, indicating a slight underestimation as one would expect most of the values to be in the interval of 4 to 5 millimoles per liter. Figure 1, third panel shows the Bland-Altman plot for chloride. Two data points are outside the limits of agreement: 6, 24. Given our sample size of 37 the two data points outside the interval are acceptable as >95% of the data points are in the confidence interval. A typical normal range is 96 to 106 milliequivalents per liter (mEq/L) or 96 to 106 millimoles per liter (mmol/L) [25]. Normal value ranges may vary slightly among different laboratories. All patient data in the study are in the normal range (except one value of 107 measured by the POCT device, this patient showed a value of 102.3 mEq/L by DBC) and the range of acceptance equals the normal range interval.
Figure 1, fourth panel shows the BA plot for calcium. The data points are outside the limits of agreement: 1, 9. Given our sample size of 37 and the fact that 95% of the data points should be in the confidence interval, two data points outside the interval would be acceptable. Calcium concentration, both total and free, is characterized by a high physiological variation, depending on age, sex, physiological state (e.g., pregnancy), and even season, owing to the seasonal variation of vitamin D. Therefore, separate reference intervals have been established according to the age and sex of the individual being tested [26]. Total calcium reference ranges for adults 2.25-2.62 mmol/L and values tend to be reduced in elderly persons. Possible critical values for total calcium are < 1.5 mmol/L or >3.25 mmol/L. Both methods applied in this study do measure ionized calcium that is the amount of free calcium in the blood (not attached to proteins) whereas serum calcium is the total amount of calcium present in the blood. Measurement of serum free (ionized) calcium (Ca++) reflects true calcium status of the body in health and disease. In healthy individuals, plasma ionized calcium concentration is maintained between approximately 1.15 and 1.30 mmol/L. Hypercalcemia (increased amount of calcium in blood), diagnosed if ionized calcium is >1.30 mmol/L, is more common than hypocalcemia (reduced amount of calcium in blood).
All DBC values are very close to the DBC average of 1.1 mmol/L which seems a bit too low for healthy patients, with a max deviation of +-0.01 mmol/L only. The fact that the DBC value is practically constant is leading to the shift observed in the Bland-Altman plot that shows clearly a x-axis dependency of the value, while the POCT device values vary with a standard deviation of 0.04 mmol/L and a range from 1.17-1.31 mmol/L. The DBC results do not seem to reflect the same range. The linearity of the dots in the plot would predict that values from patients with higher or lower than the normal range concentrations would be outside the confidence interval and not captured correctly. However, only an actual experiment/study with patients suffering from reduced calcium in blood could tell. Figure 1, fifth panel shows the BA plot for hemoglobin. The following datapoints are outside the limits of agreement: 11, 25. Given our sample size the two data points outside the interval are acceptable. The healthy range for hemoglobin is for men, 13.2 to 16.6 g/dL and for women, 11.6 to 15 g/dL [27]. The range of acceptance equals the normal range interval.
Figure 1, sixth panel shows the Bland Altman plot for the pH. Two data points are beyond the limits of agreement: 15, 27. Given our sample size two data points outside the interval are acceptable. The pH of blood in the arteries should be between 7.35 and 7.45 for the body’s metabolic processes and other systems to work well [28,29]. These processes produce acids, much of the acid made in the body is carbonic acid, so the body has a complex system of feedback and regulation to maintain healthy pH levels. Acidosis occurs when the blood is too acidic, with a pH below 7.35. Alkalosis occurs when the blood is not acidic enough, with a pH above 7.45. While all data measured with POCT device is in the range 7.35-7.45 the DBC data range from 7.21-7.51 with more than half of the values outside the expected range for healthy patients thus predicting either acidosis or alkalosis which however is in no case confirmed or supported by the i-STAT. Given the small normal range of 0.1 the standard deviation of +-0.1 of the DBC measurement is too large to allow the correct prediction of the disease state.
Figure 1, seventh panel shows the Bland-Altman plot for serum bicarbonate. Two data points are outside the limits of agreement: 5, 7. Given our sample size two data points outside the interval are acceptable. An acceptable normal range of serum bicarbonate (HCO3) is 22-26 meq/L [30]. Serum bicarbonate is used for systematic arterial blood gas interpretation. Interpretation leads to an understanding of the degree or severity of abnormalities, whether the abnormalities are acute or chronic, and if the primary disorder is metabolic or respiratory in origin. The Romanski method of analysis is most simplistic for all levels of providers [31,32]. This method helps determine the presence of an acid-base disorder, its primary cause, and whether compensation is present. The first step is to look at the pH and assess for the presence of acidemia (pH < 7.35) or alkalemia (pH > 7.45). If the pH is in the normal range (7.35-7.45), use a pH of 7.40 as a cutoff point. In other words, a pH of 7.37 would be categorized as acidosis, and a pH of 7.42 would be categorized as alkalemia. Next, evaluate the respiratory and metabolic components of the ABG results, the PaCO2 and HCO3, respectively. The PaCO2 indicates whether the acidosis or alkalemia is primarily from a respiratory or metabolic acidosis/alkalosis. PaCO2 > 40 with a pH < 7.4 indicates a respiratory acidosis, while PaCO2 < 40 and pH > 7.4 indicates a respiratory alkalosis (but is often from hyperventilation from anxiety or compensation for a metabolic acidosis). Next, assess for evidence of compensation for the primary acidosis or alkalosis by looking for the value (PaCO2 or HCO3) that is not consistent with the pH. Lastly, assess the PaO2 for any abnormalities in oxygenation.
As an example, in respiratory acidosis the expected physiologic response is an increased HCO3. The increase in concentration of bicarbonate ions (HCO3) in plasma (P HCO3) is tiny in patients with acute respiratory acidosis but is much larger in patients with chronic respiratory acidosis. As it is important to be able to distinguish between normal, slightly elevated and elevated levels of HCO3, the interval of confidence of more than 10 is not acceptable and doesn’t allow to use this value in correctly predicting the disease state at this point. Figure 1, eighth panel shows the Bland-Altman plot for Oxygen saturation. Three data points are outside the limits of agreement: 5, 19,27. Given our sample size three data point outside the interval are still acceptable. Oxygen saturation (sO2) refers to the percentage amount of oxygen in the blood. Among other things, it provides information about the functional capacity of the lungs and the effectiveness of oxygen transport in the blood. Normal values 95-99% (SaO2) resp. venous oxygen saturation 73% (SvO2) [28,29]. The brain gets affected when the SpO2 level falls below 80-85%. Cyanosis develops when the SpO2 level drops below 67%. The normal oxygen levels in a pulse oximeter usually range from 95% to 100%. While the range of agreement is acceptable and within the clinically relevant interval for healthy patients, DBC seems to slightly underestimate the oxygen levels. As this seems to be a systematic error a correction factor might resolve this issue easily.
Figure 1, nineth panel shows the Bland-Altman plot for total carbon dioxide. Two data points are outside the limits of agreement: 5, 7. Given our sample size two data points outside the interval are well acceptable. The normal range for total carbon dioxide is 23 to 29 mEq/L or 23 to 29 mmol/L [32]. While all data measured with the POCT device is in the normal range the DBC data range 16-38 mmol/L with roughly one third of the values outside the expected range for healthy patients which however is in no case confirmed or supported by POCT values. Given the small normal range of 6 mmol/L the standard deviation of +-5.25 mmol/L of the DBC measurement is too large to allow the correct prediction of the disease state. Figure 1, tenth panel shows the Bland -Altman plot for partial pressure of carbon dioxide. Two data points are outside the limits of agreement: 1, 30. Given our sample size two data points outside the interval are well acceptable. The partial pressure of carbon dioxide (PCO2) is the measure of carbon dioxide within arterial or venous blood. It often serves as a marker of sufficient alveolar ventilation within the lungs. Generally, under normal physiologic conditions, the value of PCO2 ranges between 35 to 45 mmHg [28,29]. The standard deviation is higher than the range for healthy patients and as this is a direct measured value by the TINA instrument, the transcutaneous measurement as carried out in this study seems to have a too large variation and the values gained do not match or follow the same pattern as the values observed with i-STAT. Figure 1, eleventh panel shows the Bland-Altman plot for partial pressure of oxygen. Two data points are outside the limits of agreement: 5, 30. Given our sample size two data points outside the interval are well acceptable. Most healthy adults have a PaO2 within the normal range of 75-100mmHg [28,29]. If a PaO2 level is lower than 75 mmHg, it means that a person is not getting enough oxygen. Hypoxemia is PaO2 < 50 mmHg.
Transcutaneous oxygen measurements are different (generally lower) and published normal transcutaneous oxygen partial pressures (PtcO2) for the chest and lower limb have defined tissue hypoxia as a value of < 40 mmHg (< 30 mmHg in some patients, < 50 mmHg in others). A study with thirty-two volunteers had transcutaneous oxygen measurements (TCOM) performed on the chest, upper and lower limbs breathing air, with leg then arm elevated [33]. Results were: Room-air PtcO2 (mmHg, mean (95% confidence interval)) were: chest: 53.6 (48.7–58.5); upper arm: 60.0 (56.1−64.0); forearm: 52.3 (44.8–55.8); dorsum of hand: 50.2 (46.1–54.3); thenar eminence: 70.8 (67.7–73.8); hypothenar eminence: 77.9 (75.1–80.7); lateral leg: 50.2 (46.2–54.2); lateral malleolus: 50.5 (46.6–54.3); medial malleolus: 48.9 (45.6–52.1); dorsum, between first and second toe: 53.1 (49.2–57.0); dorsum, proximal to fifth toe: 58.5 (55.0–62.0); plantar, 1st MTP: 73.7 (70.3–77.1). Nineteen subjects had at least one room-air PtcO2 below 40 mmHg (nine upper limb, 13 lower limbs, four chest). Approximately 10% lower limb PtcO2 were < 100 mmHg on normobaric oxygen. Only one subject at one site had an upper limb PtcO2 < 100 mmHg breathing oxygen. The broad dispersion in PtcO2 in this healthy cohort reflects the inherent biologic variability in dermal perfusion and oxygen delivery, making it difficult to define narrow, rigid ‘normal’ values. Thus, the authors stated that they cannot recommend a single PtcO2 value as ‘normal’ for the upper or lower limb. A thorough patient assessment is essential to establish appropriateness for hyperbaric oxygen therapy, with TCOM used as an aid to guide this decision and not as an absolute. Our standard deviation of 17 is by far too high and makes the resulting values very unreliable, overriding even the systematic shift between arterial blood draw and transcutaneous oxygen measurements (which is about 22 mmHg, or 76% of the arterial blood draw). This hints on the one hand to a correction factor to account for the systematic error for the body part measured, and on the other hand to the need a more robust protocol or measurement to gain transcutaneous pO2 to get a smaller variation and values that after correction would match or follow the same pattern as the values observed with i-STAT.
In the next step, the whole dataset was recalculated using i-STAT pO2 and pCO2 values, while leaving the initial hemoglobin and temperature values. As the software is expecting transcutaneous pO2 values, pO2 values used have been corrected with a factor of 0.76 to match the systematic difference between transcutaneous measurements and an arterial blood draw observed in our study. Figure 2 shows the re-calculated Bland-Altman plots using this new dataset. Of course, pO2 and PCO2 have been excluded now, as these would be the same values. In addition, the right panel also shows on the left of each Bland-Altman plot a distribution plot of differences between measurements by the two methods. The red curve represents Normal distribution. Figure 2 shows that while sodium, potassium, chloride and ionized Calcium are not altered significantly by using the i-STAT values for pO2 and pCO2 (Panels 1-4), pH (panel 5) shows a lower standard deviation of 0.08 from 0.11, bicarbonate (panel 6) shows a lower standard deviation of 4.17 from 5.32, the standard deviation for oxygen saturation very significantly decreases from 2.7 to 0.35 and the same is true for the standard deviation of total carbon dioxide, which decreases from 5.25 to 4.11, generally bringing the limits of agreement within the acceptable and clinically relevant range. Table 2 compares the comfort level of the study participants for both approaches. Participants filled out the questionnaire directly after their participation.
4. Conclusions
A comparison of the responses to the comfort level questionnaire indicates that the DBC non-invasive device was significantly more comfortable than the i-STAT methodology (Table 2). The study participants responded that the DBC device is low in all the six domains measured, namely, emotion, attachment, harm, perceived change, movement, and anxiety. The non-invasiveness nature of the DBC device clearly provided advantage over the i-STAT invasive method which poses additional challenges in blood withdrawal and occasionally limited sample volume. Overall, the comfort scale data analyses suggest that DBC device is more patient-friendly compared to the i-STAT.
The greatest variation between POCT and the non-invasive algorithm was observed for pO2, which is one of the four core measures obtained from the TINA device. Consequently, calculated values that strongly rely on the preciseness of pO2 show the largest deviation. The re-calculations using pO2 and pCO2 values from i-STAT demonstrate the principal ability of the DBC methodology to predict correctly the additional eight values in sufficient agreement with a standard POCT device. Detail analysis identifies the transcutaneous pO2 and pCO2 measurements as the main contributors to the high standard deviations in the original data, and thus either refining and improving the transcutaneous measurement for pO2 (and pCO2) or applying a different methodology to gain those values may improve the predictability of the algorithm. An additional improvement would be a better determination of the body temperature, as the forehead measurements are not very precise and results might vary, potentially contributing additional deviation for values that are strongly temperature dependent, as pH for instance. In summary, the DBC software itself seems to be robust and reliable in the case of healthy patients but does need the four measured input values with a preciseness comparable to a POCT device to give reliable and clinically relevant results. The broader clinical significance, especially, among critically ill adults and children remains to be determined.
Author Contributions
Conceptualization, R.H.E. and J.C.; Methodology, J.C., S.D., T.H., S.A.; Software, J.P., J.C.; Formal Analysis, R.H.E, J.P., and J.C.; Investigation, J.C., S.D., T.H., S.A.; Data Curation, R.H.E, J.P., J.C.; Writing—Original Draft Preparation, R.H.E., S.D.; Writing—Review & Editing, R.H.E, S.D., J.P., J.C; T.H., S.A.; Project Administration, J.C. and S.D..; Funding Acquisition, R.H.E., J.C., and S.D.
Funding
This study has been funded by an internal development grant from Larkin University, Miami, FL, and a grant from Digital Blood Corporation (Fort Lauderdale, FL) to Larkin University.
Institutional Review Board Statement
The study was conducted according to the guidelines of the Declaration of Helsinki and approved by the Institutional Review Board (or Ethics Committee) of Larkin University (protocol code COP052621-01F and date of approval May 26, 2021).
Informed Consent Statement
Informed consent was obtained from all subjects involved in the study.
Data Availability Statement
The data presented in this study are available on request from the corresponding author.
Acknowledgement
This study has been funded by an internal development grant from Larkin University, Miami, FL, and a grant from Digital Blood Corporation (Fort Lauderdale, FL) to Larkin University. The funders had no role in the design and conduct of the study, collection, management, analysis, and interpretation of the data. The work of J. Caballero on this study was completed while working at Larkin University.
Conflicts of Interest
The authors declare no conflict of interest.
References
- Blackburn, J.P. What is new in blood-gas analysis? Br J Anaesth 1978, 50, 51-62. [CrossRef]
- McBride, M.E.; Berkenbosch, J.W.; Tobias, J.D. Transcutaneous carbon dioxide monitoring during diabetic ketoacidosis in children and adolescents. Paediatr Anaesth 2004, 14, 167-171. [CrossRef]
- Yi, H.C.; Shi, W.S.; Zhang, Y.H.; Zhu, X.Z.; Yu, Y.; Wang, X.X.; Dai, Z.; Lin, Y. Comparison of electrolyte and glucose levels measured by a blood gas analyzer and an automated biochemistry analyzer among hospitalized patients. J Clin Lab Anal 2020, 34, e23291. [CrossRef]
- Cascales, J.P.; Li, X.; Roussakis, E.; Evans, C.L. A Patient-Ready Wearable Transcutaneous CO(2) Sensor. Biosensors (Basel) 2022, 12. [CrossRef]
- Corbo, J.; Bijur, P.; Lahn, M.; Gallagher, E.J. Concordance between capnography and arterial blood gas measurements of carbon dioxide in acute asthma. Ann Emerg Med 2005, 46, 323-327. [CrossRef]
- Conway, A.; Tipton, E.; Liu, W.H.; Conway, Z.; Soalheira, K.; Sutherland, J.; Fingleton, J. Accuracy and precision of transcutaneous carbon dioxide monitoring: A systematic review and meta-analysis. Thorax 2019, 74, 157-163. [CrossRef]
- Janssens, J.P.; Laszlo, A.; Uldry, C.; Titelion, V.; Picaud, C.; Michel, J.P. Non-invasive (transcutaneous) monitoring of PCO2 (TcPCO2) in older adults. Gerontology 2005, 51, 174-178. [CrossRef]
- Tipparaju, V.V.; Mora, S.J.; Yu, J.; Tsow, F.; Xian, X. Wearable Transcutaneous CO(2) Monitor Based on Miniaturized Nondispersive Infrared Sensor. IEEE Sens J 2021, 21, 17327-17334. [CrossRef]
- Gezer, M.; Bulucu, F.; Ozturk, K.; Kilic, S.; Kaldirim, U.; Eyi, Y.E. Effectiveness of the Stewart Method in the Evaluation of Blood Gas Parameters. Turk J Emerg Med 2015, 15, 3-7. [CrossRef]
- Lang, W.; Zander, R. The accuracy of calculated base excess in blood. Clin Chem Lab Med 2002, 40, 404-410. [CrossRef]
- Severinghaus, J.W. Siggaard-Andersen and the “Great Trans-Atlantic Acid-Base Debate”. Scand J Clin Lab Invest Suppl 1993, 214, 99-104.
- Saddawi-Konefka D, C.J. Hemodynamic Monitoring. Availabe online: (accessed on.
- Bunce, C. Correlation, agreement, and Bland-Altman analysis: Statistical analysis of method comparison studies. Am J Ophthalmol 2009, 148, 4-6. [CrossRef]
- Baumann, P.; Gotta, V.; Adzikah, S.; Bernet, V. Accuracy of a Novel Transcutaneous PCO2 and PO2 Sensor with Optical PO2 Measurement in Neonatal Intensive Care: A Single-Centre Prospective Clinical Trial. Neonatology 2022, 119, 230-237. [CrossRef]
- Gronlund, J. Evaluation of factors affecting relationship between transcutaneous PO2 and probe temperature. J Appl Physiol (1985) 1985, 59, 1117-1127. [CrossRef]
- van Wijk, J.J.; van Weteringen, W.; Hoeks, S.E.; Staals, L.M. Validation of a new combined transcutaneous tcPCO(2) and tcPO(2) sensor in children in the operating theater. Paediatr Anaesth 2022, 32, 429-435. [CrossRef]
- Abe, Y.; Hashimoto, I.; Goishi, K.; Kashiwagi, K.; Yamano, M.; Nakanishi, H. Transcutaneous PCO2 Measurement at Low Temperature for Reliable and Continuous Free Flap Monitoring: Experimental and Clinical Study. Plast Reconstr Surg Glob Open 2013, 1, 1-8. [CrossRef]
- Sorensen, L.C.; Brage-Andersen, L.; Greisen, G. Effects of the transcutaneous electrode temperature on the accuracy of transcutaneous carbon dioxide tension. Scand J Clin Lab Invest 2011, 71, 548-552. [CrossRef]
- Rafferty, T.D.; Morrero, O. Skin-fold thickness, body mass, and obesity indexes and the arterial to skin-surface PO2 gradient. Arch Surg 1983, 118, 1142-1146. [CrossRef]
- Kazar, P. System For Non-Invasive Examination of Blood Environment Parameters. 2022.
- Bland, J.M.; Altman, D.G. Statistical methods for assessing agreement between two methods of clinical measurement. Lancet 1986, 1, 307-310.
- Giavarina, D. Understanding Bland Altman analysis. Biochem Med (Zagreb) 2015, 25, 141-151. [CrossRef]
- Jameson, L. Hyponatremia and hypernatremia. In Endocrinology: Adult and Pediatric, 7th ed.; Elsevier: Philadelphia, PA, 2016.
- Adams, J.G. Potassium. In Emergency Medicine: Clinical Essentials, Saunders Elsevier: Philadelphia, PA, 2013.
- Giavarina, D. Blood biochemistry: Measuring major plasma electrolytes. In Critical Care Nephrology, 3rd ed.; Ronco C, B.R., Kellum JA, Ricci Z, Ed. Elsevier: Philadelphia, PA, 2019.
- Barbagallo, M.; Dominguez, L.J.; Licata, G.; Resnick, L.M. Effects of aging on serum ionized and cytosolic free calcium: Relation to hypertension and diabetes. Hypertension 1999, 34, 902-906. [CrossRef]
- Longo, D.L. Disorders of hemoglobin. In Harrison’s Principles of Internal Medicine, 19 ed.; McGraw-Hill Education: New York, NY, 2015.
- Williams, A.J. ABC of oxygen: Assessing and interpreting arterial blood gases and acid-base balance. BMJ 1998, 317, 1213-1216. [CrossRef]
- Verma, A.K., Roach P. The interpretation of arterial blood gases. Aust Prescr 2010, 33, 124-129. [CrossRef]
- Castro, D.; Patil, S.M.; Keenaghan, M. Arterial Blood Gas. In StatPearls, Treasure Island (FL), 2022.
- Romanski, S.O. Interpreting ABGs in four easy steps (continuing education credit). Nursing 1986, 16, 58-64.
- Adrogué, H.J., Madia,s N.E. Respiratory acidosis, respiratory alkalosis, and mixed disorders. In Comprehensive Clinical Nephrology, Feehally J, F.J., Tonelli M, Johnson RJ, Ed. Elsevier: Philadelphia, PA, 2019.
- Blake, D.F.; Young, D.A.; Brown, L.H. Transcutaneous oximetry: Variability in normal values for the upper and lower limb. Diving Hyperb Med 2018, 48, 2-9. [CrossRef]
Figure 1.
The original measured DBC dataset in comparison with the i-STAT values.
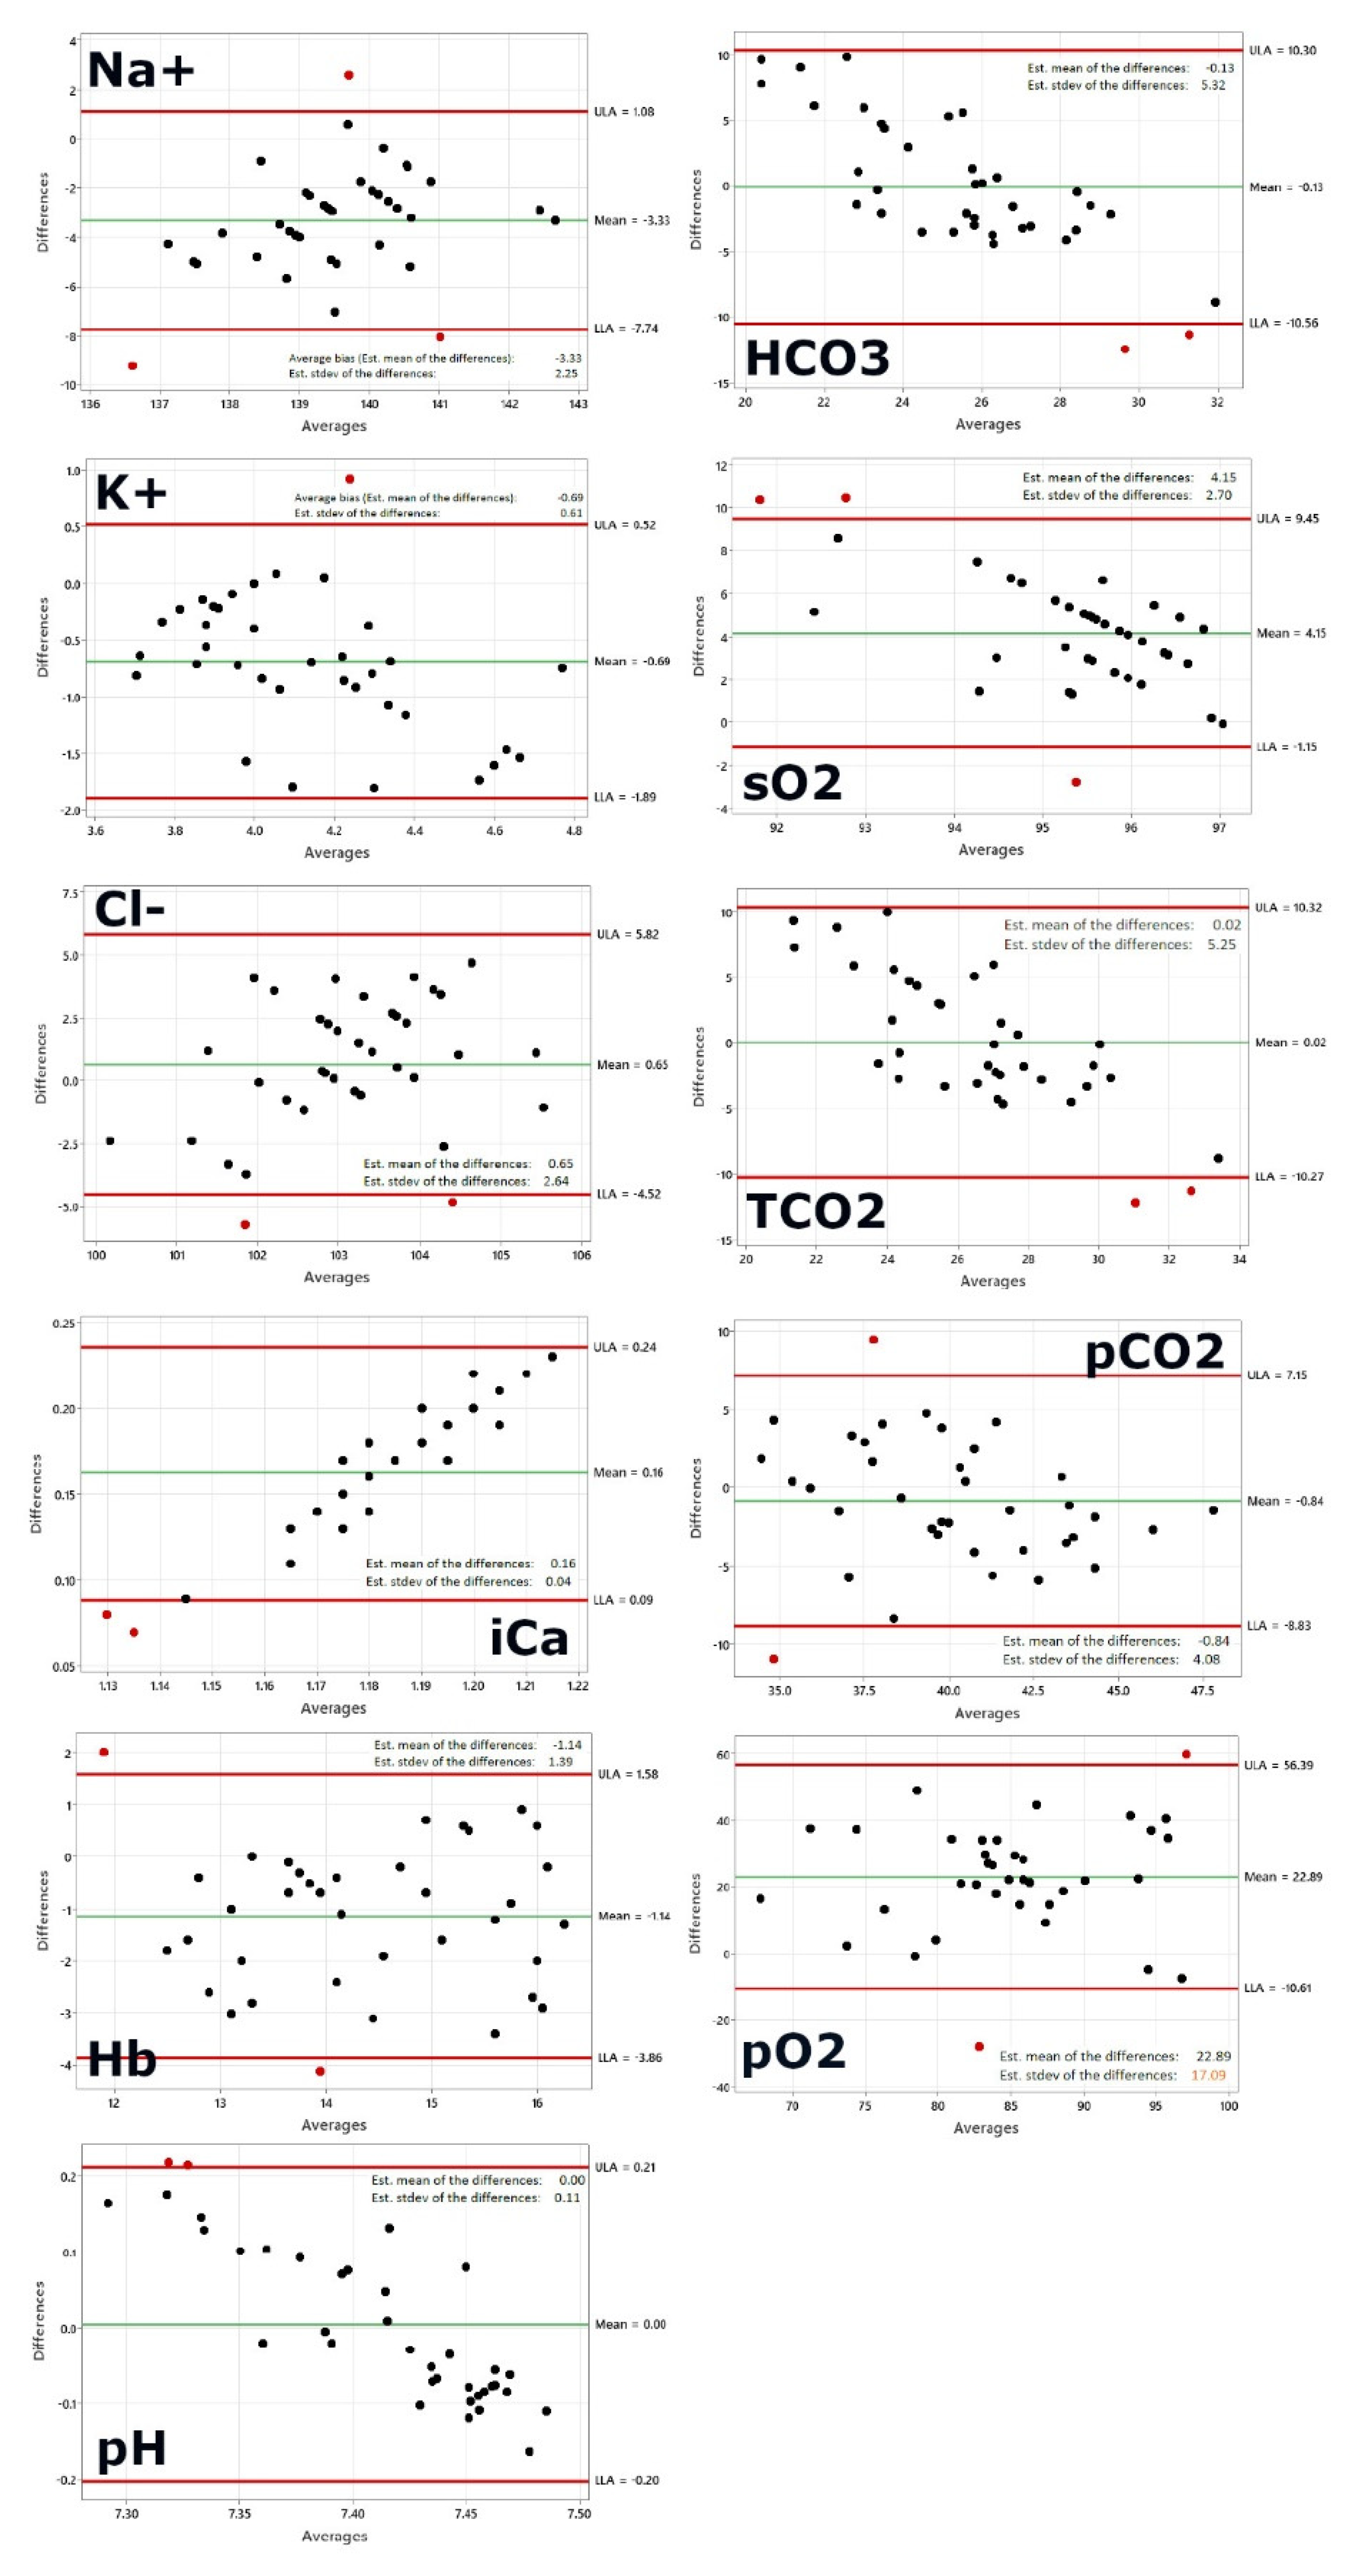
Figure 2.
Comparison of the re-calculated dataset using i-STAT pO2 and pCO2 values. Hereby, the pO2 values used have been corrected with a factor of 0.76 to match the systematic difference between transcutaneous measurements and an arterial blood draw. In addition, the right panel also shows on the left of each Bland-Altman plot a distribution plot of differences between measurements by the two methods. The red curve represents Normal distribution.
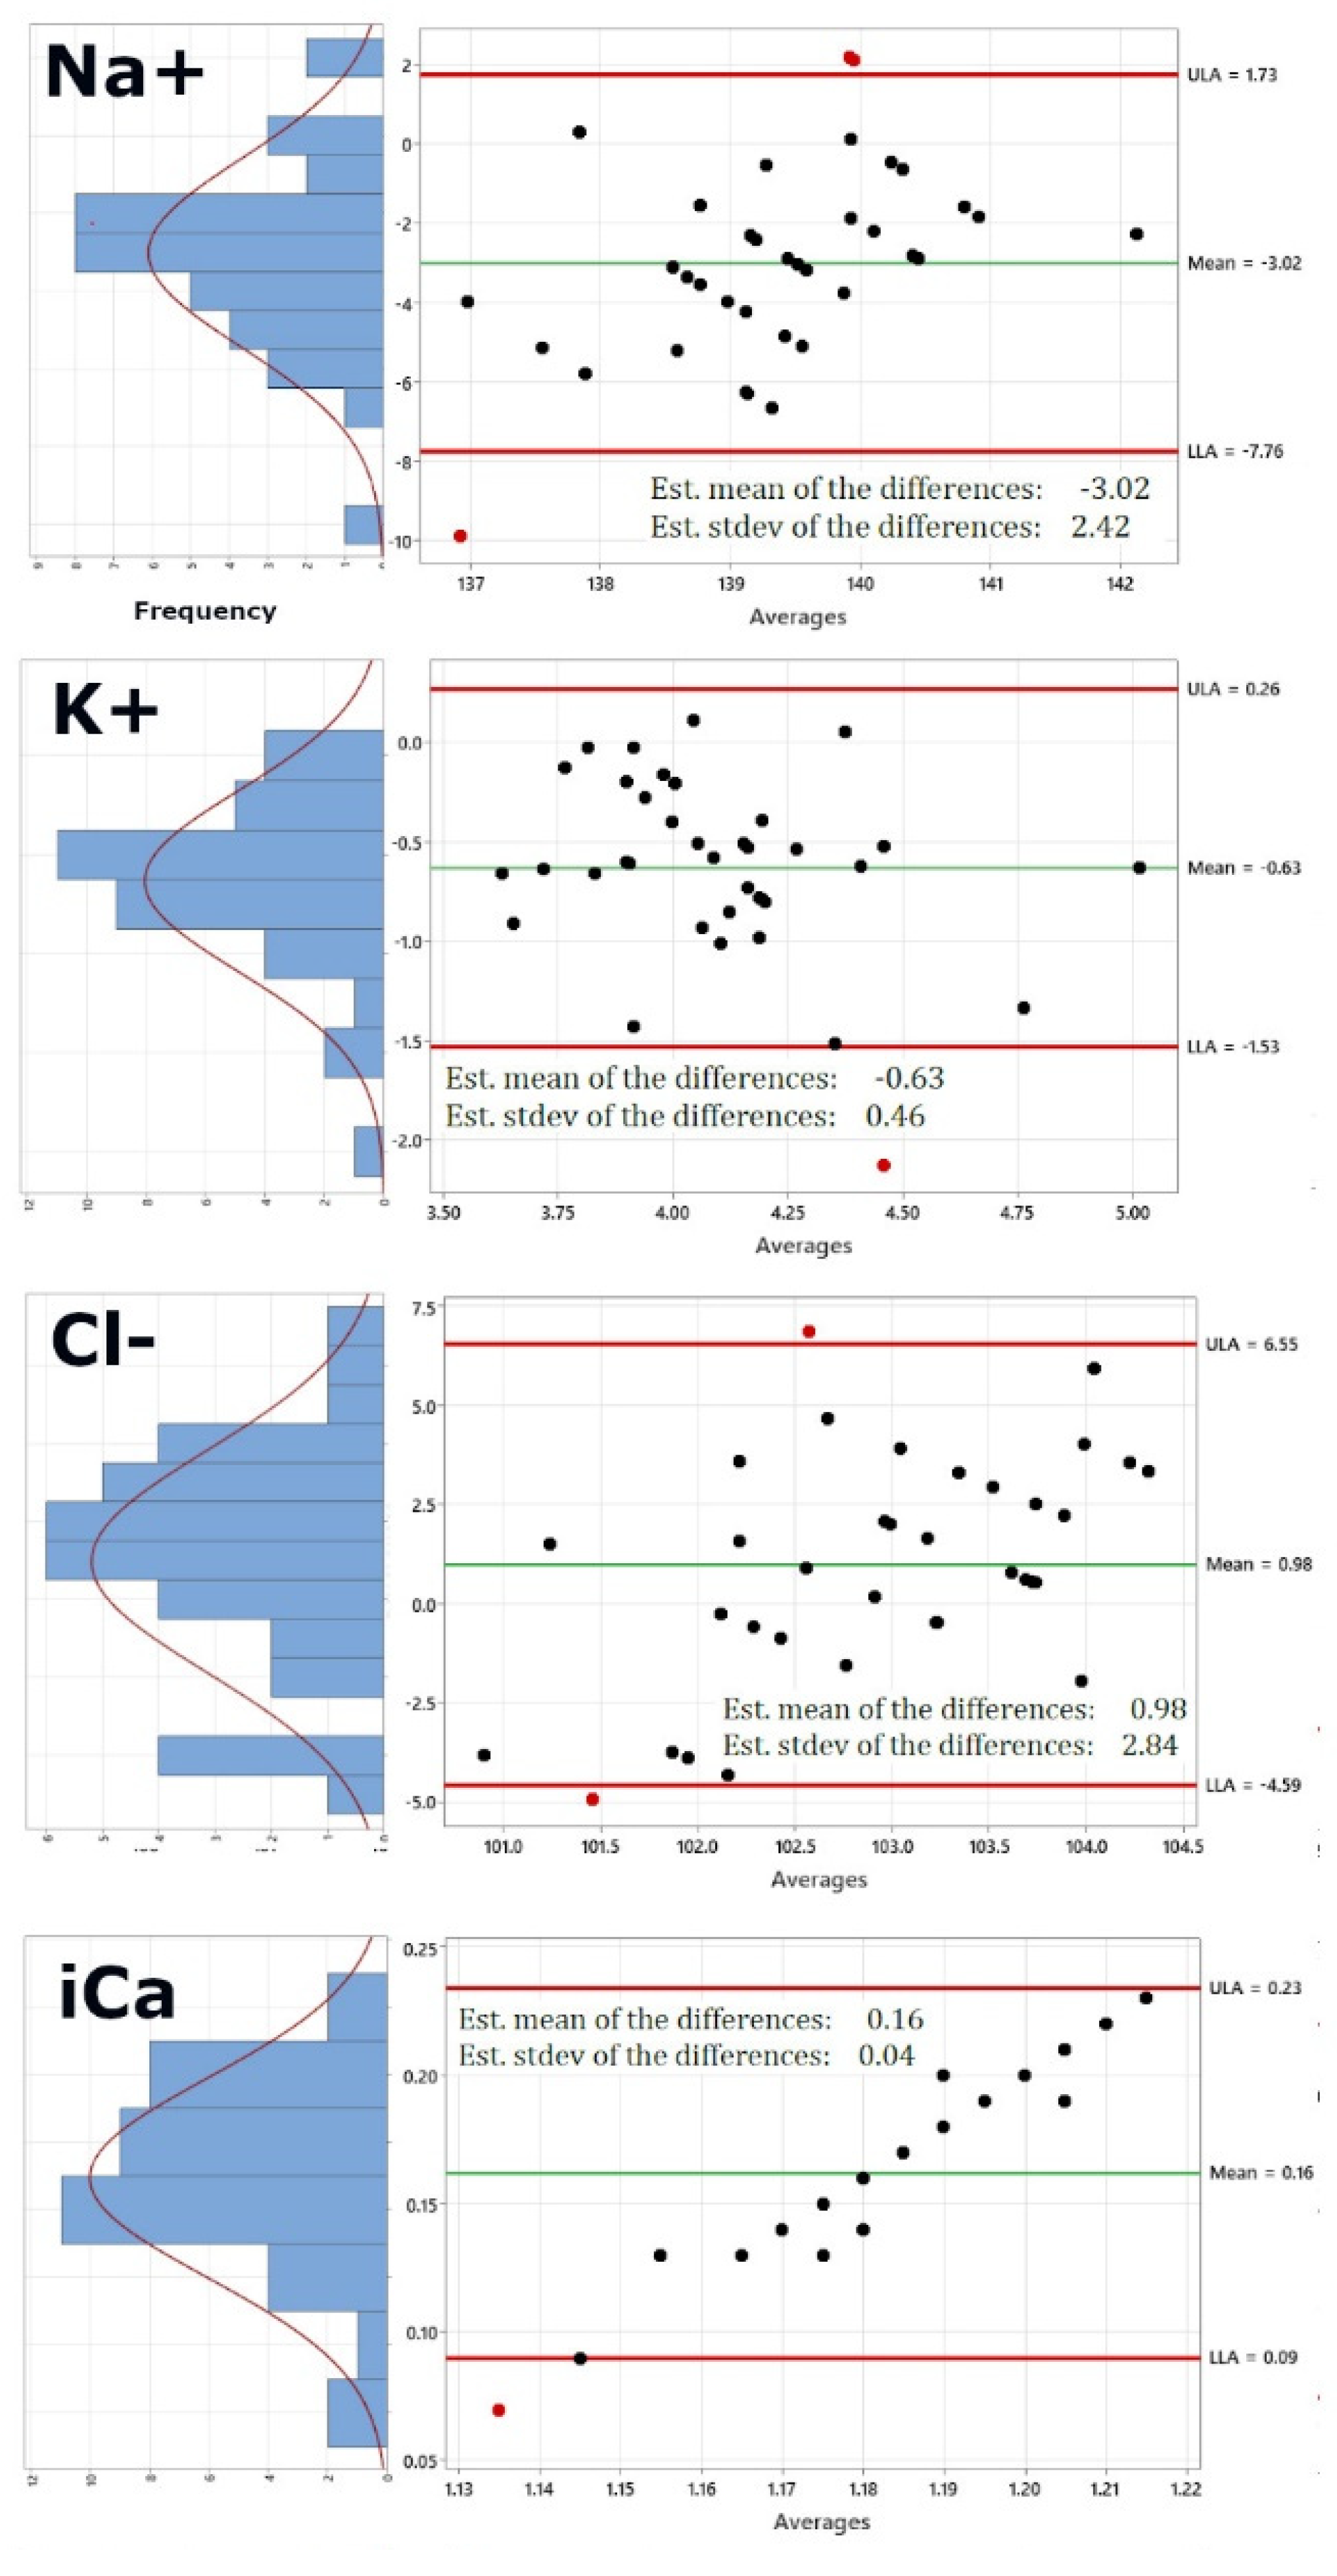
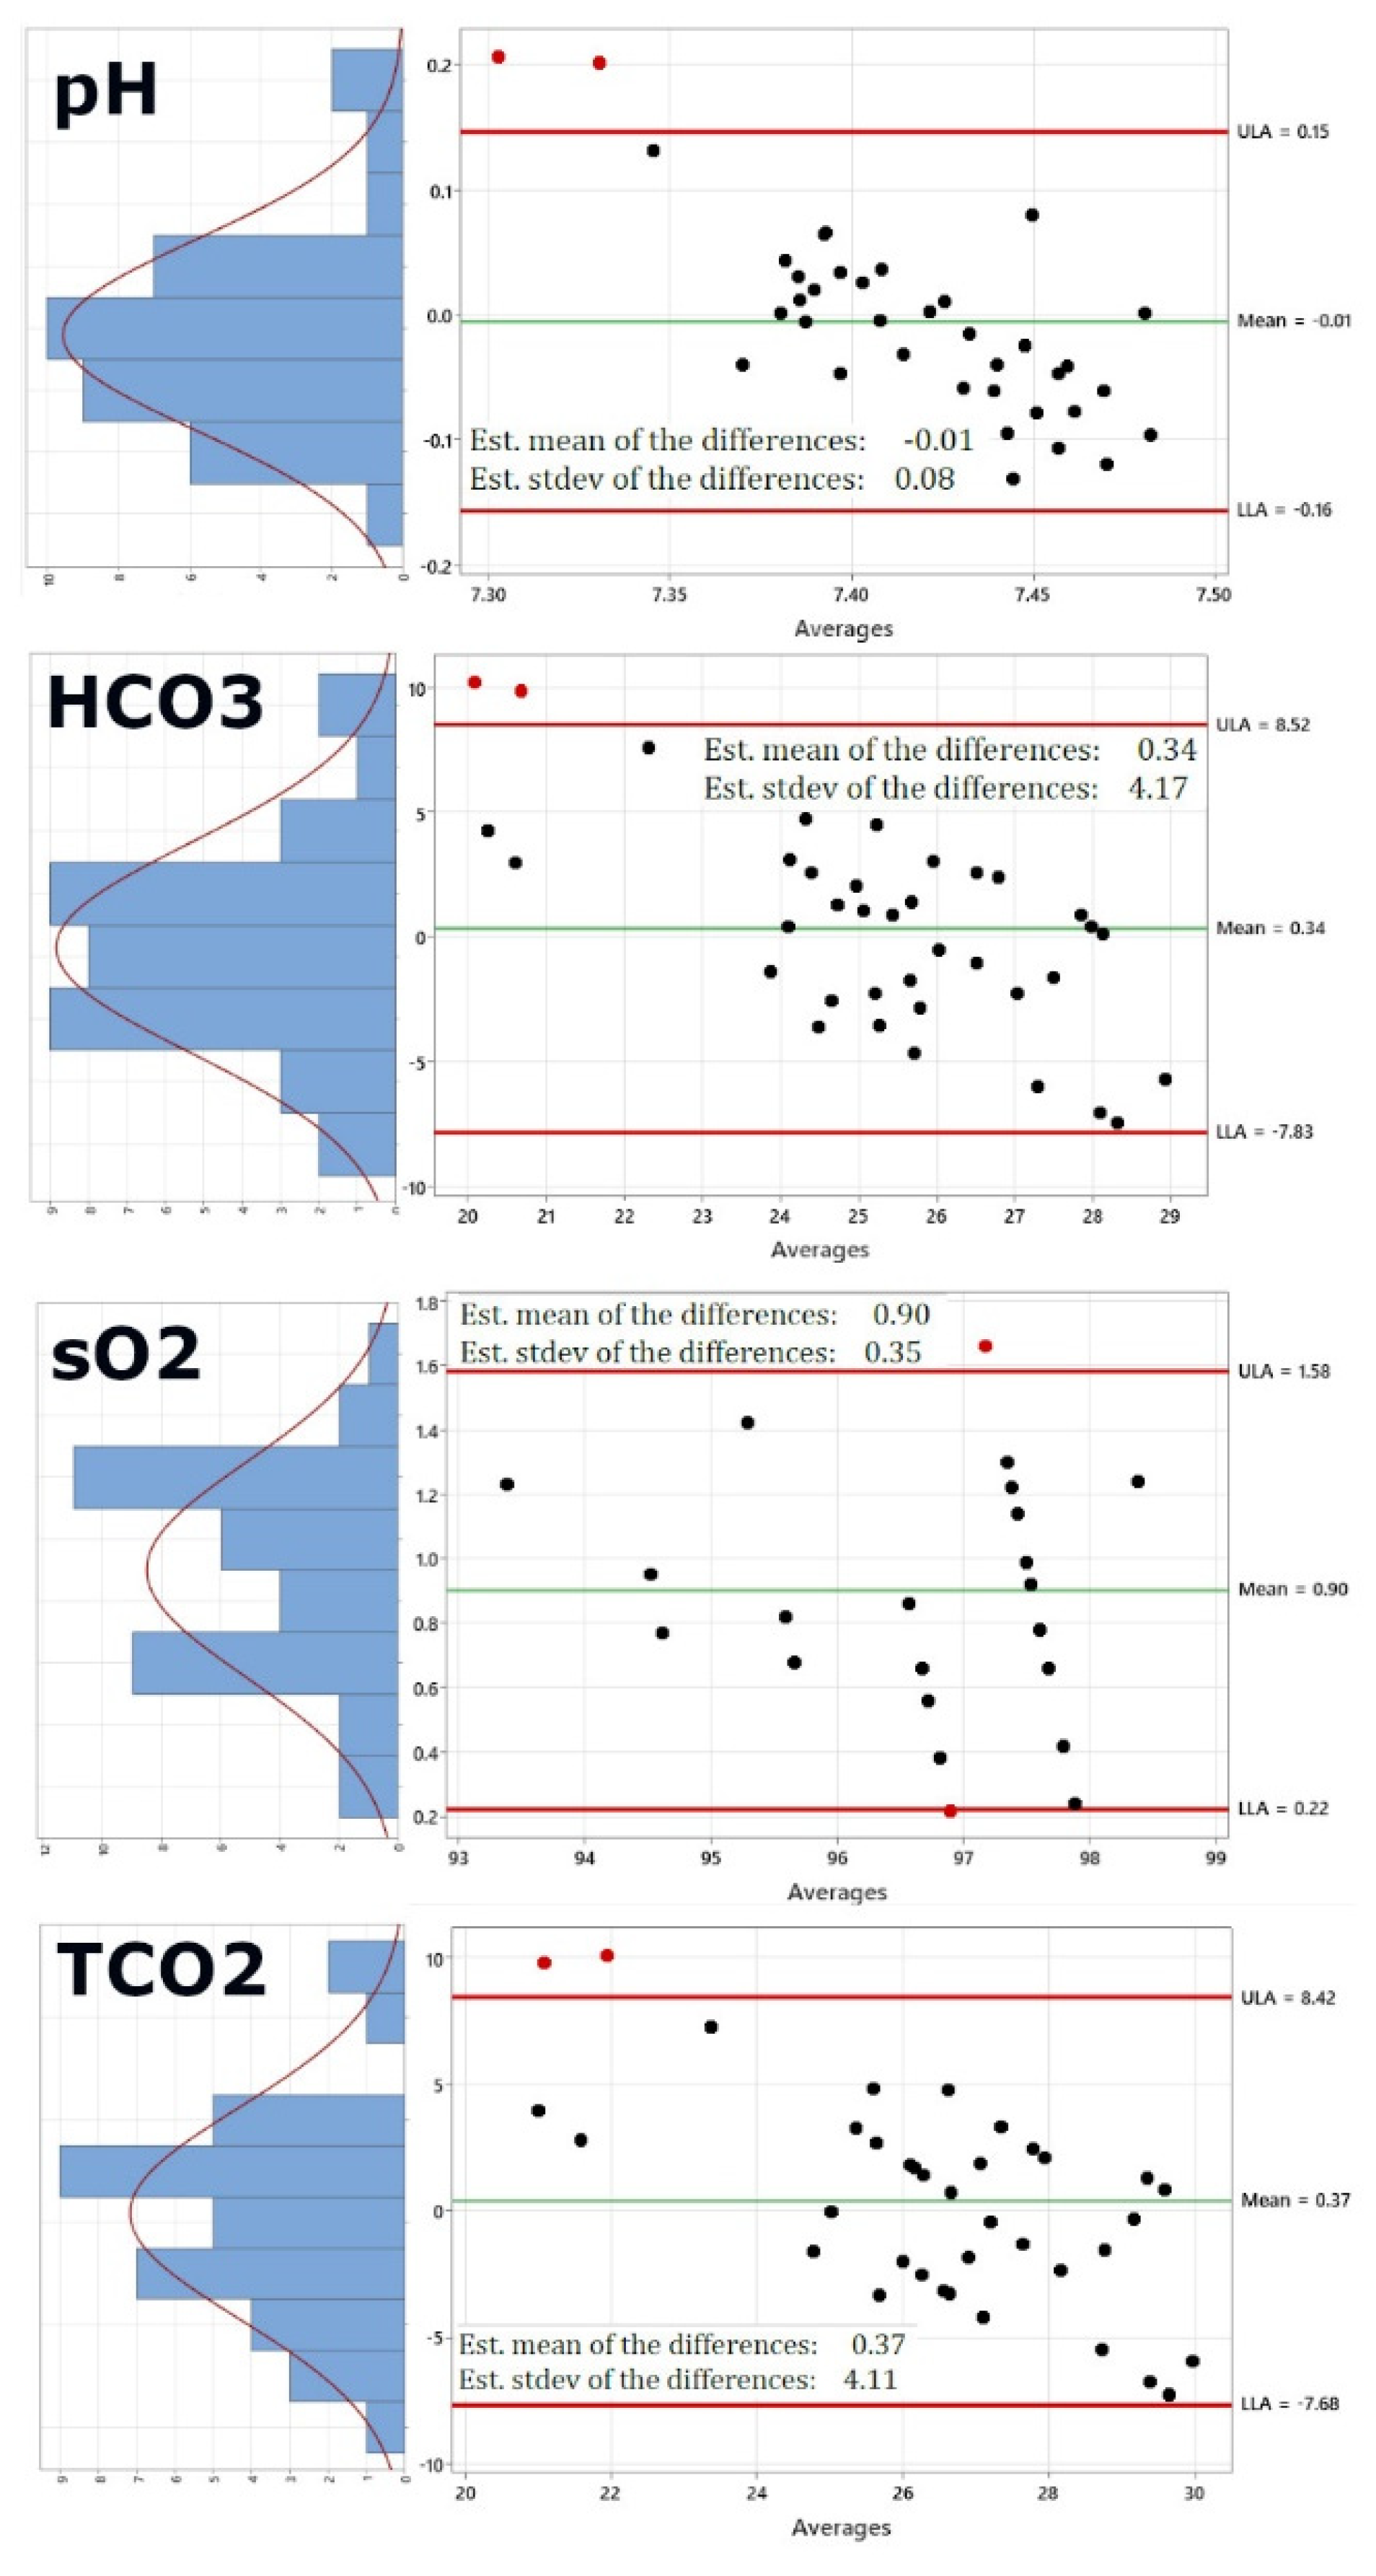

Table 1.
Characteristics of subjects (N=37) in the DBC vs i-STAT study .
| Characteristics | Number |
|---|---|
| Age, years (Mean + SD; Range) | (42.4 + 13.1; 18-64) |
| Height, inches (Mean + SD; Range) | (67.2 + 3.8; 60-74) |
| Weight, pounds (Mean + SD; Range) | (193.6 + 37.7; 122-285) |
| Gender | |
| Male | 24 |
| Female | 13 |
| Race | |
| White | 28 |
| Black | 8 |
| Asian | 1 |
| Ethnicity | |
| Hispanic | 15 |
| Non-Hispanic | 22 |
| Comorbidity | |
| Present | 13 |
| Absent | 24 |
| Chronic Medications | |
| Yes | 20 |
| No | 17 |
| Natural OTC Products | |
| Yes | 11 |
| No | 26 |
Table 2.
Comparison of comfort level from the questionnaire filled by the study subjects.
| Questions | DBC | i-STAT | p-value a |
|---|---|---|---|
| Q1. Emotion Low/High: I am worried about how I look when I wear this device. I feel tense or on edge because I am wearing the device. | 0.338 | 2.297 | 0.002 |
| Q2. Attachment Low/High: I can feel the device on my body. I can feel the device moving. | 0.392 | 3.054 | <0.001 |
| Q3. Harm Low/High: The device is causing me some harm. The device is painful to wear. | 0.149 | 4.189 | <0.001 |
| Q4: Perceived change Low/High: Wearing the device makes me feel physically different. I feel strange wearing the device. | 0.189 | 2.230 | 0.001 |
| Q5: Movement Low/High: The device affects the way I move. The device inhibits or restricts my movement. | 0.649 | 2.689 | 0.002 |
| Q6: Anxiety Low/High: I do not feel secure wearing the device. | 0.243 | 2.392 | <0.001 |
p = probability level. a Significant at p < 0.05.
Disclaimer/Publisher’s Note: The statements, opinions and data contained in all publications are solely those of the individual author(s) and contributor(s) and not of MDPI and/or the editor(s). MDPI and/or the editor(s) disclaim responsibility for any injury to people or property resulting from any ideas, methods, instructions or products referred to in the content. |
© 2023 by the authors. Licensee MDPI, Basel, Switzerland. This article is an open access article distributed under the terms and conditions of the Creative Commons Attribution (CC BY) license (http://creativecommons.org/licenses/by/4.0/).
Copyright: This open access article is published under a Creative Commons CC BY 4.0 license, which permit the free download, distribution, and reuse, provided that the author and preprint are cited in any reuse.


