
Submitted:
26 January 2023
Posted:
31 January 2023
You are already at the latest version
Preprints on COVID-19 and SARS-CoV-2
Abstract
COVID-19 is a pandemic triggered by the coronavirus SARS-CoV-2 whose peak occurred in the years 2020 and 2021. The main target of the virus is the lung and infection is associated to an accentuated inflammatory process involving mainly the innate arm of the immune system. Here, we described the induction of a pulmonary inflammatory process triggered by the intranasal (IN) instillation of UV-inactivated SARS-CoV-2 in C57BL/6 mice and then the evaluation of vitamin D (VitD) ability to control this process. The assays used to estimate the severity of lung involvement included total and differential number of cells in the BALF, histopathological analysis, quantification of T cell subsets and inflammatory mediators by RT-PCR, cytokine quantification in lung homogenates and flow cytometric analysis of cells recovered from lung parenchyma. IN instillation of inactivated SARS-CoV-2 triggered a pulmonary inflammatory process, consisting of various cell types and mediators, resembling the typical inflammation found in COVID-19 patients. This inflammatory process was significantly decreased by IN delivery of vitD, but not by its IP administration, suggesting that this hormone has therapeutic potential in COVID-19 if locally applied.
Keywords:
SARS-CoV-2
; COVID-19
; lung
; inflammation
; mice
; vitamin D
1. Introduction
The SARS-CoV-2, a newly identified β-coronavirus, is the causative agent of the pandemic respiratory pathology known as COVID-19 whose peak occurred in 2020 and 2021. Even though most of the affected individuals are asymptomatic or develop mild symptoms, a minor proportion evolves towards a severe pathology. A plethora of factors related to the host, the environment, and the virus itself can affect disease outcome [1]. Even though the lung is considered the primary target of this infection, the virus can spread to many other organs as kidneys, intestine, liver, pancreas, spleen, muscles, and the nervous system [2,3]. Pulmonary manifestations vary from asymptomatic or mild pneumonia to a severe disease accompanied by hypoxia, shock, respiratory failure, and multiorgan deterioration or death [4]. The complexity of this infection includes its aggravation by other comorbidities as hypertension, diabetes and cardiovascular diseases [5] and by the adverse outcomes that may manifest after acute illness and that are known as Long-COVID. There are emerging data on an extensive spectrum of sequelae associated with Long-COVID which are mainly characterized by cardiovascular, pulmonary and neuropsychiatric manifestations [6].
It is well established that the innate immune system functions as the first line of defense against the pathogens, including the SARS-CoV-2. This initial response is intended to limit viral infection and to promote the development of the adaptive immunity. The sense of danger is detected by pattern-recognition receptors (PRRs) present in the surface, cytosol or nucleus of macrophages, monocytes, dendritic cells (DCs), neutrophils and innate lymphoid cells (ILCs) which recognize PAMPs (pathogen-associated molecular patterns). Several PRRs are able to mediate signaling pathways in response to interaction with SARS-CoV-2 including Toll-like receptors (TLRs), retinoic acid-inducible gene-I-like receptors (RLRs), and nucleotide-binding oligomerization domain (NOD)-like receptors (NLRs). A detailed description of this interaction was recently published by [7]. A growing body of clinical data has been suggested that COVID-19 severity is mostly determined by inflammation and the associated cytokine storm [8,9]. The use of appropriated animal models is allowing a better understanding of infection and pathogenesis triggered by SARS-CoV-2. Most of the experimental in vivo studies have been done using macaques, cats, ferrets, hamsters and mice, being hamsters and genetically modified mice widely employed. Recently, [10] demonstrated that hamsters intranasally (IN) inoculated with SARS-CoV-2 developed a viral pneumonia and systemic illness showing histological evidence of lung injury, increased pulmonary permeability, acute inflammation, and hypoxemia. They also demonstrated upregulation of inflammatory mediators that persisted after infection clearance.
Many of the findings described in mice are consistent with severe COVID-19 in patients. For example, the IN inoculation of SARS-CoV-2 in transgenic mice expressing the ACE2 receptor driven by the cytokeratin-18 resulted in high virus levels in the lungs. An accentuated deterioration in pulmonary function was identified a few days later which coincided with a local infiltration of monocytes, neutrophils and activated T cells, and with an impressive up-regulation of innate immunity characterized by signatures of type I and II IFN signaling and leukocyte activation pathways [11]. Standard laboratory mice strains and non-infectious virus components have also been used to establish models of lung inflammation. For example [12], described the induction of acute lung injury associated with inflammation by SARS-CoV-2 N protein intratracheal inoculation in C57BL/6, C3H/HeJ, and C3H/HeN through the NF-kB activation. [13] described a model of pulmonary inflammation induced by lung coadministration of aerosolized S protein together with LPS in C57BL/6 mice. This procedure significantly increased the NF-kB activation, the number of inflammatory macrophages and polymorphonuclear cells (PMNs) in the bronchoalveolar lavage fluid (BALF) and also triggered pathognomonic changes in the lungs. BALF analysis revealed an increased level of inflammatory cytokines and chemokines resembling a cytokine storm.
Most of the therapeutic strategies consist in clinical trials of repurposing existing drugs already used for other infectious or inflammatory pathologies. Anti-viral drugs, monoclonal antibodies, high titer convalescent plasma, and immunomodulators are being investigated [14,15,16]. Observational studies have shown that serum Vitamin D (VitD) levels were inversely correlated with COVID-19 incidence and severity suggesting that supplementation with this hormone could be explored to prevent or treat COVID-19 patients [17]. Since then, VitD has been tested, alone or associated with other pharmaceuticals, as a potential prophylactic, immunoregulatory and even neuroprotective measure for this infection [18,19]. According to the ClinicalTrials.gov, there are 31 completed studies involving tests with VitD in COVID-19 patients. Some of these trials aimed to assess its effect on the lungs and they indicated that one single dose did not prevent the respiratory worsening of hospitalized patient [20] neither reduced hospital length in moderate to severe COVID-19 [21]. On the other hand, other reports, mainly by using multiple doses of this vitamin, have been more promising. [22] described shorter lengths of stay, lower oxygen requirements and a reduction in inflammatory markers status. As reported by [23], a 5000 IU daily supplementation during 15 days in VitD deficient patients reduced the time to recovery for cough and gustatory sensory loss.
To the best of our knowledge, most of these trials were done by administration of VitD by oral route. In this context, we initially evaluated if the IN instillation of UV inactivated SARS-CoV-2 in C57BL/6 mice was able to trigger an inflammatory pulmonary process and then we investigated if this process could be modulated by VitD administered by systemic (intraperitoneal) or local (IN) routes.
2. Materials and Methods
2.1 General experimental design
In this investigation we characterized a model of pulmonary inflammation induced by IN administration of 3 doses of inactivated SARS-CoV-2 in C57BL/6 mice and then evaluated the ability of vitamin D, administered by intraperitoneal (4 doses) or IN (3 doses) routes to control or modify this process. The following methodologies were used: total and differential count of cells present in the BALF, histopathological analysis of the target tissue, determination of lymphocyte subpopulations and inflammatory mediators by RT-PCR, flow cytometric analysis of cells recovered from the lung and cytokine quantification in pulmonary homogenates. These analyses were performed on the seventh day after administration of the first virus dose. Induction of lung inflammation and evaluation of VitD therapeutic potential are outlined in Scheme 1- General Experimental design, A and B, respectively, provided at the supplementary data section.
2.2 Animals
Female C57BL/6 mice were acquired from the Animal Facility of the Animal Research and Production Center (ARPC/IBTECH), UNESP, Botucatu or from the Animal Facility of the University of Sao Paulo. Animals were housed in polypropylene cages with a maximum capacity for 4-5 animals, in a rack with individual ventilation (Alesco). The temperature was controlled by air conditioning and maintained at about 22ºC. The animals received water and commercial feed ad libitum and were handled according to the standards of the ethics committee in animal experimentation of IB, UNESP, Botucatu (CEUA Protocol No. 1959140820, ID: 000129) and the ethics committee in animal experimentation of the ICB, USP (CEUA Protocol 3147240820).
2.3 SARS-CoV-2 propagation and inactivation
In this study was used a B lineage isolate of SARS-CoV-2 (SARS.CoV2/SP02.2020, GenBank accession number MT126808) kindly provided by Edison Luiz Durigon (PhD, ICB-USP), recovered from a sample collected on Feb 28, 2020, in Brazil. The virus was propagated in Vero cells (CCL-81; ATCC, Manassas, VA, USA) according to the previously described protocol [24] in a biosafety level 3 laboratory (BSL-3) located in the University of Campinas. All viral stocks used in the study were titrated by plaque forming assay according to previously published studies [25]. Briefly, decimal serially diluted samples were incubated with Vero cells into 24-wells plates for 1h at 37°C and 5% CO2. After adsortion, cells were overlaid and maintained with semi-solid medium (1% w/v carboxymethylcellulose in DMEM supplemented with 5% FBS) for 4 days. After fixation with 8% formaldehyde solution and staining with 1% methylene blue (Sigma-Aldrich), the viral titer was determined by dividing the average number of plates by the value obtained from the multiplication between the dilution factor and the volume of the viral suspension added to the plate. The results were expressed as viral plaque forming units (PFU)/mL of sample. The virus used in this study, with a titer of 8x10⁶ PFU/mL, was inactivated by exposure to 7,560 mJ/cm2 of UVC (30 min) according described previously [26]. The supernatant of non-infected Vero cells, inactivated by UVC, was used as a negative control. Inactivation efficacy was determined inoculating the UVC inactivation product into Vero cells. The Vero cells infected with UVC inactivated SARS-CoV-2 showed no cytopathic effect. In addition, no virus was detected in the supernatant of these cells by plaque forming assay or quantitative RT-PCR.
2.4 Induction and characterization of the pulmonary inflammation induced by SARS-CoV-2
We adopted the protocol described by [27]. Briefly, the animals received 3 doses of 4.105 PFU/50 ul, administered on days 1, 3 and 5 which were dispensed with a tip connected to a pipette. The pulmonary inflammatory response was analyzed on the seventh day by using 5 methodologies: total and differential cell counts performed in the BALF, RT-PCR for quantification of transcription factors, cytokines and inflammasome genes, flow cytometry for identification of cells present in the parenchyma, histopathological analysis and cytokine quantification in lung homogenates.
2.5 Bronchoalveolar lavage procedure
The bronchoalveolar washes were obtained from mice previously euthanized with ketamine and xylazine. The animal´s trachea was exposed with the help of scissors and tweezers and a catheter was introduced through which 1ml of sterile PBS was injected and then aspirated. This PBS injection/aspiration process was repeated 3 consecutive times and the samples were centrifuged at 4oC for 10 min, 1500 rpm. The pellets were pooled and resuspended in 300 ul and the total cell concentration determined by using a Neubauer chamber. Smears for differential cell counts were prepared by cytocentrifugation at 600 rpm for 5 min and then stained with the Rapid Pannotic Kit (Laborclin, Paraná, Brazil).
2.6 Quantitative RT-qPCR analysis
Total RNA from lung samples was extracted with the reagent TRIZOL (Invitrogen, Carlsbad, CA, USA) and the synthesis of cDNA (High Capacity RNA-to-cDNA Converter Kit Applied Biosystems, Foster city, CA, USA), according to manufacture recommendations. The quantitative expression of mRNA for the transcription factors Tbx21 (Mm00450960_m1), GATA3 (Mm00484683_m1), RORc (Mm01261022_m1) and Foxp3 (Mm00475162_m1), cytokines IL-6 (Mm00446190_m1), TNF-α (Mm0043258_m1), IFN-у (Mm01168134_m1), IL-12 (Mm00434169_m1), IL-17 (Mm00439618_m1), inflammasome components as NLRP3 (Mm09840904_m1), IL-1β (Mm00434228_m1) and Caspase-1 (Mm00438023_m1), and other inflammatory markers as iNOS (Mm00440502_m1), CPA3 (Mm00483940_m1) and Arginase (Mm00475988_m1) were analyzed by real-time PCR, using the TaqMan system with primers and probes sold by Life Technologies (Applied Biosystems) according to the manufacturer´s recommendations. Gene expression was based on GAPDH (Mm99999915_g1), a reference gene, and presented as a relative change in the fold (2-∆∆ct), using the control group as a calibrator.
2.7 Lung histopathological analysis
Left lung samples were collected on the seventh day after the beginning of IN instillations and then washed with PBS, fixed in 10% buffered formalin for 24 hours, washed and stored in 70% ethanol until inclusion. Five um thick sections from Control (Saline), Culture medium and SARS-CoV-2 groups, were obtained using a Leica RM2245 microtome and stained with H&E. Histopathological alterations were evaluated in a Carl Zeiss microscope GmbH, Oberkochen, Germany, attached to a digital camera (AxioCamHRc, Carl Zeiss).
2.8 Isolation of lung cells and cytometry analysis
In order to differentiate the parenchyma-infiltrating leukocytes from the vascular-associated fraction, mice were intravenously injected with 3ug of FITC-labeled anti-CD45 antibody (Biolegend) in 200 ul of sterile saline solution. After 3 min, mice were euthanized and lungs were perfused and collected for tissue processing. The vascular fraction of leukocytes was identified based on the anti-CD45 FITC staining.
The right lungs, which were removed soon after euthanasia, were shredded, processed in digestion buffer (incomplete RPMI medium – (Sigma, St Louis MO) containing 0,5 mg/ml DNAse I – (Sigma-Aldrich) and 1 mg/ml Colagenase IV – (Sigma Alddrich) and incubated at 37oC, 30 min, 180 rpm. Once homogenized, the digested samples were passed through 70 µm cell strainers, transferred to conical centrifuge tubes containing 8 ml of complete RPMI (3% Fetal bovine serum – (LGC Biotechnology), 10mg/ml penicillin + 10000 units/ml streptomycin – (Hyclone), 0,3 g/ml L-glutamine – (Sigma-Aldrich), 0,0040 g/ml beta-mercaptoethanol – (Sigma-Aldrich), 0,0089 g/mL non-essential amino acids – (Sigma-Aldrich), 0,0089 g/mL sodium pyruvate – (Sigma-Aldrich)) and then centrifuged at 4oC, 8 min, 1600 rpm. Supernatants were discarded, the cells resuspended in 500μL of ACK erythrocyte lysis buffer and incubated on ice. After 2 min, were added 10 ml of complete RPMI and centrifuged again at 4oC, 8 min, 1600 rpm, being the supernatant discarded and the cells resuspended in 1ml of complete RPMI, counted and prepared for cytometry analysis. Two million of lung cells were stained for surface markers or for transcription factors, according to the Table 1. All the antibodies and intranuclear staining were conducted according to the manufacturer´s instructions, by using eBioscience Transcription Factor Buffer set.
Alternatively, 2 million cells were used for intracellular cytokine detection. For labelling of cytokine-producing cells, the cells were incubated for 4 hours with 100μL of stimulus solution (50ng/ml of Phorbol myristate acetate (PMA) (Sigma Aldrich) + 500ng/ml ionomycin (Sigma- Aldrich) + 1μl/ml of stop Golgi (BD Biosciences). Cytokines, transcription factors and cells from innate and specific immunity were then labeled with fluorochrome-conjugated antibodies. Prior to addition of the antibody mix, as specified in Table S1 (available at the Supplementary Data section), all samples from all panels were incubated by 20 min, 4oC with 30μL of Live Dead (LD, Thermo Fisher Scientific), followed by surface staining and intracellular staining (BD-Citofix-Citoperm kit). The data were acquired in the BD LSRFortessa X-20 flow cytometer (BD Biosciences) and the compensation and data analyses were performed using the FlowJo software. Gate strategies are described in Supplementary Figures S2–S4.
2.9 Vitamin D administration by IP and IN routes
1α,25-dihydroxyvitamin D3 (1,25-VitD3, Sigma-Aldrich) was administered intranasally (IN) or intraperitoneally (IP). The 2 therapeutic protocols with 1α,25-dihydroxyvitamin D3 (VitD) were carried out through different strategies. In the IN protocol, each animal was treated with 3 doses of VitD (0.1ug/dose) which were administered simultaneously with the SARS-CoV-2 inoculum (4.105 PFU/each inoculum) in a final volume of 57 μl. This volume was divided between the two nostrils on days 1, 3 and 5. In the IP protocol, each animal was treated with 4 doses of VitD (0.1 ug/100 ul/dose) that were delivered on days 0, 2, 4 and 6 to mice that were instilled with 50 ul of SARS-CoV-2 on days 1, 3 and 5. In both cases, euthanasia was performed at the 7th day after the beginning of the protocol.
2.10 Measurement of serum calcium levels
Blood samples collected after anesthesia were centrifuged, and the sera stored at −20 °C until further analyses. Serum levels of calcium were measured according to the instructions of the manufacturer (Cálcio Arsenazo III, Bioclin-Quibasa Química Básica Ltda, Belo Horizonte, MG, Brazil). In this technique calcium quantification is based on a colorimetric reaction in which calcium reacts with arsenazo III, in an acidic medium, generating a blue complex whose intensity is proportional to calcium concentration in the sample.
2.11 Statistical analysis
In the case of parametric variables, the values were presented in mean and standard error of the mean (SEM) and the comparison between two groups was performed by unpaired t-Test and among three or more groups was performed by ANOVA followed by Tukey test. When the variables were non-parametric, the results were presented in median and interquartile intervals and the comparison between the groups was performed by Mann-Whitney test or Kruskal-Wallis test followed by Dunn's test. The level of significance adopted was 5%. The data were analyzed by the SigmaPlot for Windows version 2.0 statistical package (1995, Jandel Corporation, California, USA). For t-distributed stochastic neighbor embedding (t-SNE) algorithm analysis, 100,000 (Figure 2) or 50.000 (Figure 5) events per sample were downsampled from the live parenchymal leukocytes gate (Supplementary Figure S2) and concatenated. The t-SNE algorithm was applied in the concatenated samples using 2000 interaction and perplexity 80. After that, the cell clusters were identified based on the main cell subsets gated according to Supplementary Figure S2, and the percentage of each cell subset was calculated after segregating the groups based on the sample IDs.
3. Results
3.1 Cell infiltration in the BALF suggests pulmonary inflammation in mice intranasally instilled with inactivated SARS-CoV-2
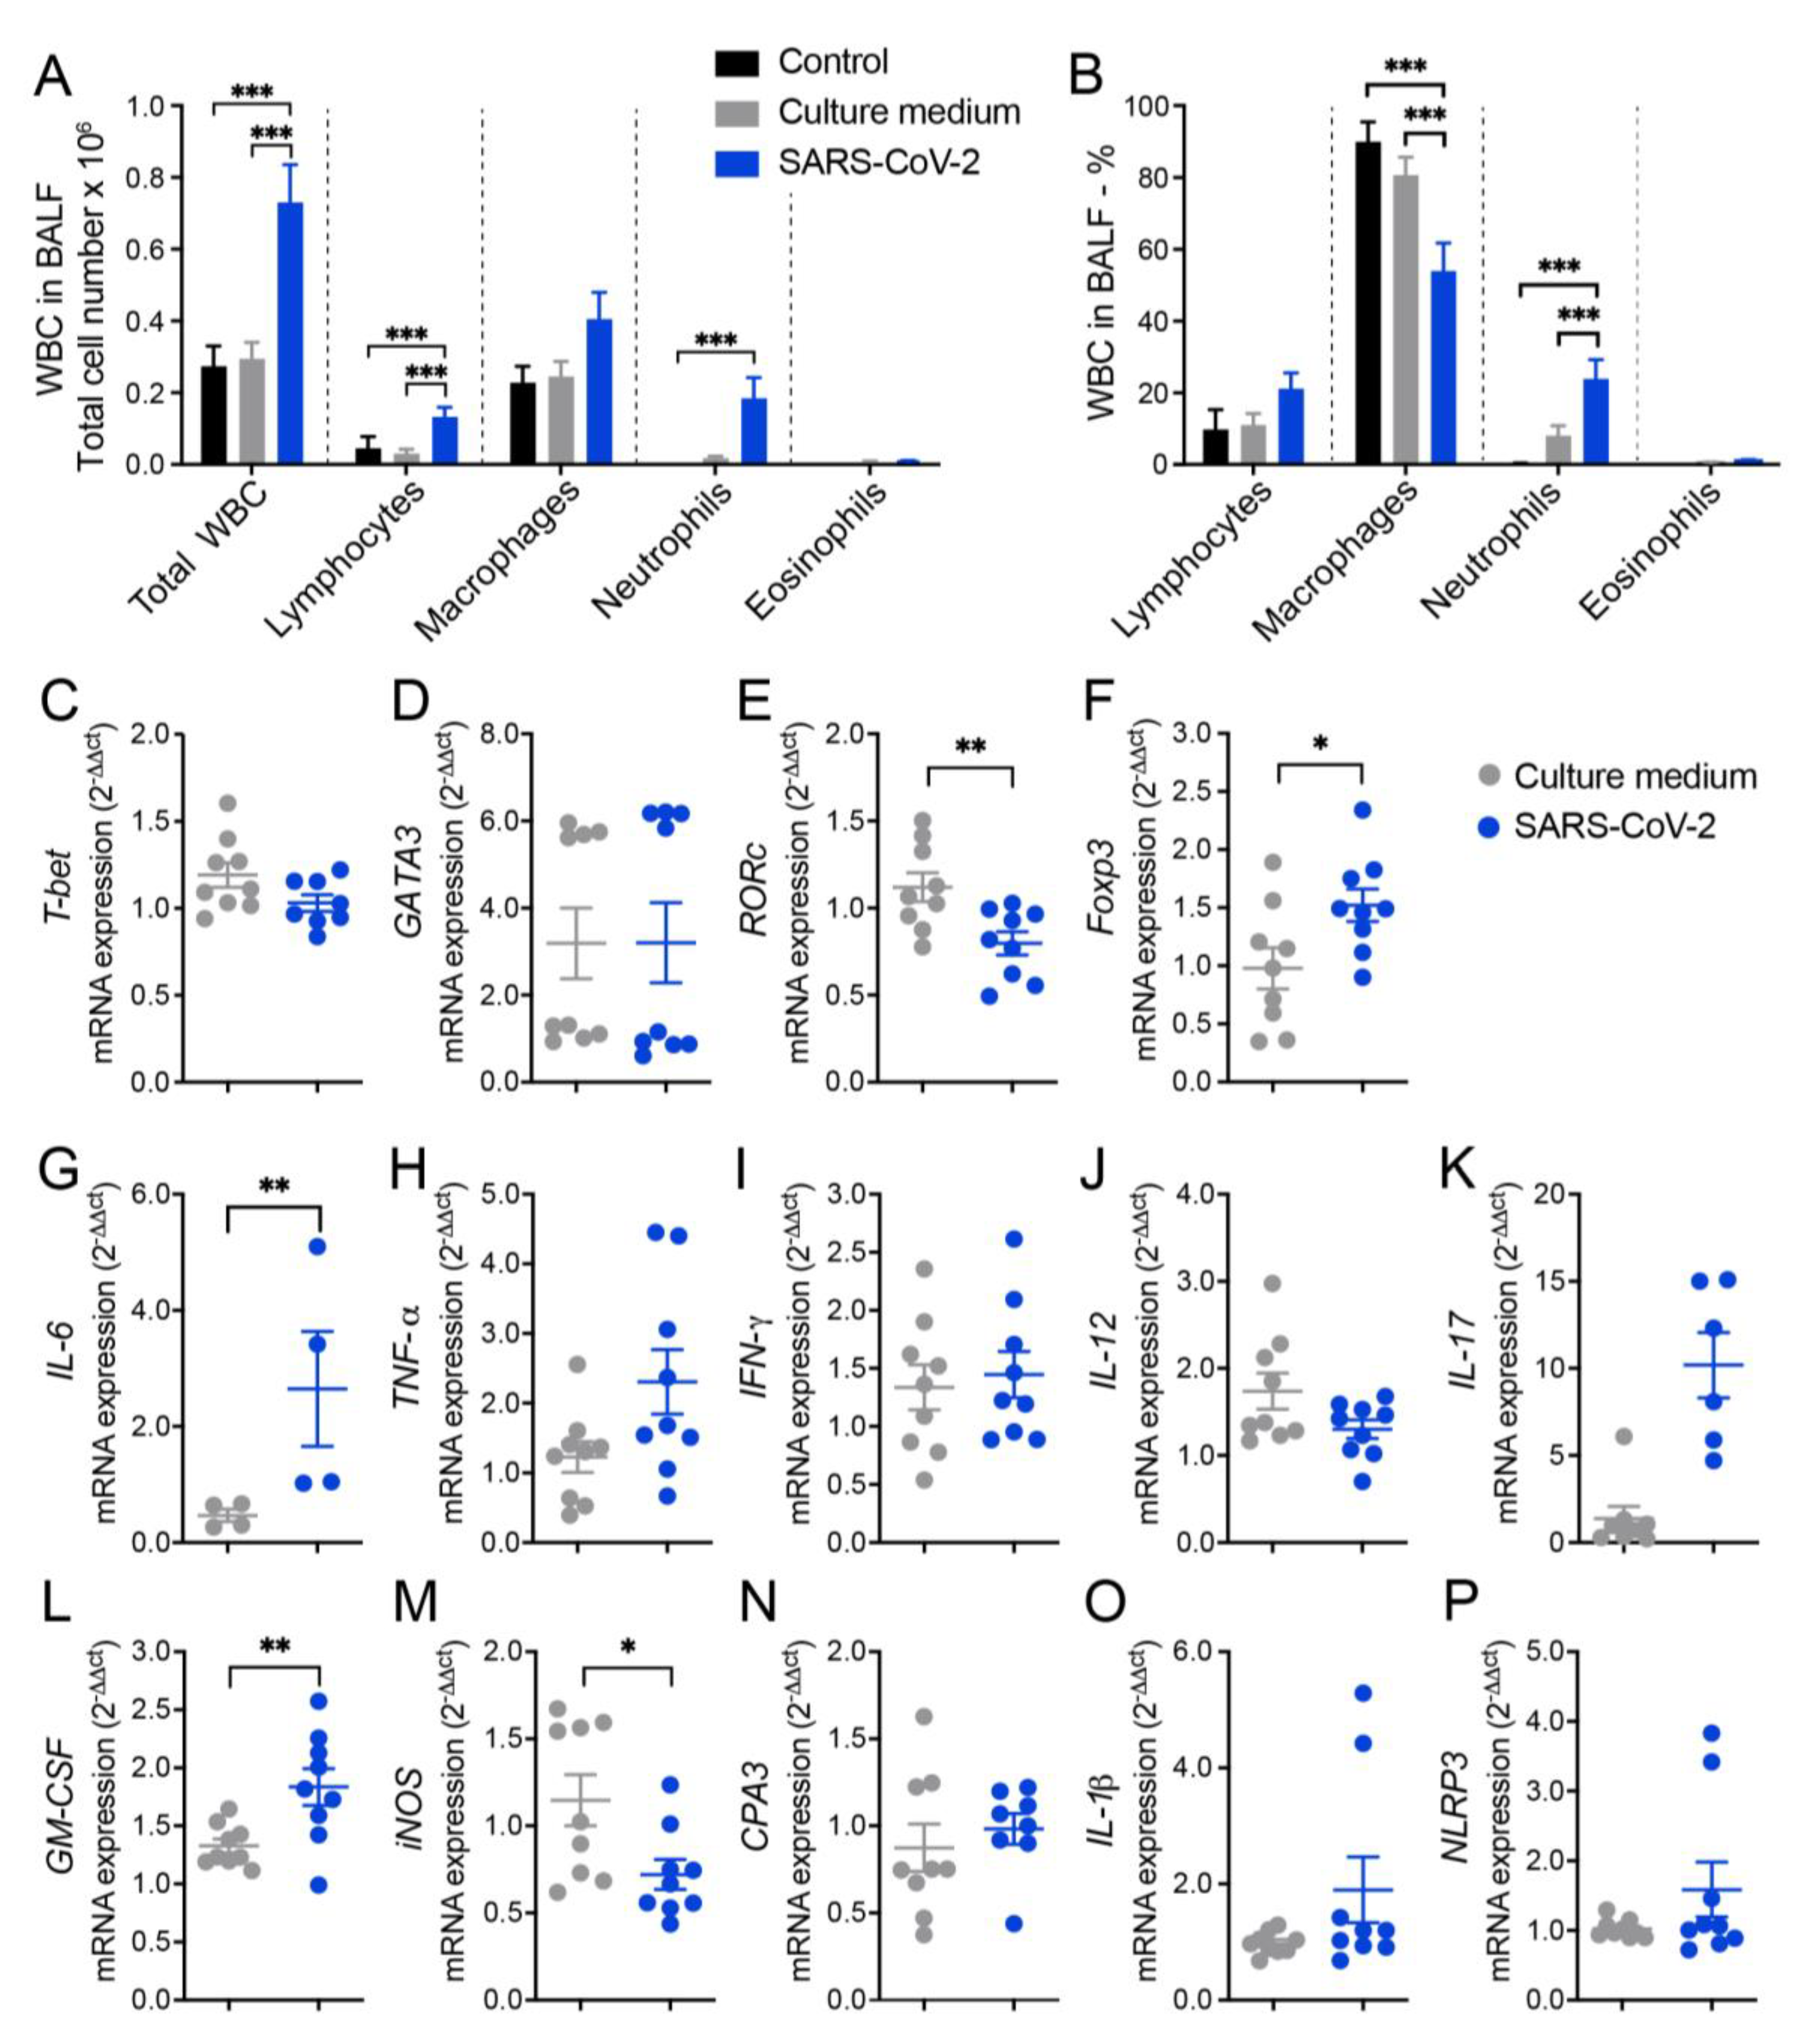
The ability of inactivated SARS-CoV-2 to trigger a lung inflammatory process was initially investigated by analyzing the amount and identity of white blood cells (WBC) obtained from the BALF of mice. Two control groups were included in all initial experimental procedures and were identified as saline and culture medium which corresponded to animals that were anesthetized and instilled with saline 0.9% or with the culture medium used for VERO cell culture and virus propagation, respectively. The total number of WBC and specific cell populations, which were identified in cytospin smears, are shown in Figure 1A and indicate a significant increase in total cell number, as well as in lymphocytes and neutrophils in animals that received SARS-CoV-2 in comparison to the control groups. The percentage of each specific cell population, as illustrated in Figure 1B, was also affected by SARS-CoV-2 and characterized by higher of lymphocytes and neutrophils, and lower percentual of macrophages. Animals injected with saline or culture medium displayed a similar profile characterized by a much smaller number of all cell types, indicating that the culture medium present in SARS-CoV-2 preparation was not triggering a significant pulmonary airway inflammation.
3.2 RT-qPCR from lung homogenates shows alterations in T cell subsets, cytokines and other inflammatory mediators
Next, we measured the relative expression of several genes by RT-PCR which revealed differences between culture medium and SARS-CoV-2 groups. In the SARS-CoV-2 group there was a significantly higher expression of Foxp3 (Figure 1F), IL-6 (Figure 1G) and GM-CSF (Figure 1L) transcripts and a higher, even though not statistically significant, expression of TNF-α (Figure 1H), IL-17 (Figure 1K), IL-1β (Figure 1O), and NLRP3 (Figure 1P) transcripts. On the other hand, we found a significant decrease in the expression of RORc (Figure 1E) and iNOS (Figure 1M) in the lungs of SARS-CoV-2 group compared to the culture medium controls. Other genes as T-bet, GATA-3, IFN-γ, IL-12 and CPA3 (Figures 1C, D, I, J and N, respectively) were similarly expressed in culture medium and SARS-CoV-2 groups.
Figure 1.
Cell counts in the BALF and lung mRNA transcripts for T cell subsets, cytokines, and other indicators of inflammation in mice intranasally instilled with UV inactivated SARS-CoV-2. C57BL/6 mice were instilled with the virus (3 doses of 4.105 PFU/each) on days 1, 3 and 5. At the 7th day, the BALF and the left lower lobe were collected for WBC differential count and mRNA transcipts determinations, respectively. Total number (A) and percentage (B) of WBC; T-bet (C), GATA3 (D), RORc (E), Foxp3 (F), IL-6 (G), TNF-α (H), IFN-γ (I), IL-12 (J), IL-17 (K), GM-CSF (L), iNOS (M), CPA3 (N), IL-1β (O), NLRP3 (P). In A and B figures the results are expressed as mean ± SEM and the statistical significance of the differences was analyzed by ANOVA test followed by Tukey´s test. In C-P figures the results were expressed in median and interquartile intervals and the comparison between the groups was performed by the t-Test. Data showed in A, B and C-P is derived from two experiments with similar results which were combined (n=9 mice/experimental group, except IL-6 determination that included 4 animals. * p <0.05; ** p<0.01; ***p<0,001.
3.3. Histopathology and cytometric analysis reveal an impressive infiltration of inflammatory cells into the pulmonary parenchyma
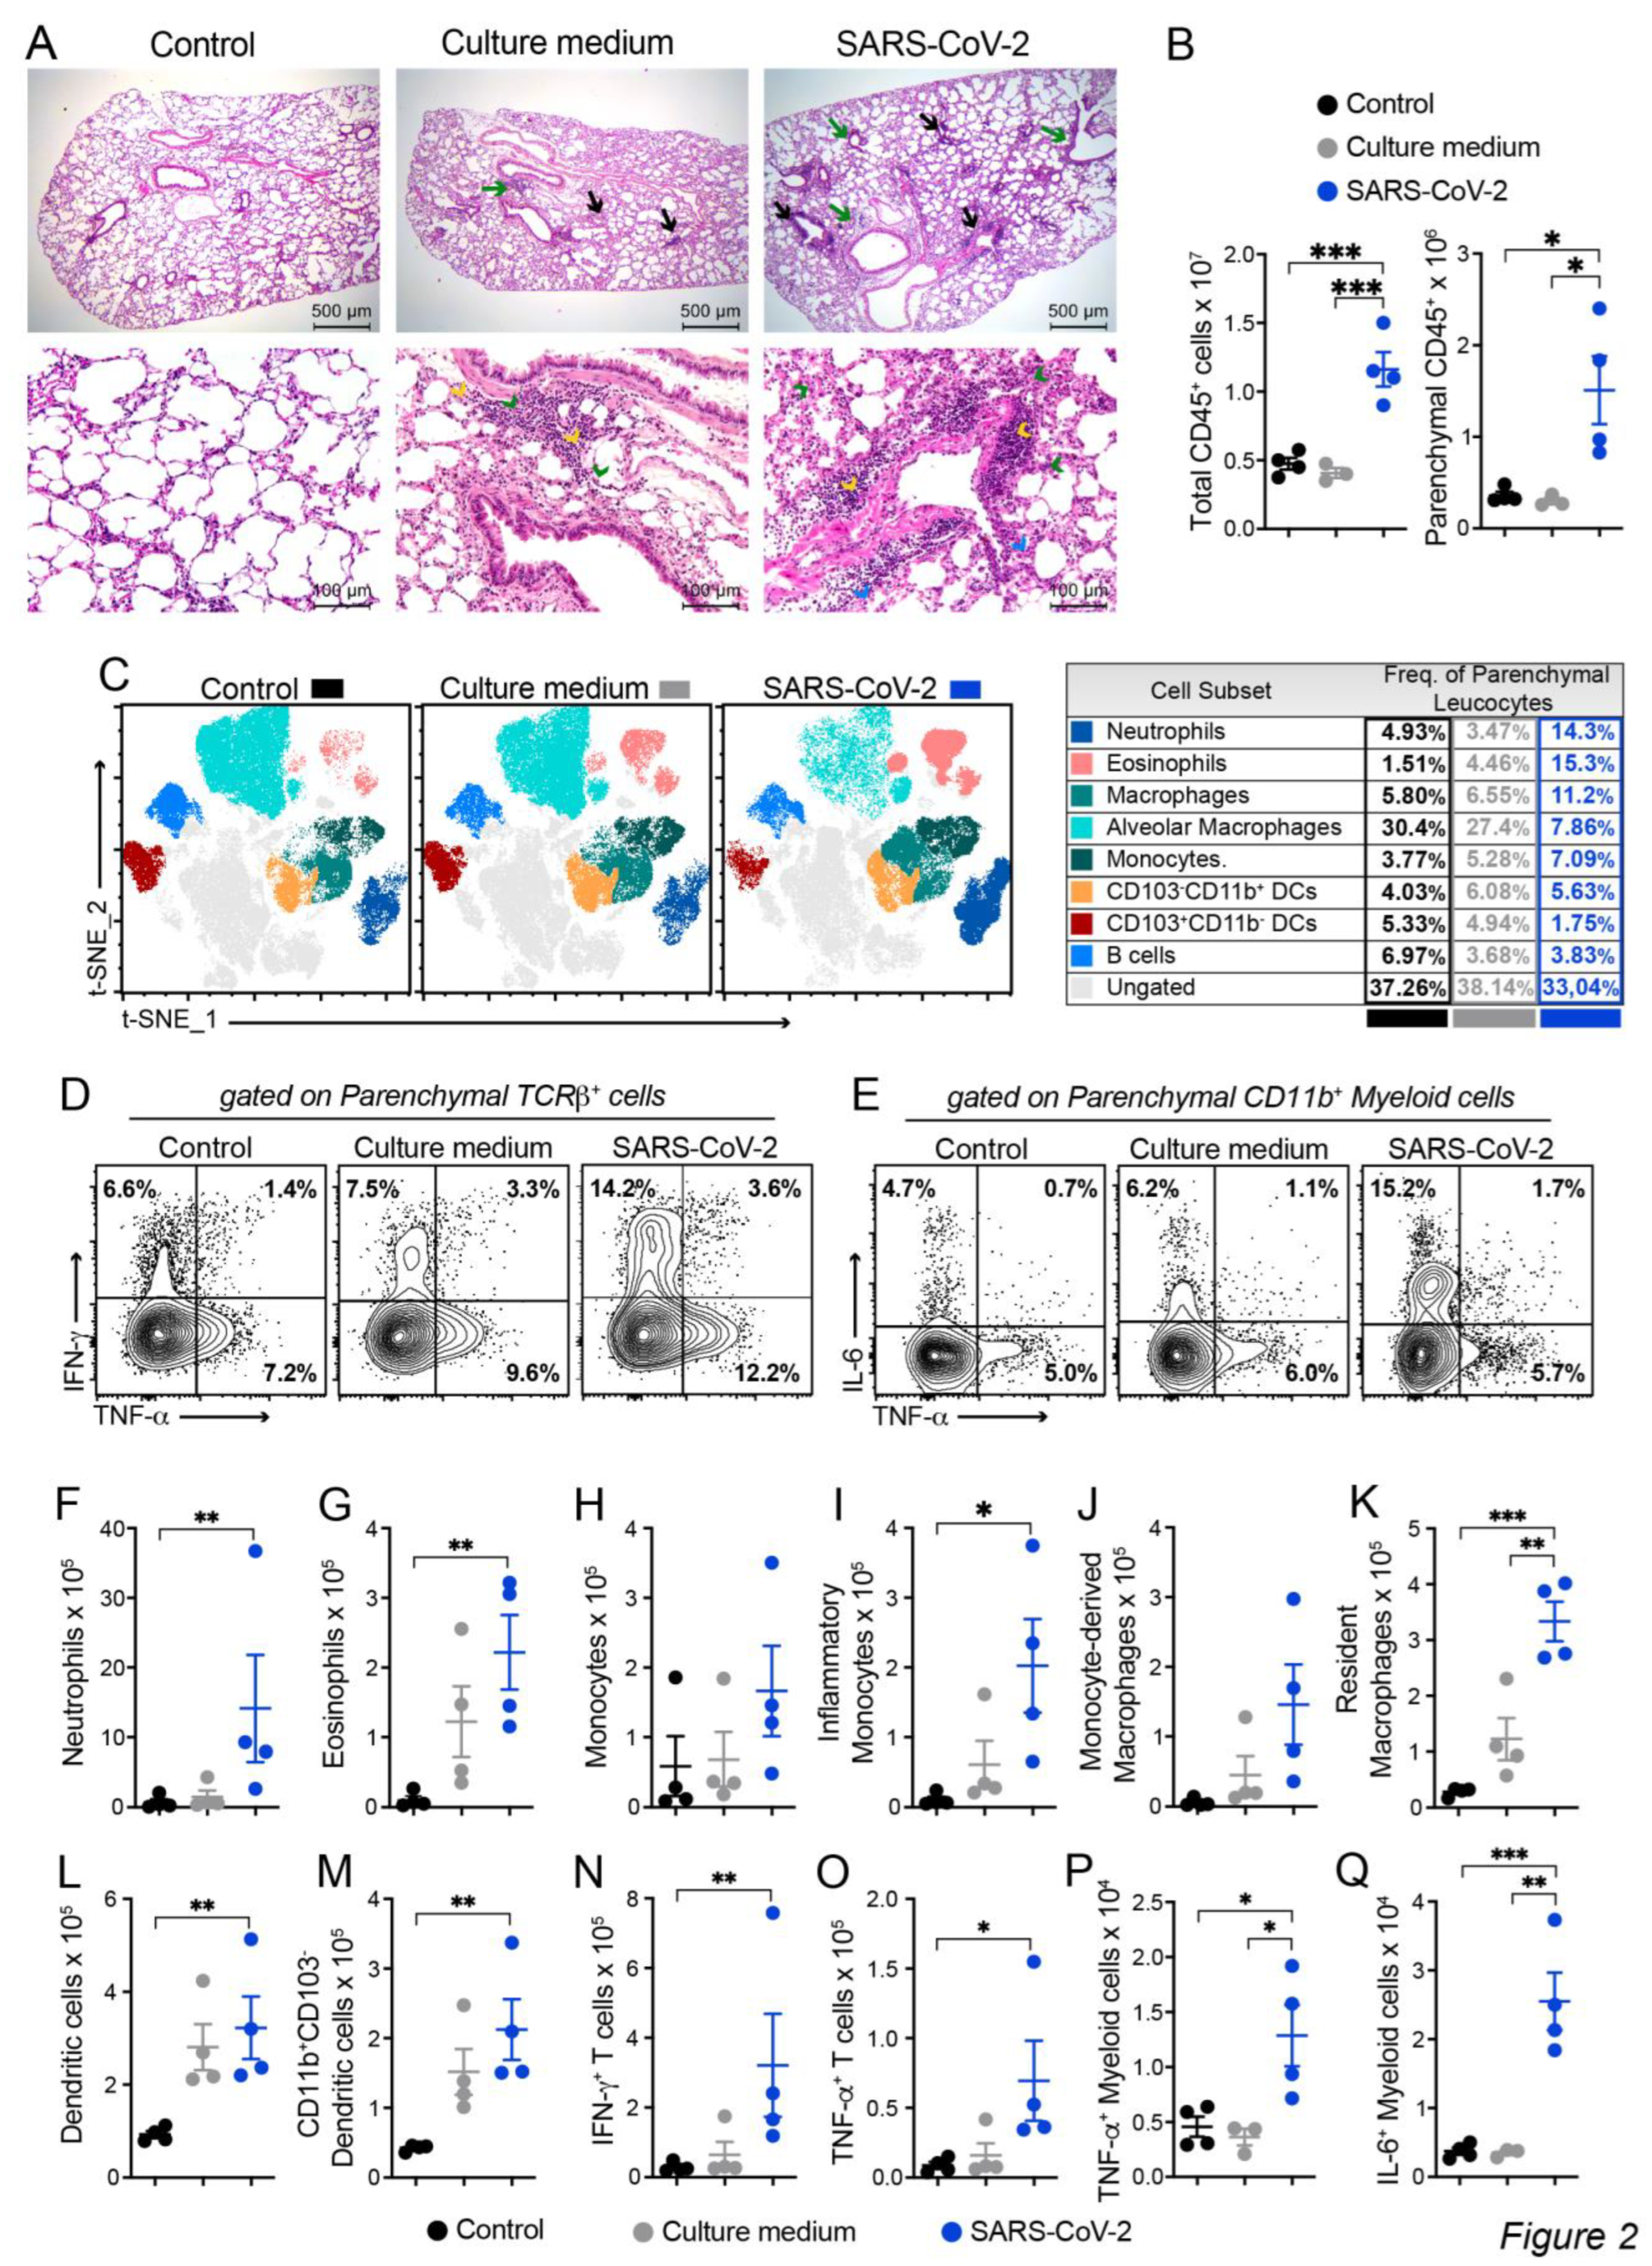
The histopathological evaluation, which is illustrated in Figure 2A, was done by analyzing serial sections obtained from the left lung lobe stained with hematoxylin and eosin (H&E). As expected, lung architecture was totally preserved in the animals of the control group, allowing the visualization of alveoli and longitudinally and transversally sectioned blood vessels. Culture medium and SARS-CoV-2 groups displayed inflammatory foci, however, the ones found in the virus instilled animals were clearly more numerous and intense. These inflammatory foci were, in both cases, located around the vessels and bronchi as indicated by black and green arrows, respectively. The presence of neutrophilic infiltrates (green arrow head), macrophage infiltrates (blue arrow head), and lymphocytic infiltrates (yellow arrow head) are indicated in the microphotographs. Numerous consolidation areas were present in the lungs of SARS-CoV-2 instilled animals but were rare and absent in culture medium and saline control groups, respectively. To confirm these findings, we evaluated the leukocytes infiltrating the lung parenchyma by using cells isolated from mice previously injected with FITC-labeled anti-CD45 antibodies to distinguish circulating cells from the tissue infiltrate. Indeed, confirming the histopathological findings, the quantification of total and parenchymal infiltrating CD45+ leukocytes revealed a significant increase in cell number in the group of mice that received UV-inactivated SARS-CoV-2 compared to both control groups.
Next, we characterized the tissue infiltrating leukocytes based on the surface molecules expression by flow cytometry and used t-SNE algorithm for dimension reduction (Figure 2C and Supplementary Figure S2). In the lungs of mice exposed to the inactivated vírus, we found an enrichment in the clusters of cells that indicate the presence of neutrophils, eosinophils, macrophages (tissue-resident), monocytes and in the CD103-CD11b+ DC subset (Figure 2C). On the other hand, the frequency of other cells subsets, such as CD103+CD11b- DCs, alveolar macrophages and B cells as reduced (Figure 2C). Furthermore, the frequency of proinflammatory cytokine-producing cells was also increased in the SARS-CoV-2 group, in particular, the frequency of IFN-γ and TNF-α-producing TCRβ+ T cells and IL-6 and TNF-α-producing CD11b+ myeloid cells (Figure 2D). The quantification of each cell subset number is shown in the Figure 2F-Q). The predominant profile of all tested cells was characterized by a significantly higher amount of cells enriched in the t-SNE analysis in the SARS-CoV-2 group in comparison to the control group. This was the case for the total number of neutrophils (Figure 2F), eosinophils (Figure 2G), monocytes (Figure 2H), inflammatory monocytes (Figure 2I), monocytes-derived macrophages (Figure 2J), resident macrophages (Figure 2K), dendritic cells (DCs) (Figure 2L), CD11b+CD103- DCs (Figure 2M), IFN-γ+- and TNF-α+-producing T cells (Figure 2N-O and Supplementary Figure S3) and TNF-α+- and IL-6-producing myeloid cells (Figure 2P-Q and Supplementary Figure S3). Contrastingly, the total number of each cell population in the culture medium instilled animals was intermediate between control and SARS-CoV-2 groups and did not present statistical differences when compared with the two other experimental groups. Therefore, this data shows that the IN instillation of the inactivated virus is sufficient to promote a proinflammatory lung milieu that resembles most of the markers of the infection with SARS-CoV-2.
Figure 2.
Characterization of the inflammatory process induced by IN instillation of inactivated SARS-CoV-2 by histopathological and cytometric analyses. C57BL/6 mice were instilled with the virus (3 doses of 4.105 PFU/each) on days 1, 3 and 5. At the 7th day, the upper left lobe and the whole right lung were collected for histopathological and flow cytometry analyses, respectively. Five um thick sections from Control (Saline), Culture medium and SARS-CoV-2 groups were stained with H&E and representative images are shown in (A). Inflammatory focci around the vessels (black arrows) and around the bronchi (green arrows), neutrophilic infiltrates (green arrow head), macrophage infiltrates (blue arrow head), and lymphocytic infiltrates (yellow arrow head). (B) Cells were isolated from the lung tissue and total CD45+ leukocytes or the parenchymal infiltrating leukocyte fraction (identified based on anti-CD45 intravenous injection) were quantified by flow cytometry and specific cells subsets were evaluated according to the gating strategy described in Supplemmentary Figure S2. (C) t-distributed stochastic neighbor embedding (t-SNE) analysis illustrating the distribution of cell clusters in each experimental group according to gate strategy described in the Supplementary Figure S2. The table on the right side indicates the frequency of each cell cluster relative to the CD45+ parenchyma infiltrating leukocyte in the Control (black), Culture medium (grey) and SARS-CoV-2 (blue) groups. Representative contour plots of IL-6, TNF-α or IFN-γ staining in parenchymal TCRβ+ T cells (D) or CD11b+ myeloid cells (E), according to gate strategy described in the Supplementary Figure S3. The total cell numbers of each parenchymal-infiltrating cell subsets are expressed in mean ± SEM, including Neutrophils (F), Eosinophils (G), Monocytes (H), Inflammatory monocytes (I), Monocyte-derived macrophages (J), Resident macrophages (K), Dendritic cells (L), CD11b+CD103- Dendritic cells (M), IFN-γ+ TCRβ+ cells (N), TNF-α+ TCRβ+ cells (O), TNF-α+ CD11b+ myeloid cells (P) and IL-6+CD11b+ myeloid cells (Q). Data shown in A is derived from one experiment between two showing similar findings (n=4); B-Q data are derived from two experiments with similar results which were combined (n=6-8). The comparison between the groups in C-P was performed by the Kruskal-Wallis test followed by the Duun test. * p<0.05; ** p<0.01; ***p<0,001.
3.4 BALF and cytokine levels in lung homogenates suggest that VitD modulates pulmonary inflammation induced by SARS-CoV-2
Considering that VitD has a strong effect over the immune system and its given consideration for prophylactic or therapeutic application in COVID-19 patients, we tested its IP and IN immunomodulatory efficiency towards lung inflammation. As already observed in previous studies, the IP treatment with VitD decreased body weight (Figure 3A) and increased serum calcium levels (Figure 3B). Contrary to our expectation, VitD applied via IN similarly affected body weight and calcium levels, as illustrated in (Figure 3A and B), respectively. BALF findings suggested a modulatory action of VitD administered by both routes and characterized by reduction, although not statistically significant, of lymphocytes, macrophages, neutrophils and eosinophils as illustrated in Figure 3C,D.
To analyze if SARS-CoV-2 induced lung inflammation model was also mimicking the cytokine storm-like phenomenon and to reinforce the presumed downmodulatory effect of VitD, we tested the presence of pro-inflammatory cytokines in lung homogenates. As can be observed in Figure 3E, SARS-CoV-2 group produced higher levels of IL-17A, TNF, and IL-6. The level of these pro-inflammatory cytokines was reduced by both VitD administration routes, being this effect more accentuated by IN pathway.
3.5 Differential effects of VitD delivered by IN and IP routes on RORc and inflammasome genes expression
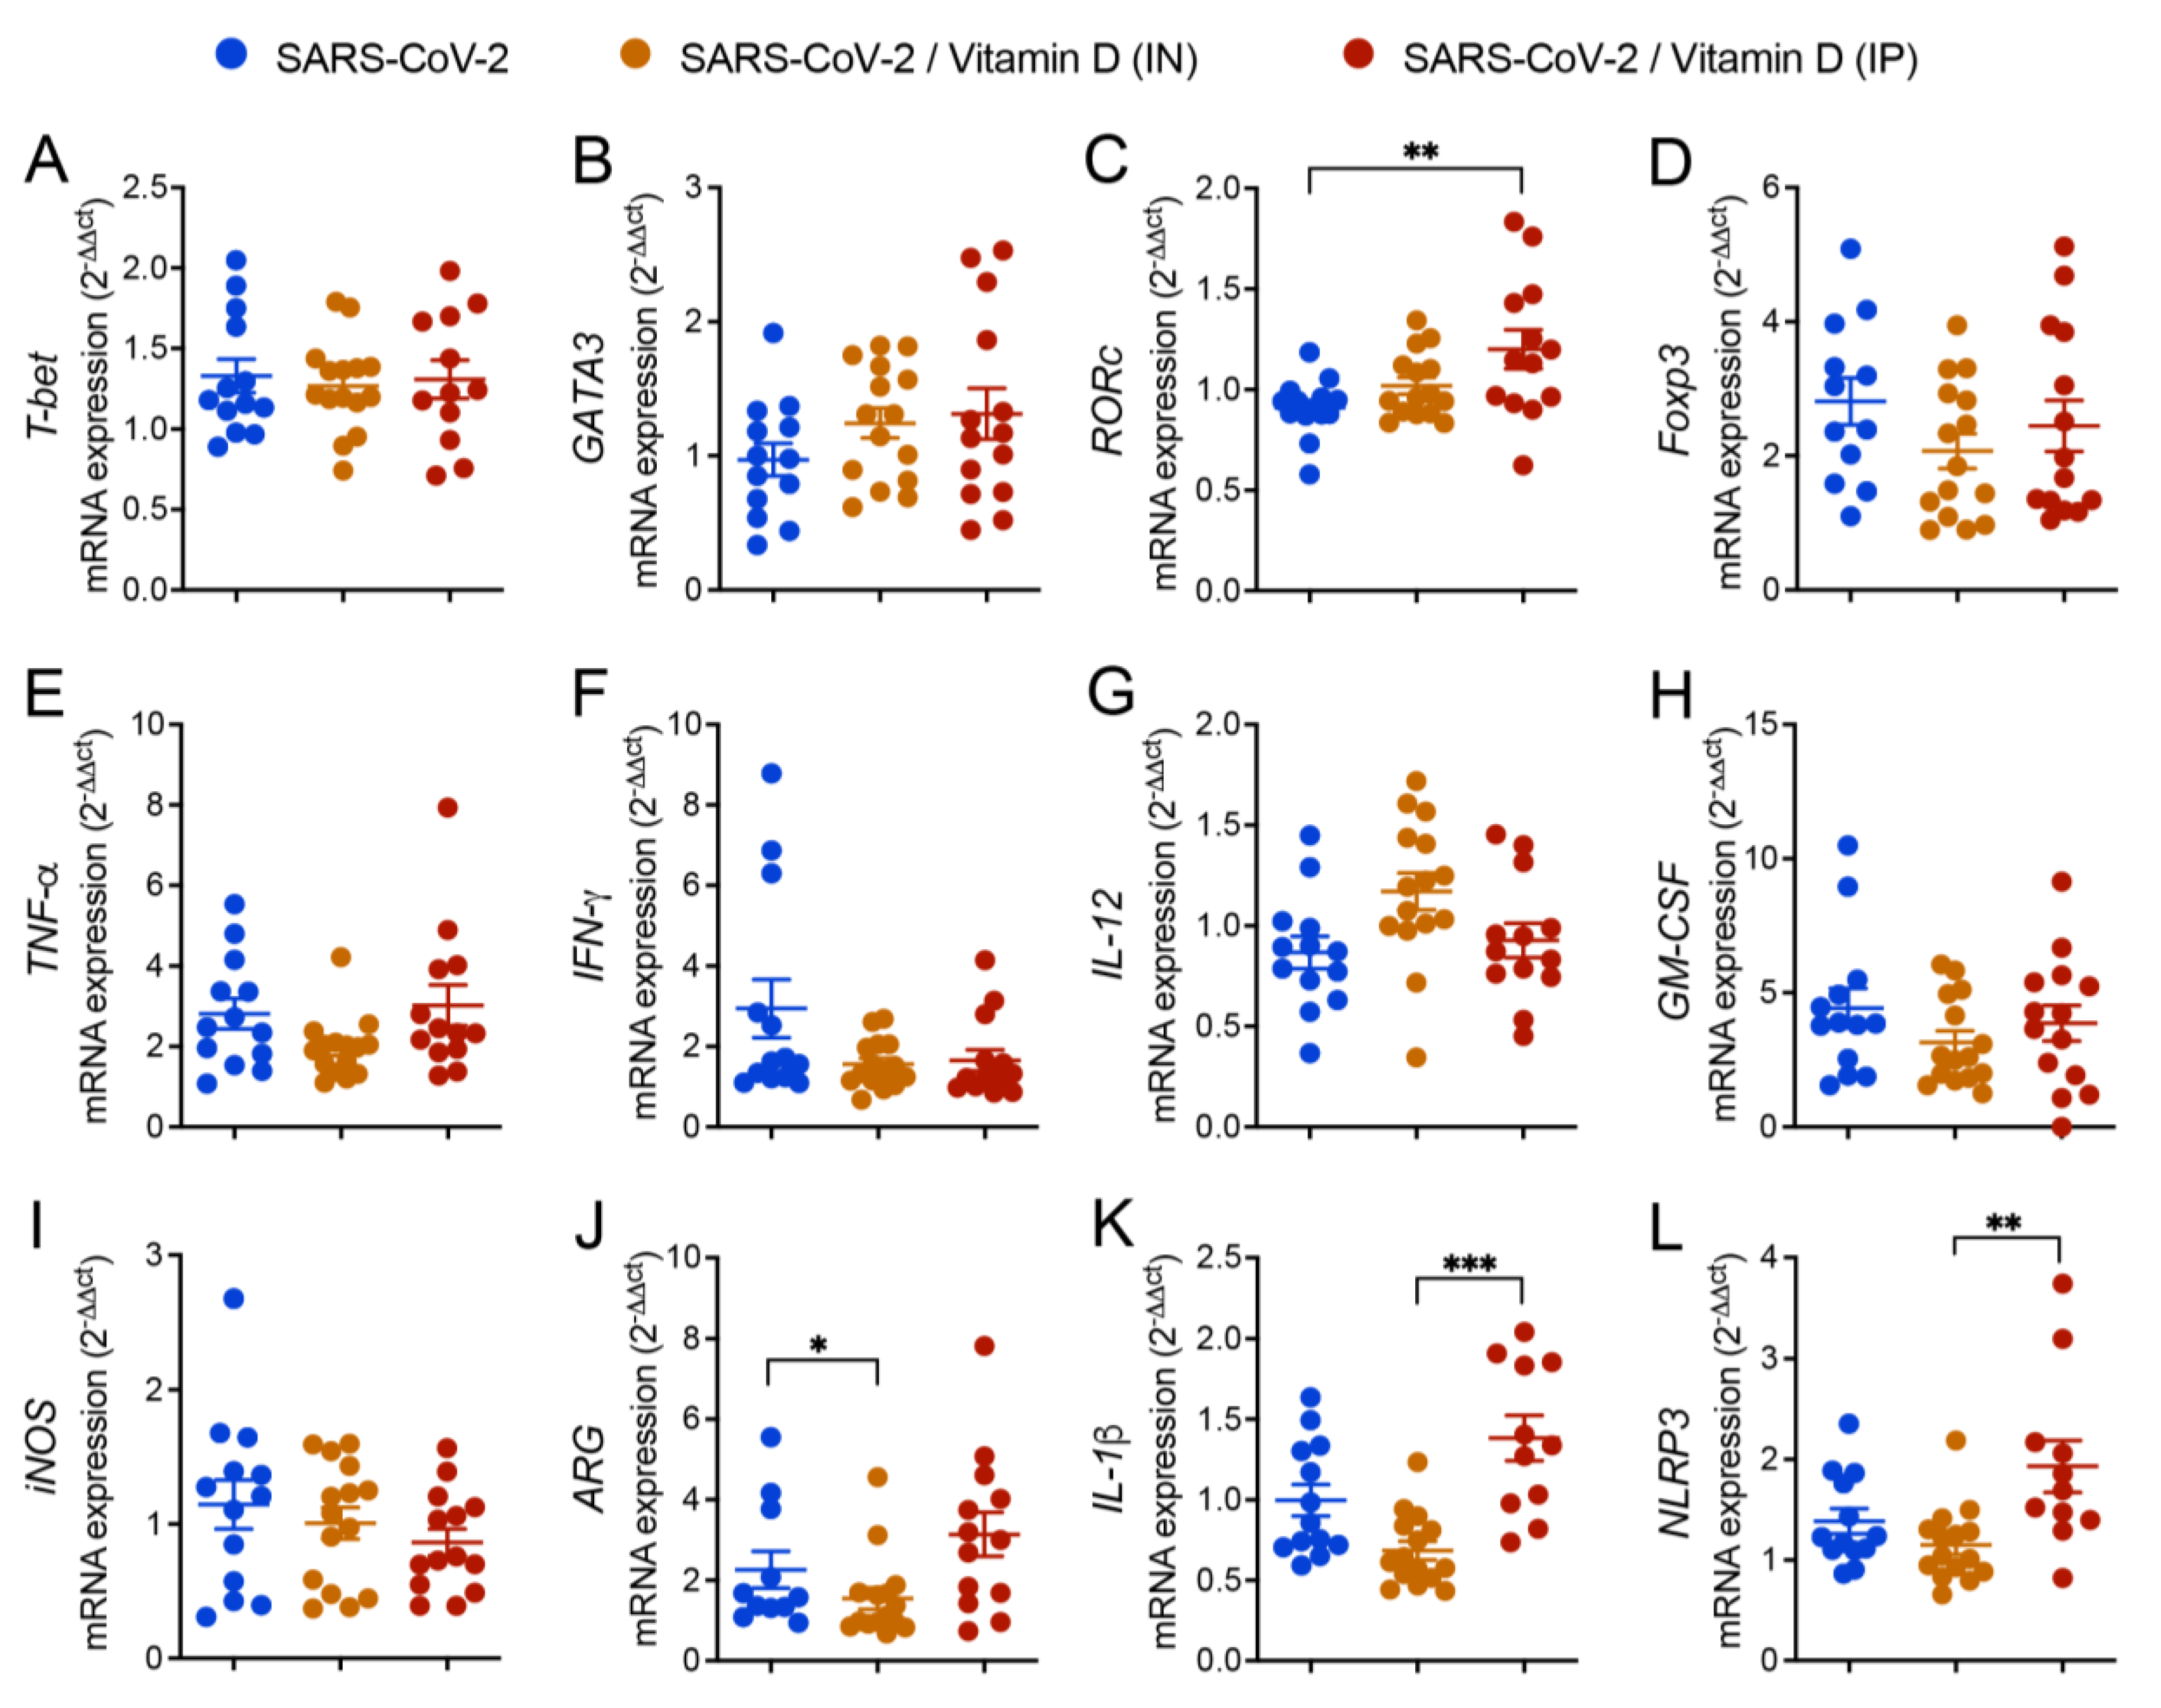
The expression of various genes was similar in the three compared groups as was the case of T-bet, GATA3, Foxp3, TNF-α, IFN-γ, IL-12, GM-CSF, and INOs (Figures 4A, B, D, E, F, G, H, I and J). However, the expression of ARG, IL-1β, and NLRP3 was significantly higher in the IP VitD-treated group in comparison to the IN VitD-treated one (Figures 4C, K and L).
Figure 4.
Effects of IN and IP vitamin D delivery on T cell transcription factors, cytokines and inflammasome gene transcripts in lungs of mice IN challenged with UV inactivated SARS-CoV-2. C57BL/6 mice were instilled with the virus (3 doses of 4.105 PFU/each) on days 1, 3 and 5. In the IN protocol, mice was treatment with 3 VitD doses (0,1 µg/dose) simultaneously with the SARS-CoV-2 inoculum. In the IP protocol, each animal was treated with 4 VitD doses delivered on days 0,2,4 and 6. At the 7th day, the lower left lobe was removed and RNA extracted and submitted to RT-PCR. Tested genes included T-bet (A), GATA3 (B), RORc (C), Foxp3 (D), TNF-α (E), IFN-γ (F), IL-12 (G), GM-CSF (H), iNOS (I), ARG (J), IL-1β (K), NLRP3 (L). Data derives from three experiments with similar results which were combined (n=13-15 mice/experimental group). The results are presented in median and interquartile intervals and the comparison between the groups was performed by the Kruskal-Wallis test followed by the Dunn test. * p<0.05; ** p<0.01; *** p<0.001.
3.6 IN VitD treatment efficiently controls pulmonary inflammation
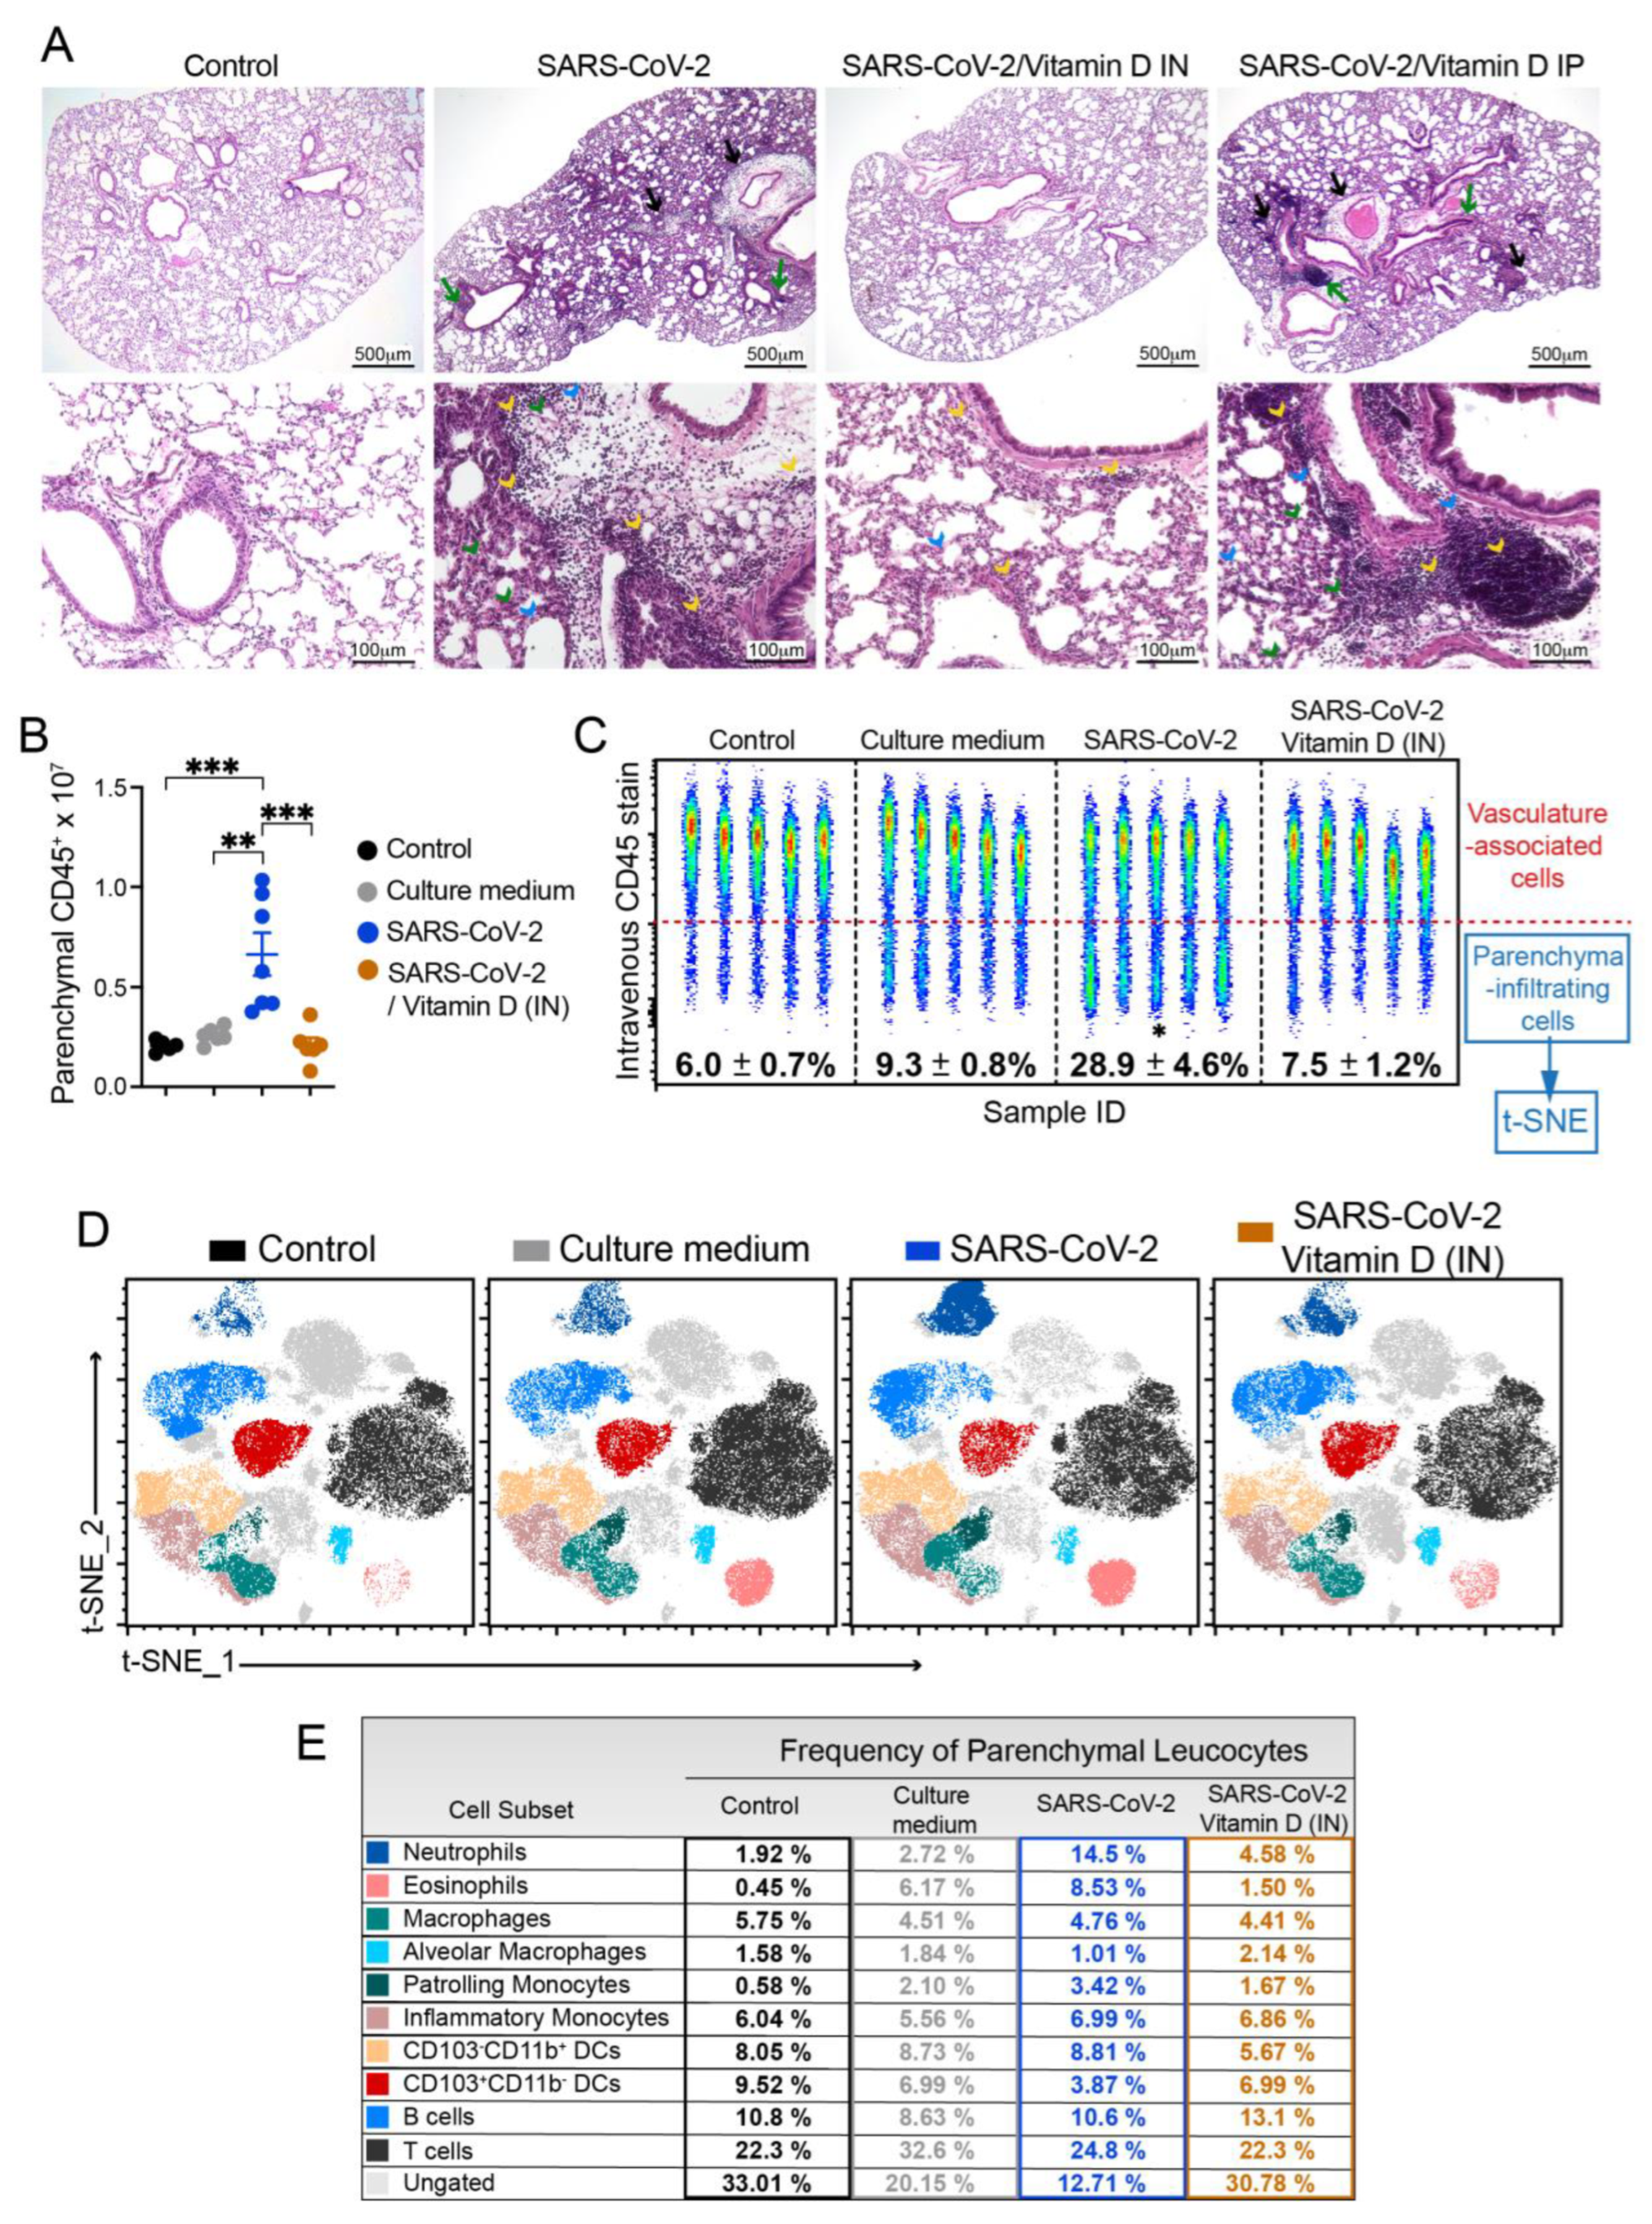
The analysis of the histological sections clearly indicated the strong ability of IN VitD to control lung inflammation (Figure 5A). In this case, there was a convincing interruption of the accumulation of inflammatory cells in the lung parenchyma of IN VitD treated mice that were exposed to the inactivated virus. Even though BALF and cytokines in lung homogenates have suggested a possible down-modulatory effect of IP VitD, this modulatory activity was not confirmed by histopathological analysis of the lungs. These findings can be clearly observed in Figure 5A. Inflammatory foci are easily observed around the vessels (black arrows) and bronchi (green arrows) in SARS-CoV-2 and SARS-CoV-2/Vitamin D IP groups. The presence of neutrophilic infiltrates (green arrow head), macrophage infiltrates (blue arrow head), and lymphocytic infiltrates (yellow arrow head) are also numerous in these two experimental groups but rare in animals treated by IN route.
To clarify whether this anti-inflammatory effect of IN VitD involved the modulation of specific cell types, including myeloid, DCs, ILCs and lymphocytes, we used flow cytometry to identify the cells infiltrating in the lung parenchyma, as described above. The total number and the frequency of CD45+ cells infiltrating the lung parenchyma of mice instilled with inactivated SARS-CoV-2 was significantly increased compared to both control groups (Control and Culture medium) (Figures 5B and C). Notably, the IN VitD treatment significantly reduced the number and frequency of leukocytes infiltrating the lung parenchyma of mice receiving the inactivated virus (Figures 5B and C).
Next, to better understand the modulatory effects of VitD in the virus-induced parenchymal lung inflammation, we analyzed the frequency of distinct cell subsets by t-SNE and found that the VitD treatment reverted the recruitment of neutrophils, eosinophils, monocytes and CD103-CD11b+ DCs induced by the inoculation of inactivated SARS-CoV-2 (Figures 5D, 5E, 6C). In addition. the VitD treatment slightly increased the percentage of B cells and CD103+CD11b- DCs in the lung parenchyma in comparison to the SARS-Cov-2 group (Figures 5E, 6C), suggesting that the treatment might be selectively controlling the inflammatory immune tone in the lung.
Figure 5.
Effect of IN vitamin D on lung histopathology and infiltration of cytokine-producing cells triggered by IN instillation of UV inactivated SARS-CoV-2. C57BL/6 mice were instilled with the virus (3 doses of 4.105 PFU/each) on days 1, 3 and 5. In the IN protocol, mice was treatment with 3 VitD doses (0,1 µg/dose) simultaneously with the SARS-CoV-2 inoculum. In the IP protocol, each animal was treated with 4 VitD doses delivered on days 0,2,4 and 6. At the 7th day, the upper left lobe and the right lung were collected for histopathological and flow cytometry analyses, respectively. The upper left lobe was washed, fixed and stained with H&E, and then evaluated concerning the presence of inflammatory focci (A). Cells from lung parenchyma were eluted and analyzed after labeling with an array of specific antibodies (B). Data showed in A is derived from one experiment (n=5 animals /experimental group) and data shown in B is derived from one experiment (n= 7-8 animals /group). Results are presented in median and interquartile intervals and the comparison between the groups was performed by the Kruskal-Wallis test followed by the Dunn´s test. * p<0.05; ** p<0.01.
In addition, the functional impact of VitD treatment on inflammatory cytokine production was also analyzed by flow cytometry in myeloid cells, B cells, Tγδ, TCD4+ cells and ILCs (Figure 6). Concerning cytokine production by myeloid cells, were analyzed the ones producing TNF-α, IL-6 or both cytokines. While the inactivated virus promoted the production of TNF-α and IL-6 by lung myeloid cells, the VitD treatment controlled the frequency of cytokine-producing cells (Figure 6A). When we quantified the number of cytokine-producing myeloid cells, the only population that displayed a significant difference was the one producing both cytokines. Even though the % of TNF-α+IL-6+ CD11b+ cells was similar in SARS-CoV-2 and SARS-CoV-2/VitD groups (Figure 6E), the total number of these cells was significantly lower in the VitD-treated animals as shown in Figure 6D. This data could be explained by the consistent reduction in total cell recruitment to the lung parenchyma in the VitD-treated mice.
The % of DCs was only slightly reduced by VitD (not shown). As already observed during the characterization phase of the lung inflammatory process, the amount of DCs was very similar in SARS-CoV-2 and its respective control group (culture medium). In spite of this, VitD therapy was able to significantly reduce the total number of DCs (Figure 6F) and also of the two checked subsets, that is, CD103-CD11b+ (Figure 6G) and CD103+CD11b- (Figure 6H), but not the frequency of the CD103+CD11b- (Figure 5B and D). Once again, this inconsistency in the modulation of cell number but no cell frequency could be attributed to the considerable reduction of leukocyte recruitment to the lung parenchyma of VitD-treated animals (Figure 5B).
The total number of IFN-γ, IL-17 and IL-6 producing ILCs were usually increased in SARS-CoV-2 group in comparison to the control that received the culture medium and VitD therapy triggered a clear tendency to decrease the total number of theses cytokine-producing cells as shown in Figures 6A, I, J and K. Concerning the Tγδ lymphocytes, the most relevant alterations were detected in the cells that were producing IL-17 or IFN-γ. As shown in figures Figures 6A, L and N, VitD significantly downregulated the total cell number of IL-17 and IFN-γ producing cells. VitD also downmodulated, although not significantly, their percentages as illustrated in Figures 6M and O for IL-17 and IFN-γ, respectively. In regard to TCD4+ lymphocytes, the most pronounced differences were also observed in IL-17- and IL-17/IFN-γ-producing cells. The % of these cells was reduced by treatment with VitD being this reduction statistically significant in the case of TCD4+IL17+ (Figures 6A and Q). The total amount of these two cell subsets was also decreased by VitD therapy, being this reduction statistically significant regarding TCD4+IL-17+IFN-γ+ (Figures 6P, R and S). The % and the total number of B cells were similar in culture medium and SARS-CoV-2 groups (Figures 6T and U). However, a significant increase in these two parameters was triggered by local VitD administration as shown in figures T and U. Interestingly, the number of IL-6+TNF-α+ B cells, which was increased in the SARS-CoV-2 group, was significantly downregulated by VitD (Figure 6V).
Taken together, our data suggest that local administration of VitD was sufficient to suppress the recruitment of inflammatory cells to the lung parenchyma induced by the exposure to inactivated SARS-CoV-2.
4. Discussion
This investigation was conducted considering that COVID-19 can be a lethal pathology whose treatment is not well established nowadays. In this study we initially used C57BL/6 mice, instilled with UV-inactivated SARS-CoV-2, to characterize a working model of inflammation in the lung that is the initial and main target of COVID-19 infection [28]. We then employed this model to investigate the potential of VitD to control local inflammation. The choice of C57BL/6 mice strain and inactivated virus would, in our view, make the model more accessible to a greater number of researchers and laboratory facilities.
The initial results, obtained by analyzing the BALF, suggested the ability of inactivated SARS-CoV-2 to trigger a local inflammatory process characterized by a clear increase in WBC, including in lymphocytes and neutrophils. As the BALF obtained from the culture medium group presented a profile very similar to the other control group (saline), most of the inflammatory process can be attributed to the virus itself and not to the content of the medium used to grow the virus. Even though the subsequent analyses provided much more enlightening information about this model, this preliminary data was considered relevant because BALF procedures have been largely employed as a tool to study a plethora of experimental and human diseases [29,30]. In addition, this technique has been explored in experimental and clinical investigations involving the SARS-CoV-2 virus itself [31].
Data obtained from RT-PCR assays performed with RNA extracted from lungs reinforced the initial findings showing increased expression of GM-CSF and Foxp3 and a tendency towards increased values for IL-17, IL-1β and NLRP3 mRNA expression. The possible contribution of inflammasome activation to COVID-19 immunopathogenesis is highly supported by the literature. It has been reported that inflammasome activation is triggered by SARS-CoV-2 components [32]; that its higher activation is possibly involved in COVID-19 severity [33], and that specific inhibition of the NLRP3 inflammasome was able to decrease the intensity of a COVID-19-like pathology in mice [34].
Histopathological analysis together with the flow cytometric evaluation of the cells obtained from the lung parenchyma allowed a better evaluation of the intensity and the quality of this inflammatory process. H&E stained sections clearly showed that IN instillation of inactivated SARS-CoV-2 induced a multifocal and interstitial pneumonia characterized by perivascular and perialveolar inflammation. Flow cytometric analysis performed with cells isolated from the lung parenchyma allowed a more precise identification of the cells involved in local inflammation. The presence of PMNs, eosinophils, macrophages, and lymphocytes was confirmed and the use of a combination of certain monoclonal antibodies allowed the differentiation of, for example, monocyte-derived macrophages and parenchyma-resident macrophages as described by [35]. All these cell types have been associated with COVID-19 and their presumed contribution to disease immunopathogenesis has been apprised by clinical and SARS-CoV-2 animal model investigations. The detection of mononuclear cells, including macrophages and lymphocytes, in our study is entirely supported by literature data showing that all COVID-19 patients presented a pulmonary inflammatory reaction predominantly composed of lymphocytes and macrophages [36]. These cell populations have also been characterized in COVID-19 experimental disease model [37]. Our findings indicated the presence of a significant number of inflammatory macrophages in the lungs of SARS-CoV-2 instilled mice, including an increase in monocyte-derived macrophages. Interestingly, the hyper inflammation observed in COVID-19 has been partially attributed to this cell type which is recruited from the blood by a plethora of chemotactic factors [38]. An increased amount of PMNs is also described in the bloodstream and in the lungs of COVID-19 patients and strong evidences indicate that they play a paramount role on disease pathophysiology [39]. A neutrophilic mucositis involving the entire lower respiratory tract has been described in lung autopsies from COVID-19 deceased patients [40]. Moreover, a neutrophil activation signature predicted critical illness and mortality in COVID-19 [41]. Most of the damage triggered by PMNs has been attributed to their extensive and prolonged activation which leads to an excessive ROS release composed of superoxide radicals and H2O2 [42]. In addition, according to [43], PMNs have been seen as drivers of hyperinflammation by enhanced degranulation and pro-inflammatory cytokine production. The release of neutrophil extracellular traps (NETs) by PMNs is also pointed as a major promotor of damage in COVID-19 by causing endothelial injury and necroinflammation via complement activation, and by promoting the venous thrombus formation [44]. At least partially, this activation of PMNs could be directly determined by the virus. It was recently described by [45], that single-strand RNAs from the SARS-CoV-2 genome is able to activate human neutrophils via TLR8, triggering a remarkable production of TNFα, IL-1ra, and CXCL8, apoptosis delay, modulation of CD11b and CD62L expression, and release of neutrophil extracellular traps. This exuberant contribution of PMNs to the interstitial pneumonia that occurs in COVID-19 was, in many aspects, reproduced in hACE2 mouse model infected with SARS-CoV-2.
The contribution of eosinophils to this pathology is still a matter of debate but their quantification in the blood indicates that eosinophilia and eosinopenia are associated with better and worst disease outcomes, respectively [46]. Considering these and other findings, some authors believe that they could play a protective role. Nevertheless, [47], by analyzing BALF of COVID-19 patients, found an eosinophil-mediated lung inflammation associated with elevated natural killer T cell response. In accordance with these findings, we also detected eosinophils in BALF what was further confirmed by cytometry. To the best of our knowledge, there are no published studies concerning the involvement of eosinophils in the murine lung inflammation triggered by SARS-CoV-2.
The presence of DCs in the pulmonary parenchyma also deserves attention considering that they are fundamental for both, innate and specific anti-viral immune response but can also contribute to viral dissemination and immunopathogenesis during COVID-19 [48]. In this regard, by analyzing circulating DCs and monocyte subsets from hospitalized COVID-19 patients, [49] described their impaired function and delayed regeneration. Flow cytometry also allowed the identification of lymphoid and myeloid cells producing cytokines as TNF-α, IFN-γ, and IL-17 which are among the most important mediators of COVID-19 immunopathogenesis [50].
Having confirmed that SARS-CoV-2 IN instillation triggered a pulmonary inflammation similar to that developed by COVID-19 patients, we used this model to test VitD ability to modulate this inflammatory process. The option for VitD was based on the extensive literature attesting the powerful immunomodulatory property of this hormone [51], the robust evidences linking its low levels with poor COVID-19 outcomes [52] and our own previous experience indicating its ability to counteract the inflammatory process that damages the central nervous system in a multiple sclerosis murine model [53,54]. As indicated by our results, VitD administered by both routes, was capable to partially control pulmonary inflammation by downmodulating both, the number of infiltrating cells and the local expression of pro-inflammatory cytokines. Interestingly, its IN application was way more effective which was confirmed by histopathological and flow cytometric analyses. H&E sections from animals that received VitD by the IN route revealed well preserved lung structures, similar to those observed in the animals from the control group injected with saline. The flow cytometry protocol indicated that VitD was able to impair the recruitment of several cell types, as PMNs, DCs, and lymphocytes as CD4+ and Tγδ in the lungs of mice challenged with SARS-CoV-2. This approach also allowed the identification of various cell subsets whose cytokine production was being decreased by VitD as myeloid, ILCs, Tγδ, TCD4+ and B cells. These findings were considered especially relevant because the main detected cytokines, as TNF-α, IL-6, IL-17 and IFN-γ, have been identified as some of the major villains of the cytokine storm associated with COVID-19 and were significantly downmodulated by VitD. The possible association between this disease and VitD levels has been investigated from different perspectives, including the possible role of its deficiency and worst disease outcomes [55] and its prophylactic, immune regulatory and protective role in COVID-19 [19]. Its therapeutic benefit is also being widely pursued but a final conclusion is not possible yet due to the discordant results reported so far [56,57]. As far as we know, there are no publications concerning the administration of IN VitD to control lung inflammation triggered by SARS-CoV-2 in animal models neither in patients up to now. In this context and considering the efficacy of its local instillation, we believe that once this effect has been proven in SARS-CoV-2-infected animals too, that it would be worth going to clinical trials.
Our initial hypothesis already predicted a superior efficacy of IN VitD because other lung inflammatory pathologies, as asthma and rhinitis, are efficiently controlled by local drug delivery [58,59]. Theoretically, a higher local concentration of vitamin D could be more efficient and, possibly, less toxic. The higher efficacy of local delivery was confirmed by our findings, however, we still detected increased calcium levels and body weight loss associated with this route. Hypercalcemia could be related to VitD systemic diffusion, subsequent increased calcium absorption from the intestine and increased bone mobilization [60]. Body weight loss is possibly related to the effect of VitD in the brain considering that IN administration can provide a route for easier delivery of substances to the CNS [61]. Also, the brain is the master regulator of weight through the hypothalamus that controls both weight and express vitamin D receptors. According to [62], administration of 1,25-D3 into the third ventricle of the brain dramatically decreased body weight by lowering food intake in obese rodents through action within the arcuate nucleus. These authors also found that vitamin D receptor colocalized with and activated key appetite-regulating neurons in the arcuate, namely proopiomelanocortin neurons.
Considering that IN VitD efficacy was much more impressive than IP VitD, we believe that most of its effect is locally occurring and is being mediated by some of its well-established immunomodulatory mechanisms. The significant reduction in many cytokine-producing cells and also in the level of these mediators in lung homogenates supports this possibility. In addition, the total levels of many proinflammatory cells in both, the pulmonary parenchyma, showed by cytometry, and in the alveolar space, demonstrated by BALF analysis, were also clearly downmodulated by VitD. Different mechanisms could be involved in this anti-inflammatory VitD effect as, for example, the reduction in TLR expression in lung-resident cells what could decrease the intensity of the initial interaction of SARS-CoV-2 with these cells [63]. This could decrease the release of chemokines and therefore control the subsequent movement of leukocytes towards the lung. Classical immunomodulatory mechanisms involving the innate immunity as inhibition of DCs maturation and blockage of antigen presentation to T helper cells could also occur. Inhibition of Th1 and Th17 effector cells and induction of Th2 lymphocytes could also contribute to VitD efficacy. In addition, VitD suppresses the release of a plethora of pro-inflammatory cytokines [19], which seem, considering our results, to play a major role in its therapeutic effect when delivered intranasally. The model of inflammation limited to the lung, used in this work, does not allow us to predict whether IN vitD would control extrapulmonary inflammatory processes triggered by SARS-CoV-2 infection. As IN VitD was able to attenuate LPS-induced acute lung inflammation [64], it is expected that its application by this route would also be effective to control pulmonary inflammatory processes triggered by other infectious agents or substances.
Even though the focus of our work had been the control of lung inflammation, we conceive that the possible adoption of IN VitD could bring additional advantages to COVID-19 patients. In this sense, we highlight the stabilizing activity towards BBB disruption and the anti-fibrotic property of VitD considering that increased BBB [65] and lung fibrosis had been associated to more severe COVID-19 cases.
Our study is mainly limited by the fact that we did not show that this anti-inflammatory effect of VitD also happens during experimental SARS-CoV-2 infection. However, considering its adjunct therapeutic potential for COVID-19, we understand that this anti-inflammatory activity determined by IN VitD deserves to be further and fully investigated in preclinical and clinical assays.
5. Conclusion
Considering the results provided by this investigation and the fact that most of the clinical trials done with vitamin D employed other supplementation routes, mainly the oral one, we suppose that the IN one could be more efficient. This clarification depends upon clinical trials in which vit D ability to control pulmonary inflammation is compared after its administration by different routes.
Supplementary Materials
Author Contributions
Funding
This study was supported by JBS S.A. and the scholarships of the Coordination for the Improvement of Higher Education Personnel (CAPES), master's scholarship no. 88882.495054/2020-01), São Paulo Research Support Foundation (FAPESP, scholarship no. 2020/04558-0). J.L.P.-M. is supported by CNPq no. 305628/2020-8 and A.S. is supported by the CNPq no. 307269/2017-5 grant. DMF is supported by CNPq 313429/2020-0 and FAPESP 2021/06881-5. MCA, CSL, BCO, GWS were supported by FAPESP scholarships 2019/12691-4, 2019/13916-0, 2019/07771-9 and 2021/12768-7, respectively.
Institutional Review Board Statement
“The animal study protocol was approved by the Institutional Animal Ethics Committee (CEUA/IBB/UNESP) (protocol code 1959140820) for studies involving animals.
Acknowledgements
Dr. Edison Luiz Durigon (IBS-USP) for the donation of SARS-CoV-2, Dr Maria Luisa Cotrim Sartor de Oliveira (Pathology laboratory UNESP/SP) for the use of the equipment, and Flow Cytometry and Imaging Research FLUIR-CEFAP/USP core facility for the support on the flow cytometry experiments.
Conflict of Interest
The authors declare that the research was conducted in the absence of any commercial or financial relationships that could be construed as a potential conflict of interest.
References
- Samadizadeh, S.; Masoudi, M.; Rastegar, M.; Salimi, V.; Shahbaz, M.B.; Tahamtan, A. COVID-19: Why Does Disease Severity Vary among Individuals? Respiratory Medicine 2021, 180, 106356. [Google Scholar] [CrossRef] [PubMed]
- Machhi, J.; Herskovitz, J.; Senan, A.M.; Dutta, D.; Nath, B.; Oleynikov, M.D.; Blomberg, W.R.; Meigs, D.D.; Hasan, M.; Patel, M.; et al. The Natural History, Pathobiology, and Clinical Manifestations of SARS-CoV-2 Infections. J Neuroimmune Pharmacol 2020, 15, 359–386. [Google Scholar] [CrossRef] [PubMed]
- Khreefa, Z.; Barbier, M.T.; Koksal, A.R.; Love, G.; Del Valle, L. Pathogenesis and Mechanisms of SARS-CoV-2 Infection in the Intestine, Liver, and Pancreas. Cells 2023, 12, 262. [Google Scholar] [CrossRef] [PubMed]
- Gavriatopoulou, M.; Korompoki, E.; Fotiou, D.; Ntanasis-Stathopoulos, I.; Psaltopoulou, T.; Kastritis, E.; Terpos, E.; Dimopoulos, M.A. Organ-Specific Manifestations of COVID-19 Infection. Clin Exp Med 2020, 20, 493–506. [Google Scholar] [CrossRef] [PubMed]
- Zhou, Y.; Yang, Q.; Chi, J.; Dong, B.; Lv, W.; Shen, L.; Wang, Y. Comorbidities and the Risk of Severe or Fatal Outcomes Associated with Coronavirus Disease 2019: A Systematic Review and Meta-Analysis. International Journal of Infectious Diseases 2020, 99, 47–56. [Google Scholar] [CrossRef] [PubMed]
- Kobusiak-Prokopowicz, M.; Fułek, K.; Fułek, M.; Kaaz, K.; Mysiak, A.; Kurpas, D.; Beszłej, J.A.; Brzecka, A.; Leszek, J. Cardiovascular, Pulmonary, and Neuropsychiatric Short- and Long-Term Complications of COVID-19. Cells 2022, 11, 3882. [Google Scholar] [CrossRef] [PubMed]
- Diamond, M.S.; Kanneganti, T.-D. Innate Immunity: The First Line of Defense against SARS-CoV-2. Nat Immunol 2022, 23, 165–176. [Google Scholar] [CrossRef] [PubMed]
- Hu, B.; Huang, S.; Yin, L. The Cytokine Storm and COVID-19. J Med Virol 2021, 93, 250–256. [Google Scholar] [CrossRef]
- Karki, R.; Sharma, B.R.; Tuladhar, S.; Williams, E.P.; Zalduondo, L.; Samir, P.; Zheng, M.; Sundaram, B.; Banoth, B.; Malireddi, R.K.S.; et al. Synergism of TNF-α and IFN-γ Triggers Inflammatory Cell Death, Tissue Damage, and Mortality in SARS-CoV-2 Infection and Cytokine Shock Syndromes. Cell 2021, 184, 149–168.e17. [Google Scholar] [CrossRef]
- Bednash, J.S.; Kagan, V.E.; Englert, J.A.; Farkas, D.; Tyurina, Y.Y.; Tyurin, V.A.; Samovich, S.N.; Farkas, L.; Elhance, A.; Johns, F.; et al. Syrian Hamsters as a Model of Lung Injury with SARS-CoV-2 Infection: Pathologic, Physiologic, and Detailed Molecular Profiling. Translational Research 2022, 240, 1–16. [Google Scholar] [CrossRef]
- Winkler, E.S.; Bailey, A.L.; Kafai, N.M.; Nair, S.; McCune, B.T.; Yu, J.; Fox, J.M.; Chen, R.E.; Earnest, J.T.; Keeler, S.P.; et al. SARS-CoV-2 Infection of Human ACE2-Transgenic Mice Causes Severe Lung Inflammation and Impaired Function. Nat Immunol 2020, 21, 1327–1335. [Google Scholar] [CrossRef] [PubMed]
- Xia, J.; Tang, W.; Wang, J.; Lai, D.; Xu, Q.; Huang, R.; Hu, Y.; Gong, X.; Fan, J.; Shu, Q.; et al. SARS-CoV-2 N Protein Induces Acute Lung Injury in Mice via NF-ĸB Activation. Front. Immunol. 2021, 12, 791753. [Google Scholar] [CrossRef] [PubMed]
- Puthia, M.; Tanner, L.; Petruk, G.; Schmidtchen, A. Experimental Model of Pulmonary Inflammation Induced by SARS-CoV-2 Spike Protein and Endotoxin. ACS Pharmacol. Transl. Sci. 2022, 5, 141–148. [Google Scholar] [CrossRef] [PubMed]
- Alunno, A.; Najm, A.; Mariette, X.; De Marco, G.; Emmel, J.; Mason, L.; McGonagle, D.G.; Machado, P.M. Immunomodulatory Therapies for the Treatment of SARS-CoV-2 Infection: An Update of the Systematic Literature Review to Inform EULAR Points to Consider. RMD Open 2021, 7, e001899. [Google Scholar] [CrossRef] [PubMed]
- Majumder, J.; Minko, T. Recent Developments on Therapeutic and Diagnostic Approaches for COVID-19. AAPS J 2021, 23, 14. [Google Scholar] [CrossRef] [PubMed]
- Şi̇Mşek Yavuz, S.; Komşuoğlu Çeli̇Kyurt, İ. An Update of Anti-Viral Treatment of COVID-19. Turk J Med Sci 2021, 51, 3372–3390. [Google Scholar] [CrossRef] [PubMed]
- Mercola, J.; Grant, W.B.; Wagner, C.L. Evidence Regarding Vitamin D and Risk of COVID-19 and Its Severity. Nutrients 2020, 12, 3361. [Google Scholar] [CrossRef] [PubMed]
- Alexander, J.; Tinkov, A.; Strand, T.A.; Alehagen, U.; Skalny, A.; Aaseth, J. Early Nutritional Interventions with Zinc, Selenium and Vitamin D for Raising Anti-Viral Resistance Against Progressive COVID-19. Nutrients 2020, 12, 2358. [Google Scholar] [CrossRef] [PubMed]
- Xu, Y.; Baylink, D.J.; Chen, C.-S.; Reeves, M.E.; Xiao, J.; Lacy, C.; Lau, E.; Cao, H. The Importance of Vitamin d Metabolism as a Potential Prophylactic, Immunoregulatory and Neuroprotective Treatment for COVID-19. J Transl Med 2020, 18, 322. [Google Scholar] [CrossRef]
- Mariani, J.; Antonietti, L.; Tajer, C.; Ferder, L.; Inserra, F.; Sanchez Cunto, M.; Brosio, D.; Ross, F.; Zylberman, M.; López, D.E.; et al. High-Dose Vitamin D versus Placebo to Prevent Complications in COVID-19 Patients: Multicentre Randomized Controlled Clinical Trial. PLoS ONE 2022, 17, e0267918. [Google Scholar] [CrossRef]
- Murai, I.H.; Fernandes, A.L.; Antonangelo, L.; Gualano, B.; Pereira, R.M.R. Effect of a Single High-Dose Vitamin D3 on the Length of Hospital Stay of Severely 25-Hydroxyvitamin D-Deficient Patients with COVID-19. Clinics 2021, 76, e3549. [Google Scholar] [CrossRef] [PubMed]
- Ohaegbulam, K.C.; Swalih, M.; Patel, P.; Smith, M.A.; Perrin, R. Vitamin D Supplementation in COVID-19 Patients: A Clinical Case Series. American Journal of Therapeutics 2020, 27, e485–e490. [Google Scholar] [CrossRef] [PubMed]
- Sabico, S.; Enani, M.A.; Sheshah, E.; Aljohani, N.J.; Aldisi, D.A.; Alotaibi, N.H.; Alshingetti, N.; Alomar, S.Y.; Alnaami, A.M.; Amer, O.E.; et al. Effects of a 2-Week 5000 IU versus 1000 IU Vitamin D3 Supplementation on Recovery of Symptoms in Patients with Mild to Moderate Covid-19: A Randomized Clinical Trial. Nutrients 2021, 13, 2170. [Google Scholar] [CrossRef] [PubMed]
- Wölfel, R.; Corman, V.M.; Guggemos, W.; Seilmaier, M.; Zange, S.; Müller, M.A.; Niemeyer, D.; Jones, T.C.; Vollmar, P.; Rothe, C.; et al. Virological Assessment of Hospitalized Patients with COVID-2019. Nature 2020, 581, 465–469. [Google Scholar] [CrossRef] [PubMed]
- Coimbra, L.D.; Borin, A.; Fontoura, M.; Gravina, H.D.; Nagai, A.; Shimizu, J.F.; Bispo-dos-Santos, K.; Granja, F.; Oliveira, P.S.L.; Franchini, K.G.; et al. Identification of Compounds With Antiviral Activity Against SARS-CoV-2 in the MMV Pathogen Box Using a Phenotypic High-Throughput Screening Assay. Front.Virol. 2022, 2, 854363. [Google Scholar] [CrossRef]
- Bispo-dos-Santos, K.; Barbosa, P.P.; Granja, F.; Martini, M.C.; Oliveira, C.F.S.; Schuck, D.C.; Brohem, C.A.; Arns, C.W.; Hares Junior, S.J.; Sabino, C.P.; et al. Ultraviolet Germicidal Irradiation Is Effective against SARS-CoV-2 in Contaminated Makeup Powder and Lipstick. Journal of Photochemistry and Photobiology 2021, 8, 100072. [Google Scholar] [CrossRef] [PubMed]
- Roberts, A.; Deming, D.; Paddock, C.D.; Cheng, A.; Yount, B.; Vogel, L.; Herman, B.D.; Sheahan, T.; Heise, M.; Genrich, G.L.; et al. A Mouse-Adapted SARS-Coronavirus Causes Disease and Mortality in BALB/c Mice. PLoS Pathog 2007, 3, e5. [Google Scholar] [CrossRef] [PubMed]
- Bösmüller, H.; Matter, M.; Fend, F.; Tzankov, A. The Pulmonary Pathology of COVID-19. Virchows Arch 2021, 478, 137–150. [Google Scholar] [CrossRef]
- Meyer, K.C.; Raghu, G. Bronchoalveolar Lavage for the Evaluation of Interstitial Lung Disease: Is It Clinically Useful? European Respiratory Journal 2011, 38, 761–769. [Google Scholar] [CrossRef]
- Van Hoecke, L.; Job, E.R.; Saelens, X.; Roose, K. Bronchoalveolar Lavage of Murine Lungs to Analyze Inflammatory Cell Infiltration. JoVE 2017, 55398. [Google Scholar] [CrossRef]
- Liao, M.; Liu, Y.; Yuan, J.; Wen, Y.; Xu, G.; Zhao, J.; Cheng, L.; Li, J.; Wang, X.; Wang, F.; et al. Single-Cell Landscape of Bronchoalveolar Immune Cells in Patients with COVID-19. Nat Med 2020, 26, 842–844. [Google Scholar] [CrossRef] [PubMed]
- Pan, P.; Shen, M.; Yu, Z.; Ge, W.; Chen, K.; Tian, M.; Xiao, F.; Wang, Z.; Wang, J.; Jia, Y.; et al. SARS-CoV-2 N Protein Promotes NLRP3 Inflammasome Activation to Induce Hyperinflammation. Nat Commun 2021, 12, 4664. [Google Scholar] [CrossRef] [PubMed]
- Rodrigues, T.S.; de Sá, K.S.G.; Ishimoto, A.Y.; Becerra, A.; Oliveira, S.; Almeida, L.; Gonçalves, A.V.; Perucello, D.B.; Andrade, W.A.; Castro, R.; et al. Inflammasomes Are Activated in Response to SARS-CoV-2 Infection and Are Associated with COVID-19 Severity in Patients. Journal of Experimental Medicine 2021, 218, e20201707. [Google Scholar] [CrossRef] [PubMed]
- Zeng, J.; Xie, X.; Feng, X.-L.; Xu, L.; Han, J.-B.; Yu, D.; Zou, Q.-C.; Liu, Q.; Li, X.; Ma, G.; et al. Specific Inhibition of the NLRP3 Inflammasome Suppresses Immune Overactivation and Alleviates COVID-19 like Pathology in Mice. eBioMedicine 2022, 75, 103803. [Google Scholar] [CrossRef] [PubMed]
- Hou, F.; Xiao, K.; Tang, L.; Xie, L. Diversity of Macrophages in Lung Homeostasis and Diseases. Front. Immunol. 2021, 12, 753940. [Google Scholar] [CrossRef] [PubMed]
- Xu, Z.; Shi, L.; Wang, Y.; Zhang, J.; Huang, L.; Zhang, C.; Liu, S.; Zhao, P.; Liu, H.; Zhu, L.; et al. Pathological Findings of COVID-19 Associated with Acute Respiratory Distress Syndrome. The Lancet Respiratory Medicine 2020, 8, 420–422. [Google Scholar] [CrossRef] [PubMed]
- Yinda, C.K.; Port, J.R.; Bushmaker, T.; Offei Owusu, I.; Purushotham, J.N.; Avanzato, V.A.; Fischer, R.J.; Schulz, J.E.; Holbrook, M.G.; Hebner, M.J.; et al. K18-HACE2 Mice Develop Respiratory Disease Resembling Severe COVID-19. PLoS Pathog 2021, 17, e1009195. [Google Scholar] [CrossRef] [PubMed]
- Merad, M.; Martin, J.C. Pathological Inflammation in Patients with COVID-19: A Key Role for Monocytes and Macrophages. Nat Rev Immunol 2020, 20, 355–362. [Google Scholar] [CrossRef] [PubMed]
- Reusch, N.; De Domenico, E.; Bonaguro, L.; Schulte-Schrepping, J.; Baßler, K.; Schultze, J.L.; Aschenbrenner, A.C. Neutrophils in COVID-19. Front. Immunol. 2021, 12, 652470. [Google Scholar] [CrossRef]
- Barnes, B.J.; Adrover, J.M.; Baxter-Stoltzfus, A.; Borczuk, A.; Cools-Lartigue, J.; Crawford, J.M.; Daßler-Plenker, J.; Guerci, P.; Huynh, C.; Knight, J.S.; et al. Targeting Potential Drivers of COVID-19: Neutrophil Extracellular Traps. Journal of Experimental Medicine 2020, 217, e20200652. [Google Scholar] [CrossRef]
- Meizlish, M.L.; Pine, A.B.; Bishai, J.D.; Goshua, G.; Nadelmann, E.R.; Simonov, M.; Chang, C.-H.; Zhang, H.; Shallow, M.; Bahel, P.; et al. A Neutrophil Activation Signature Predicts Critical Illness and Mortality in COVID-19. Blood Advances 2021, 5, 1164–1177. [Google Scholar] [CrossRef] [PubMed]
- Cavalcante-Silva, L.H.A.; Carvalho, D.C.M.; Lima, É. de A.; Galvão, J.G.F.M.; da Silva, J.S. de F.; Sales-Neto, J.M. de; Rodrigues-Mascarenhas, S. Neutrophils and COVID-19: The Road so Far. International Immunopharmacology 2021, 90, 107233. [Google Scholar] [CrossRef] [PubMed]
- Parackova, Z.; Zentsova, I.; Bloomfield, M.; Vrabcova, P.; Smetanova, J.; Klocperk, A.; Mesežnikov, G.; Casas Mendez, L.F.; Vymazal, T.; Sediva, A. Disharmonic Inflammatory Signatures in COVID-19: Augmented Neutrophils’ but Impaired Monocytes’ and Dendritic Cells’ Responsiveness. Cells 2020, 9, 2206. [Google Scholar] [CrossRef] [PubMed]
- Tomar, B.; Anders, H.-J.; Desai, J.; Mulay, S.R. Neutrophils and Neutrophil Extracellular Traps Drive Necroinflammation in COVID-19. Cells 2020, 9, 1383. [Google Scholar] [CrossRef] [PubMed]
- Gardiman, E.; Bianchetto-Aguilera, F.; Gasperini, S.; Tiberio, L.; Scandola, M.; Lotti, V.; Gibellini, D.; Salvi, V.; Bosisio, D.; Cassatella, M.A.; et al. SARS-CoV-2-Associated SsRNAs Activate Human Neutrophils in a TLR8-Dependent Fashion. Cells 2022, 11, 3785. [Google Scholar] [CrossRef] [PubMed]
- Xie, G.; Ding, F.; Han, L.; Yin, D.; Lu, H.; Zhang, M. The Role of Peripheral Blood Eosinophil Counts in COVID-19 Patients. Allergy 2021, 76, 471–482. [Google Scholar] [CrossRef] [PubMed]
- Kim, D.-M.; Seo, J.-W.; Kim, Y.; Park, U.; Ha, N.-Y.; Park, H.; Yun, N.R.; Kim, D.Y.; Yoon, S.H.; Na, Y.S.; et al. Eosinophil-Mediated Lung Inflammation Associated with Elevated Natural Killer T Cell Response in COVID-19 Patients. Korean J Intern Med 2022, 37, 201–209. [Google Scholar] [CrossRef] [PubMed]
- Marongiu, L.; Valache, M.; Facchini, F.A.; Granucci, F. How Dendritic Cells Sense and Respond to Viral Infections. Clinical Science 2021, 135, 2217–2242. [Google Scholar] [CrossRef] [PubMed]
- Winheim, E.; Rinke, L.; Lutz, K.; Reischer, A.; Leutbecher, A.; Wolfram, L.; Rausch, L.; Kranich, J.; Wratil, P.R.; Huber, J.E.; et al. Impaired Function and Delayed Regeneration of Dendritic Cells in COVID-19. PLoS Pathog 2021, 17, e1009742. [Google Scholar] [CrossRef]
- Darif, D.; Hammi, I.; Kihel, A.; El Idrissi Saik, I.; Guessous, F.; Akarid, K. The Pro-Inflammatory Cytokines in COVID-19 Pathogenesis: What Goes Wrong? Microbial Pathogenesis 2021, 153, 104799. [Google Scholar] [CrossRef]
- Sassi, F.; Tamone, C.; D’Amelio, P. Vitamin D: Nutrient, Hormone, and Immunomodulator. Nutrients 2018, 10, 1656. [Google Scholar] [CrossRef] [PubMed]
- Karonova, T.L.; Andreeva, A.T.; Golovatuk, K.A.; Bykova, E.S.; Simanenkova, A.V.; Vashukova, M.A.; Grant, W.B.; Shlyakhto, E.V. Low 25(OH)D Level Is Associated with Severe Course and Poor Prognosis in COVID-19. Nutrients 2021, 13, 3021. [Google Scholar] [CrossRef] [PubMed]
- de Oliveira, L.R.C.; Mimura, L.A.N.; Fraga-Silva, T.F. de C.; Ishikawa, L.L.W.; Fernandes, A.A.H.; Zorzella-Pezavento, S.F.G.; Sartori, A. Calcitriol Prevents Neuroinflammation and Reduces Blood-Brain Barrier Disruption and Local Macrophage/Microglia Activation. Front. Pharmacol. 2020, 11, 161. [Google Scholar] [CrossRef] [PubMed]
- Mimura, L.A.N.; Fraga-Silva, T.F. de C.; Oliveira, L.R.C. de; Ishikawa, L.L.W.; Borim, P.A.; Machado, C. de M.; Júnior, J. de A. de C. e H.; Fonseca, D.M. da; Sartori, A. Preclinical Therapy with Vitamin D3 in Experimental Encephalomyelitis: Efficacy and Comparison with Paricalcitol. IJMS 2021, 22, 1914. [Google Scholar] [CrossRef] [PubMed]
- Radujkovic, A.; Hippchen, T.; Tiwari-Heckler, S.; Dreher, S.; Boxberger, M.; Merle, U. Vitamin D Deficiency and Outcome of COVID-19 Patients. Nutrients 2020, 12, 2757. [Google Scholar] [CrossRef] [PubMed]
- Entrenas Castillo, M.; Entrenas Costa, L.M.; Vaquero Barrios, J.M.; Alcalá Díaz, J.F.; López Miranda, J.; Bouillon, R.; Quesada Gomez, J.M. “Effect of Calcifediol Treatment and Best Available Therapy versus Best Available Therapy on Intensive Care Unit Admission and Mortality among Patients Hospitalized for COVID-19: A Pilot Randomized Clinical Study. ” The Journal of Steroid Biochemistry and Molecular Biology 2020, 203, 105751. [Google Scholar] [CrossRef] [PubMed]
- Marcinkowska, E.; Brown, G. Editorial: Vitamin D and COVID-19: New Mechanistic and Therapeutic Insights. Front. Pharmacol. 2022, 13, 882046. [Google Scholar] [CrossRef] [PubMed]
- Feng, L.; Meng, T.; Qi, Y.; Athari, S.S.; Chen, X. Study Effect of Vitamin D on the Immunopathology Responses of the Bronchi in Murine Model of Asthma. IJAAI 2021. [Google Scholar] [CrossRef] [PubMed]
- Cho, S.-W.; Zhang, Y.-L.; Ko, Y.K.; Shin, J.M.; Lee, J.H.; Rhee, C.-S.; Kim, D.-Y. Intranasal Treatment With 1, 25-Dihydroxyvitamin D3 Alleviates Allergic Rhinitis Symptoms in a Mouse Model. Allergy Asthma Immunol Res 2019, 11, 267. [Google Scholar] [CrossRef]
- Tebben, P.J.; Singh, R.J.; Kumar, R. Vitamin D-Mediated Hypercalcemia: Mechanisms, Diagnosis, and Treatment. Endocrine Reviews 2016, 37, 521–547. [Google Scholar] [CrossRef]
- Rhea, E.M.; Logsdon, A.F.; Banks, W.A.; Erickson, M.E. Intranasal Delivery: Effects on the Neuroimmune Axes and Treatment of Neuroinflammation. Pharmaceutics 2020, 12, 1120. [Google Scholar] [CrossRef] [PubMed]
- Sisley, S.R.; Arble, D.M.; Chambers, A.P.; Gutierrez-Aguilar, R.; He, Y.; Xu, Y.; Gardner, D.; Moore, D.D.; Seeley, R.J.; Sandoval, D.A. Hypothalamic Vitamin D Improves Glucose Homeostasis and Reduces Weight. Diabetes 2016, 65, 2732–2741. [Google Scholar] [CrossRef] [PubMed]
- Bilezikian, J.P.; Bikle, D.; Hewison, M.; Lazaretti-Castro, M.; Formenti, A.M.; Gupta, A.; Madhavan, M.V.; Nair, N.; Babalyan, V.; Hutchings, N.; et al. MECHANISMS IN ENDOCRINOLOGY: Vitamin D and COVID-19. European Journal of Endocrinology 2020, 183, R133–R147. [Google Scholar] [CrossRef] [PubMed]
- Serré, J.; Mathyssen, C.; Ajime, T.T.; Heigl, T.; Verlinden, L.; Maes, K.; Verstuyf, A.; Cataldo, D.; Vanoirbeek, J.; Vanaudenaerde, B.; et al. Local Nebulization of 1α,25(OH)2D3 Attenuates LPS-Induced Acute Lung Inflammation. Respir Res 2022, 23, 76. [Google Scholar] [CrossRef]
- Krasemann, S.; Haferkamp, U.; Pfefferle, S.; Woo, M.S.; Heinrich, F.; Schweizer, M.; Appelt-Menzel, A.; Cubukova, A.; Barenberg, J.; Leu, J.; et al. The Blood-Brain Barrier Is Dysregulated in COVID-19 and Serves as a CNS Entry Route for SARS-CoV-2. Stem Cell Reports 2022, 17, 307–320. [Google Scholar] [CrossRef]
Figure 3.
Evaluation of VitD effects on body weight, serum calcium levels, BALF cell counts and cytokine levels in the lungs of mice instilled with inactivated SARS-CoV-2. C57BL/6 mice were instilled with the virus (3 doses of 4.105 PFU/each) on days 1, 3 and 5. Body weight was checked daily and, at the 7th day, were collected blood samples for calcium measurement, BALF for WBC analysis and lower left lobe for cytokine quantification. Body weight loss (A), serum calcium levels (B), total WBC and WBC subsets in BALF (C), percentage of WBC in BALF (D), and cytokines in lung homogenates (E). Data showed in A, B and D derive from one experiment (n=5 mice/ experimental group). Data showed in C and D derive from 3 experiments with similar results which were combined (n= 16 mice/experimental group). The results are expressed as mean ± SEM and the comparison between the 4 groups was performed by the ANOVA test followed by Tukey. * p<0.05; ** p<0.01; p<0,001.
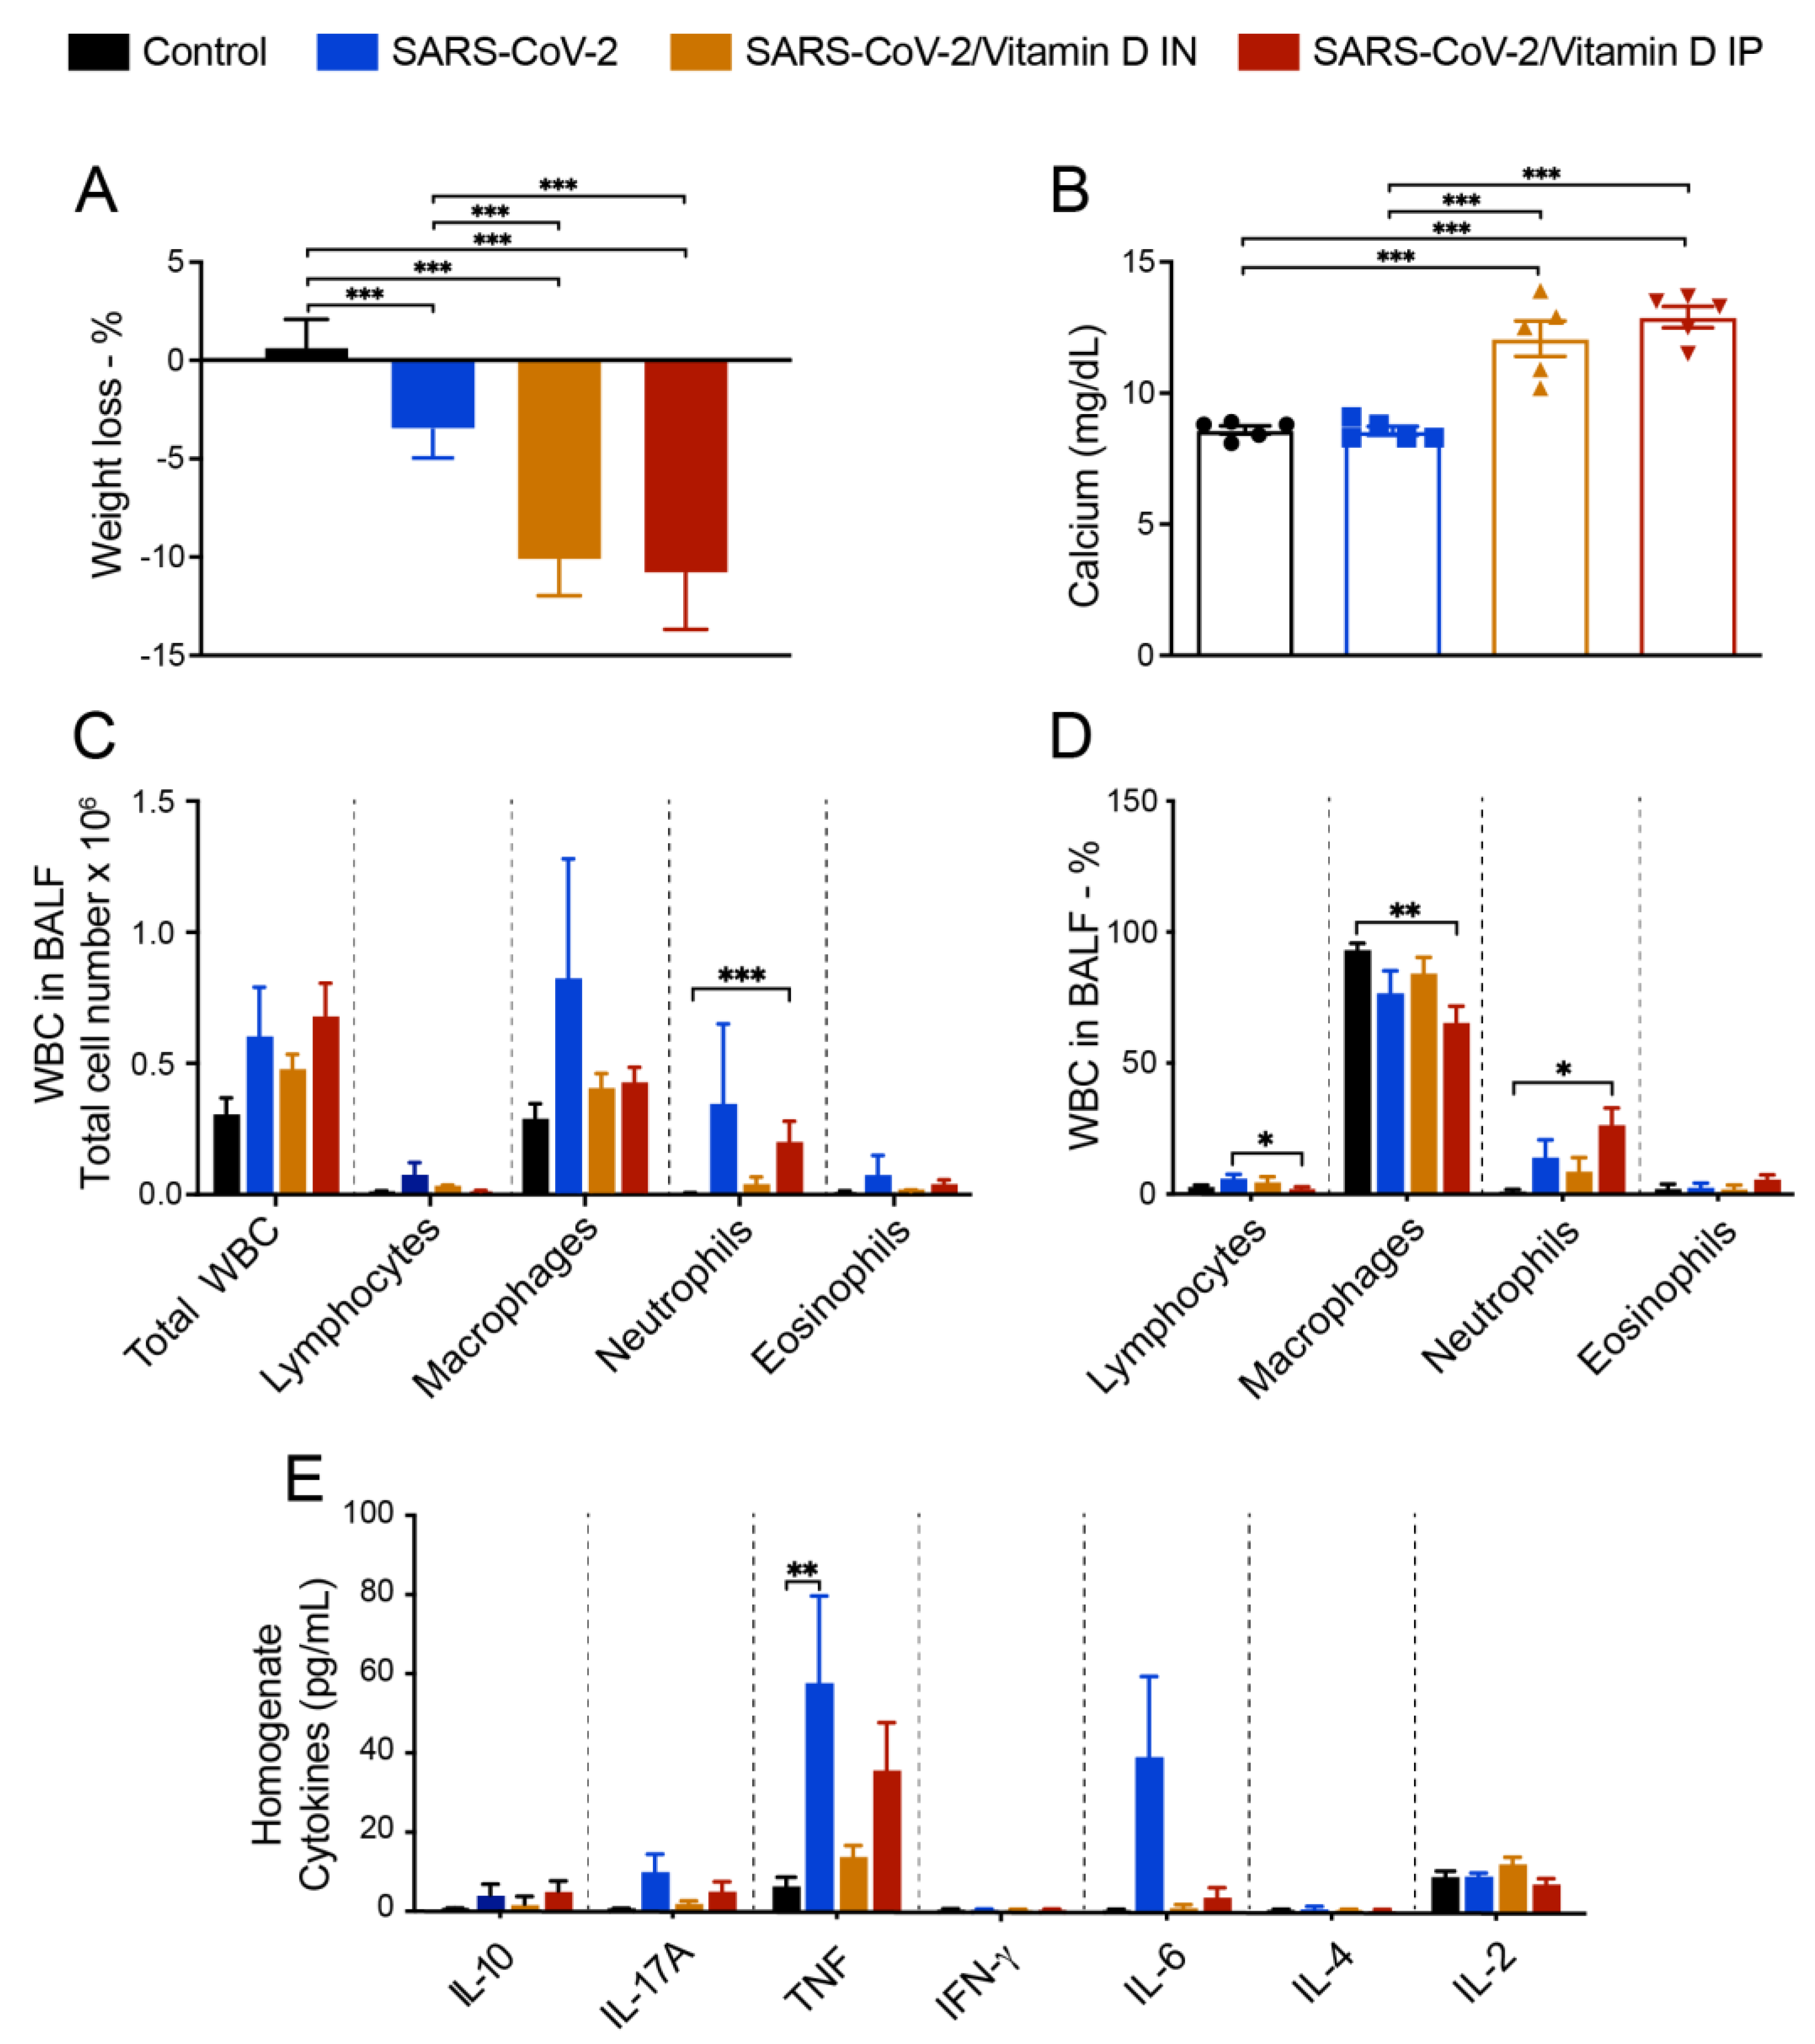
Figure 6.
Effect of IN vitamin D on lung histopathology and cell infiltration triggered by IN instillation of UV-inactivated SARS-CoV-2. C57BL/6 mice were instilled with the virus (3 doses of 4.105 PFU/each) on days 1, 3 and 5. In the IN protocol, mice was treatment with 3 VitD doses (0,1 µg/dose) simultaneously with the SARS-CoV-2 inoculum. In the IP protocol, each animal was treated with 4 VitD doses delivered on days 0,2,4 and 6. At the 7th day, the upper left lobe and the right lung were collected for flow cytometry analyses. In order to differentiate the parenchyma-infiltrating leukocytes from the vasculature-associated fraction, mice were intravenously injected with FITC-labeled anti-CD45 antibody 3 min before euthanasia. Specific cell subsets infiltrating the lungs of mice were analyzed according to the gate strategy described in Supplementary Figures S2, S3 and S4. Intracellular cytokine production was detected by flow cytometry in PMA/Ionomycin/brefeldin in vitro stimulated cells. (A) Representative contour plots of each experimental group indicating the frequency of cytokine production by each parenchymal cell subset, as indicated in the Y axis of the figure. (B-V) Absolute numbers and/or percentage of each cell subset or cytokine producing cell as indicated in each graph Y axis. Results are presented in median and interquartile intervals and the comparison between the groups was performed by the Kruskal-Wallis test followed by the Dunn´s test. * p<0.05; ** p<0.01; ***p<0,001
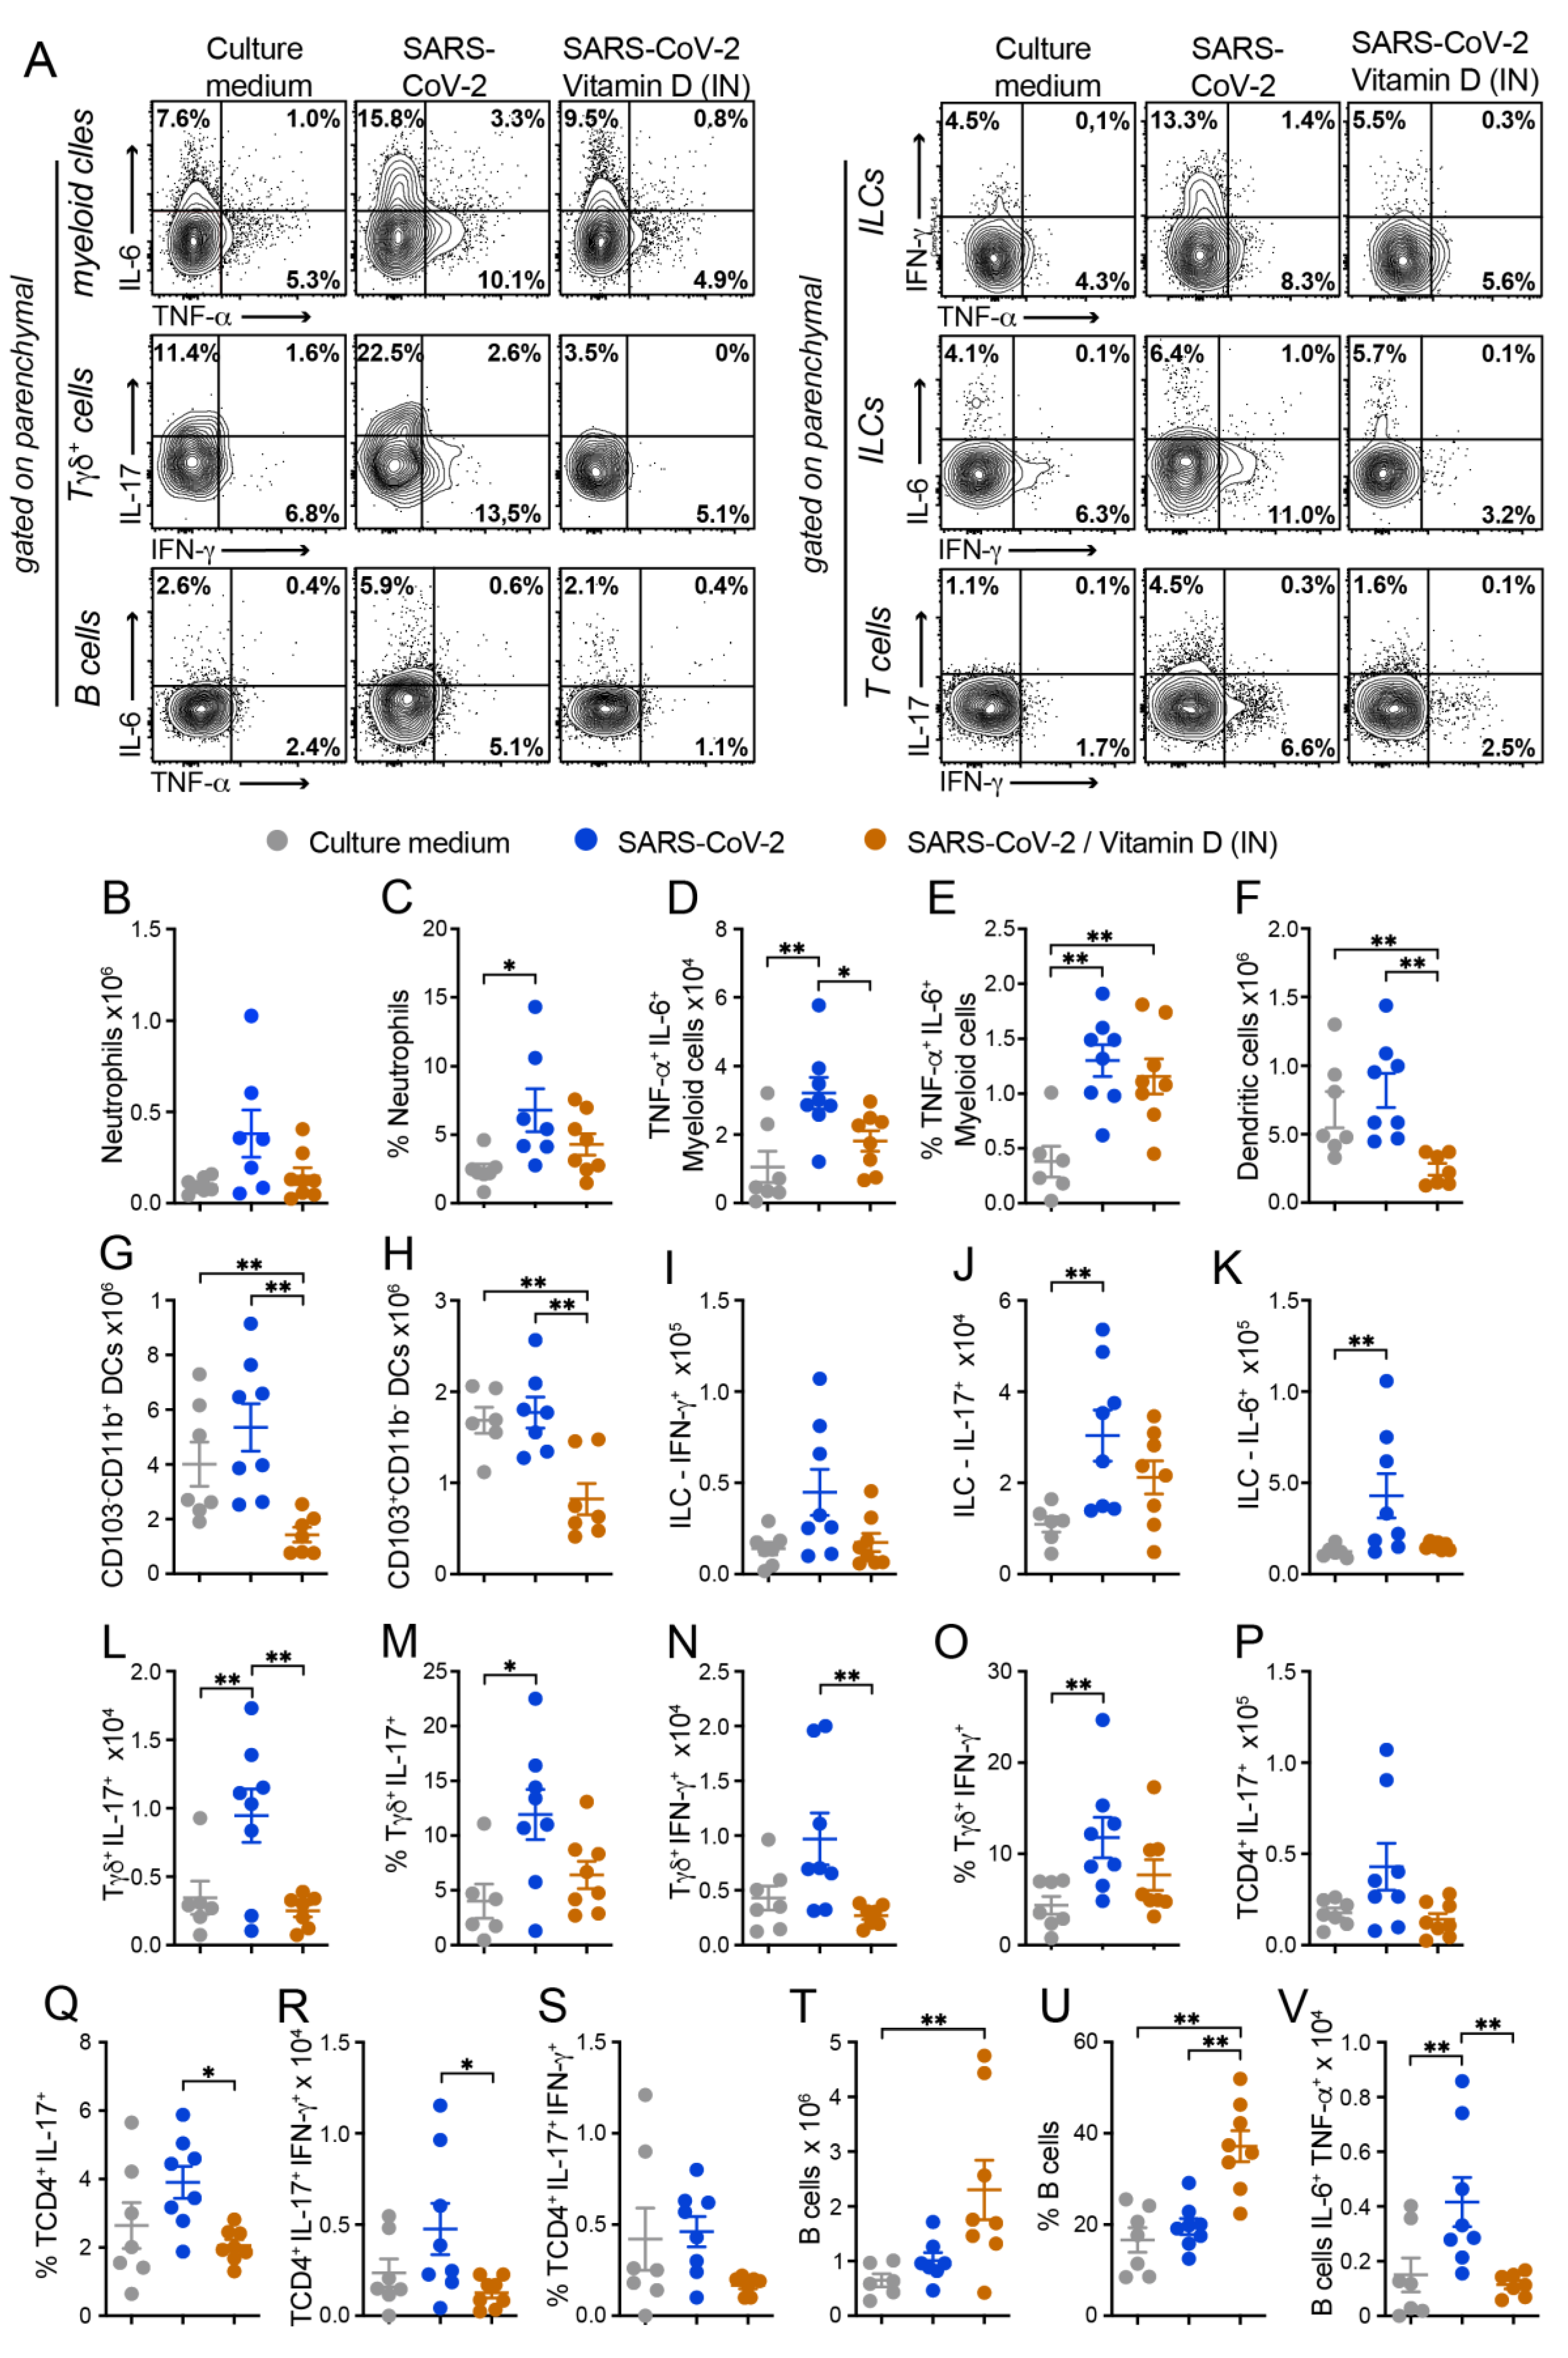
Disclaimer/Publisher’s Note: The statements, opinions and data contained in all publications are solely those of the individual author(s) and contributor(s) and not of MDPI and/or the editor(s). MDPI and/or the editor(s) disclaim responsibility for any injury to people or property resulting from any ideas, methods, instructions or products referred to in the content. |
© 2023 by the authors. Licensee MDPI, Basel, Switzerland. This article is an open access article distributed under the terms and conditions of the Creative Commons Attribution (CC BY) license (http://creativecommons.org/licenses/by/4.0/).
Copyright: This open access article is published under a Creative Commons CC BY 4.0 license, which permit the free download, distribution, and reuse, provided that the author and preprint are cited in any reuse.


