Preprint
Article

Intermittent Fasting Resolves Dyslipidemia and Atherogenesis in Apolipoprotein E-deficient Mice in a Diet-Dependent Manner, Irrespective of Sex

Altmetrics

Downloads

186

Views

182

Comments

0

A peer-reviewed article of this preprint also exists.

Submitted:

06 January 2023

Posted:

09 January 2023

You are already at the latest version

Alerts
Abstract
In humans and animal models, intermittent fasting (IF) interventions promote body weight loss, improve metabolic health, and are thought to lower cardiovascular disease risk. However, there is a paucity of reports on the relevancy of such nutritional interventions in the context of dyslipidemia and atherosclerotic cardiovascular diseases. The present study assessed the metabolic and atheroprotective effects of intermittent fasting intervention (IF) in atherosclerosis-prone apolipoprotein E-deficient (Apoe-/-) mice. Groups of male and female Apoe-/- mice were fed a regular (chow) or atherogenic (high-fat, high-cholesterol, HFCD) diet for 4 months, either ad libitum or in an alternate-day fasting manner. The results show that IF intervention improved glucose and lipid metabolism independently of sex. However, IF only decreased body weight gain in males fed chow diet and differentially modulated adipose tissue parameters and liver steatosis in a diet composition-dependent manner. Finally, IF prevented spontaneous aortic atherosclerotic lesions formation in mice fed chow diet, irrespective of sex but failed to reduce HFCD-diet-induced atherosclerosis. Overall, the current work indicates that IF interventions can efficiently improve glucose homeostasis and treat atherogenic dyslipidemia, but a degree of caution is warranted with regard to the individual sex and the composition of the dietary regimen.
Keywords: 
Subject: Medicine and Pharmacology  -   Dentistry and Oral Surgery

1. Introduction

The Dietary interventions are broadly considered to be powerful non-pharmacological approaches not only for losing weight and adiposity but also for the prevention of metabolic and cardiovascular diseases in diverse model organisms [1,2,3,4].
Intermittent fasting (IF) has been promoted as an alternative dietary weight loss strategy to caloric restriction diets [5]. The IF regimen encompasses several patterns, including every-other-day fasting (feeding no calories on fasting days), every-other-day modified fasting (feeding less than 25% of caloric demand on fasting days), cyclic fasting (fasting on two to three days per week), and time-restricted fasting (limiting the interval of daily food intake to specific daytimes).
Accumulating evidence from both human and animal studies suggests that IF, in particular every-other-day fasting, has ample potential to improve cardiometabolic health [6,7,8,9,10].
Human studies have reported that IF interventions favour body weight loss. However, these studies have been primarily conducted in small populations including non-obese healthy individuals or metabolically healthy overweight or obese patients [11,12,13,14]. Moreover, Wilkinson et al. recently reported that IF interventions in humans efficiently promote body weight loss but only slightly improve glucose metabolism [15]. Yet IF significantly reduced several cardiovascular risk factors, such as blood pressure and plasma atherogenic lipids levels, including triglycerides (TG) and low-density lipoprotein cholesterol (LDL-C) in patients with metabolic syndrome [15,16]. However, the dietary regimen compositions were poorly documented in these studies, and no study to date has assessed the effect of IF on patients with mild or advanced atherosclerosis.
In mice, IF intervention extends lifespan independently of sex and calorie intake [17]. In both sexes, IF protects mice from diet-induced obesity, glucose intolerance, insulin resistance, liver steatosis, systemic inflammation, and dyslipidemia [18,19]. These beneficial effects of IF on metabolic syndrome are mediated by diverse mechanisms including modulation of adipokine production [20], improvement in insulin sensitivity, reduction in oxidative stress and inflammation, and enhancement of adaptive stress responses such as autophagy, proteostasis, and endogenous antioxidant systems [17,21].
Three studies have analysed the impact of IF in atherogenesis in atherosclerosis mouse models, apolipoprotein E- and low-density lipoprotein receptor-deficient mice (Apoe-/- and LDLr-/-, respectively) [22,23,24], but they included only males and the differences in the diet compositions and IF regimen patterns used in these studies have yielded contradictory results regarding glucose homeostasis and atherogenesis.
In this context, the present study aimed to examine whether an IF intervention, in the form of an alternate-day fasting regimen, improves metabolic health and prevents atherogenesis in male and female Apoe-/- mice fed chow or atherogenic diet by analysing lesions at early and advanced stages of atherosclerosis, respectively [25].

2. Materials and Methods

2.1. Ethics

All mouse experiments were approved by the institutional animal care and use committee CEEA122, under number 2019/022111492658, and were performed according to Inserm guidelines for the care and use of laboratory animals. All efforts were made to minimize animal suffering and the number of animals used.

2.2. Animals, diets, and feeding interventions

Apolipoprotein E-deficient (Apoe-/-) mice on a C57BL/6J background were supplied by the Jackson Laboratory (Bar Harbor, ME, USA). Animals were housed at 22 ± 1°C on a 12 h light–dark cycle and had ad libitum access to water and a standard normal chow diet (CD, 67% carbohydrates, 9% fat, V1534-000, ssniff®, Germany). At 6 weeks of age, male and female mice were randomized into experimental groups based on body weight (RandoMice software, Leiden, the Netherlands [26]) and co-housed (3–4 mice per cage) for two weeks to allow for acclimation prior to feeding intervention for 16-weeks. The experimental groups consisted of 1) ad libitum feeding with CD (CD-AL group), 2) ad libitum feeding with CD in alternation to fasting every 24 h [24,27], namely intermittent fasting (CD-IF group), 3) ad libitum feeding with a high-fat high-cholesterol diet (HFCD, 50% carbohydrates, 20% fat with 16% of cocoa butter, and 1.25% cholesterol, SAFE A04, SAFE, Augy, France) (HFCD-AL group), and 4) ad libitum feeding with HFCD in alternation with fasting every 24 h (HFCD-IF group). Food intake (kcal) and body weight (g) were monitored weekly, and the metabolic efficiency was calculated as g of body weight gained per millijoule (MJ) of food consumed during the 16 weeks of intervention. The mice were then euthanized and blood, adipose tissues, liver, heart, and aorta were collected for biochemical and histological analysis. Organs and tissues were frozen for further analysis. The feeding intervention protocol (Figure 1A) was repeated in three independent cohorts.

2.3. Plasma lipid analysis

Plasma lipids were assessed as previously described [28]. Briefly, the concentration of plasma triglycerides (TG), high-density lipoprotein cholesterol (HDL-C), total cholesterol, and non-esterified fatty acids were determined using commercial colorimetric kits (Biolabo SAS, Maizy, France) based on GPO and CHOD-PAP detection methods, coupling enzymatic reaction, and detection of reaction end products by spectrophotometry (CLARIOstar Plus microplate reader, BMG Labtech, Germany).

2.4. Glucose and Insulin Tolerance Test

An intraperitoneal (i.p.) glucose tolerance test (IPGTT) was performed at 12 weeks of feeding intervention. Animals were fasted overnight before the experiments. Mice were administered glucose as a single bolus i.p. injection at 1 g/kg of body weight. Blood samples for plasma glucose measurement were collected from the tail vein 30 min before and 30, 60, 90, and 120 min after glucose administration. Glucose was measured using an Accu-Chek® glucometer (Roche). The plasma (5 µL sample) insulin concentration was determined 30 min before and 15 min and 60 min after glucose loading using an ultrasensitive ELISA kit (#10-1247, Mercodia AB, Uppsala, Sweden).
An insulin tolerance test (ITT) was performed at 14 weeks of feeding intervention in the same mouse groups that were tested for IPGTT. Animals were fasted 5 hours before the experiment and received a single i.p. bolus injection of insulin at 0.5 U/kg of body weight. Blood was collected from the tail vein 30 min before and 15, 30, 60, 90, and 120 min after insulin administration. Glucose was measured using the Accu-Chek® glucometer (Roche).

2.5. Haematoxylin and eosin (H&E) staining

Tissue histology was performed as previously described [28]. Briefly, liver, subcutaneous white adipose tissue (SC-WAT), and brown adipose tissue (BAT) were fixed in 4% paraformaldehyde for 24 h at room temperature, dehydrated, and embedded into paraffin. The tissues were sectioned into 5 μm slices. The sections were incubated for 30 min in Mayer’s haematoxylin solution, rinsed with distilled water for 5 min, and then incubated in saturated lithium carbonate solution for 15 s. The sections were then rinsed again with distilled water for 3 min and finally placed in 0.5% alcoholic eosin solution for 30 s. The slides were scanned with a NanoZoomer scanner 2.0 RS (Hamamatsu, Japan) at 40X magnification. The images shown are representative results of at least three biological replicates.

2.6. RNA extraction and Quantitative Real-Time PCR Analysis

RNA extraction and quantitative real-time PCR were performed as previously described [28]. Briefly, total RNA was prepared from liver or adipose tissues using QIAzol lysis reagent (QIAGEN, Germantown, MD, USA). The concentration of extracted RNAs of each sample was determined using a NanoDrop™ spectrophotometer (Thermo Fisher Scientific, Waltham, MA, USA). Reverse transcription of mRNA (1 μg) was performed using M-MLV Reverse Transcriptase (Promega, Madison, WI, USA) in the presence of a random primer (oligo(dT); 2 μL, 500 μg/mL; Promega) and 0.5 μL RNaseOUT™ (Thermo Fisher Scientific). After incubation for 8 min at 75°C to inactivate DNase, 200 U of M-MLV reverse transcriptase was added with subsequent incubation at 25°C for 10 min and then at 37°C for 1 h. The reverse transcription reaction was terminated by heating at 95°C for 5 min and then chilling and storing at -80°C.
Real-time quantitative PCR was performed using the SsoFast™ EvaGreen® Supermix (Bio-Rad). PCR was carried out in a 96-well format with 20 μL reactions containing SsoFast™ EvaGreen® Supermix (10 μL), cDNA (2 μL), gene-specific primers (0.5 μL), and DNase/RNase-free water (7 μL). To perform RT-PCR analyses, the relative gene expression of each transcript was normalized to the reference gene Gapdh by the 2−∆∆Ct method, and further normalized to the relative expression of the respective controls (i.e., ad libitum-fed group mice). The oligonucleotide sequences are provided in the Supplementary data section, Table S1.

2.7. Liver lipid content

The concentration of lipids in the liver was determined as previously described [28], according to Folch et al. [29]. Briefly, frozen liver tissue was homogenized in phosphate buffer (pH 7.4) until complete tissue lysis. Lipids were extracted by mixing the liver lysate with a 2:1 chloroform-to-methanol solution. After centrifugation, the chloroform phase was evaporated under nitrogen, and the dried residue was solubilized in isopropanol. Triglycerides and cholesterol were measured using commercial kits based on the CHOD-PAP and GPO-PAP detection methods (Biolabo SAS, Maizy, France). The results are expressed as micrograms of lipid per gram of liver.

2.8. Liver reactive oxygen species and TBARS

Reactive oxygen species (ROS) in liver were assayed as described [28]. Briefly, liver tissue was homogenized in a cold buffer (150 mM KCl, 20 mM Tris base, 0.5 mM EGTA, 1 mM MgCl2, 5 mM glucose, and 0.5 mM octanoic acid at pH 7.4). The ROS-reactive fluorescent probe H2-DCFDA (Molecular Probes) was then added to the liver lysate and incubated at 37°C for 30 min. The reaction was stopped with 0.1 M HCl in 70% of ethanol. The samples were centrifuged and the supernatants were collected and neutralized by the addition of 1 M NaHCO3 solution. The fluorescence was determined (485 nm excitation, 535 nm emission) using a CLARIOstar Plus microplate reader (BMG Labtech). The relative fluorescence units were normalized to the liver tissue weight used for each sample measurement, and the results are expressed as the percentage of fluorescence of the IF groups versus the AL groups. Lipid peroxidation was assessed as described [28] by measuring the concentration of thiobarbituric acid response substrates (TBARS), which are by-products of lipid peroxidation. Liver homogenate was incubated with 200 μL of 0.6% TBA, and 10 μL of 1% H3PO4 solutions at 95°C for 1 h. After the addition of 200 μL butanol, the coloured phase was extracted. Fluorescence was measured (515 nm excitation, 548 nm emission) using a CLARIOstar Plus microplate reader (BMG Labtech). The TBARS concentration was extrapolated from a standard curve. The results were normalized to the liver tissue weight used for each sample measurement and are expressed as the percentage of TBARS in the liver of the IF groups versus the AL groups.

2.9. Cannulation of the common bile duct and collection of hepatic bile

At the end of the IF intervention, a cohort of 6–7 mice per group was anesthetized by intraperitoneal injection of ketamine/xylazine. The common bile duct was ligated close to the duodenum, and then the gallbladder was punctured and cannulated with a polyethylene-10 catheter. After 30 min, newly secreted bile was collected for 30 min by gallbladder cannulation. During bile collection, the body temperature was stabilized using a temperature mattress. Bile flow (μL/min/100 g of body weight) was determined gravimetrically assuming a density of 1 g/mL for bile.

2.10. Biliary lipid analyses

For bile acid analysis [30], 1 μL of bile samples was diluted with 99 μL of Milli-Q® water and then incubated with the reagent solution (6 mg NAD, 0.5 M hydrazine hydrate buffer, 0.05 M Na-pyrophosphate) for 4 min. The mix was then incubated with the solution (0.03 M Tris-EDTA; 0.3 U/mL 3-alpha-OH steroid dehydrogenase), and the bile acids concentration was determined by spectrophotometry (excitation of 340/330 nm/emission of 440/420 nm, CLARIOstar Plus microplate reader, BMG Labtech). For phospholipids (PL) analysis, 1 μL of bile samples was diluted with 49 μL of Milli-Q® water and then incubated with the reagent solution (100 mM MOPS, pH 8; 0.55 mM HVA; 20 mM CaCl2; 11 U/mL phospholipase-D; 1.66 U/mL peroxidase; 0.1% Triton X-100) for 4 min. The mix was then incubated with a start reagent (1 M MOPS, pH 8, 50 U/mL choline oxidase), and the PL concentration was determined by spectrophotometry (excitation 340/330 nm/emission 440/420 nm using a CLARIOstar Plus microplate reader, BMG Labtech). For cholesterol analysis, 1 μL of bile samples was diluted with 29 μL of Milli-Q® water and then incubated with the reagent solution (100 mM MOPS, pH 8, 0.25 mM HVA; 0.1% Triton X-100) for 4 min. The mix was then incubated with a start reagent (0.1 M MOPS, pH 8, 0.06 U/mL cholesterol oxidase, 0.15 U/mL cholesterol esterase, 0.45 U/mL peroxidase, 0.06 mM taurocholate), and the cholesterol concentration was determined by spectrophotometry (excitation of 330/340 nm / emission of 420/440 nm, CLARIOstar Plus microplate reader, BMG Labtech).

2.11. Atherosclerotic lesions analysis

Atherosclerosis progression was measured in euthanized mice at the end of the intervention, as previously described [31](n = 5–6 per group). Briefly, the heart linked to the ascending aorta was carefully removed and snap-frozen at −80°C. Peripheral fat was removed from defrosted heart samples, under a binocular magnifier, and samples were embedded in OCT and frozen at −80°C for serial 10 μm-thick cryosectioning. Serial cross-sections of three valve leaflets from the aortic root were sectioned (5 sections per slide, from 200 to 800 μm from the base of the heart to the aortic arch). The slides were stained with Oil Red O (ORO) to visualize neutral lipids and counterstained with haematoxylin. Images of all stained slides were captured with a NanoZoomer scanner 2.0 RS (Hamamatsu). The areas of lesions were quantified using ImageJ software for image analysis and represented as the average of the lipid-stained areas for each distance from the heart [32].

2.12. Statistical analysis

All analyses of the results were performed using GraphPad prism V 6.06 software. The data are expressed as means ± the standard error of the mean (SEM). Significance was determined by the Mann–Whitney non-parametric test for comparison between two groups, intermittent fasting vs. ad libitum. A p-value of less than 0.05 was considered significant.

3. Results

3.1. Food intake and body weight gain

Two-month-old male (M) and female (F) Apoe-/- mice were randomly assigned to one of the four experimental groups (Figure 1A): ad libitum feeding with chow diet (CD-AL), intermittent feeding with CD (CD-IF), ad libitum feeding with high-fat high-cholesterol diet (HFCD-AL), and intermittent feeding with HFCD (HFCD-IF). As expected, for all sexes and diet compositions, the cumulative calorie intake was significantly lower in the IF groups compared with the AL groups (Figure 1B-E). Strikingly, despite this reduction in cumulative calorie intake in all IF groups, the intermittent fasting intervention only decreased body weight gain in males fed CD (Figure 1F) while no effect of IF on body weight gain was observed in males fed HFCD (Figure 1H) or in females fed CD or HFCD (Figure 1G-I). Metabolic efficiency, which reflects metabolic control of weight gain measured as the part of ingested energy that is stored as extra body energy deposits [33], was lower in M-CD-IF compared to M-CD-AL. This effect of IF was not observed in females fed CD (Supplementary Figure S1A) or in males fed HFCD (Supplementary Figure S1B, left panel). However, in females fed HFCD, IF led to an increase in metabolic efficiency (Supplementary Figure S1B, right panel).
These data indicate that IF regulates body weight gain and metabolic efficiency in Apoe-/- mice in a sex- and diet composition-dependent manner.

3.2. Lipid and glucose homeostasis

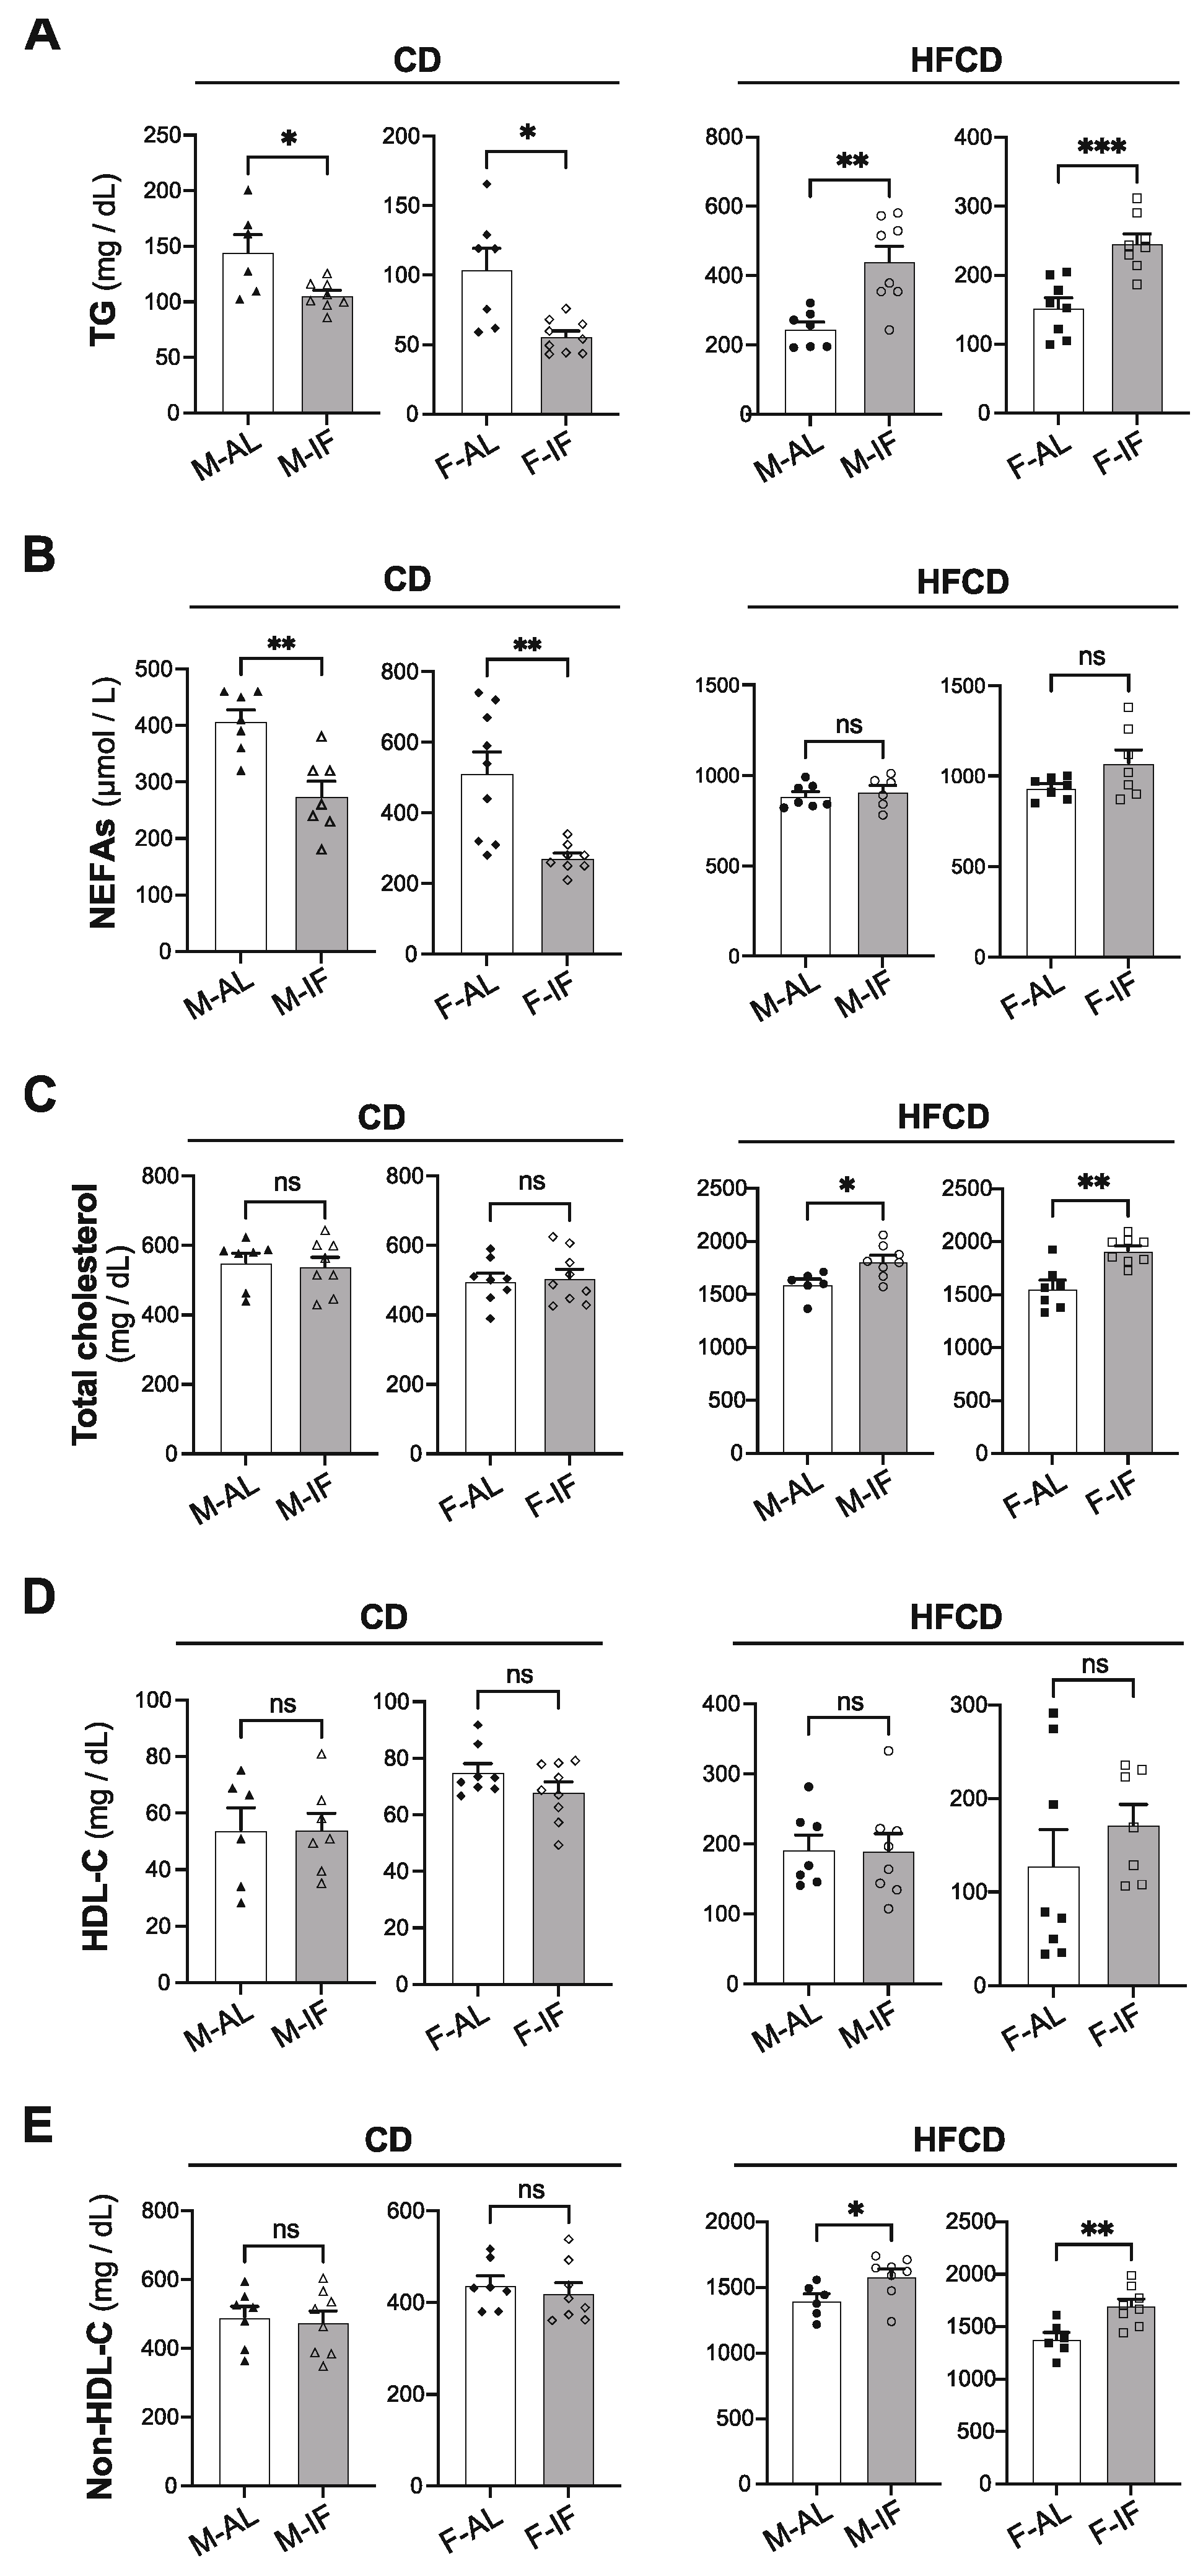
Compared to the AL control group, IF intervention in Apoe-/- mice fed CD significantly lowered the plasma levels of TG and NEFA in both sexes, while this condition did not affect total cholesterol, HDL-C and non-HDL-C levels (Figure 2A-E, left panels). Conversely, when Apoe-/- mice were fed HFCD, IF intervention favoured a dyslipidemic profile in both sexes, characterized by higher levels of plasma TG, total cholesterol, and non-HDL-C, and similar levels of HDL-C and FFA (Figure 2A-E, right panel).
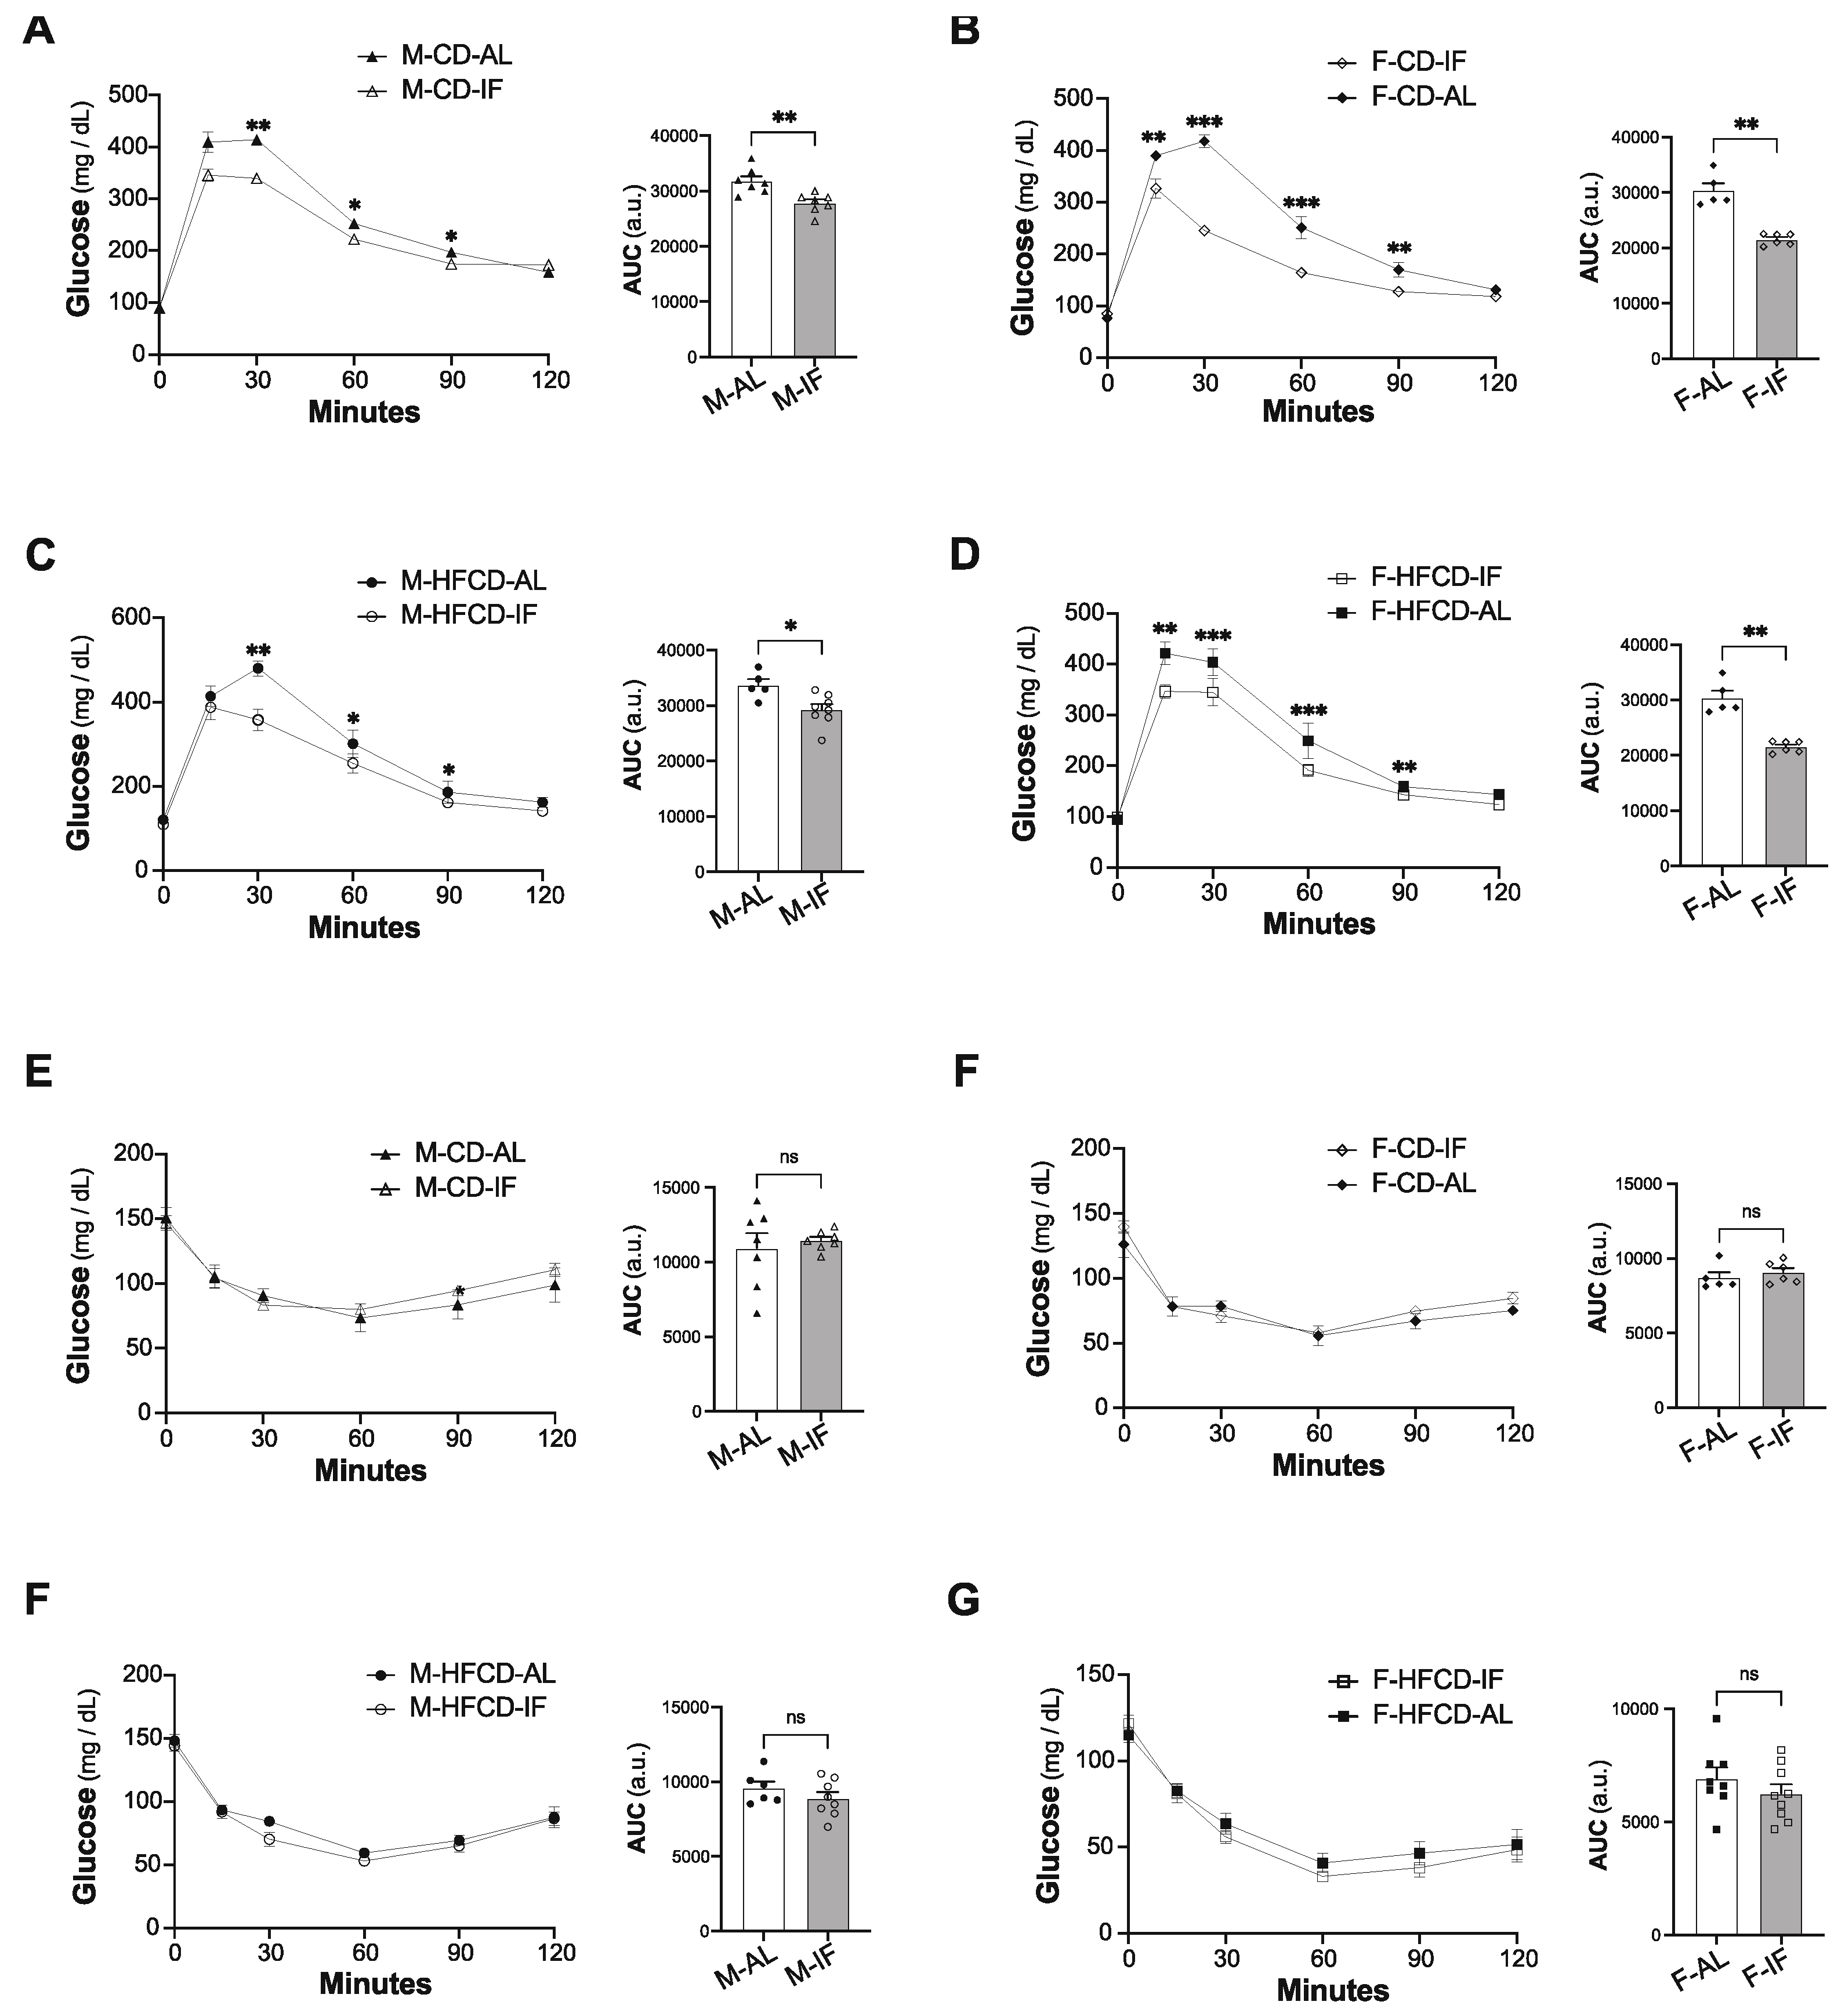
Baseline fasting glycaemia did not differ between the IF and AL groups (Figure 3A-D). In comparison to AL feeding, IF intervention resulted in less increase and faster clearance of blood glucose upon glucose loading (IPGTT), in both sexes and with any diet composition (Figure 3A-D). This improvement in glucose tolerance mediated by IF was not due to changes in plasma insulin levels (Supplementary Figure S2). Accordingly, the insulin sensitivity was comparable between the IF groups and their respective AL control groups, irrespective of sex and diet composition (Figures 3E-H), confirming that IF improves glucose tolerance in an insulin-independent manner.
Altogether, these results indicate that IF intervention improves glucose tolerance in Apoe-/- mice, independently of sex and diet composition, and partially resolves hypertriglyceridemia in mice fed CD, but it worsened dyslipidemia when mice were fed HFCD.

3.3. Adipose tissue features

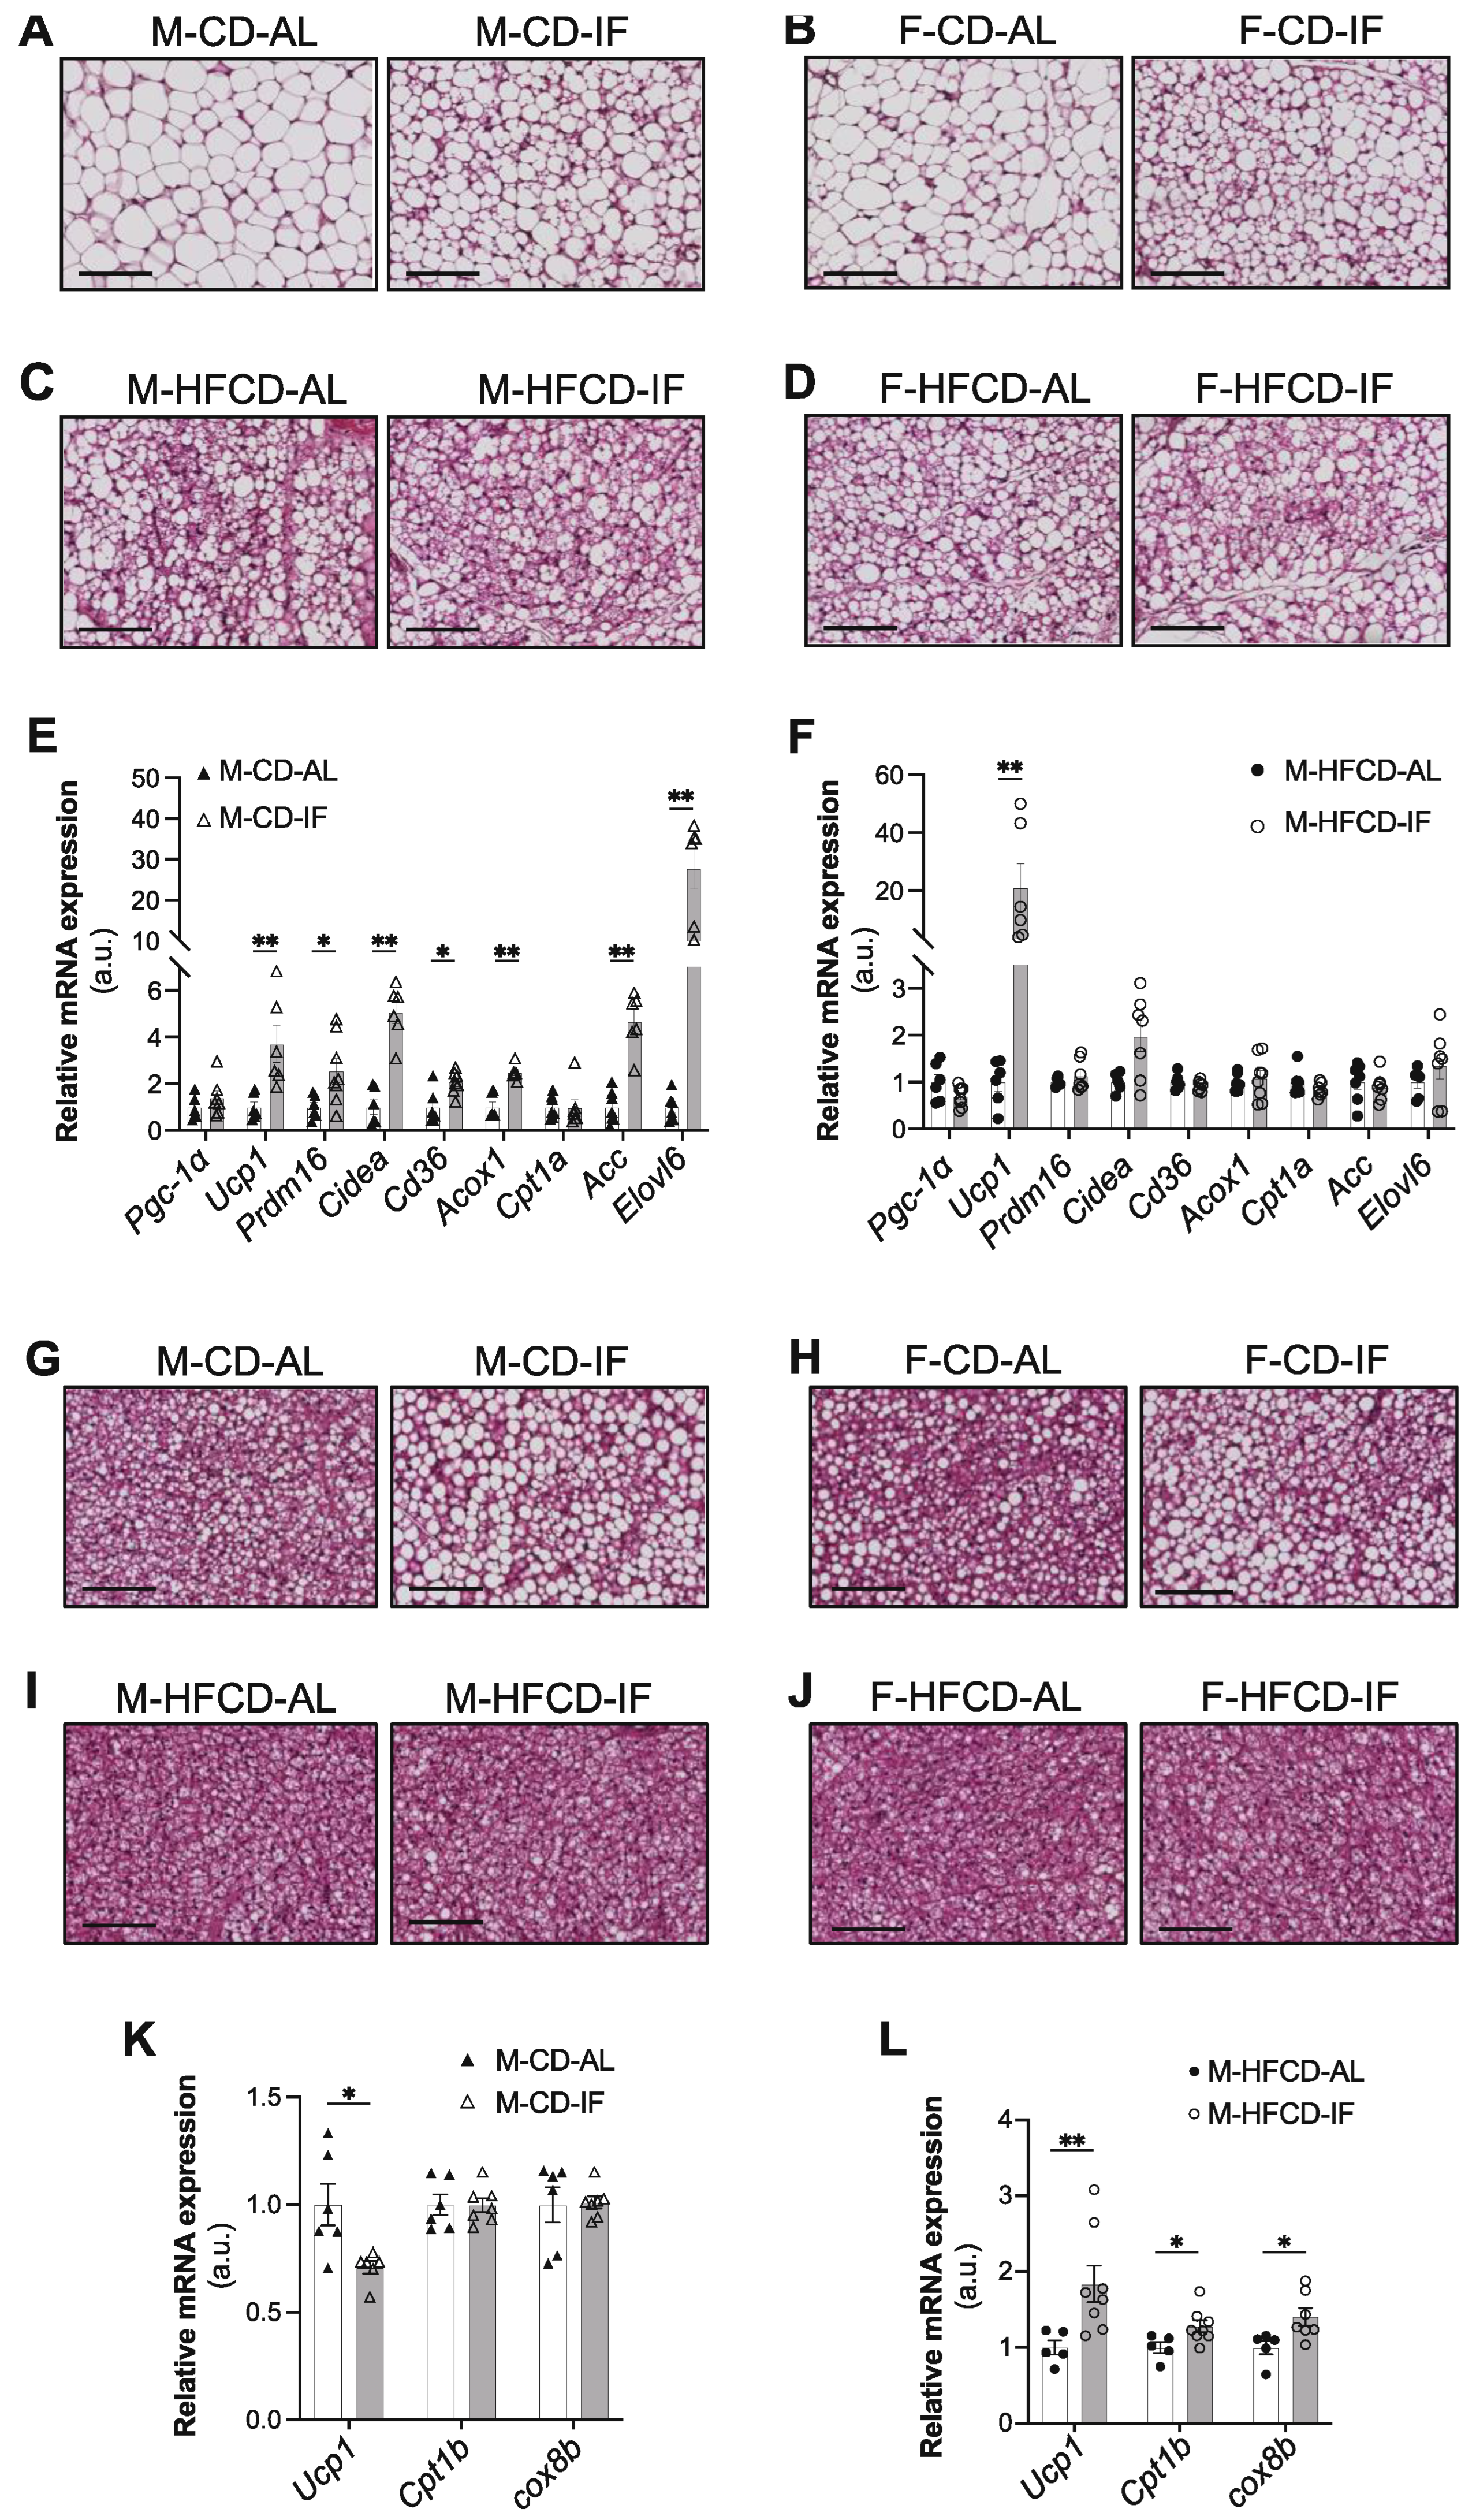
The effect of IF on weight loss might be consequent to WAT browning [34]. IF intervention in any group did not affect the subcutaneous adipose tissue (SC-AT) weight (Supplementary Figure S3A,B) but histological analysis of SC-AT sections showed that IF resulted in smaller adipocytes in male and female mice fed CD, accompanied by a profound morphological transformation towards a brown adipose tissue (BAT)-like phenotype, as numerous clusters of multilocular adipocytes were observed (Figure 4A,B). The effect of IF on SC-AT morphology in HFCD-fed mice was not as evident as in CD-fed mice (Figure 4C,D). It is noteworthy that HFCD by itself (i.e., under AL feeding conditions) induced a transformation towards a BAT-like phenotype (Figure 4A-D, left panels), as reported in Apoe-/- mice fed a high-fat diet [35,36].
Given that IF favoured a BAT-like phenotype independently of sex, we analysed gene expression in male mice only. In support of the histological analysis, when mice were fed CD, IF induced a significant increase in the expression of browning genes in SC-AT (Figure 4E), including uncoupling protein 1 (Ucp1), PR domain containing 16 (Prdm16), and cell death-inducing DFFA-like effector A (Cidea). IF also induced a significant increase in lipolysis-related genes, including cluster of differentiation 36 (Cd36), acyl-CoA oxidase 1 (Acox1), and elongation of very long-chain fatty acids protein 6 (Elovl6), as well as acetyl-CoA carboxylase alpha (Acaca), a rate-limiting enzyme for fatty acid synthesis (Figure 4E). However, in mice fed HFCD, only the Ucp1 mRNA expression level was dramatically upregulated by IF (Figure 4F). No difference was observed between the AL and IF groups in gene expression of peroxisome proliferator-activated receptor gamma coactivator 1-alpha (Pgc1-α) or carnitine palmitoyltransferase-1 (Cpt1-α), the rate-limiting enzyme of fatty acid oxidation (Figure 4E,F).
Together with AT browning, IF intervention increased the weight of BAT in mice of both sexes fed CD (Supplementary Figure S3C). A similar effect of IF was observed when mice were fed HFCD, but only in males (Supplementary Figure S3D). Intriguingly, brown fat cells from both male and female mice fed CD and undergoing IF intervention acquired a white-like unilocular adipocyte phenotype compared to their control AL mice (Figures 4G,H). However, under HFCD, no evidence of a difference in brown adipocytes morphology was observed between the AL and IF groups (Figures 4I,J). Consistent with our histological analysis, under CD, the mRNA level of Ucp1 was significantly reduced in the BAT of male mice submitted to IF compared to their AL controls. However, the expression of the other brown adipocytes marker genes, CPT1-α and cytochrome c oxidase subunit 8b (Cox8b), were not modified by IF (Figure 4K). Interestingly, under HFCD, IF induced a significant increase in the expression of all of these thermoregulatory genes (Figure 4L), suggesting that brown adipocytes are activated by IF when mice are subjected to HFCD.
Together, our data demonstrate that in Apoe-/- mice fed CD, IF differentially regulates the WAT and BAT morphologies and features by reprogramming lipid metabolism and browning gene expression in WAT and by inducing a whitening program in BAT. However, when mice are under HFCD, IF induces both browning of WAT and activation of BAT.

3.4. Hepatic lipid metabolism

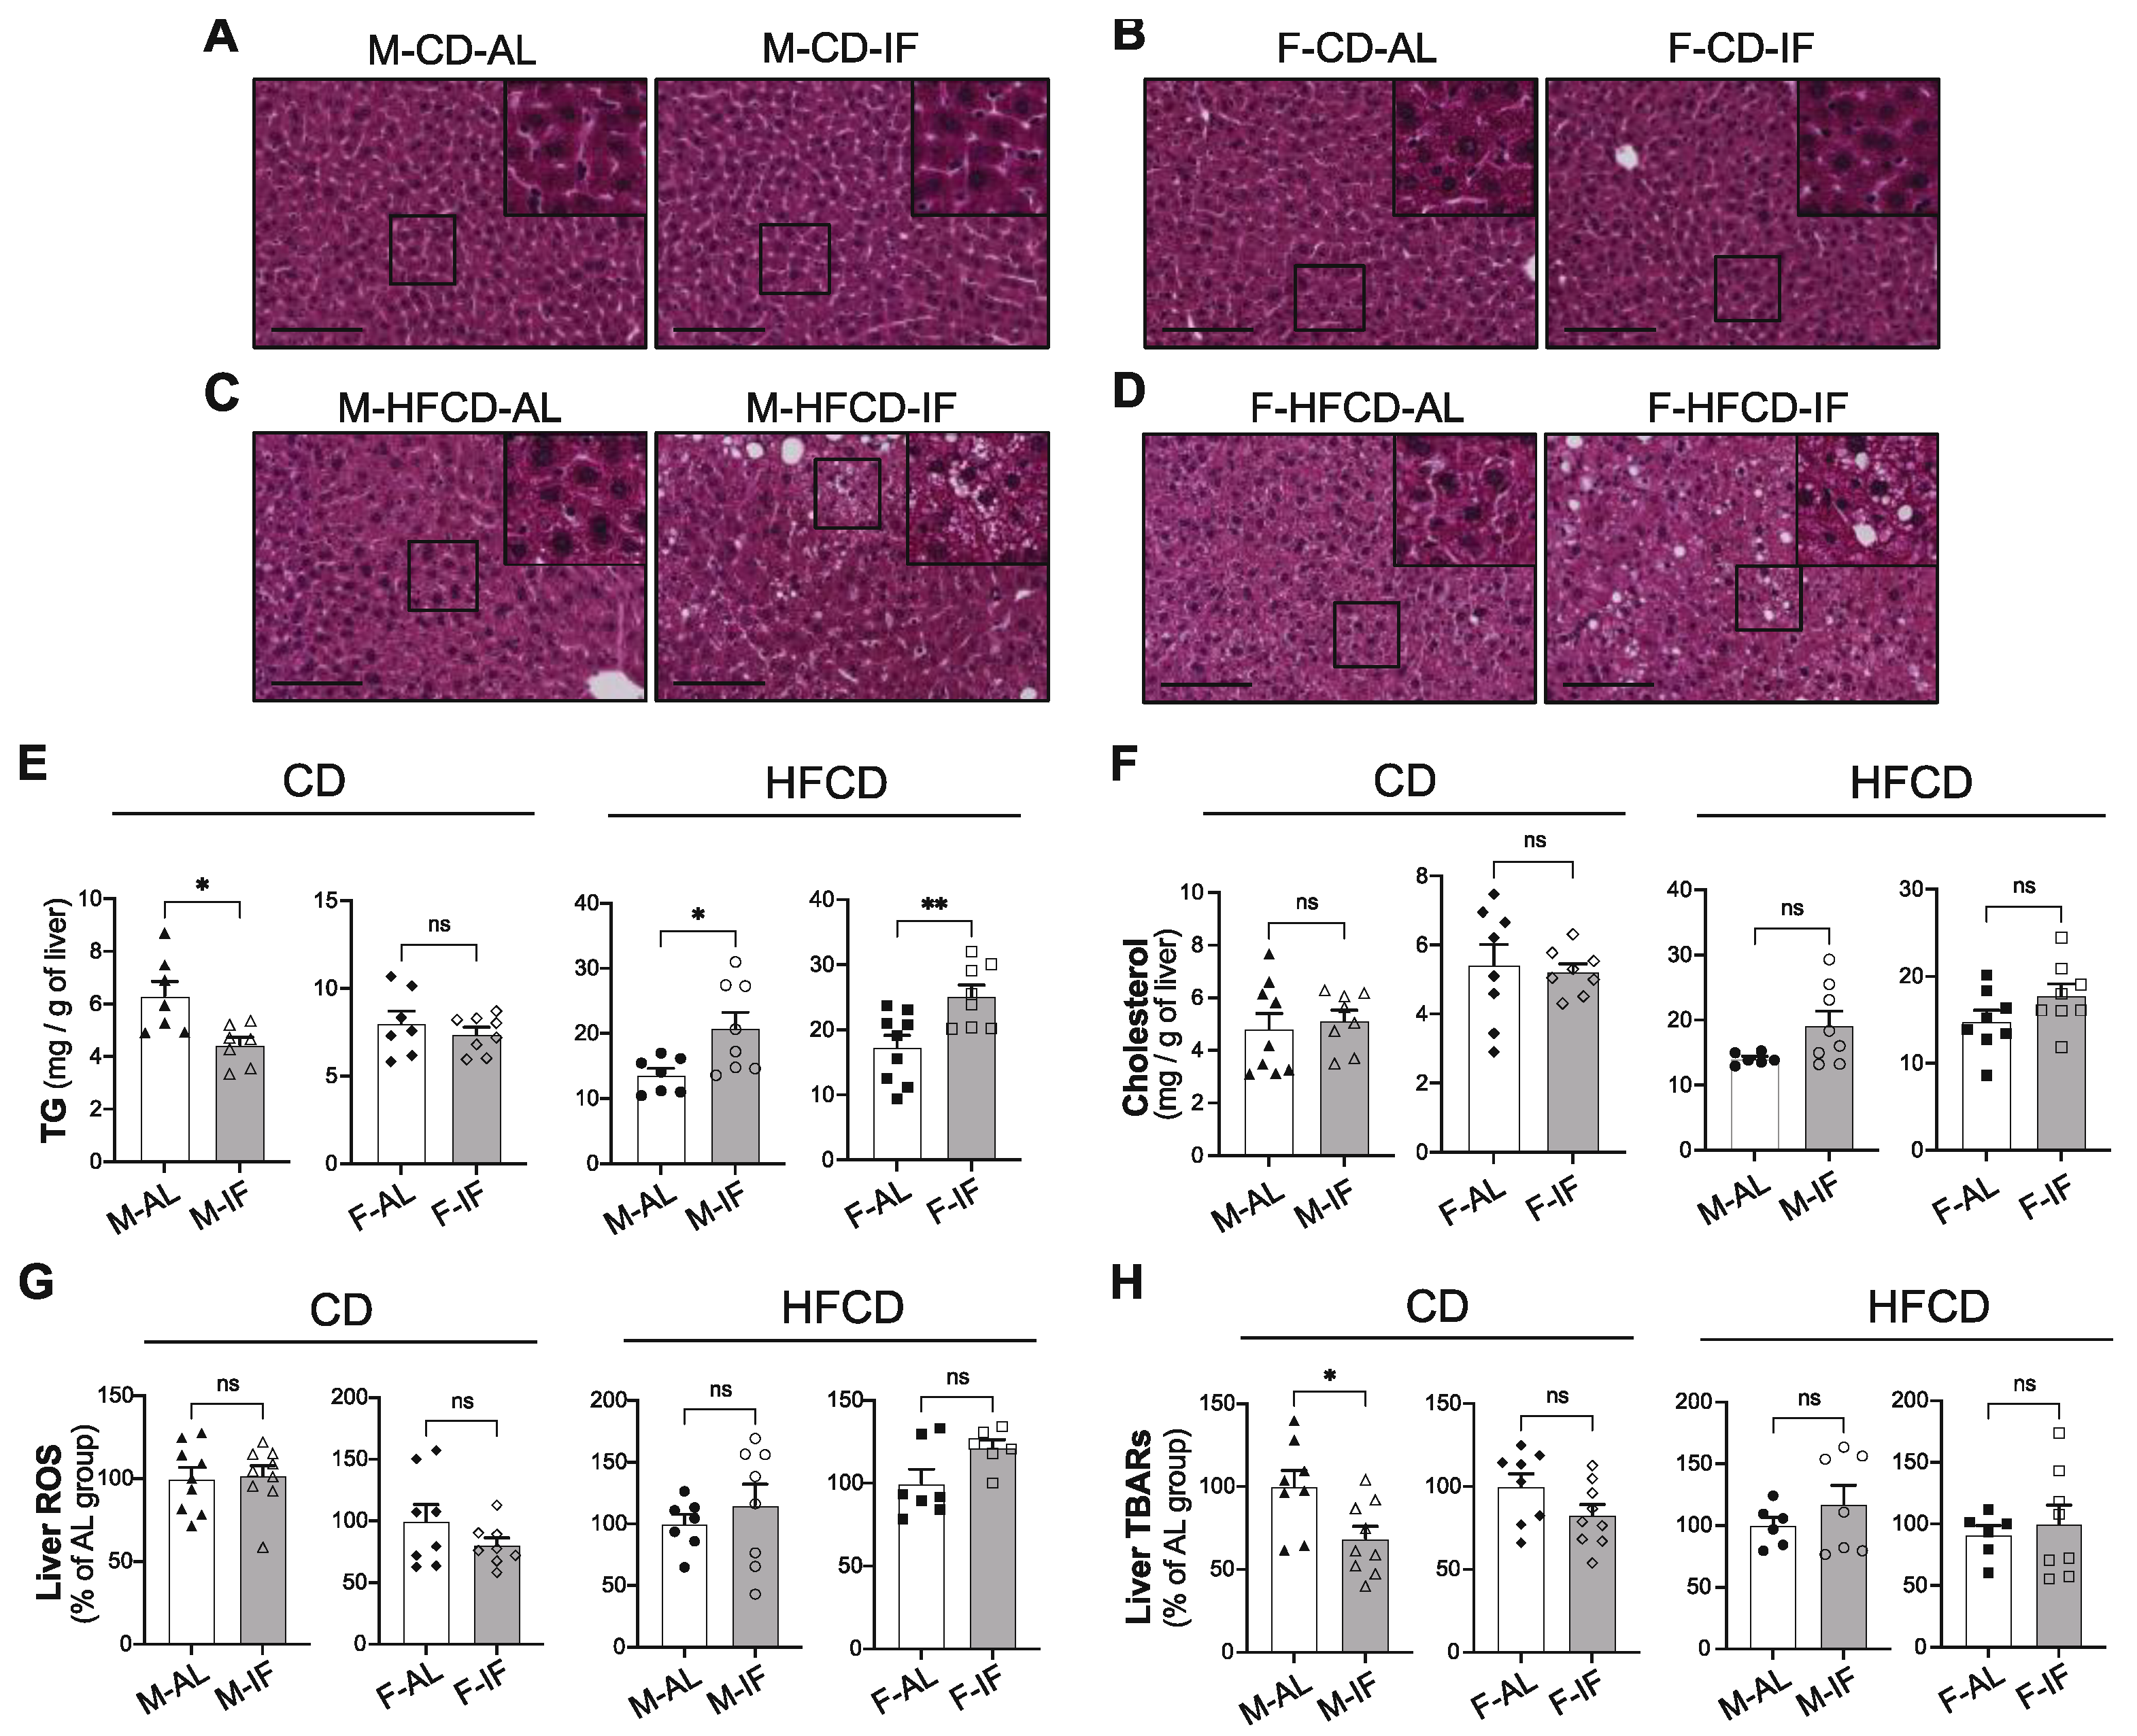
The effect of IF on hepatic lipid deposition was first examined in H&E-stained liver sections. Under CD, the histological morphology of the liver was similar between the AL and IF groups, with a normal structure of the liver cells in both groups in a sex-independent manner (Figure 5A,B). Yet, we found that IF significantly reduced hepatic triglycerides (TG) levels in males fed CD but not in females (Figure 5E, left panel). In contrast, in mice fed HFCD, the abundance and size of lipid droplets were higher in the IF groups than in the AL groups (Figures 5C,D). Accordingly, IF in mice fed HFCD was associated with increased levels of hepatic TG, independently of sex (Figure 5E, right panel). The hepatic cholesterol content and ROS levels, documenting oxidative stress, were similar between the IF groups and their respective AL control groups (Figure 5F,G), and the ability of IF to reduce liver TBARS, which are by-products of lipid peroxidation, was strictly limited to males fed CD (Figure 5H).
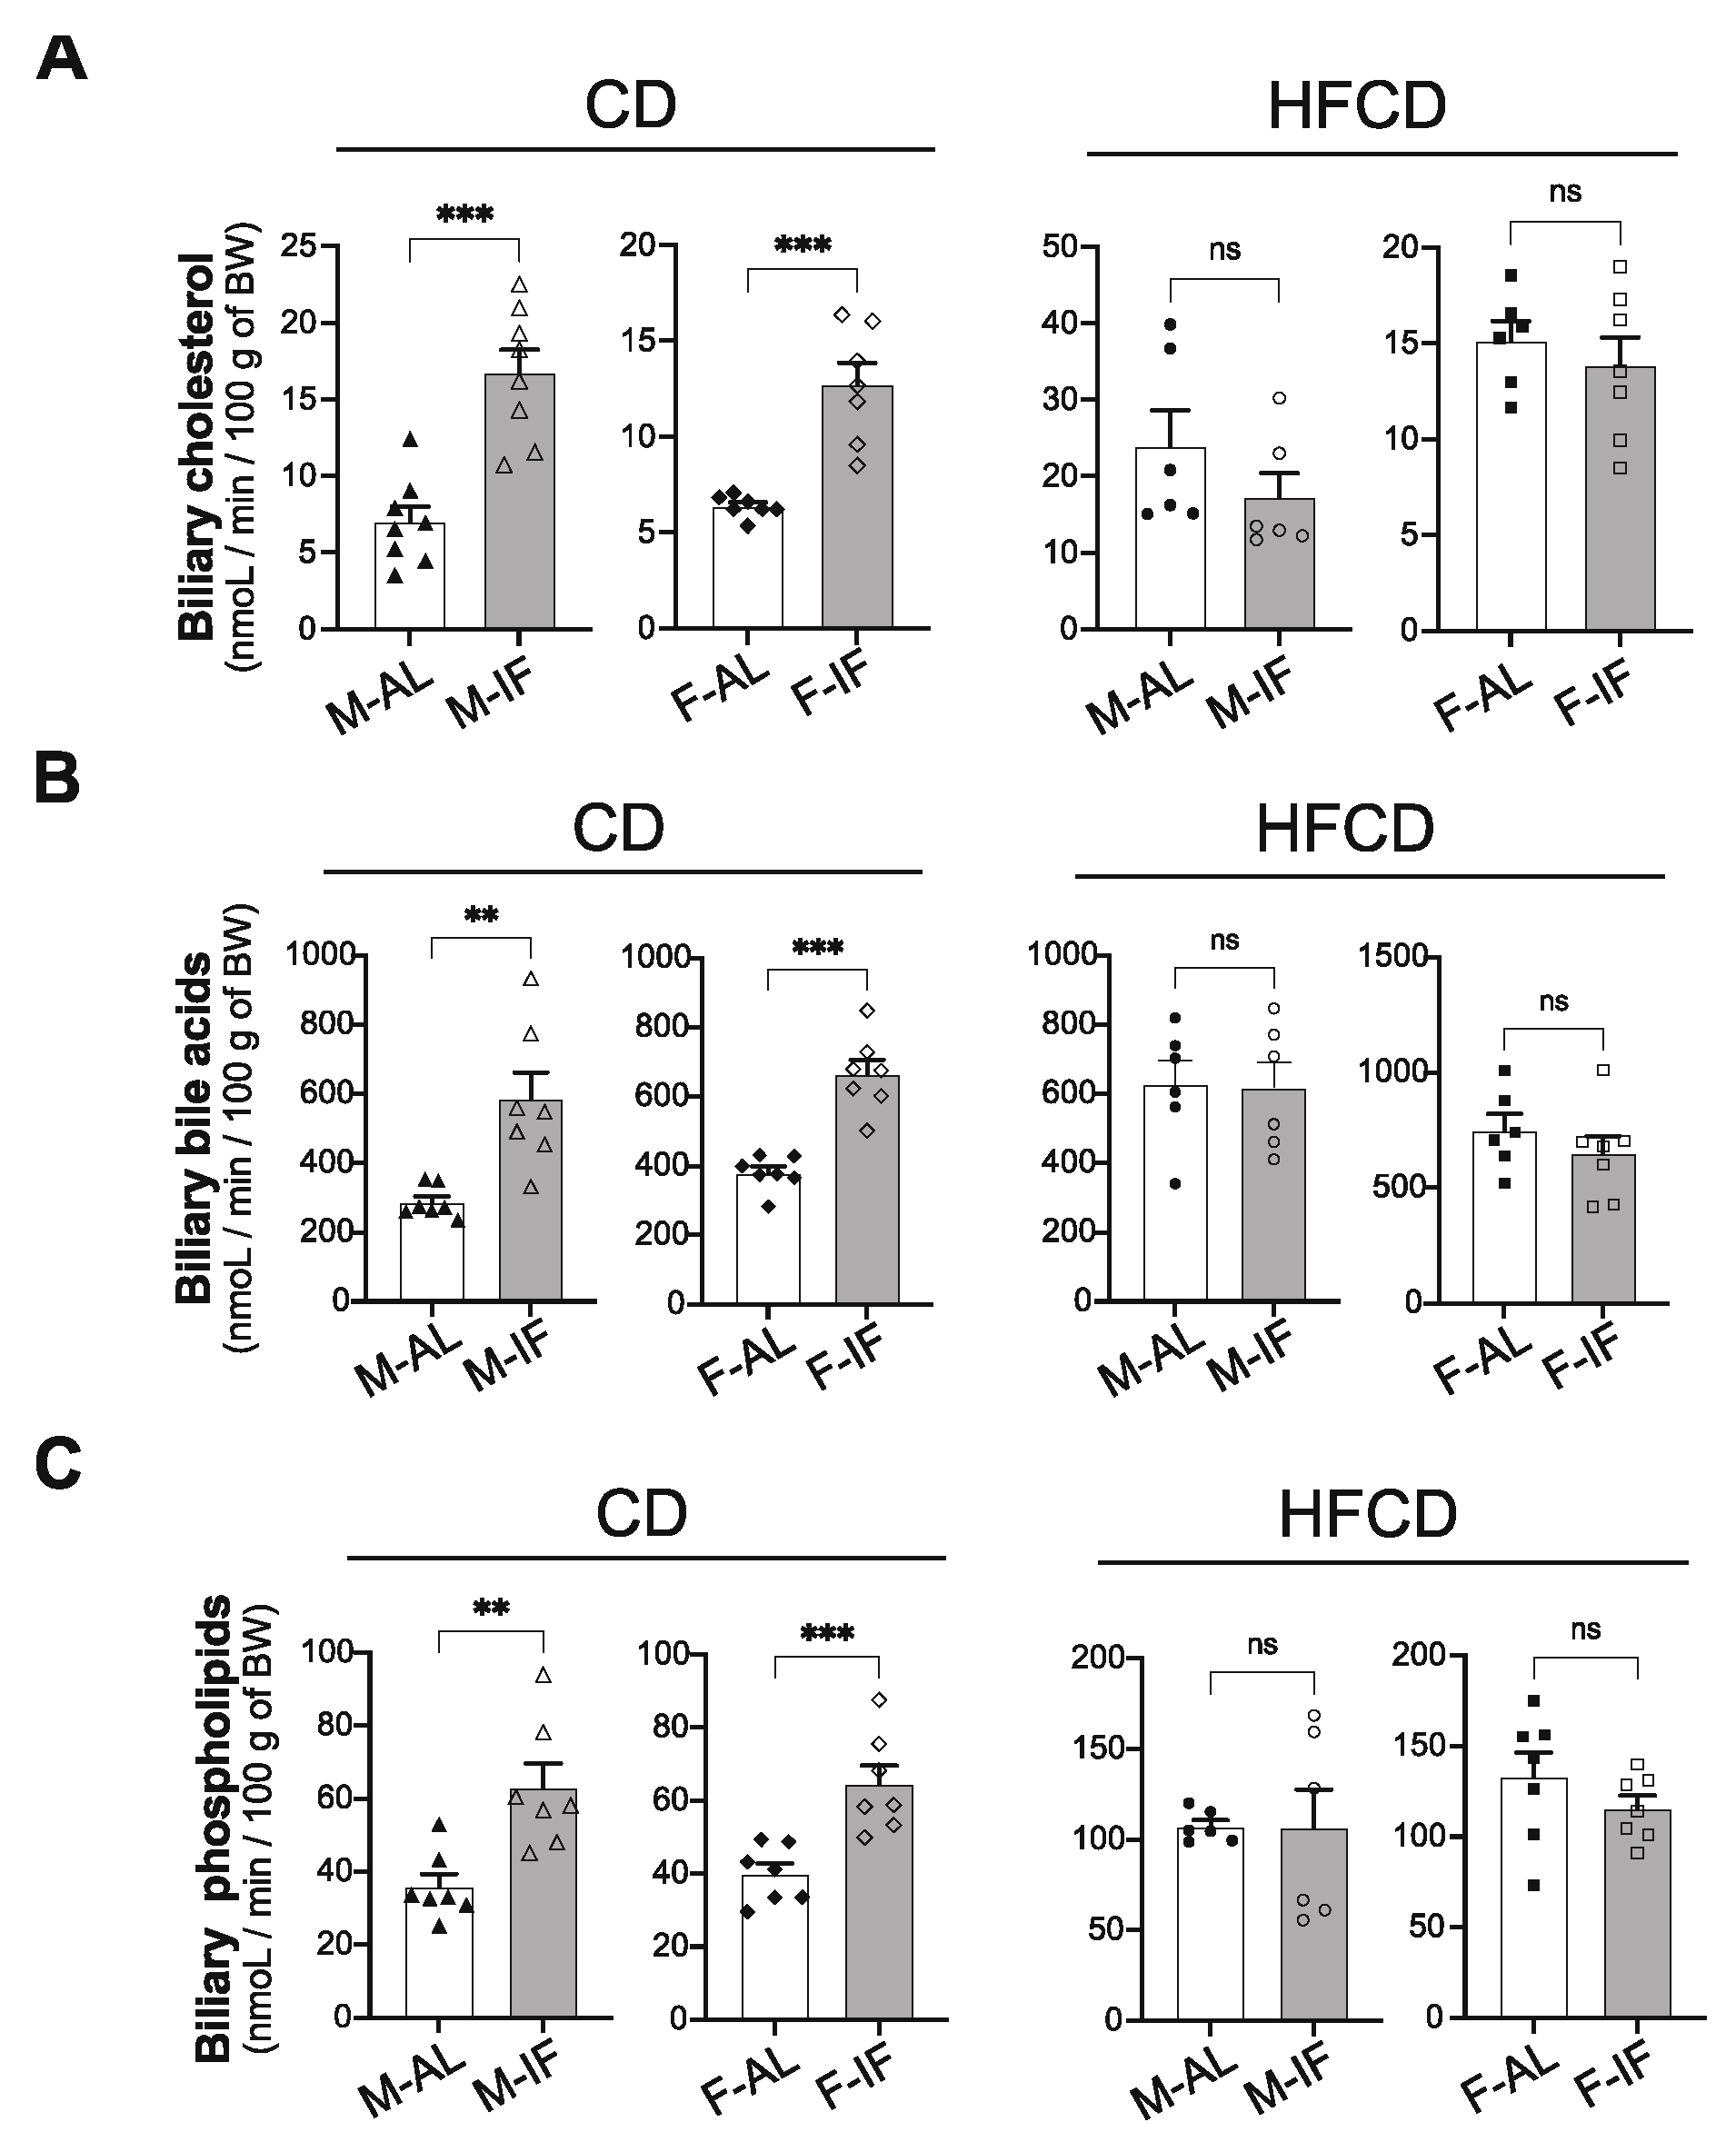
We then examined hepatic lipid catabolism and fluxes. First, the rate of hepatic VLDL-TG secretion was reduced in all IF groups compared with the AL groups (Supplementary Figure S4A-D), indicating that IF efficiently lowered TG secretion by the liver, independently of the diet composition. We then examined hepatic biliary lipid secretion, which is considered to be the last step of the reverse cholesterol transport pathway by which the body removes excess cholesterol [37]. In mice fed CD, IF intervention significantly increased the biliary secretion of cholesterol, bile acids and phospholipids, irrespective of sex (Figure 6A-C, left panels). Of note, the effect of IF on the biliary lipid secretion was lost when mice were fed HFCD (Figure 6A-C, right panels).
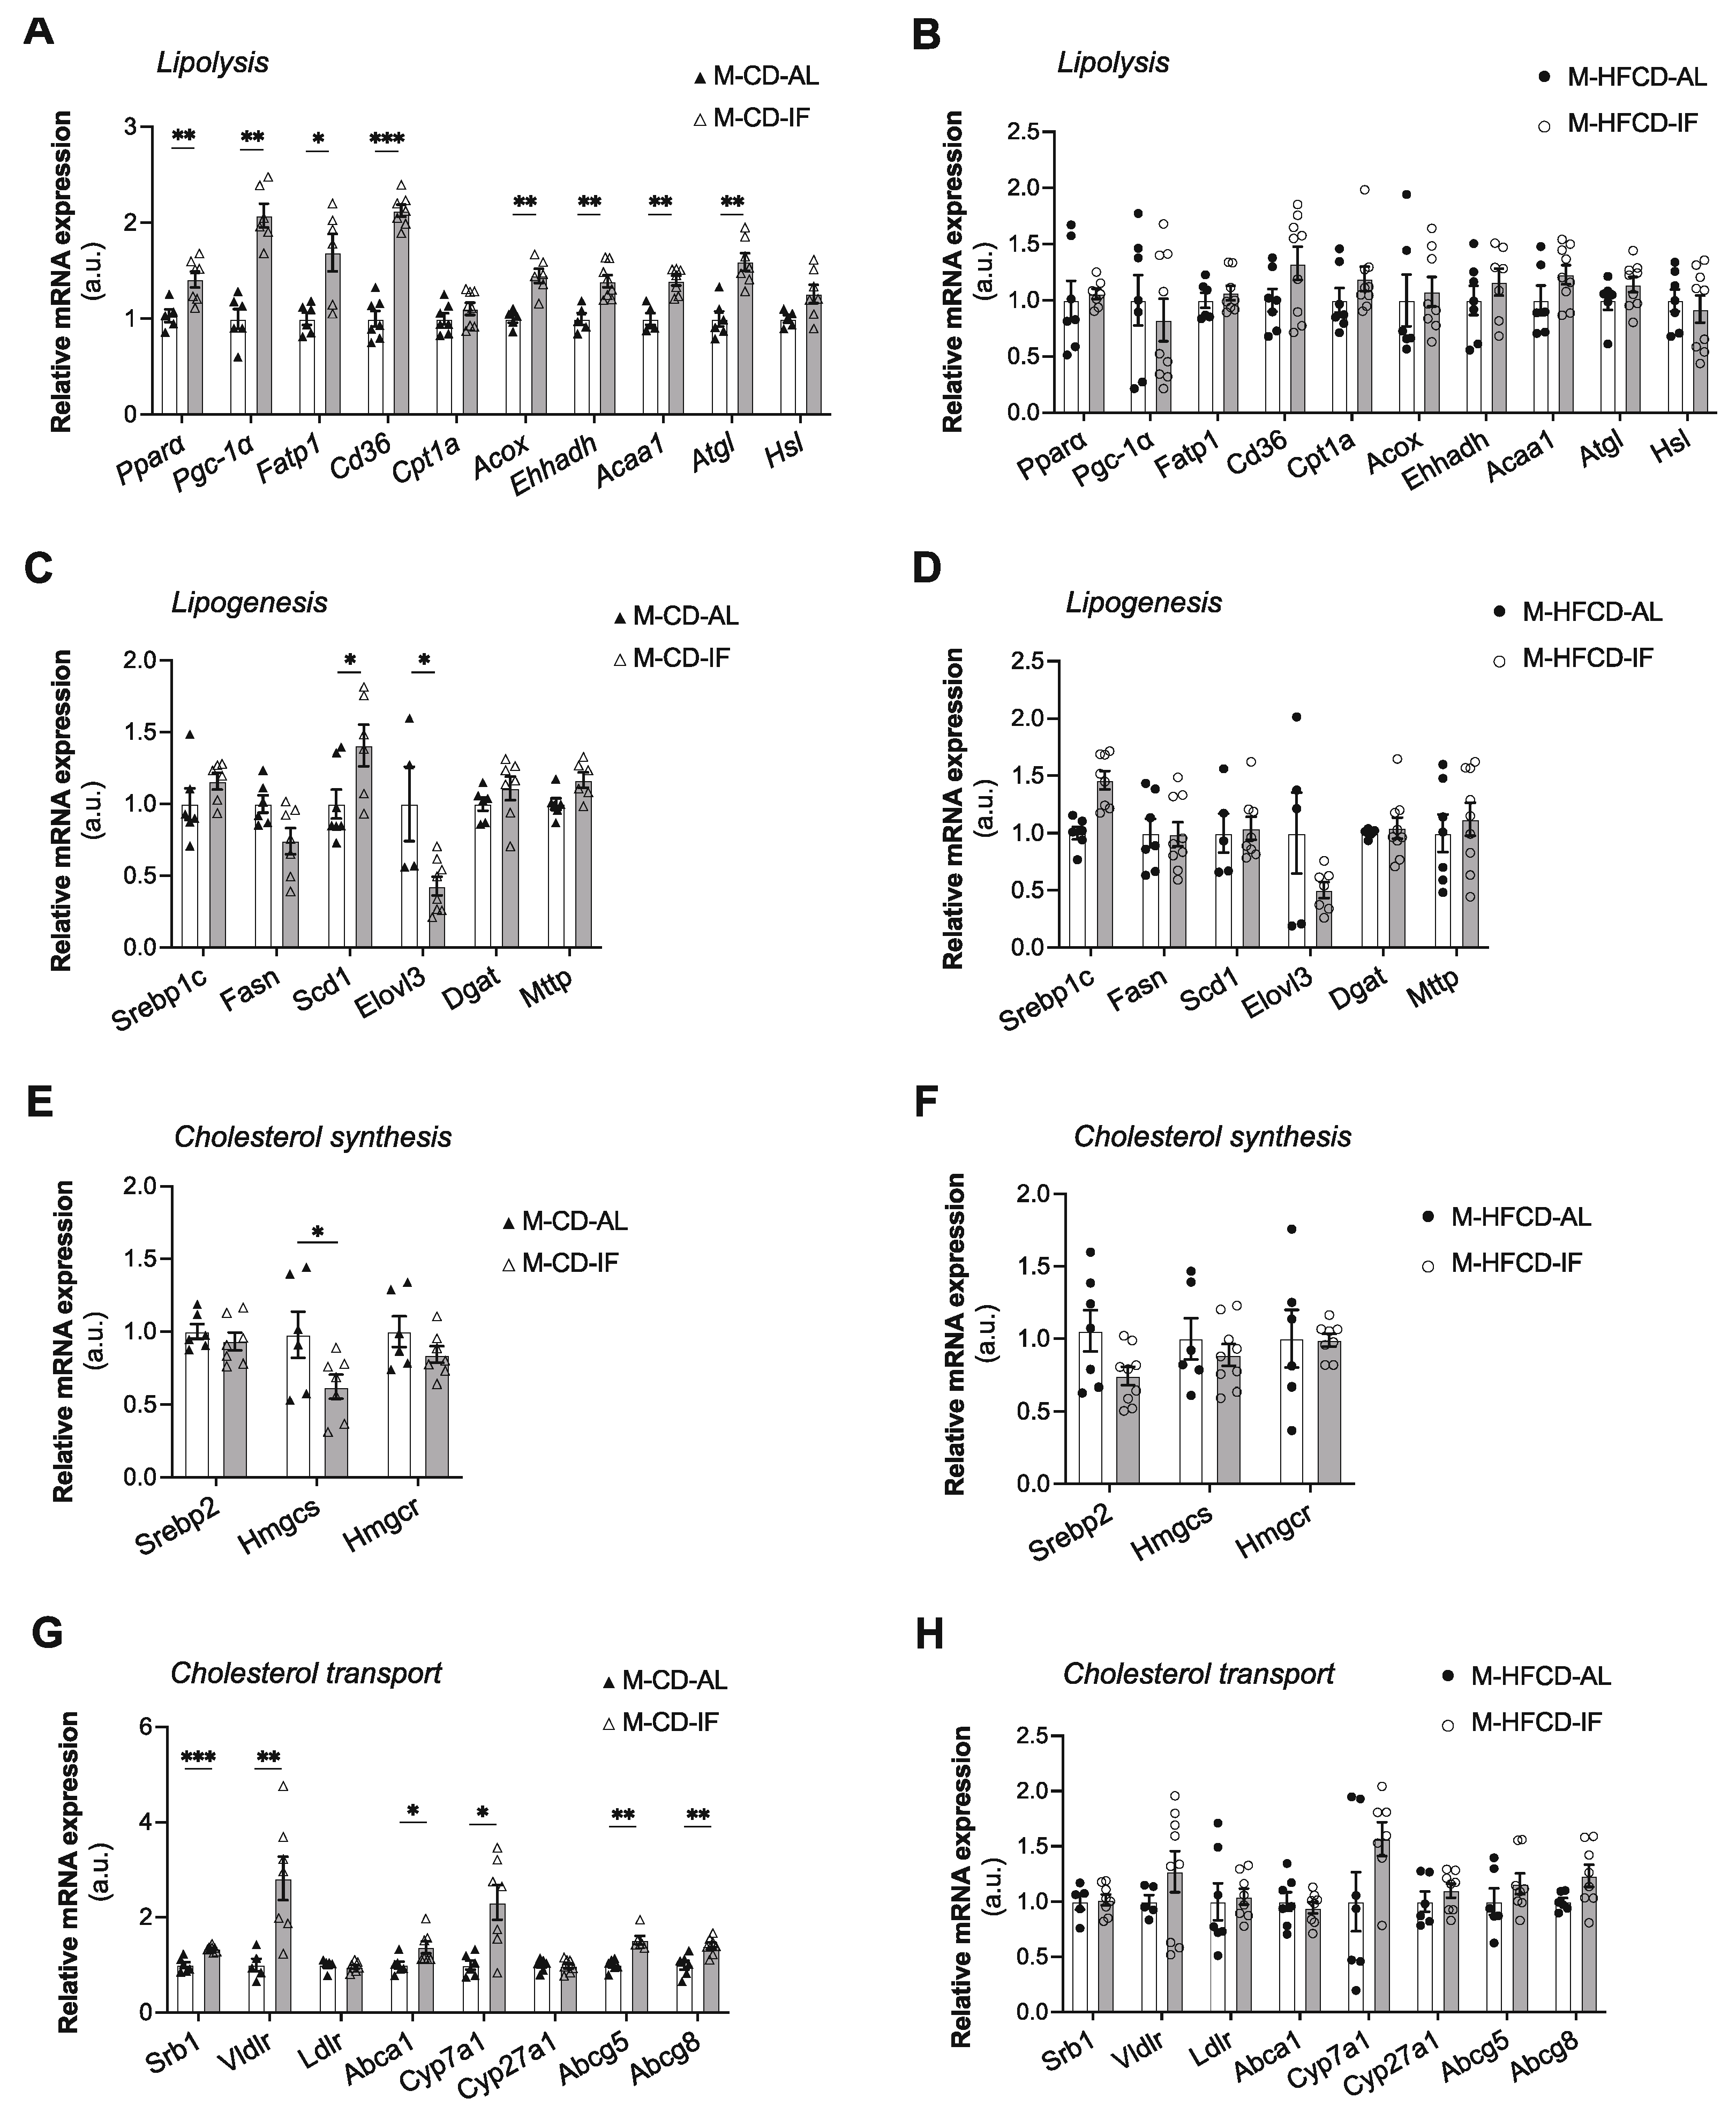
We then evaluated the expression of genes involved in lipolysis, fatty acid and cholesterol synthesis, and cholesterol transport in the liver of Apoe-/- male mice fed CD and HFCD. In CD-fed mice, IF increased the hepatic expression of genes involved in lipid catabolism, including the transcriptional factor peroxisome-proliferator-activated-receptor-α (Ppar-α) and its co-activator Pgc1-α, as well as genes involved the uptake and oxidation of fatty acids such as fatty acid transport protein 1 (Fatp1), Cd36, acyl-CoA oxidase 1 (Acox1), L-bifunctional protein (Ehhadh), and acetyl-CoA acyltransferase 1 (Acaa1). Interestingly, gene expression of adipose triglyceride lipase (Atgl) and hormone-sensitive lipase (Hsl), which are key enzymes involved in intracellular degradation of triacylglycerols, were also increased in the IF groups compared with the AL groups when mice were fed CD (Figure 7A). However, when mice were fed HFCD, IF had no effect on the expression of any of the above-mentioned genes (Figure 7B). We then explored the expression of lipogenic genes. Intriguingly, we found that under CD, the mRNA expression level of stearoyl-coenzyme A desaturase 1 (Scd1), the rate-limiting enzyme involved in the synthesis of monounsaturated fatty acids, was increased in the IF groups compared to the AL groups (Figure 7C). This increase could also explain the decrease in the liver TG content as SCD1 has been reported to promote the catabolism of TG by its product, oleic acid, which upregulates ATGL and HSL [38]. We also found that the mRNA expression level of fatty acid elongase, Elovl3, which is involved in the synthesis of saturated and monounsaturated very long-chain fatty acids, was reduced (Figure 7C). IF had no effect on the mRNA expression level of the other lipogenic genes examined, including the transcription factor controlling fatty acid biosynthesis, sterol regulatory element-binding protein-1c (Srebp-1c), fatty acid synthase (Fasn), acyl CoA:diacylglycerol acyltransferase 2 (Dgat2), and microsomal triglyceride transfer protein (Mttp) (Figure 7C). Intriguingly, under HFCD, IF significantly increased the mRNA level of Srebp-1c only, without affecting the expression of its target genes Fasn and Scd1, or the expression of Elovl3, Dgat, and Mttp (Figure 7D).
The expression of cholesterol metabolism-related genes was also examined. We found that when mice were under CD, IF did not affect the mRNA level of sterol regulatory element-binding protein-2 (Srebp-2), a transcription factor that activates genes involved in cholesterol biosynthesis, nor did it affect the mRNA level of its target gene HMG-CoA reductase (Hmgcr), while it significantly decreased HMG-CoA synthase 1 (Hmgs1) gene expression (Figure 7E). Interestingly, IF also upregulated gene expression of the scavenger receptor class B type 1(Srb-1) and very low-density lipoprotein receptor (Vldlr), involved in hepatic cholesterol uptake, the ATP-binding cassette transporter A1 (Abca1), involved in HDL cholesterol efflux and reverse cholesterol transport (RCT), and the cholesterol 7 alpha-hydroxylase A1 (Cyp7a1), and ATP-binding cassette G5 (Abcg5) and G8 (Abcg8) involved in cholesterol excretion (Figure 7G). When mice were fed HFCD, IF failed to modulate the expression level of genes involved in cholesterol biosynthesis and transport (Figure 7F,H).
Altogether, these results indicate that IF intervention in Apoe-/- mice fed CD triggers liver transcriptional reprogramming of lipid metabolism genes, which is associated with lower hepatic storage and secretion of TG and higher biliary cholesterol secretion, regardless of the sex (except for TG storage). Most of these beneficial effects of IF intervention on lipid metabolism in the liver were lost when mice were fed HFCD, while hepatic steatosis was worsened.

3.5. Atherosclerosis

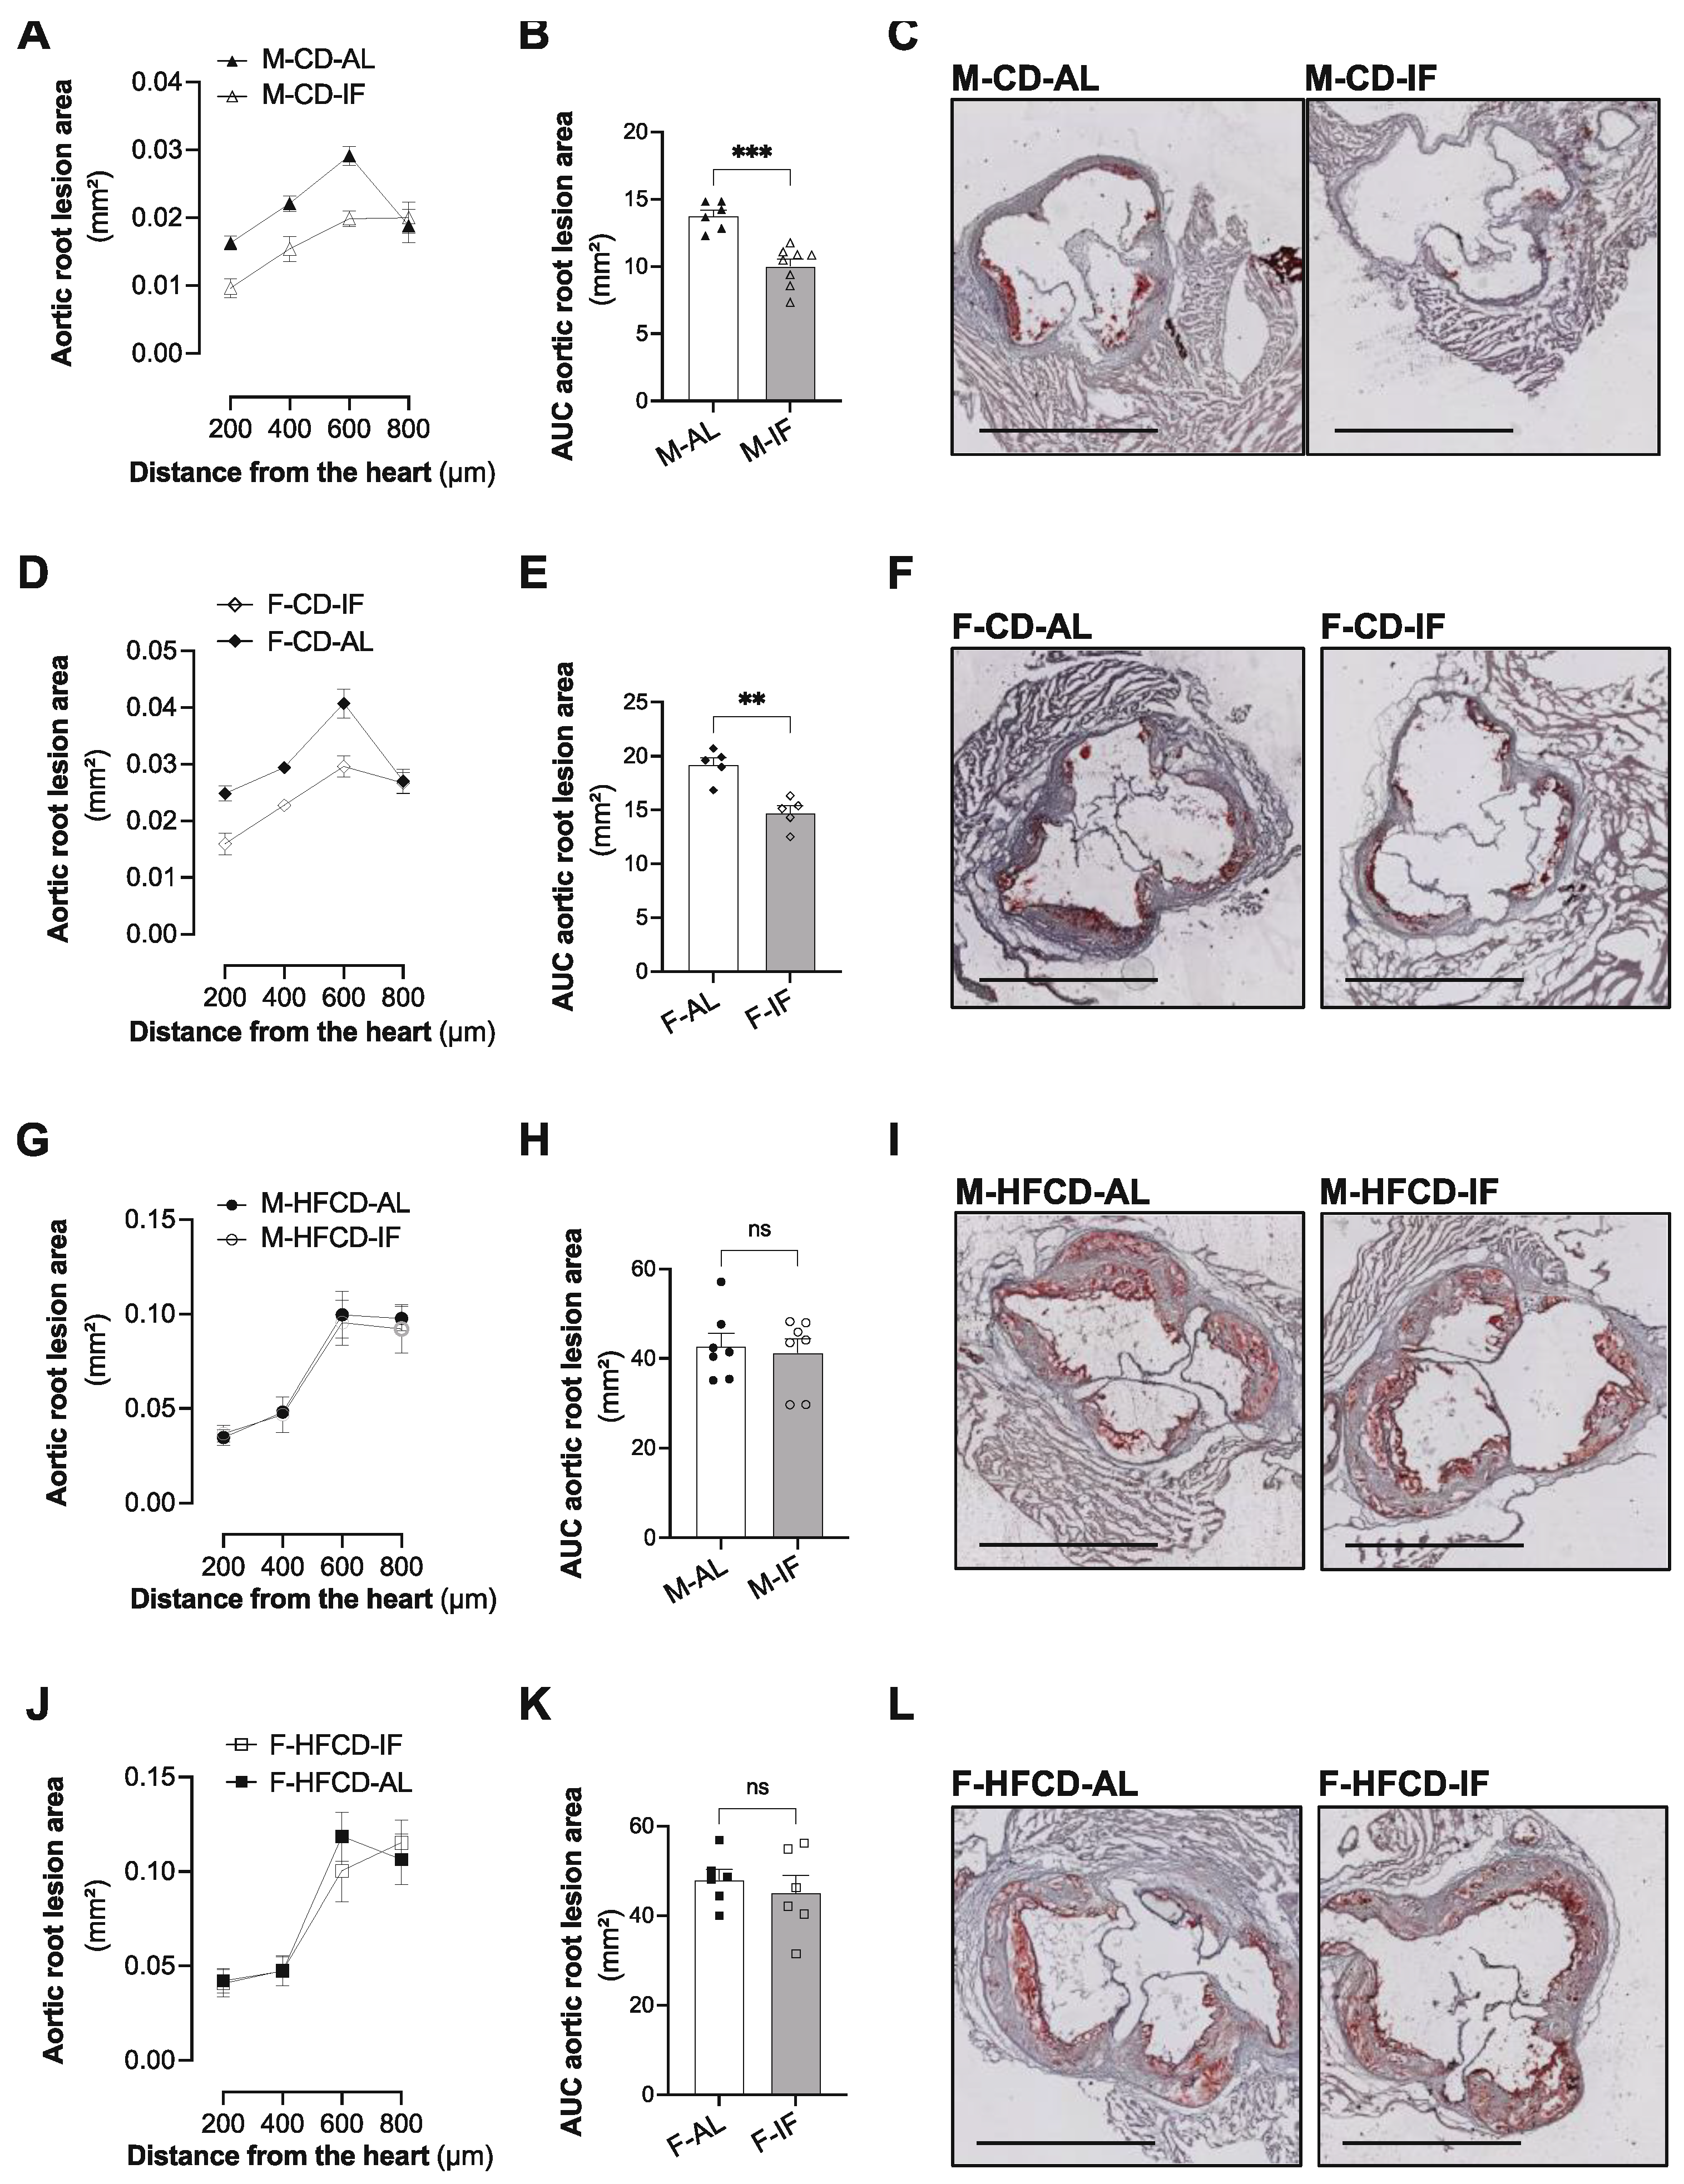
To examine the effect of the IF regimen on atherosclerosis development in Apoe-/- mice, we determined the aortic sinus plaque sizes. Considering the distance from the heart to the aortic arch, the aortic root lesions were increased in both the AL and IF groups irrespective of sex and diet (Figure 8A,D,G,J). Interestingly, when mice were under CD, IF significantly decreased fatty streak lesions in the aortic root in both males and females as demonstrated by calculation of the AUC (Figure 8B,E) and evaluated by Oil Red O staining (Figure 8C,F). However, under HFCD, the lesion area was not modified by the IF regimen (Figures 8G-L). These data suggest that IF alleviates atherosclerosis progress in Apoe-/- mice in a sex-independent manner when fed chow diet and that an atherogenic diet offsets this effect.

4. Discussion

Clinical parameters of cardiovascular diseases such as levels of circulating cholesterol and triglycerides have been reported to be reduced in animals and humans on every-other-day fasting, called intermittent fasting (IF). However, the majority of the results from these studies were conducted in healthy and overweight humans or in healthy or obese and diabetic mice that do not present cardiovascular abnormalities [39,40,41].
Only three studies to date have assessed the effect of IF in atherosclerosis-prone genetic mouse models [22,23,24]. However, discrepancies in the results regarding the weight gain reduction, the improvement of glucose metabolism, and the development of atherosclerosis, were observed between these studies. Furthermore, only male mice were subjected to these interventions, and each study assessed IF in mice subjected to a single diet (chow diet, high-fat diet, or Western diet).
Our study evaluated the relevance of IF in the improvement of glucolipid metabolism and atherosclerosis development in male and female Apoe-/- mice fed either a chow diet (CD) or a high-fat and high-cholesterol atherogenic diet (HFCD). Our main findings are that the IF regimen prevented weight gain only in male Apoe-/- mice fed a chow diet, ameliorated glucose tolerance in a sex- and a diet-independent manner, and reduced hypertriglyceridemia and atherogenesis only when Apoe-/- mice were fed a chow diet.
Despite the overall reduction in cumulative calorie intake in all groups submitted to IF compared to ad libitum ones, IF significantly reduced body weight gain and metabolic efficiency only in males fed CD, and it failed to reproduce the same effect in females fed CD or in mice fed HFCD. These findings suggest that the decrease in calorie intake alone cannot explain the observed decrease in body weight gain in males under CD. The sexual dimorphism regarding body weight benefits of IF in CD-fed Apoe-/- mice was also described for wild-type C57BL/6J mice submitted to 10 h time-restricted feeding [42]. Moreover, IF by every-other-day fasting, the regimen we used in our study, has been reported to affect the level of sex hormones and gonadal function in rats, with increasing testosterone levels in males but not in females, and a significant change in gene expression in the gonads of males compared to females [43]. This could explain the beneficial effect of IF only in male mice fed CD. On the other hand, studies have shown that long-term feeding of a high-fat diet leads to similar cardiometabolic dysfunction in both male and female C57BL/6J mice [44], which is consistent with our results that HFCD outweighs the beneficial IF effect as both male and female Apoe-/- mice fed HFCD were resistant to a reduction in body weight gain by IF.
Metabolic efficiency is a hallmark of metabolic control of weight gain. While the bulk of energy intake is converted to heat by brown adipose tissue (BAT), metabolic efficiency constitutes a small part of the ingested energy that is stored as extra body energy deposits in white adipose tissue [33]. Interestingly, the effect of IF on weight loss was reported to be consequent to its effect on WAT browning and BAT activation [34].
We found that IF did not affect subcutaneous white adipose tissue (SC-WAT) weight irrespective of sex or diet. However, IF resulted in browning of WAT in mice fed chow diet independently of sex. This was accompanied by an increase in gene expression of browning markers and lipid metabolism enzymes. Deficiency in Apoe results in a smaller adipocyte size due to impairment of lipogenesis and a defect in lipid acquisition from the circulation. This renders Apoe-/- mice resistant to adiposity when fed an obesogenic diet [35,45]. Accordingly, we found that HFCD feeding did not have a significant effect on body weight gain compared to CD feeding. Furthermore, HFCD by itself induced transformation of WAT towards a BAT-like phenotype, as previously reported [35,36]. This masked the effect of IF on WAT morphology when mice were fed HFCD. Interestingly, among the browning markers and lipid metabolism genes explored, only Ucp1 gene expression was dramatically upregulated by IF in WAT when mice were fed HFCD. Intriguingly, brown adipocytes from mice fed CD acquired a white-like unilocular adipocyte phenotype, when submitted to IF in a sex-independent manner, accompanied by a significant decrease in Ucp1 gene expression. However, BAT from mice fed HFCD presented an increase in genes induced by BAT activation. These results suggested that when mice were fed CD, IF induced a reduction in BAT activity that was offset by an increase in WAT browning. This is in line with the previously reported fasting suppression of Ucp1 expression-induced thermogenesis in BAT [46,47,48], and the compensatory effect of white fat browning for defective BAT activity to maintain energy homeostasis metabolism [49]. However, when mice were fed HFCD, IF resulted in browning of WAT and activation of BAT. Interestingly, activated BAT and increased browning of WAT in Apoe-/- mice exacerbate atherosclerosis [50,51], and genetic deletion of Ucp1 in Apoe-/- mice has been reported to prevent atherosclerotic plaque growth [50,51]. Furthermore, in humans, improvements in coronary heart disease risk factors by every-other-day fasting involved modulation of adipose tissue parameters [20].
IF effects on body fat remodelling were associated with an increase in glucose tolerance and improvement of insulin sensitivity [52,53,54]. We found an increase in glucose tolerance by IF in Apoe-/- mice irrespective of sex and diet. Unexpectedly, the improvement in glucose clearance was not a consequence of an enhancement in insulin sensitivity. Recent studies have demonstrated that glucose homeostasis could be maintained by non-insulin determinant pathways through a rearrangement of the gastrointestinal tract, glucose utilization in insulin-independent tissues/organs such as the brain and kidneys, or renal excretion of glucose, which is an insulin-independent process [55,56]. On the other hand, while glucose transporter GLUT4 is insulin-dependent and is responsible for the majority of glucose transport into muscle and adipose cells under anabolic conditions, GLUT1 is insulin-independent and is widely distributed in different tissues [57]. Although we did not explore these mechanisms, they could explain the IF-improved glucose tolerance in our model.
We also found that IF decreased liver TG accumulation only in males fed chow diet. This was consistent with an increase in the expression of lipid catabolism genes in the liver. This effect was not observed in females fed CD. As the decrease in VLDL secretion was observed in both sexes, it could not explain the sexual dimorphism regarding liver TG content. This suggests that the decrease in TG content and VLDL secretion in males could be a result of increased liver lipid catabolism, while the absence of an IF effect in females could be a result of an equilibrium between lipid oxidation, synthesis, and secretion.
There is a degree of discrepancy regarding the role of Apoe in hepatic lipid accumulation upon high-fat feeding. Karvia et al. showed that Apoe deficiency has a protective effect on diet-induced nonalcoholic fatty liver disease in mice through a mechanism involving a delay in post-prandial triglyceride (TG) clearance from their plasma [58]. However, Lu et al. demonstrated that Apoe deficiency promotes nonalcoholic fatty liver disease in mice by a mechanism involving a decrease in autophagy [59]. We found that IF exacerbated the mild HFCD-induced hepatic steatosis in a sex-independent manner in Apoe-/- mice. We found that this increase in liver TG content by IF was not associated with the regulation of lipolytic genes. However, the increased expression of Srebp-1c, which codes for a key transcription factor that regulates lipogenesis, could partially explain the exacerbation of hepatic steatosis, although there was no modification of the expression level of SREBP-1c target genes by IF. Interestingly, VLDL secretion is also inhibited by IF in Apoe-/- mice fed HFCD. These findings suggest that the high-fat diet outweighs the benefits of IF and worsens liver steatosis by disrupting the equilibrium between degradation, synthesis, and secretion of TG.
Although the levels of cholesterol content in the liver in all IF groups and the AL groups were comparable, we found that IF resulted in a decrease in gene expression of HMG-CoA synthase (Hmgs), which is an enzyme involved in cholesterol synthesis in males fed CD. Furthermore, in the same mice, IF significantly increased the expression of genes involved in cholesterol uptake by the liver, cholesterol efflux, and cholesterol bile secretion. These changes were not observed when mice were fed HFCD. These data suggest that when mice were fed CD, IF promoted an increase in cholesterol transport and excretion, while it induced a decrease in cholesterol synthesis.
Interestingly, while we did not observe any effect of IF on plasma cholesterol levels (total, HDL, and non-HDL cholesterol) in CD-fed mice, we found that cholesterol excretion into the bile, either as unesterified (free) cholesterol or after conversion to bile acids, was increased in these mice compared to their AL control. This is in line with the increase in the expression of genes involved in the biliary excretion of cholesterol, including Abcg5/Abcg8 responsible for reducing circulating cholesterol. These data suggest that IF increases the clearance of cholesterol by reverse cholesterol transport (RCT), which is considered to be a main way for the body to excrete cholesterol [60]. We also found that the level of plasma TG was decreased by IF in CD-fed mice in a sex-independent manner. This could be explained by the observed decrease in hepatic VLDL-TG secretion. Although we did not measure lipoprotein lipase activity (LPL), the decrease in plasma TG concentration could also be attributed to an increase in LPL activity. Indeed, LPL, which is a key enzyme in lipid metabolism, hydrolyses triglycerides in circulating TG-rich lipoproteins and promotes the cellular uptake of chylomicron remnants, cholesterol-rich lipoproteins, and free fatty acids by adipose tissue and skeletal muscle [61]. Contrary to the beneficial effect of IF in mice fed CD, IF exacerbated both the plasma TG and cholesterol levels, which were increased by HFCD, and had no effect on biliary lipid secretion. We did not explore the molecular mechanisms of this effect but we can hypothesize that IF in HFCD mice induced a decrease in LPL activity, a delay in post-prandial TG-rich lipoprotein clearance from the plasma, and/or an increase in intestinal lipid absorption.
Finally, and in keeping with the beneficial effects of IF on lipid metabolism in Apoe-/- mice when fed CD, IF also reduced the development of aortic root sinus lesions in these mice in a sex-independent manner, but it failed to counteract atherosclerosis progression induced by HFCD.
The effect of IF on atherosclerosis development has also been explored in the other frequently used model of mouse atherosclerosis, the low-density lipoprotein receptor-deficient (Ldlr-/-) model. The first study found that every-other-day fasting induced obesity and diabetes and exacerbated the development of spontaneous atherosclerosis in Ldlr-/- male mice fed a chow diet [24]. The difference with our results regarding glucose metabolism could be explained by the difference in genotypes, as LDL receptor but not apolipoprotein E deficiency increases diet-induced obesity and diabetes in mice [62]. Furthermore, aside from the fact that they only studied the effect of IF in Ldlr-/- male mice, the results were obtained by IF of chow diet feeding. Yet, on a chow diet, Ldlr-/- mice do not readily develop atherosclerosis, and thus a high cholesterol diet with or without a high fat is needed to provide the hyperlipidemic drive for atherogenesis in these mice [63]. Indeed, atherosclerosis development in Ldlr-/- mice was very slow when they were fed a chow diet for 3 months [64]. Therefore, under these conditions, Ldlr-/- mice could display significant individual differences in lesion development, which could bias the results of the IF regimen.
A more recent study showed that intermittent fasting cycles of 3 days of ad libitum feeding and 1 day of fasting ameliorated hypercholesterolemia, reduced atherosclerosis lesions, and increased plaque stability in Ldlr-/- male mice fed a high-fat diet [22]. Although we used a different mouse model and fasting cycles for IF intervention, our results with Apoe-/- mice fed CD are comparable to the beneficial effect of IF on atherosclerosis development in Ldlr-/- male mice fed a high-fat diet. Taking into account that Apoe-/- mice exhibited higher plasma cholesterol and larger aortic root lesions with larger necrotic cores, and more smooth muscle cells and matrix at 3 months of atherogenic diet than did the Ldlr-/- mice [63], one can suggest that the beneficial effect of IF depends on the stage of atherosclerosis development and the lesion area. Future studies will be needed to determine the plasma and aortic inflammatory profile as well as the plaque stability in our model.
It was recently reported that time-restricted feeding of a Western diet in Apoe-/- males mice limits adiposity but fails to inhibit atherosclerosis progression and glucose intolerance [23]. Despite obtaining the same results regarding atherosclerosis development under HFCD, the effect of IF on glucose homeostasis and body weight gain is different. This discrepancy could be explained first by the difference in the fasting regimen treatment, as we used a more stringent intermittent fasting (every other day) compared to the 9 hours per day used in the above study. The origin of fat in the diet could also be an explanation. Indeed, in our study, the dietary fat was derived from cocoa butter (diets rich in stearic acid), which could not have any effect on Apoe-/- body weight gain or glucose tolerance, compared to chow diet [65]. However, the fat diet used in the study mentioned above is very obesogenic, as the body weight gain of Apoe-/- mice nearly reached 100% compared to their initial body weight after only 14 weeks of feeding [23]. This overweightness of mice was also accompanied by high fasting plasma glucose. Yet, diabetes hindered plaque regression in atherosclerotic mice, even after reduction of hyperlipidemia [66,67]. These results suggest that diabetes induced by an obesogenic diet is not suitable for assessment of the effect of IF on atherosclerosis development.

5. Conclusions

Our work assessed for the first time the same regimen of intermittent fasting (every other day) in both males and females on the development of both spontaneous atherosclerosis and atherogenic diet-induced progression of atherosclerosis in Apoe-/- mice. Our results show that intermittent fasting of Apoe-/- mice reduced body weight gain only in males fed chow diet, improved glycaemia in a sex and diet-independent manner, but reduced dyslipidemia and prevented atherosclerosis development irrespective of sex only when the mice were fed a chow diet.
Overall, the current work indicates that intermittent fasting could have potential clinical applications as an efficient therapy to improve glucose homeostasis and to treat atherosclerosis, but a degree of caution is warranted with regard to the dietary regimen and the overall eating patterns of the patients and/or stages of development of atherosclerosis.

Supplementary Materials

The following supporting information can be downloaded at the website of this paper posted on Preprints.org. Supplementary experimental procedure for hepatic secretion of VLDL-TG; Figure S1: Effect of intermittent fasting in Apoe-/- mice on metabolic efficiency; Figure S2: Effect of intermittent fasting in Apoe-/- mice on the plasma insulin level during glucose tolerance test; Figure S3: Effect of intermittent fasting in Apoe-/- mice on white and brown adipose tissue weight. Figure S4: Effect of intermittent fasting in Apoe-/- mice on hepatic very low-density-lipoprotein (VLDL)-TG secretion; Table S1: List of qPCR primer pair sequences and GeneBank accession numbers specific to each gene.

Author Contributions

Conceptualization, S.N.; methodology, J.M., L.G., C.T., T.D., D.B., V.B. and G.C.; formal analysis, J.M.; L.G., C.T. and L.O.M. and S.N.; data curation, S.N.; writing—original draft preparation, N.S., L.O.M. and S.N; writing—review and editing, J.M; L.G., C.T., T.D., L.O.M and S.N.; supervision, N.S. and S.N.; project administration, N.S., L.O.M. and S.N.; funding acquisition, N.S., L.O.M and S.N. All authors have read and agreed to the published version of the manuscript.

Funding

This research was funded by the region Occitanie Pyrénées-Méditerranée (GRAINE HEPATOCARE, Reference number: no. 19014226). J.M. received a Ph.D. fellowship from Inserm and the Region Occitanie Pyrénées-Méditerranée (allocation doctorale, Reference number: no. R18093BB/RPH18007BBA).

Institutional Review Board Statement

The animal study protocol was approved by the Institutional Ethics Committee CEEA122 of UMS006/CREFRE (Approved protocol number 2019/022111492658).

Informed Consent Statement

Not applicable.

Data Availability Statement

Datasets generated in the present study are available from the corresponding author on reasonable request.

Acknowledgments

We thank the UMS006/CREFRE, Anexplo Platform, Toulouse (mouse breeding & experimental zone; ENI core platform), the I2MC core technology platforms, and in particular the staff of the PHI platform for histology and imaging (I2MC, UMR1297, Toulouse, France).

Conflicts of Interest

The authors declare no conflict of interest.

References

  1. Hamman, R.F.; Wing, R.R.; Edelstein, S.L.; Lachin, J.M.; Bray, G.A.; Delahanty, L.; Hoskin, M.; Kriska, A.M.; Mayer-Davis, E.J.; Pi-Sunyer, X.; et al. Effect of weight loss with lifestyle intervention on risk of diabetes. Diabetes Care 2006, 29, 2102–2107. [Google Scholar] [CrossRef]
  2. Poirier, P.; Giles, T.D.; Bray, G.A.; Hong, Y.; Stern, J.S.; Pi-Sunyer, F.X.; Eckel, R.H. Obesity and cardiovascular disease: Pathophysiology, evaluation, and effect of weight loss: An update of the 1997 American Heart Association Scientific Statement on obesity and heart disease from the Obesity Committee of the Council on Nutrition, Physical. Circulation 2006, 113, 898–918. [Google Scholar] [CrossRef] [PubMed]
  3. Lavie, C.J.; Milani, R. V; Ventura, H.O. Obesity and Cardiovascular Disease. Risk Factor, Paradox, and Impact of Weight Loss. J. Am. Coll. Cardiol. 2009, 53, 1925–1932. [Google Scholar] [CrossRef] [PubMed]
  4. Ristow, M.; Schmeisser, S. Extending life span by increasing oxidative stress. Free Radic. Biol. Med. 2011, 51, 327–336. [Google Scholar] [CrossRef] [PubMed]
  5. Rynders, C.A.; Thomas, E.A.; Zaman, A.; Pan, Z.; Catenacci, V.A.; Melanson, E.L. Effectiveness of intermittent fasting and time-restricted feeding compared to continuous energy restriction for weight loss. Nutrients 2019, 11, 1–23. [Google Scholar] [CrossRef]
  6. Mager, D.E.; Wan, R.; Brown, M.; Cheng, A.; Wareski, P.; Abernethy, D.R.; Mattson, M.P. Caloric restriction and intermittent fasting alter spectral measures of heart rate and blood pressure variability in rats. FASEB J. 2006, 20, 631–637. [Google Scholar] [CrossRef]
  7. Varady, K.A.; Hudak, C.S.; Hellerstein, M.K. Modified alternate-day fasting and cardioprotection: relation to adipose tissue dynamics and dietary fat intake. Metabolism. 2009, 58, 803–811. [Google Scholar] [CrossRef]
  8. Heilbronn, L.K.; De Jonge, L.; Frisard, M.I.; DeLany, J.P.; Larson-Meyer, D.E.; Rood, J.; Nguyen, T.; Martin, C.K.; Volaufova, J.; Most, M.M.; et al. Effect of 6-month calorie restriction on biomarkers of longevity, metabolic adaptation, and oxidative stress in overweight individuals: A randomized controlled trial. JAMA 2006, 295, 1539–1548. [Google Scholar] [CrossRef]
  9. Halberg, N.; Henriksen, M.; Söderhamn, N.; Stallknecht, B.; Ploug, T.; Schjerling, P.; Dela, F. Effect of intermittent fasting and refeeding on insulin action in healthy men. J. Appl. Physiol. 2005, 99, 2128–2136. [Google Scholar] [CrossRef]
  10. Johnson, J.B.; Summer, W.; Cutler, R.G.; Martin, B.; Hyun, D.H.; Dixit, V.D.; Pearson, M.; Nassar, M.; Tellejohan, R.; Maudsley, S.; et al. Alternate day calorie restriction improves clinical findings and reduces markers of oxidative stress and inflammation in overweight adults with moderate asthma. Free Radic. Biol. Med. 2007, 42, 665–674. [Google Scholar] [CrossRef]
  11. Antoni, R.; Robertson, T.M.; Robertson, M.D.; Johnston, J.D. A pilot feasibility study exploring the effects of a moderate time-restricted feeding intervention on energy intake, adiposity and metabolic physiology in free-living human subjects. J. Nutr. Sci. 2018, 7, 1–6. [Google Scholar] [CrossRef]
  12. Moro, T.; Tinsley, G.; Bianco, A.; Marcolin, G.; Pacelli, Q.F.; Battaglia, G.; Palma, A.; Gentil, P.; Neri, M.; Paoli, A. Effects of eight weeks of time-restricted feeding (16/8) on basal metabolism, maximal strength, body composition, inflammation, and cardiovascular risk factors in resistance-trained males. J. Transl. Med. 2016, 14, 1–10. [Google Scholar] [CrossRef] [PubMed]
  13. Hutchison, A.T.; Regmi, P.; Manoogian, E.N.C.; Fleischer, J.G.; Wittert, G.A.; Panda, S.; Heilbronn, L.K. Time-Restricted Feeding Improves Glucose Tolerance in Men at Risk for Type 2 Diabetes: A Randomized Crossover Trial. Obesity 2019, 27, 724–732. [Google Scholar] [CrossRef] [PubMed]
  14. Gill, S.; Panda, S. A Smartphone App Reveals Erratic Diurnal Eating Patterns in Humans that Can Be Modulated for Health Benefits. Cell Metab. 2015, 22, 789–798. [Google Scholar] [CrossRef] [PubMed]
  15. Wilkinson, M.J.; Manoogian, E.N.C.; Zadourian, A.; Lo, H.; Fakhouri, S.; Shoghi, A.; Wang, X.; Fleischer, J.G.; Navlakha, S.; Panda, S.; et al. Ten-Hour Time-Restricted Eating Reduces Weight, Blood Pressure, and Atherogenic Lipids in Patients with Metabolic Syndrome. Cell Metab. 2020, 31, 92–104.e5. [Google Scholar] [CrossRef] [PubMed]
  16. Moon, S.; Kang, J.; Kim, S.H.; Chung, H.S.; Kim, Y.J.; Yu, J.M.; Cho, S.T.; Oh, C.M.; Kim, T. Beneficial effects of time-restricted eating on metabolic diseases: A systemic review and meta- analysis. Nutrients 2020, 12. [Google Scholar] [CrossRef] [PubMed]
  17. Longo, V.D.; Di Tano, M.; Mattson, M.P.; Guidi, N. Intermittent and periodic fasting, longevity and disease. Nat. Aging 2021, 1, 47–59. [Google Scholar] [CrossRef] [PubMed]
  18. Chaix, A.; Zarrinpar, A.; Miu, P.; Panda, S. Time-restricted feeding is a preventative and therapeutic intervention against diverse nutritional challenges. Cell Metab. 2014, 20, 991–1005. [Google Scholar] [CrossRef] [PubMed]
  19. Chung, H.; Chou, W.; Sears, D.D.; Patterson, R.E.; Webster, N.J.G.; Ellies, L.G. Time-restricted feeding improves insulin resistance and hepatic steatosis in a mouse model of postmenopausal obesity. Metabolism. 2016, 65, 1743–1754. [Google Scholar] [CrossRef] [PubMed]
  20. Bhutani, S.; Klempel, M.C.; Berger, R.A.; Varady, K.A. Improvements in coronary heart disease risk indicators by alternate-day fasting involve adipose tissue modulations. Obesity 2010, 18, 2152–2159. [Google Scholar] [CrossRef]
  21. Longo, V.D.; Mattson, M.P. Fasting: Molecular mechanisms and clinical applications. Cell Metab. 2014, 19, 181–192. [Google Scholar] [CrossRef] [PubMed]
  22. Chen, Y.; Su, J.; Yan, Y.; Zhao, Q.; Ma, J.; Zhu, M.; He, X.; Zhang, B.; Xu, H.; Yang, X.; et al. Intermittent Fasting Inhibits High-Fat Diet–Induced Atherosclerosis by Ameliorating Hypercholesterolemia and Reducing Monocyte Chemoattraction. Front. Pharmacol. 2021, 12, 1–14. [Google Scholar] [CrossRef]
  23. Inoue, K.I.; Toyoda, S.; Jojima, T.; Abe, S.; Sakuma, M.; Inoue, T. Time-restricted feeding prevents high-fat and high-cholesterol diet-induced obesity but fails to ameliorate atherosclerosis in apolipoprotein e-knockout mice. Exp. Anim. 2021, 70, 194–202. [Google Scholar] [CrossRef] [PubMed]
  24. Dorighello, G.G.; Rovani, J.C.; Luhman, C.J.F.; Paim, B.A.; Raposo, H.F.; Vercesi, A.E.; Oliveira, H.C.F. Food restriction by intermittent fasting induces diabetes and obesity and aggravates spontaneous atherosclerosis development in hypercholesterolaemic mice. Br. J. Nutr. 2014, 111, 979–986. [Google Scholar] [CrossRef] [PubMed]
  25. Nakashima, Y.; Plump, A.S.; Raines, E.W.; Breslow, J.L.; Ross, R. ApoE-deficient mice develop lesions of all phases of atherosclerosis throughout the arterial tree. Arterioscler. Thromb. 1994, 14, 133–40. [Google Scholar] [CrossRef] [PubMed]
  26. Van Eenige, R.; Verhave, P.S.; Koemans, P.J.; Tiebosch, I.A.C.W.; Rensen, P.C.N.; Kooijman, S. RandoMice, a novel, user-friendly randomization tool in animal research. PLoS One 2020, 15, e0237096. [Google Scholar] [CrossRef] [PubMed]
  27. Patterson, R.E.; Sears, D.D. Metabolic Effects of Intermittent Fasting. Annu. Rev. Nutr. 2017, 37, 371–393. [Google Scholar] [CrossRef] [PubMed]
  28. Duparc, T.; Briand, F.; Trenteseaux, C.; Merian, J.; Combes, G.; Najib, S.; Sulpice, T.; Martinez, L.O. Liraglutide improves hepatic steatosis and metabolic dysfunctions in a 3-week dietary mouse model of nonalcoholic steatohepatitis. Am. J. Physiol. Gastrointest. Liver Physiol. 2019, 317, G508–G517. [Google Scholar] [CrossRef] [PubMed]
  29. Folch, J.; Lees, M.; Sloane Stanley, G.H. A simple method for the isolation and purification of total lipides from animal tissues. J. Biol. Chem. 1957, 226, 497–509. [Google Scholar] [CrossRef]
  30. Lichtenstein, L.; Serhan, N.; Annema, W.; Combes, G.; Robaye, B.; Boeynaems, J.-M.M.; Perret, B.; Tietge, U.J.F.; Laffargue, M.; Martinez, L.O. Lack of P2Y13 in mice fed a high cholesterol diet results in decreased hepatic cholesterol content, biliary lipid secretion and reverse cholesterol transport. Nutr. Metab. (Lond). 2013, 10, 67. [Google Scholar] [CrossRef]
  31. Lichtenstein, L.; Serhan, N.; Espinosa-Delgado, S.; Fabre, A.; Annema, W.; Tietge, U.J.F.; Robaye, B.; Boyenaems, J.-M.; Laffargue, M.; Perret, B.; et al. Increased Atherosclerosis in P2Y13 / Apolipoprotein E Double-Knockout Mice: Contribution of P2Y13 to Reverse Cholesterol Transport. Cardiovasc. Res. 2015, 106, 315–23. [Google Scholar] [CrossRef] [PubMed]
  32. Lichtenstein, L.; Serhan, N.; Espinosa-Delgado, S.; Fabre, A.; Annema, W.; Tietge, U.J.F.; Robaye, B.; Boeynaems, J.M.; Laffargue, M.; Perret, B.; et al. Increased atherosclerosis in P2Y13/apolipoprotein e double-knockout mice: Contribution of P2Y13 to reverse cholesterol transport. Cardiovasc. Res. 2015, 106, 314–323. [Google Scholar] [CrossRef]
  33. Feldmann, H.M.; Golozoubova, V.; Cannon, B.; Nedergaard, J. UCP1 Ablation Induces Obesity and Abolishes Diet-Induced Thermogenesis in Mice Exempt from Thermal Stress by Living at Thermoneutrality. Cell Metab. 2009, 9, 203–209. [Google Scholar] [CrossRef] [PubMed]
  34. Li, G.; Xie, C.; Lu, S.; Nichols, R.G.; Tian, Y.; Li, L.; Patel, D.; Ma, Y.; Brocker, C.N.; Yan, T.; et al. Intermittent Fasting Promotes White Adipose Browning and Decreases Obesity by Shaping the Gut Microbiota. Cell Metab. 2017, 26, 672–685.e4. [Google Scholar] [CrossRef] [PubMed]
  35. Gao, J.; Katagiri, H.; Ishigaki, Y.; Yamada, T.; Ogihara, T.; Imai, J.; Uno, K.; Hasegawa, Y.; Kanzaki, M.; Yamamoto, T.T.; et al. Involvement of apolipoprotein E in excess fat accumulation and insulin resistance. Diabetes 2007, 56, 24–33. [Google Scholar] [CrossRef] [PubMed]
  36. Cao, L.; Choi, E.Y.; Liu, X.; Martin, A.; Wang, C.; Xu, X.; During, M.J. White to brown fat phenotypic switch induced by genetic and environmental activation of a hypothalamic-adipocyte axis. Cell Metab. 2011, 14, 324–338. [Google Scholar] [CrossRef]
  37. Martinez, L.O.; Ingueneau, C.; Genoux, A. Is it time to reconcile HDL with cardiovascular diseases and beyond? An update on a paradigm shift. Curr. Opin. Lipidol. 2020, 31, 302–304. [Google Scholar] [CrossRef] [PubMed]
  38. Zou, Y.; Wang, Y.N.; Ma, H.; He, Z.H.; Tang, Y.; Guo, L.; Liu, Y.; Ding, M.; Qian, S.W.; Tang, Q.Q. SCD1 promotes lipid mobilization in subcutaneous white adipose tissue. J. Lipid Res. 2020, 61, 1589–1604. [Google Scholar] [CrossRef] [PubMed]
  39. Varady, K.A.; Allister, C.A.; Roohk, D.J.; Hellerstein, M.K. Improvements in body fat distribution and circulating adiponectin by alternate-day fasting versus calorie restriction. J. Nutr. Biochem. 2010, 21, 188–195. [Google Scholar] [CrossRef]
  40. Belkacemi, L.; Selselet-Attou, G.; Hupkens, E.; Nguidjoe, E.; Louchami, K.; Sener, A.; Malaisse, W.J. Intermittent fasting modulation of the diabetic syndrome in streptozotocin-injected rats. Int. J. Endocrinol. 2012, 2012, 962012. [Google Scholar] [CrossRef]
  41. Chaix, A.; Lin, T.; Le, H.D.; Chang, M.W.; Panda, S. Time-Restricted Feeding Prevents Obesity and Metabolic Syndrome in Mice Lacking a Circadian Clock. Cell Metab. 2019, 29, 303–319.e4. [Google Scholar] [CrossRef] [PubMed]
  42. Chaix, A.; Deota, S.; Bhardwaj, R.; Lin, T.; Panda, S. Sex- and age-dependent outcomes of 9-hour time-restricted feeding of a Western high-fat high-sucrose diet in C57BL/6J mice. Cell Rep. 2021, 36, 109543. [Google Scholar] [CrossRef]
  43. Martin, B.; Pearson, M.; Brenneman, R.; Golden, E.; Wood, W.; Prabhu, V.; Becker, K.G.; Mattson, M.P.; Maudsley, S. Gonadal transcriptome alterations in response to dietary energy intake: Sensing the reproductive environment. PLoS One 2009, 4. [Google Scholar] [CrossRef] [PubMed]
  44. Bruder-Nascimento, T.; Ekeledo, O.J.; Anderson, R.; Le, H.B.; Belin de Chantemèle, E.J. Long term high fat diet treatment: An appropriate approach to study the sex-specificity of the autonomic and cardiovascular responses to obesity in mice. Front. Physiol. 2017, 8, 1–11. [Google Scholar] [CrossRef] [PubMed]
  45. Hofmann, S.M.; Perez-Tilve, D.; Greer, T.M.; Coburn, B.A.; Grant, E.; Basford, J.E.; Tschöp, M.H.; Hui, D.Y. Defective lipid delivery modulates glucose tolerance and metabolic response to diet in apolipoprotein E-deficient mice. Diabetes 2008, 57, 5–12. [Google Scholar] [CrossRef]
  46. Desautels, M.; Dulos, R.A. Effects of repeated cycles of fasting-refeeding on brown adipose tissue composition in mice. Am. J. Physiol. - Endocrinol. Metab. 1988, 255. [Google Scholar] [CrossRef] [PubMed]
  47. Hayashi, M.; Nagasaka, T. Suppression of norepinephrine-induced thermogenesis in brown adipose tissue by fasting. Am. J. Physiol. - Endocrinol. Metab. 1983, 8. [Google Scholar] [CrossRef] [PubMed]
  48. Sivitz, W.I.; Fink, B.D.; Donohoue, P.A. Fasting and leptin modulate adipose and muscle uncoupling protein: Divergent effects between messenger ribonucleic acid and protein expression. Endocrinology 1999, 140, 1511–1519. [Google Scholar] [CrossRef] [PubMed]
  49. Tan, C.Y.Y.; Virtue, S.; Bidault, G.; Dale, M.; Hagen, R.; Griffin, J.L.L.; Vidal-Puig, A. Brown Adipose Tissue Thermogenic Capacity Is Regulated by Elovl6. Cell Rep. 2015, 13, 2039–2047. [Google Scholar] [CrossRef] [PubMed]
  50. Dong, M.; Yang, X.; Lim, S.; Cao, Z.; Honek, J.; Lu, H.; Zhang, C.; Seki, T.; Hosaka, K.; Wahlberg, E.; et al. Cold exposure promotes atherosclerotic plaque growth and instability via UCP1-dependent lipolysis. Cell Metab. 2013, 18, 118–129. [Google Scholar] [CrossRef]
  51. Sui, W.; Li, H.; Yang, Y.; Jing, X.; Xue, F.; Cheng, J.; Dong, M.; Zhang, M.; Pan, H.; Chen, Y.; et al. Bladder drug mirabegron exacerbates atherosclerosis through activation of brown fat-mediated lipolysis. Proc. Natl. Acad. Sci. U. S. A. 2019, 166, 10937–10942. [Google Scholar] [CrossRef] [PubMed]
  52. Liu, B.; Page, A.J.; Hatzinikolas, G.; Chen, M.; Wittert, G.A.; Heilbronn, L.K. Intermittent fasting improves glucose tolerance and promotes adipose tissue remodeling in male mice fed a high-fat diet. Endocrinology 2019, 160, 169–180. [Google Scholar] [CrossRef] [PubMed]
  53. Liu, B.; Page, A.J.; Hutchison, A.T.; Wittert, G.A.; Heilbronn, L.K. Intermittent fasting increases energy expenditure and promotes adipose tissue browning in mice. Nutrition 2019, 66, 38–43. [Google Scholar] [CrossRef] [PubMed]
  54. Marinho, T. de S.; Ornellas, F.; Aguila, M.B.; Mandarim-de-Lacerda, C.A. Browning of the subcutaneous adipocytes in diet-induced obese mouse submitted to intermittent fasting. Mol. Cell. Endocrinol. 2020, 513. [Google Scholar] [CrossRef] [PubMed]
  55. Ahrén, B.; Pacini, G. Glucose effectiveness: Lessons from studies on insulin-independent glucose clearance in mice. J. Diabetes Investig. 2021, 12, 675–685. [Google Scholar] [CrossRef] [PubMed]
  56. Lu, Z.; Wei, X.; Sun, F.; Zhang, H.; Gao, P.; Pu, Y.; Wang, A.; Chen, J.; Tong, W.; Li, Q.; et al. Non-insulin determinant pathways maintain glucose homeostasis upon metabolic surgery. Cell Discov. 2018, 4. [Google Scholar] [CrossRef] [PubMed]
  57. Ebeling, P.; Koistinen, H.A.; Koivisto, V.A. Insulin-independent glucose transport regulates insulin sensitivity. FEBS Lett. 1998, 436, 301–303. [Google Scholar] [CrossRef] [PubMed]
  58. Karavia, E.A.; Papachristou, D.J.; Kotsikogianni, I.; Giopanou, I.; Kypreos, K.E. Deficiency in apolipoprotein e has a protective effect on diet-induced nonalcoholic fatty liver disease in mice. FEBS J. 2011, 278, 3119–3129. [Google Scholar] [CrossRef] [PubMed]
  59. Lu, W.; Mei, J.; Yang, J.; Wu, Z.; Liu, J.; Miao, P.; Chen, Y.; Wen, Z.; Zhao, Z.; Kong, H.; et al. ApoE deficiency promotes non-alcoholic fatty liver disease in mice via impeding AMPK/mTOR mediated autophagy. Life Sci. 2020, 252, 117601. [Google Scholar] [CrossRef]
  60. Dikkers, A.; Tietge, U.J.F. Biliary cholesterol secretion: More than a simple ABC. World J. Gastroenterol. 2010, 16, 5936–5945. [Google Scholar]
  61. Olivecrona, G. Role of lipoprotein lipase in lipid metabolism. Curr. Opin. Lipidol. 2016, 27, 233–241. [Google Scholar] [CrossRef] [PubMed]
  62. Verdier, L.L.; Boirie, Y.; Van Drieesche, S.; Mignon, M.; Begue, R.J.; Meynial-Denis, D. LDL receptor but not apolipoprotein E deficiency increases diet-induced obesity and diabetes in mice. Am. J. Physiol. - Endocrinol. Metab. 2002, 282, 207–214. [Google Scholar]
  63. Getz, G.S.; Reardon, C.A. Do the Apoe-/- and Ldlr-/- mice yield the same insight on atherogenesis? Arterioscler. Thromb. Vasc. Biol. 2016, 36, 1734–1741. [Google Scholar] [CrossRef] [PubMed]
  64. Ma, Y.; Wang, W.; Zhang, J.; Lu, Y.; Wu, W.; Yan, H.; Wang, Y. Hyperlipidemia and atherosclerotic lesion development in Ldlr-deficient mice on a long-term high-fat diet. PLoS One 2012, 7. [Google Scholar] [CrossRef] [PubMed]
  65. Chen, B.; Huang, Y.; Zheng, D.; Ni, R.; Bernards, M.A. Dietary fatty acids alter lipid profiles and induce myocardial dysfunction without causing metabolic disorders in mice. Nutrients 2018, 10. [Google Scholar] [CrossRef] [PubMed]
  66. Parathath, S.; Grauer, L.; Huang, L.S.; Sanson, M.; Distel, E.; Goldberg, I.J.; Fisher, E.A. Diabetes adversely affects macrophages during atherosclerotic plaque regression in mice. Diabetes 2011, 60, 1759–1769. [Google Scholar] [CrossRef]
  67. Nagareddy, P.R.; Murphy, A.J.; Stirzaker, R.A.; Hu, Y.; Yu, S.; Miller, R.G.; Ramkhelawon, B.; Distel, E.; Westerterp, M.; Huang, L.S.; et al. Hyperglycemia promotes myelopoiesis and impairs the resolution of atherosclerosis. Cell Metab. 2013, 17, 695–708. [Google Scholar] [CrossRef]
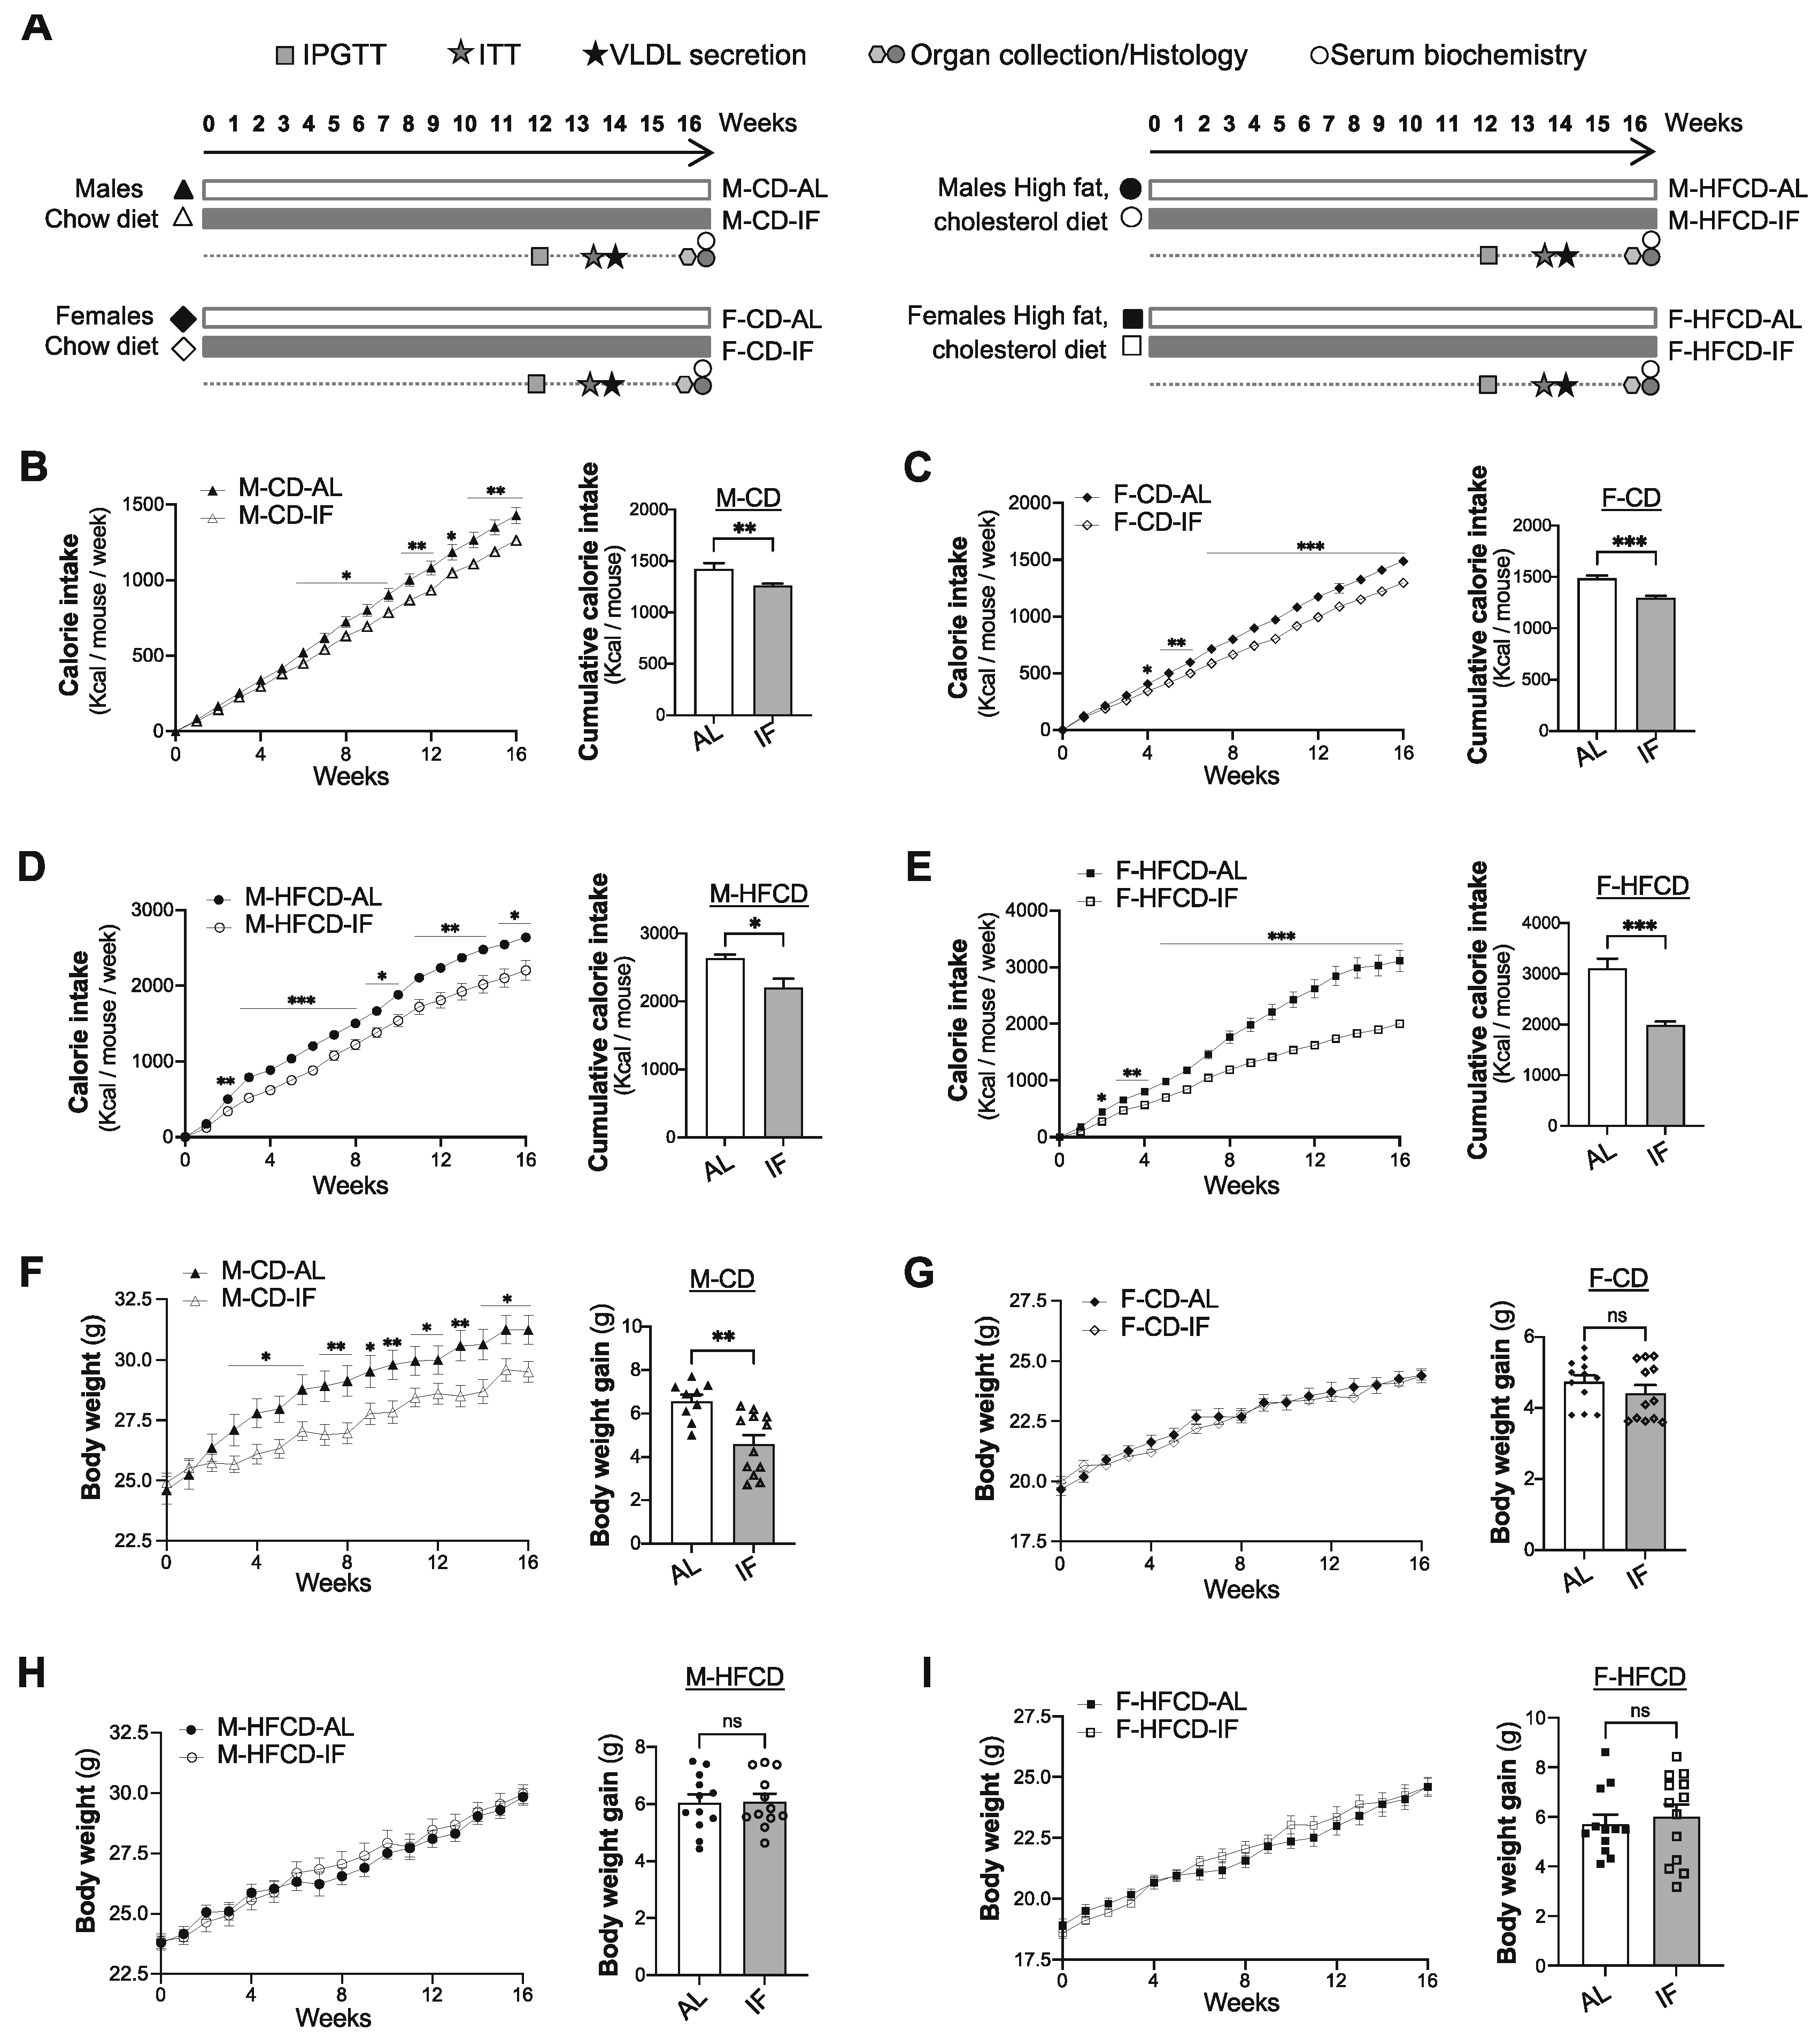
Figure 1. Intermittent fasting reduces body weight gain in Apoe-/- male mice fed chow diet. (A), Schematic outline of the experimental design: male or female Apoe-/- mice were divided into four groups that were assigned standard chow diet ad libitum (CD-AL group), intermittent fasting treatment of chow diet, by fasting every other day (CD-IF group) for 16 weeks, high-fat high cholesterol diet ad libitum (HFCD-AL group), or intermittent fasting of HFCD for 16 weeks (HFCD-IF group). Metabolic tests were performed at the indicated time and blood and organ samples were collected from euthanized mice at the end of the treatment. (B-E), The calorie intake was determined and calculated as the weekly average of Kcal intake per mouse (left panel) and the cumulative calorie intake after 16 weeks of treatment (right panel). Calorie intake in CD-fed males (B), CD-fed females (C), HFCD-fed males (D), and HFCD-fed females, n = 12–14 per group. (F-I) Change in body weight per week (left panel) and body weight gain after 16 weeks of treatment (right panel) in CD-fed males (F), CD-fed females (G), HFCD-fed males (H), and HFCD-fed females (I), n = 12–14 per group. Values are expressed as means ± SEM; ns: not significant, *p < 0.05, **p < 0.01, ***p < 0.001. IPGTT: intraperitoneal glucose tolerance test, ITT: insulin tolerance test, VLDL: very low-density lipoprotein.
Preprints 67142 g001
Figure 2. Intermittent fasting reduces hypertriglyceridemia in Apoe-/- mice fed CD while it exacerbates HFCD-induced dyslipidemia. Plasma levels of TG (A), NEFAs (B), total cholesterol (C), HDL-C (D) and non-HDL-C (D), and (E) in ad libitum (AL) or intermittent fasting (IF) Apoe-/- mice fed chow diet (CD) or high-fat high-cholesterol diet (HFCD). Values are expressed as means ± SEM (n = 6–9 per group); ns; not significant, *p < 0.05, **p < 0.01, ***p < 0.001. HDL-C, high-density lipoprotein cholesterol; TG, triglycerides; NEFAs, non-esterified fatty acids.
Preprints 67142 g002
Figure 3. Intermittent fasting in Apoe-/- mice improves glucose tolerance. (A-D) Intraperitoneal glucose tolerance test (IPGTT). At 12 weeks of intervention, ad libitum (AL) and intermittent fasting (IF) Apoe-/- mice were fasted for 16 hours and received an intraperitoneal injection of glucose (1 g/kg). Glycemia was measured at the indicated times (left panel), and the respective area under the curve (AUC) was calculated (right panel) for CD-fed males (A), CD-fed females (B), HFCD-fed males (C), and HFCD-fed females (D). (E-H) Intraperitoneal insulin tolerance test (ITT). 2 weeks after IPGTT; the same mice were fasted for 5 hours and received an intraperitoneal injection of insulin (0.5 U/kg). Glycemia was measured at the indicated times (left panel), and the respective area under the curve (AUC) was calculated (right panel) for CD-fed males (E), CD-fed females (F), HFCD-fed males (G), and HFCD-fed females (H). Values are expressed as means ± SEM (n = 5–9 per group); ns: not significant, *p < 0.05, **p < 0.01, ***p < 0.001.
Preprints 67142 g003
Figure 4. Intermittent fasting in Apoe-/- mice regulates adipose tissue phenotypes depending on the diet.(A,B) Representative images of H&E staining of WAT tissue sections of ad libitum (AL) or intermittent fasting (IF) CD-fed males (A), CD-fed females (B), HFCD-fed males (C), and HFCD-fed females (D). Scale bar: 100 μm, n = 4 per group. (E,F) Expression of genes related to browning and lipid metabolism in ad libitum (AL) or intermittent fasting (IF) CD-fed males (E) and HFCD-fed males (F). (G-J) Representative images of H&E staining of BAT-tissue sections of ad libitum (AL) or intermittent fasting (IF) CD-fed males (G), CD-fed females (H), HFCD-fed males (I), and HFCD-fed females (J). Scale bar: 100 μm, n = 3 per group. (K,L) Expression of genes related to BAT activation in ad libitum (AL) or intermittent fasting (IF) CD-fed males (K) and HFCD-fed males (L). Values are expressed as means ± SEM (n = 6–7 per group); ns: not significant, *p < 0.05, **p < 0.01, ***p < 0.001.
Preprints 67142 g004
Figure 5. Intermittent fasting reduced hepatic triglyceride content in Apoe-/- male mice fed chow diet while it exacerbated HFCD-induced steatosis. (A-D) Representative images of H&E staining of sections of liver tissue of ad libitum (AL) and intermittent fasting (IF) CD-fed males (A), CD-fed females (B), HFCD-fed males (C), and HFCD-fed females (D). Scale bars: 250 μm (E) Liver triglycerides content in AL and IF CD-fed mice (left panel) and HFCD-fed mice (right panel). (F) Liver cholesterol content in AL and IF CD-fed mice (left panel) and HFCD-fed mice (right panel). (G) Liver reactive oxygen species (ROS) content in AL and IF CD-fed mice (left panel) and HFCD-fed mice (right panel). (H) Liver thiobarbituric acid response substrates (TBARs) level in AL and IF CD-fed mice (left panel) and HFCD-fed mice (right panel). Values are expressed as means ± SEM (n = 6–9 per group); ns; not significant, *p < 0.05, **p < 0.01, ***p < 0.001.
Preprints 67142 g005
Figure 6. Intermittent fasting increased biliary lipid secretion in Apoe-/- mice fed CD. The gallbladder was cannulated and bile was collected for 30 min, after a stabilization time of 30 min. Biliary secretions of cholesterol (A), bile acids (B) and phospholipids (C) were determined in ad libitum (AL) or intermittent fasting (IF) Apoe-/- mice fed chow-diet (CD) or high-fat high-cholesterol diet (HFCD). Values are expressed as means ± SEM (n = 6–7 per group); ns; not significant, *p < 0.05, **p < 0.01, ***p < 0.001.
Preprints 67142 g006
Figure 7. Intermittent fasting induced significant changes in the hepatic expression of genes involved in lipid and cholesterol metabolism only in males fed CD. (A-B) Expression of genes related to lipolysis in ad libitum (AL) or intermittent fasting (IF) CD-fed males (A) and HFCD-fed males (B). (C-D) Expression of genes related to lipogenesis in ad libitum (AL) or intermittent fasting (IF) CD-fed males (C) and HFCD-fed males (D). (E-F) Expression of genes related to cholesterol synthesis in ad libitum (AL) or intermittent fasting (IF) CD-fed males (E) and HFCD-fed males (F). (G-H) Expression of genes related to cholesterol transport in ad libitum (AL) or intermittent fasting (IF) CD-fed males (G) and HFCD-fed males (H). Values are expressed as means ± SEM (n = 5–8 per group); ns; not significant, *p < 0.05, **p < 0.01, ***p < 0.001.
Preprints 67142 g007
Figure 8. Intermittent fasting reduced atherosclerotic lesions only when Apoe-/- mice were fed CD. (A,D,G,J) Quantification of the Oil Red O-stained aortic root at the indicated distances from the heart of ad libitum (AL) or intermittent fasting (IF) males fed CD (A), females fed CD (D), males fed HFCD (G), and females fed HFCD (J). (B,E,H,K) Calculation of the AUC regarding the quantification of atherosclerotic lesions of ad libitum (AL) or intermittent fasting (IF) males fed CD (B), females fed CD (E), males fed HFCD (H), and females fed HFCD (K). (C,F,I,L) Representative images of Oil Red O-stained sections of aortic valve of ad libitum (AL) or intermittent fasting (IF) males fed CD (C), females fed CD (F), males fed HFCD (I), and females fed HFCD (L). Scale bars: 1 mm. Values are expressed as means ± SEM (n = 5–7/group); ns; not significant, *p < 0.05, **p < 0.01, ***p < 0.001.
Preprints 67142 g008
Disclaimer/Publisher’s Note: The statements, opinions and data contained in all publications are solely those of the individual author(s) and contributor(s) and not of MDPI and/or the editor(s). MDPI and/or the editor(s) disclaim responsibility for any injury to people or property resulting from any ideas, methods, instructions or products referred to in the content.
Copyright: This open access article is published under a Creative Commons CC BY 4.0 license, which permit the free download, distribution, and reuse, provided that the author and preprint are cited in any reuse.
Prerpints.org logo

Preprints.org is a free preprint server supported by MDPI in Basel, Switzerland.

Subscribe

© 2024 MDPI (Basel, Switzerland) unless otherwise stated