
Submitted:
30 December 2022
Posted:
04 January 2023
Read the latest preprint version here
Abstract
The BRFSS is an annual survey conducted by each state and designed to identify trends in a representative sample of the resident population. In its 2019 field survey, the U.S. state of Georgia tested a new 3 – item module to measure the numbers of bereaved, resident adults. Bereavement means that participants answered, ‘Yes’ to the item ‘Have you experi-enced the death of a family member or close friend in the years 2018 or 2019?’. This analysis addresses two questions. Can estimates for bereavement prevalence be derived without large sampling errors, low precision, and small subsamples? Can multiple imputation techniques be applied to overcome non-response and missing data to support multivari-ate modeling? Analyses in this study were conducted under two scenarios. Scenario 1 ap-plies the complex sample weights created by the Centers for Disease Control and imputes values for missing responses. Scenario 2 treats the data as a panel – no weighting com-bined with removal of persons with missing data. Scenario 1 reflects the use of BRFSS data for public health and policy, while Scenario 2 reflects data as it is commonly used in so-cial science research. The bereavement item has a response rate (RR) of 70.8% (5206 of 7534 persons). Subgroups have RR of 55% or more. Under Scenario 1, the prevalence of bereavement is 45.38%, meaning that 3,739,120 adults reported bereaved in 2018 or 2019. The prevalence is 46.02% with Scenario 2 which removes persons with any missing data (4,289 persons). Scenario 2 overestimates the bereavement prevalence by 1.39%. An il-lustrative logistic model is included to show the performance of exposure to bereavement under each scenario. Recent bereavement can be ascertained in a surveillance survey without biases in response. This survey is limited to one US state in a single year and ex-cludes persons aged 17 years and younger.
Keywords:
BRFSS
; Bereavement
; Grief
; Mental Health
; Physical Health
; Population Surveillance
; Social de-terminants of health
; Multiple Imputation
; Screening
1. Introduction
Bereavement is a known risk factor for morbidity and mortality. By taking a social network view, researchers have documented a broader circle of persons who are connected to a single death.[1,2,3,4,5] One recent study has created a bereavement multiplier. This multiplier is based on analyses of single deaths within a kinship network and estimates that nine persons are connected to a single death.[6] The Kinship Risk multiplier provides an evidence-based estimate of the social network. Kinship risk operates like flood risk analysis. Flood risk identifies the number of buildings damaged by a single flood event7 while kinship risk identifies the numbers of persons in the social network of a singular decedent. Is kinship risk, i.e., bereavement prevalence enough to merit its inclusion in an ongoing surveillance survey? To answer this question, the U.S. state of Georgia field tested a new bereavement module in its 2019 BRFSS field survey. The product of this effort is an estimate of the number of persons responding ‘Yes’ to a query about bereavement in a defined time frame. The aim of this analysis is testing the feasibility of population surveillance for bereavement. Are there enough persons bereaved within a similar time frame to support the assessment of bereavement-related injury?
Currently, societal risk due to bereavement is indirectly inferred from big data sources such as population registries[8], or complex sampling surveys.[9,10] The Swedish population registry is one source for measuring survivor mortality and morbidity after the death of a family member.[8] The Swedish registry has the capacity to link family members alive or dead. The National Mortality Followback Survey (NMFS) is a complex sampling survey of death certificates in the U.S.[9] NMFS is designed to validate death certificates and ascertain events surrounding decedent health in the 3 months prior to the death. Data are obtained by interviewing key informants, usually a family member. Despite the sensitive nature of the topic, participation rates in NMFS ranged from 90 to 95% in the 3 cycles – 1966, 1986, and 1993. NMFS does not have data on the informant other than age, gender, and race. The Health and Retirement Survey (HRS) is a longitudinal complex sampling survey of U.S. adults aged 50 years and older in which cohort members are recontacted regularly at two-year intervals.[10] The HRS item on bereavement was introduced in 2006. Analyses of HRS data has been used to identify individual mediators and moderators of health related to bereavement and factors supporting resilience to its negative health effects.[2,3,11,12,13] HRS respondents have a response rate of 80%. Taken together, the evidence from these surveys indicates that participants are willing to respond when asked specific questions about the deaths of friends and family.
2. Materials and Methods
2.1. Sample
The 2019 Georgia BRFSS contained an unweighted panel of 7,354 responding to the common core items. A subset (n = 5,206) also responded to the recent bereavement module placed at the end of the interview. The core interview took an average of 17 minutes and the bereavement module added 5 minutes. Interviewees were recruited from list-assisted, random digit dialing of adults selected from the non-institutionalized population aged 18 years and older resident in Georgia households drawn from within primary statistical units. Persons were recruited from both landline and cellular phone lists. The panel sample includes 4,289 respondents with complete information on all 15 core and module items. The missing responses were not uniform across individual items. See Appendix Table A1 for the list of variables used in the analysis and rates of missing data for each. The Tables and Figures compare estimates derived the panel or multiple imputation, weighted samples (MI). Methods for the creation of the MI sample are described in statistical methods.
2.2. Measures
Georgia’s common core contains uniform survey items asked in all U.S. states on health risk behaviors, chronic diseases, access to health care, and use of preventive services. The analytic dataset used in this study contains items from the following categories – Demographics (Age, Race / Ethnicity, Sexual Orientation / Gender Identity); Social Determinants (Education, Residence in Metropolitan Counties, Employment); Health Behaviors (Physical Activity, Smoking, Alcohol Use); and Quality of Life (Self rated health, Physical and Mental Health). The format for these items is described in detail elsewhere.[14]
2.2.1. Recent bereavement
The 2019 Georgia BRFSS added a new state module on the topic of bereavement to the end of the interview. All participants who continued to the end of the common core were asked about bereavement. The module contains questions from the HRS and have been described elsewhere.[10] Those who replied yes to the question ‘Have you experienced the death of a family member or close friend in the years 2018 or 2019? were further queried about the number of losses and their relationship to each decedent.
2.2.2. Demographic variables: Gender Identity / Sexual Orientation, Age, Race / Ethnicity
Binary gender, age at interview, race, and ethnicity are a part of the common core questions asked by all states. The Georgia BRFSS also has three items asking about sexual orientation and gender identity. To define sexual orientation, participants were asked: Which of the following best represents how you think of yourself, and do you consider yourself to be transgender? Response options include Gay, Straight or Bisexual or Something else. Response options for the transgender question include Transgender male to female, Transgender female to male, and transgender nonconforming. The survey also queries age (in years) and self-selected race and ethnicity from a series of U.S. census bureau categories. See Appendix Table A2 for the Georgia BRFSS formulation of Sex and Gender Identity questions.
2.3. Statistical methods
2.3.1. Response rates
Of the original 7,354 persons answering the BRFSS core questions, there were 5,206 persons responding to the bereavement module screening question for a module response rate of 70.8%. Among the module participants, 4,703 persons had completed responses to all items used in these analyses. Response rates for subgroups in the bereavement module are calculated by dividing the number of subgroup members completing an item by the total subgroup numbers in the module panel.
2.3.2. Multiple imputation
Prevalence of bereavement is based on responses to an item with a binary response. In multivariable statistical models, missing responses to the other items become an increasingly important consideration. Multiple imputation is a simulation-based statistical technique that allows researchers to use more available data, thus reducing biases when persons with missing data are excluded.[15,16] Multiple imputation has three elemental phases: imputation, analysis, and pooling. The imputation phase is to create m copies of the dataset, with the missing values replaced by imputed values using an appropriate model. Rubin suggested that m=5 should be sufficient to obtain valid inference, while some researchers reported m should be 50 or more.[17,18,19,20] Missing data elements can stem from three possible situations: missing completely at random (MCAR), missing at random (MAR), and missing not at random (MNAR). MCAR occurs when the missingness is unrelated to the observed and unobserved value for that unit.[21] Under a MAR mechanism, the probability of a missing value for an item may depend on observed data but not on unobserved data. MNAR means that the probability of missingness depends on the underlying value of an item.[22]
Steps creating the final MI sample proceeded as follows. First, complex sampling weights were applied to the panel and the variables weighting, stratification, and primary sampling unit were used. The complex sampling weights were applied to the panel using the variable _llcpwt for weighting, _ststr for stratification, and the variable _psu for primary sampling unit.[23] Next, 50 copies of the weighted data were created. This number was chosen to reduce the sampling error due to imputations. The imputation process was then carried out based on multiple imputation by chained equations (MICE). The MICE method is a practical approach to impute missing data in multiple variables based on a set of univariate imputation models.[20] We selected the conditional models based on the type of variables. The MICE method allows the use of logistic regression model to impute binary variables such as bereavement. Moreover, ordered logistic and multinomial logistic regression models can impute ordered categorical such as educational attainment and unordered categorical variables such as race. The estimated variance of this MI estimate is calculated based on Rubin’s rules.[21] Standard imputation models with Rubin’s rules result in an upwardly biased estimate of the variance.[24] Rubin’s variance estimator combines the average of the variance estimates using complex sample variance estimates. Therefore, we included the sampling weights as a linear term in the imputation model.[25] The estimated variance of the MI prevalence is calculated based on the between-imputation variance and the within-imputation variance.
Testing on whether the data set is MCAR was performed. Little’s MCAR test gives a χ2 distance of 1633.93 with the degree of freedom =1052 and a p-value< 0.001.[26] The test suggests that the missing data of the measured variables included the analyses are not MCAR. In this phase, each of the 50 complete datasets was used to calculate prevalence rates in the weighted sample. The results obtained from the 50 completed datasets are combined into a single multiple-imputation result in the pooling phase.[20] The single parameter estimate is the mean of the m (=50) parameter estimates.
2.3.3. Prevalence estimates, relative difference, and standard errors
To see the biases created by missing data, prevalence rates were calculated using both the panel sample and the MI sample. A single measure – the Relative Difference (RD) - is a ratio showing the relative difference of bereavement prevalence as a percent difference between the two samples. The numerator is calculated by subtracting MI prevalence from panel prevalence and can have either a positive or negative value. The panel prevalence is the denominator for this ratio. RD illustrates the effect on prevalence in a scenario where survey design and missing responses are ignored. The associated negative and positive signs provide direction for this difference. A negative RD means that panel data underestimates bereavement prevalence. A positive RD indicates that panel data overestimates prevalence. BRFSS is designed for development of population estimates by public health agencies. The preferred denominator for this application is the weighted MI estimate. The panel estimates maybe an acceptable substitute when exploring mechanisms.
These analyses also calculate standard errors associated with bereavement prevalence rate for both panel and weighted-MI data. Standard error indicates the uncertainty around each estimated rate. The standard error is also a component in calculating a confidence interval. The estimated SEs for the weighted-MI estimates account for biases associated when sample weights are ignored, and missing responses are excluded. Hence SEs of weighted imputed prevalence are larger than those obtained from panel data. By calculating the relative difference between the SE from weighted imputed prevalence and SE obtained from panel data, the size of bias between panel and MI data can be discussed with a single metric.
The logistic regression model demonstration included in this paper presents the confidence interval because it is often used in public health reports. Although the results are not shown in these analyses, we explored two approaches for calculating 95 percent confidence intervals for prevalence rates – the Clopper-Pearson (CP) method[27] and the Korn-Graubard (KG) adjustment[28] to the Clopper-Pearson method. In the analyses, we used the CP method for the panel data and the KG for complex survey data (i.e., the weighted survey data). These are used when the normal approximation to the binomial does not work well – typically when the expected number of cases (number in the numerator) is less than 5. This will occur for rare prevalence and/or small samples. These methods produce non-symmetric confidence intervals. They would be relevant for prevalence estimates for sub-groups with small samples that generate 5 or less people suffering bereavement – in this case roughly 5/0.46= 12 or less.
The KG confidence interval was developed specifically for analyzing survey data with a complex design and uses weighted data without imputation. As anticipated, CP and KG yield similar confidence intervals. For the panel sample (4,289 respondents), the standard error uses the traditional approach available in statistical packages. The SE is an analytically derived variance estimator associated with the sample proportion. This approach ignores missing response and characteristics of the sample design. On the other hand, when BRFSS weights and imputed data are incorporated into the estimates, the SE is obtained based on Rubin’s rule. Rubin’s rule combines the average within imputation variance with the between imputation variance in estimates using complex sample variance estimates.
All statistical analyses were conducted using Stata Version 17 (StataCorp, College Station, TX). First, the proportion and logistic commands were used to calculate the SEs for prevalence estimates and the ORs from the logistic regression in the panel data. Second, the svyset command was used to account for complex sampling weights. Third, the key commands are mi set, mi register imputed, and mi impute chained commands for creating multiple imputation. Last, the mi estimate: svy: proportion and mi estimate or: svy: logistic commands were used to calculate the SEs for prevalence estimates and the ORs from the logistic regression in weighted-MI data set.
All models in Table 3 included interaction terms represented as the product of two independent variables (Bereavement and Gender). The models also included the main effects for bereavement and gender separately. For example, when the dependent variable is current smoker, we can see the main effects (ORs) of bereavement and gender are 1.52 and 1.66, and the interaction effect is 0.74. To evaluate the risk of reporting a current smoker, the model is as follows: Current smoker = [Main effects] a*bereavement + b*gender + [Interaction] c*bereavement*gender + [controls] d*age + e*race; a, b, c, d, and e are coefficients.
3. Results
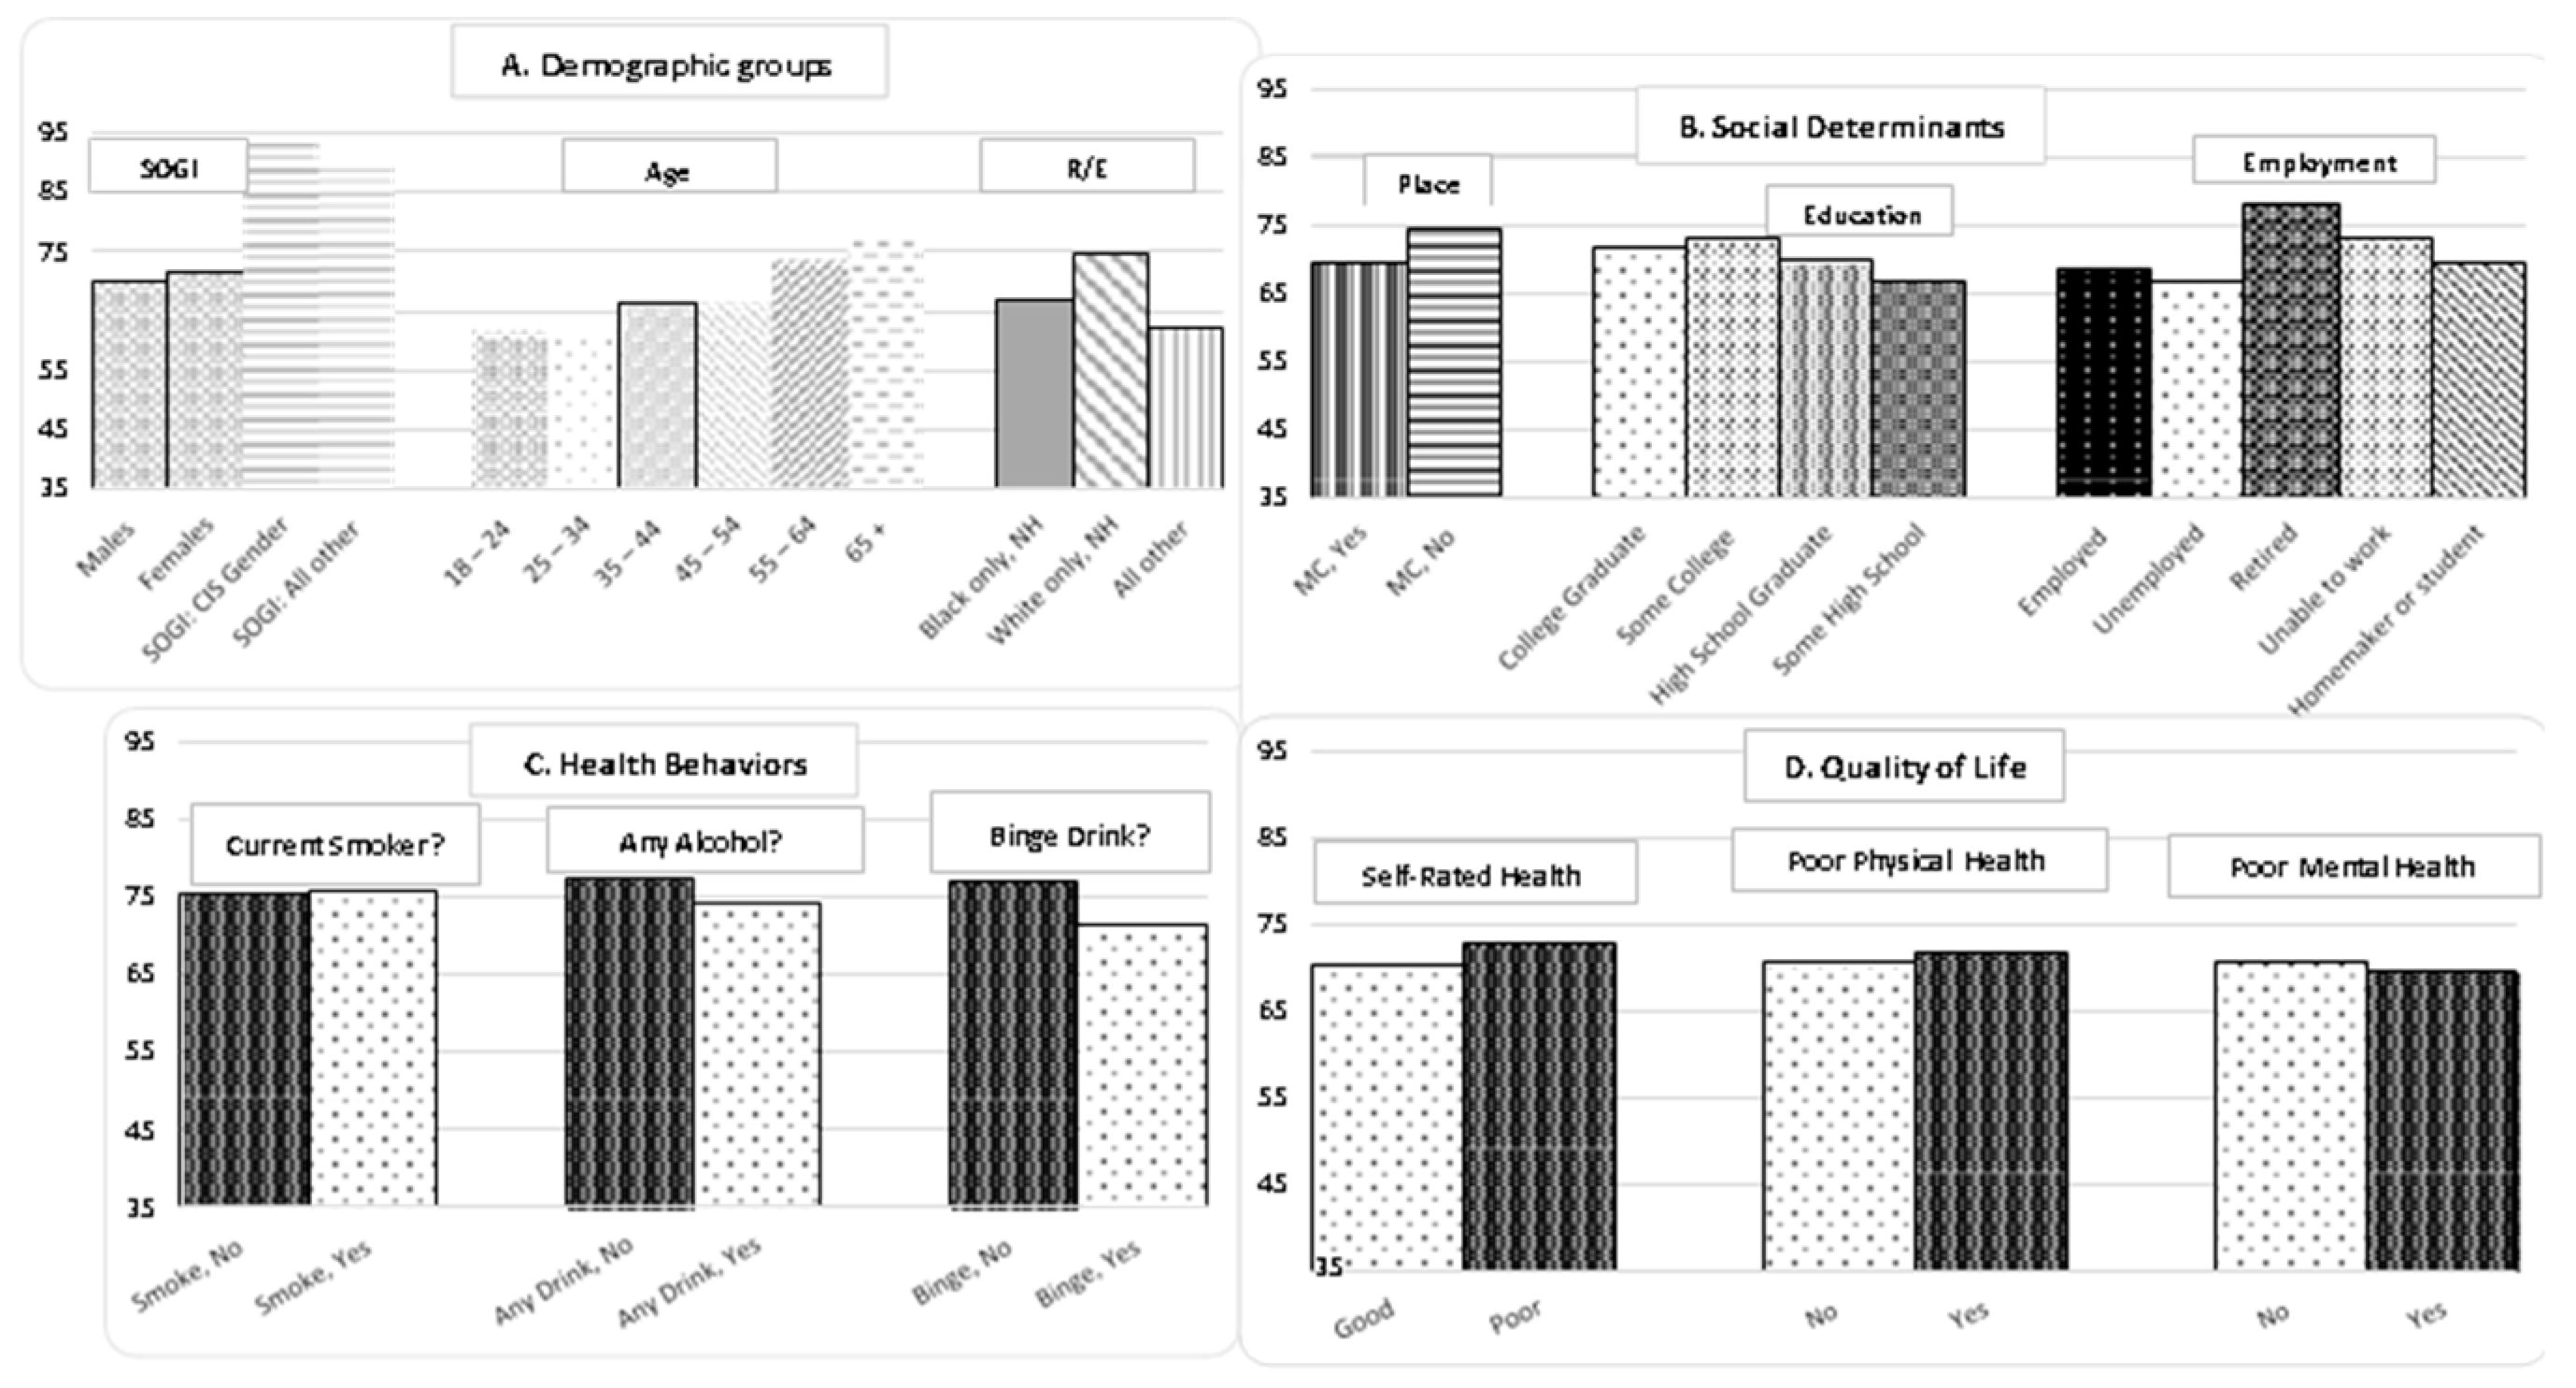
Are participants willing to discuss the deaths of family and friends? Figure 1 shows response rates to the question ‘Have you experienced the death of a family member or friend in the years 2018 or 2019?’. The graphs are shown in 4 clusters – Demographic groups, Social Determinants of Health (SDOH), Health Behaviors, and Quality of Life (QOL). Health behavior and quality of life have response rates that exceed 70%. The response rates shown in Panel C and D reflect the proportion of module participants (n = 5206) who also answered the specific item. There were 4,289 participants who had complete information on all 15 items. The remaining 917 were missing one or more responses and were deleted from the panel data. Appendix Table A1 shows the missing response rates for each individual item. For example, the response rate for gender is 100% and the response rate for the 1st bereavement item is 70.71%. Men (69.99%) are less likely to respond to the bereavement item while women (71.42%) are more likely to respond. The smoking item has a response rate of 93.11% (N = 6,847). Persons who answer the smoking item answer the bereavement item at slightly different rates – 75.38% of ‘No’ and 75.86% of ‘Yes’. Response biases within categories was a first strategy to evaluate survey data on bereavement.
Table 1 shows the prevalence rate of bereavement for both the panel and MI samples. The rate for the MI sample is 45.38% on a base population of 8,164,018 adults aged 18 years and older. By using this rate, an analyst can project that there are 3,739,120 adults who reported the death of at least one family member or friend in 2018 or 2019. Across the MI subgroups, prevalence rates range from 37.4% to 55.7%. In the panel sample, the population prevalence increases to 46.02% with a range of 38.51% to 54.98%. The column labeled RD (Relative Difference) is a ratio showing the relative difference of bereavement prevalence as a percent difference between the two samples. The RD illustrates the effect of ignoring survey design and deleting persons with missing responses. The RD of 1.39% means that panel data overestimates the MI prevalence rate. Each subgroup’s prevalence rate and their associated RD are shown in the table. Generally, the absolute value of RD increases with subgrouping. While the relative differences are often less than 5%, there are some that are larger. These larger RDs are observed for the subgroups – SOGI All Other (7.82%), Race All Other (10.36%), and Unemployed (7.65%). The larger RDs show that weighting and MI reduce biases affecting panel-based estimates for these vulnerable groups.

Table 1.
Prevalence of Bereavement and Relative Difference, Panel versus MI data. 2019 Georgia Behavioral Risk Factor Surveillance System (BRFSS).
Table 1.
Prevalence of Bereavement and Relative Difference, Panel versus MI data. 2019 Georgia Behavioral Risk Factor Surveillance System (BRFSS).
| Panel N = 4,289 |
Weighted MI N = 8,164,018 |
Relative Difference (RD, %) | |
|---|---|---|---|
| Percent bereaved | 46.02 | 45.38 | 1.39 |
| Demographics | |||
| Males | 43.89 | 44.24 | -0.80 |
| Females | 47.66 | 46.43 | 2.58 |
| SOGI§: CIS Gender | 46.88 | 45.71 | 2.50 |
| SOGI§: All other | 44.48 | 41.00 | 7.82 |
| 18 – 24 years | 38.51 | 37.49 | 2.65 |
| 25 – 34 years | 42.60 | 43.60 | -2.35 |
| 35 – 44 years | 48.41 | 47.77 | 1.32 |
| 45 – 54 years | 48.20 | 48.01 | 0.39 |
| 55 – 64 years | 48.66 | 50.15 | -3.06 |
| 65 + years | 45.14 | 43.85 | 2.86 |
| Black / African American only, NH | 54.98 | 55.72 | -1.35 |
| White only, NH | 44.79 | 42.75 | 4.55 |
| All other | 37.65 | 33.75 | 10.36 |
| Social Determinants of Health | |||
| Place | |||
| Metropolitan County | 45.10 | 44.94 | 0.35 |
| Non-Metropolitan County | 47.29 | 47.25 | 0.08 |
| Education | |||
| Graduated, College or Technical School | 43.58 | 43.63 | -0.11 |
| Attended College or Technical School | 48.45 | 47.74 | 1.47 |
| Graduated, High School | 47.38 | 45.71 | 3.52 |
| Did not graduate, High School | 47.38 | 43.09 | 9.05 |
| Employment | |||
| Employed | 45.87 | 45.17 | 1.53 |
| Unemployed | 52.29 | 48.29 | 7.65 |
| Retired | 45.24 | 45.18 | 0.13 |
| Unable to work | 49.54 | 51.51 | -3.98 |
| Homemaker or student | 43.29 | 41.12 | 5.01 |
| 14 or more days of high-risk health behaviors / states past 30 days | |||
| No physical activity | 46.04 | 45.97 | 0.15 |
| Current smoker | 52.10 | 53.44 | -2.57 |
| Binge Drinking | 48.78 | 47.08 | 3.49 |
| Fair or Poor, SRH | 48.94 | 50.44 | -3.06 |
| Physical health not good | 50.87 | 51.78 | -1.79 |
| Mental health not good | 53.34 | 54.72 | -2.59 |
Note: Item ‘Have you experienced the death of a family member or close friend in the years 2018 or 2019? SE = Standard Error, SOGI§, CIS Gender includes ‘I think of myself as straight and not transgender.’ SOGI§, all other includes Gay /Bisexual /Something else and transgender (male to female, female to male, gender nonconforming). NH€ = non-Hispanic. SRH¥ Self-rated health 5 categories: excellent, very good, good, fair, and poor. Health behaviors reflect Healthy People 2020 target areas described in accessed April 11, 2021. https://www.healthypeople.gov/2020/topics-objectives. For 2019 BRFSS Questionnaire https://www.cdc.gov/brfss/questionnaires/index.htm; accessed May 14, 2021. RD, the relative difference between panel and weighted multiple imputation (MI). Héraud-Bousquet et al. BMC Med Res Meth 2012, http://www.biomedcentral.com/1471-2288/12/73.
Table 2 shows standard errors (SE) associated with estimated bereavement prevalence for subgroups of age and categories of high-risk health states. Column 2 (Rel SE Weighted) and Column 4 (Rel SE Panel) shows the relative difference in SE obtained from fully weighted, imputed data compared to the panel sample. The relative SE is calculated for each sample as a ratio of the SE and the prevalence estimate. The panel sample has smaller SEs. However, as with Table 1, omitting sample weights and missing responses creates biased estimates. The differences in relative SE for the weighted MI estimates associated with age ranges from 9.34% (ages 18 to 24 years) to 3.9% (ages 65 and over). The relative differences in SE for high-risk health states ranges from 6.78% (binge drinking) to 4.33% (no physical activity for 14 or more days in a month). These Rel SE are less than 30% which makes them acceptable for public health reporting.
Table 2.
Relative Standard Error (SE, %) , Weighted-Multiple Imputed data versus Panel data, 2019 Georgia Behavioral Risk Factor Surveillance System (BRFSS).
Table 2.
Relative Standard Error (SE, %) , Weighted-Multiple Imputed data versus Panel data, 2019 Georgia Behavioral Risk Factor Surveillance System (BRFSS).
| Weighted, SE N = 8,164,018 |
Rel SE, Weighted (%) |
Panel, SE N = 4,289 |
Rel SE, Panel (%) |
|
|---|---|---|---|---|
| Age Groups, years | ||||
| 18 – 24 | 3.50 | 9.34 | 2.71 | 7.04 |
| 25 – 34 | 3.21 | 7.36 | 2.20 | 5.16 |
| 35 – 44 | 3.13 | 6.55 | 2.00 | 4.13 |
| 45 – 54 | 2.63 | 5.48 | 1.83 | 3.80 |
| 55 – 64 | 2.56 | 5.10 | 1.55 | 3.19 |
| 65 + | 1.71 | 3.90 | 1.13 | 2.50 |
| 14 or more days of high-risk health behaviors / states past 30 days | ||||
| No physical activity | 1.99 | 4.33 | 1.24 | 2.69 |
| Current smoker | 3.12 | 5.84 | 2.09 | 4.01 |
| Binge Drinking | 3.19 | 6.78 | 2.08 | 4.26 |
| Fair or Poor, SRH | 2.31 | 4.58 | 1.43 | 2.92 |
| Physical health not good | 2.67 | 5.16 | 1.76 | 3.46 |
| Mental health not good | 2.68 | 4.90 | 1.88 | 3.52 |
Note: Relative difference equals Standard error for weighted Imputed bereavement minus SE for panel data presented as a percent ratio of the SE weighted imputed.
Does bereavement increase the probability of reporting high-risk health behaviors and poor quality of life? Table 3 provides a demonstration of hypotheses testing for subgroup differences in health behaviors. This table is provided so that readers can begin to think about the application of this new item. It is not designed to present a definitive assessment of gender differences. Gender was selected for subgroup comparison because there are no missing responses to this item in the panel. Due to missing responses for the other items, imputed data was used in this demonstration. The BRFSS is cross-sectional data, so logistic regression modeling is used for this demonstration. Odds ratio and 95% confidence intervals are shown for both panel (Scenario A) and MI data (Scenario B). The odds ratios shown are adjusted for age and race because preparatory analyses show significant differences across age groups and racial groups. Within each category of health, the rows are organized to show compare 3 scenarios - bereaved with not bereaved (Model 1A,1B; 4A, 4B,7A, 7B,10A, 10B, and 13A and B), males with females (Model 2A & B, 5A & B, 8A&B, 11A&B, 14A&B), and inclusion of an interaction term (Model 3A&B, 6A&B, 9A&B, 12A&B, 15A&B). In total, there are 15 models in the table.
Table 3.
Logistic Modeling: Gender differences in effect of bereavement on health behavior in the past 30 days. Demonstration of Panel versus MI data. 2019 Georgia BRFSS.
Table 3.
Logistic Modeling: Gender differences in effect of bereavement on health behavior in the past 30 days. Demonstration of Panel versus MI data. 2019 Georgia BRFSS.
| Scenario A Panel Sample N = 4,703 |
Scenario B Multiple Imputation and Weights (MI) N =8,164,018 |
||||||
|---|---|---|---|---|---|---|---|
| Models | ORadj | CIL | CIU | ORadj | CIL | CIU | |
| Binge Drinking | 1 Bereaved (B) | 1.37 | 1.03 | 1.81 | 1.31 | 0.85 | 2.03 |
| 2 Gender (G) | 2.35 | 1.81 | 3.05 | 1.94 | 1.34 | 2.79 | |
| 3 B*G | 0.77 | 0.53 | 1.12 | 0.82 | 0.47 | 1.44 | |
| Current smoker | 4 B | 1.52 | 1.17 | 1.95 | 1.68 | 1.16 | 2.43 |
| 5 G | 1.66 | 1.28 | 2.14 | 1.52 | 1.08 | 2.14 | |
| 6 B*G | 0.74 | 0.52 | 1.06 | 0.78 | 0.46 | 1.31 | |
| SRH / Fair or Poor |
7 B |
1.30 |
1.09 |
1.54 |
1.33 |
1.02 |
1.73 |
| 8 G | 1.11 | 0.92 | 1.33 | 1.13 | 0.87 | 1.47 | |
| 9 B*G | 0.73 | 0.56 | 0.95 | 0.92 | 0.61 | 1.39 | |
| Physical Health | 10 B | 1.24 | 1.01 | 1.52 | 1.26 | 0.92 | 1.72 |
| 11 G | 0.95 | 0.76 | 1.18 | 0.88 | 0.66 | 1.17 | |
| 12 B*G | 0.93 | 0.68 | 1.28 | 1.14 | 0.72 | 1.78 | |
| Mental Health | 13 B | 1.38 | 1.12 | 1.71 | 1.64 | 1.20 | 2.23 |
| 14 G | 0.77 | 0.60 | 0.98 | 0.83 | 0.60 | 1.14 | |
| 15 B*G | 1.08 | 0.77 | 1.51 | 1.01 | 0.63 | 1.60 | |
Note: ORadj = Odds ratio adjusted for Age and Race. CIL = 95% Confidence interval, lower limit; CIU = 95% Confidence interval, upper limit. Bold numbers indicate p>.10.
When viewing this table, start with the challenge of studying bereavement and its potential association with binge drinking alcohol under different data scenarios and proceeds as follows. First, is there an association between bereavement and binge drinking (Model 1)? Next, is there an association between gender and binge drinking (Model 2)? Finally, an interaction term (bereavement *gender) is modeled (Model 3). What about different data scenarios - Panel (A) and MI (B)? Models A1 and B1 do not yield the same result. Model A1 yields an ORadj of 1.37 and a 95% CI ranging from 1.03 to 1.81. This indicates that bereaved persons have a statistically significant likelihood of reporting binge drinking when compared to those without bereavement. Model B1 yields an ORadj of 1.31 combined with a 95% CI ranging from 0.85 to 2.03, suggesting no significant association between bereavement and bingeing. What about gender differences in binge drinking? In Model A2, the ORadj compares males and females; the anticipated higher risk of bingeing for men is clearly shown in both scenario A - ORadj = 2.35; 95% CI 1.81 – 3.05 - and scenario B - ORadj = 1.94; 95% CI 1.34 – 2.79. Does gender modify the risk of binge drinking within the context of bereavement? Model 3A and 3B show that the ORadj is not significantly under either data scenario. Men are not more likely than women to have an association between bereavement and binge drinking. This 3rd model shows the challenge associated with evaluating bereavement and health and provides a cautionary note for thinking about gender and health effects. The results of logistic regression revealed that the CIs are wider for the weighted-MI estimates as the SEs are larger reflecting the effect of weighting and MI.
4. Discussion
The goal of this study was to evaluate the performance of an item assessing recent bereavement in BRFSS - a complex sampling survey, designed to provide population numbers for use in public health planning.[29,30] Its design includes features that account for the distribution of a state population within counties and by demographic characteristics. This accounting gives state and local governmental agencies the numbers needed to create cost estimates for the development of programs and their related resources. BRFSS is also used by the social science community to test hypotheses related to the social determinants of health.[31]
Bereavement in a surveillance survey advances the study of bereavement health effects because a broader age group is included. Prior surveys of bereavement are limited to adults aged 50 years and older. This event can happen to anyone at any age in the life cycle. By starting at 18 years and not having an upper limit, our measurement captures bereavement earlier parts of the adult life cycle. These rates provide evidence that across all age groups, participants are willing to answer sensitive questions. However, more work is needed to evaluate the responsiveness of adolescents and children to survey items about bereavement. To gain greater details, these items can be incorporated in the Youth Risk Behavior Surveillance System (YRBSS). YBRSS monitors six types of health-risk behaviors that contribute to the leading causes of death and disability among youth and adults.[32] These behaviors are sexual behaviors, alcohol and other drug use, tobacco use, unintentional injury and violence, unhealthy diet, and inadequate physical activity. Bereavement may be a factor increasing likelihood for these risky behaviors. The YRBSS population consists of representative samples of students typically in grades 9 - 12 and occurs every two years. YBRSS begins with school recruitment. School response rates range from 73% to 100%. Student response rates range from 60% to 88%. This makes YBRSS ideal for bereavement surveillance.
One challenge to the statistical use of these data is the potential for rapidly diminishing numbers in targeted subgroups. Analysts wanting to compare rates across categories of Social Determinants, Health Behaviors, and Quality of Life may not detect significant differences in the effects due to missing responses. These results show that imputation is a robust statistical method to overcome bias. This report compared prevalence estimates using two data scenarios – one without weighting and ignoring missing responses (panel) and the other using fully weighted with imputation techniques (MI). Each data scenario yielded prevalence estimates with small standard errors. One interpretation of the SE is that bereavement is sufficiently common within all subgroups. Bereavement rates from the panel data had smaller standard errors. However, when compared to MI, panel data either over- or underestimates bereavement rates. In a resource limited setting, the use of fully weighted and imputed data provides a better accounting of the numbers of affected persons and the resources needed for their care.
All the strengths and weaknesses of surveillance for recent bereavement can be seen in the analyses of bereavement and its possible association with binge drinking. Reduction in binge drinking rates – particularly for teens and young adults – is a target public health goal.[30] In BRFSS, missing responses are an issue for both items - binge drinking (11.07%) and bereavement (29.0%) Despite missing data, both panel and MI samples yield stable prevalence estimates. However, these prevalence rates are not identical. The panel overestimates bereavement prevalence by 3.49% and is associated with a 34.08% Relative difference in SE. This difference matters when the goal is counting the number needing care for alcohol abuse. The analyses with MI data did not show a gender difference in risk while panel data does suggest differences. Based on these results, analysts might be tempted to exclude women from binge drinking interventions because ‘Women are less likely to binge drink’. This could create a disparity in access to therapy for alcohol abuse by bereaved women. To avoid this bias, it is important to understand that bereavement can occur for anyone, and it is the unhealthy behavior that is the target of successful care. In short, any recently bereaved person can engage in binge drinking.
As far as is known, there are no prevalence estimates for the numbers of persons reporting recent bereavement in a 24-month period that can be used for comparison. Further field testing of the bereavement item is needed to replicate these results. Without comparison data, statistical strategies and their underlying assumptions are a critical starting point for this evaluation. Measuring this recent exposure accurately and precisely is required. Population prevalence of bereavement operates similarly to a flood safety risk assessment.[7] Like a flood, surveillance surveys measure bereavement within a specific time frame. Its contribution to excess numbers of persons with an associated injurious health behavior can be counted. In our demonstration of its application to binge drinking, the estimates show that 1,343,530 persons report binge drinking. Within the population of binge drinkers, there are 685,517 persons (51%) who are also recently bereaved. If this association is confirmed, then any strategy to reduce the prevalence of binge drinking also requires attention to recent bereavement. Bereavement also has well described short and long-term economic consequences.[33,34] Sometimes we forget that mortality creates orphans as well as widows. During childhood, death of a parent threatens health and economic security of surviving children well into their adult lives.[35,36,37] Bereavement has the potential to operate as an emerging risk factor leading to declines in current and future indices of population health.
5. Conclusions
The prevalence of bereavement in Georgia is 45.38%. Recent bereavement can be ascertained in a surveillance survey with high rates of response and small standard errors. Weighting combined with application of multiple imputation provides estimates useful for needs-based planning and costing. More field testing is required to replicate these results in other states, for younger individuals, and in subsequent years.
Author Contributions
Authorship must be limited to those who have contributed substantially to the work reported. Toni P Miles: Originator of concept, author, and interpretation of data; Changle Li: Author, originator of imputation techniques, and interpretation of data; Rana Bayakly, Moges Ido: Georgia Department of Public Health, coordinated data collection, created analytic dataset, reviewed, and approved interpretation. M Mahmud Khan: Collaborator on concept of bereavement and risk, interpretation of data.
Funding
The RRF foundation for aging provided support for the inclusion of the bereavement module in Georgia (https://www.rrf.org/).
Institutional Review Board Statement
All data usage protocols were approved by the Georgia Department of Public Health. All handling of BRFSS data were carried out in accordance with the Centers for Disease Control and Prevention guidance in collaboration with the University of Georgia. These include use of complex sampling weights, reporting of prevalence, and standard errors.
Informed Consent Statement
Informed consent was obtained from all participants during the telephone recruitment process by the Georgia Department of Public Health. There are no proxy interviews in this survey. BRFSS is anonymized, publicly available data.
Data Availability Statement
The Centers for Disease Control and Prevention contain BRFSS data and related guidance. Data from the Georgia Bereavement Module can be obtained from Rana Bayakly; RANA.BAYAKLY@DPH.GA.GOV (Georgia, Department of Public Health).
Acknowledgments
Deborah Carr, Boston University and, Joyal Mulheron, at Evermore (https://live-evermore.org/) for providing interim reviews of the results for prior reviews.
Conflicts of Interest
The authors declare no conflict of interest. The funders had no role in the design of the study; in the collection, analyses, or interpretation of data; in the writing of the manuscript; or in the decision to publish the results.
Appendix A
Table A1.
Variables used in this analysis, 2019 Georgia BRFSS, Unweighted.
| Variable | Complete Response, N (%) |
Missing Response, N (%) |
|||
|---|---|---|---|---|---|
|
Bereavement item*: Loss of family or friend in 2018 or 2019. |
5,206 (70.79) | 2,148 (29.21) | |||
| Demographics | |||||
| Gender | 7,354 (100.00) | 0 | |||
| SOGI§ | 5,443 ( 74.01) | 1,911 (25.99) | |||
| Age | 7,354 (100.00) | 0 | |||
| Race /ethnicity | 7,180 ( 97.63) | 174 ( 2.37) | |||
| Social determinants | |||||
| Educational attainment | 7,319 ( 99.52) | 35 ( 0.48) | |||
| Metropolitan Statistical Area, residence | 7,354 (100.00) | 0 | |||
| Employment status | 7,202 ( 97.93) | 152 (2.07) | |||
| Health Behaviors | |||||
| Physical activity in past month? | 6,780 ( 92.19) | 574 ( 7.81) | |||
| Smoking status | 6,847 ( 93.11) | 507 ( 6.89) | |||
| At least one drink of alcohol in past 30 days? | 6,796 ( 92.41) | 558 ( 7.59) | |||
| Multiple drinks on one occasion | 6,540 ( 88.93) | 814 (11.07) | |||
| Self-rated health | 7,330 ( 99.67) | 24 ( 0.33) | |||
| Physical Health not good, days in past month | 6,802 ( 92.49) | 552 ( 7.51) | |||
| Mental Health not good, days in past month | 6,799 ( 92.45) | 555 ( 7.55) | |||
| Complete information, 15 variables | 4,289 ( 58.32) | 3,065 ( 41.68) | |||
Note: ‘Don’t know’, ‘Refused’ and ‘Blank’ equal missing. *New 2019 BRFSS item ‘Have you experienced the death of a family member or close friend in the years 2018 or 2019? * SOGI§: Sexual Orientation and Gender Identity. Module 29, two questions ‘Which of the following best represents how you think of yourself? Do you consider yourself to be transgender? Health behaviors reflect Healthy People 2020 target areas described in https://www.healthypeople.gov/2020/topics-objectives ; Accessed April 11, 2021. For all items see 2019 BRFSS Questionnaire https://www.cdc.gov/brfss/questionnaires/index.htm; Accessed May 14, 2021.
Appendix B
Table A2.
Sex, Sex-at-Birth, and SOGI Questions of the BRFSS, by Year Sex Question (Demographics Section). Sex Question (Screening Section) 2019: Are you male or female?
Table A2.
Sex, Sex-at-Birth, and SOGI Questions of the BRFSS, by Year Sex Question (Demographics Section). Sex Question (Screening Section) 2019: Are you male or female?
| SOGI Optional Module 2018-2019: (For male respondents) Which of the following best represents how you think of yourself? 1 = Gay 2 = Straight, that is, not gay 3 = Bisexual 4 = Something else 7 = I don't know the answer 9 = Refused Ask if Sex= 1. (For female respondents) Which of the following best represents how you think of yourself? 1 = Lesbian or Gay 2 = Straight, that is, not gay 3 = Bisexual 4 = Something else 7 = I don't know the answer 9 = Refused Do you consider yourself to be transgender? 1 = Yes, Transgender, male-to-female 2 = Yes, Transgender, female-to-male, 3 = Yes, Transgender, gender nonconforming 4 = No |
Source: https://www.cdc.gov/brfss/data_documentation/pdf/BRFSS-SOGI-Stat-Brief-508.pdf . Accessed March 24, 2022.
References
- Smith KP, Christakis NA. Social networks and health. Ann. Rev. Sociology, 2008. https://doi.org:10.1146/annurev.soc.34.040507.13460.
- Allegra JC, Ezeamama A, Simpson C, Miles TP. Population-level impact of loss on survivor mortality risk. Quality of Life Res, 2015, . [CrossRef]
- Miles TP, Allegra JC, Ezeamama A, Simpson C, Gerst-Emerson K, Elkins J. In a longevity society, loss and grief are emerging risk factors for health care use: findings from the Health and Retirement Survey cohort aged 50 to 70 years. American J of Hospice and Palliative, 2016, . [CrossRef]
- Yang YC, Boen C, Gerken K, Li T, Schorpp K, Harris KM. 2016. Social relationships and physiological determinants of longevity across the human life span. Proc Nat Acad Sci, 2016, 113(3), 578–583. https://www.jstor.org/stable/26467429.
- Fadlon I, Nielson T H. Family Health Behaviors Amer Eco Rev, 2019. 109(9): 3162–3191 . [CrossRef]
- Verdery AM, Smith-Greenaway E, Margolis R, Dawa J. Tracking the reach of COVID-19 kin loss with a bereavement multiplier. 2020 PNAS 117 (30): 17695 – 17701. https://www.pnas.org/lookup/suppl/doi:10.1073/pnas.2007476117/-/DCSupplemental.
- Johnkman S, Jongejan R, Maaskant B. The use of individual and societal risk criteria within the Dutch flood safety policy – nationwide estimates of societal risk and policy applications. Risk Analysis, 2011 31:2 doi:10.1111/j.1539-6924.2010.01502.
- Rostilla M, Saarela JM. Time does not heal all wounds. J Marriage and Family 2011. doi:10.1111/j.1741-3737.2010.00801.x.
- National Mortality Follow-back Survey (NMFS), 1993, U.S. HHS, National Center for Health Statistics. ICPSR version. Hyattsville, MD: U.S. Center for Disease Control and Prevention, 1999.Ann Arbor, MI: Inter-university Consortium for Political and Social Research [distributor], 2005. https://www.icpsr.umich.edu/web/ICPSR/studies. Accessed March 27, 2022.
- Health and Retirement Survey (HRS) Sample sizes and response rates. 2017. Accessed March 22, 2022. https://hrsonline.isr.umich.edu/sitedocs/sampleresponse.pdf.
- Simpson C, Allegra JC, Ezeamama AE, Elkins J, Miles TP. The Impact of Mid-and Late-Life Loss on Insomnia. Family and Community Health. 2014. 37(4): 317-326. https://www.jstor.org/stable/48515394.
- Ezeamama AE, Elkins J, Simpson C, Smith S, Allegra JC, Miles TP. Indicators of resilience and healthcare outcomes: findings from the 2010 health and retirement survey. Qual Life Res. 2016. 25: 1007 – 1015. [CrossRef]
- Roelfs DJ, Shorb E, Currelic M, Clemowd L, Burge MM, Schwartzf JE., Eran Shor, Misty Curreli, Lynn Clemow, Matthew M. Burg, Joseph E. Schwartz, 2012. Widowhood and mortality: A meta-analysis and meta-regression. Demography. 2012. 49(2): 575–606. https://doi:10.1007/s13524-012-0096-x.
- BRFSS Users Guide. 2013 https://www.cdc.gov/brfss/data_documentation/pdf/UserguideJune2013.pdf. Accessed August 8, 2022.
- Rubin DB. 1976. Inference and missing data. Biometrika. [CrossRef]
- Rubin DB. 2004. Multiple imputation for nonresponse in surveys. John Wiley & Sons, Ltd.ISBN: 978-0-471-65574-9.
- Kenward MG, Carpenter J. 2007. Multiple imputation: current perspectives. Statistical Methods Medical Research. 2007 . [CrossRef]
- Horton NJ, Lipsitz SR. Multiple imputation in practice: comparison of software packages for regression models with missing variables. The American Statistician. 2001. [CrossRef]
- StataCorp. 2017. Stata Statistical Software: Release 15. College Station, TX: StataCorp LLC.
- White IR, Royston P, Wood AM. Multiple imputation using chained equations: issues and guidance for practice. Statistics in Medicine. 2011. [CrossRef]
- Carpenter A, Kenward M, Multiple imputation and its application. John Wiley & Sons, Ltd. 2012. [CrossRef]
- Penn DA. Estimating missing values from the general social survey: an application of multiple imputation. Department of Economics and Finance Working Paper Series, 2007. JEL Categories: A10, C42.
- 2019 Data quality report. https://www.cdc.gov/brfss/annual_data/2019/pdf/Complex-Smple-Weights-Prep-Module-Data-Analysis-2019-508.pdf. Accessed March 25, 2022.
- Kim JK, Brick MJ, Fuller WA, Kalton G On the basis of the multiple imputation variance estimator in survey sampling, J Royal Statistical Soc: Series B 68: 509-521. 2006. https://www.jstor.org/stable/3879288.
- Quartagno M, Carpenter JR, Goldstein H. Multiple imputation with survey weights: A multilevel approach. J Survey Statistics and Methodology, 2020. 8:963 – 989. https://doi:10.1093/jssam/smz036.
- Li C. Little’s Test of Missing Completely at Random. The Stata Journal. 2013;13(4):795-809.
- Clopper CJ, Pearson ES. The Use of Confidence or Fiducial Limits Illustrated in the Case of the Binomial. 1934. https://www.jstor.org/stable/2331986.
- Korn EL, Graubard BI. Analysis of Health Surveys. Wiley Series in Probability and Statistics. ISBN-13: 978-0471137733.
- National Center for Health Statistics. Health, United States, 2019. Hyattsville, MD. 2021. https://dx.doi.org/10.15620/cdc:100685.
- Healthy People 2030, https://health.gov/healthypeople/objectives-and-data/about-objectives.
- Rizzo VM, Kintner E. The utility of the behavioral risk factor surveillance system (BRFSS) in testing quality of life theory: an evaluation using structural equation modeling, Qual of Life Res, 2013. 22(5): 987-995, Stable URL: https://www.jstor.org/stable/24724283.
- Youth Risk Behavior Surveillance System (YRBSS) https://www.cdc.gov/healthyyouth/data/yrbs/feature/index.htm.
- Héraud-Bousquet, V., Larsen, C., Carpenter, J.. Practical considerations for sensitivity analysis after multiple imputation applied to epidemiological studies with incomplete data. BMC Med Res Meth. 2012 . [CrossRef]
- Gillen M, Kim H. Older women and poverty transition: consequences of income source changes from widowhood. J Applied Gerontology. 2009. [CrossRef]
- Li J, Vestergaard M, Cnattingius S, Gissler M, Bech BH, Obel C, Olsen J. Mortality after parental death in childhood: a nationwide cohort study from three Nordic countries. PloS Med. 2014. [CrossRef]
- Brent DA, Melhem NM, Masten AS, Porta G, Payne NW. Longitudinal effects of parental bereavement on adolescent developmental competence. J Clinical Child & Adolescent Psyc. 2012. [CrossRef]
- Feigelman W, Rosen Z, Joiner T, Silva C, Mueller AS. Examining longer-term effects of parental death in adolescents and young adults: evidence from the national longitudinal survey of adolescent to adult. Death Studies. 2017. https://doi.org10.1080/07481187.2016.1226990.
- Weaver DA. Parental mortality and outcomes among minor and adult children. Pop Rev 2019. [CrossRef]
Figure 1.
Response rates to bereavement item: 'Have you experienced the death of a family member or close friend in the years 2018 or 2019 ?'. Note: 2019 Georgia BRFSS Field Survey. Response rate for bereavement screening module of 70.8%= 5206 module respondents / 7534 core respondents. 4,289 persons responded to all items used in these analyses (56.9 %). Response rates to the bereavement item within subgroups by Demographic, Social Determinants of Health, Health Behaviors, and Quality of Life. Abbreviations: SOGI - Sexual orientation Gender identity; NH - Non-Hispanic; SRH - Self rated health; MC - Metropolitan County. Source: 2019 Data quality report. https://www.cdc.gov/brfss/annual_data/2019-sdqr-508.pdf Accessed March 25, 2022.
Figure 1.
Response rates to bereavement item: 'Have you experienced the death of a family member or close friend in the years 2018 or 2019 ?'. Note: 2019 Georgia BRFSS Field Survey. Response rate for bereavement screening module of 70.8%= 5206 module respondents / 7534 core respondents. 4,289 persons responded to all items used in these analyses (56.9 %). Response rates to the bereavement item within subgroups by Demographic, Social Determinants of Health, Health Behaviors, and Quality of Life. Abbreviations: SOGI - Sexual orientation Gender identity; NH - Non-Hispanic; SRH - Self rated health; MC - Metropolitan County. Source: 2019 Data quality report. https://www.cdc.gov/brfss/annual_data/2019-sdqr-508.pdf Accessed March 25, 2022.
Disclaimer/Publisher’s Note: The statements, opinions and data contained in all publications are solely those of the individual author(s) and contributor(s) and not of MDPI and/or the editor(s). MDPI and/or the editor(s) disclaim responsibility for any injury to people or property resulting from any ideas, methods, instructions or products referred to in the content. |
© 2023 by the authors. Licensee MDPI, Basel, Switzerland. This article is an open access article distributed under the terms and conditions of the Creative Commons Attribution (CC BY) license (http://creativecommons.org/licenses/by/4.0/).
Copyright: This open access article is published under a Creative Commons CC BY 4.0 license, which permit the free download, distribution, and reuse, provided that the author and preprint are cited in any reuse.


