
Submitted:
08 March 2023
Posted:
09 March 2023
You are already at the latest version
Abstract
The province of Jaén (Andalusia, Spain), despite being declared the European territory with the largest number of defensive constructions (castles and fortifications), has few conservation plans, with many remains included on the Red List of Spanish Heritage lying abandoned. This presents a problem for the conservation of the landscape and the optimal use of the province’s tourism potential. Through the study case of Magaña hamlet two actions are proposed to alleviate this situation: The creation of an archaeological and environmental risk chart with which to answer such questions as “How have climate change, anthropic alterations and environmental charac-teristics affected the state of conservation of certain heritage sites?” and to put forward proposals for improving their protection using as a basis digital and technological tools, such as remote sensing (SAR), taking advantage of data from the Sentinel 2A and 2B satellites, HBIM, RPAS and GIS. To foster the promotion of smart tourism by digitalising and virtualising tourist routes and archaeological remains by building a Smart Tourism App for mobile devices. Finally, public administrations will be apprised of the need to implement a conservation policy for cultural as-sets and their surroundings in a simple, quick and cost-effective manner.
Keywords:
SAR
; Climate Change
; GIS
; Archaeological Chart
; Risk Assessment
; Digital Humanities.
; Magaña
1. Introduction
In this article [1] we present a theoretical approach and a pilot study case designed to the integration of the latest digital technologies applied to environmental protection and their dissemination aimed to providing twin protection for heritage assets in the heritage and environmental spheres. Through the DIGITALESCAPE project, we will develop an innovative and experimental proposal oriented towards a twin study path. Firstly, we will analyses how climate change, anthropic alterations and environmental characteristics have affected the state of conservation of a certain historical-cultural heritage assets, the extent of their level of deterioration, and the measures to be taken to halt this. Secondly, we will look at how to highlight the value this heritage for tourism use and raise environmental awareness of it using digital tools. This proposal is directly linked to United Nations Sustainable Development Goal (SDG) 15. To achieve the aforementioned objectives, we will use the latest advances in digital and technological tools, such as remote sensing (SAR), HBIM, RPAS flights, GIS and the development and the construction of a Smart Tourism App for mobile devices. To do this, we will take advantage of data provided by the European Space Agency (ESA) Copernicus mission, thanks to the constellation of Sentinel satellites (accessible free of charge), and the application of the ISO 28000 and ISO 31000 International Risk Management Standard.
Remote Sensing applied to Cultural Heritage has been proved to be a high-quality tool for conservation as numerous projects demonstrates i.e. the Endangered Archaeology in the Middle East & Nort Africa (EAMENA) project [2] based on Universities of Oxford, Leicester and Durham, use satellite imagery to identify and record new archaeological sites and their landscapes. On the other hand, other examples of the potential of the techniques that will be used here are the studies carried out at Angkor using LiDAR data [3], those developed for the Italian CNR to avoid looting from space [4] and other as the research carried out at Belize where LiDAR data has been used for detecting settlements and modified landscape [5,6] or the job carried out by Fiz et al. using aerial pohotogrammetry with UAV [7]. Also, Copernicus mission data have been proved to be a powerful tool for monitoring, protection and management of Cultural and Natural Heritage [8].
The area under study, to which the methodology contained in this project will be applied, is the province of Jaén in the northern part of the Andalusia region in southern Spain (Figure 1). This province has been declared the territory with the greatest number of defensive constructions (castles, fortifications, towers, etc.) in Europe, more than 400, although there could be more. Currently, nineteen structures are included on the aforementioned Heritage Red List [9]. The list does not reflect all the structures that are in a ruinous state. Therefore, the number of these is greater, as many are at risk and there are few measures in place for their protection and conservation. Many are completely abandoned. Completing this bleak panorama, we have other civil elements associated with the history of the territory and its landscape that are in an advanced state of ruin (localities, villages, farmhouses, etc.) that have been included on the Spanish Heritage Red List [9]. This situation constitutes a problem for the province’s landscape conservation and the optimization of its tourism potential. We believe that to solve or alleviate it, it is necessary to address a series of proposals for change and transformation. In this respect, the symbiosis between archaeological remains, localities and environmental characteristics cannot be approached independently, but rather in combination. We will therefore apply a multidisciplinary methodology adapted to each case and the different scales of analysis, in order to deal with the issues raised. The proposed methodology, as we will see in detail below and in the proposed study case, includes an approach based on remote sensing combined with terrestrial archaeological surveys and other disciplines, such as geology, musicology, archiving and gender studies, to cover all the mentioned sections.
The areas chosen to carry out this study are the Sierra Sur de Jaén and the Sierra Morena. Given this situation, we decided to focus our research on five specific case studies that reflect the situation described in two different areas of Jaén province and previously experiences in remote sensing analysis of archaeological remains inside Sierra Morena such us Buenos Aires hamlet (on press) and Magaña hamlet as a pilot study case, both in Sierra Morena. Both study areas reflect the same idea, the transformation of the territory through projects for the foundation of new populations. However, they are based on two different historical realities: the border area in medieval and modern times in the Sierra Sur and the New Populations in an area that was depopulated in the second half of the 18th century. From the Sierra Sur we chose the sites of Castillo de Susana, Castillo de Otiñar and Castillo de Arenas, while from Sierra Morena we selected the cases of villages in the New Populations, such as Buenos Aires and Magaña (Figure 2).
To understand the reasons behind the foundation of new populations in each area, we must first take a brief, concise historical approach. Our history dates back to the hinge decades of two centuries, between the years 1489 and 1539, during the reigns of the Catholic Monarchs, Juana I of Castile, Fernando the Catholic and Emperor Carlos V. The aim of the Catholic Monarchs in 1489 was to found population centres along the communication axis between the Christian territories and the last Muslim redoubt, the town of Granada. These territories are known as the Entredichos (Interdictions), a reference to the fact that they occupied territory "between dicho (said) kingdom of Jaén" and "dicho (said) kingdom of Granada".
These populations would be dispersed between the Castle of Otiñar and the Eliche River. It may have been the rapid conquest of the town of Granada in 1492 that led to the abandonment of the project, although there was a later attempt, also unsuccessful, in 1494. Queen Juana I of Castile echoed these proposals and signed a royal decree on 17 March 1508, in which she expressed her support by setting the number of foundations and possible locations in the Sierra Sur de Jaén. It was made up of a series of castles, towers, farmhouses, isolated houses, villages, localities, towns and villages that reached its peak with the foundation of the towns of Valdepeñas de Jaén, Los Villares de Jaén, Mancha Real and Campillo de Arenas in the surroundings of the abandoned and ruined castles of Susana, Otiñar and Arenas.
Castillo de Susana (Valdepeñas de Jaén)
In the area of Castellón, Cerro de Castellón, near the Susana River, we find Susana Castle, which was conquered by Fernando III the Saint and donated to the Order of Calatrava. According to Jimena Jurado, Susana Castle was conquered by the master of the Order of Calatrava in 1238. It may also have had a Muslim population, judging by the pottery remains and a necropolis. It was declared an Asset of Cultural Interest on 29 June 1985 (Figure 3).
Castillo de Otiñar (Los Villares de Jaén)
In 1228 Fernando III laid waste to the Otiñar area, the site of a fortification of Muslim origin and the town of Otiñar Viejo. Subsequently in 1246, he built a castle on its ruins. The geostrategic position was especially notable for its proximity to the Nasrid lands. During the 14th century, a population in the form of a village was founded next to the castle, but with a mayor's office and a church. In the Ordinances of 1464, the mayor of Otíñar was assigned 8,000 maravedís a year. From 1492 it lost its geostrategic potential and little by little it was abandoned. In 1505 Otíñar was described as a town surrounded by a good lime and pebble wall, with a fortress. It is currently in ruins. It has a main tower, defensive towers, a cistern and some rooms with ogival vaults. The village or town of Otiñar in the vicinity of the castle is difficult to locate. Juana I of Castile’s repopulation project in 1508 affected Otiñar, where it was planned to establish a population. The project, as we will see, did not become a reality until the time of Emperor Carlos V. The site was protected under the generic declaration of the Decree of 22 April 1949 and declared Spanish Historical Heritage under Act 16/1985 (Figure 4).
Castillo de Arenas (Campillo de Arenas)
Located on the hill known as Cerro del Castillo de Puerta Arenas in the Sierra de Alta Coloma. It has remains from a first phase (9th - 11th centuries) perhaps of Almohad origin. The second construction phases date from the 14th - 15th centuries and comprise up to three enclosures with towers, walls, gates, a moat, cisterns, a chapel, etc. It was in an excellent geostrategic position on the road between Jaén and Granada. The flags that flew over the castle alternated between those of the Christian kings and kings of Granada, until it was definitively conquered in 1486 by Fernando the Catholic. During the reign of the Catholic Monarchs, there were already projects to repopulate the area. Juana I of Castile proposed the foundation in 1508 of a town in Campillo, which was finally established in the time of Carlos V and called Campillo de Arenas. It is categorised as an Asset of Cultural Interest and was declared Spanish Historical Heritage on 22 June 1993 (Figure 5)
Regarding the other study area, Sierra Morena, the founding of the New Populations in Sierra Morena and Andalusia during the 18th century was the reformist project par excellence. It pursued two premises: agricultural and manufacturing development and control and dominance of the territory.
The cartography generated as a result of the decision to found the New Populations is currently being reviewed. New hypotheses are being put forward, such as the fact that some maps and plans were used by various hands and at different times, gradually adding extremely valuable layers of geo-historical information. These have remained hidden until now due to the lack of legends or notes attached to the document [2].
Aldea de Buenos Aires in La Feligresía de Aldeaquemada
The history of Aldeaquemada (Jaén) began in 1767. It was founded by order of King Carlos III as one of the new towns in Sierra Morena and Andalusia. Its legal status was that of a feligresía or parish. It consisted of the central town, Aldeaquemada, and three neighbouring villages, Aldea de la Cruz, Aldea de Buenos Aires (also called Aldehuela) and La Tamujosa, all within its jurisdictional boundaries.
A succession of historical events led to the gradual demise of each of the villages and today their remains are difficult to identify.
The abandonment of Aldea de Buenos Aires came about basically due to the attraction of nearby Aldeaquemada. We have documentation that cites other reasons, such as the poor construction quality and the torrential rains that destroyed many buildings.
Hypothetically, Aldea de Buenos Aires was founded in 1775. The first information about the collapse of houses due to the poor quality of the building materials was also received from 1784, with new collapses confirmed in 1786. During 1788, controlled demolitions of damaged structures were carried out. From 1789, the decision was taken to gradually abandon the village and relocate the settlers in Aldeaquemada, although some families resisted leaving the village.
Aldea de Buenos Aires (1775-1793) on the present-day Navazo road was also called Aldea Martín in 1775, after the stream that passes nearby, and either Aldehuela or Ruinas de Aldehuela. Its building materials were reused in Aldeaquemada and today only remnants covered with vegetation remain (Figure 6). The frailty of the constructions referred to in the documentary sources clashes with the remains that can still be seen today: the structures have wide, solid walls in which in the corners still give an idea of their previous splendour.
The deterioration of the buildings was presumably due more to a combination of weak roofs, inclement weather and poor materials than to problems in the wall structures. Its high location affords impressive views of Aldeaquemada and the surrounding mountains.
Aldea de Magaña in the Feligresía de Santa Elena.
The feligresía or parish of Santa Elena was made up of part of the districts of Vilches, Baños (both in Jaén) and El Viso del Marqués (La Mancha). Next to the forgotten Los Palacios inn was the chapel of Santa Elena or Vera Cruz, dedicated to the victory of Alfonso VIII in the Battle of Las Navas in Tolosa in 1212. These two buildings served as a starting point for the village and the orientation of its streets. Santa Elena was located on the old Muradal road, on a branch that led to Vilches, and was separated from the Puerto del Rey royal road, where two new population points were founded in 1768: Miranda del Rey and Magaña, both taking old inns as a reference. Finally, the construction of the new section of the Despeñaperros pass on the same Muradal road between 1779 and 1783 led to the progressive depopulation of both villages as the inhabitants moved to Santa Elena, on the route of the new royal road designed by the military engineer Carlos Lemaur.
The parish was finally constituted with the addition of the village of Magaña (Figure 7). This situation continued until 1782, when the status of the parish was once again reduced to that of a village, becoming once again, together with Magaña, part of Santa Elena. The main reasons would have been the construction of the new royal road and the growing depopulation. The loss of colonists from Magaña was progressive, although it was never completely abandoned.
At the end of the 18th century, the parish was made up of Santa Elena and three villages: Miranda del Rey, Magaña and Venta Nueva. Magaña resisted with a small group of inhabitants, who remained in the area until the 1960s, after which it was completely abandoned. Today it lies in ruins (Figure 7).
The case studies referred to here are located in non-urban country areas. Some are classified as natural parks, landscapes of interest or protected areas, etc. They are difficult to access, both for vehicles (of any type) and people. As can be seen in Figure 2 to Figure 6, the chosen sites are in medium and/or high states of ruin or abandonment. There are no musealised and interpretive spaces, information panels, restored or consolidated architectural elements, risk prevention measures for visitors, etc.
Thus, among the objectives of this proposal is the creation of an archaeological and environmental map that reflects the current state of the heritage assets. It will also contain the factors that have caused their deterioration, and a series of measures proposed, on the one hand, to prevent further deterioration and, on the other, to improve protection of the assets. The purpose of this environmental charter is ambitious, since its intention is to detect the negative environmental effects on these places and their surroundings in order to propose solutions, such as native reforestation, runoff channeling, etc. It also aims to promote of smart tourism by digitalizing the ruins and the surroundings of the buildings, as well as the virtualization of tourist routes. At the same time, together with the definition of the effects on the heritage assets, we aim to lessen the impact of visitors and invite them to participate in the environmental questions that affect both the assets and their surroundings.
2. Materials and Methods
Given the multidisciplinary nature of the project, in order to achieve the aforementioned objectives, we consider it necessary place them in groups, depending on the thematic area to which they are addressed. Therefore, we have classified them in three main groups of objectives: Environmental, Historical-Archaeological and Digital Transition (Figure 8).
2.1. Environmental objectives
2.1.1. Preparation of an Environmental Risk Map
The aim of this objective will be to clearly identify which are the damages suffered by Cultural Heritage sites aforementioned and their surrounding landscape. To reach this objective we propose the subsequent sub-objectives:
- Characterization of the geological characteristics and recent and current natural dynamics of the environment as well as for the aforementioned Cultural Heritage sites by analyzing Spanish geological charts freely available [10], soil samples analysis and their enhancement by presenting geological and landscape information with a view to their exploitation for tourism.
- Definition and application of objective indicators for assessing the state of conservation of the natural environment, evidence of deterioration, foreseeable impacts due to the enhancement of the natural space, and present geological risks, both for the elements it is aimed to highlight and for the people who visit the sites. To carry out this objective is mandatory to consider the principles stated by the Nature and biodiversity laws by European Commission [11] that will allow to clearly identify how natural environment is being affected by climate change and human activity and how consequently cultural heritage is being affected.
2.1.2. Identify the climate characteristics
- Analyzing SAR time series data from 80’s till nowadays will allow to understand the climate dynamics of the area as well as identify changes in landscape. This objective is clearly interrelation with subobjective 2.1.1.a. Thanks to their combined interpretation we could reach a correlation between geology and climate characteristics, clearly identifying the affections caused by climate change.
- Considering the aforementioned objectives, we will prepare a thematic cartography reflecting all the aspect related with climate change on the area that affect the environment and Cultural Heritage. This thematic cartography will be fundamental to clearly understand environmental dynamics and its diffusion.
2.2. History and archaeology objectives
One must be in mind that this is an hollistic project on which we are analysing who climate change affect to Cultural Heritage and we also must provide information about historical context so we have designed 3 sub-objetives focused in the conservation of the archaeological remains and it difussion.
- Build and develop a Smart Tourism App with the data provided thanks to the consecution of the previously stated objectives to make easier the diffusion of the results obtained and consciousness-raising about how human activity and climate change affect the environment and consequently the Cultural Heritage.
- Generate data to provide content for the HBIM that will allow to create a conservation plan, allowing to monitor the state of the Cultural Heritage along time, also it will allow to the virtual diffusion of the remains.
- As a transversal objective and thanks to the great type of information sources that we are going to use we understand that the visibility of women must be reflected with information during the historical development of the Cultural Heritage as well as using inclusive language
2.3. Digital transition objectives
Lastly, during the design of this project we have taking in mind the adaptacion of the methodology to the new ones that are more efficent and adpats better to our necessities. So online with principles we have planned the next objectives.
-
Produce HD cartography by using latest Remote Sensing data. The sources that will be used are:
- Already made Digital Terrain Model (DTM) available from IGN [12]
- LiDAR data: This kind of data will allow us to obtain information about areas where the vegetation cover is high, so this will allow to create a high-resolution Digital Elevation Model of the ground and to analyze the kind of vegetation and its status. This also will allow to combine information about the health of the vegetation with those obtained from Satellite Imagery data.
- Orthophotography made by drone will allow to obtain a high-quality documentation about the archaeological remains and their surroundings, allowing to create a base on which visual analysis could be done in laboratory, reducing but not eliminating field work to evaluate the conservation status.
- Designing and building of 3D models and use of HBIM. This objective is directly related with 2.2.b.
- Online GIS. The diffusion on this project is fundamental so we have stablished this objective to diffuse the results of this project between a most specialized public too, in this case the user more interested in specific aspect could see the data in an online viewer as Potree [13] that will allow to go deeper into the research carried out.
3. Methodology
The methodology we propose has been designed taking into account its optimization for the achievement of the objectives in their three aspects. It is, therefore, a truly multidisciplinary and complex project (Figure 9).
3.1. Data acquisition
This phase is oriented towards obtaining all the publicly available data that will be used during the project. They range from the environmental objectives (climatological, geological, etc.) to the geographical, historical and archaeological objectives (conservation, restoration, orthophotography, historical cartography, LiDAR and SAR data, printed and manuscript documentary sources, travel literature, historical geographical descriptions, archaeological finds, etc.); even digital ones. They are all available from various archives, libraries, digitized collections, repositories, national and international institutional websites, etc.
To facilitate their reuse, as well as access to the compiled documentation, as far as possible we will use free software, such as QGIS, a GIS whose power and expandability through plugins adapted to each need will allow us to process the vast majority of the data expected in this project [14,15], such as LiDAR [16] , SAR data [17], MDE analysis [18], etc. In some cases, for example for the creation of 3D models, it will be necessary to use proprietary software such as Bentley Context Capture or Autodesk REVIT.
3.2. Geographic, historic and artistic data analysis
For the analysis of these data and especially those dedicated to the roles of women throughout the Muslim, Christian and modern periods (12th - 18th centuries), applied history and quantitative and qualitative history methodologies and Digital Humanities tools [3,4,5] will be used to explain how to apply historical knowledge to digital tools. Specifically, and in the case of the study of the surroundings of the castles of Campillo, Otiñar and Susana, and their respective new Renaissance towns (Campillo, Los Villares and Valdepeñas), the available medieval documentary collections will be studied, as well as the 16th-century land distribution books, notarial protocols, etc. For the case studies of the villages of Buenos Aires and Magaña, we will basically analyse the 16th-century libros de repartimiento (land distribution records) of the governor Ondeano (from 1780) and the cartographic series of Ampudia and Valdés (1792-1797).
3.3. Description and evaluation of cultural property state of conservation
This part of the project is essential for setting the guidelines to follow in future actions in the field of restoration and conservation. We intend to draw up a protocol for each case study that will serve as a base document for future action proposals and master plans. In order to systematise data collection, with the aim of increasing its reproducibility and unifying criteria, a table of alterations will be prepared, in which the various forms of deterioration affecting the case studies will be examined. These include biodeterioration due to animal, vegetable or microorganism causes; chemical or contaminant damage; anthropogenic deterioration or vandalism; and deterioration caused by environmental actions or natural disasters. For their correct identification, it is important to take samples and perform laboratory analyses of the various factors causing biodeterioration. For this purpose, a taxonomic classification will be made using visual observation techniques through a stereoscopic binocular loupe, an optical microscope, a scanning electron microscope, and a transmission electron microscope.
3.4. Inclusion and accessibility
These are fundamental aspects to consider in the design of the proposed smart tourism app and it would be appropriate to begin with a brief conceptual clarification. Taking the words of Llorenç Prat [19], the concept of Cultural Heritage “…understood as everything that is socially considered worthy of conservation regardless of its utilitarian interest. Of course, this concept also covers what is commonly known as natural heritage, to the extent that it deals with culturally selected natural elements and ensembles”.
Cultural heritage can also be defined from a humanistic and relational perspective, assuming that it is people who bestow value on goods. This brings us closer to the concept of diversity, understood as a wide range of people, each with their own characteristics. This could be due to their ways of thinking, acting, feeling, proceeding, being [20] or to physical or psychological limitations. In short, diversity is conceived as a continuum in which we are all included. Therefore, as we have seen, accessibility needs are diverse and vary throughout life. We all benefit from measures aimed at accessibility and inclusion that seek better physical, cognitive and sensory access. Therefore we will develop measures for cognitive and sensory accessibility, gender inclusion and effective accessibility [21,22], UNE 153101:2018 EX standard, and Accessibility Observatory [23]
3.6. Aerial orthophotography and historical cartography
For the analysis of the five proposed archaeological sites we will use both existing historical cartography and orthophotography, which will facilitate the characterisation of the sites to be studied. With the LiDAR data provided by the IGN download centre [12], we will generate Digital Terrain Models (DTM). Although their spatial resolution is relatively low (0.5 points/m2), analyzed with the correct algorithms and software, such as SAILORE [24] or RVT [25] respectively, based on GIS, they can provide us with valuable information regarding the original plan of certain archaeological remains that, due to their state of conservation and the identification of new aspects in the spatial distribution, have previously gone unnoticed. This type of data is especially useful in areas covered by vegetation[25,26,27,28].
3.6. Analysis of satellite data time series
The SAR data will be used to monitor the Sustainable Development Goals (SDG), in our specific case, Number 15, Life of Terrestrial Ecosystems, recognised in Article 76 of the 2030 Agenda for Sustainable Development, approved by the United Nations General Assembly in 2015. In the analysis we will use the data provided by the European Commission’s Copernicus space programme, the objective of which is the surveillance of our planet through earth observation and monitoring, including geographic information on land cover, land use and temporal changes from the 1970s to the present [29]. Specifically, for the study and understanding of the climate dynamics over time in the areas under study, we will use the indicators and indices on the control and prediction of climate change that can be consulted in the Climate Change Service [29], data from the CORINE Land Cover (CLC) project on large-scale land occupation, and on a national level we will use the data contained in SIOSE, PNOA and LiDAR and reference geographic information, such as IGR Hydrography and IGR Populations, which are part of the local component of the Copernicus programme. All of them are free to access.
The usefulness of this type of data for the discovery and exploration of archaeological sites has been demonstrated since the 1980s in studies carried out in both tropical and subtropical environments [30], as well as in arid areas [31], or more recently in the Chinese city of Luoyang [32]. On the other hand, its use for the study of climate change presents some advantages, since this type of SAR image analysis applied to the study of the alterations produced by humans in their immediate environment is becoming a basic technology to combine in different types of interventions related to cultural heritage [33]. In some cases, such studies have revealed hitherto hidden characteristics in palaeo-landscapes by registering differences in the refractance produced by archaeological remains in the ground and vegetation [34].
3.8. Geomatics and Topography
Their purpose in this project will be to georeference the data collected with drone flights, the realization of topographic surveys in areas of special interest and the preparation of GIS, both of the current landscape and applied to the historical cartography. Thanks to their use, a thematic cartography will be drawn up with already existing data and a new one will be created to respond to the questions that arose during the development of the project. These include the historical evolution of the landscape in the areas under study and the effects caused by human beings, etc. This will allow us to understand the climatic behaviour of the studied areas, as well as to advance our knowledge of the structure of some of them.
3.9. Geology
The approach to its study will be divided into three phases:
- Data phases.
- Laboratory and field work: analysis of the available geological information (geological maps, reports, scientific publications).
- Field work (geological cartography, lithological characterization of natural geological dynamics); geological risk analysis (erosion, landslides, floods, earthquakes); analysis of anthropogenic impacts on the geological environment (runoff modification, waste contamination, changes in topography due to land use, etc.); definition and application of indicators: geodiversity; geological heritage; risks; present and expected impacts of the proposed intervention; and the preparation of material for the dissemination of geological information for tourist use: maps, graphs, texts, panels, etc.. Integration of the material in digital applications.
3.10. Drone flights
A drone flight has been planned for each of the five case studies. They have been divided into two blocks: the methods related to field studies and the actual flights.
There are numerous cases in which the drone has proven to be a highly effective tool both for obtaining aerial orthophotography and for creating 3D models of heritage elements [35]. Thanks to their versatility, various types of sensors can be mounted to facilitate data collection, increase spatial resolution, and reduce time and cost, which indirectly reduces pollution.
We will use the data obtained from the five scheduled flights to make the 3D models [6,15,34,36] (Figure 10). The purpose will be to establish a three-dimensional base that will allow us to use the BIM methodology, identifying both the construction aspects and the effects caused by inclement weather/climate[37,38,39,40], which need to be dealt with, as well as to work on the creation of a future smart tourism app for mobile devices. It will be essential to create a personalized cartography. To this end, high-resolution orthophotography of the areas under study has been planned. This will allow the analysis of details of the environment that would otherwise be lost, as well as a detailed study of the conditions documented in the asset. Thanks to this high-resolution model, treatments can be planned to alleviate its deterioration, as well to analyse its evolution over time.
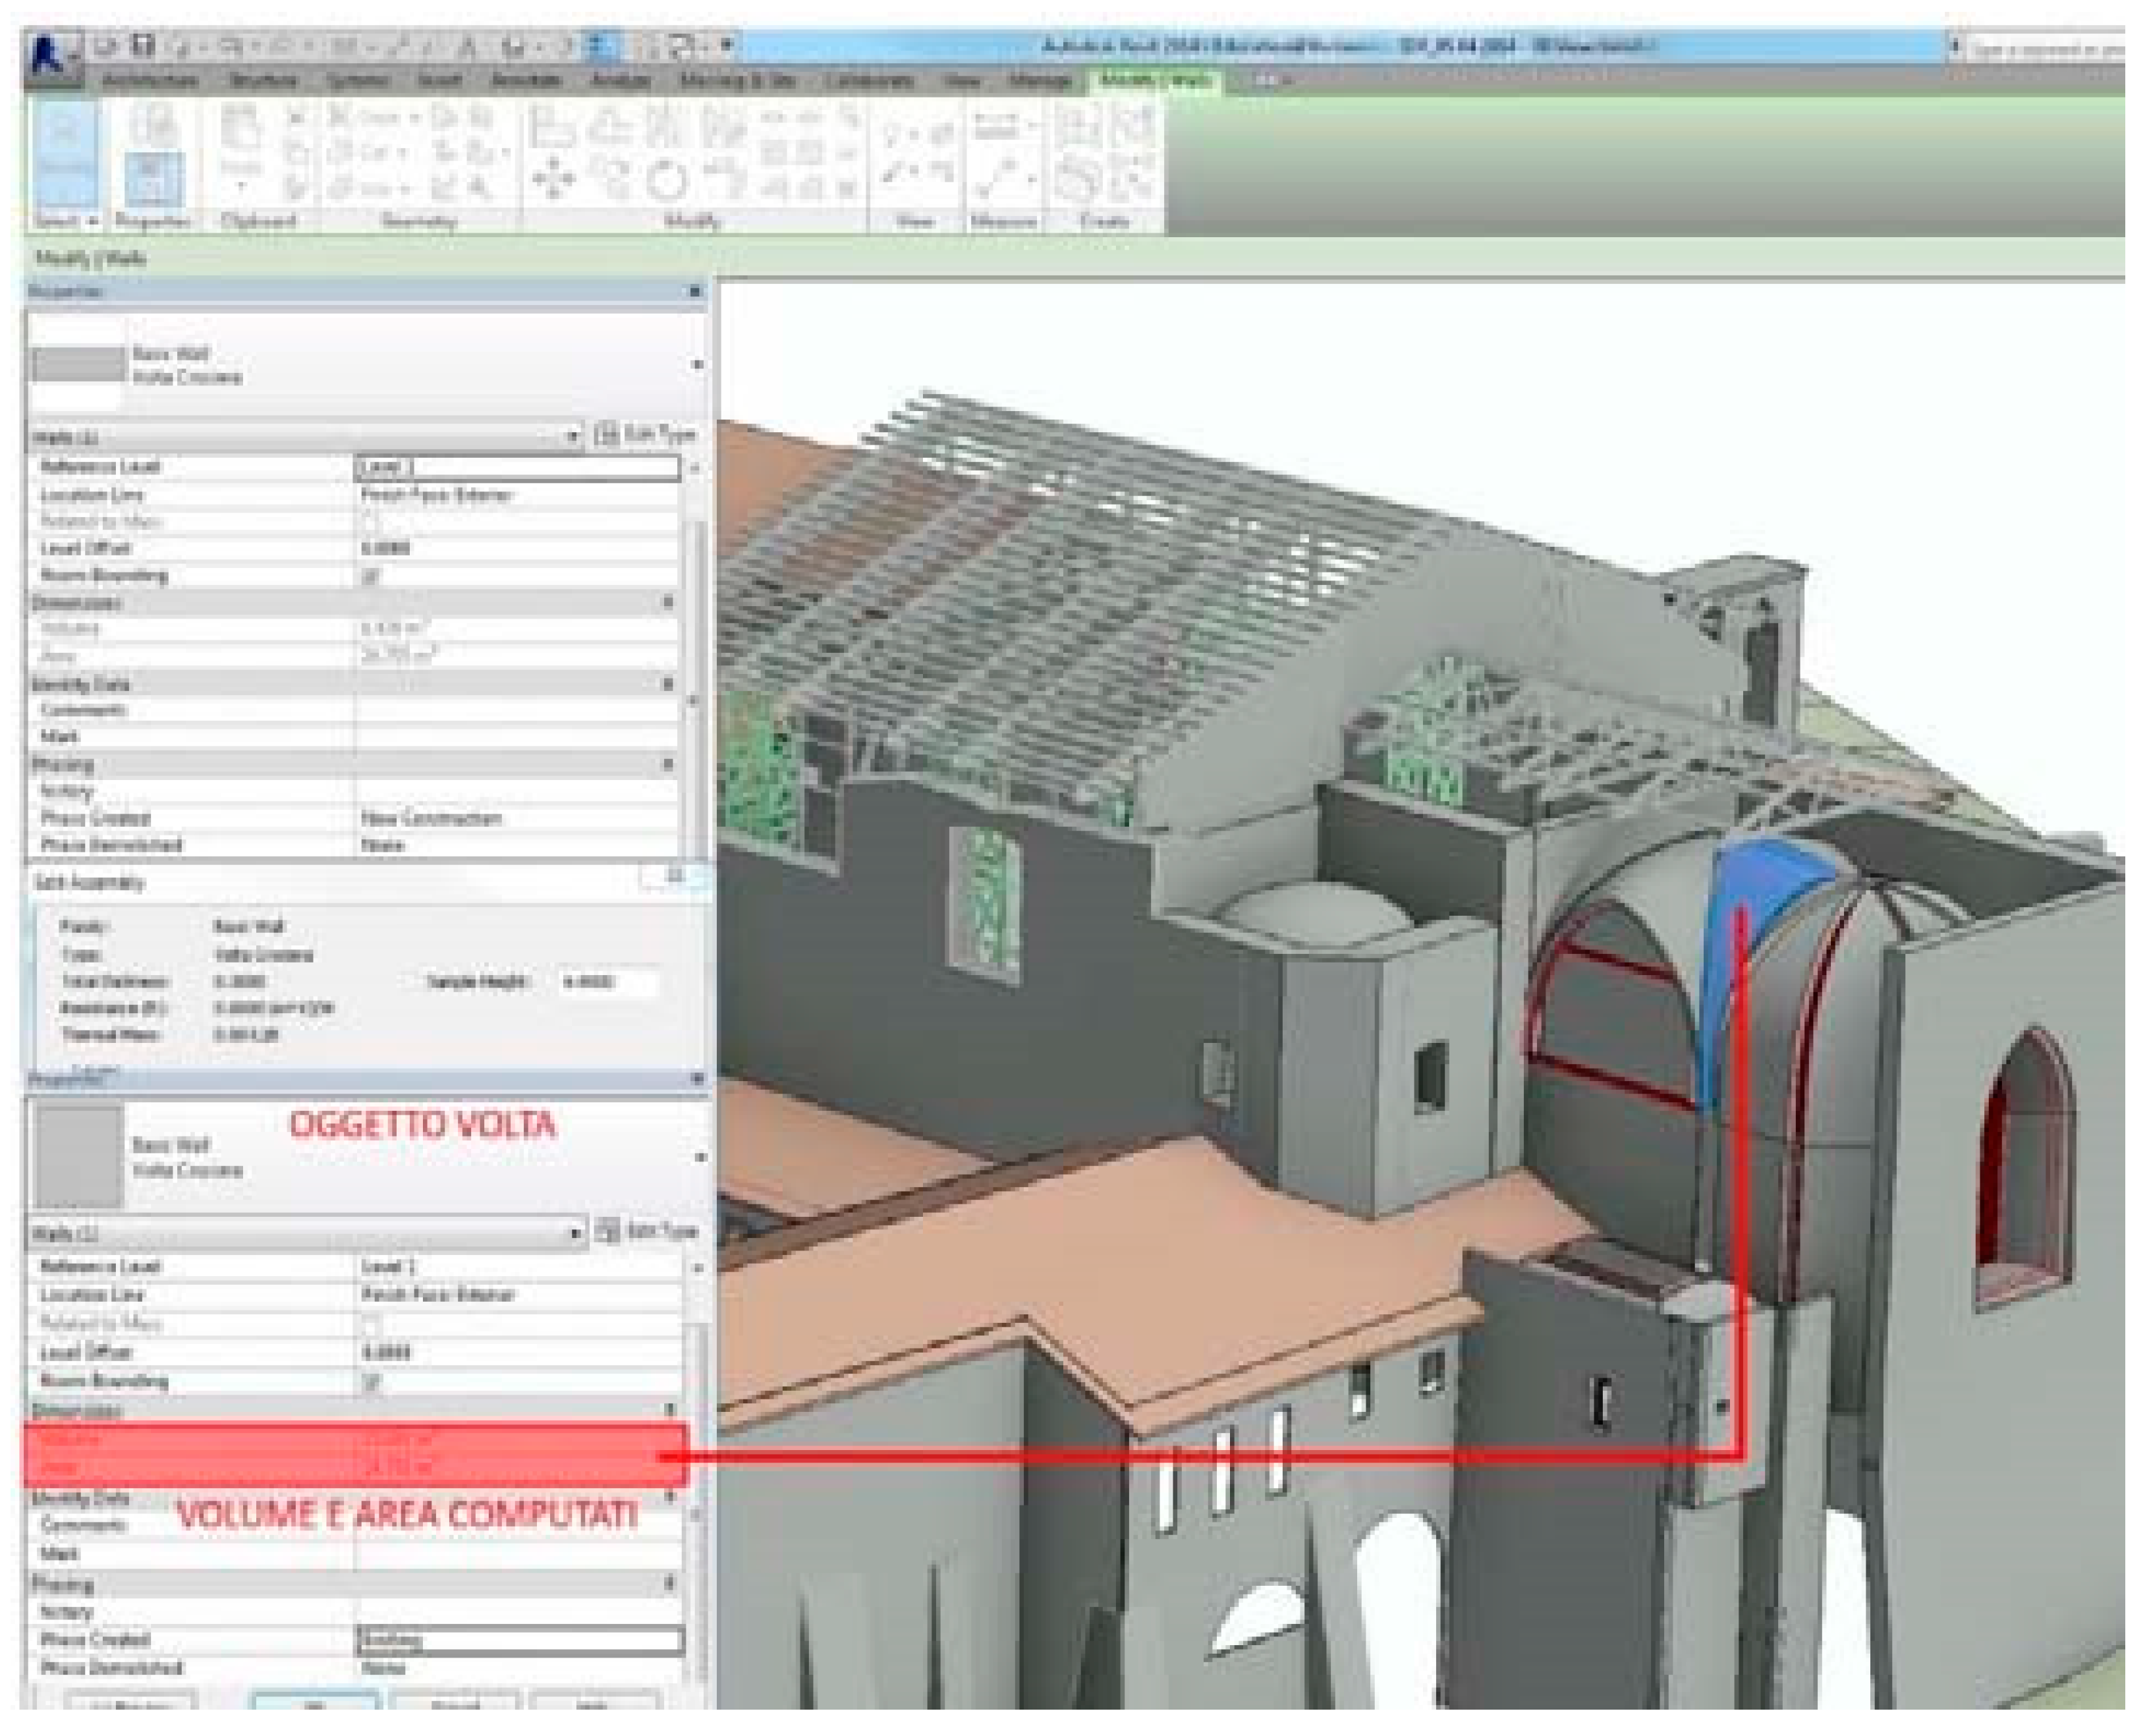
3.11. BIM (Building Information Modelling) methodology
This methodology is based on the creation or construction of a central 3D model or a shared and collaborative database [41], in which the agents/stakeholders involved in the project can create and easily access the information, recreating virtualised spaces and historical environments, reducing the number of exchanges between them and avoiding losses or duplicates. When this methodology is applied to historic buildings it is known as HBIM. The ultimate purpose is to create a graphic model from data faithful to the Heesom historical reality [42] and, in our case, also climatic, since it will be fed by data obtained through the use of the GIS referred to above. This methodology allows us to make virtual recreations of the historical and environmental space and environs. In turn, it will allow us, on the one hand, to delve more deeply into the historical-artistic and conservation details of the asset and, on the other, it will allow the visitor to enjoy the history virtually and the internal background of the asset, allowing a temporal [36] and climatic approach to it. Thanks to its use, administrations will be provided with a plan with action proposals both to halt further deterioration and to facilitate the conservation of the assets under study [40].
Figure 11.
HBIM image with the file containing the information on an element. Source: D. Oreni, R. Brumana, S. della Torre, and F. Banfi, “Survey, HBIM and conservation plan of a monumental building damaged by earthquake,” in International Archives of the Photogrammetry, Remote Sensing and Spatial Information Sciences - ISPRS Archives, May 2017, vol. 42, no. 5W1, pp. 337–342. doi: 10.5194/isprs-Archives-XLII-5-W1-337-2017.
3.12. Multispectral analyses
This type of analysis is fundamental in the approach we propose. The maximum spatial resolution that can be freely accessed with the Copernicus mission data is 10 m/pix. in the Red, Green, Blue bands. This is very useful for understanding the environmental dynamics of the cultural asset's surroundings, but is insufficient for the study of an area as precise as the one we propose. For this reason, we aim to use a multispectral camera that will allow the analysis of the same range of the electromagnetic spectrum (Red, Green, Blue, NIR, etc.). It will be mounted on a drone and will increase exponentially the precision of the data obtained, reaching a resolution of at least 8 cm/pix, allowing the identification of any anomaly in the electromagnetic spectrum related to both the climate and the presence of archaeological remains (Figure 12). This methodology is similar to that used in precision agriculture to study the health status of crops, the presence of plant diseases, etc.
4. Study case: Magaña hamlet
Due to the heterogeneous landscape and varying states of preservation among the proposed archaeological sites, the methodology mentioned above will be adapted to optimize responses to specific questions, including those related to history, climate, and tourism. This implies that not all techniques will be applied on each study case. Taking this consideration in mind, and in order to initially test the proposed workflow, we conducted a pilot study in the Magaña hamlet. Its location within the Parque Natural de Despeñaperros has given it a unique landscape. The surrounding landscape and environment have been modified since 1954 due to a decree from the Ministry of Agriculture, which declared the public utility, necessity, and urgency of occupying a significant portion of the farms in the northernmost area of the region for reforestation purposes.[1].
Considering the unique characteristics and historical behavior of the Magaña hamlet, we aimed to test the proposed methodological approach by adapting the different techniques outlined in section 2. The analyses that we carried out include:
- Analysis of written texts.
- Corine Land Cover and pluviometry analysis.
- Historical aerial imagery analysis.
- Analysis of time series of Sentinel 2A imagery.
- Very high-quality DEM analysis using the Open Lidar Toolbox (OLI) algorithm, and spatial analysis with the most suitable visualization techniques for archaeological purposes such as Sky View Factor (SVF), Hillshade, and Openness [27].
- Drone made 3D model of Magaña Hamlet.
Please, note that the methodological approach presented in this paper is theoretical, and due to the high number of specialists involved in the project, we have decided to initially test the basic procedure, in further steps, we will continue to complement the information provided by the rest of the team by combining the obtained data in the planned App, which is currently under embargo.
4.1. Analysis of written texts.
This is a fundamental approach, especially considering the aim of the project. The historical behaviour of an area reflected in written texts normally does not reflect environmental aspects. The aim of this analysis was to establish its history in order to understand its relation with its surrounding landscape particularly considering the lack of remotely sensed data for periods prior to the 20th century and its historical behaviour on a wider scale, such as the historical period. Thanks to this approach, we can focus on the most suitable aspects for our purpose, such as the reasons for creating the hamlet and any references to economic exploitation, among others. A very summed up results of this analysis can be found in the previous pages.
4.2. Corine Land Cover Analysis
In this case the information provided by this analysis was not as useful as expected As can be seen in Figure 13, there have been no changes in the land cover within the study area, confirming the reforestation process carried out in 1954 in the Despeñaperros Natural Park. Since this process was man-made with a clear objective and carried out within a natural park, no significant variation was expected. However, the data provided by Copernicus Land Monitoring Services only dates back to 1990, so information about the land cover prior to this date is needed to fully understand the phenology of the area. This information can be obtained from other sources, such as historical aerial orthophotography, but even in this case, the information may be incomplete.
4.3. Historical aerial imagery analysis
The information provided by this source has enabled us to document the evolution of the surrounding landscape as well as changes that have occurred in the communication routes, which in this case is a clear effect of reforestation. While historical imagery has been captured over other regions of Spain, there are no available images of the target area, so the dataset used is reflected in Table 1
The results obtained from evaluating these images, particularly from the American Flight Series B and the National Flight, are very useful in identifying the major changes that occurred in the second half of the 20th century, which presumably altered the historical landscape of the area (Figure 14).
As noted in Figure 14B, some terraces can be seen, which can be associated with the aforementioned reforestation plan. Changes in the morphology of the terrain are evident but not unique. We can also identify alterations in the communication routes; in fact, a new route has been constructed to grant access for the reforestation process. This route also crosses the remains of Magaña hamlet, increasing its degradation. Additionally, some of the original man-made lanes have disappeared.
4.4. Time series of Sentinel 2A imagery analysis.
As has been demonstrated in numerous estudy cases such us those carried out in in Central America [43,44] among others, environmental factors are affecting the conservation of arhcaeolgical rest of past communities, also turistics ones [45]. To understand the be phenology of the surrounding landscape as well as to identify possible rests of Magaña hamlet we proceed to time series analysis of Sentinel 2A satellite, concretely dates from: 2015-06-01 to 2023-01-31. The analysis was carried out using Google Earth Engine [46,47]. In total 239 images with a cloud cover less than 10% were analysed. To proceed with this analysis we used the most suitbale vegetation indexes for archaeolgical purpouse such us NDVI [48,49,50] and NWVI [51,52]. Spectral bands used in those indexes are B3, B4, B5 and B8 due to those bands are the most suitable for. Bands B3, B4 and B5, reflects the phenology of the vegetation due to they absorve part of the sun energy, on the other hand, the reflectivity on band B8 (Near Infrarred) increases so, multiples aspectes regarding to vegetation can be anlysised providing information regarding to vegetation, humidity, or growing phase. Also, crop-marks can be linked to the presence of archaeolgical remains in vegetated areas in two ways: the first constrains, whereas the second favours the vegetation growth [53,54]
Graphic 1.
Results fo the multiemporal analysis of Bands B3, B4, B5 and B8. Source: The author.
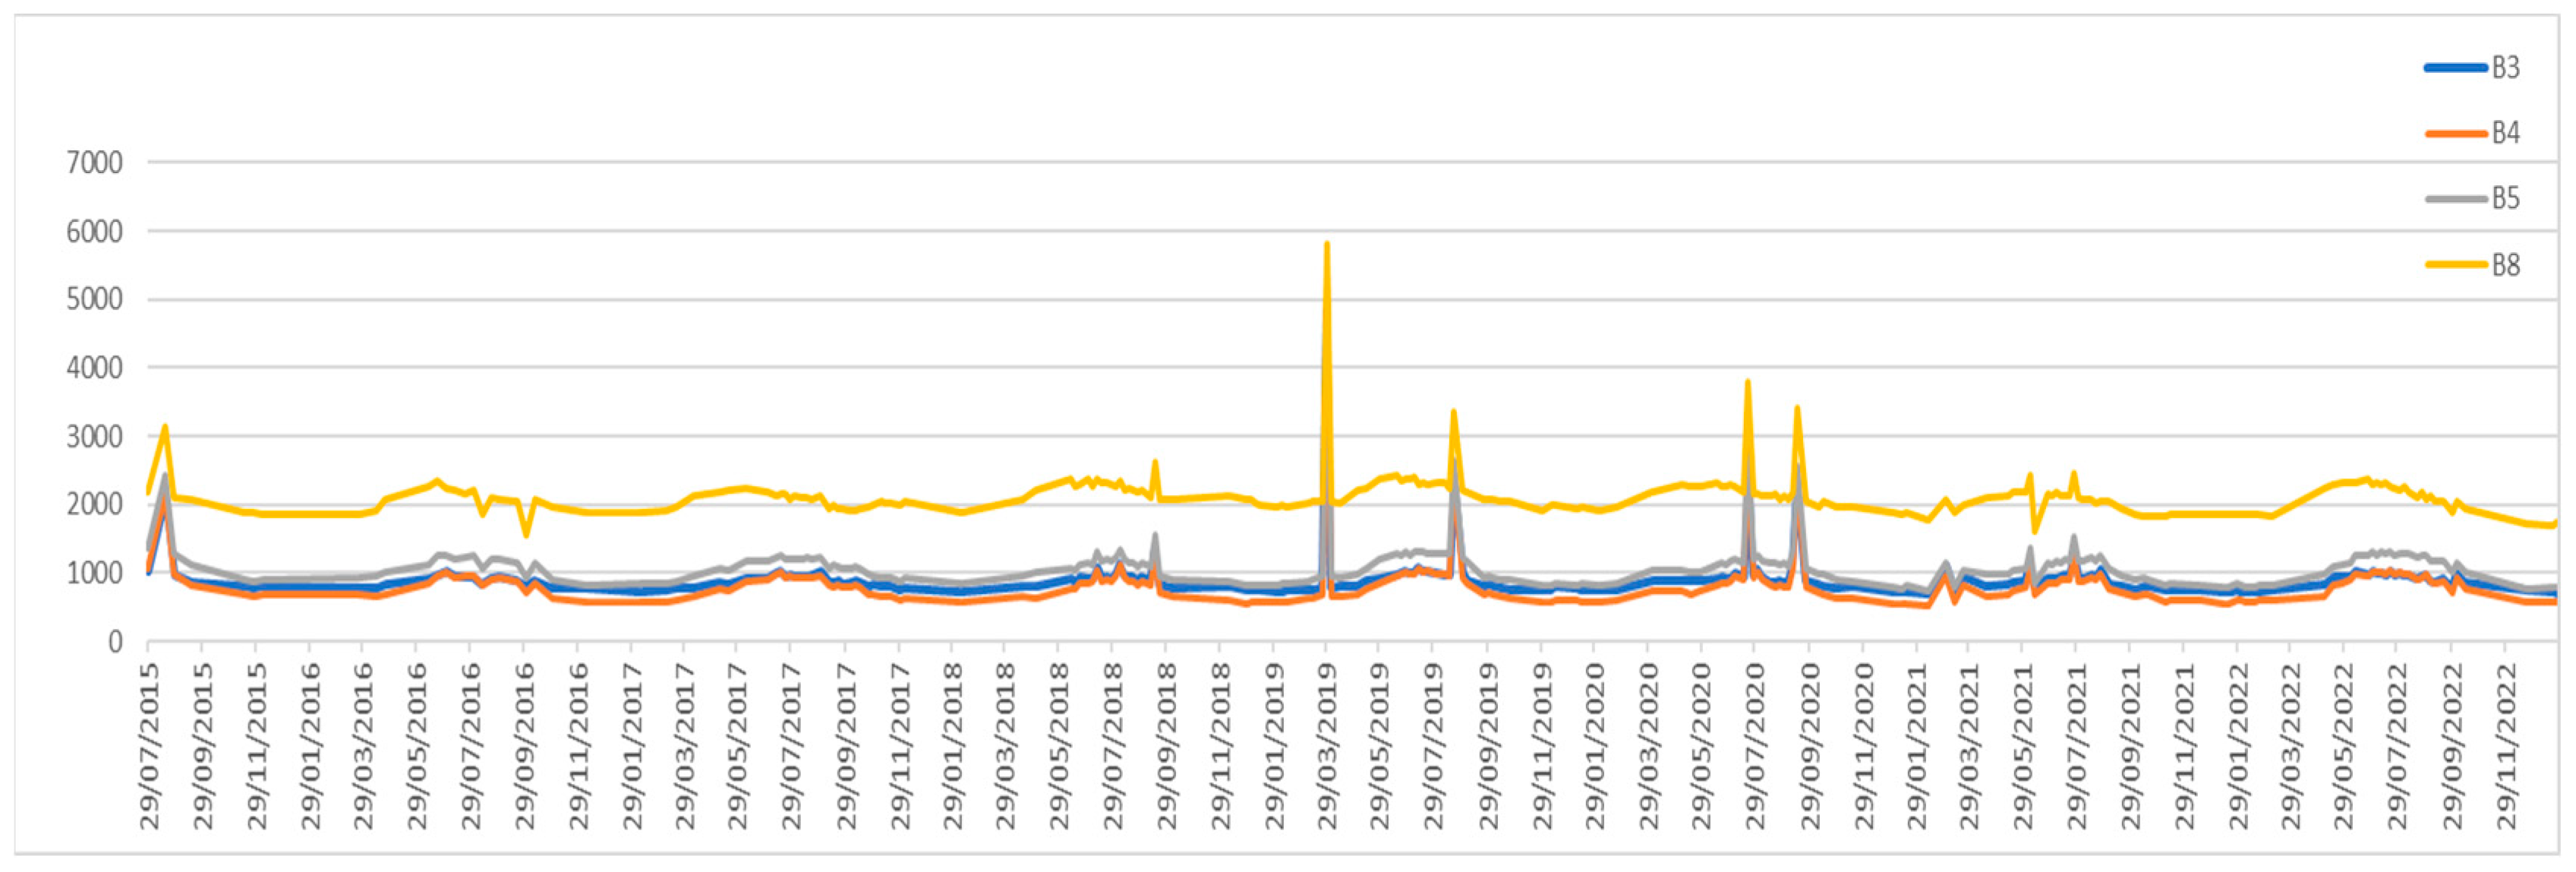
As can be noted in graphic 1 the behaviour of the bands is very homogeneous, just interrupted by some “anomalies”. Considering previous experience of the author in the analysis of multispectral data it is most suitable to use data previously to these marked changes. Intending to knowing what could be the cause of these alteration we proceed to analyse the pluviometry of the area during 15 days previous and later to the anomaly and just one date coincide with precipitation on 30/03/2019 when rained a quantity of 8.5 l/m2. Considering that, we could infer that rain was not the cause of the alteration and what is more, neither could analyse the area after the rain due to the nearest imagery to date had cloud cover that made impossible to see the specific area. So, considering that we analysed the images nearest to the alteration identified and that had less than 10% of cloud cover. Finally, the range of images that has been analysed where:
- S2A_MSIL2A_20180802T105621_N0208_R094_T30SVH_20180802T141714
- S2B_MSIL2A_20190325T105709_N0211_R094_T30SVH_20190325T141511
- S2A_MSIL2A_20190817T105621_N0213_R094_T30SVH_20190817T141933
- S2A_MSIL2A_20200702T105621_N0214_R094_T30SVH_20200702T135414
To proceed with their analysis, we used SNAP software from ESA, which is a specific software developed to carry out multispectral analysis of diverse satellite imagery. As preparatory phase previously to analyse NDVI, NDWI and PCA we proceed to convert Radiance to reflectance[55].
Once the data had been converted, we proceeded to calculate the NDVI index for the four images in order to analyze the vegetation growth dynamics in the area (Figure 15), We also considered that variations in this index could be related to the presence of buried archaeological remains. However, due to the low spatial resolution and the characteristics of the studied area, we were unable to identify any archaeological remains. Nevertheless, the NDVI index provided valuable environmental information. As shown in Figure 15, seasonal changes were detected depending on the year, indicating the health and changes in reforestation over time and seasons, particularly between spring (Figure 15B) and summer (Figure 15A,B,D). After calculating this index, we used Principal Component Analysis (PCA) to reduce the amount of spectral redundancy, which is an excellent method when using multispectral imagery[44]. The results obtained did not provide information about archaeological remains but showed a clear upward trend in NDVI index values, reflecting the success of the repopulation process as the index indicated vegetation growth.
4.5. LiDAR data analysis
Lidar used during this study where downloaded from IGN[56], concretely the second flight carried out on 2020 with a point density of 1.5 points/m2 and the used dataset where:
- PNOA_2019_CLM-SW_450-4254_ORT-CLA-RGB
- PNOA_2019_CLM-SW_450-4256_ORT-CLA-RGB
These date where naturally (RGB) and infrared (IRC) coloured, also classified taking into account the American Society for Photogrammetry and Remote Sensing (ASPRS) principles. In the development of this study case we proceed to filter Lidar data point cloud to keep those related with ground (Class 2) using the algorithm Las2las filter included in QGIS plug-in LasTools. After that, we processed the generated point cloud with Open Lidar Toolbox in QGIS [57] and we obtained different visualization techniques optimized for archaeological purpose such us: Sky View factor (SVF) [58], Hillshade [59] and Openess [60].
Thanks to the analysis of the different raster obtained using the aforementioned analysis we could identify some elements that must be taken into consideration such us possible original routes of ancient road (Figure 16), the presence of the aforementioned terraces done when the reforestation, the confirmation of the existence of the sparse road mentioned in 4.3 (Figure 14A) and a possible threshing floor and identified terrain alteration that could be related with a livestock structure (Figure 17).
Regarding the aforementioned thressing floor (Figure 17) it is located to a distance of 88 m aproximately in the south, and its radious is of aproximately 8.80 m so the stimated total diameter is around 17 m. To clearly understand it location and fucntion we must taking into account the orography of it surrounding landscape previously to the so called reforestation in 1954. It is located in extreme of the plaeteu where Magaña hamlet it is located and, as can be seen in American flight serie B, there weren’t any trees in their inmediate surrounding that could obstacle the wind, also the road and ancient lines passed near of it.
Concerning to the possible livestock structure, it is located near the south face of Magaña hamlet. Is seems to be something temporary due to it cannot be documented with other visutalization techniques neither other historical imagery. It aproximate radious is 16 m that implies a diameter of 32 m. It location beside the walls of the hamlet reject the possibility to be a thresshing fllor. On the other hand, this estructure is the main factor that made dissapear the aforemeionted original route (Figure 16)
Lastly terraces done during the reforestation process can be clearly identify in both, historical aerial imagery and Lidar data (Figure 18) has altered the landscape considerably and has eliminated any possible remains in the surroundin area.
4.6. Drone made 3D model of Magaña Hamlet
As a final step, we proceeded to create a 3D model (Figure 7) of the Magaña hamlet for two main purposes. Firstly, it will be integrated into the HBIM system, with the point cloud generated during the creation of the 3D model serving as the basis for modelling a virtual reconstruction of the Magaña hamlet. This model will include information regarding the actual conservation status, causes of degradation, possible treatments, costs, and other relevant details, allowing different stakeholders from Cultural Heritage and Environmental studies to work together in a coordinated manner to develop more accurate conservation policies. Secondly, the creation of this 3D model plays an important role in diffusion and dissemination. The model will be included in the aforementioned app, and explanatory videos will be uploaded to various social media channels, providing access to this archaeological site and broadening knowledge among interested audiences worldwide.
5. Discussion
The focus of the proposal is novel in the field of Modern History (16th - 18th centuries) and, therefore, the expected scientific-technical and socio-economic impact of the project is high. The studies of Spatial Archaeology or Applied History in Spain during the centuries of the Modern Age are minority or infrequent, even more so taking into account the climatic conditions of the environment. The joint interpretation of a corpus of data in which architectural and environmental values are integrated to facilitate both the conservation of the asset and its landscape environment has been practically non-existent. The use of drone flights over constructions is more frequent, although not for the analysis and morphological study of the territory in which the archaeological remains are located. In this respect, the results will have a high impact. Letters of interest and collaboration from different European geo-historical laboratories could be added to these actions. Particularly notable in this case are those from Italy, due to the similarities between the Italian and Spanish methodologies, thus guaranteeing international impact. We can cite the Osservatorio Geopolitico Internazionale sulle citta' di fondazione of the municipality of Saubadia (Latina); the Centro Italiano per gli Studi Storico-Geografici of the Dipartimento di Studi Umanistici, Università degli Studi Roma Tre; the Centro Geo-Cartografico di Studio e Documentazione GeCo of the Università di Trento; the Laboratorio Geocartografico "Giuseppe Caraci" of the Università di Roma Tre; and the Geographic Research and Application Laboratory (GREAL) of the Università Europea di Roma (letters kept in the UJA Vice-Rectorate for Research).
Thanks to the pilot study developed in this paper, we have obtained very important information about the proposed methodology. Additionally, we have achieved a comprehensive understanding of the archaeological site and its surrounding landscape. Due to the characteristics of the Magaña hamlet, which has been used until the mid-twentieth century, the remaining structures are relatively well conserved, and their structure can be seen and interpreted clearly. However, the information obtained through this study is of significant importance. Archaeologically speaking, it allowed us to identify possible remains of a section of the main road to Magaña hamlet that must be interpreted jointly with the two circular structures related with daily routine of the inhabitants of Magaña hamlet, a threshing floor and a possible livestock structure, that must be confirmed in next field campaigns. As a hypothesis that must be demonstrated or don’t, we think that the sparse part of the main road communicated the threshing floor with the hamlet and that one this structure was abandoned, the structure identified as livestock was created and it changed the physiognomy of the original route.
Regarding the climate information, we observed that the main change in the landscape occurred since 1954 when the reforestation process was carried out, altering the landscape of the natural park. This action resulted in the creation of a specific environment with very little changes, having two different aspects that have affected Magaña Hamlet and its surroundings in two different and contradictory ways. The first aspect is the contradictory one, the modification of the landscape carried out since 1954 has altered the surrounding landscape, creating a new environment that has nothing to do with the historical one. Moreover, the creation of a new communication route through Magaña hamlet has led to its deterioration, even though the traffic is reduced also the terraces have erase the original morphology of the area eliminating the possibilities to identify archaeological remains near of Magaña hamlet. The second aspect is the positive one, the reforestation has created a specific and protected environment, as demonstrated in the Corine Landcover cartography (Figure 13 and the variation identified through PCA and NDVI analysis in Figure 12). The protection of this plantation inside a natural park has reduced the climatic impact on the conserved structure. As has been demonstrated, the vegetation is healthy, and its continuous growth shows that climatic conditions in the area are consistent, reducing the impact of weather on archaeological remains.
Thanks to this study, we have gained a comprehensive understanding of the historical and climatic behavior of one archaeological site, in this case, the Magaña hamlet. We must not forget that alterations in the landscape, whether natural or man-made, are part of the history of a populated area. Although some changes are recent, they must be considered as an integral part of its evolution. The information provided by holistic approaches such as the one described in this paper will be the basis for promoting the most accurate and efficient conservation policies of Cultural Heritage sites, taking into account their adaptation to climate change.
Author Contributions
Conceptualization, Antonio J. Ortiz Villarejo and José M. Delgado Barrado; Formal analysis, Antonio J. Ortiz Villarejo and José M. Delgado Barrado; Funding acquisition, José M. Delgado Barrado; Investigation, Antonio J. Ortiz Villarejo and José M. Delgado Barrado; Methodology, Antonio J. Ortiz Villarejo and José M. Delgado Barrado; Project administration, José M. Delgado Barrado; Resources, Antonio J. Ortiz Villarejo and José M. Delgado Barrado; Supervision, Antonio J. Ortiz Villarejo and José M. Delgado Barrado; Validation, José M. Delgado Barrado; Visualization, José M. Delgado Barrado; Writing – original draft, Antonio J. Ortiz Villarejo and José M. Delgado Barrado; Writing – review & editing, Antonio J. Ortiz Villarejo and José M. Delgado Barrado.
Data Availability Statement
Data regarding App are under protection by Universidad de Jaén due to its future register and exploitation.
Conflicts of Interest
The authors declare no conflict of interest.
References
- Domingo, J.; Martínez, S.; Eduardo, Y.; Jiménez, A. EL PARQUE NATURAL DE DESPEÑAPERROS: CARACTERIZACIÓN TERRITORIAL Y PERSPECTIVAS INMEDIATAS. Cuadernos Geográficos 2005, 37, 7–39. [Google Scholar]
- Endangered Archaeology in the Middle East and North Africa | EAMENA Project. Available online: https://eamena.org/ (accessed on 21 January 2023).
- Evans, D.H.; Fletcher, R.J.; Pottier, C.; Chevance, J.B.; Soutif, D.; Tan, B.S.; Im, S.; Ea, D.; Tin, T.; Kim, S.; et al. Uncovering Archaeological Landscapes at Angkor Using Lidar. Proc Natl Acad Sci U S A 2013, 110, 12595–12600. [Google Scholar] [CrossRef]
- Tapete, D.; Cigna, F. Detection of Archaeological Looting from Space: Methods, Achievements and Challenges. Remote Sens (Basel) 2019, 11. [Google Scholar] [CrossRef]
- Prufer, K.M.; Thompson, A.E.; Kennett, D.J. Evaluating Airborne LiDAR for Detecting Settlements and Modified Landscapes in Disturbed Tropical Environments at Uxbenká, Belize. J Archaeol Sci 2015. [Google Scholar] [CrossRef]
- Galeazzi, F. Towards the Definition of Best 3D Practices in Archaeology: Assessing 3D Documentation Techniques for Intra-Site Data Recording. J Cult Herit 2016. [Google Scholar] [CrossRef]
- Fiz, J.I.; Martín, P.M.; Cuesta, R.; Subías, E.; Codina, D.; Cartes, A. Examples and Results of Aerial Photogrammetry in Archeology with UAV: Geometric Documentation, High Resolution Multispectral Analysis, Models and 3D Printing. Drones 2022, 6. [Google Scholar] [CrossRef]
- Bonazza, A.; Bonora, N.; Duke, B.; Spizzichino, D.; Recchia, A.P.; Taramelli, A. Copernicus in Support of Monitoring, Protection, and Management of Cultural and Natural Heritage. Sustainability 2022, 14, 2501. [Google Scholar] [CrossRef]
- Lista Roja. Available online: https://listaroja.hispanianostra.org/ (accessed on 21 January 2023).
- InfoIGME - Catálogo de Aplicaciones. Available online: https://info.igme.es/catalogo/catalog.aspx?catalog=2&shim=true&shdt=false&shtb=true&shtp=false&shfp=false&shsf=false&shfo=false&master=infoigme&lang=spa&intranet=false (accessed on 21 January 2023).
- Nature and Biodiversity Law - Environment - European Commission. Available online: https://ec.europa.eu/environment/nature/legislation/index_en.htm#legal_sources (accessed on 21 January 2023).
- Organismo Autónomo Centro Nacional de Información Geográfica (CNIG) Centro Nacional de Información Geográfica. Available online: https://www.ign.es/web/ign/portal/qsm-cnig (accessed on 6 May 2020).
- Potree. Available online: https://potree.github.io/ (accessed on 21 January 2023).
- Logothetis, S.; Delinasiou, A.; Stylianidis, E. Building Information Modelling for Cultural Heritage: A Review. ISPRS Annals of Photogrammetry, Remote Sensing and Spatial Information Sciences 2015. [Google Scholar] [CrossRef]
- Sarris, A. Best Practices of GeoInformatic Technologies for the Mapping of Archaeolandscapes.
- Štular, B.; Lozić, E.; Eichert, S. Airborne LiDAR-Derived Digital Elevation Model for Archaeology. Remote Sens (Basel) 2021, 13. [Google Scholar] [CrossRef]
- Agapiou, A.; Hadjimitsis, D.; Sarris, A.; Themistocleous, K.; Papadavid, G. Hyperspectral Ground Truth Data for the Detection of Buried Architectural Remains; 2010; Vol. 6436;.
- Análisis Del Sistema De Transporte, S.Y.; Moreno-Navarro, F. Simulación y Análisis Del Sistema de Transporte En El Norte de La Carpetania Romana. Una Aproximación Desde Los Sig y Análisis de Redes = Transportation System Simulation and Analysis in the North of Roman Carpetania. A Gis and Network Analysis Approach. 2022. [CrossRef]
- Prats, L. El Concepto de Patrimonio Cultural. Cuadernos de Antropología Social 2000, 11, 115–136. [Google Scholar]
- García, A. EL CONCEPTO DE DIVERSIDAD ENTENDIDO POR LOS FUTUROS DOCENTES; 2016;
- Gil González, S. Cómo Hacer “Apps” Accesibles; 2013; Vol. 1;
- Marín-Cepeda, S.; García-Ceballos, S.; Gümez-Redondo, C.; Vicent, N.; Gillate, I. Educación Patrimonial Inclusiva En OEPE: Un Studio Prospectivo. Revista de Educacion 2017, 2017, 110–135. [Google Scholar] [CrossRef]
- Gobierno de España. Porta de Administración Electrónica Observatorio de Accesibilidad Web. Available online: https://administracionelectronica.gob.es/pae_Home/pae_Estrategias/pae_Accesibilidad/pae_Observatorio_de_Accesibilidad.html (accessed on 2 November 2022).
- Toumazet, J.-P.; Simon, F.-X.; Mayoral, A. Self-AdaptIve LOcal Relief Enhancer (SAILORE): A New Filter to Improve Local Relief Model Performances According to Local Topography. Geomatics 2021, 1, 450–463. [Google Scholar] [CrossRef]
- Kokalj, Ž.; Zaksek, K.; Oštir, K.; Čotar, K. Relief Visualization Toolbox, Version 1.3, Manual Special Issue “Applications of Micro-and Nano-Satellites for Earth Observation” View Project; 2013;
- Kokalj, Ž.; Somrak, M. Why Not a Single Image? Combining Visualizations to Facilitate Fieldwork and on-Screen Mapping. Remote Sens (Basel) 2019, 11. [Google Scholar] [CrossRef]
- Štular, B.; Eichert, S.; Lozić, E. Airborne LiDAR Point Cloud Processing for Archaeology. Pipeline and QGIS Toolbox. Remote Sens (Basel) 2021, 13, 3225. [Google Scholar] [CrossRef]
- Chase, A.F.; Chase, D.Z.; Weishampel, J.F.; Drake, J.B.; Shrestha, R.L.; Slatton, K.C.; Awe, J.J.; Carter, W.E. Airborne LiDAR, Archaeology, and the Ancient Maya Landscape at Caracol, Belize. J Archaeol Sci 2011, 38, 387–398. [Google Scholar] [CrossRef]
- Climate Change Service. Available online: https://climate.copernicus.eu/.
- Adams, R.E.W. a; Brown Jr., W.E. b; Patrick Culbert, T. c Radar Mapping, Archeology, and Ancient Maya Land Use. Science (1979) 1981, 213, 1457–1463.
- Elachi, C.; Roth, L.E.; Schaber, G.G. Spaceborne Radar Subsurface Imaging in Hyperarid Regions. IEEE Transactions on Geoscience and Remote Sensing 1984, GE-22, 383–388. [Google Scholar]
- Cheng, G.; Han, J. A Survey on Object Detection in Optical Remote Sensing Images. ISPRS Journal of Photogrammetry and Remote Sensing 2016. [Google Scholar] [CrossRef]
- Chen, F.; Lasaponara, R.; Masini, N. An Overview of Satellite Synthetic Aperture Radar Remote Sensing in Archaeology: From Site Detection to Monitoring. J Cult Herit 2017. [Google Scholar] [CrossRef]
- Verhoeven, G. BRDF and Its Impact on Aerial Archaeological Photography. Archaeol Prospect 2017, 24, 133–140. [Google Scholar] [CrossRef]
- De Reu, J.; Plets, G.; Verhoeven, G.; De Smedt, P.; Bats, M.; Cherretté, B.; De Maeyer, W.; Deconynck, J.; Herremans, D.; Laloo, P.; et al. Towards a Three-Dimensional Cost-Effective Registration of the Archaeological Heritage. J Archaeol Sci 2013, 40, 1108–1121. [Google Scholar] [CrossRef]
- Soler, F.; Melero, F.J.; Luzón, M.V. A Complete 3D Information System for Cultural Heritage Documentation. J Cult Herit 2017, 23, 49–57. [Google Scholar] [CrossRef]
- Tapete, D.; Banks, V.; Jones, L.; Kirkham, M.; Garton, D. Contextualising Archaeological Models with Geological, Airborne and Terrestrial LiDAR Data: The Ice Age Landscape in Farndon Fields, Nottinghamshire, UK. J Archaeol Sci 2017, 81. [Google Scholar] [CrossRef]
- Willis, M.D.; Koenig, C.W.; Black, S.L.; Castañeda, A.M. ARCHEOLOGICAL 3D MAPPING: THE STRUCTURE FROM MOTION REVOLUTION; 2016; Vol. 3;
- Megahed, N. Towards a Theoretical Framework for HBIM Approach in Historic Preservation and Management. International Journal of Architectural Research: ArchNet-IJAR 2017, 9, 130. [Google Scholar] [CrossRef]
- Oreni, D.; Brumana, R.; Torre, S. Della; Banfi, F. Survey, HBIM and Conservation Plan of a Monumental Building Damaged by Earthquake. In Proceedings of the International Archives of the Photogrammetry, Remote Sensing and Spatial Information Sciences - ISPRS Archives; International Society for Photogrammetry and Remote Sensing, May 12 2017; Vol. 42, pp. 337–342.
- Hermoso-Orzáez, M.J.; Camacho Sánchez, J.M.; Estepa Cantero, C.; Terrados-Cepeda, J. IMPLEMENTATION OF THE BIM MANAGER FIGURE WITH CYPE’S TOOL BIM SERVER CENTER IN THE DESIGN, MODELING, DIRECTION AND PROJECT MANAGEMENT-UNIVERSIDAD DE JAÉN. EDULEARN21 Proceedings 2021, 1, 2337–2347. [Google Scholar] [CrossRef]
- Heesom, D.; Boden, P.; Hatfield, A.; Rooble, S.; Andrews, K.; Berwari, H. Developing a Collaborative HBIM to Integrate Tangible and Intangible Cultural Heritage. International Journal of Building Pathology and Adaptation 2021, 39, 72–95. [Google Scholar] [CrossRef]
- 43. Wiseman, James.; El-Baz, Farouk. Remote Sensing in Archaeology. 2007, 553.
- Parcak, S.H. Satellite Remote Sensing for Archaeology; Routledge. Taylor and Francis Group.: London and New York, 2009; ISBN 0-415-44877-8. (hbk). [Google Scholar]
- Ramírez-Guerrero, G.; García-Onetti, J.; Arcila-Garrido, M.; Chica-Ruiz, J.A. A Tourism Potential Index for Cultural Heritage Management through the Ecosystem Services Approach. Sustainability 2021, Vol. 13, Page 6415 2021, 13, 6415. [Google Scholar] [CrossRef]
- Google Earth Engine.
- Liss, B.; Howland, M.D.; Levy, T.E. Testing Google Earth Engine for the Automatic Identification and Vectorization of Archaeological Features: A Case Study from Faynan, Jordan. J Archaeol Sci Rep 2017, 15. [Google Scholar] [CrossRef]
- Crippen, R.E. Calculating the Vegetation Index Faster. Remote Sens Environ 1990, 34, 71–73. [Google Scholar] [CrossRef]
- Agapiou, A.; Hadjimitsis, D.G.; Georgopoulos, A.; Sarris, A.; Alexakis, D.D. Towards an Archaeological Index: Identification of the Spectral Regions of Stress Vegetation Due to Buried Archaeological Remains. In Proceedings of the Lecture Notes in Computer Science (including subseries Lecture Notes in Artificial Intelligence and Lecture Notes in Bioinformatics); 2012.
- Verena, H.; Krauss, G.; Götze, C.; Sandow, C. Index DataBase. A Database for Remote Sensing Indices.
- Gao, B.C. NDWI—A Normalized Difference Water Index for Remote Sensing of Vegetation Liquid Water from Space. Remote Sens Environ 1996, 58, 257–266. [Google Scholar] [CrossRef]
- McFeeters, S.K. The Use of the Normalized Difference Water Index (NDWI) in the Delineation of Open Water Features. 2007, 17, 1425–1432. [CrossRef]
- Masini, N.; Marzo, C.; Manzari, P.; Belmonte, A.; Sabia, C.; Lasaponara, R. On the Characterization of Temporal and Spatial Patterns of Archaeological Crop-Marks. J Cult Herit 2018, 32, 124–132. [Google Scholar] [CrossRef]
- Lasaponara, R.; Masini, N. Detection of Archaeological Crop Marks by Using Satellite QuickBird Multispectral Imagery. J Archaeol Sci 2007, 34, 214–221. [Google Scholar] [CrossRef]
- SENTINEL-2 User Handbook Sentinel-2 User Handbook SENTINEL-2 User Handbook Title Sentinel-2 User Handbook Issue 1 Revision 1 SENTINEL-2 User Handbook; 2013;
- Organismo Autónomo Centro Nacional de Información Geográfica Centro de Descargas Del IGN. Available online: https://centrodedescargas.cnig.es/CentroDescargas/index.jsp (accessed on 5 June 2020).
- Štular, B.; Eichert, S.; Lozić, E. Airborne Lidar Point Cloud Processing for Archaeology. Pipeline and Qgis Toolbox. Remote Sens (Basel) 2021, 13. [Google Scholar] [CrossRef]
- Zakšek, K.; Oštir, K.; Kokalj, Ž. Sky-View Factor as a Relief Visualization Technique. Remote Sens (Basel) 2011. [Google Scholar] [CrossRef]
- Bennett, R.; Welham, K.; Hill, R.A.; Ford, A. A Comparison of Visualization Techniques for Models Created from Airborne Laser Scanned Data. Archaeol Prospect 2012. [Google Scholar] [CrossRef]
- Doneus, M. Openness as Visualization Technique for Interpretative Mapping of Airborne Lidar Derived Digital Terrain Models. Remote Sens (Basel) 2013. [Google Scholar] [CrossRef]
Figure 1.
Study zone locations. 1. Castillo de Susana (Valdepeñas); 2. Castillo de Otiñar (Los Villares); 3. Castillo de Arenas (Campillo de Arenas); Sierra Morena: 4. Aldea de Buenos Aires (Aldeaquemada) 5. Aldea de Magaña (Santa Elena).
Figure 1.
Study zone locations. 1. Castillo de Susana (Valdepeñas); 2. Castillo de Otiñar (Los Villares); 3. Castillo de Arenas (Campillo de Arenas); Sierra Morena: 4. Aldea de Buenos Aires (Aldeaquemada) 5. Aldea de Magaña (Santa Elena).
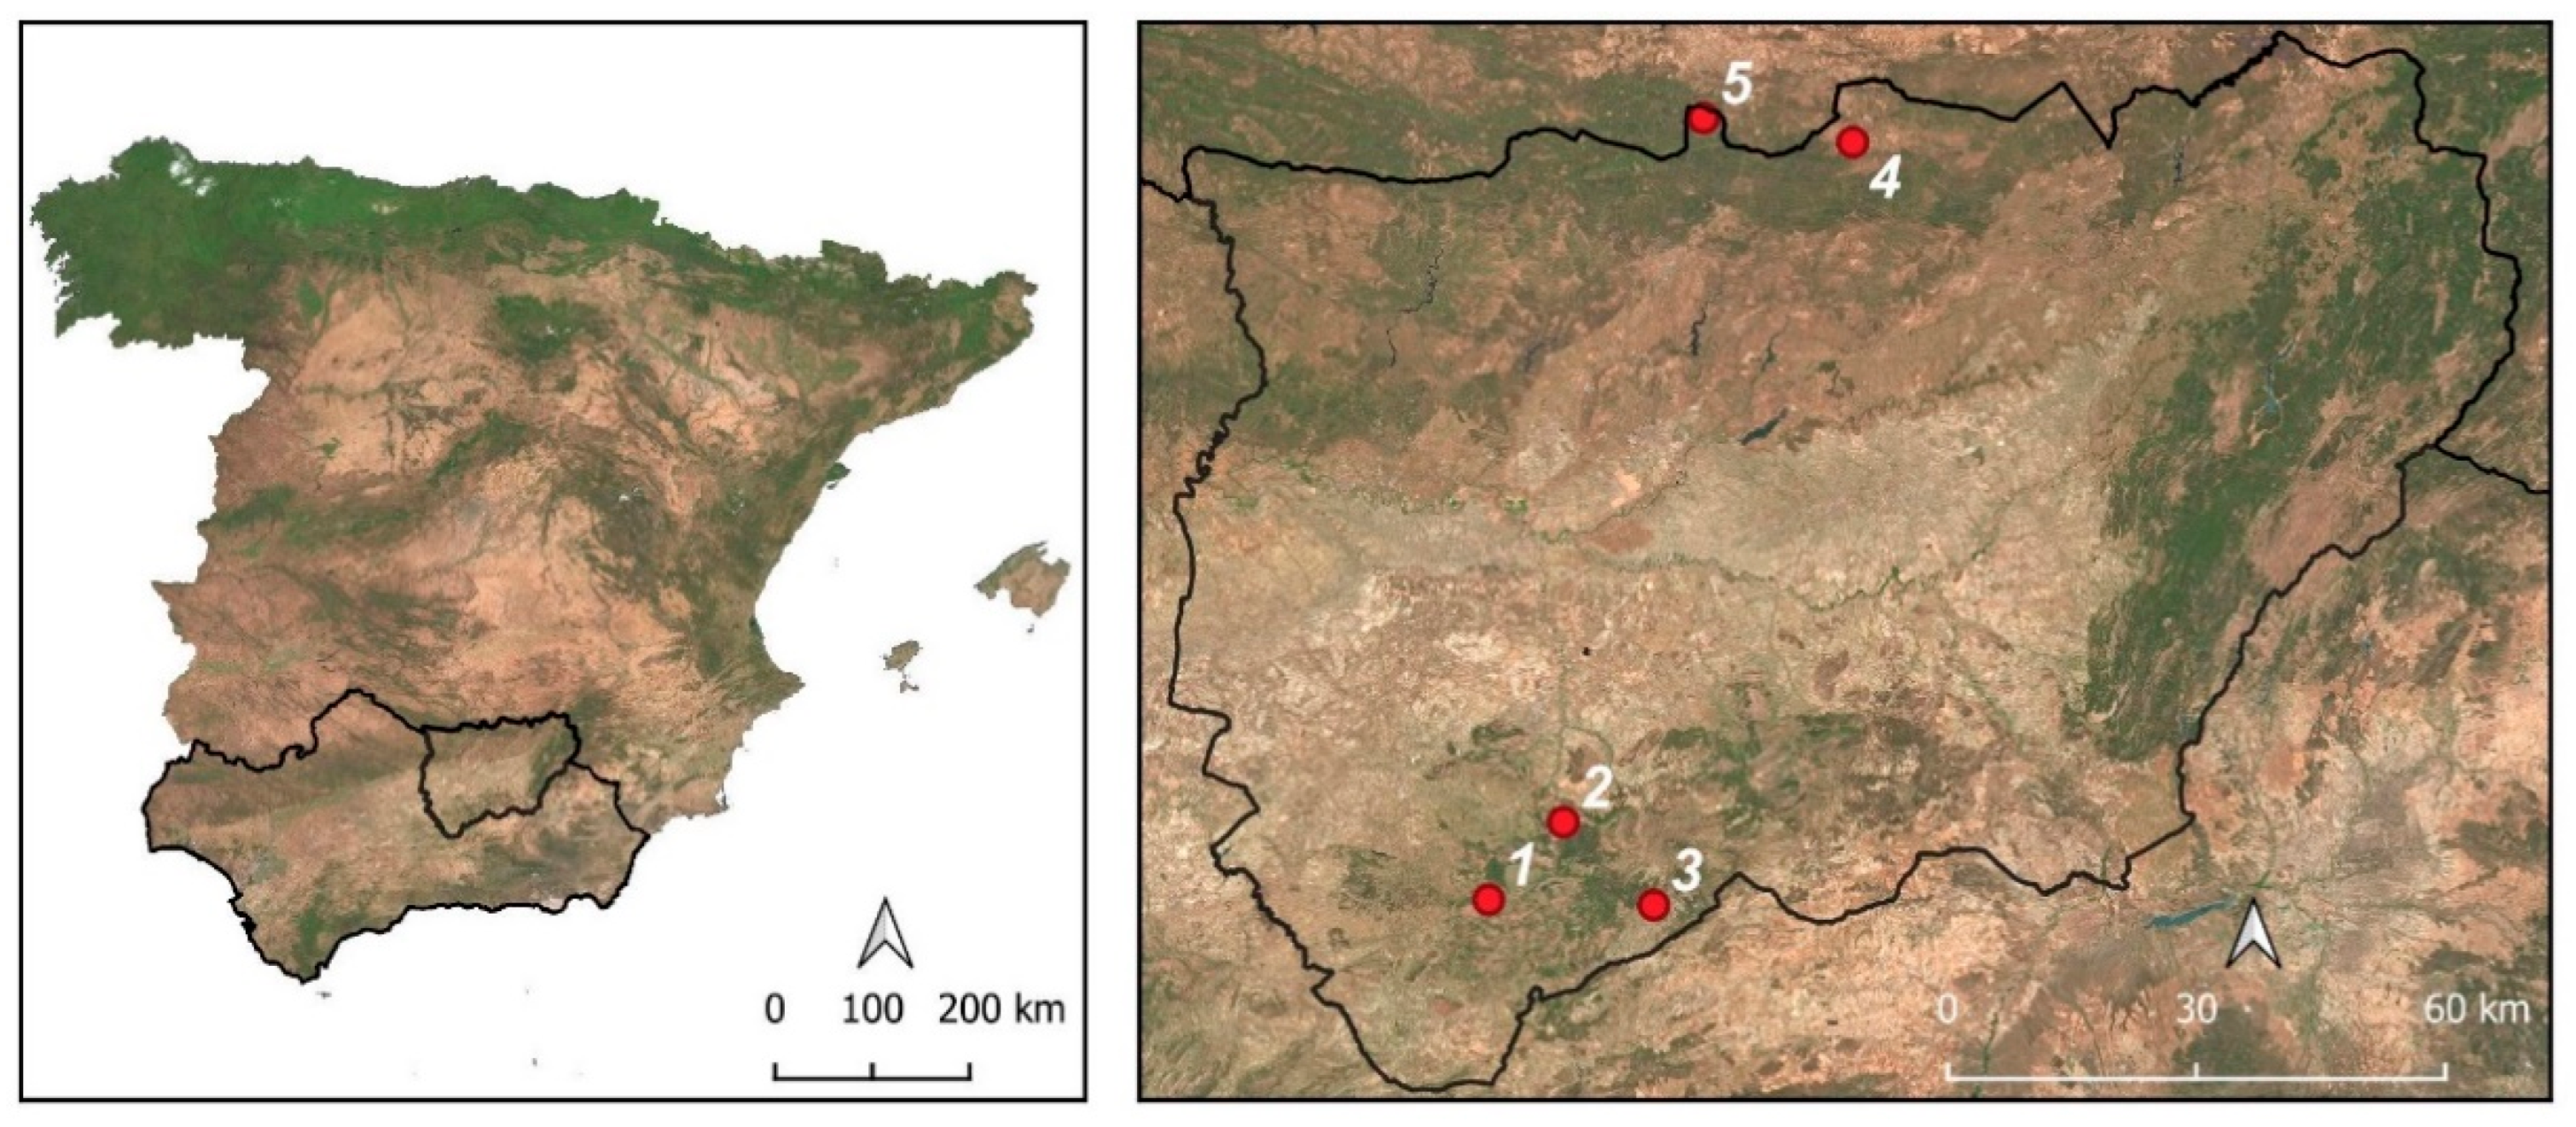
Figure 2.
General area of research. Cases 1 to 3 Sierra Sur. 1. Castillo de Susana (Valdepeñas); 2. Castillo de Otiñar (Los Villares); 3. Castillo de Arenas (Campillo de Arenas); Cases 4 and 5 Sierra Morena: 4. Aldea de Buenos Aires (Aldeaquemada) 5. Aldea de Magaña (Santa Elena).
Figure 2.
General area of research. Cases 1 to 3 Sierra Sur. 1. Castillo de Susana (Valdepeñas); 2. Castillo de Otiñar (Los Villares); 3. Castillo de Arenas (Campillo de Arenas); Cases 4 and 5 Sierra Morena: 4. Aldea de Buenos Aires (Aldeaquemada) 5. Aldea de Magaña (Santa Elena).
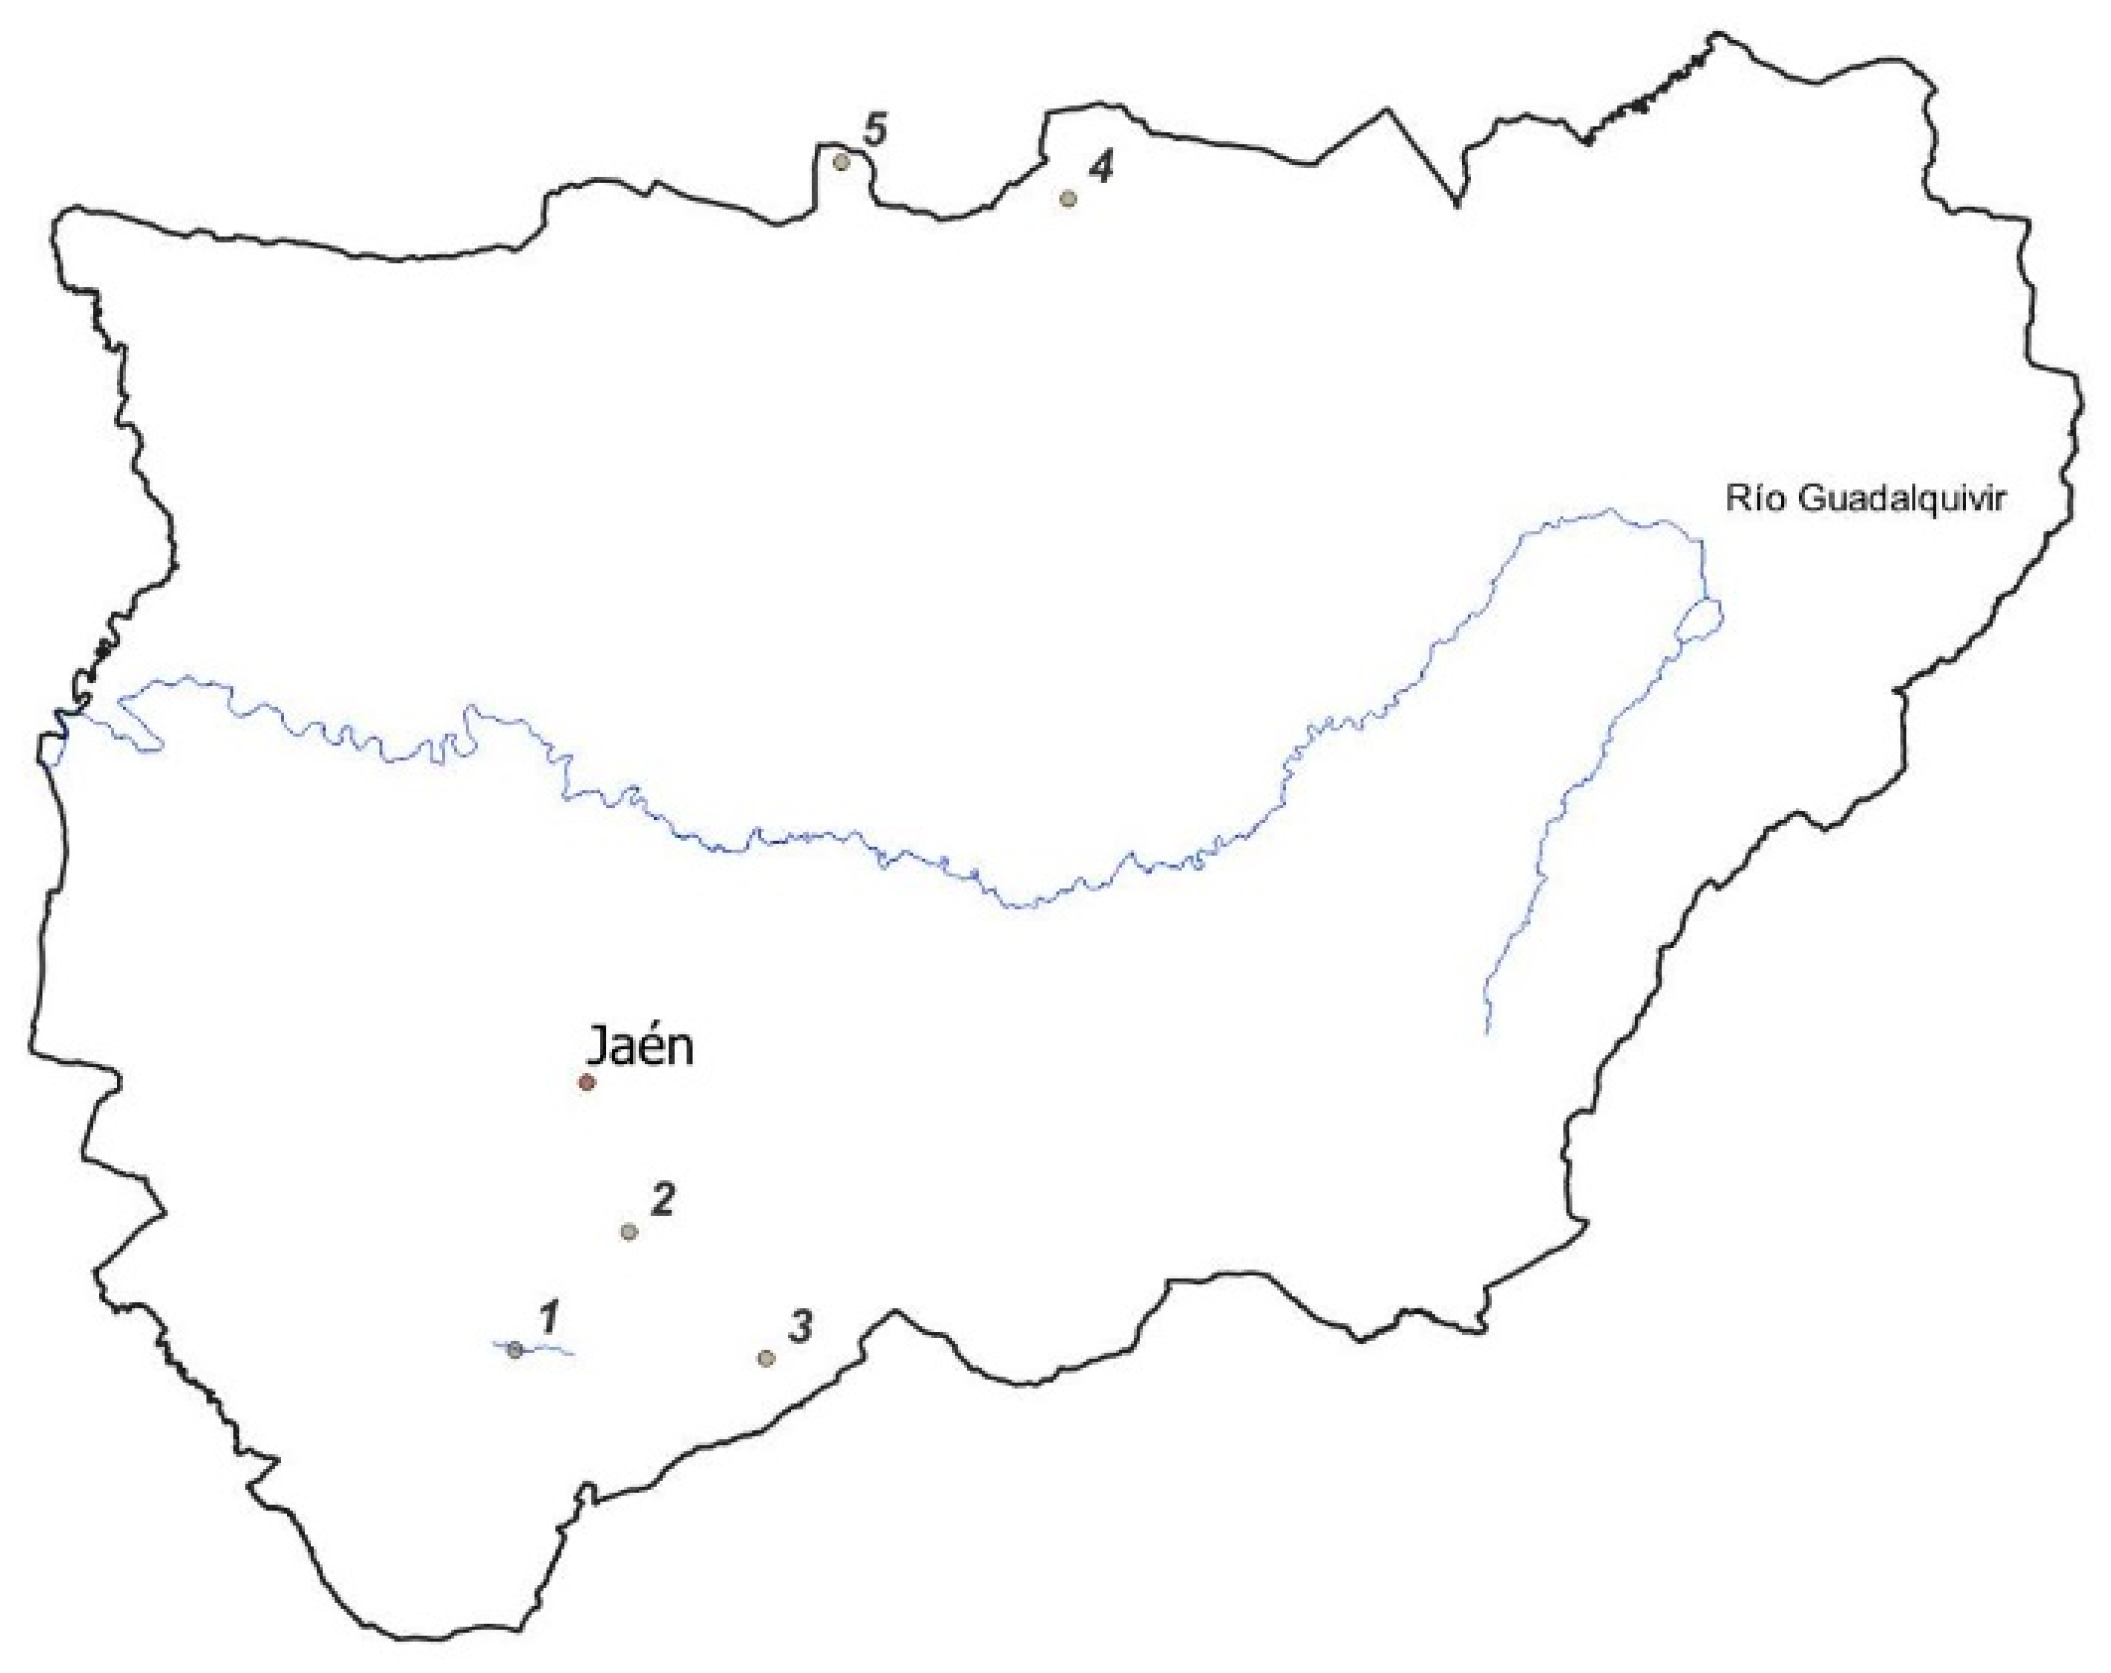
Figure 3.
State of Susana Castle. Source: http://www.redjaen.es/francis/?m=c&o=31555.
Figure 3.
State of Susana Castle. Source: http://www.redjaen.es/francis/?m=c&o=31555.
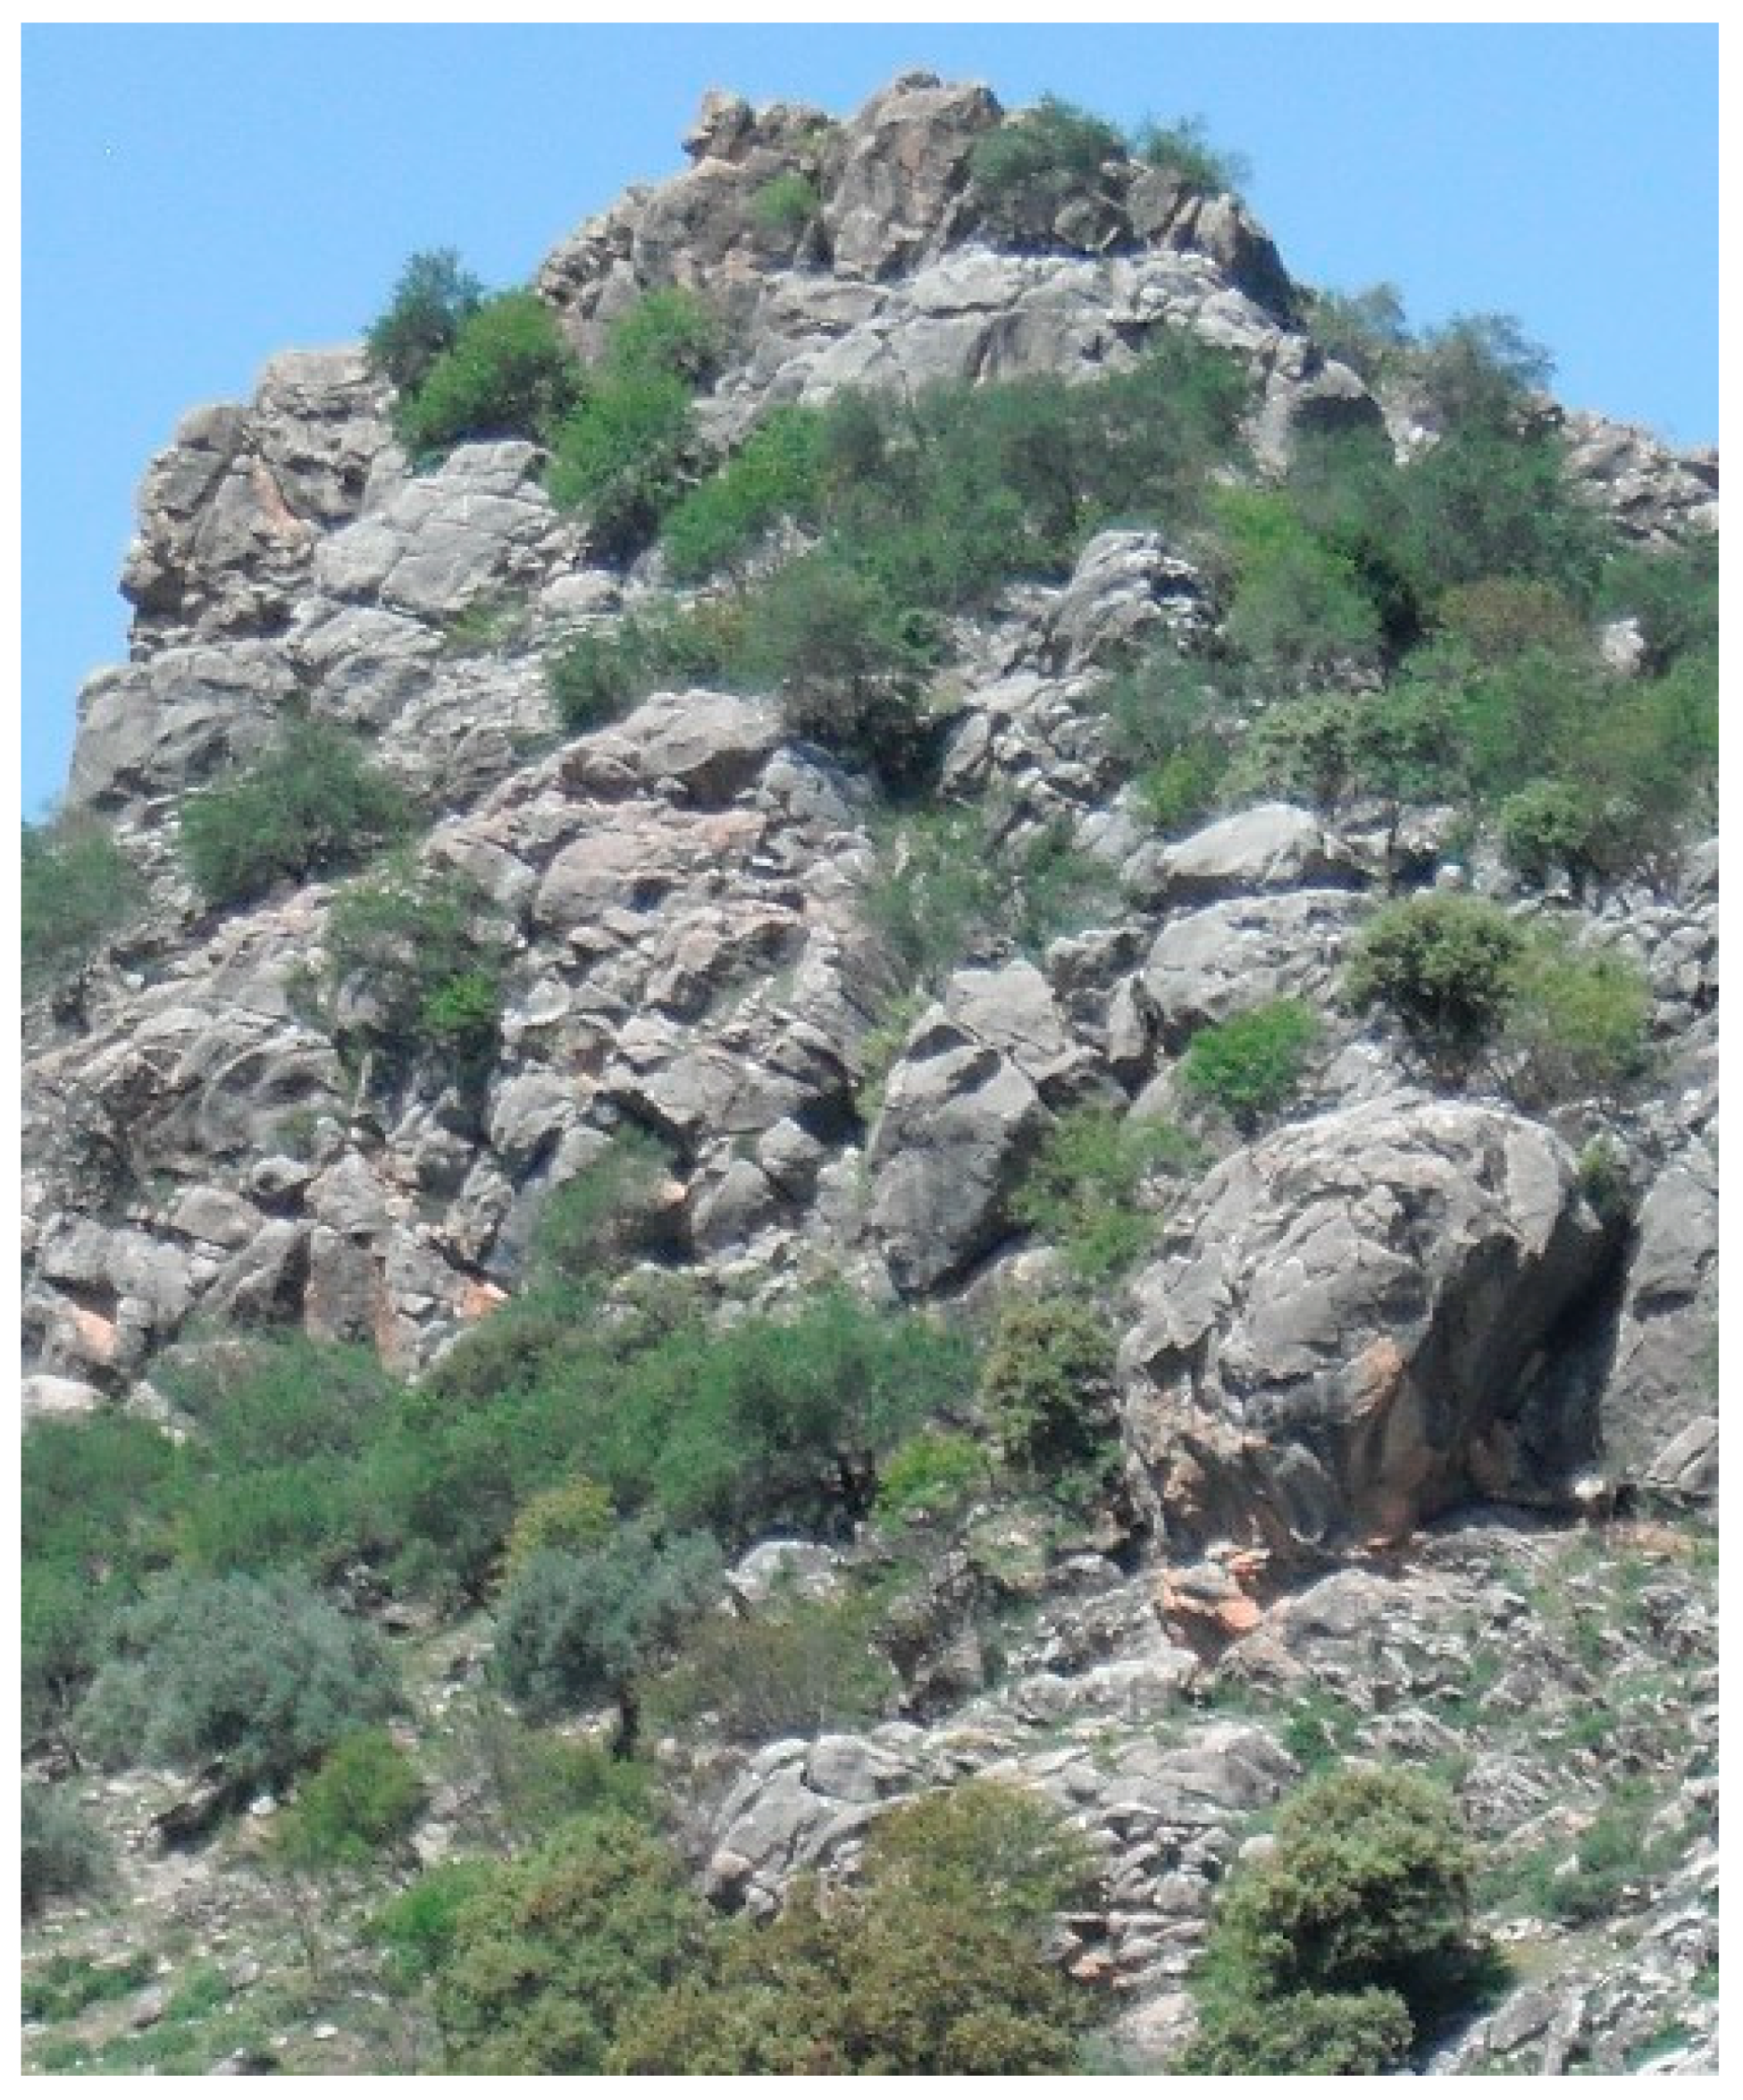
Figure 4.
Castillo de Otiñar. Source: https://www.flickr.com/photos/eduardo72/45317457191.
Figure 4.
Castillo de Otiñar. Source: https://www.flickr.com/photos/eduardo72/45317457191.
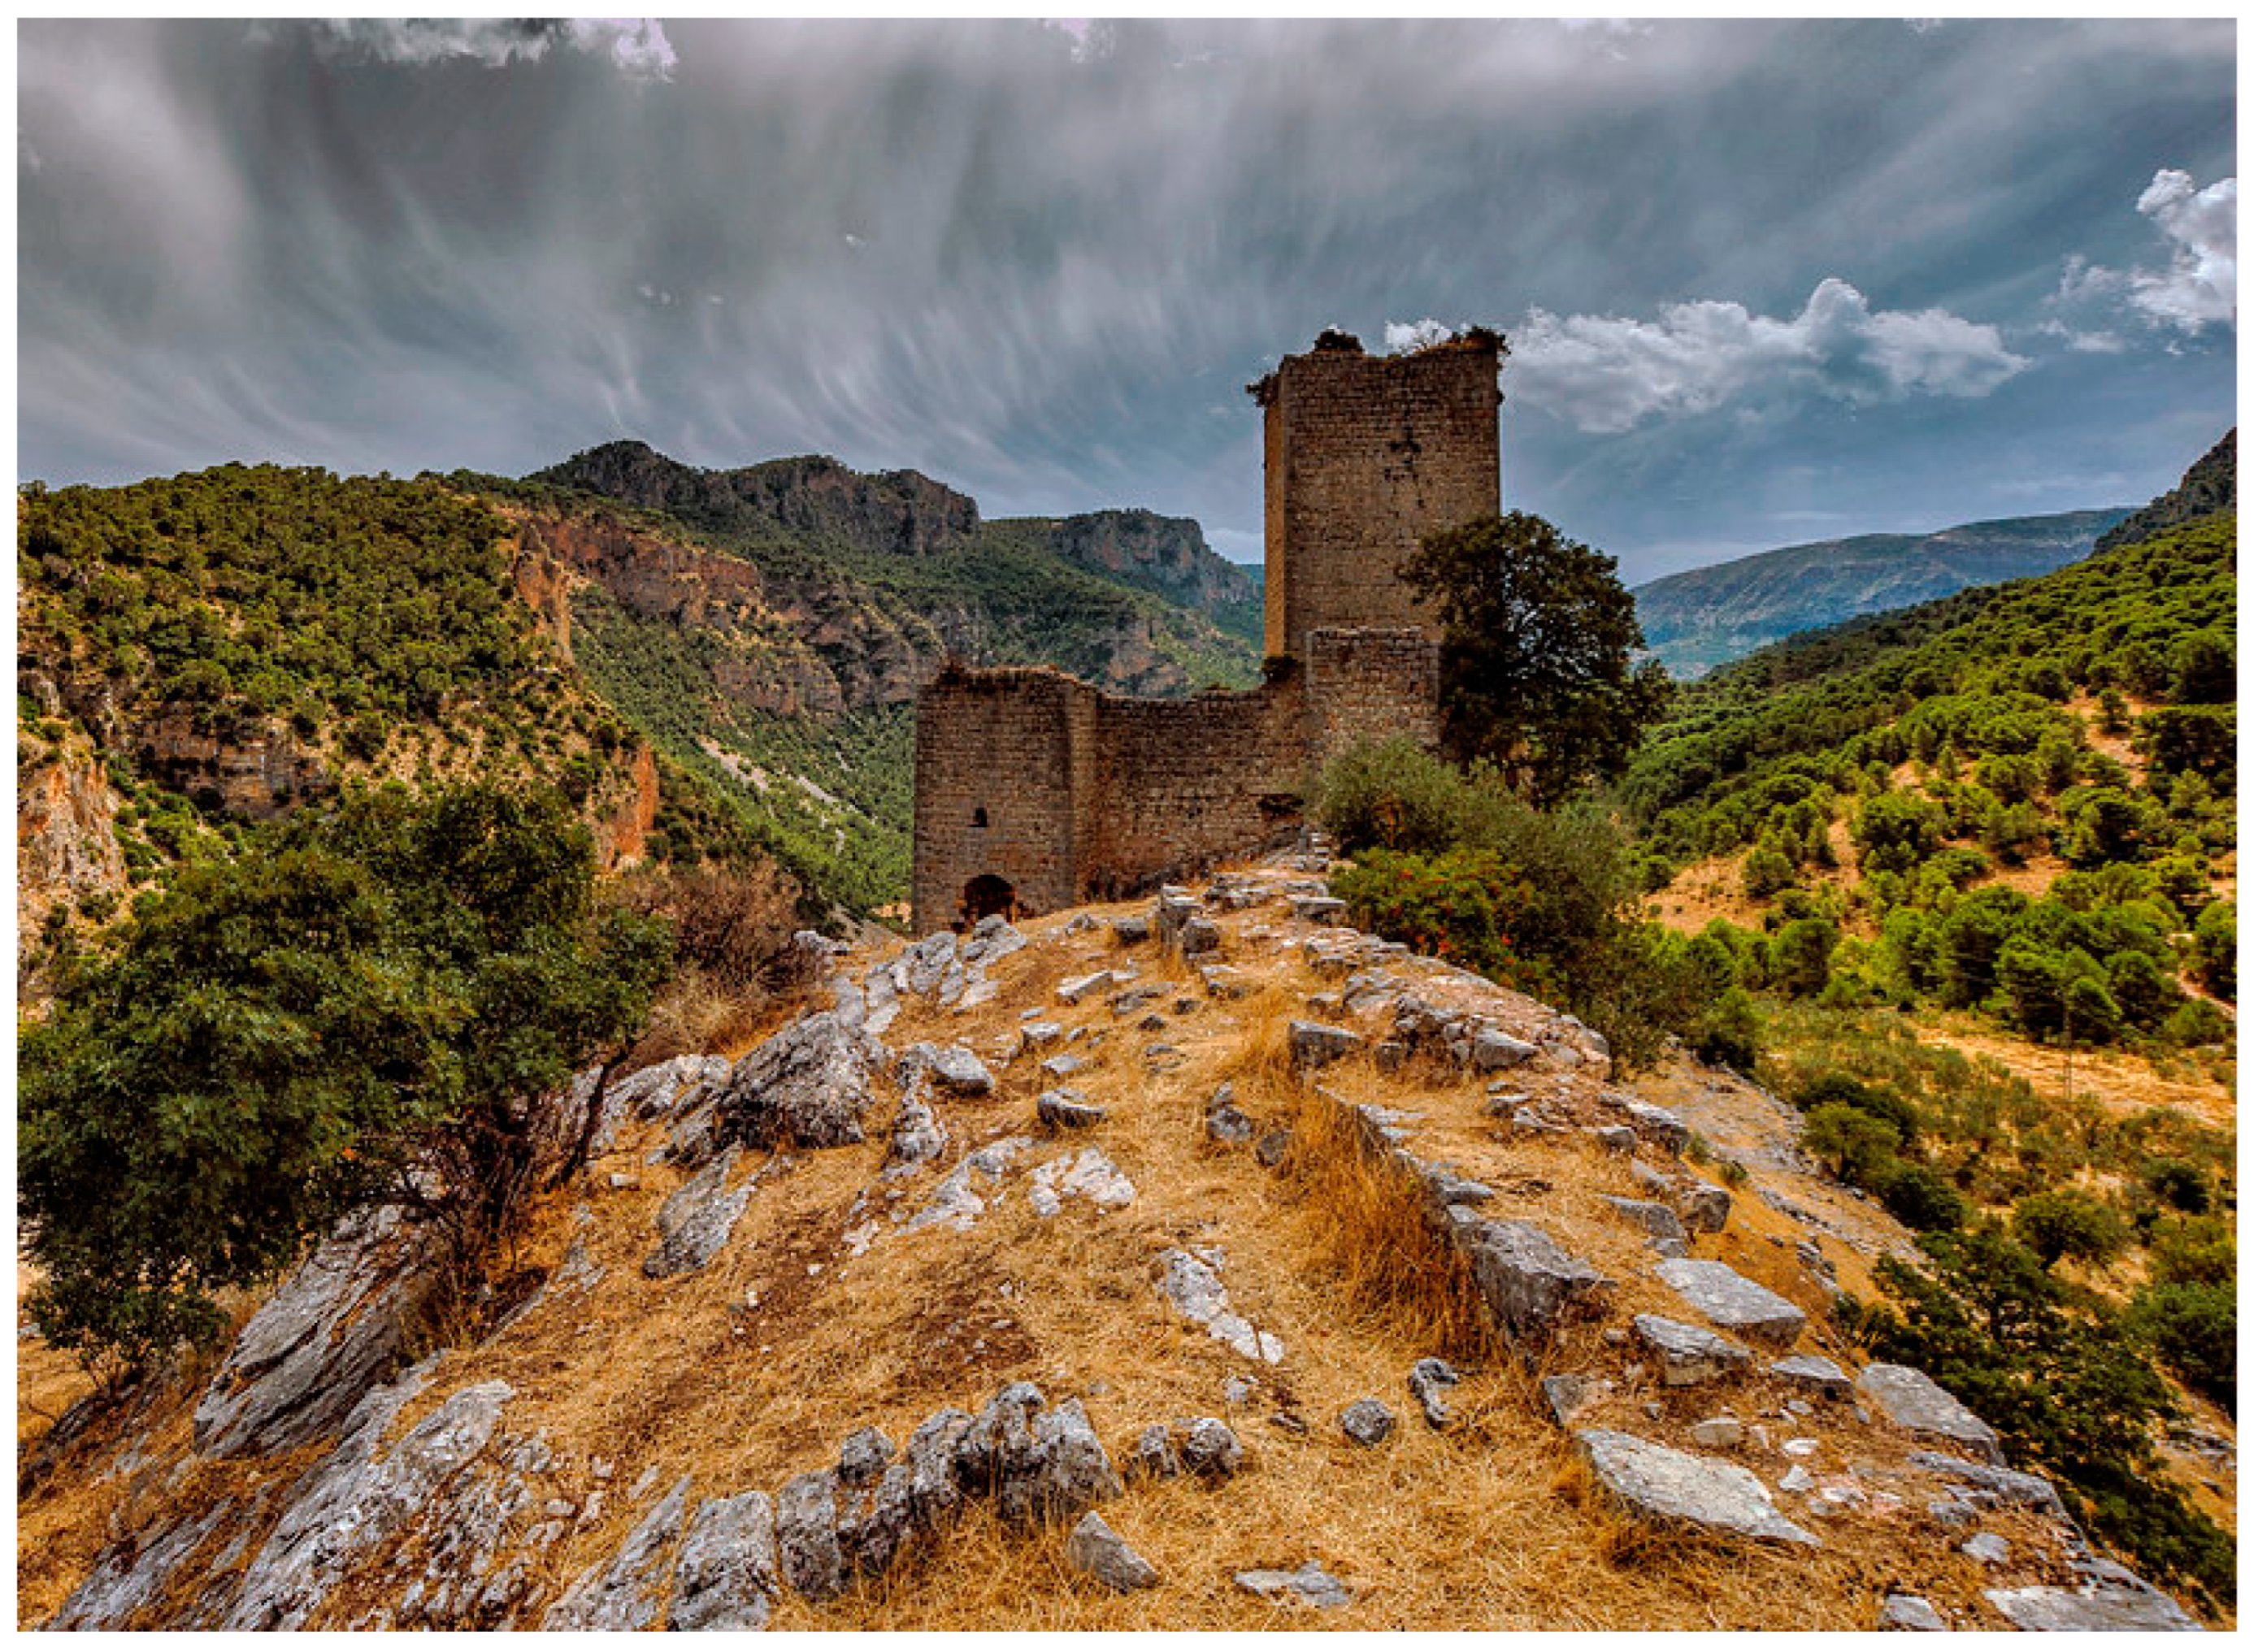
Figure 5.
The present-day condition of Arenas Castle. Source: https://corazondelasierrasur.com/blog/castillo-de-arenas-en-jaen/
Figure 5.
The present-day condition of Arenas Castle. Source: https://corazondelasierrasur.com/blog/castillo-de-arenas-en-jaen/
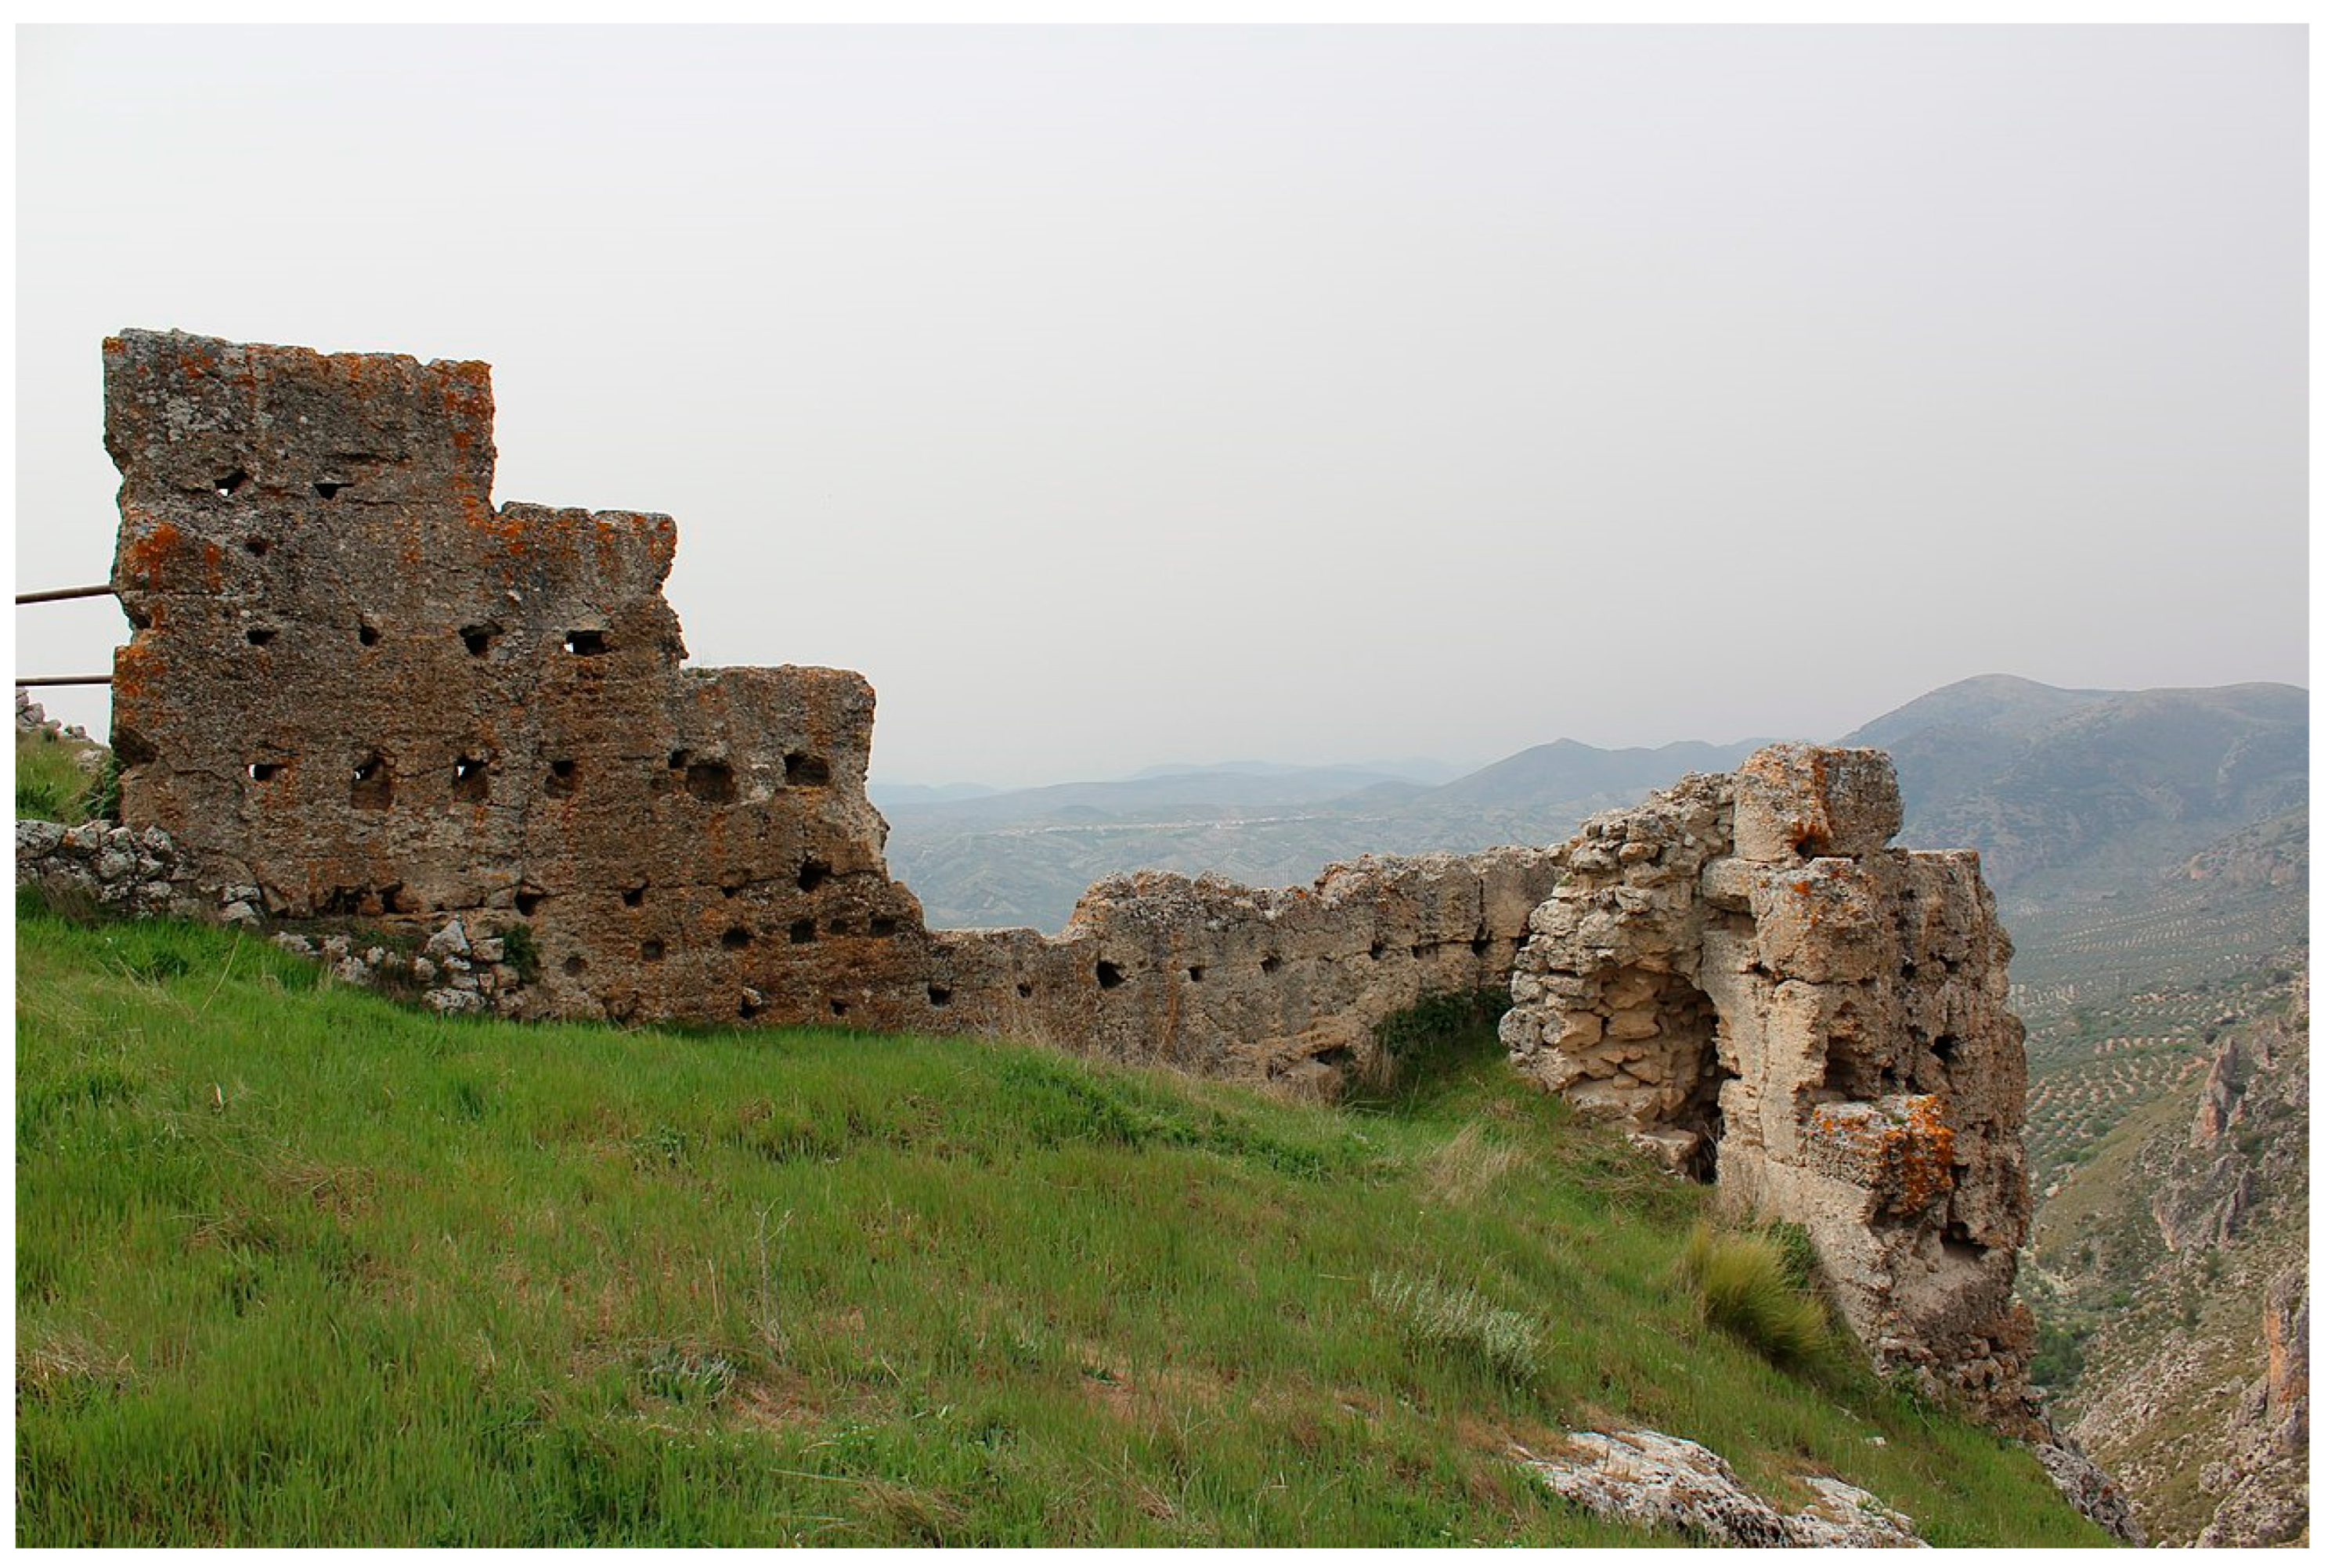
Figure 6.
3D model of the current state of Aldea de Buenos Aires. Source: the authors.
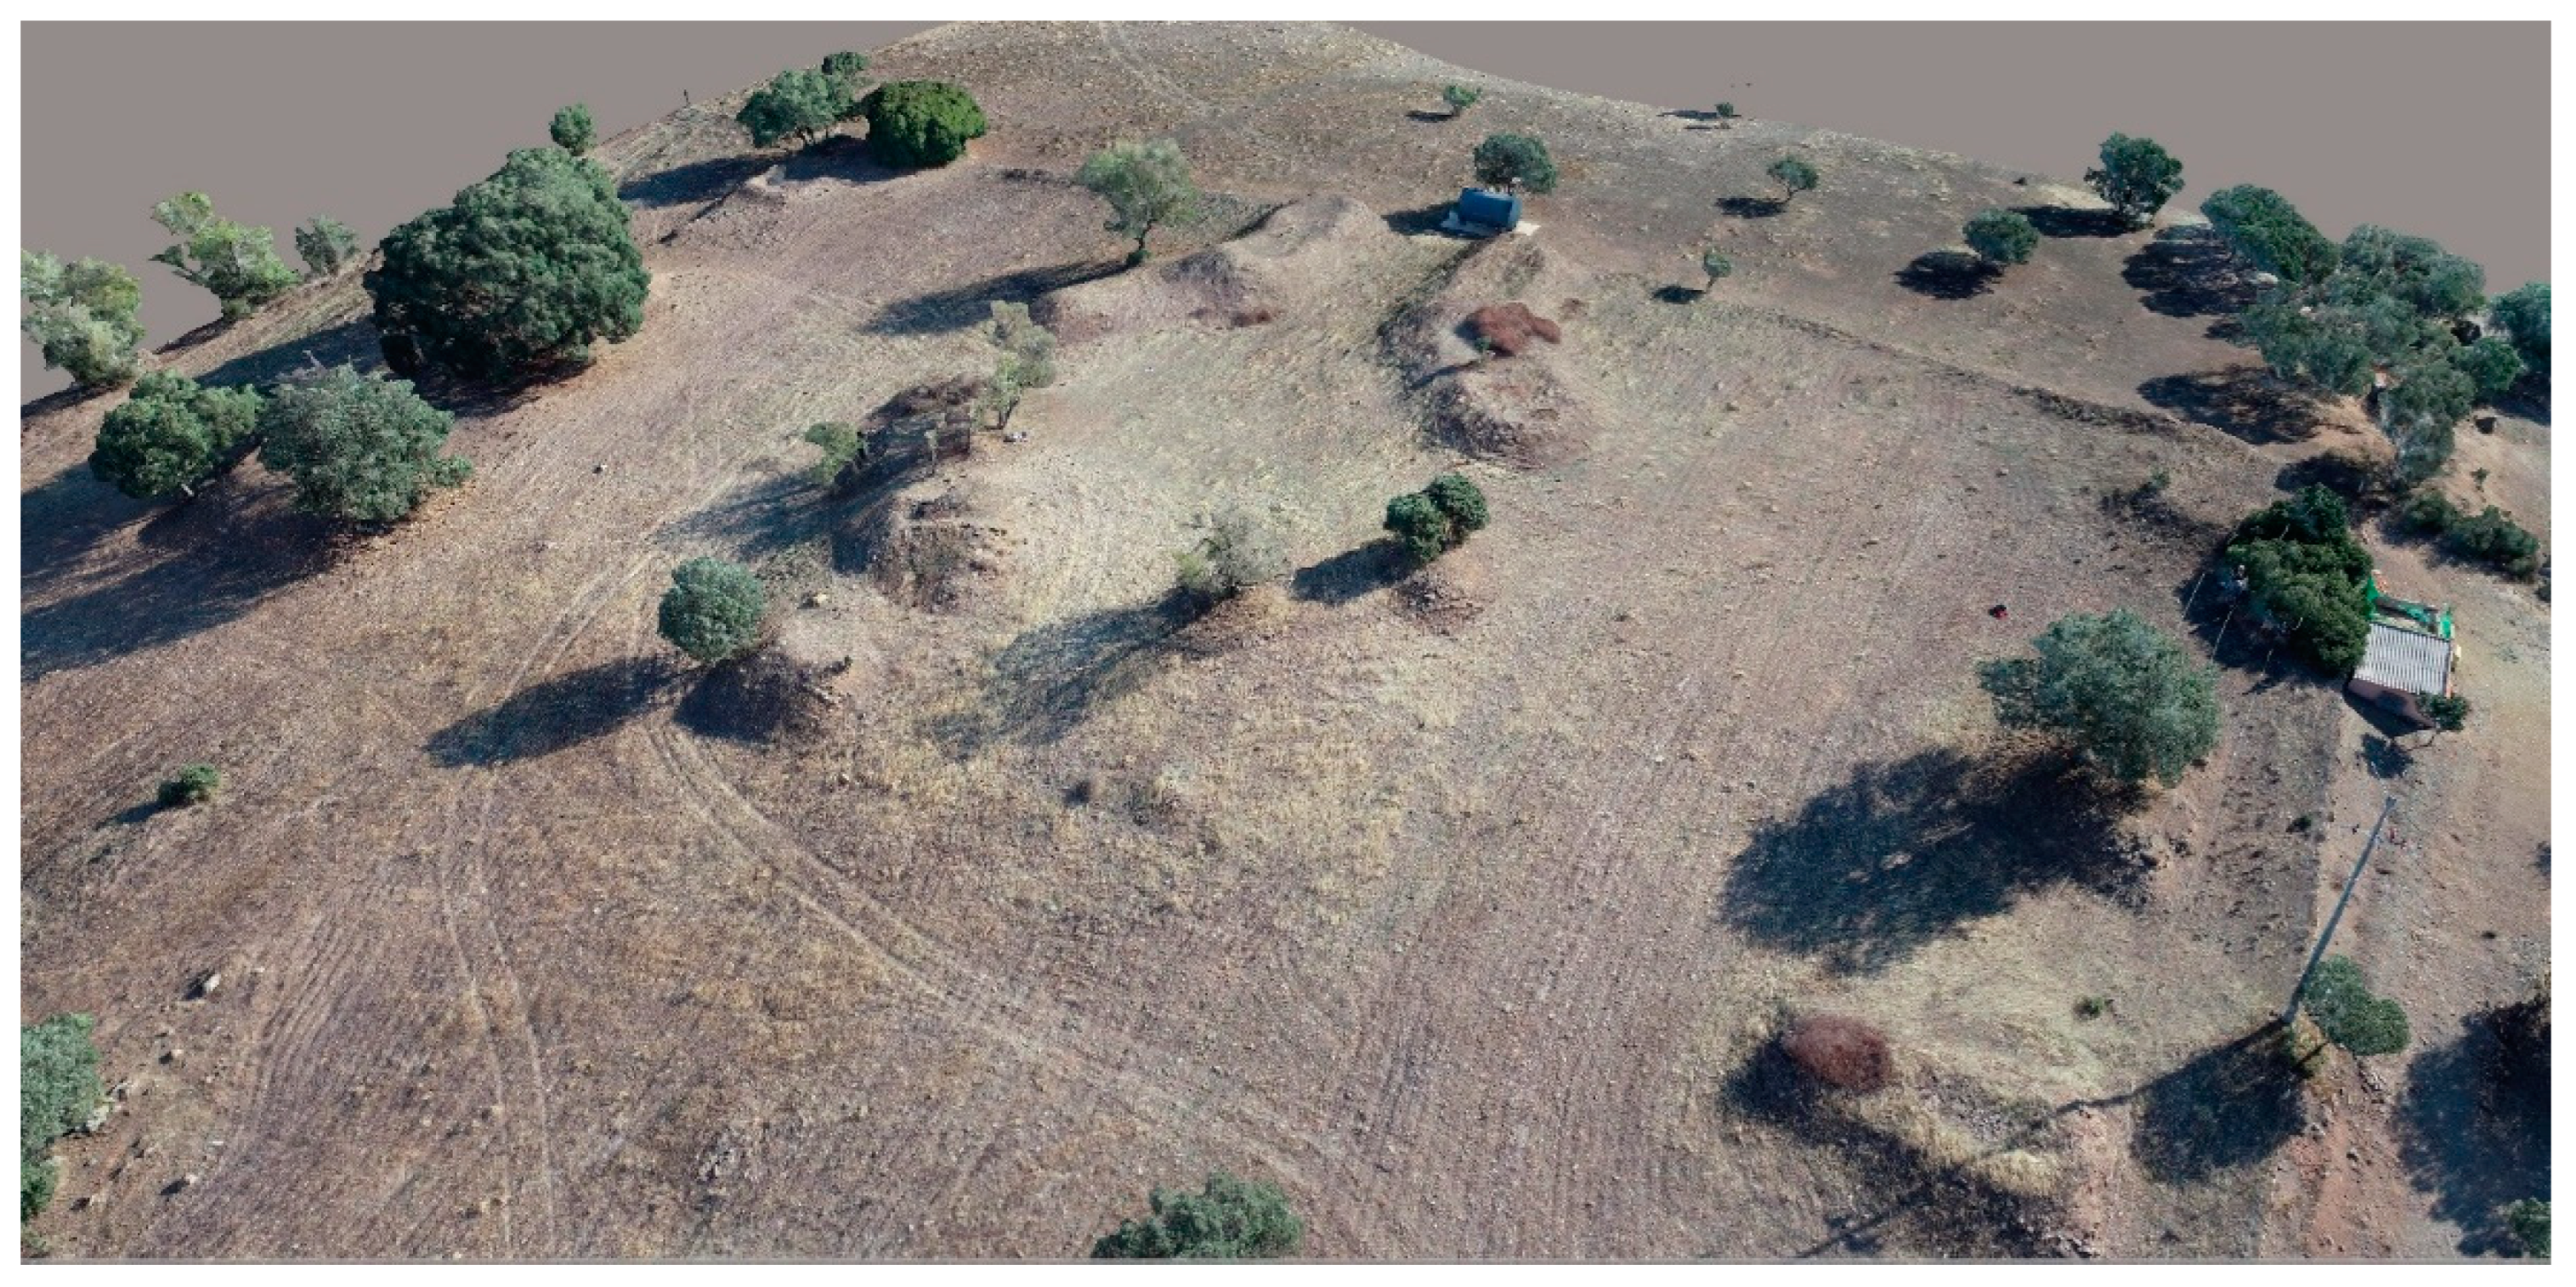
Figure 7.
3D image of the present-day condition of Aldea de Magaña. Source: the authors.
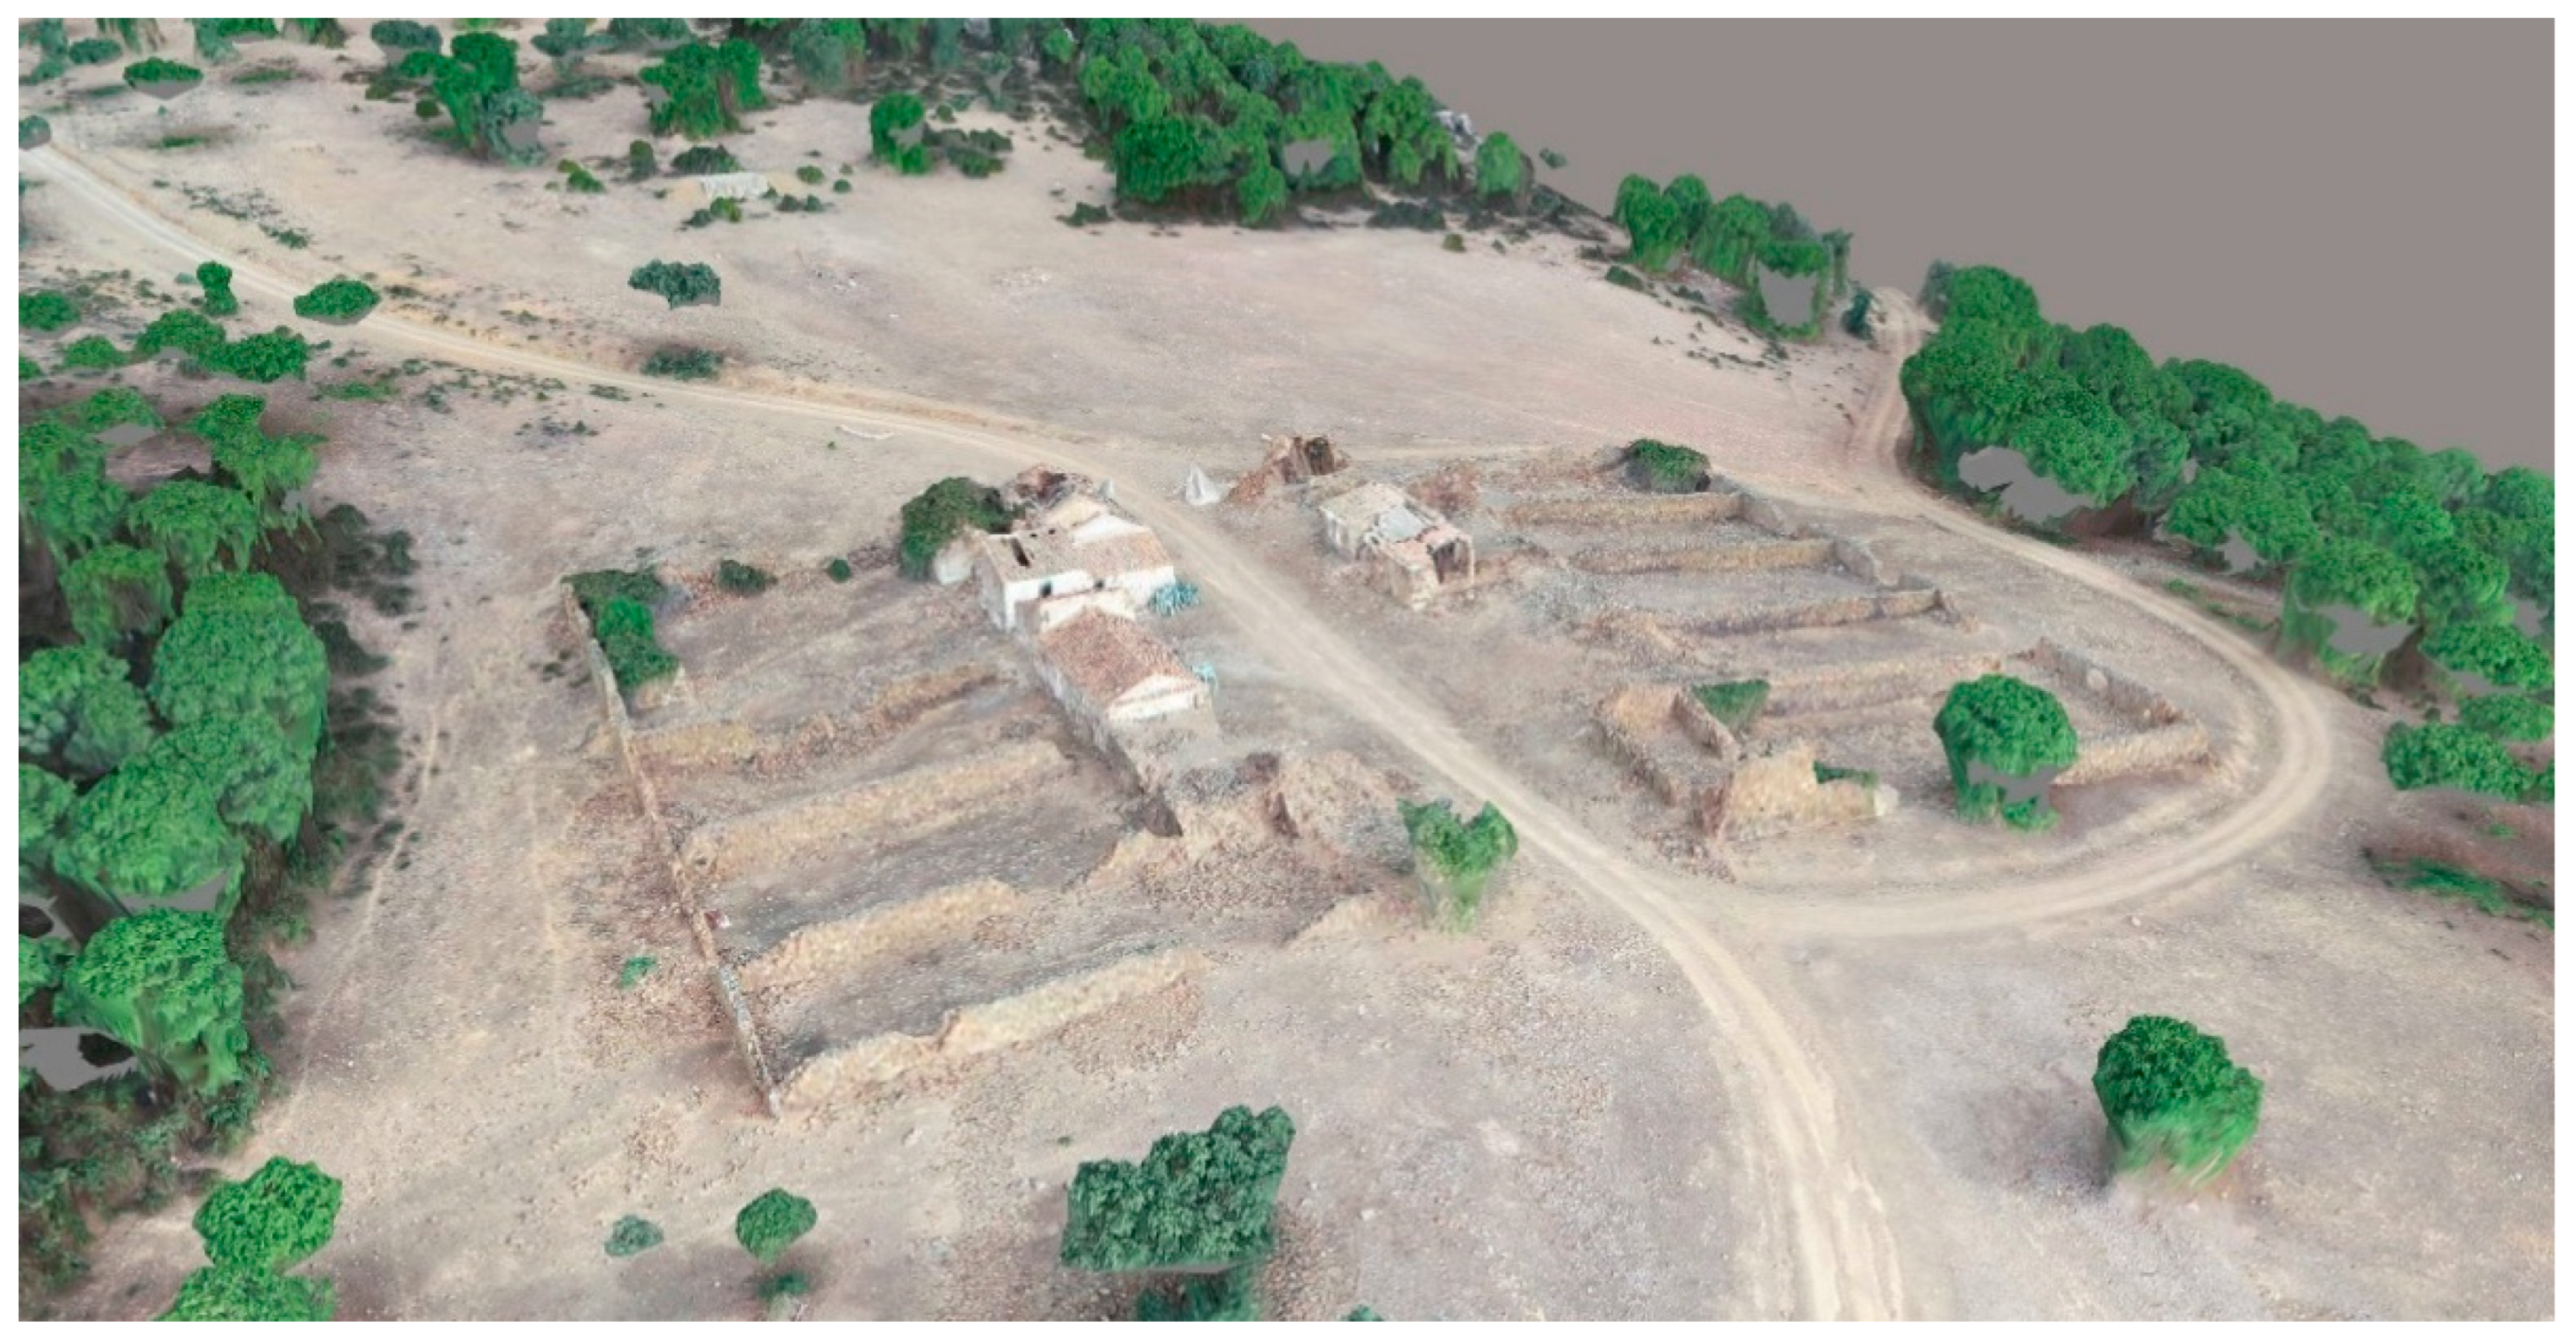
Figure 8.
Scheme of the proposed objectives.
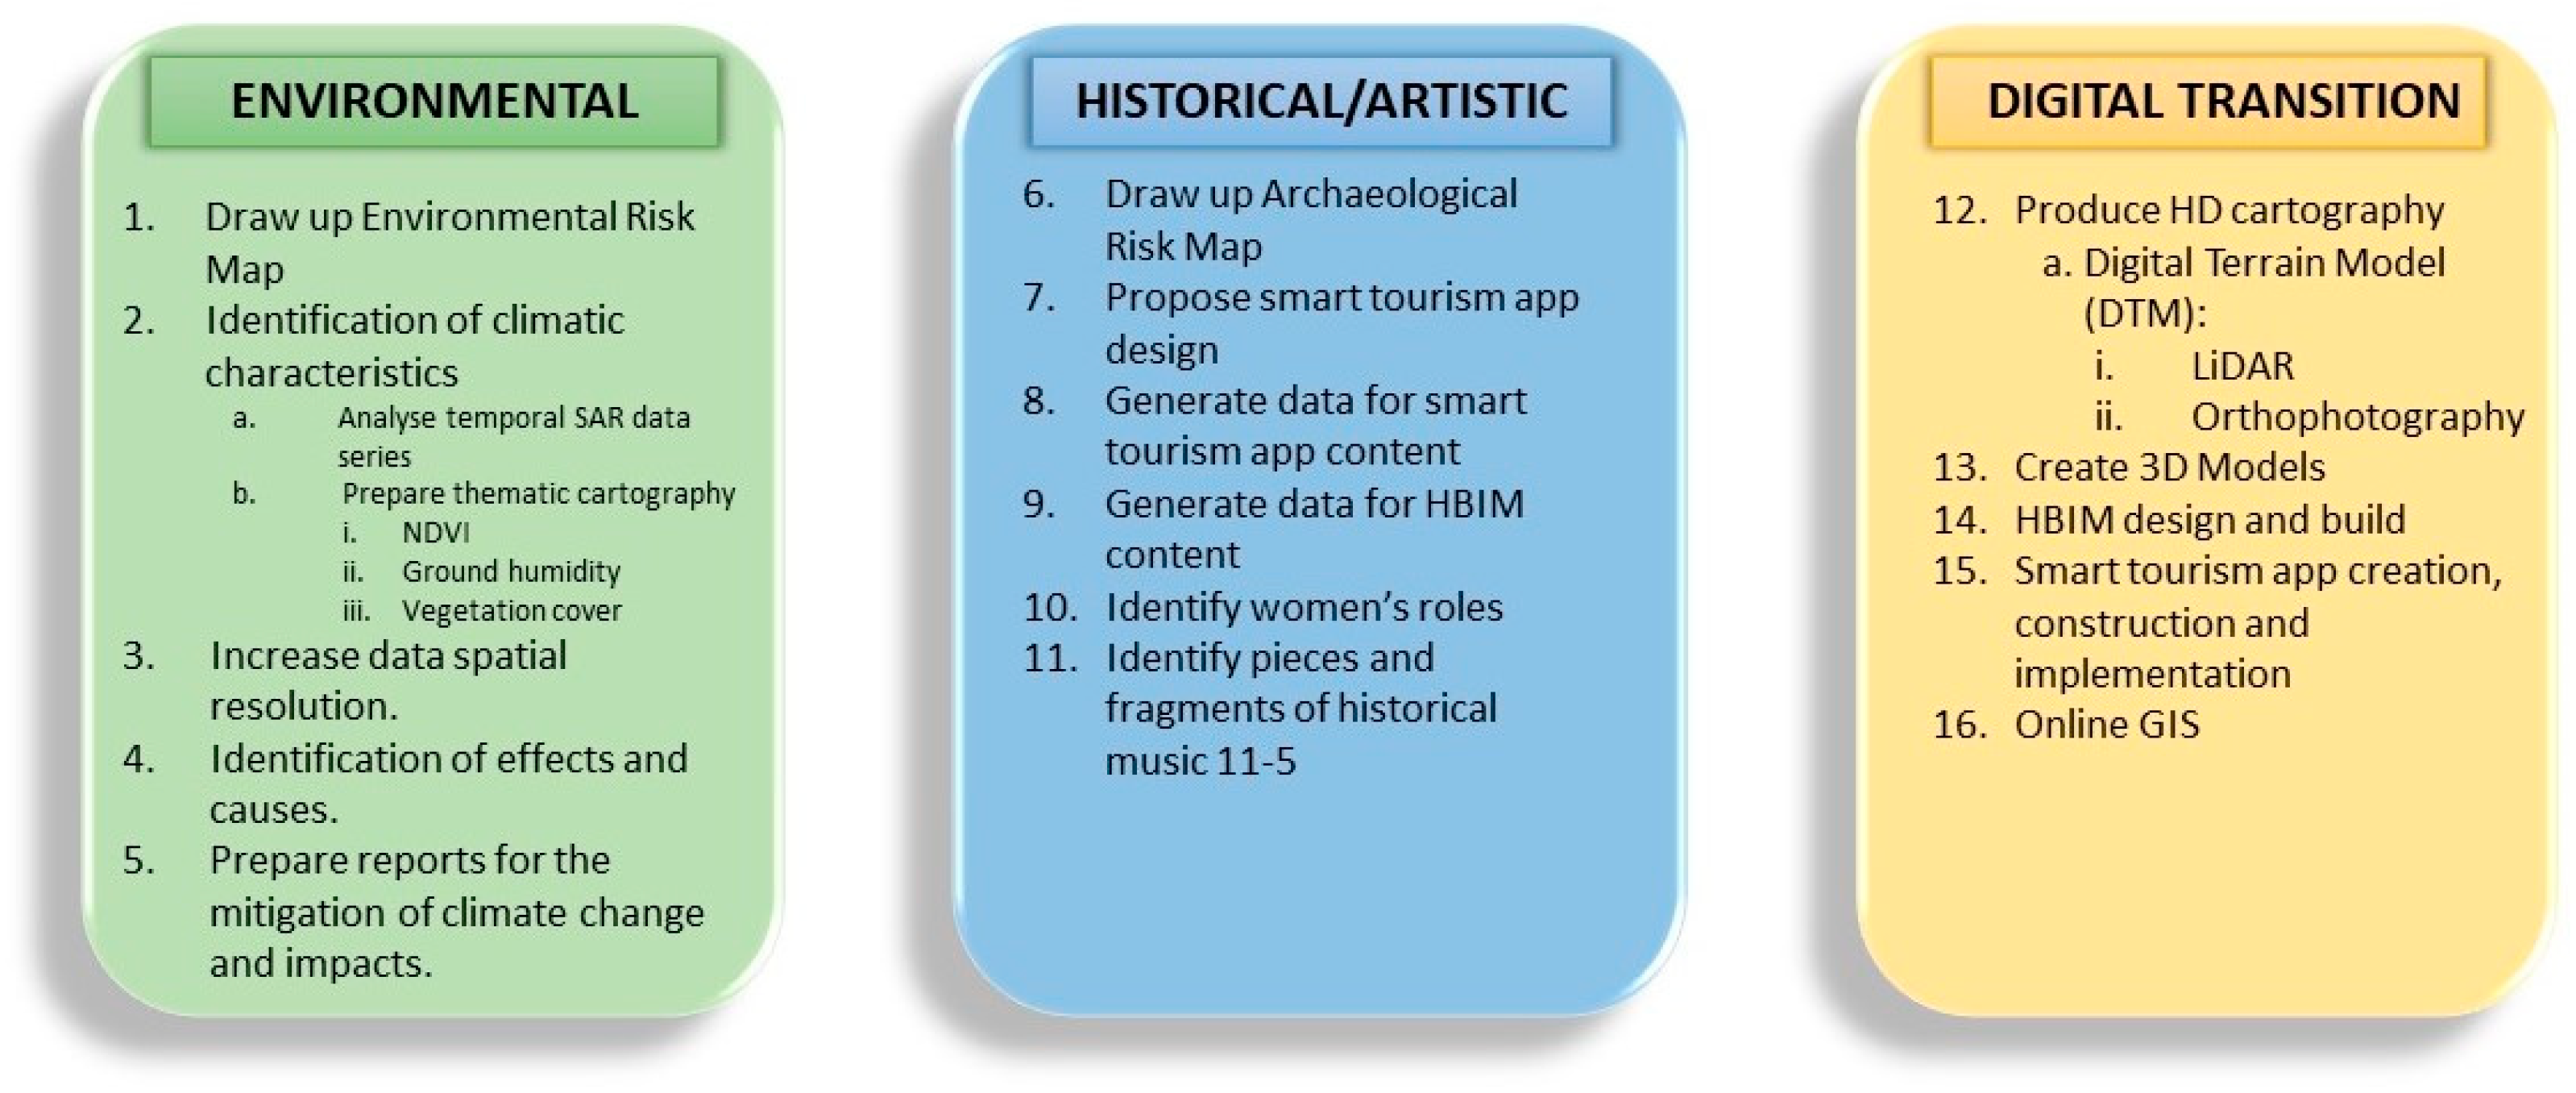
Figure 9.
Scheme of the proposed methodology.
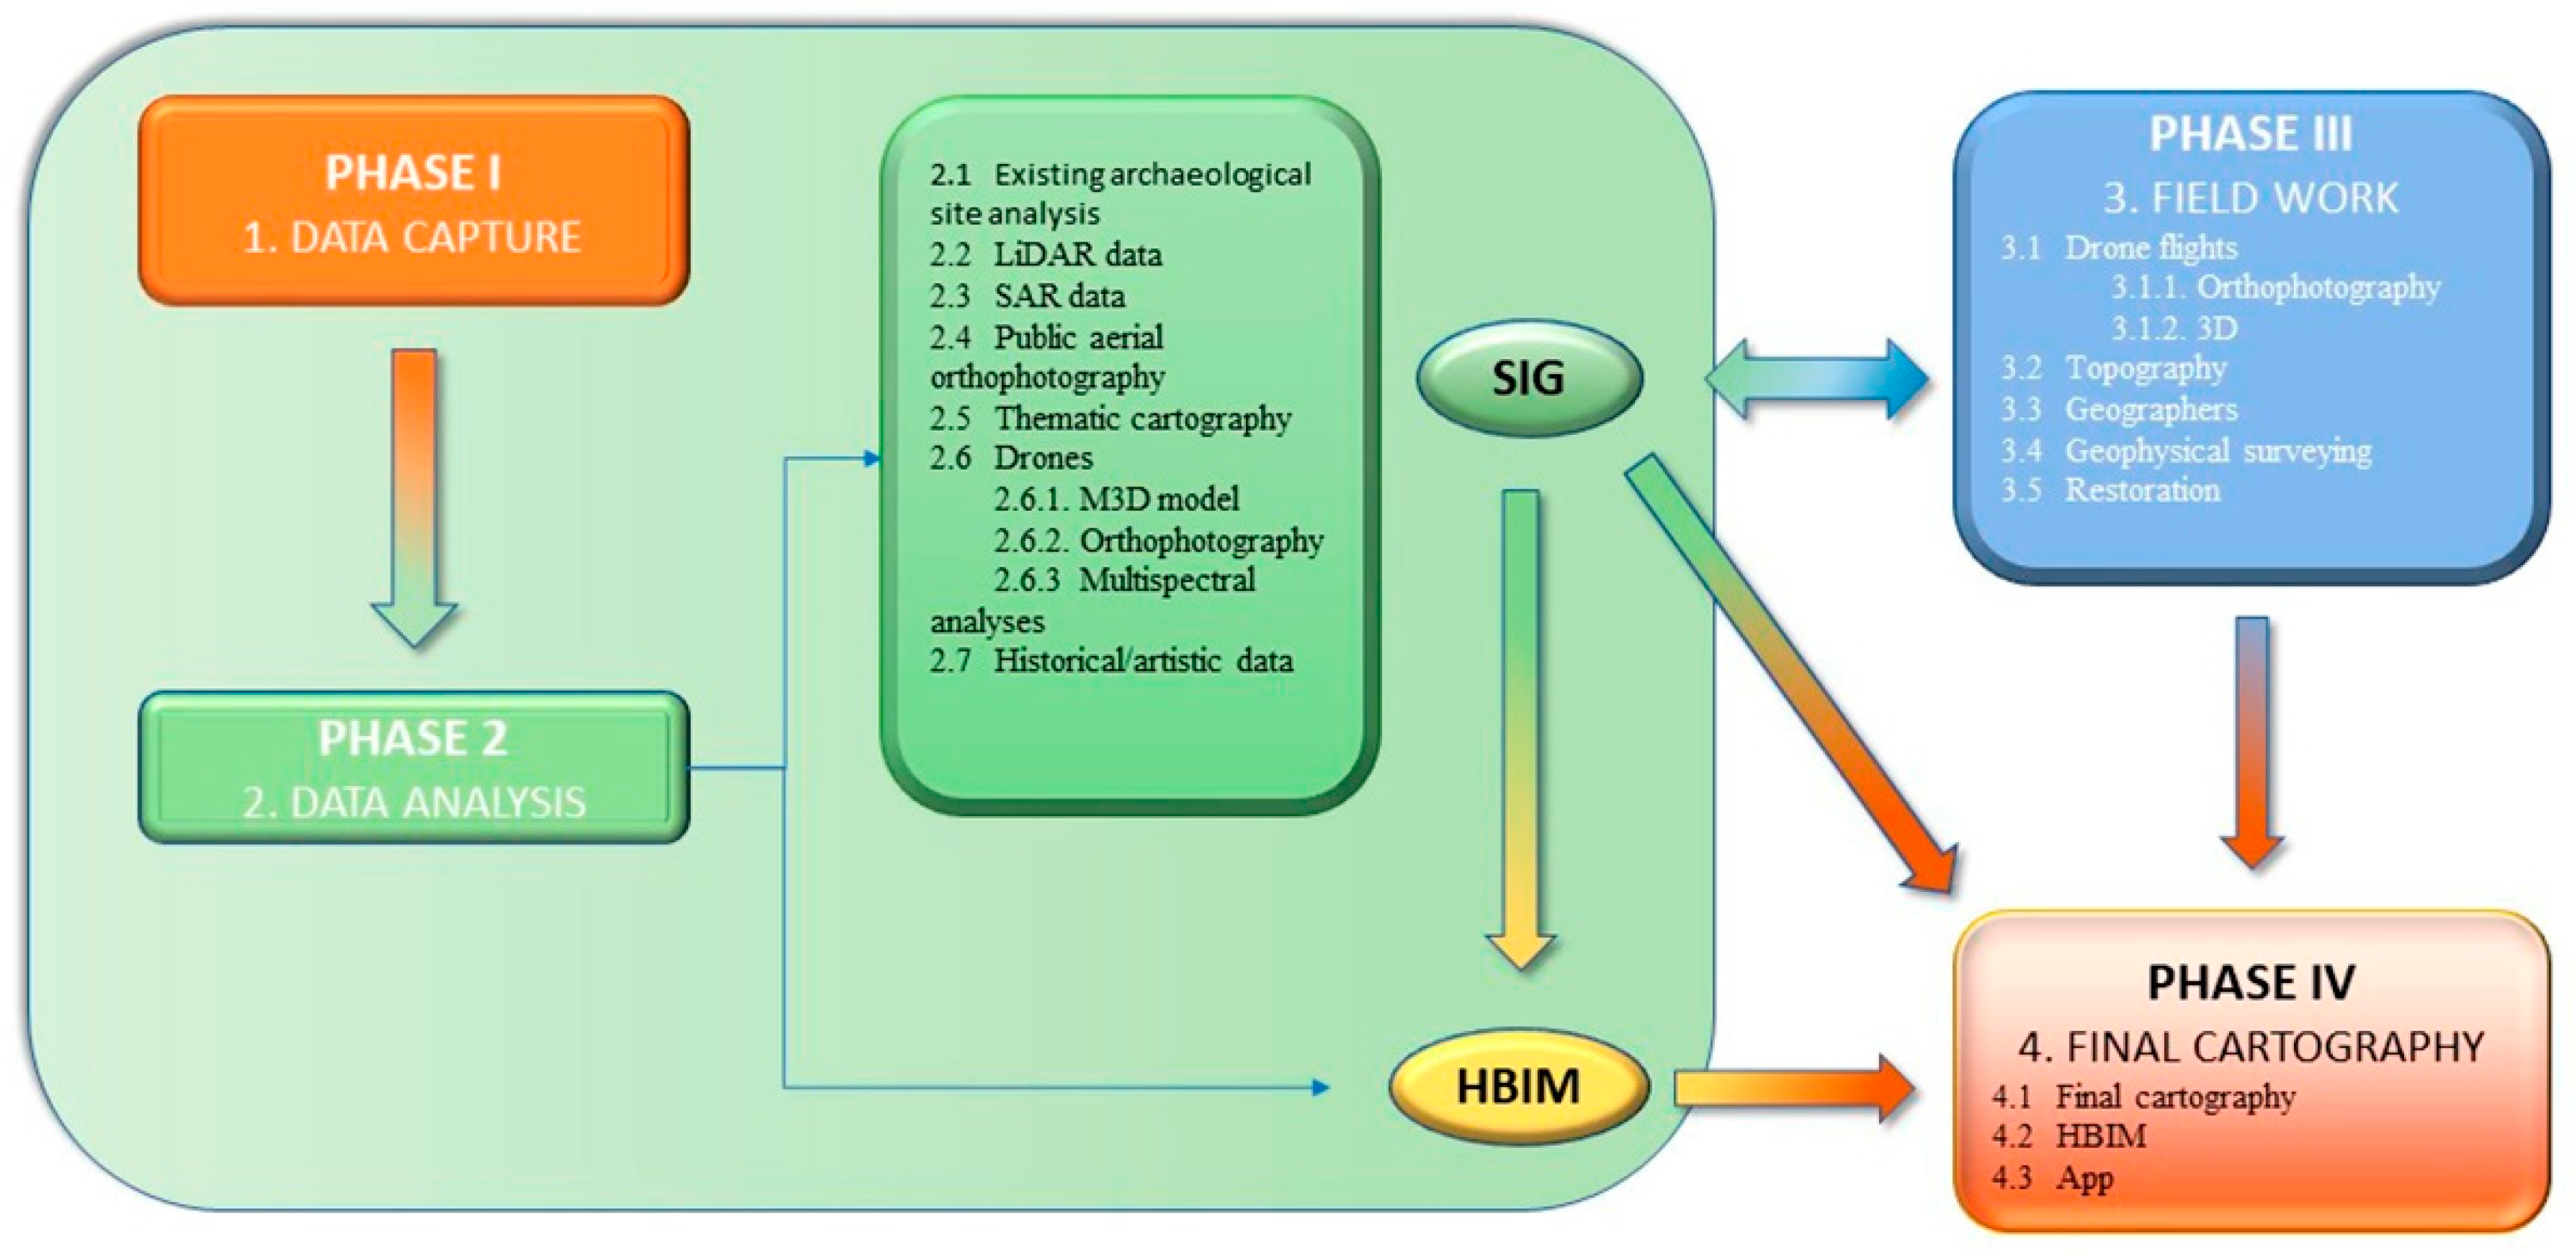
Figure 10.
3D model of the village of Buenos Aires. Source: the authors.
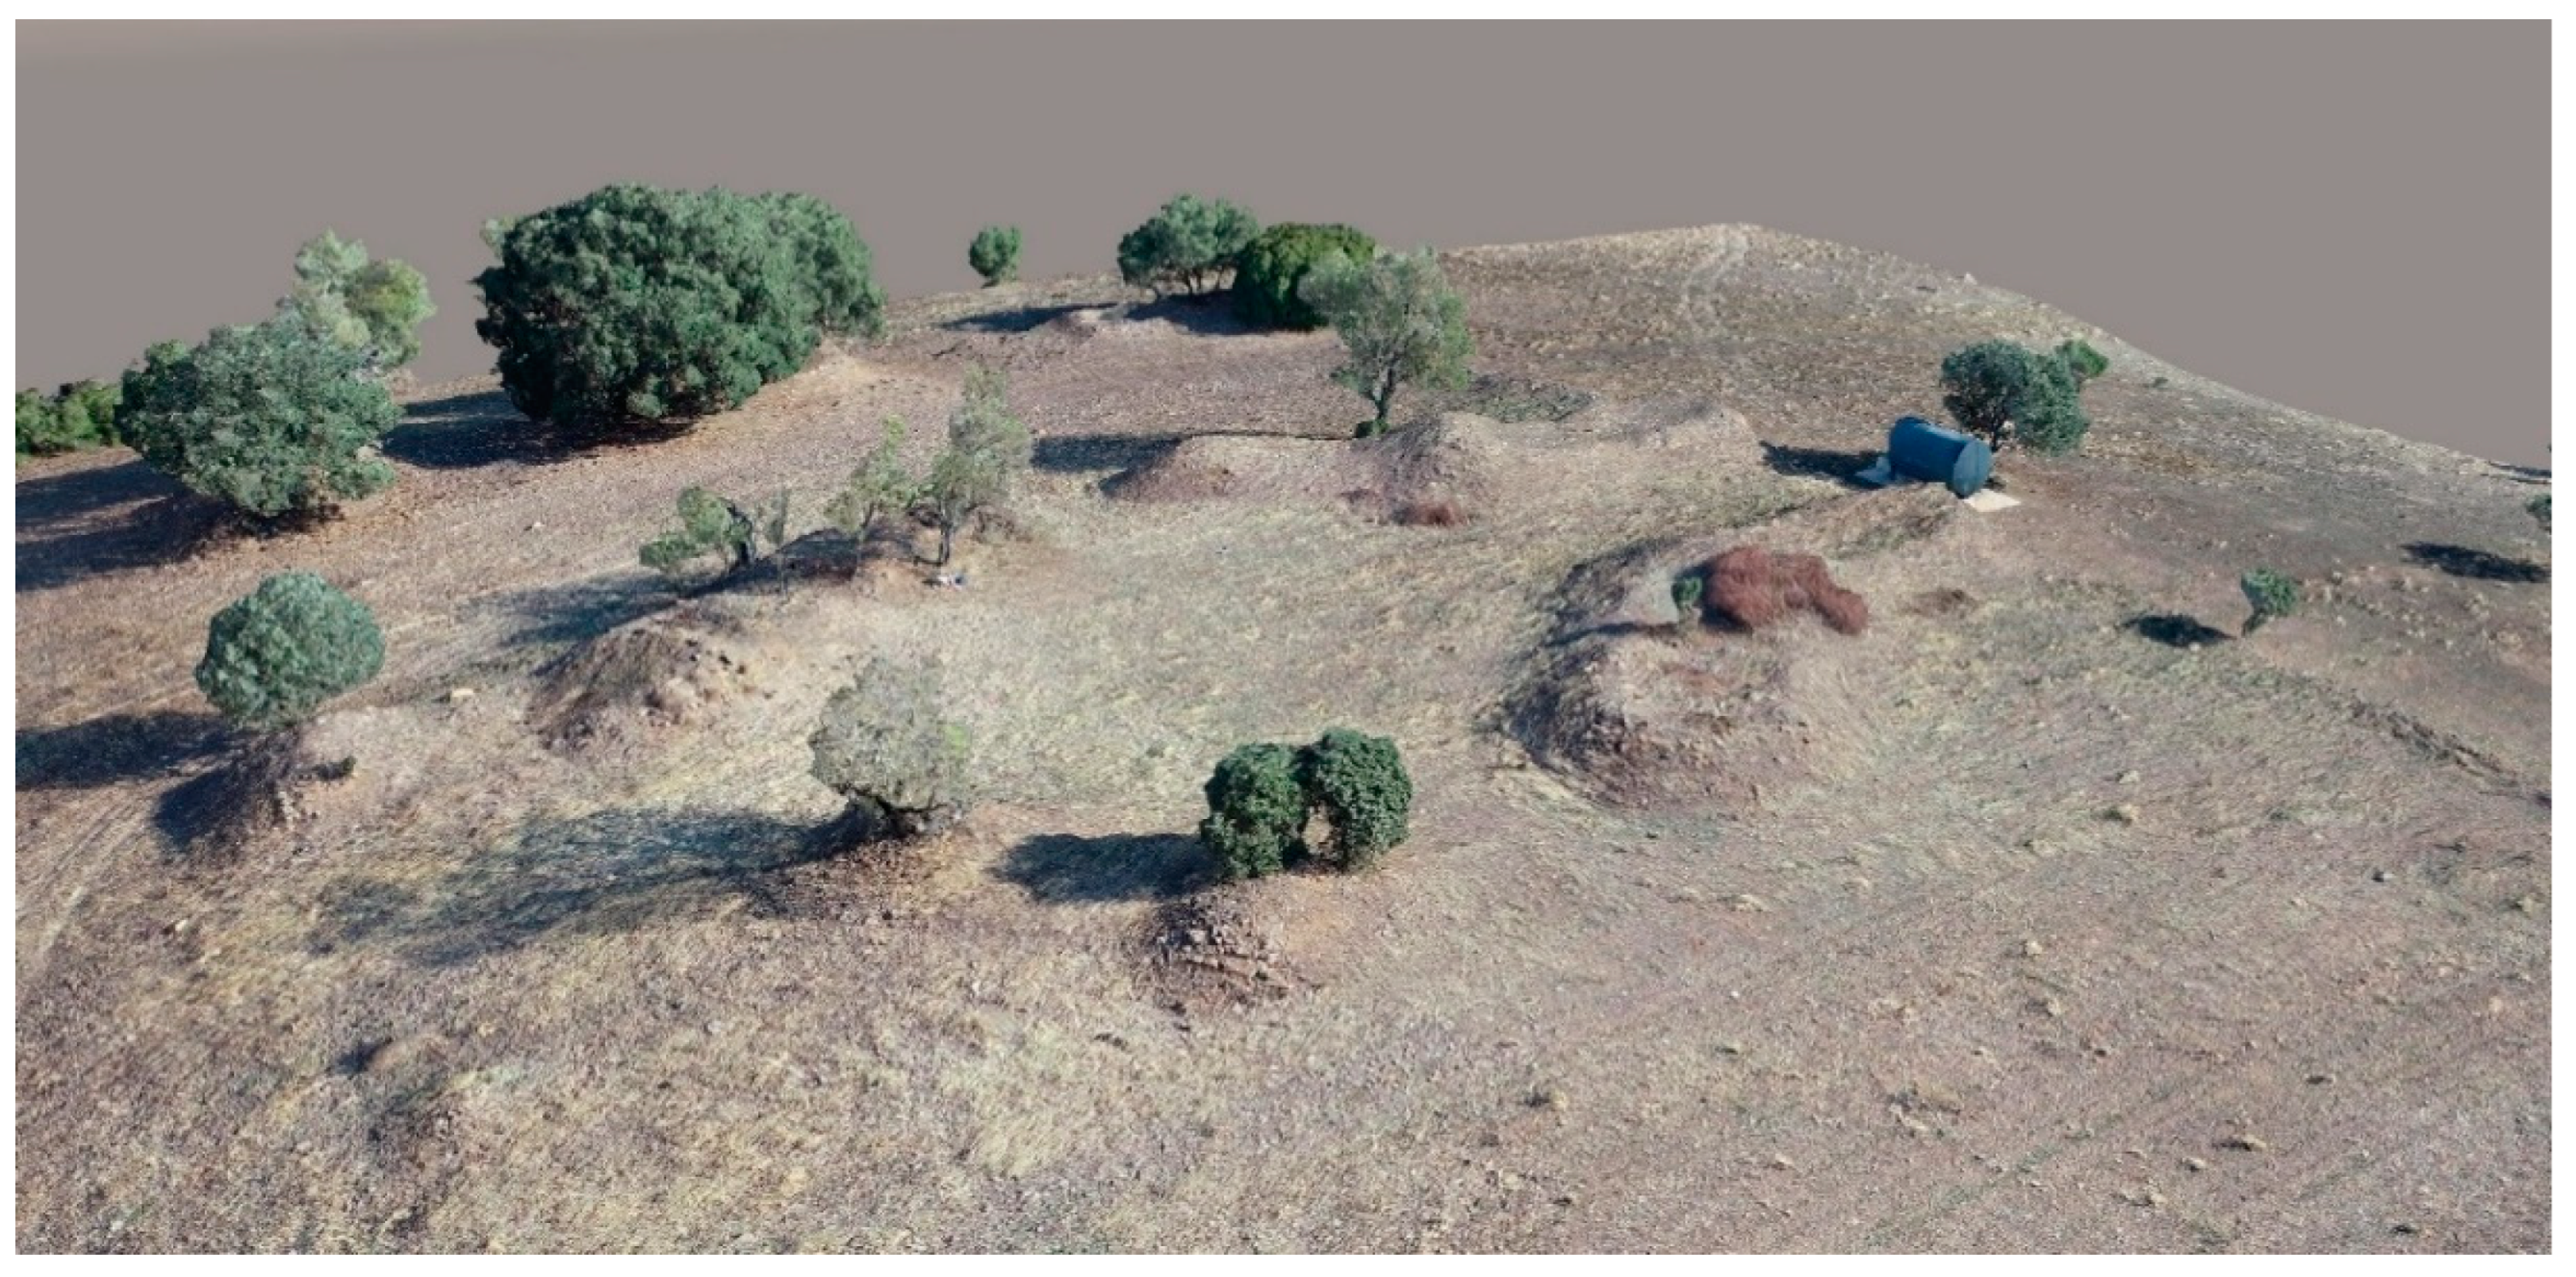
Figure 12.
NDVI calculated from multispectral image taken in the village of Buenos Aires. Sierra Morena, in which we can appreciate the presence of two palaeo-channels. Source: the authors.
Figure 12.
NDVI calculated from multispectral image taken in the village of Buenos Aires. Sierra Morena, in which we can appreciate the presence of two palaeo-channels. Source: the authors.
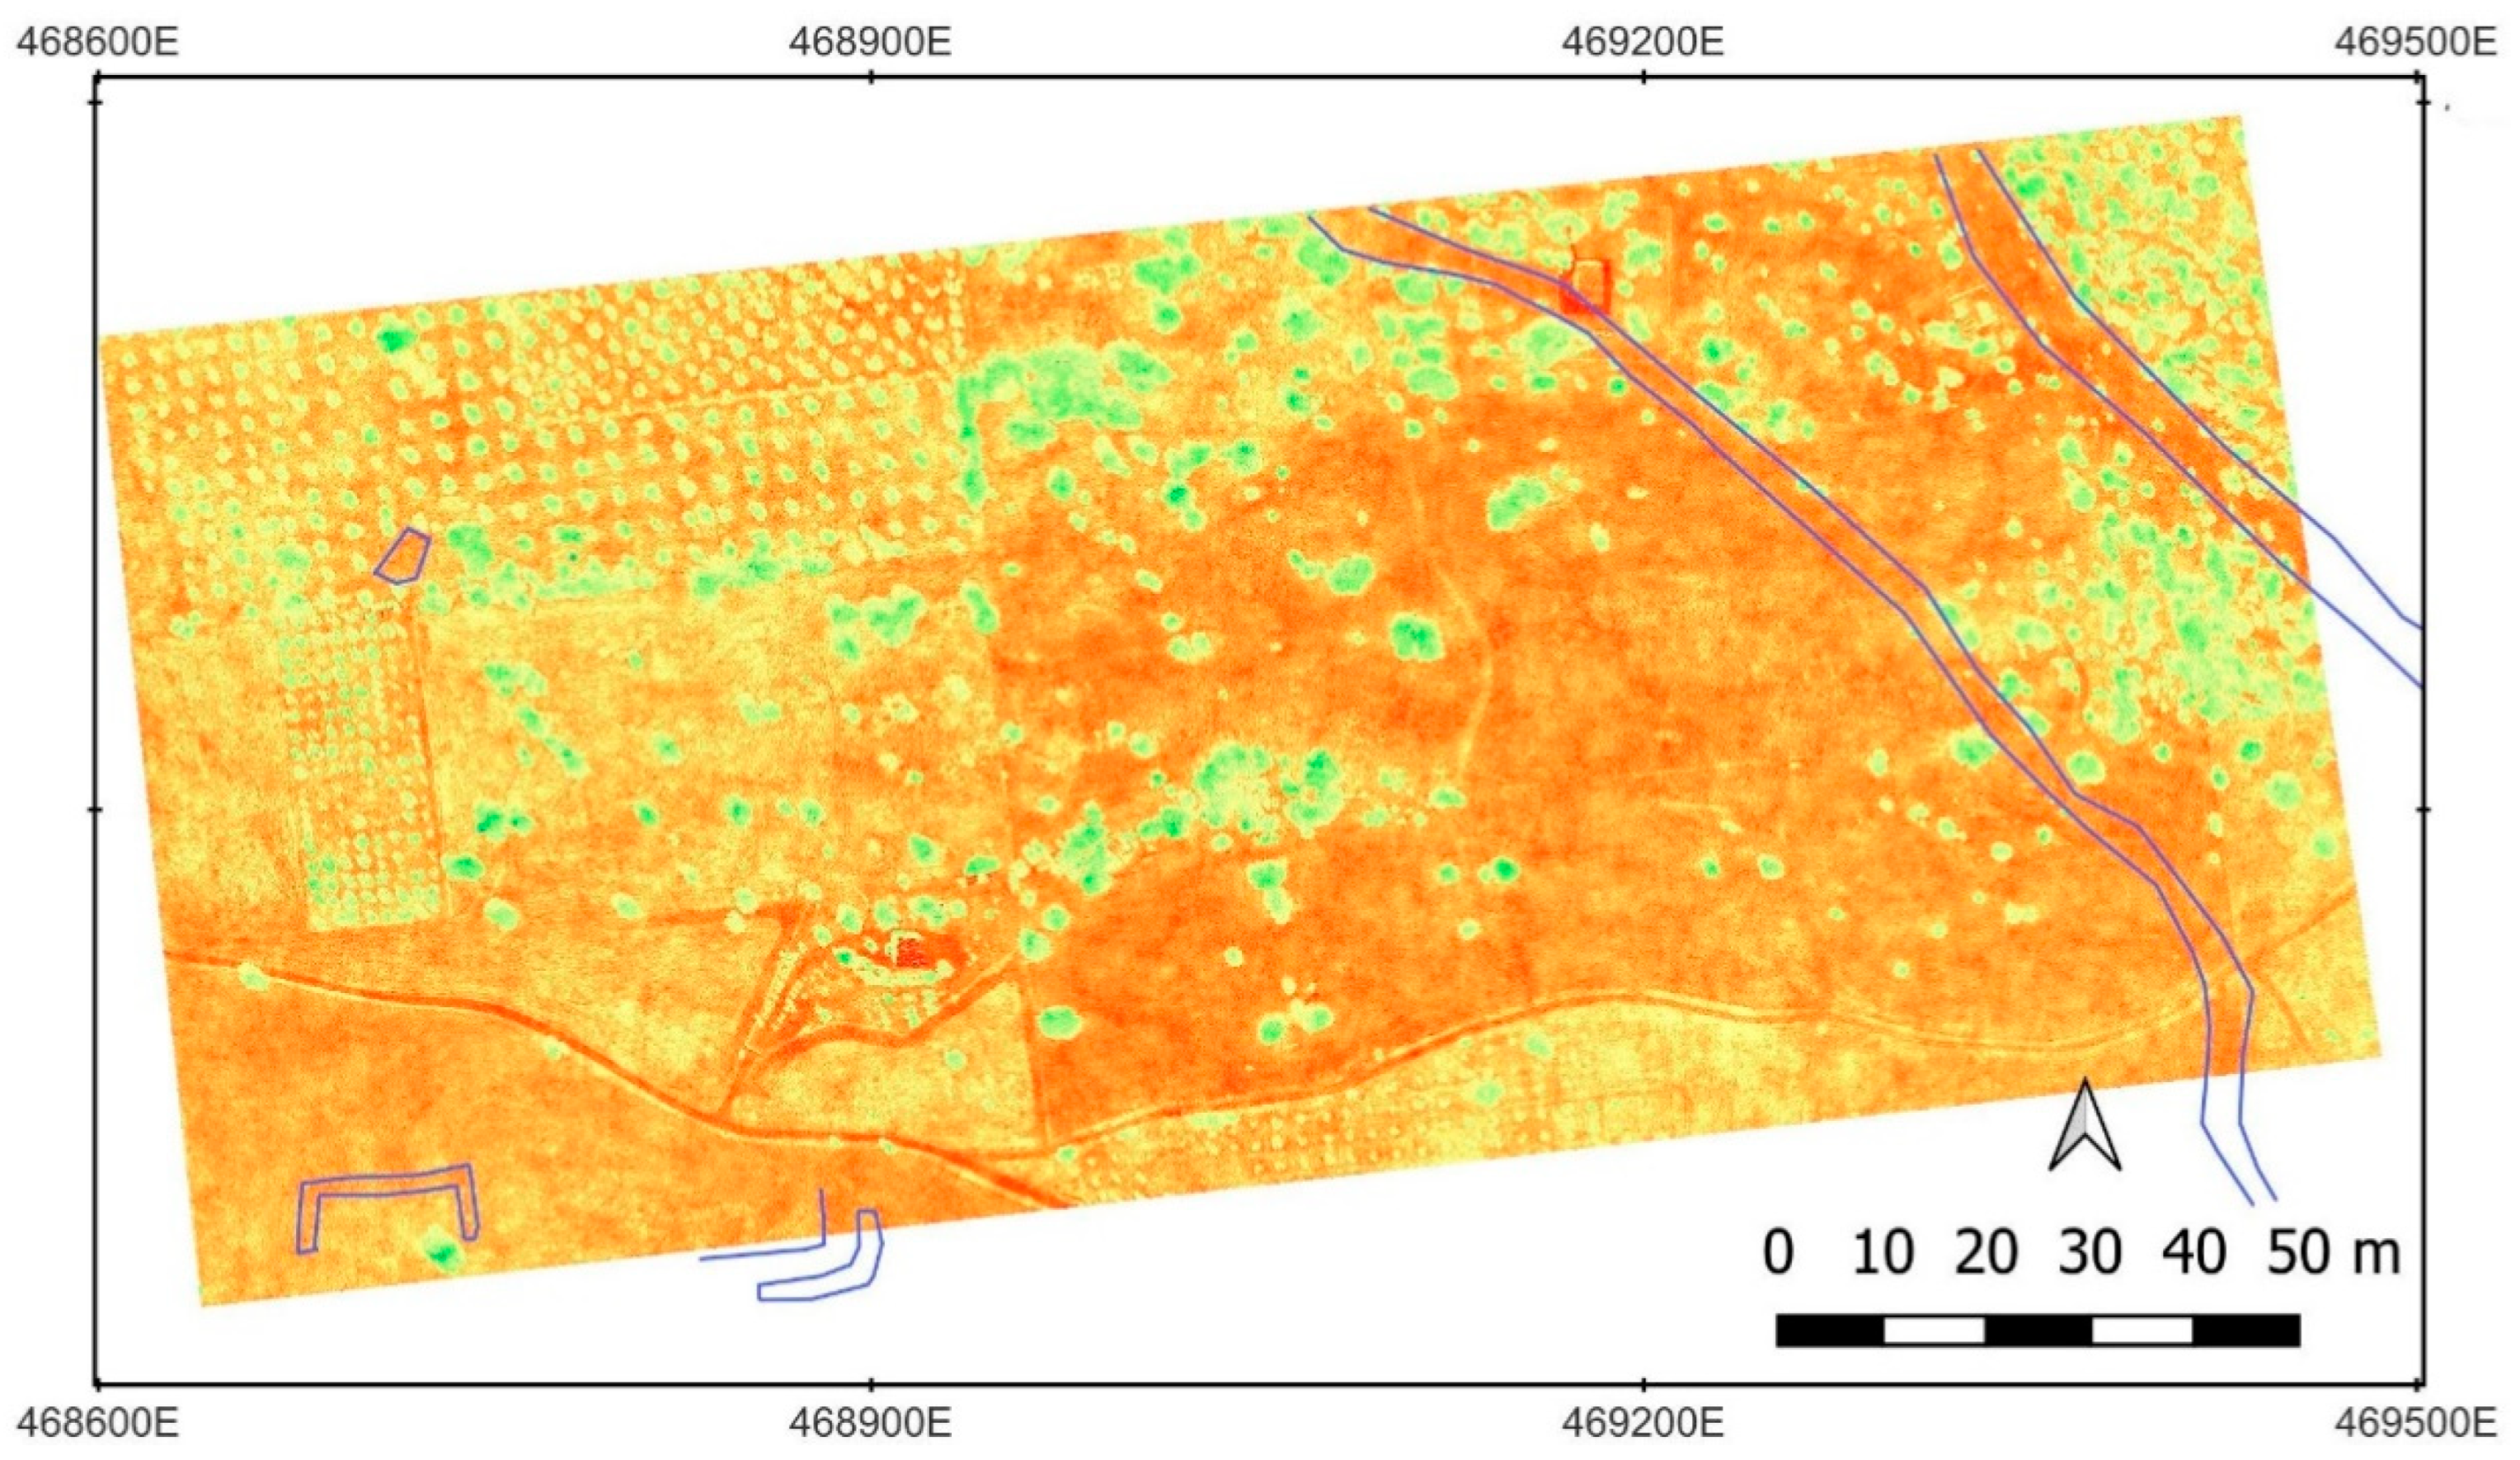
Figure 13.
Land cover evolution. A. Land cover of the study area an their surrounding. B. Land cover changes from 2000-2006. C. Land cover changes from 2006-2012. D. Land cover changes from 2012-2018. Red sqauare marks the study area. Source: Copernicus Land Cover Service and the Authors.
Figure 13.
Land cover evolution. A. Land cover of the study area an their surrounding. B. Land cover changes from 2000-2006. C. Land cover changes from 2006-2012. D. Land cover changes from 2012-2018. Red sqauare marks the study area. Source: Copernicus Land Cover Service and the Authors.
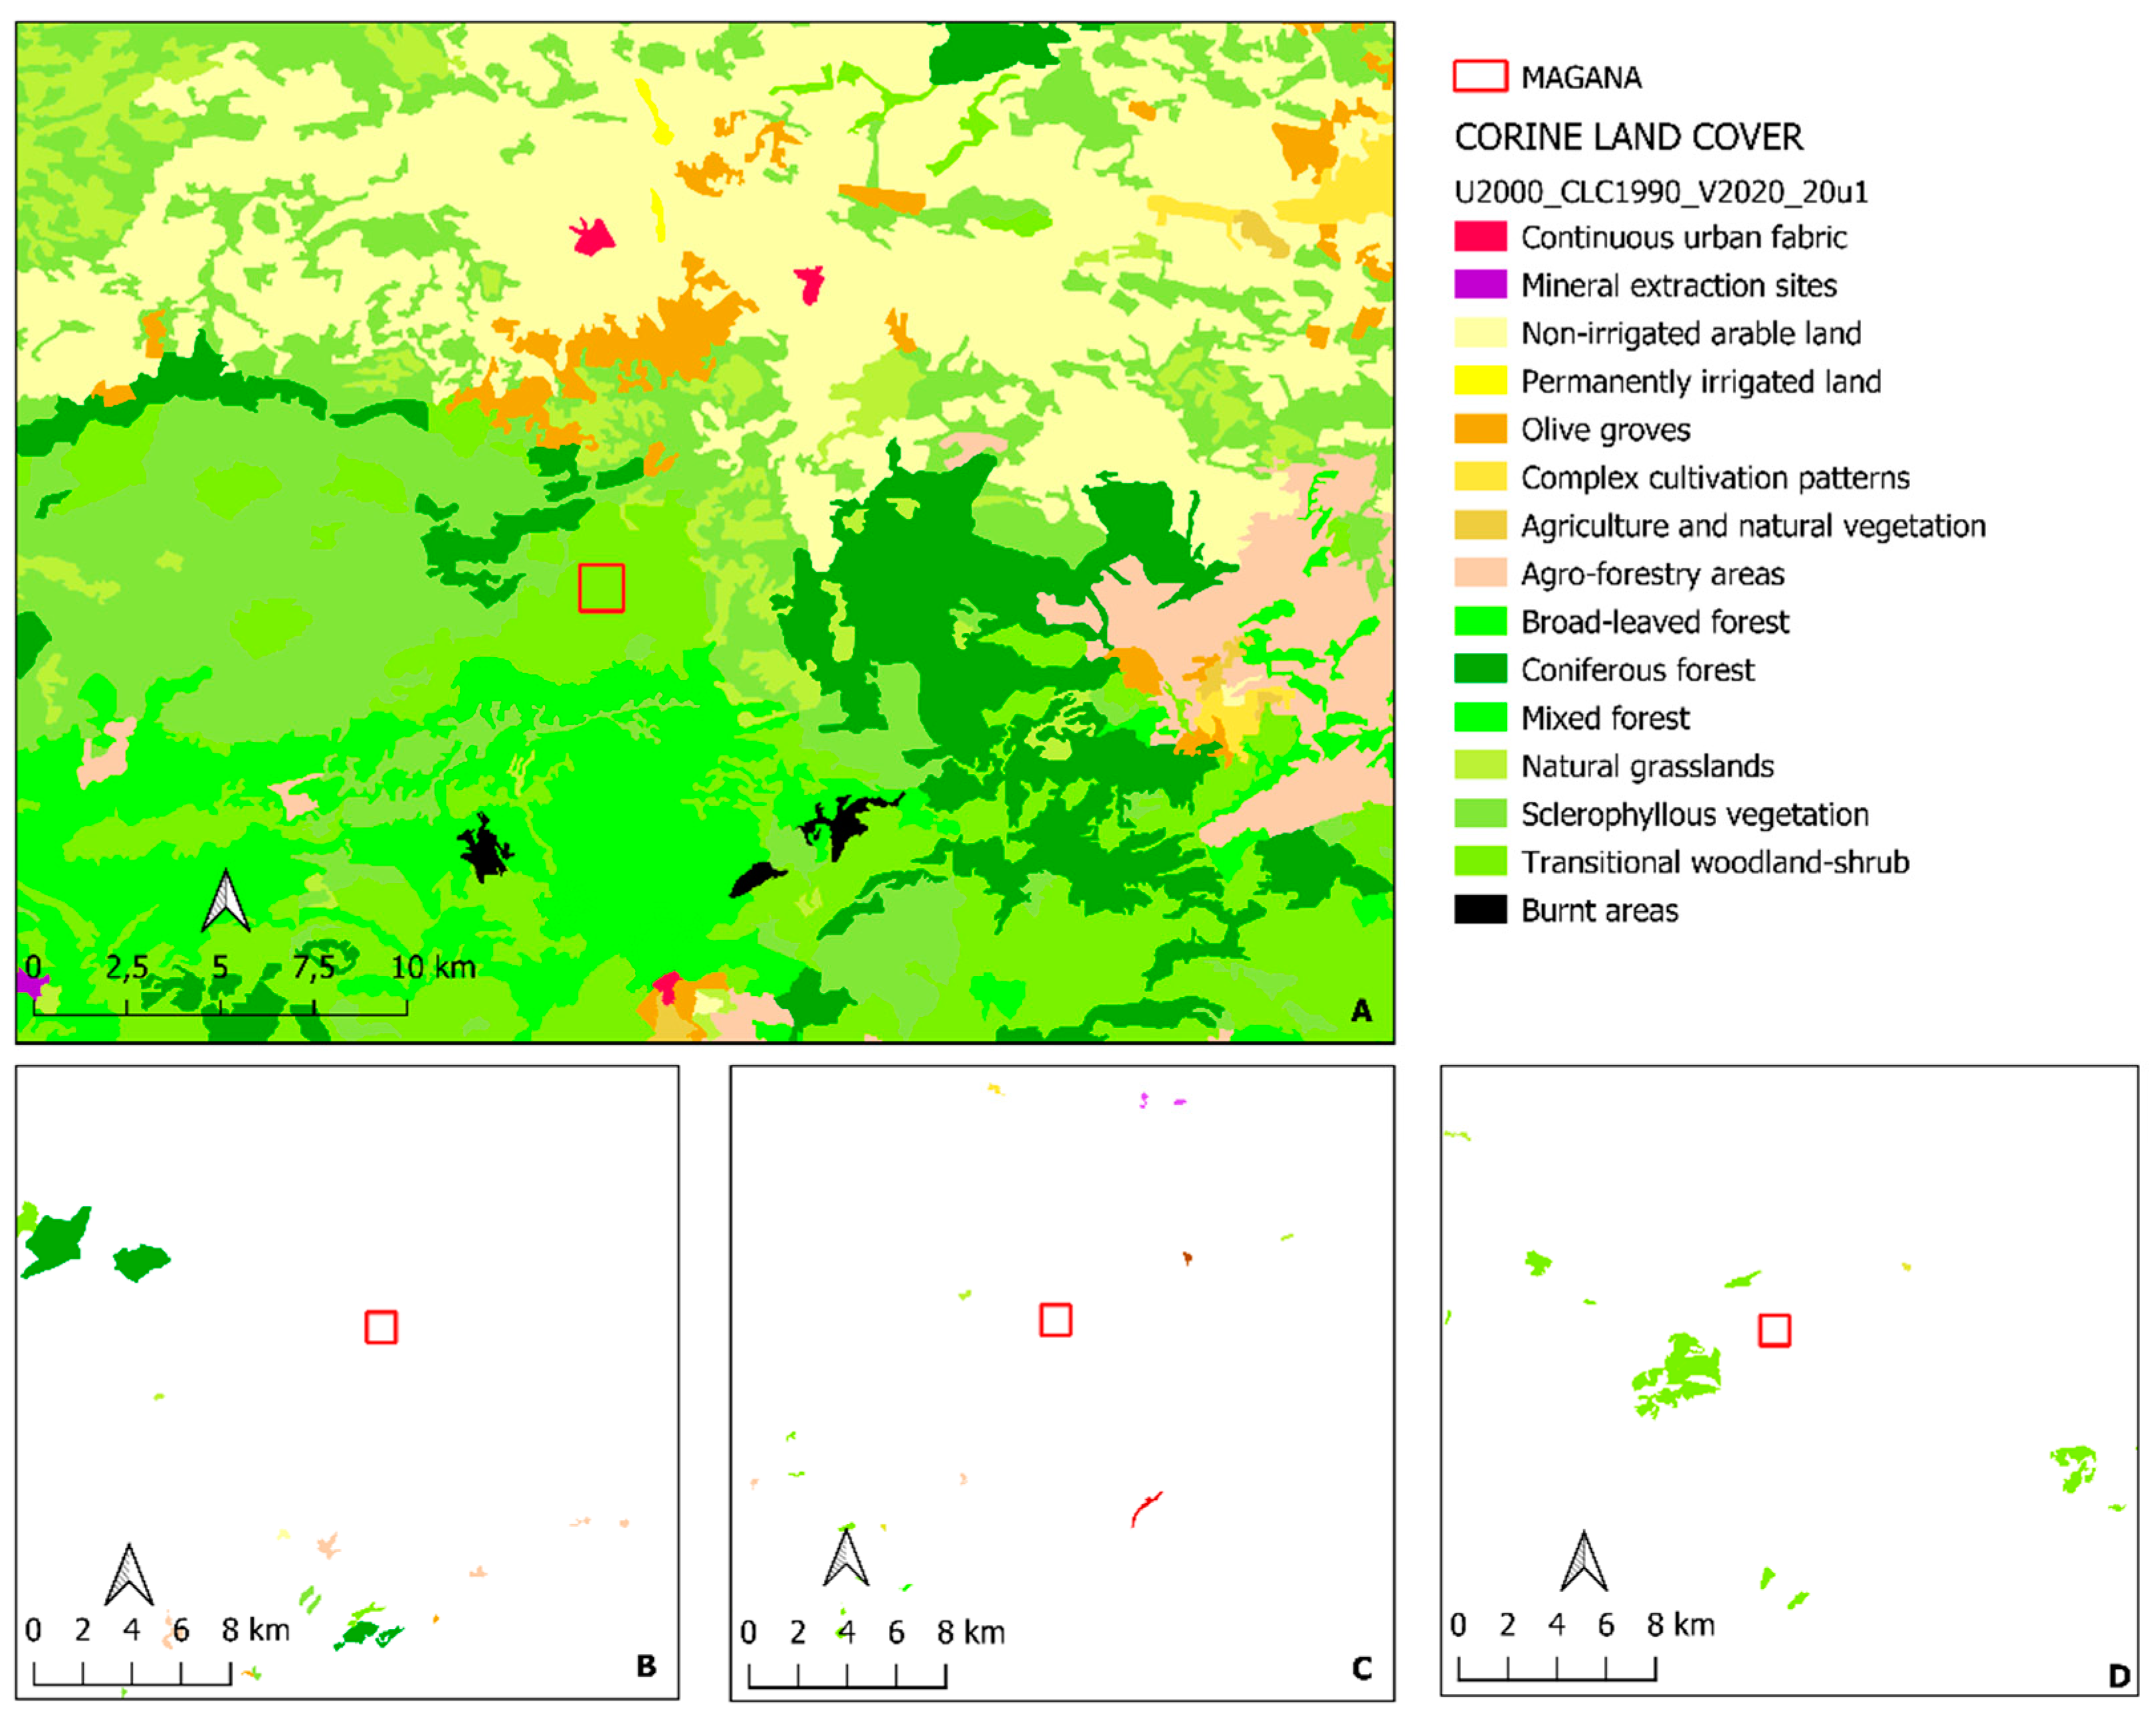
Figure 14.
A. American flight serie B (1956-1957). B. National Flight (1981-1986). Note the alteration caused by the beginning of the reforestation plan. Source: Instituto Geografía de España (IGN).
Figure 14.
A. American flight serie B (1956-1957). B. National Flight (1981-1986). Note the alteration caused by the beginning of the reforestation plan. Source: Instituto Geografía de España (IGN).
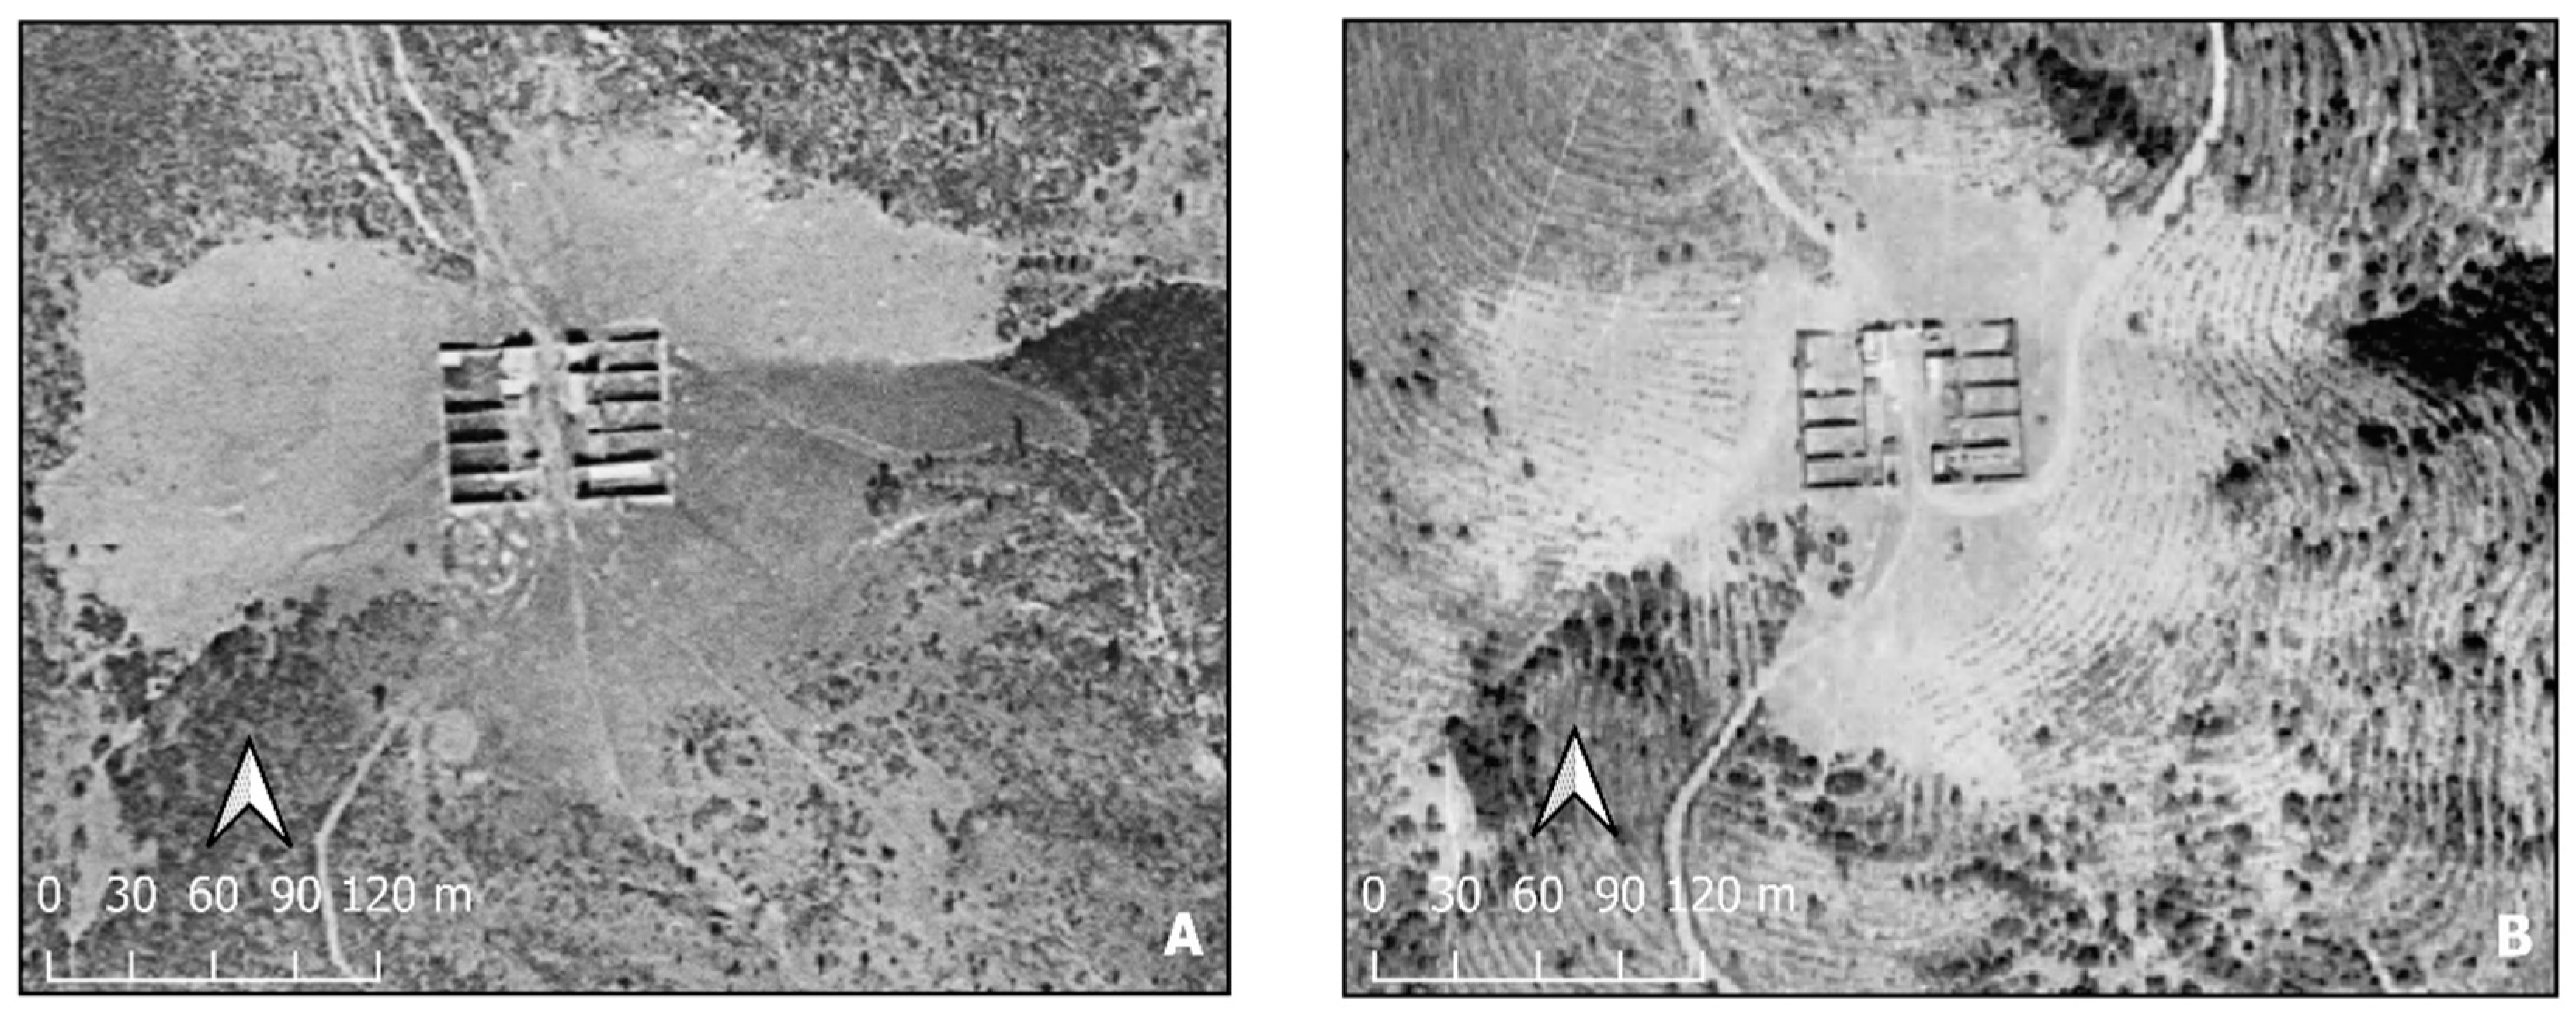
Figure 15.
Evolution of NDVI index in the studied area. A. 02-08-2018. B. 25-03-2019. C. 18-08-2109. D. 02-07-2020. Source: The authors.
Figure 15.
Evolution of NDVI index in the studied area. A. 02-08-2018. B. 25-03-2019. C. 18-08-2109. D. 02-07-2020. Source: The authors.
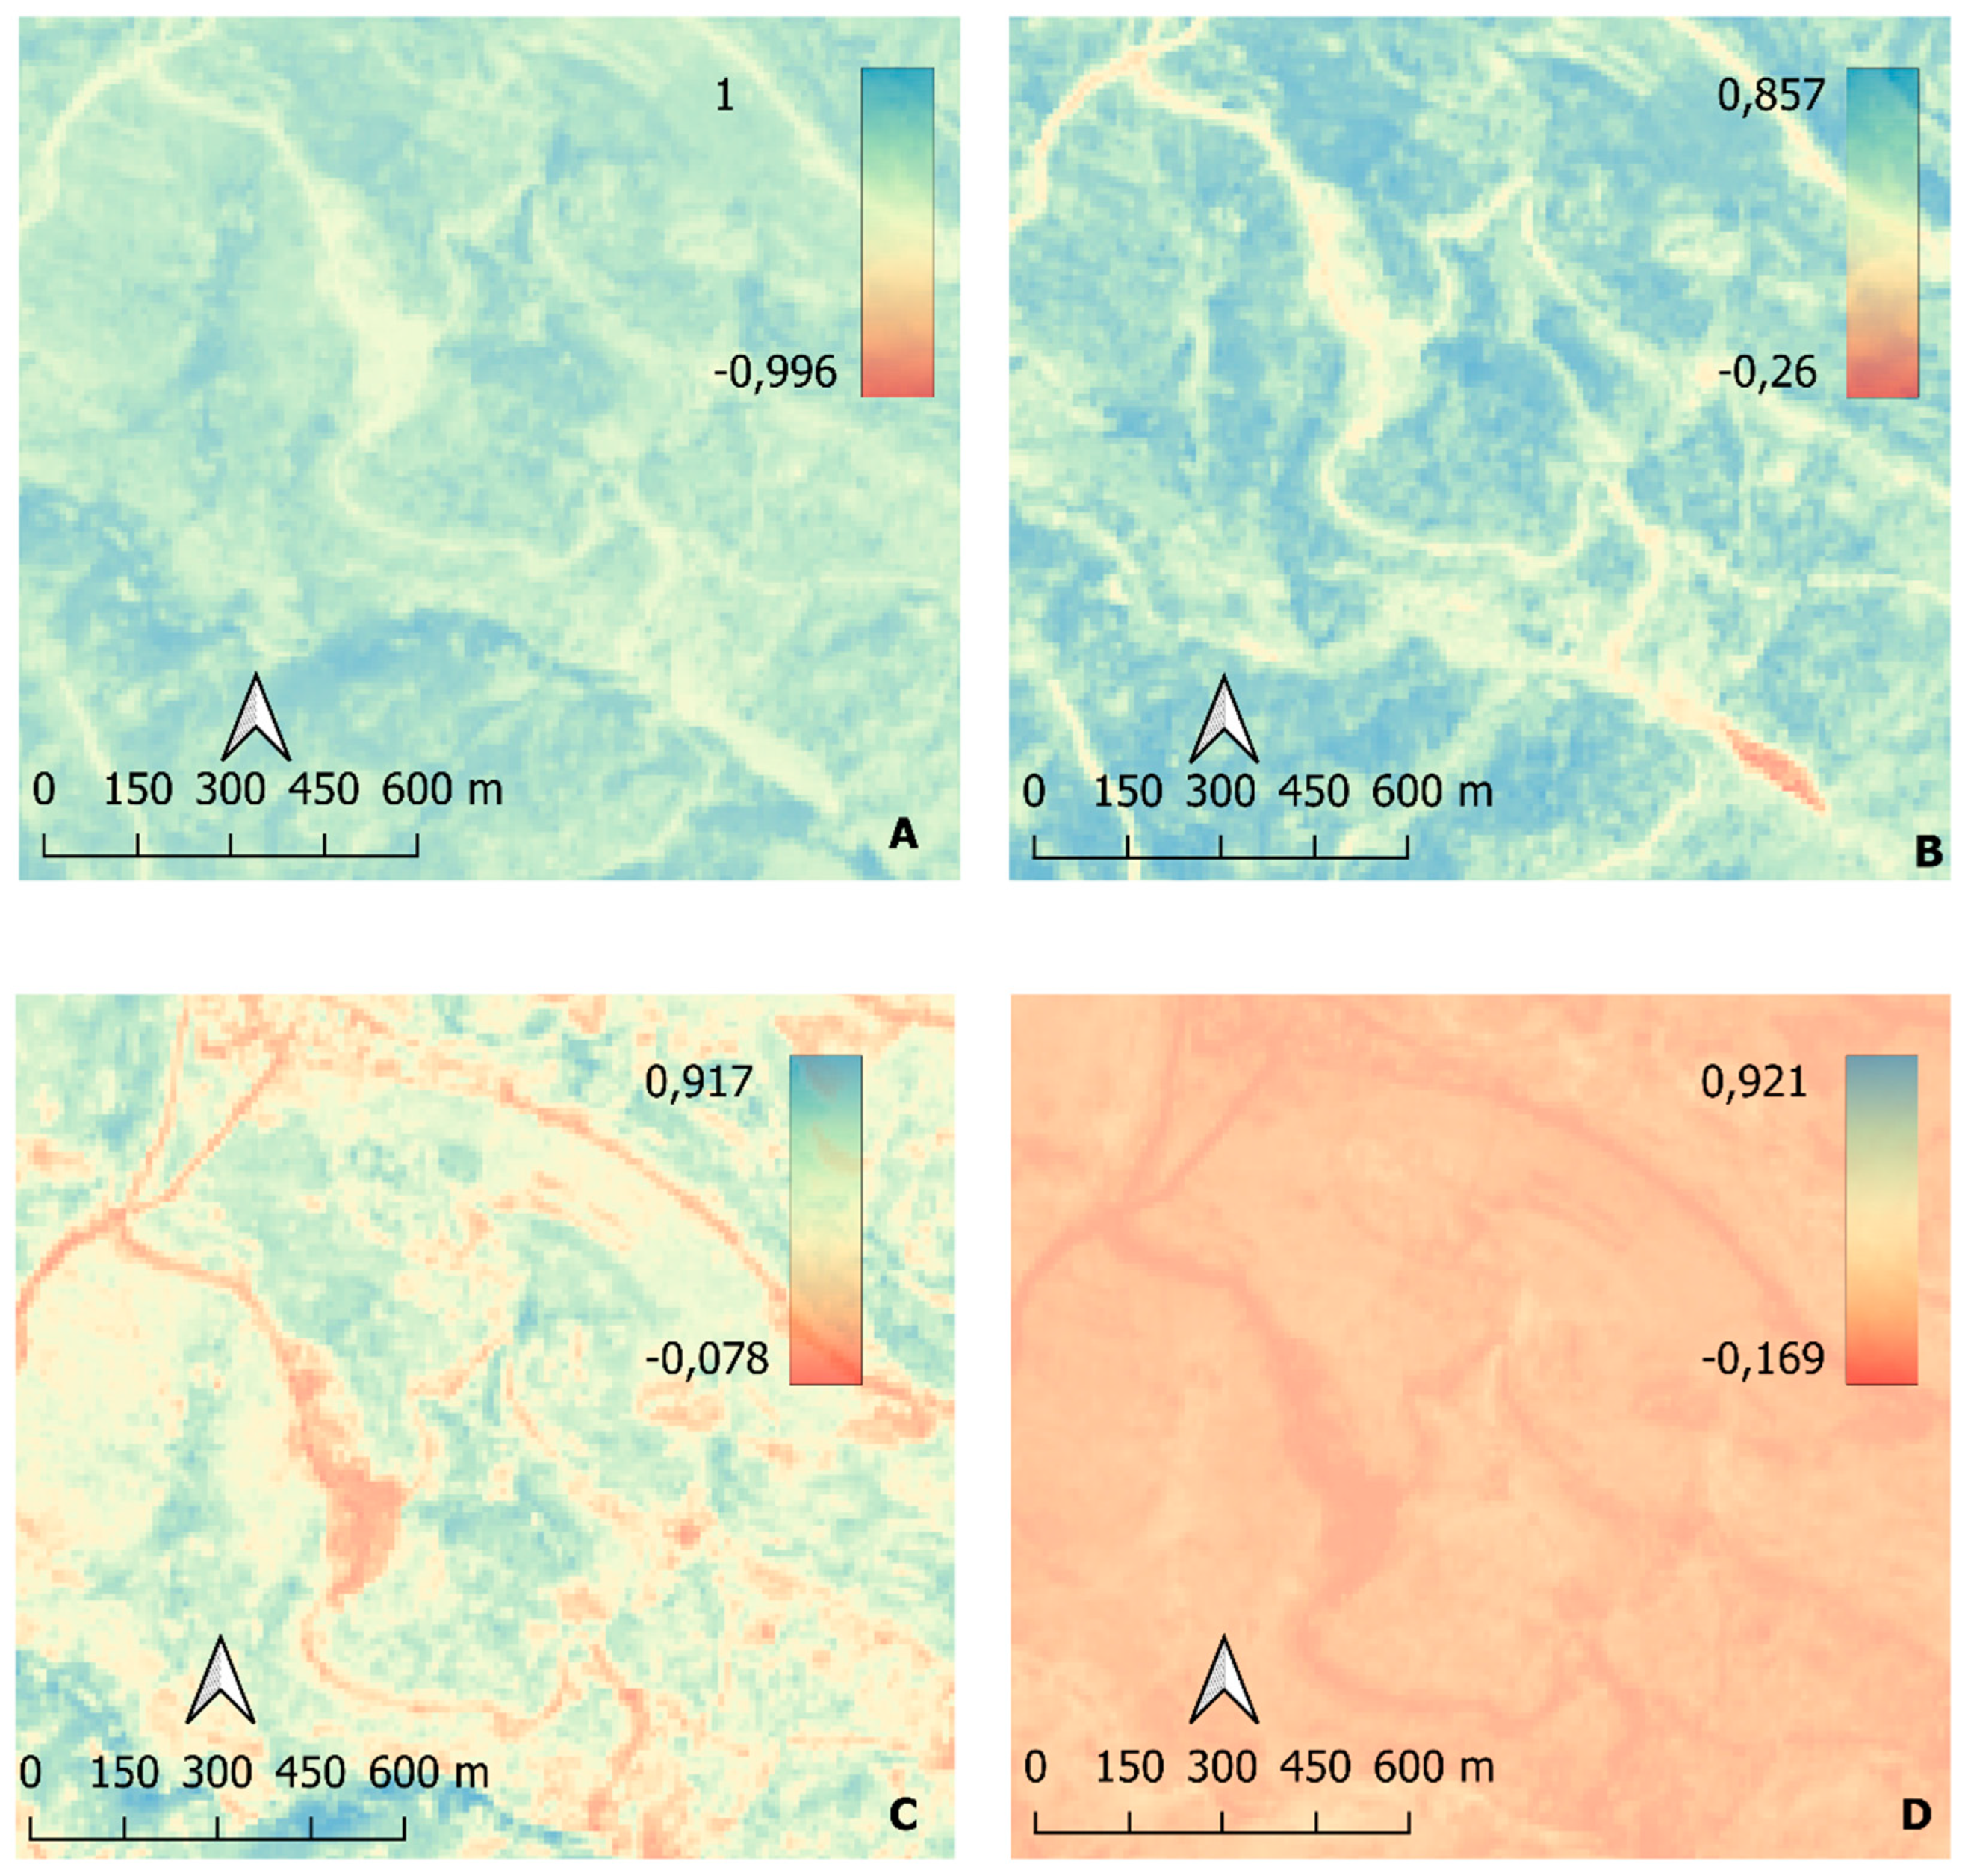
Figure 16.
Possible original route of ancient road identified thanks to the use of Lidar data analysis marked with black arrow. A. American Fligh Serie B (1956-1957). B. Sky view factor. C. Hillshade. Source: The authors.
Figure 16.
Possible original route of ancient road identified thanks to the use of Lidar data analysis marked with black arrow. A. American Fligh Serie B (1956-1957). B. Sky view factor. C. Hillshade. Source: The authors.
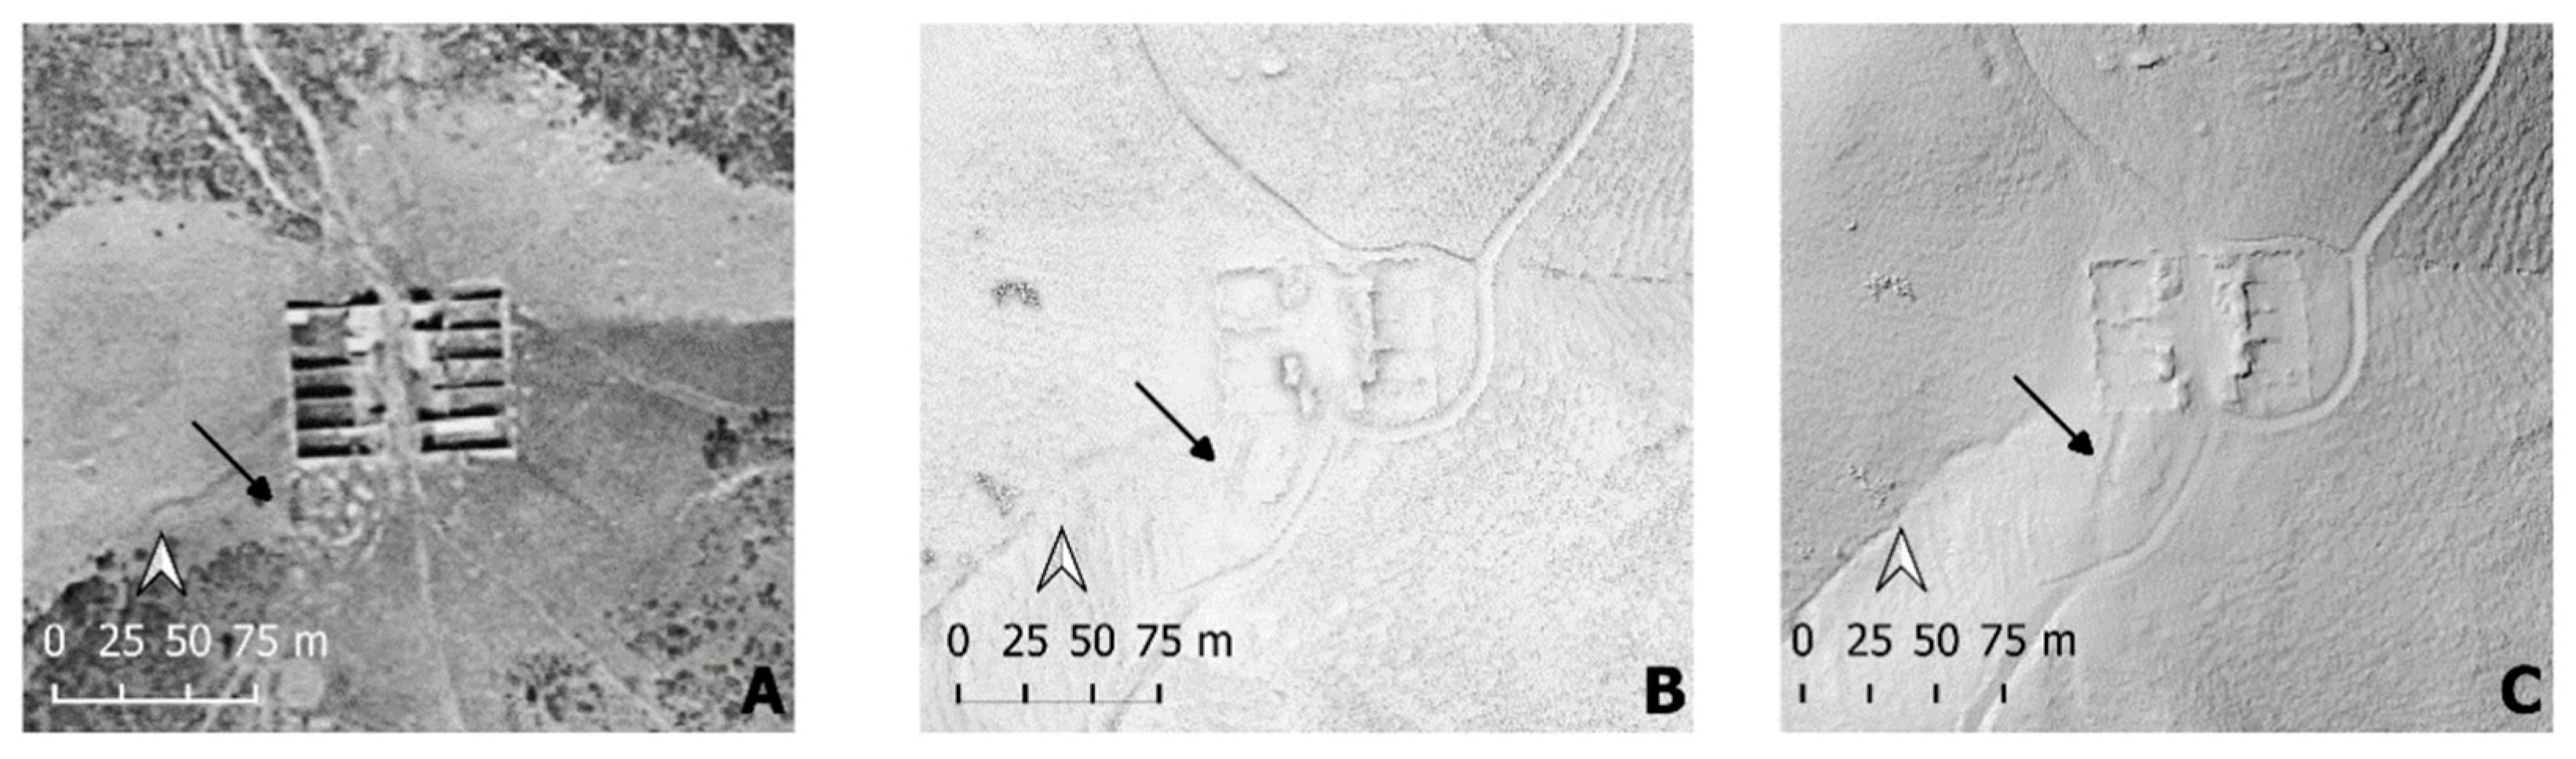
Figure 17.
Thressing floor identified in American flight serie B (1956-1957). Red circle marks the presence of the thressing flor. Black circle marks posible livestock structure.
Figure 17.
Thressing floor identified in American flight serie B (1956-1957). Red circle marks the presence of the thressing flor. Black circle marks posible livestock structure.
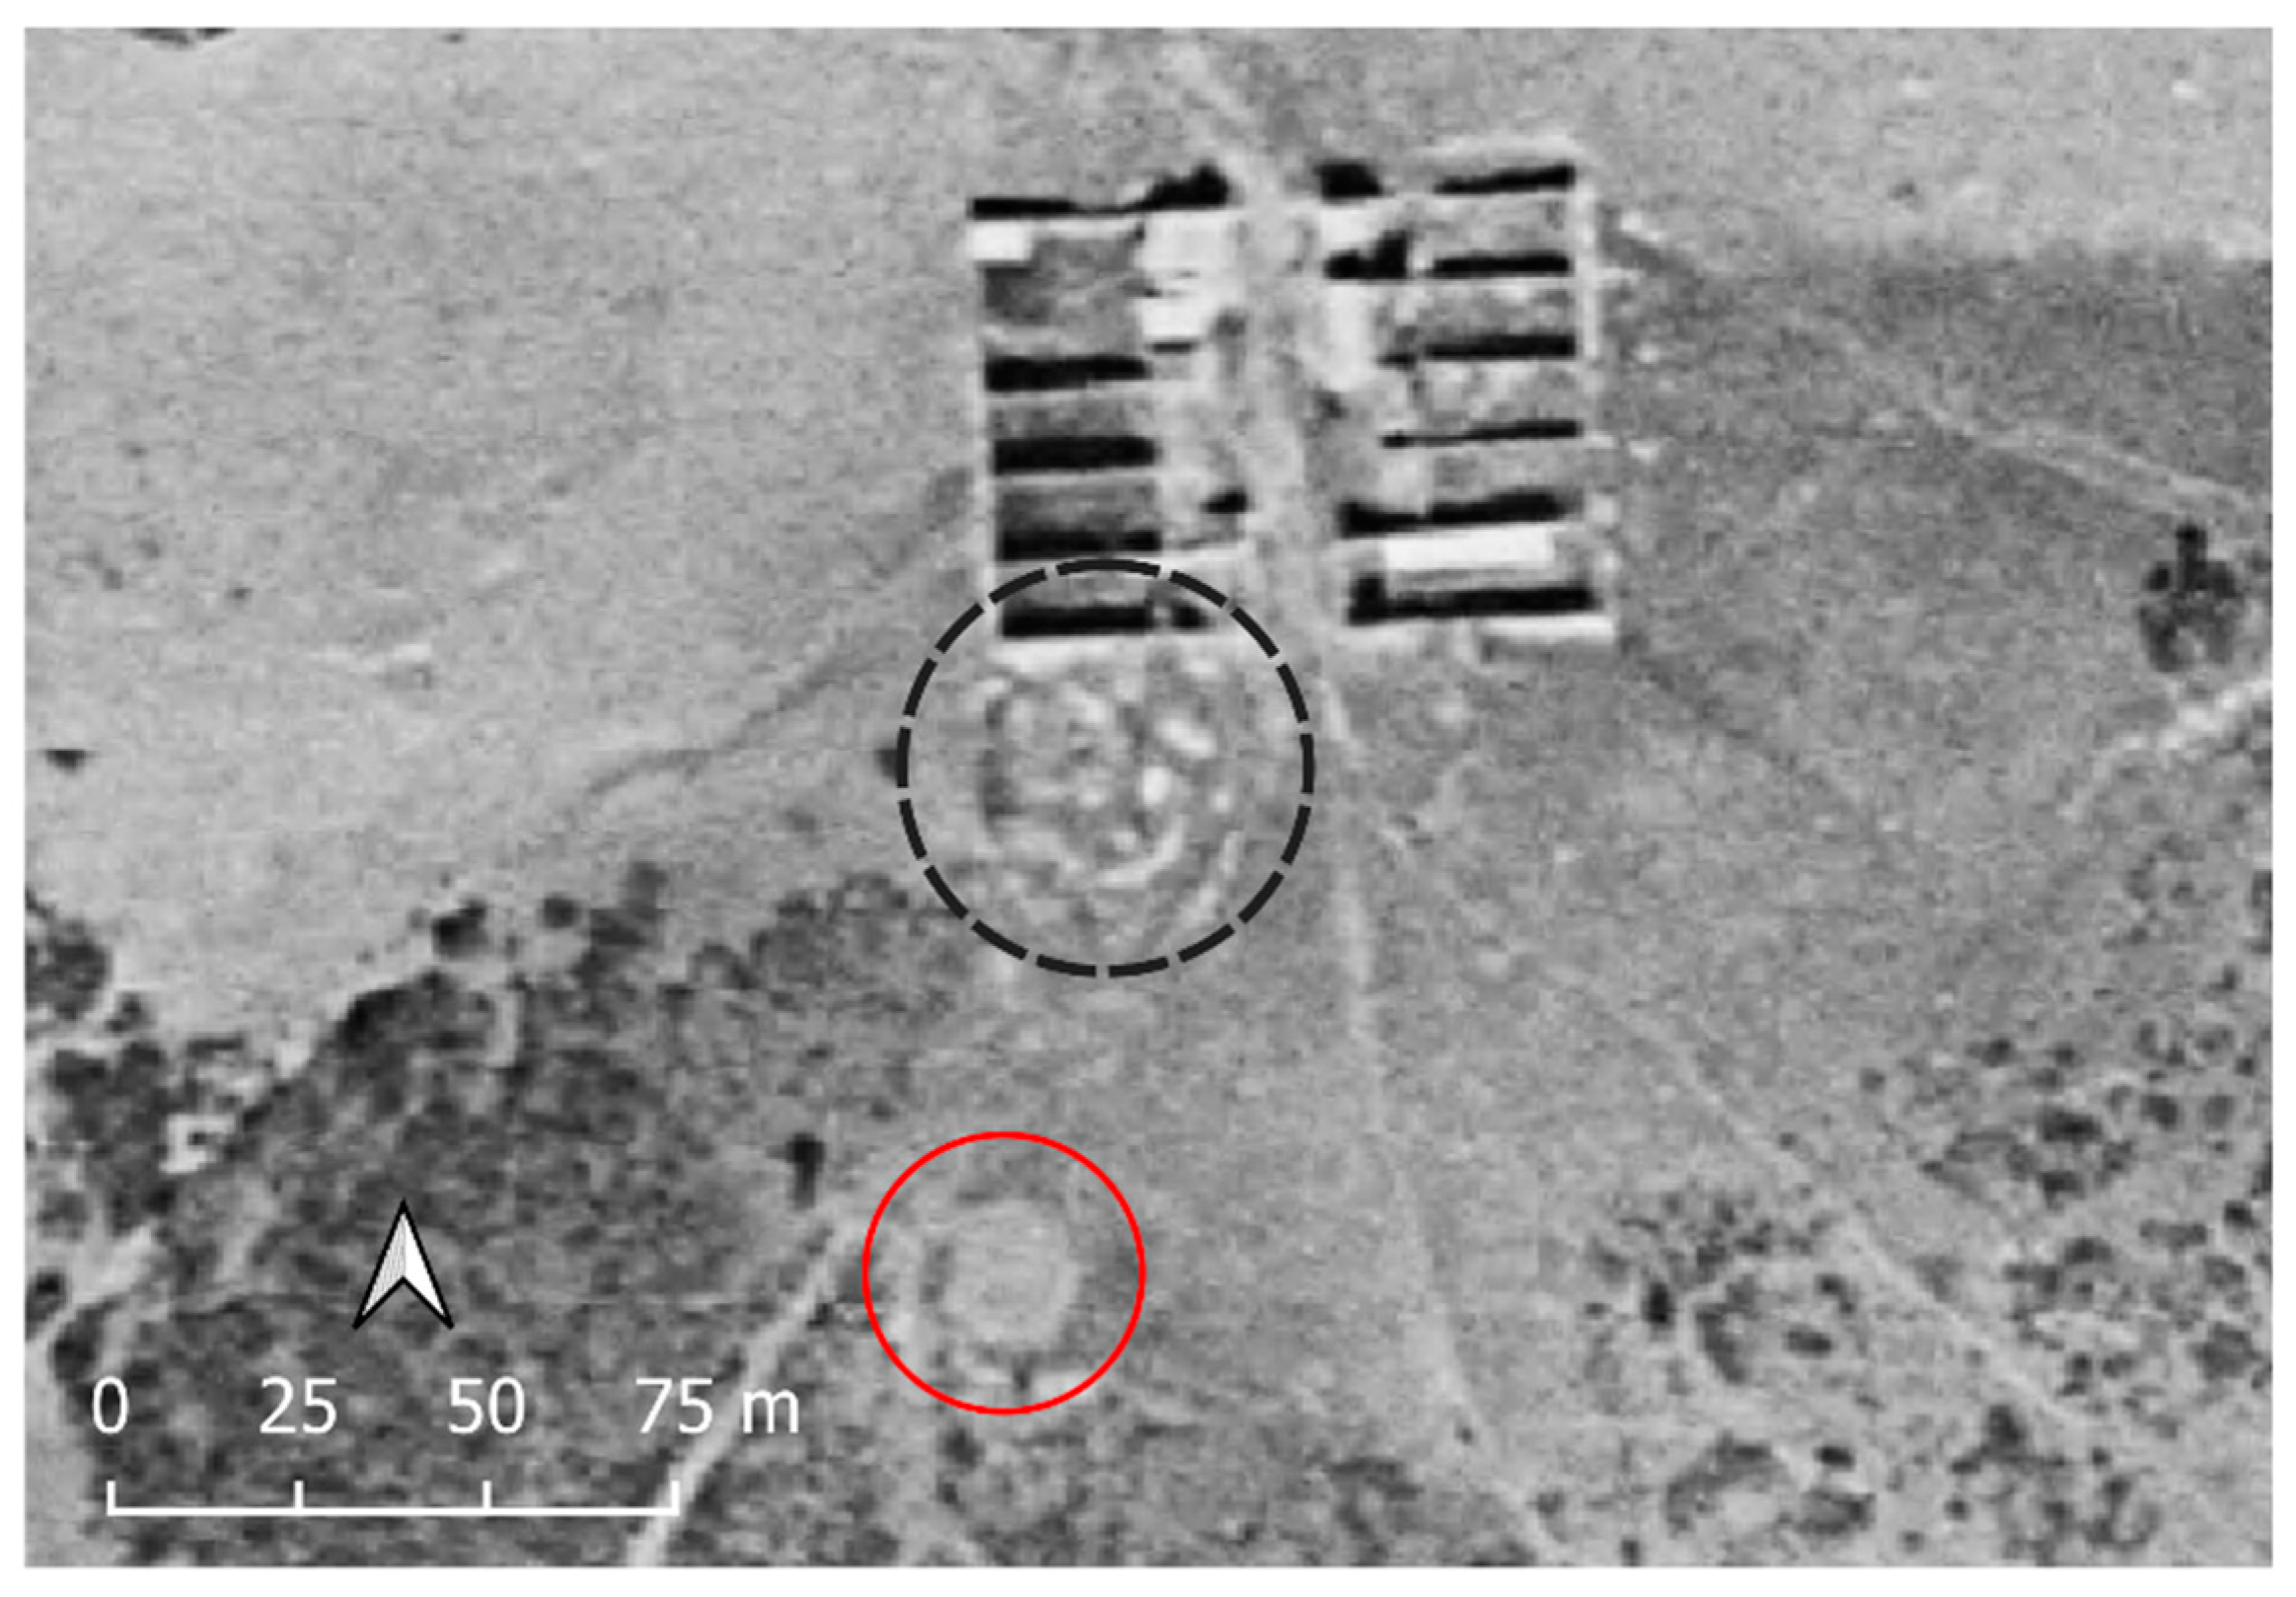
Figure 18.
Terraces made during reforestation. A. National flight carried out between 1981-86. B. Sky View Factor.
Figure 18.
Terraces made during reforestation. A. National flight carried out between 1981-86. B. Sky View Factor.
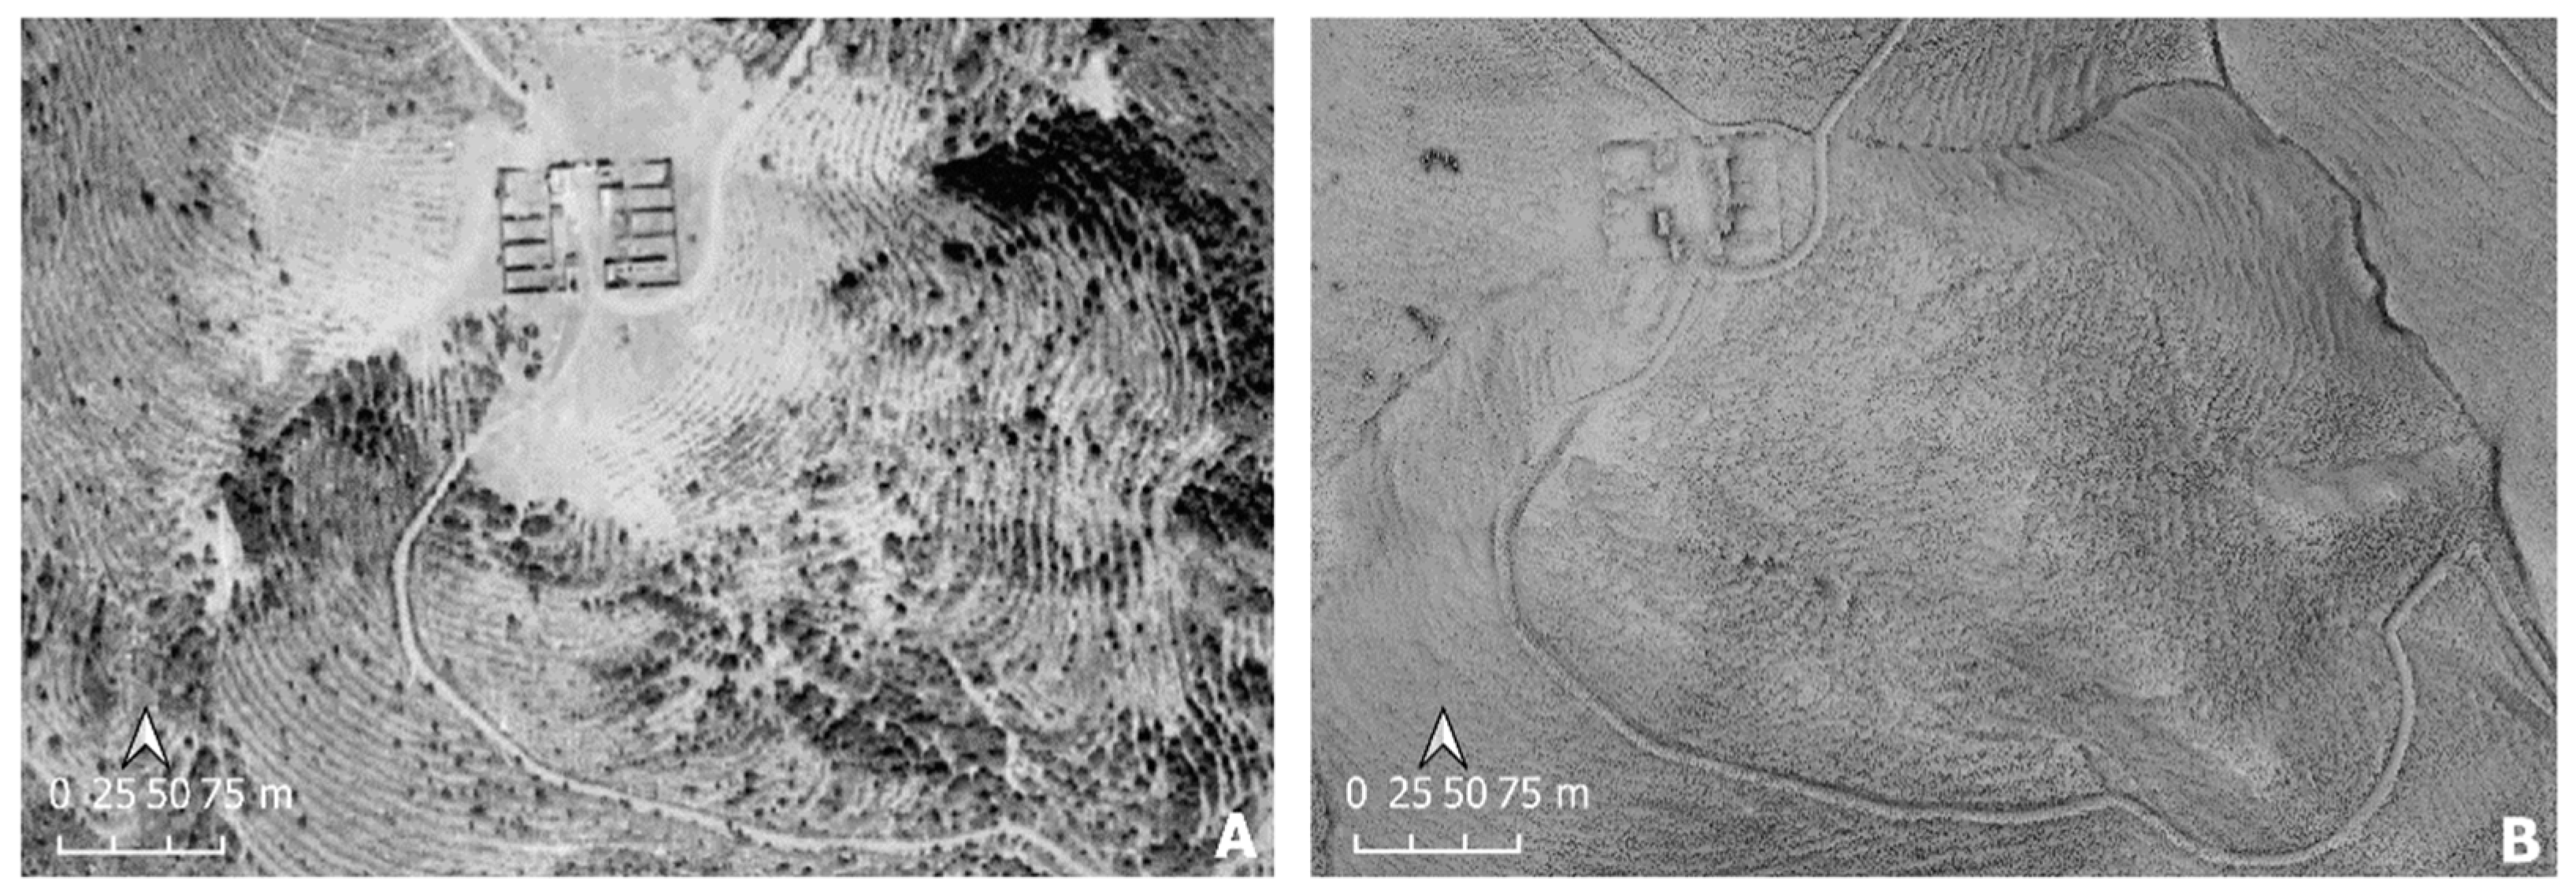

Table 1.
Historical imagery used.
| DATASET | ORIGIN | DATE |
|---|---|---|
| PNOA-H AMS 1956-57 | American Flight Serie B | 1956-1957 |
| PNOA-H NACIONAL | National flight | 1981-1986 |
| PNOA-H OLISTAT | OLISTAT | 1997-1998 |
| PNOA-H SIGPAC | SIGPAC | 1997-2003 |
| PNOA ANUAL | Annual Flight | 2005, 2009 and 2018 |
Disclaimer/Publisher’s Note: The statements, opinions and data contained in all publications are solely those of the individual author(s) and contributor(s) and not of MDPI and/or the editor(s). MDPI and/or the editor(s) disclaim responsibility for any injury to people or property resulting from any ideas, methods, instructions or products referred to in the content. |
© 2023 by the authors. Licensee MDPI, Basel, Switzerland. This article is an open access article distributed under the terms and conditions of the Creative Commons Attribution (CC BY) license (http://creativecommons.org/licenses/by/4.0/).
Copyright: This open access article is published under a Creative Commons CC BY 4.0 license, which permit the free download, distribution, and reuse, provided that the author and preprint are cited in any reuse.


