Submitted:
10 February 2022
Posted:
11 February 2022
You are already at the latest version
Abstract
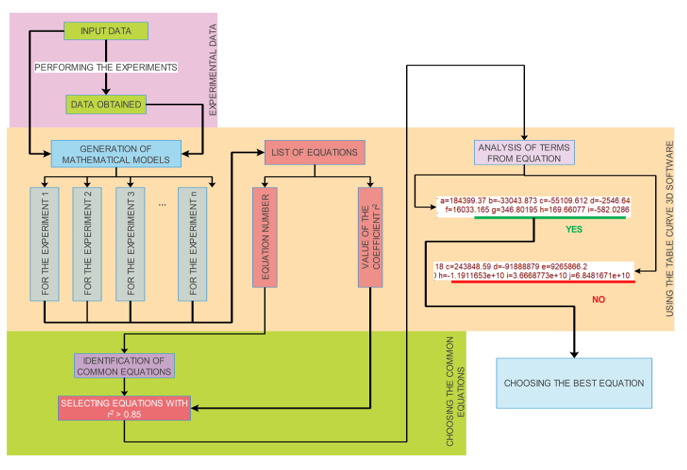
This article describes the methodology used to identify the mathematical model that describes the correlations between the input parameters of an experiment and the parameters being followed. As a technological process, the aerodynamic separation was chosen, respectively, the behavior of a solid particle within an ascending vertical airflow. The experimental data obtained were used to identify two parameters, the average linear velocity, and the angular velocity, and through the Table Curve 3D program was developed a mathematical model which describes the dependence between the input parameters (the shape and size of the solid particle and the velocity of the airflow) and the monitored parameters. In order to determine a single mathematical equation that describes as accurately as possible the correlation between the input variables and those obtained, a pyramid-type analysis was designed. The determination of the mathematical equation started from the number of equations generated by the Table Curve 3D program, then the equations with a correlation coefficient greater than 0.85 were chosen, and finally, the common equations were identified. Respecting the working methodology was identified one equation which has for the average linear velocity a correlation coefficient r2 between 0.88-0.99 and 0.86-0.99 for the angular velocity.
Keywords:
mathematical models
; Table Curve 3D
; correlation coefficient
Copyright: This open access article is published under a Creative Commons CC BY 4.0 license, which permit the free download, distribution, and reuse, provided that the author and preprint are cited in any reuse.


