Version 1
: Received: 19 March 2019 / Approved: 19 March 2019 / Online: 19 March 2019 (10:42:26 CET)
How to cite:
Ding, J.; Zhao, J.; Pan, T.; Xi, L.; Zhang, J.; Zou, Z. Comparative Transcriptome Analysis of Gene Expression Patterns in Tomato under Different Light Intensity Distributions. Preprints2019, 2019030184
Ding, J.; Zhao, J.; Pan, T.; Xi, L.; Zhang, J.; Zou, Z. Comparative Transcriptome Analysis of Gene Expression Patterns in Tomato under Different Light Intensity Distributions. Preprints 2019, 2019030184
Ding, J.; Zhao, J.; Pan, T.; Xi, L.; Zhang, J.; Zou, Z. Comparative Transcriptome Analysis of Gene Expression Patterns in Tomato under Different Light Intensity Distributions. Preprints2019, 2019030184
APA Style
Ding, J., Zhao, J., Pan, T., Xi, L., Zhang, J., & Zou, Z. (2019). Comparative Transcriptome Analysis of Gene Expression Patterns in Tomato under Different Light Intensity Distributions. Preprints. https://doi.org/
Chicago/Turabian Style
Ding, J., Jing Zhang and Zhirong Zou. 2019 "Comparative Transcriptome Analysis of Gene Expression Patterns in Tomato under Different Light Intensity Distributions" Preprints. https://doi.org/
Abstract
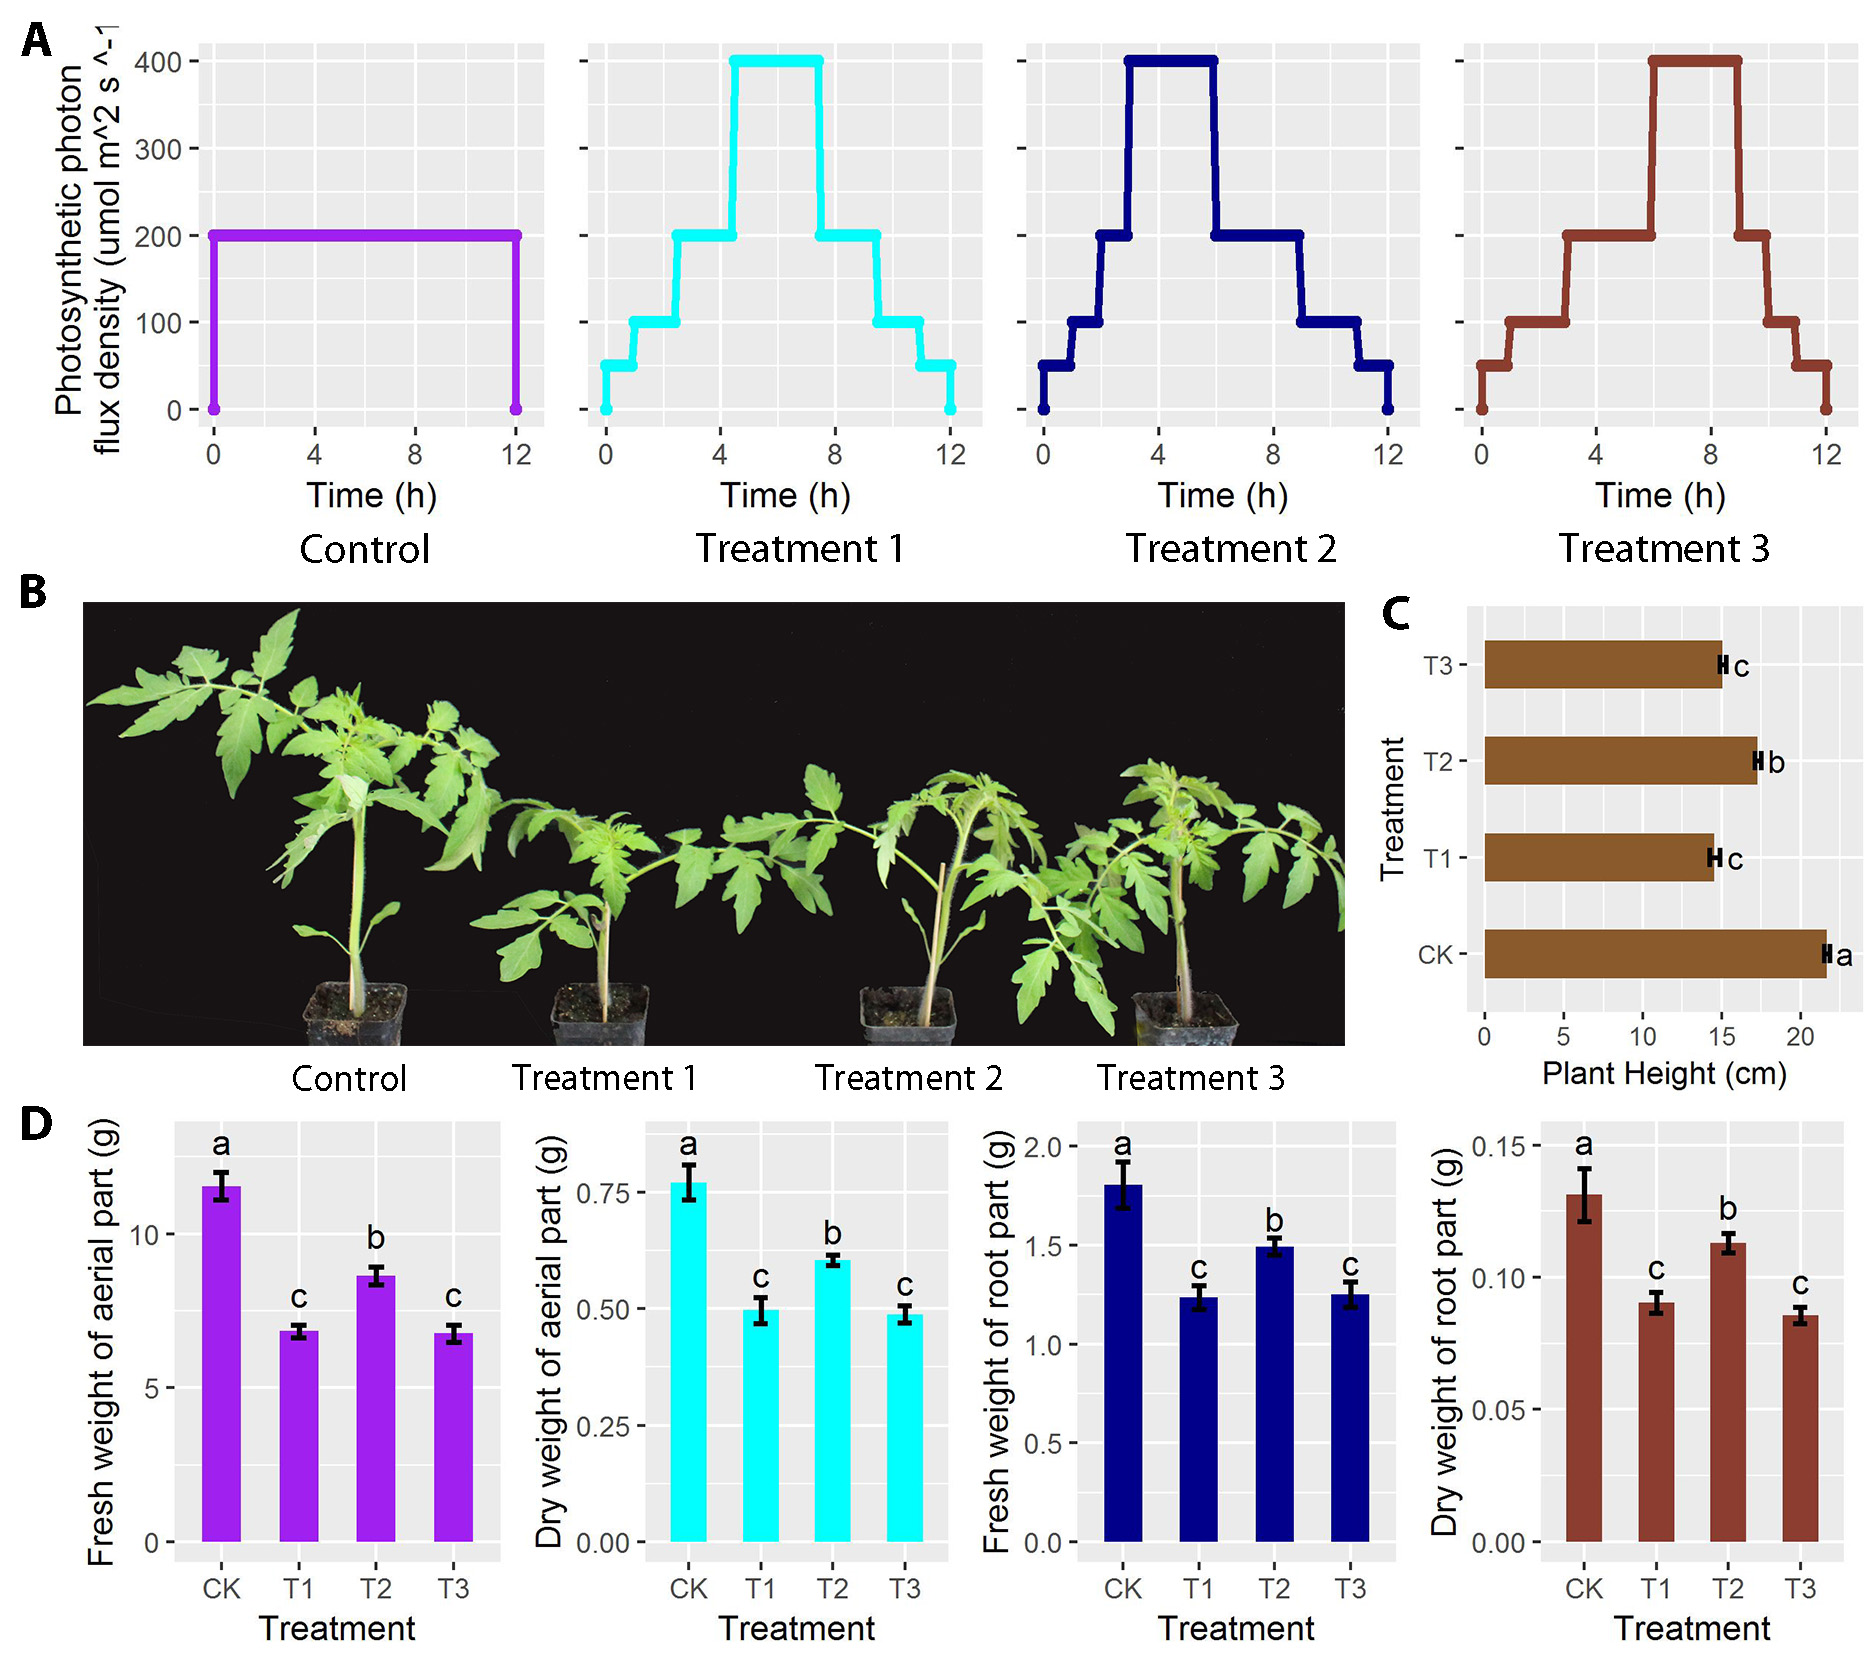
Plants grown under fluctuating light impact plant developments compared with those grown under non-fluctuating light conditions. However, our knowledge on the underlying regulatory mechanisms is still quite limited, particularly from the transcriptional perspective. In order to investigate the influence of different light intensity distributions on tomato plant development, we designed three fluctuating light intensity distributions with the non-fluctuating light intensity as control and compared the transcriptional differences after five weeks of treatment. We found plant height and aerial/root weight were significantly reduced under all fluctuating light treatments. Transcriptome analysis revealed that the number of up and down regulated genes had a distinct distribution pattern between different treatments and control. The largest difference between the numbers of down and up regulated genes was found between treatment 1 and 3, reaching to a total of 416 genes. The number and type of the top 20 enriched pathways differed between treatments and control. The largest number of genes enriched was involved in the biosynthesis of secondary metabolites. These results provide insights into the transcriptional regulations of tomato under different light intensity distributions.
Copyright:
This is an open access article distributed under the Creative Commons Attribution License which permits unrestricted use, distribution, and reproduction in any medium, provided the original work is properly cited.