
Submitted:
16 November 2026
Posted:
18 November 2026
You are already at the latest version
Abstract
Digital payment participation captures a distinct dimension of financial service use, although cross-country comparisons are complicated by differences in survey measurement and the bounded nature of adoption. This study examines four Global Findex rounds for 14 purposively selected Eurasian economies, using Kazakhstan as the principal comparative benchmark. Ukraine is excluded from the primary analysis because its abbreviated 2024 questionnaire employed an alternative operationalisation; the original 15-economy sample is retained for sensitivity analysis. Drawing on unrounded estimates and documented survey reference years, the analysis assesses cross-economy dispersion, rank persistence and progress relative to baseline headroom. Mean adoption increased from 34.10% in 2014 to 64.26% in 2024. The cross-economy standard deviation declined from 20.56 to 16.12 percentage points, although the trajectory was non-monotonic. Initial adoption was negatively correlated with absolute gains (r = −0.622), whereas its correlation with headroom-adjusted gains was positive (r = 0.234). The endpoint rank correlation was 0.736. Kazakhstan's adoption rate increased from 46.74% to 85.02%, moving the country from fifth to second place. These findings indicate broader digital payment participation and narrower endpoint dispersion, but show that interpretations of catching-up depend on how progress is measured. For Kazakhstan, the results establish a comparative benchmark for payment participation without identifying causal effects on financial-sector competitiveness.
Keywords:
digital payments
; financial inclusion
; Global Findex
; cross-country comparison
; convergence
; Kazakhstan
1. Introduction
Payment-system development matters for financial participation because access to a financial account or a digital service does not necessarily translate into use. Digital finance changes how institutions deliver services and how customers interact with them, while also raising questions about competition, operational reliability and the distribution of benefits (Gomber et al., 2017; Vives, 2019; Boot et al., 2021). An individual-level measure of digital payment participation captures the use dimension of this transformation. Its interpretation requires a clear separation between adoption, payment intensity and wider financial-sector outcomes.
This distinction is relevant to Kazakhstan. The development of payment systems can form part of a research agenda on financial-sector competitiveness, but a high share of adults using digital payments is not itself a competitiveness measure. Payment participation does not reveal transaction costs, market contestability, service quality, interoperability or resilience. Examining the relationship between payment-system development and financial-sector competitiveness would require separately defined outcomes and an appropriate research design.
The Global Findex Database provides repeated survey-based estimates of financial behaviour. The 2025 release extends the available comparison to the 2024 survey round (Klapper et al., 2025; World Bank, 2025a). Two issues complicate its use. First, a common published indicator does not ensure identical implementation across economies and rounds. In Ukraine, the abbreviated 2024 questionnaire employed an alternative operationalisation that incorporated account access via card or phone into the digital payment measure. Second, adoption is bounded by 100%, so an economy starting near universal participation has less possible percentage-point growth. A negative association between initial adoption and subsequent gains may therefore arise partly from this arithmetic constraint rather than reflecting a common catching-up mechanism.
This article examines these issues in an exploratory comparison of selected economies spanning Central Asia, the South Caucasus, the Western Balkans and neighbouring parts of Eurasia. The country group is purposive and does not constitute an official region or a representative sample of Eurasia. Kazakhstan serves as the principal comparative benchmark. The study asks how adoption levels and interval changes evolved, whether cross-economy dispersion narrowed, how rankings persisted, and how a catching-up interpretation changes when gains are scaled by available baseline headroom.
The contribution is a reproducible descriptive benchmark that combines a documented measurement screen with a sensitivity analysis of bounded growth. Its substantive finding is that lower endpoint dispersion and a negative initial-level–gain correlation coexist with substantial rank persistence, while the initial-level–gain correlation changes sign under headroom scaling. This comparison shows why evidence of convergence based on absolute gains is sensitive to the scale on which progress is measured. A Kazakhstan comparison illustrates why level, absolute progress and progress relative to initial headroom can give different assessments.
2. Literature and analytical framework
Digital financial inclusion combines dimensions of access and use. The index developed by Khera et al. (2022) illustrates why infrastructure availability, account access and actual financial behaviour should not be treated as interchangeable. Global Findex provides complementary individual-level evidence on adults' reported use of financial services (Demirgüç-Kunt et al., 2022; Klapper et al., 2025). The binary participation measure used here records whether an adult made or received at least one qualifying digital payment during the preceding year; it does not capture transaction frequency or value.
Research on financial technology also places adoption within a wider institutional setting. Boot et al. (2021) examine changes in financial intermediation, while Vives (2019) discusses digital disruption and competition in banking. Górka (2025) compares instant-payment systems across countries. These contributions concern institutional and service arrangements that may support participation, but an adoption share cannot identify which arrangement generated a country's observed change.
Existing research on digital financial inclusion addresses both the determinants of adoption and its potential economic consequences, whereas the present study examines changes in the cross-country distribution of payment participation. Andaregie et al. (2024) analyse individual characteristics and digital infrastructure in Ethiopia. Putrevu and Mertzanis (2024) discuss challenges and policy responses in emerging economies. Khera et al. (2021) investigate digital financial inclusion and growth, and Birigozzi et al. (2025) examine digital payments and GDP growth. These studies motivate interest in participation but do not justify inferring growth or competitiveness effects from the descriptive statistics reported here.
Convergence requires several distinctions. A reduction in the standard deviation describes narrower absolute dispersion, often called sigma convergence. A negative initial-level–change association resembles a beta-convergence pattern, but is not sufficient evidence of a common adjustment mechanism (Barro & Sala-i-Martin, 1992; Quah, 1993). Because the change measure subtracts the initial observation, mathematical coupling can contribute to a negative association between baseline adoption and subsequent gains. Measurement error in the baseline estimate may introduce additional distortion. The upper bound of adoption adds a further constraint: maximum possible gain equals 100 minus the initial level.
Accordingly, the analysis uses complementary measures rather than a single convergence label. Standard deviation assesses absolute dispersion; the coefficient of variation describes dispersion relative to the mean; endpoint rank correlation assesses persistence of relative positions. Baseline headroom closure expresses a country's gain as a share of its initial distance from 100%. This rescaling does not remove measurement error or establish efficiency. We assess whether the interpretation of catching-up based on absolute percentage-point gains remains consistent when gains are normalised by baseline headroom.
3. Data and methods
3.1. Scope and measurement screen
The unit of analysis is an economy in a survey round. The underlying observations are repeated national cross-sections, not a panel of the same individuals. We use an exploratory, purposively selected set of 17 candidate economies. The design was not preregistered. The candidates were Albania, Armenia, Azerbaijan, Bosnia and Herzegovina, Georgia, Kazakhstan, the Kyrgyz Republic, Moldova, Mongolia, Montenegro, North Macedonia, the Russian Federation, Serbia, Tajikistan, Türkiye, Ukraine and Uzbekistan. The selection is not exhaustive; no probability of selection is assigned to economies.
The data screen first requires a published all-adult value for each of the four rounds. Montenegro lacks an intermediate-round observation; the Russian Federation lacks the 2024 value for the selected indicator. Fifteen complete cases remain. The screening register preserves these decisions rather than treating missing values as zeros.
A further comparability screen excludes Ukraine from the primary analysis. Box 3.3.1 and its associated note in the 2025 report document an abbreviated questionnaire in selected economies, including Ukraine. Questions on receiving payments and some payment types were omitted; making a digital payment or accessing an account using a card or phone formed the alternative measure (Klapper et al., 2025). This documented exception warrants a conservative exclusion, without implying that the provider's estimate is erroneous or establishing the direction of measurement bias. Ukraine remains in the extended-sample sensitivity analysis. The primary sample therefore contains 14 economies and 56 economy-round values. This screen improves transparency but does not establish complete measurement invariance elsewhere.

Table 1.
Country screening and analytical scope.
| Stage | Economies | Decision |
|---|---|---|
| Purposive candidate set | 17 | Exploratory scope; no claim of regional representativeness |
| Complete indicator records | 15 | Exclude Montenegro and the Russian Federation for missing required records |
| Primary comparable subset | 14 | Exclude Ukraine for the documented 2024 questionnaire exception |
| Primary data structure | 56 values | 14 economies × four rounds; no interpolation or zero substitution |
| Extended sensitivity | 15 | Restore Ukraine with a measurement caveat |
Source: World Bank (2025a) and Klapper et al. (2025); authors’ documented screening.
3.2. Source and timing
The source is the World Bank's Global Findex Database 2025 aggregate workbook, downloaded on 28 October 2026 (World Bank, 2025a). The extract uses sheet Data, indicator g20.any, and group and group2 both equal to all. Workbook proportions are multiplied by 100. The outcome is the published share of adults aged 15 or older who made or received a qualifying digital payment during the preceding year. The analysis uses the published country-level estimates and their documented survey reference years. Calculations are based on unrounded source values, with results rounded only for presentation.
At the final source check on 28 October 2026, the 2024 survey round, published in Global Findex 2025, was the latest publicly available Findex round for the selected payment-use indicator (World Bank, 2025a). The analysis therefore uses the latest available survey round for the selected indicator. The 2025 release date does not change the survey reference year, and these estimates should not be interpreted as measurements of payment participation in 2026.
The rounds are labelled 2014, 2017, 2021/22 and 2024. Azerbaijan's intermediate record has source reference year 2022, while the other selected economies have 2021. Its documented fieldwork ran from October 2022 to February 2023 (World Bank, 2023). Thus reference years do not identify the exact elapsed time between interviews. For descriptive annualization, Azerbaijan has reference-year intervals of five and two years after 2017; other economies have four and three. These rates are approximations and do not reconstruct annual observations. The primary estimates are also checked after excluding Azerbaijan.
The World Bank methodology documents probability sampling and national survey weights, alongside variations in modes and coverage (World Bank, 2025b). The 2024 samples in the selected economies are generally about 1,000 adults. Coverage exceptions include Transnistria in Moldova, Karakalpakstan in Uzbekistan and specified territories in Azerbaijan. Azerbaijan's intermediate and final rounds also differ in coverage. Supplementary Table S2 records the 2024 fieldwork, sample size, mode and documented exclusions. These issues may affect comparisons; their direction and magnitude cannot be inferred from the aggregate workbook.
3.3. Descriptive measures
Let A denote a country's adoption percentage. Each primary wave-level summary gives equal weight to the 14 economies, describing the average selected economy rather than the average Eurasian adult. Means, medians, ranges and sample standard deviations are reported. Standard deviation uses the n−1 divisor, with n = 14; this is a descriptive convention, not a claim of random country sampling. The coefficient of variation is 100 times standard deviation divided by the mean. A falling coefficient alone can reflect a rising mean, so it is interpreted alongside absolute dispersion.
The endpoint gain is the 2024 estimate minus the 2014 estimate, in percentage points. Interval rates divide each country's difference by the difference between its source reference years, then average those country rates. They are not compound percentage growth rates. Pearson's correlation relates the initial level to endpoint gains; Spearman's correlation relates the 2014 and 2024 ranks, with rank 1 assigned to the highest adoption estimate. These endpoint correlations use 14 economies, not 56 independent observations.
Baseline headroom closure is calculated as follows, where H is expressed as a percentage of initially available headroom.
The denominator is strictly positive for every included baseline estimate. H is a descriptive normalization of the gain, not a probability that an initially unserved person adopted: the surveys observe different respondents, and population composition may change. It is also not an efficiency or policy-performance measure. We compare its ordering and initial-level correlation with those based on raw percentage-point gains.
3.4. Sensitivity analysis and reproducibility
Sensitivity checks include the original 15-economy sample with Ukraine, a 13-economy sample excluding Azerbaijan, one-decimal input rounding and leave-one-out exclusions. Moldova is also excluded in a separate specification because its documented 2024 territorial coverage exclusion, approximately 13%, is the largest quantified share among the primary economies. Population-weighted means use the workbook's adult population estimates; fixed 2024 weights separate the influence of changing country population weights. These summaries remain confined to the selected economies and do not correct survey undercoverage. The checks are diagnostic, not corrections for all potential biases.
The analysis uses published point estimates. Indicator-specific design-based confidence intervals cannot be reconstructed from the aggregate workbook, and the methodology's general national margins of error are not substituted for indicator standard errors. No significance tests or causal regressions are reported. Small changes and rank differences therefore warrant caution. The underlying data are publicly available from the World Bank Global Findex Database 2025. The manuscript documents the sample selection criteria, statistical measures and sensitivity procedures, while the supplementary material reports country-level estimates and additional results. Calculations were performed using Python 3.12.14 and NumPy 2.3.5.
OpenAI GPT-6 through Codex was used in October 2026 to assist with study restructuring, source checks, analytical code, figure preparation and drafting. AI-generated output was not used as a primary data source. The authors reviewed the AI-assisted outputs and retain responsibility for the accuracy of the reported calculations, their scientific interpretation and the final submitted material.
4. Results
4.1. Expansion and changing dispersion
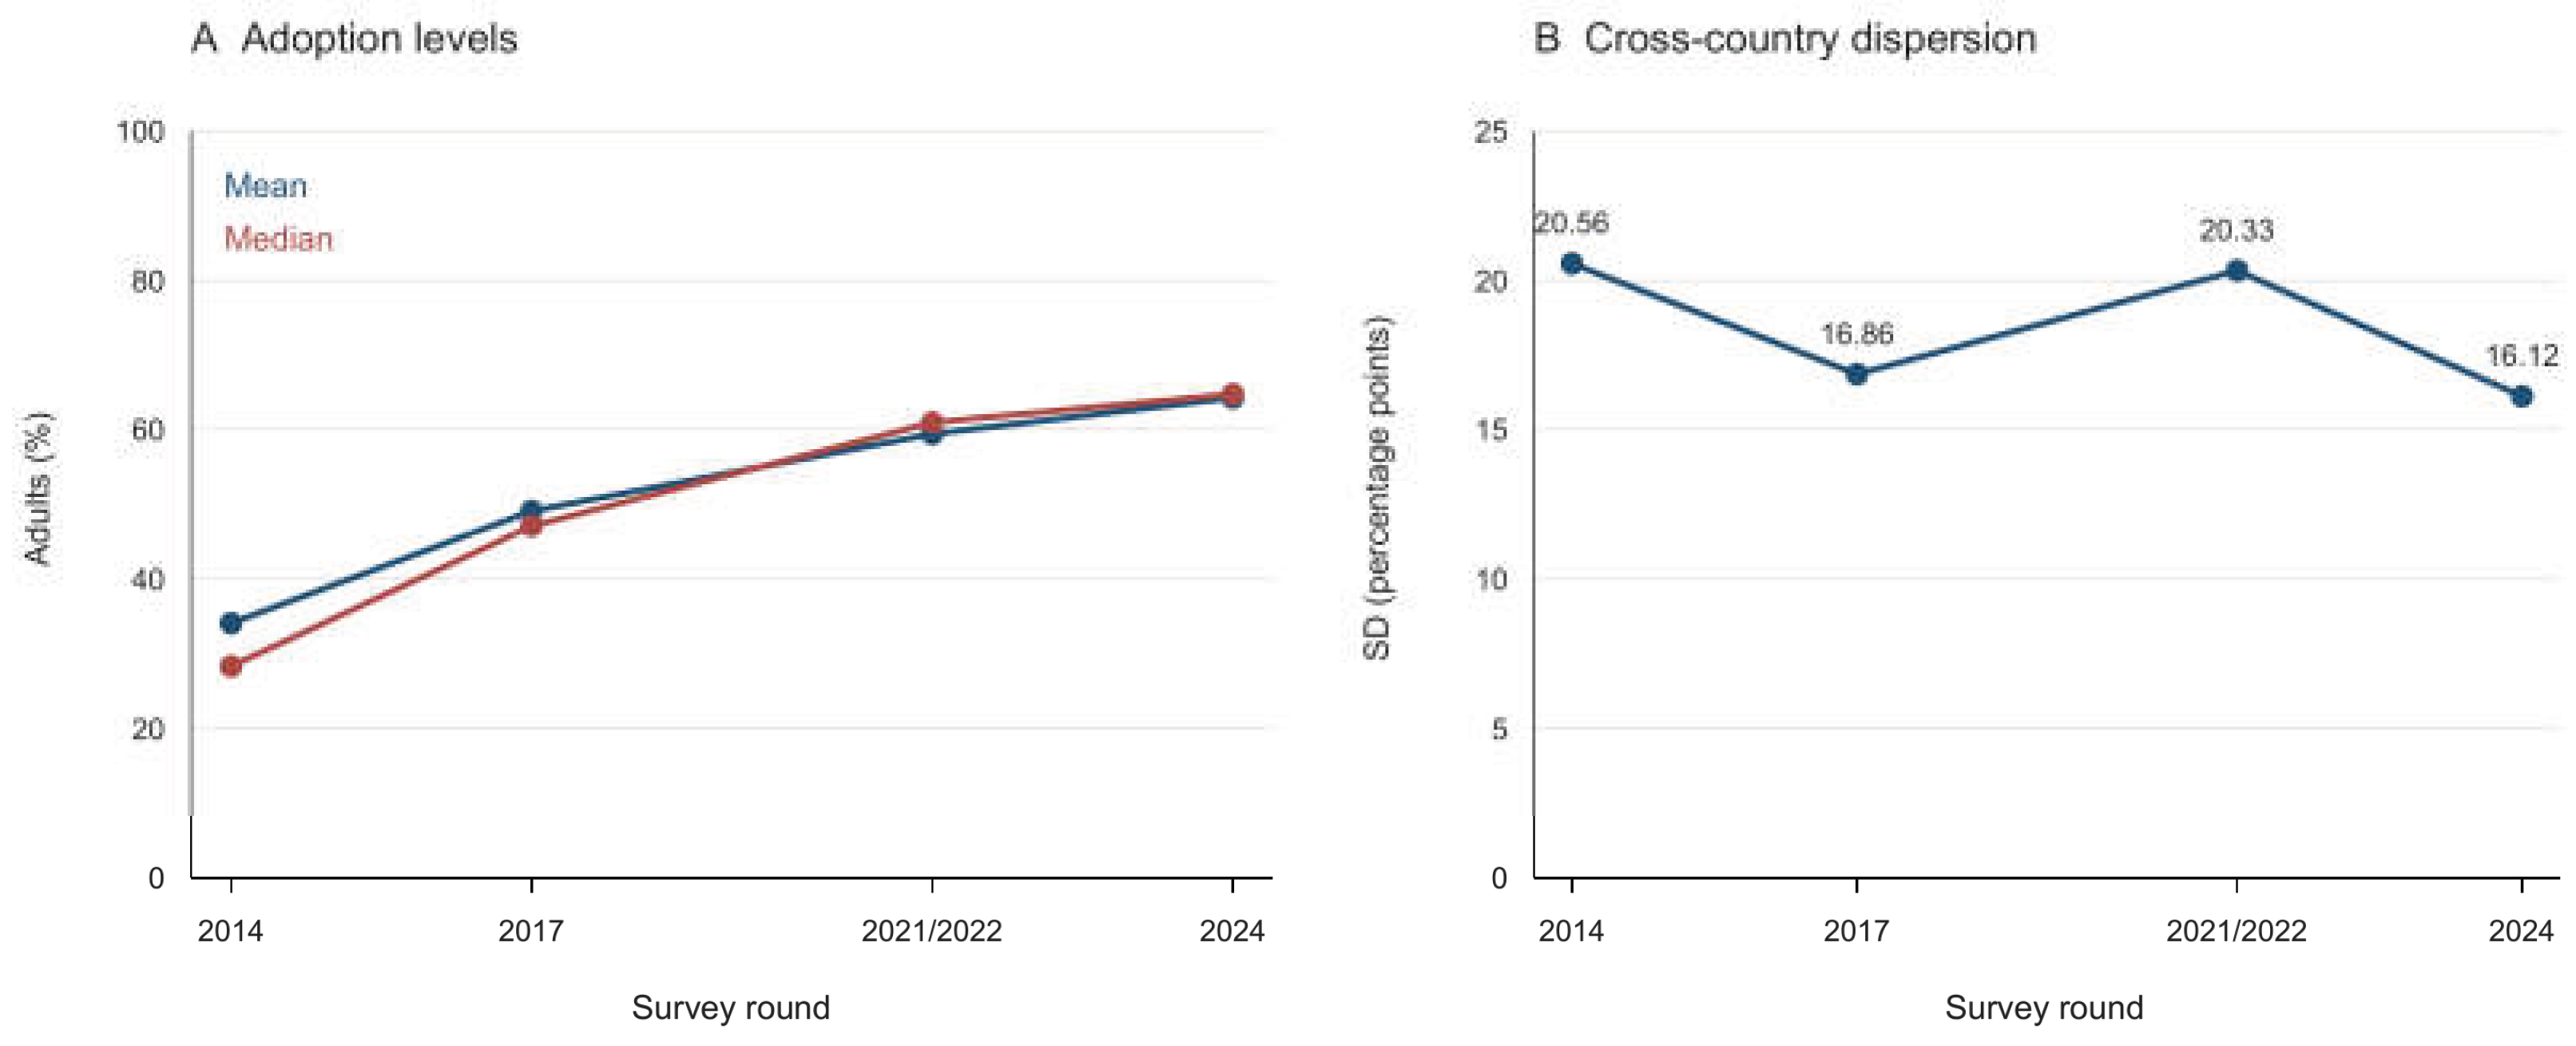
Mean adoption rose from 34.10% in 2014 to 49.11% in 2017, 59.43% in the intermediate round and 64.26% in 2024. The endpoint increase was 30.16 percentage points. The median rose from 28.33% to 64.77%. All 14 final point estimates exceeded their 2014 levels, but this does not imply that each intervening path increased monotonically.
Table 2.
Adoption levels and cross-economy dispersion in the primary sample.
| Round | Mean % | Median % | SD pp | CV % | Minimum % |
Maximum % |
|---|---|---|---|---|---|---|
| 2014 | 34.10 | 28.33 | 20.56 | 60.29 | 8.75 | 72.27 |
| 2017 | 49.11 | 47.10 | 16.86 | 34.33 | 24.58 | 85.27 |
| 2021/2022 | 59.43 | 60.96 | 20.33 | 34.20 | 33.13 | 97.41 |
| 2024 | 64.26 | 64.77 | 16.12 | 25.08 | 35.31 | 94.91 |
Source: authors’ calculations from World Bank (2025a). n = 14 in each round. SD uses n−1. Intermediate-round source year is 2022 for Azerbaijan and 2021 for other primary economies. pp = percentage points
The standard deviation fell from 20.56 to 16.12 percentage points between the endpoints, a reduction of 21.59%. Its path was non-monotonic: it first declined to 16.86, rose to 20.33 in 2021/22 and then declined again. The coefficient of variation decreased from 60.29% to 25.08%. Both endpoint measures indicate narrower cross-economy differences, while the intermediate reversal argues against describing the process as continuous convergence. In 2024 the range still extended from 35.31% in Albania to 94.91% in Mongolia.
Figure 1.
Mean and median adoption and absolute dispersion across the four rounds. Lines join observed rounds and do not represent interpolated annual estimates. Source: authors’ calculations from World Bank (2025a).
Figure 1.
Mean and median adoption and absolute dispersion across the four rounds. Lines join observed rounds and do not represent interpolated annual estimates. Source: authors’ calculations from World Bank (2025a).
4.2. Interval changes and national heterogeneity
Mean reference-year-adjusted increases were 5.00, 2.52 and 1.72 percentage points per year across the three intervals. The last rate was 34.31% of the first. These are comparisons of country-level interval changes; they do not date a slowdown within an interval or attribute it to a particular event. Excluding Azerbaijan, whose intermediate fieldwork straddles calendar years, gives approximately 5.28, 2.43 and 1.50 percentage points per year. Thus the declining sequence in the selected-economy average does not depend on that timing treatment.
National paths differed substantially. The largest endpoint gains were in the Kyrgyz Republic, Armenia and Georgia: 52.37, 48.31 and 45.80 percentage points, respectively. Uzbekistan's increase was 11.51 points and Albania's 12.85 points. Between the intermediate and final rounds, the estimates decreased in Bosnia and Herzegovina, Moldova, Mongolia and Serbia, by 4.45, 9.30, 2.50 and 10.44 percentage points. These declines refer to published point estimates and cannot be interpreted as confirmed population-level reversals. Differences in survey coverage and measurement also limit their attribution to changes in payment infrastructure or policy.
Table 3.
Country estimates and endpoint progress.
| Economy | 2014 % | 2017 % | 2021/22 % | 2024 % | Gain pp | Headroom closed % |
|---|---|---|---|---|---|---|
| Albania | 22.5 | 28.8 | 34.6 | 35.3 | 12.8 | 16.6 |
| Armenia | 12.3 | 41.5 | 47.5 | 60.6 | 48.3 | 55.1 |
| Azerbaijan | 20.4 | 24.6 | 42.5 | 51.6 | 31.2 | 39.2 |
| Bosnia and Herzegovina | 33.1 | 50.3 | 66.5 | 62.1 | 29.0 | 43.3 |
| Georgia | 23.6 | 53.0 | 62.2 | 69.4 | 45.8 | 59.9 |
| Kazakhstan | 46.7 | 53.9 | 77.9 | 85.0 | 38.3 | 71.9 |
| Kyrgyz Republic |
15.1 | 36.1 | 39.4 | 67.5 | 52.4 | 61.7 |
| Moldova | 15.2 | 40.4 | 59.8 | 50.5 | 35.2 | 41.6 |
| Mongolia | 72.3 | 85.3 | 97.4 | 94.9 | 22.6 | 81.6 |
| North Macedonia |
55.9 | 65.8 | 74.3 | 75.2 | 19.3 | 43.7 |
| Serbia | 63.7 | 66.1 | 87.5 | 77.0 | 13.4 | 36.8 |
| Tajikistan | 8.7 | 43.9 | 33.1 | 49.3 | 40.6 | 44.5 |
| Türkiye | 49.5 | 63.8 | 67.6 | 71.4 | 21.9 | 43.3 |
| Uzbekistan | 38.4 | 34.2 | 41.7 | 49.9 | 11.5 | 18.7 |
Source: authors’ calculations from World Bank (2025a). Gains and headroom closure are calculated using unrounded estimates; differences derived from the displayed values may therefore vary by 0.1 percentage points. Headroom closure = 100 × gain / (100 − baseline). Azerbaijan's intermediate source reference year is 2022. Ukraine is excluded from the primary sample.
4.3. Catching up depends on the growth metric
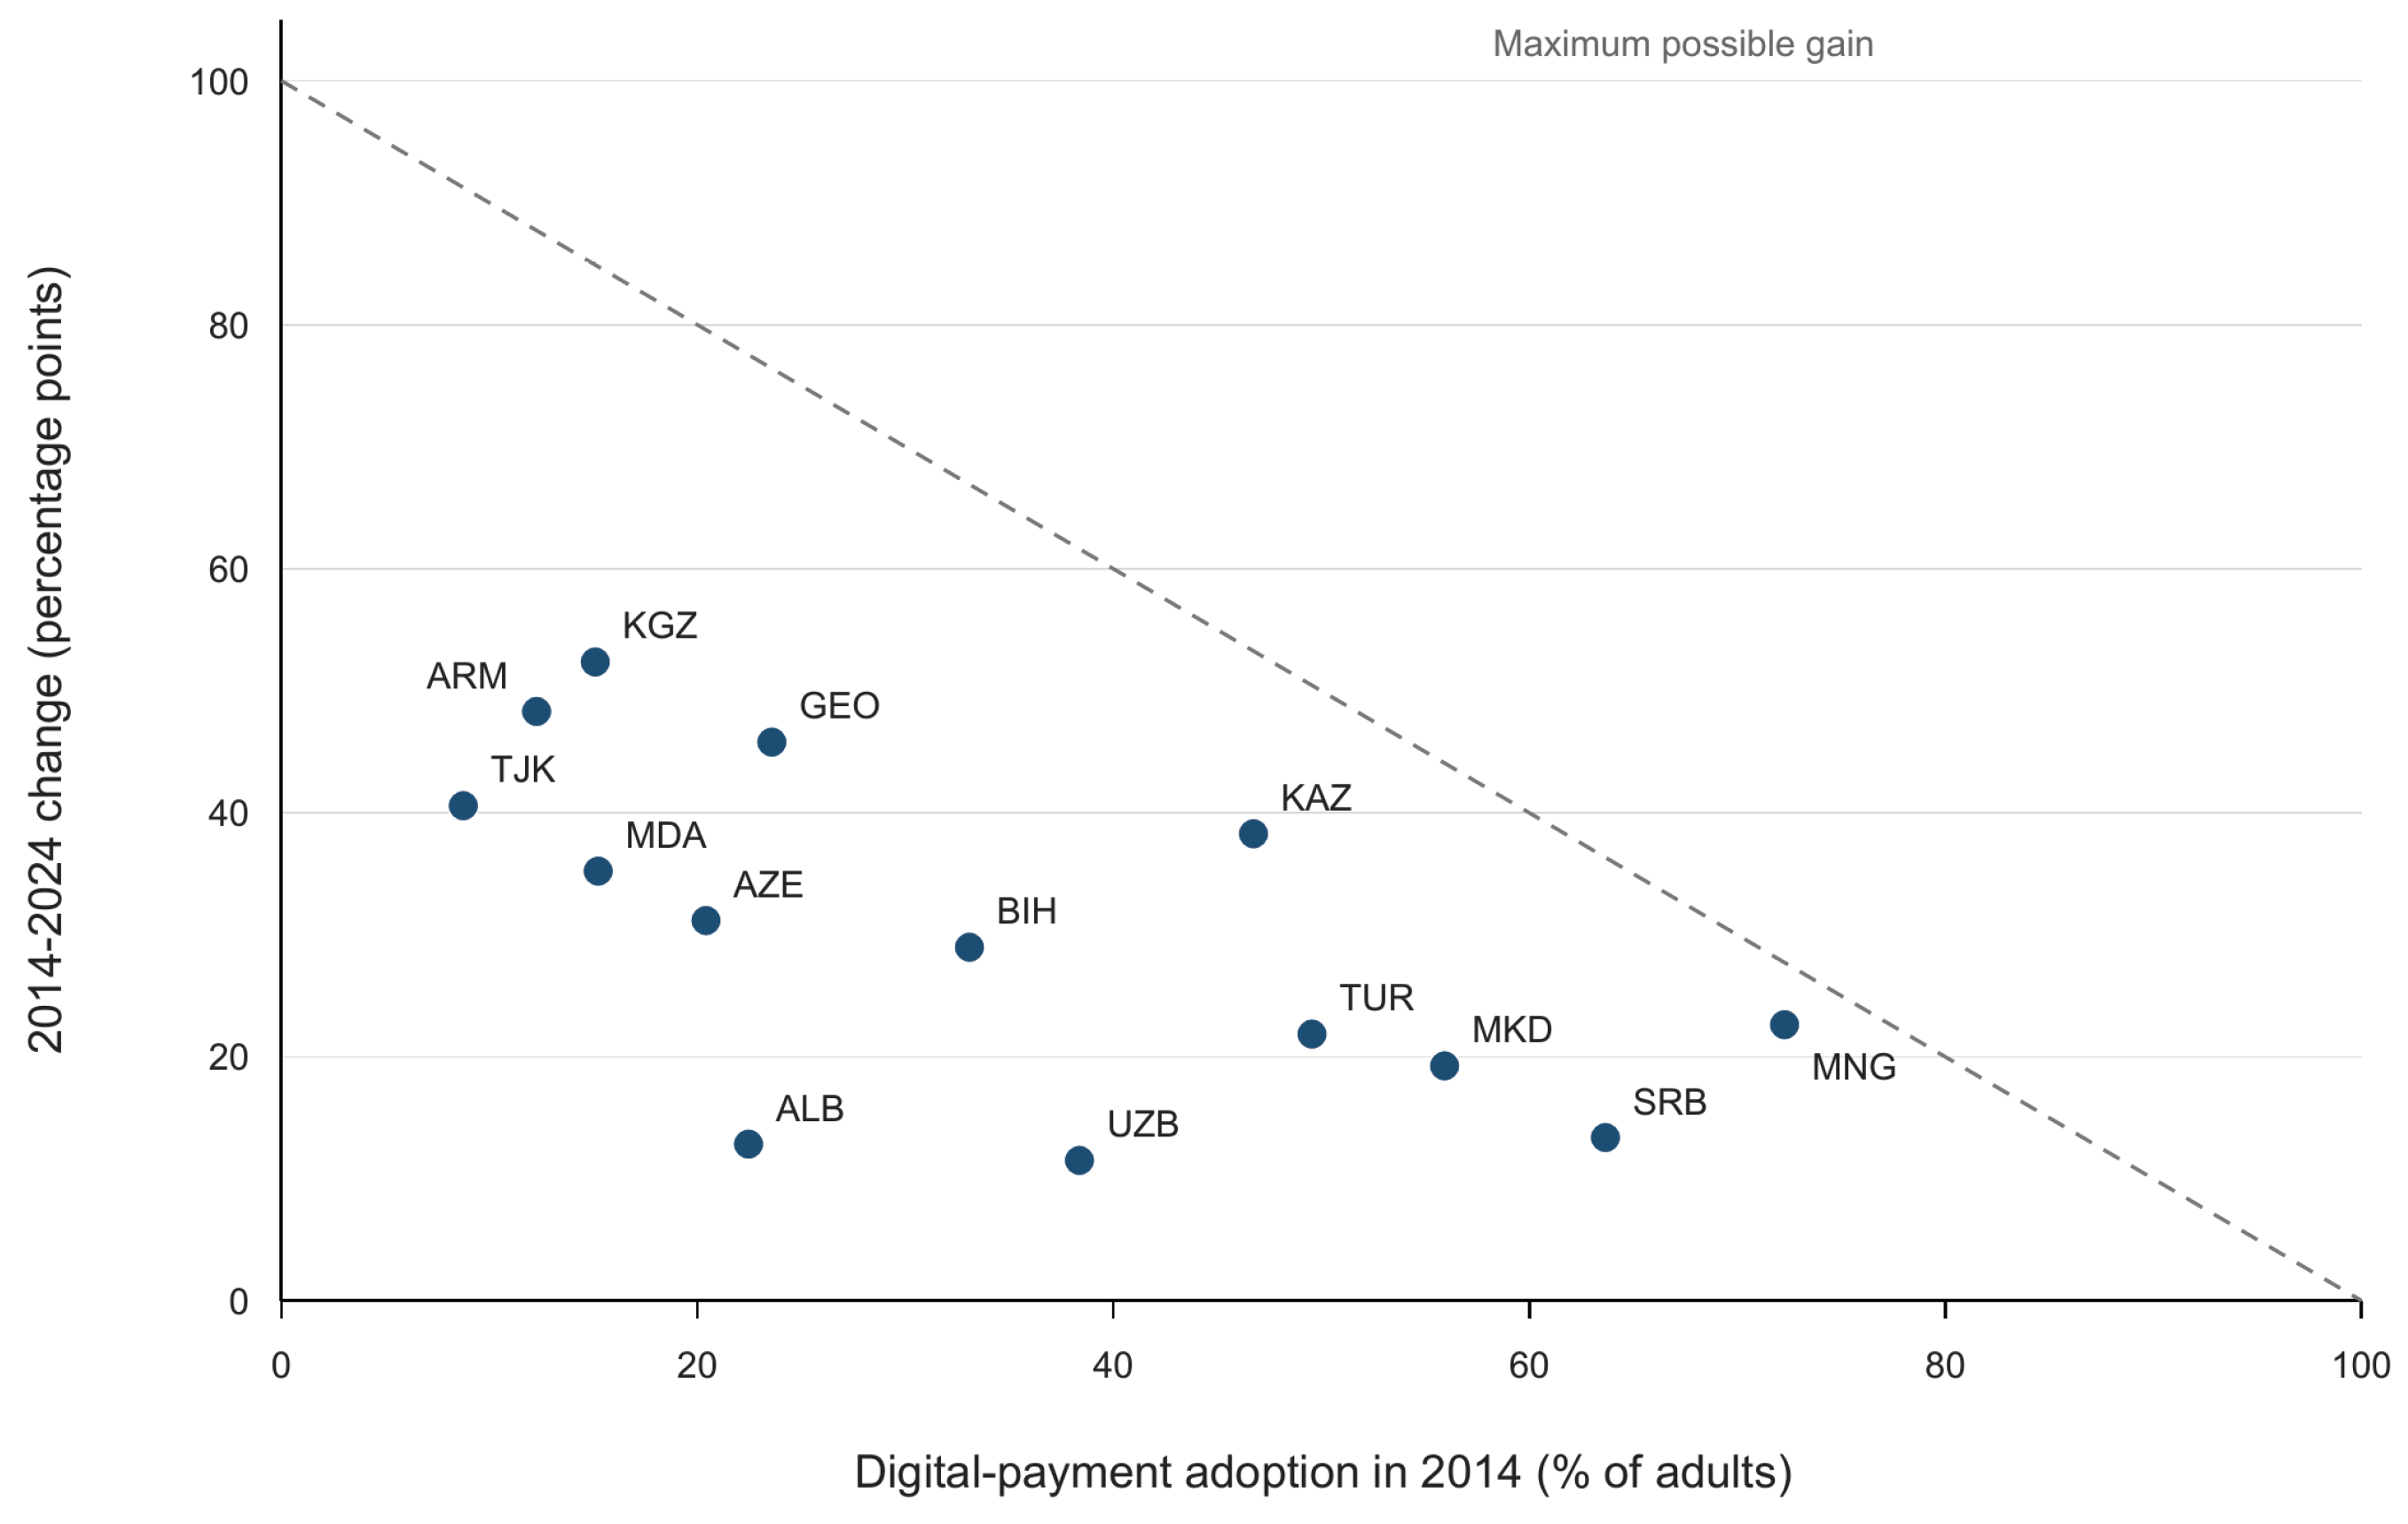
The Pearson correlation between 2014 adoption and endpoint percentage-point gains was −0.622. Lower initial estimates tended to be associated with larger absolute gains within the selected group. However, the feasible maximum gain decreases mechanically with the initial value, as illustrated in Figure 2. The descriptive association does not identify a convergence mechanism.
Mean baseline headroom closure was 46.99%, with a median of 43.53%. Mongolia closed 81.63% of its baseline headroom and Kazakhstan 71.88%, compared with 61.68% in the Kyrgyz Republic. The association between initial adoption and headroom closure was +0.234, reversing the sign of the raw gain correlation. The reversal indicates that the negative association observed for absolute gains is sensitive to the choice of growth measure and cannot, on its own, establish a general catching-up pattern.
Endpoint rank correlation was 0.736, indicating considerable persistence despite several changes in position. Mongolia remained first. The Kyrgyz Republic moved from twelfth to seventh, while Uzbekistan moved from sixth to twelfth. Reduced absolute dispersion and persistent relative positions describe different aspects of the distribution and can coexist.
4.4. Kazakhstan as a comparative benchmark
Kazakhstan's estimates were 46.74%, 53.87%, 77.93% and 85.02% across the four rounds. It moved from fifth to second place in the primary group and exceeded the 2024 unweighted mean by 20.76 percentage points. Its endpoint gain of 38.29 points ranked fifth, while its 71.88% headroom closure ranked second. Ranking by absolute gains therefore places Kazakhstan lower than the headroom-closure ranking does.
Kazakhstan's interval rates were 2.38, 6.01 and 2.37 percentage points per year. Unlike the selected-group average, its fastest observed interval was 2017–2021. Its latest rate was lower than that preceding interval, but close to its first interval. The contrast cautions against treating the average sequence as a national trajectory. The estimates establish wider reported participation; they do not reveal transaction frequency, provider competition or the contribution of particular reforms.
4.5. Sensitivity checks
The main endpoint findings were similar after removing Azerbaijan or Moldova and after rounding inputs to one decimal place. Restoring Ukraine produced a mean increase from 35.05% to 65.50%, a 19.29% decline in standard deviation, a raw initial-level–gain correlation of −0.594 and rank correlation of 0.750. That benchmark remains explicitly subject to Ukraine's questionnaire exception; numerical similarity does not resolve the measurement issue.
Table 4.
Endpoint sensitivity checks for 2014–2024.
| Specification | n | Mean gain pp | SD change % | Initial level vs gain r | Rank ρ |
|---|---|---|---|---|---|
| Primary sample | 14 | 30.16 | -21.59 | -0.622 | 0.736 |
| Exclude Azerbaijan | 13 | 30.08 | -22.18 | -0.630 | 0.769 |
| Exclude Moldova | 13 | 29.77 | -21.21 | -0.620 | 0.769 |
| One-decimal inputs | 14 | 30.16 | -21.64 | -0.623 | 0.736 |
| Include Ukraine with caveat | 15 | 30.46 | -19.29 | -0.594 | 0.750 |
Source: authors’ calculations. SD change is the percentage change in the standard deviation, not a percentage-point change in adoption. The Ukraine sensitivity retains the published estimate despite its documented measurement exception. Correlations are descriptive and use n economies.
Across the 14 leave-one-out cases, the raw initial-level–gain correlation ranged from −0.741 to −0.559. Endpoint standard deviation declined in every case, by 16.14% to 31.97%. The persistence of these patterns across leave-one-out specifications indicates that no single economy drives the endpoint results, although the underlying measurement and selection limitations remain.
Contemporaneous adult-population weighting gave means of 41.48%, 52.69%, 60.82% and 66.34%. Fixed 2024 population weights gave 41.53%, 52.70%, 60.70% and 66.34%. Both preserve the upward sequence, while the weighted endpoint gain is smaller than the equal-economy gain. The difference reflects the estimand and relative population sizes, not an error in either calculation. Detailed results and the retained Ukraine observations appear in the supplementary material.
5. Discussion
5.1. What the distribution reveals
The results indicate broader digital payment participation across the selected economies and narrower endpoint dispersion. However, dispersion increased between 2017 and the intermediate round before declining, national trajectories differed from the group average, and relative country positions remained persistent. Rising participation therefore did not entail a uniform pace of adoption, a continuous narrowing of cross-economy differences or convergence towards a common level.
The headroom comparison provides a different perspective on the negative correlation between initial adoption and absolute gains. An economy with relatively high initial participation can close a substantial proportion of its remaining gap despite a modest percentage-point increase. Mongolia illustrates this distinction, while Kazakhstan combines a high final adoption level with considerable headroom closure. Conversely, large absolute gains from a low baseline do not necessarily translate into a leading final position. The divergence between absolute and headroom-adjusted gains indicates that assessments of catching-up depend on whether progress is measured in percentage points or relative to the initial distance from universal adoption.
Headroom adjustment nevertheless introduces its own limitations. Dividing gains by the remaining baseline gap makes the resulting measure sensitive to the initial estimate, particularly as adoption approaches 100%. The transformation neither identifies latent adoption potential nor eliminates regression-to-the-mean effects. The reversal in the initial-level correlation therefore demonstrates sensitivity to the chosen growth measure rather than establishing the superiority of headroom-adjusted gains as a convergence statistic. The reduction in endpoint standard deviation remains a distinct finding, supported by the sensitivity checks.
5.2. Relevance to payment-system development in Kazakhstan
For Kazakhstan, the comparative evidence establishes a relatively strong position in digital payment participation within the selected group. However, these findings cannot determine whether payment-system development has improved financial-sector competitiveness. Examining that relationship would require separately defined outcomes, including payment costs, service accessibility, interoperability, operational reliability and market structure, together with a research design addressing reverse causality and common economic influences.
More recent administrative statistics provide additional context without extending the survey observation period. In its August 2026 payment-card and electronic-banking release, the National Bank of Kazakhstan (2026) reported KZT 17.9 trillion in non-cash transactions using cards issued in Kazakhstan, representing a 6.1% year-on-year increase in nominal transaction value. These figures measure transaction activity rather than the proportion of adults participating in digital payments and are therefore not incorporated into the Global Findex series. The distinction highlights the different information provided by administrative payment statistics and internationally comparable participation surveys.
This distinction also has implications for monitoring payment-system development. As digital payment participation approaches higher levels, further improvements may be reflected in transaction frequency, lower costs, service reliability or accessibility without corresponding increases in the binary adoption measure. Cross-country analyses of payment infrastructure, such as Górka (2025), and research on adoption determinants, including Andaregie et al. (2024), offer complementary perspectives on these dimensions.
5.3. Limits of the evidence
The purposive selection of economies restricts the generalisability of the findings beyond the analytical sample. Maintaining a fixed country composition prevents changes in sample membership from affecting the primary averages, but does not establish regional representativeness. The screening criteria and their implications for sample composition are documented in the supplementary material. Extended-sample and country-exclusion checks demonstrate the sensitivity of the results to alternative specifications without establishing that any particular sample provides a uniquely valid comparison.
The indicator captures whether adults participated in digital payments during the preceding year, rather than transaction intensity, monetary value, system security or welfare outcomes. Published estimates are subject to sampling uncertainty, differences in questionnaire design, survey modes and geographical coverage. Excluding Ukraine addresses a documented measurement exception but does not establish full comparability across the remaining economies and survey rounds. Azerbaijan's extended fieldwork period and changes in territorial coverage, together with the other documented exclusions, introduce additional limitations.
The four survey rounds do not permit the reconstruction of annual adoption dynamics. Annualised changes based on survey reference years approximate the timing of observations rather than actual elapsed interview periods. Moreover, the absence of indicator-specific design-based confidence intervals limits the interpretation of relatively small changes and differences in country rankings. Country-exclusion checks cannot substitute for statistical inference based on respondent-level survey data. The analysis does not identify causal effects attributable to the COVID-19 pandemic, regulatory interventions, financial infrastructure or digital payment adoption itself. Further research could extend the present framework by incorporating respondent-level survey designs and independently measured indicators of financial-sector competitiveness.
6. Conclusions
Across 14 selected Eurasian economies, mean digital payment adoption increased from 34.10% to 64.26% between 2014 and 2024. Absolute dispersion narrowed by 21.59%, although its trajectory was non-monotonic and relative country positions remained persistent. The average annualised rate of increase declined across the selected economies, whereas Kazakhstan recorded its strongest growth during 2017–2021 and ranked second in adoption by 2024.
The negative association between initial adoption and absolute gains changed sign when gains were normalised by baseline headroom. The findings therefore distinguish a reduction in absolute dispersion from evidence of a common catching-up mechanism, which cannot be established from the observed associations alone. For Kazakhstan, the contrast between absolute gains and headroom closure demonstrates why assessments of payment-system development should distinguish the level of participation from progress relative to the remaining adoption gap. Whether these developments translate into greater financial-sector competitiveness requires separate empirical investigation.
Supplementary Materials
The following supporting information can be downloaded at the website of this paper posted on Preprints.org: Table S1, Complete source extract and primary-sample inclusion; Table S2, Documented 2024 fieldwork and coverage; Table S3, Primary-sample interval changes; Table S4, Endpoint sensitivity specifications; Table S5, Leave-one-out endpoint results; Table S6, Equal-economy and adult-population-weighted means; Figure S1, Percentage-point gains and baseline headroom closure.
Author Contributions
Conceptualization: A.B.A. and L.A.O.; Methodology: A.B.A. and I.V.S.; Formal analysis: A.B.A.; Investigation: A.B.A. and T.T.M.-L.; Data curation: A.B.A.; Validation: I.V.S., A.K.T., and T.T.M.-L.; Resources: A.K.T.; Visualization: A.B.A. and A.K.T.; Supervision: I.V.S.; Project administration: L.A.O.; Writing – original draft: A.B.A.; Writing – review & editing: A.K.T., T.T.M.-L., and L.A.O. All authors have read and approved the final manuscript and agree to be accountable for all aspects of the work.
Funding
This research received no external funding.
Institutional Review Board Statement
Not applicable. This study used publicly available aggregate country-level secondary data and involved no new recruitment, intervention or access to personally identifiable information.
Informed Consent Statement
Not applicable.
Data Availability Statement
The underlying country-level data are publicly available from the World Bank Global Findex Database 2025 (https://www.worldbank.org/en/publication/globalfindex/download-data). The country-level estimates, sample inclusion decisions, derived statistics and sensitivity results reported in this study are presented in the manuscript and its supplementary material. Further inquiries regarding the analytical procedures may be directed to the corresponding author.
Acknowledgments
During the preparation of this manuscript, the authors used OpenAI GPT-6 through Codex (OpenAI, October 2026) to assist with study restructuring, literature and source checks, analytical code, figure preparation and drafting. The authors reviewed and edited the outputs, verified the sources and calculations, and take full responsibility for the content of this publication. AI-generated output was not used as a primary source of evidence.
Conflicts of Interest
The authors declare no conflicts of interest.
Abbreviations
The following abbreviations are used in this manuscript:
| AI | Artificial Intelligence |
| CV | Coefficient of Variation |
| DOI | Digital Object Identifier |
| KZT | Kazakhstani Tenge |
| SD | Standard Deviation |
| pp | Percentage Points |
References
- Andaregie, A.; Abebe, G. K.; Gupta, P.; Worku, G.; Matsumoto, H.; Astatkie, T.; Takagi, I. Exploring individuals’ socioeconomic characteristics and digital infrastructure determinants of digital payment adoption in Ethiopia. Digit. Bus. 2024, 4(2), 100092. [Google Scholar] [CrossRef]
- Barro, R. J.; Sala-i-Martin, X. Convergence. J. Political Econ. 1992, 100(2), 223–251. [Google Scholar] [CrossRef]
- Birigozzi, A.; De Silva, C.; Luitel, P. Digital payments and GDP growth: A behavioural quantitative analysis. Res. Int. Bus. Financ. 2025, 75, 102768. [Google Scholar] [CrossRef]
- Boot, A. W. A.; Hoffmann, P.; Laeven, L.; Ratnovski, L. Fintech: What’s old, what’s new? J. Financ. Stab. 2021, 53, 100836. [Google Scholar] [CrossRef]
- Demirgüç-Kunt, A.; Klapper, L.; Singer, D.; Ansar, S. The Global Findex Database 2021: Financial inclusion, digital payments, and resilience in the age of COVID-19; World Bank, 2022. [Google Scholar] [CrossRef]
- Gomber, P.; Koch, J.-A.; Siering, M. Digital finance and FinTech: Current research and future research directions. J. Bus. Econ. 2017, 87(5), 537–580. [Google Scholar] [CrossRef]
- Górka, J. The rise of instant payments: A cross-country comparison. Cent. Eur. Manag. J. 2025, 33(4), 575–589. [Google Scholar] [CrossRef]
- Khera, P.; Ng, S.; Ogawa, S.; Sahay, R. Is digital financial inclusion unlocking growth? (IMF Working Paper No. 2021/167); International Monetary Fund, 2021. [Google Scholar] [CrossRef]
- Khera, P.; Ng, S.; Ogawa, S.; Sahay, R. Measuring digital financial inclusion in emerging market and developing economies: A new index. Asian Econ. Policy Rev. 2022, 17(2), 213–230. [Google Scholar] [CrossRef]
- Klapper, L.; Singer, D.; Starita, L.; Norris, A. The Global Findex Database 2025: Connectivity and financial inclusion in the digital economy. In World Bank; 2025. [Google Scholar] [CrossRef]
- National Bank of Kazakhstan. Platezhnye kartochki i elektronnye bankovskie uslugi [Payment cards and electronic banking services] (Version 276). 29 September 2026. Available online: https://nationalbank.kz/ru/news/elektronnye-bankovskie-uslugi/20351 (accessed on 28 October 2026).
- Putrevu, J.; Mertzanis, C. The adoption of digital payments in emerging economies: Challenges and policy responses. Digit. Policy Regul. Gov. 2024, 26(5), 476–500. [Google Scholar] [CrossRef]
- Quah, D. Galton’s fallacy and tests of the convergence hypothesis. Scand. J. Econ. 1993, 95(4), 427–443. [Google Scholar] [CrossRef]
- Vives, X. Digital disruption in banking. Annu. Rev. Financ. Econ. 2019, 11, 243–272. [Google Scholar] [CrossRef]
- World Bank. Global Financial Inclusion (Global Findex) Database 2021: Azerbaijan; Microdata Library, 2023. [Google Scholar] [CrossRef]
- World Bank. The Global Findex Database 2025: Data download and documentation [Data set]. 2025a. Available online: https://www.worldbank.org/en/publication/globalfindex/download-data (accessed on 28 October 2026).
- World Bank. Global Findex Database 2025: Survey methodology [Survey documentation]. 2025b. Available online: https://thedocs.worldbank.org/en/doc/be6615202d1f08a25855c8ac2d615122-0050012025/related/Survey-methodology.pdf (accessed on 28 October 2026).
Figure 2.
Initial adoption and endpoint gain in the primary sample. The dashed line marks the arithmetic upper bound, gain = 100 − baseline; it is not a fitted relationship. ISO codes identify economies. Source: authors’ calculations from World Bank (2025a).
Figure 2.
Initial adoption and endpoint gain in the primary sample. The dashed line marks the arithmetic upper bound, gain = 100 − baseline; it is not a fitted relationship. ISO codes identify economies. Source: authors’ calculations from World Bank (2025a).
Disclaimer/Publisher’s Note: The statements, opinions and data contained in all publications are solely those of the individual author(s) and contributor(s) and not of MDPI and/or the editor(s). MDPI and/or the editor(s) disclaim responsibility for any injury to people or property resulting from any ideas, methods, instructions or products referred to in the content. |
© 2026 by the authors. Licensee MDPI, Basel, Switzerland. This article is an open access article distributed under the terms and conditions of the Creative Commons Attribution (CC BY) license (http://creativecommons.org/licenses/by/4.0/).
Copyright: This open access article is published under a Creative Commons CC BY 4.0 license, which permit the free download, distribution, and reuse, provided that the author and preprint are cited in any reuse.