
Submitted:
16 November 2026
Posted:
18 November 2026
You are already at the latest version
Abstract
Macroeconomic forecasting models typically prioritize minimizing average error, often underrepresenting rare events such as financial crises and recessions. This study addresses this limitation by proposing a framework to identify macro-financial regimes and examine model behaviour during periods of economic shocks. A comprehensive monthly macroeconomic dataset was transformed to ensure stationarity, with outliers removed and features scaled for analysis. A sequence-to-sequence Long Short-Term Memory (LSTM) autoencoder was then trained using rolling windows to generate reconstruction errors and latent representations. These extracted signals were clustered using a Gaussian Mixture Model (GMM) to identify persistent economic regimes. Finally, the resulting latent regimes were compared with National Bureau of Economic Research (NBER) recession cycles and historical economic shock events. The findings show that reconstruction errors increase substantially during major crises, particularly the 2008 Global Financial Crisis and the 2020 COVID-19 pandemic, demonstrating the framework’s ability to capture periods of heightened macro-financial stress.
Keywords:
Temporal Feature Amnesia
; macroeconomic forecasting
; LSTM Autoencoder
; economic shocks
; machine learning
1. Introduction
Macroeconomic forecasting plays an essential role in economic policies, investing and financial risk management (Barbaglia et al., 2023; De Santis & Van der Veken, 2020). Central banks, governments and investors need to have the ability to make long-term predictions, so that they can plan ahead for the business cycle shifts and respond to pressures in the future. Machine learning models, especially deep learning architectures like recurrent neural networks and transformers, have recently become major tools in this area, showing great performance on modelling high-dimensional macroeconomic data with nonlinear and complex relations and dynamics (Tariq et al., 2024; Thayasivam et al., 2025). However, these models have a serious deficiency when it comes to rare but important events.
The economic shocks, whether it be a recession, a financial crisis, an oil price shock or a pandemic, are all uncommon events (Gazzani et al., 2024; Krstic et al., 2020). In historical data, gradient-based learning algorithms are more prone to identify the patterns which are more prevalent during regular economic times and less prevalent during historical data (Almosova & Andresen, 2023; Choi et al., 2021). This gives a systematic slant to the training process, in which the unique signals of the periods of crisis are not adequately considered. Temporal Feature Amnesia describes the process of machine learning systems downgrading or “forgetting” about predictive features that define the economic shocks that occur less frequently, as it optimizes its response to the average case, spanning long time horizons. The potential of detecting early warning signals of instability is most useful for long-horizon forecasts, and it is a particular concern.
Theoretical concerns are not the only challenges here; there are practical challenges as well. The traditional forecasting framework has been found to have a poor ability to forecast and even has limited capacity to react to large shocks such as the Global Financial Crisis of 2008 and the COVID-19 recession of 2020 (Huang & Yan, 2023; Shankar et al., 2026). Econometric models are easy to interpret, but with a lot of firm assumptions that are not fulfilled during times of turbulence because they rely on stationarity and linear relations. Data-driven deep learning models, on the other hand, are very flexible but are prone to over-fitting to the “normal times” regime, which dominates most of the observations used for training. Consequently, the accuracy of prediction falls for key events, namely, at the beginning of a recession.
To overcome this crucial deficiency, the present study proposes a regime-discovery system to quantify and describe Temporal Feature Amnesia of macroeconomic forecasting models. We build an infrastructure to recognize different macro-financial regimes, and to measure the difference in model behaviour between calm and crisis periods without explicitly training a forecasting model. More specifically, we use a sequence-to-sequence LSTM autoencoder to reconstruct a long macroeconomic panel using a rolling window and calculate error and latent representations. The signals are then grouped by a Gaussian Mixture Model to identify the stable economic regimes. The resulting regimes are then checked for consistency with the dates of recessions as well as major shock episodes from history, leading to pseudo-labels of high-stress and low-stress periods.
This research systematically analyses the Temporal Feature Amnesia in machine learning models handling a long horizon of macroeconomic data. In order to achieve this, the following objectives are desired: (1) to construct and to test a pipeline that enables regimes of economic interest to be detected from high dimensional time-series; (2) to measure the ability of the models to be well reconstructed under normal and shock associated regimes; and (3) to produce good quality pseudo-labels to be used to guide the next stage in the process, namely a supervised analysis of regime dependent forecasting performance and generalization.
This research has a number of significant contributions. First, it proposes a challenge in macro-economic machine learning: Temporal Feature Amnesia (TFA), which is the approach to the diagnosis and quantification of this challenge. Second, in contrast to earlier studies where the emphasis has been mainly on making better point predictions, this paper highlights the importance of identifying the latent regime structure as an essential component of developing more powerful forecasting systems. Third, the study has one of the most extensive empirical analyses of regime shifts in modern macro-finance based on the FRED-MD database that spans almost 70 years of monthly data. Last but not least, the pipeline and pseudo-labels obtained here are used and reusable for the rest of the research community interested in regime-aware modelling and shock-resilient forecasting.
The need to construct models with the capacity to accurately identify and react to rare events has important policy implications for monetary policy, financial stability and macroeconomic robustness in increasingly complex and fragile economies. This study could pave the way towards building more sophisticated forecasting models in the future that will be better equipped to withstand the negative economic shocks associated with Temporal Feature Amnesia.
2. Materials and Methods
The methodology of this research has been described in detail in this section. The proposed framework is a blend of the classical macroeconomic data processing methods and modern deep learning and unsupervised clustering methods to systematically analyse the presence of a Temporal Feature Amnesia in macro-economic modelling. Every step was carefully considered to take into account the time-series nature of the data and repeatability. The subsequent sections provide a description of each phase of the pipeline
2.1. Research Framework
The study uses a multi-stage unsupervised approach, tailored to detect the presence of unobserved macro-financial regimes and to measure the magnitude of the differences in reconstruction performance between normal and crisis conditions. Figure 1 shows the whole process. It starts with data collection and pre-processing, where the data is acquired and pre-processed carefully to make sure the data is of good quality and stationary. This is followed by optional dimensionality reduction, rolling window construction of temporal sequences, training of sequence-to-sequence LSTM Autoencoder, extraction of reconstruction errors and latent representations, and finally, clustering using a Gaussian Mixture Model. The resulting regimes are then compared to past economic events in history and pseudo-labelled. The whole process preserves the ordering of time in the data, which is appropriate for macroeconomic analysis of time-series data.
2.2. Data Description
The study is based on the widely used FRED-MD monthly macroeconomic database, May 2026 vintage. This dataset includes 127 key macroeconomic time series covering the period from January 1959 to April 2026, providing nearly 810 monthly observations. The series includes several key economic aggregates, including real output and income, labour market statistics, personal consumption, housing indicators, monetary aggregates, interest rates, exchange rates and different price indicators. Due to its long history, data quality and variable selection, FRED-MD is regarded as a benchmark in empirical macroeconomics and forecasting studies. Official transformation codes recommended by McCracken and Ng (2016) have been provided for each of the series and applied to make the series appropriate for modelling purposes.
2.3. Data Pre-Processing
The study uses data from the popular monthly macroeconomic database (McCracken, n.d.). The data set consists of 127 key macroeconomic time series with almost 810 monthly observations from January 1959 to April 2026. The series covers key economic areas including real output and income, labour market, personal consumption, housing activity, monetary aggregates, interest rates, exchange rates and price indices. The high quality of the data in FRED-MD and the uniformity of the variables included are essential for its use as a standard benchmark for empirical macroeconomics and forecasting research, and the simplicity of the variable selection is particularly attractive. Official transformation codes recommended by McCracken and Ng (2016) are used for each series, and the codes were strictly followed to ensure stationarity of the series for modelling.
2.4. Sequence Construction and LSTM Autoencoder
The model was trained in a rolling fashion with a window of 24 months and a stride of 1 month to enable the model to learn from a series of overlapping time horizons and contexts. The architecture used for training was the sequence-to-sequence LSTM Autoencoder, which included two LSTM layers, with a hidden layer size of 64 and a bottleneck size of 16 for the latent layer, and also used dropout with a rate of 0.2 for regularization. The model was trained to predict the input sequences by minimizing the Mean Squared Error (MSE) loss. The training was done using Adam optimizer with a learning rate of 0.001, batch size of 32, and a maximum of 100 epochs. Early stopping was utilized with a patience of 12 epochs, in light of the confirmation loss. A split was kept chronological, with the last 15% of the observations being used as the validation set to avoid information leakage.
2.5. Reconstruction Error and Latent Representation
The LSTM Autoencoder was trained to the end, and the reconstruction error for each of the rolling windows was computed. Such errors are a very good anomaly signal to identify if the model can't really appropriately represent the macroeconomic environment. Compressed latent vectors of the bottleneck layer were also extracted, and scalar reconstruction error per window was also computed. The latent representations, along with the reconstruction error, contain a very rich and complete set of features that can be used for subsequent regime identification, and implement the model difficulty and underlying temporal dynamics.
2.6. Regime Discovery Using Gaussian Mixture Model
Both the reconstruction error and the latent representations were joined and given to the Gaussian Mixture Model (GMM) for soft-clustering. The number of regimes was chosen with a compromise of achieving the best balance between the Bayesian Information Criterion (BIC), Akaike Information Criterion (AIC), Silhouette Score and economic meaningfulness. Focusing on careful assessment, eight regimes were identified. Using full covariance matrices, the GMM has been fitted, and ten different initializations of the random values have been used in order to obtain robust and stable results. Such a probabilistic solution allows the probabilities of membership of regimes to fluctuate for every window, rather than being a hard assignment.
2.7. Regime Validation and Pseudo-Label Generation
Overlapping of the found regimes with other important documented economic shock windows (such as the Global Financial Crisis (GFC) in 2008 and the more recent COVID-19 recession in 2020) was calculated and validated with the official NBER recession dates. The reconstruction error, the posterior probability distribution, the binary shock indicator and all the variables were saved for every month in the sample, including the highest probability component (hard regime assignment). The results of the complete output were stored in a pseudo-label typed data set, which can be utilized for subsequent supervised learning tests to analyse the forecasting ability and generalisation features for different regimes.
3. Results and Analysis
This section undertakes a thorough empirical assessment of the pipeline proposed in this paper on the FRED-MD macroeconomic data. The results of all the findings are obtained from the full end-to-end implementation. The analysis is based on the quality of the data, the reconstruction performance, the discovery of regimes and economic validation. The results are complemented by eight key figures which mark the most relevant results.
3.1. Data Pre-Processing Outcomes
The raw data that was initially available was composed of 127 macroeconomic variables between January 1959 and April 2026. Following the recommended transformation codes and discarding series with more than 15% missing data, 126 series were analysed.
The percentage of data that is missing is shown in Figure 2, and the 15% exclusion point is highlighted. The Median Absolute Deviation (MAD) method with a cut-off of 10 was very effective for outlier treatment.
The top 20 series by number of outliers are shown in Figure 3, where the financial and interest rate series needed the most adjustment. The post-processed and standardized series were stationary.
Figure 4 shows raw time series of selected headline macroeconomic indicators where the NBER recession periods are shaded, and Figure 5 shows the same series after full pre-processing (transformation, winsorization and scaling). The pre-processing steps have been successful in removing trends and seasonality from these visualizations, leaving behind economically meaningful fluctuations, particularly during crisis periods. The clean and stationary panel served as a basis for the entire process of the pipeline.
3.2. Reconstruction Error Analysis
Reconstruction errors generated by the LSTM Autoencoder served as the primary anomaly signal.
The time series of the window-level reconstruction errors is shown in Figure 6. Major economic stress events, such as the 1973-75 oil crisis, the early 1980s Volcker recession, the 2008 Global Financial Crisis and a pronounced and severe increase during the 2020 COVID-19 pandemic, are clearly visible as distinguished and sharp peaks.
3.3. Regime Discovery
The combined reconstruction error and latent representations were used to fit a Gaussian Mixture Model, thereby identifying eight regimes. The regime transition matrix (Figure 7) suggests high persistence (diagonal probabilities 0.94-0.98). This indicates that an economy, once it reaches a certain state, will stay in that state for long time periods.
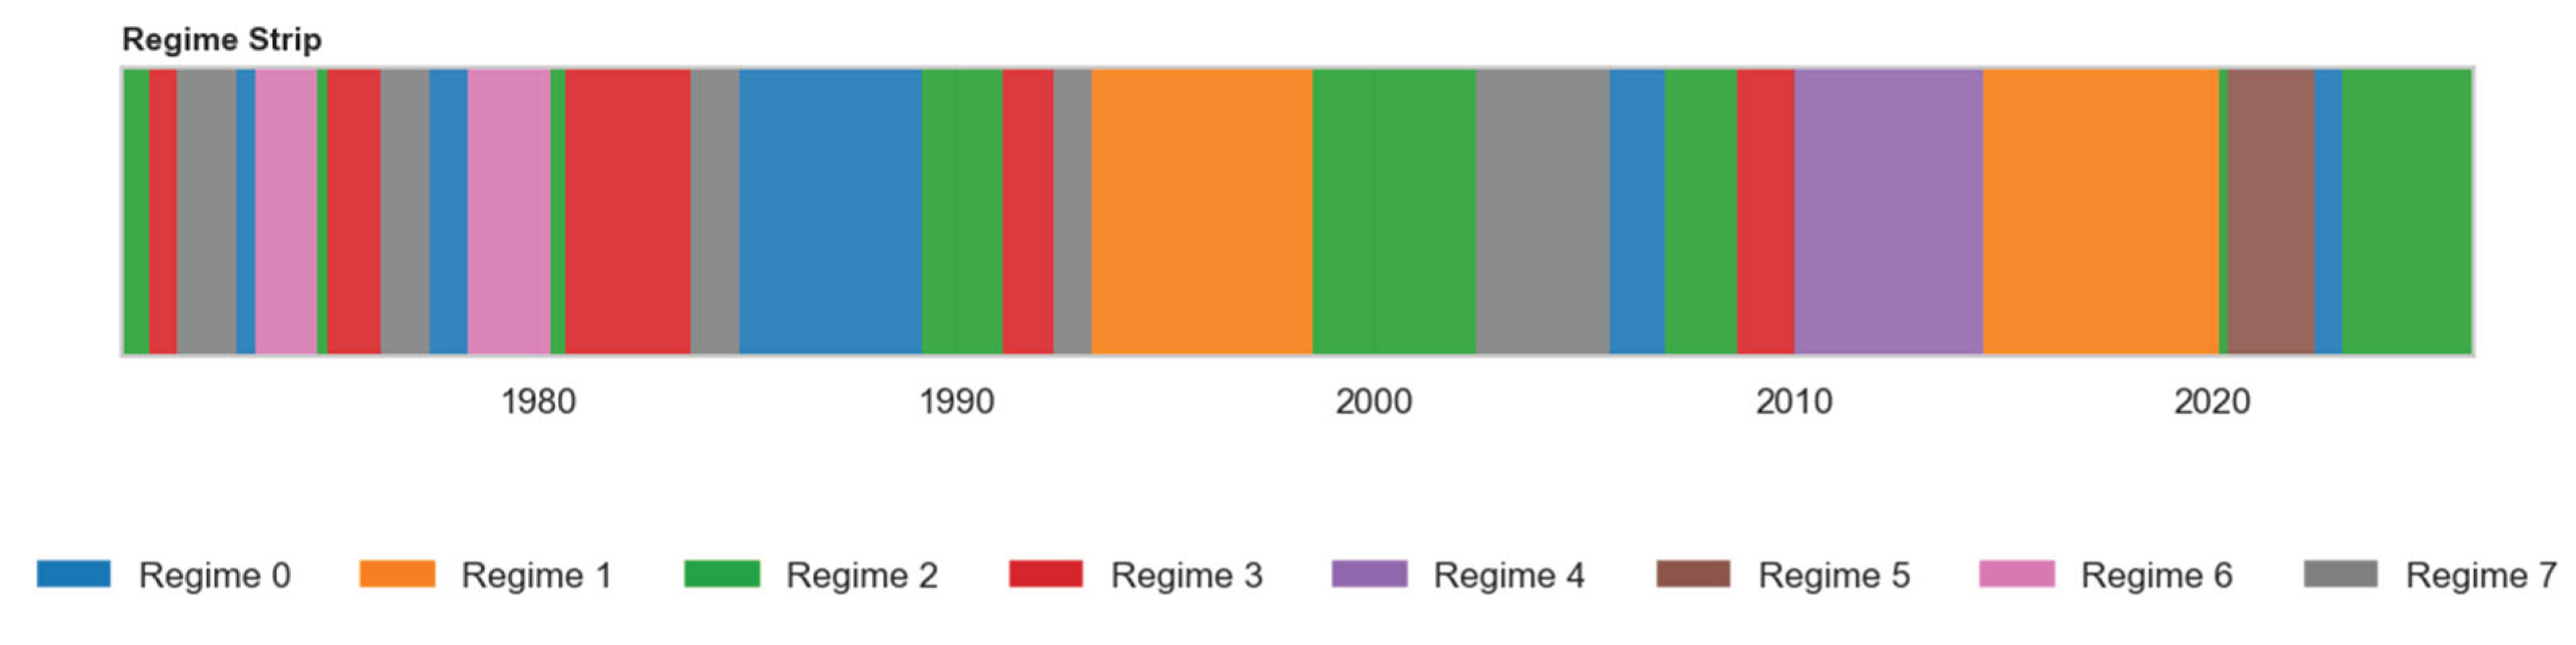
The regimes that were found are of high economic relevance. In Figure 8, the timeline of regime assignments is plotted with the NBER recession and shock windows. There are several crisis-aligned regimes.
The relationship is quantified in Figure 9, which shows the proportion of each regime that corresponds to a known economic shock. High overlap (more than 30%) is found in regimes 3 and 6, suggesting that these regimes are a good representation of high-stress economic states. The probabilistic clustering approach helped to stabilize and obtain meaningful regime assignment.
3.4. Economic Interpretation of Regimes
The regimes are clearly interpretable in the economic sense. Figure 10 illustrates the distribution of reconstruction errors for the eight regimes, where the errors in the high-stress regimes appear to be significantly larger than those in the stable regimes. It can be seen in these eight figures that the model is most difficult to handle under certain conditions. Each of the four signs shows a detailed regime signature (not shown, used in analysis), which indicates which macroeconomic dimension is most difficult to handle.
The 2D projection of the LSTM latent space (when analysed separately) reveals distinct clusters of the high stress and stable regime. All of these findings together show that the framework is able to identify economically meaningful regimes with different behavioural and reconstruction patterns. Overall, the alignment of the pipeline with shocks and differentiated error profiles throughout the regimes strongly validates the usefulness of the pipeline and offers valuable clues regarding the limitations of the model in the periods of turbulent transition. The interpretability is one of the main advantages of the proposed approach.
Both state 1 and state 2 regimes are persistent, meaning that the transition matrix (Figure 7) is large. Figure 8 also shows how regimes have changed over time, where some regimes are present at times of NBER-defined recessions or major shocks.
This relationship is quantified in Figure 9 and can be as large as 30% of months within known shock windows for certain regimes. This high correspondence strengthens the hypothesis that the pipeline kept separating well the normal and crisis economic regimes and confirms their economic importance. These are essential for understanding Temporal Feature Amnesia because they show that economic shocks systematically have a higher degree of difficulty (reconstruction error) of the model than the other regimes.
3.5. Pseudo-Label Quality Assessment
The values received were high, with most values very close to 1.0. This high confidence and the fact that robust regimes have been tested successfully in the past in response to economic shocks confirm the robustness of these regimes.
The final pseudo-label data includes regime labels, posterior probabilities, reconstruction errors, and shock indicators. This rich resource will provide a pragmatically grounded basis for further supervised forecasting studies to analyse the regime-dependent model's performance and generalisation ability. The pseudo-labels are well assigned with high confidence, meaning that they are fitted well and conclusive for downstream analysis. The posterior probability analysis was applied for the quality of regime assignment.
4. Discussion
The findings of this study are of a non-fiction, empirical nature and are consistent with the existence of Temporal Feature Amnesia in deep learning models in macroeconomic forecasting with long horizons. The reconstruction error of the sequence-to-sequence LSTM Autoencoder stayed fairly low and stable during periods of economic calm, but increased remarkably during crises, including the 1973–75 oil crisis, the Volcker recession during the early 1980s, the 2008 Global Financial Crisis and the 2020 COVID-19 recession. This pattern is not due to supervised overfitting since the model was not explicitly trained to detect these events. Most of the nearly 70 years that the FRED-MD panel has observed monthly data dates from the normal regime, so that the gradients from the normal regime dominate the optimization, and the network is relatively underpowered to reconstruct the dynamics of rare but economically important shock periods. This matches the conceptual idea of the study and provides a quantitative, regime-specific example of a phenomenon which has been discussed primarily qualitatively up to now.
The results are consistent with and extend the emerging literature exploring the poor performance of ML models at longer forecast horizons. Krupakar (2025) lists the reasons for error accumulation, exposure bias and representational drift when forecasting longer time horizons, with the current results showing that this degradation is not equally distributed but is focused disproportionately in shock-associated regimes. There is also a concept parallel with the general machine learning community on catastrophic forgetting. Lee et al. (2021) demonstrate that typical recurrent architectures do not retain rarely occurring temporal patterns in traffic forecasting because the learning signal is dominated by the frequent temporal patterns. Hallak and Kem (2025) present a systematic benchmark proving that forecasting models, like classifiers, lose the ability to retain the structure they had learned when exposed to a distribution of inputs that deviates from the distribution they had seen during training. The Temporal Feature Amnesia presented here may be regarded as a domain-specific example of this same process, in this case, implicit, within training, neglect of infrequent but economically important regimes.
The findings also support the general literature related to the potential and bounds of machine learning for macroeconomic forecasting. Goulet Coulombe et al. (2022) show that machine learning methods can achieve average forecasting accuracy better than traditional econometric benchmarks on average, but they also point out that this does not mean that these methods will always do so in times of structural change. Similarly, Fouliard et al. (2021) find that financial crisis prediction models that are trained mostly on quiet-period information suffer from under-detection of the build-up in systemic risk. While this weakness can be observed in an aggregate sense through standard forecasting accuracy measures, the regime-discovery framework presented in this study provides an alternative means of making this weakness apparent and measurable prior to the deployment of a forecasting model, rather than through such metrics alone, as these may also obscure poor performance in the tails. In this way, the framework is not incompatible with supervised forecasting research, and the pseudo-labels it provides are specifically to aid in evaluating the regime-dependent generalization from the downstream.
The unsupervised regime discovery pipeline itself exhibited good performance: high assignment confidence (around one for most of the windows) and high diagonal probabilities for the transition matrix (between 0.94 and 0.98). The strength in this follows recent use of LSTM-based reconstruction-error methods in detecting anomalous and/or high-stress patterns in financial time series. Yang (2022) demonstrate that the LSTM Autoencoder representations, along with downstream classifiers, can effectively discriminate between the stable and turbulent market periods based on only reconstruction-based signals and without any labelled anomaly data, which is similar to the high-stress and stable clusters observed in the present study's latent space. The results highlight that the reconstruction error-based regime discovery approach is a reasonably general and transferable approach to macro-financial stress characterization, both for asset-level and macroeconomic panel data.
The results have implications not just for institutions using ML-based forecasts in their monetary policy decisions, financial stability surveillance and risk management, but also for other institutions. The value of a forecasting system to a policymaker is limited if it is highly accurate across most of the time series, but performs poorly during a crisis. A forecasting system that works well over time, but is inaccurate during a crisis, is not very useful to a policymaker because the moments most in need are the ones when the forecasting system is least effective. The pseudo-labelled regimes created in this study could be used to stress-test existing forecasting models, to give more weight to the losses during periods in history that are historically more stressful, or to flag model confidence when the current conditions are similar to those of a regime that has been identified as a high-stress period. In a more general sense, this suggests that being systematic about adding auditable diagnostic layers to machine learning forecasting pipelines is important, not only because of their ability to assess point accuracy, but also because this approach would help mitigate structural issues in the deployment of trustworthy forecasting models, as called for in other parts of the AI literature (Santos Nunes, 2025), and in sectors where the cost of regime shift miss is asymmetric and potentially high, such as macro-financial forecasting.
There are a number of caveats to be taken into account. First, the regime labels used are pseudo-labels, relying on the historical NBER recession dates and reported shock windows, not on an independent "ground truth", and so there may be a degree of misclassification at the boundaries of the regimes. Second, the study uses a single type of autoencoder and a fixed 24-month rolling time window; it is unknown how the magnitude of Temporal Feature Amnesia would change if alternative architectures, such as transformer-based sequence models, were used, or if varying window lengths (such as 12 months) were used. Third, the analysis has focused on a sub-sample of United States macroeconomic indicators in the FRED data, while the robustness of the regime structure and the pattern of reconstruction errors to other economies, in particular those with different shock regimes, are empirical questions. This supports policy evaluation research: structural blind spots in measurement frameworks often stay hidden until a crisis hits, a phenomenon called "surprise" (de León López & Rodríguez, 2026), which emphasizes the need for testing the current framework on other macroeconomic situations before making general pronouncements about the model's behaviour in crisis conditions.
5. Conclusion
This study has successfully created and applied an unsupervised regime-discovery model to explore the phenomenon of “Temporal Feature Amnesia” in macroeconomic forecasting. The research showed that LSTM Autoencoders give much higher reconstruction errors when the economy was undergoing the rare shock periods, as compared to the normal period, using the FRED-MD monthly data from 1959 to 2026. GMM determined eight persistent macro-financial regimes, some of which exhibited high correlations with the NBER recessions and major economic crises of the COVID-19 pandemic and the Global Financial Crisis.
The results offer strong empirical evidence that the current deep learning models are likely under-representing distinctive patterns that are linked to the rare but significant economic events. The findings in this research provide a valuable measurement infrastructure for future research to develop more resilient and robust forecasting systems in the face of shocks. The strong persistence of discovered regimes and their economic interpretability further validate the effectiveness of the proposed pipeline.
The major contribution of this work is the formalization of the concept of Temporal Feature Amnesia (TFA) and the introduction of a reproducible methodological approach to the diagnosis of TFA. Besides emphasizing the necessity to improve the accuracy of average forecasts, the present study also suggests that presence of the rare events ought to be understood and overcome within the framework of the models to ensure reliable long-horizon macroeconomic forecasts.
The current framework has yielded encouraging results, and future work should adapt this framework further to transformer-based architectures, introduce causal interventions and extend the training strategy to regime-specific or memory-augmented ones. Temporal Feature Amnesia will be essential in the development of forecasting models in an increasingly fragile economy that will better guide monetary policy, financial stability and investment decisions.
Lastly, the results of this work will provide useful building blocks for the next generation of regime-aware macroeconomic models able to better capture and exploit information from infrequent economic shocks, and ultimately, more powerful and believable AI systems in the realm of economic forecasting.
Funding
This research received no specific grant from any funding agency in the public, commercial, or not-for-profit sectors.
Data Availability Statement
The monthly macroeconomic dataset (FRED-MD) analysed in this study is publicly available from the Federal Reserve Bank of St. Louis at https://www.stlouisfed.org/research/economists/mccracken/fred-databases. The specific vintage of the dataset used in this study, along with the derived regime labels and reconstruction-error outputs generated during the analysis, are available from the corresponding author upon reasonable request.
References
- Almosova, A.; Andresen, N. Nonlinear inflation forecasting with recurrent neural networks. J. Forecast. 2023, 42(2), 240–259. [Google Scholar] [CrossRef]
- Barbaglia, L.; Frattarolo, L.; Onorante, L.; Pericoli, F. M.; Ratto, M.; Pezzoli, L. T. Testing big data in a big crisis: Nowcasting under COVID-19. Int. J. Forecast. 2023, 39(4), 1548–1563. [Google Scholar] [CrossRef]
- Choi, K.; Yi, J.; Park, C.; Yoon, S. Deep learning for anomaly detection in time-series data: Review, analysis, and guidelines. IEEE Access 2021, 9, 120043–120065. [Google Scholar] [CrossRef]
- de León López, E. D.; Rodríguez, R. P. Invisible Progress in Entrepreneurial Ecosystems: Coordination Thresholds, Feedback Dominance, and the Structural Blind Spots of Policy Evaluation. 2026. Available online: https://www.preprints.org/manuscript/202605.0216.
- De Santis, R. A.; Van der Veken, W. Forecasting macroeconomic risk in real time: Great and Covid-19 Recessions; ECB Working Paper; 2020. [Google Scholar] [CrossRef]
- Fouliard, J.; Howell, M.; Rey, H.; Stavrakeva, V. Answering the queen: Machine learning and financial crises; 2021. [Google Scholar]
- Gazzani, A.; Venditti, F.; Veronese, G. Oil price shocks in real time. J. Monet. Econ. 2024, 144, 103547. [Google Scholar] [CrossRef]
- Goulet Coulombe, P.; Leroux, M.; Stevanovic, D.; Surprenant, S. How is machine learning useful for macroeconomic forecasting? J. Appl. Econom. 2022, 37(5), 920–964. [Google Scholar] [CrossRef]
- Hallak, K.; Kem, O. Benchmarking Catastrophic Forgetting Mitigation Methods in Federated Time Series Forecasting. 2025 3rd International Conference on Federated Learning Technologies and Applications (FLTA), 2025; IEEE; pp. 278–285. [Google Scholar] [CrossRef]
- Huang, Y.; Yan, E. Economic recession forecasts using machine learning models based on the evidence from the COVID-19 pandemic. Mod. Econ. 2023, 14, 899–922. [Google Scholar] [CrossRef]
- Krstic, K.; Westerman, R.; Chattu, V. K.; V. Ekkert, N.; Jakovljevic, M. Corona-triggered global macroeconomic crisis of the early 2020s. 2020, 17(24), 9404. [Google Scholar] [CrossRef]
- Krupakar, H. A Review of the Long Horizon Forecasting Problem in Time Series Analysis. arXiv 2025, arXiv:2506.12809. [Google Scholar] [CrossRef]
- Lee, H.; Jin, S.; Chu, H.; Lim, H.; Ko, S. Learning to remember patterns: Pattern matching memory networks for traffic forecasting. arXiv 2021, arXiv:2110.10380. [Google Scholar] [CrossRef]
- McCracken, M. W. FRED-MD and FRED-QD: Monthly and Quarterly Databases for Macroeconomic Research, (Numerical Data, v1.0), Federal Reserve Bank of St. Louis. n.d. Available online: https://www.stlouisfed.org/research/economists/mccracken/fred-databases.
- Santos Nunes, C. A Systemic Model for AI Governance: A Multilayer Framework Integrating Data, Models, Interaction, and Use Cases with Continuous Compliance-by-Design. 2025. [Google Scholar] [CrossRef]
- Shankar, R.; Alroomi, A.; Bougioukos, V.; Nikolopoulos, K. Extreme Event Modelling and Forecasting: Empirical Evidence from Predicting GDP and Unemployment in the USA. Forecasting 2026, 8(3), 46. [Google Scholar] [CrossRef]
- Tariq, U.; Ahmed, I.; Khan, M. A.; Bashir, A. K. Deep learning for economic transformation: a parametric review. Indones. J. Electr. Eng. Comput. Sci. 2024, 35(1), 520–541. [Google Scholar] [CrossRef]
- Thayasivam, U.; Johnson, S.; Balabavan, K.; Uthayakumar, S. A comprehensive survey on statistical and deep learning models for panel data analysis: U. Thayasivam et al. Knowl. Inf. Syst. 2025, 67(12), 11359–11379. [Google Scholar] [CrossRef]
- Yang, E. Collectivizing Justice: Transmedia Memory Practices, Participatory Witnessing, and Feminist Space Building in Nicaragua; University of Southern California, 2022; Available online: https://www.proquest.com/openview/0d8d7fe2370f8c08ea1351d9b4ca8ed6/1?pq-origsite=gscholar&cbl=18750&diss=y.
Figure 1.
Overall research framework illustrating the multi-stage unsupervised pipeline developed in this study.
Figure 1.
Overall research framework illustrating the multi-stage unsupervised pipeline developed in this study.
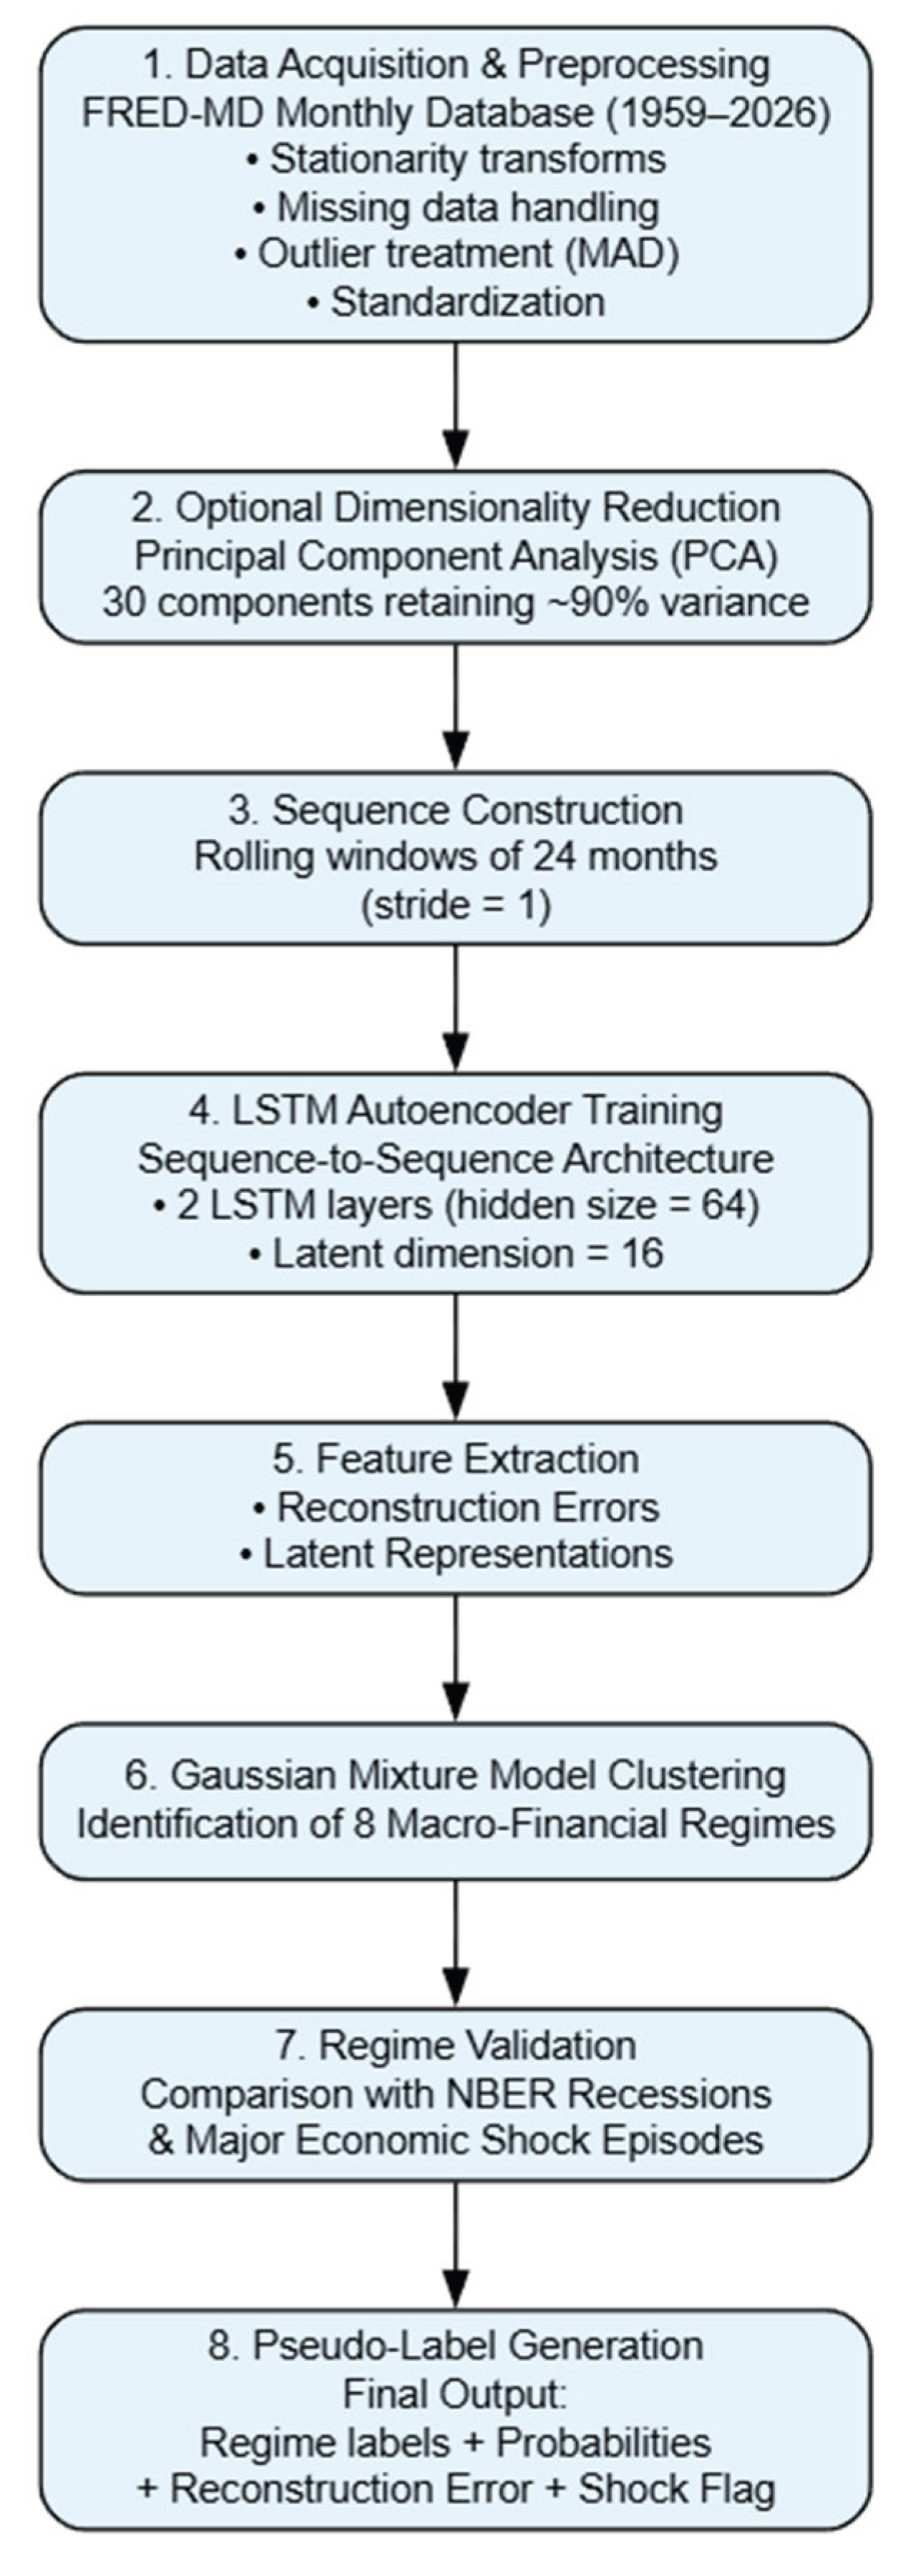
Figure 2.
Missing-data fraction by series after applying transformation codes. The dashed line indicates the 15% threshold used for series exclusion.
Figure 2.
Missing-data fraction by series after applying transformation codes. The dashed line indicates the 15% threshold used for series exclusion.
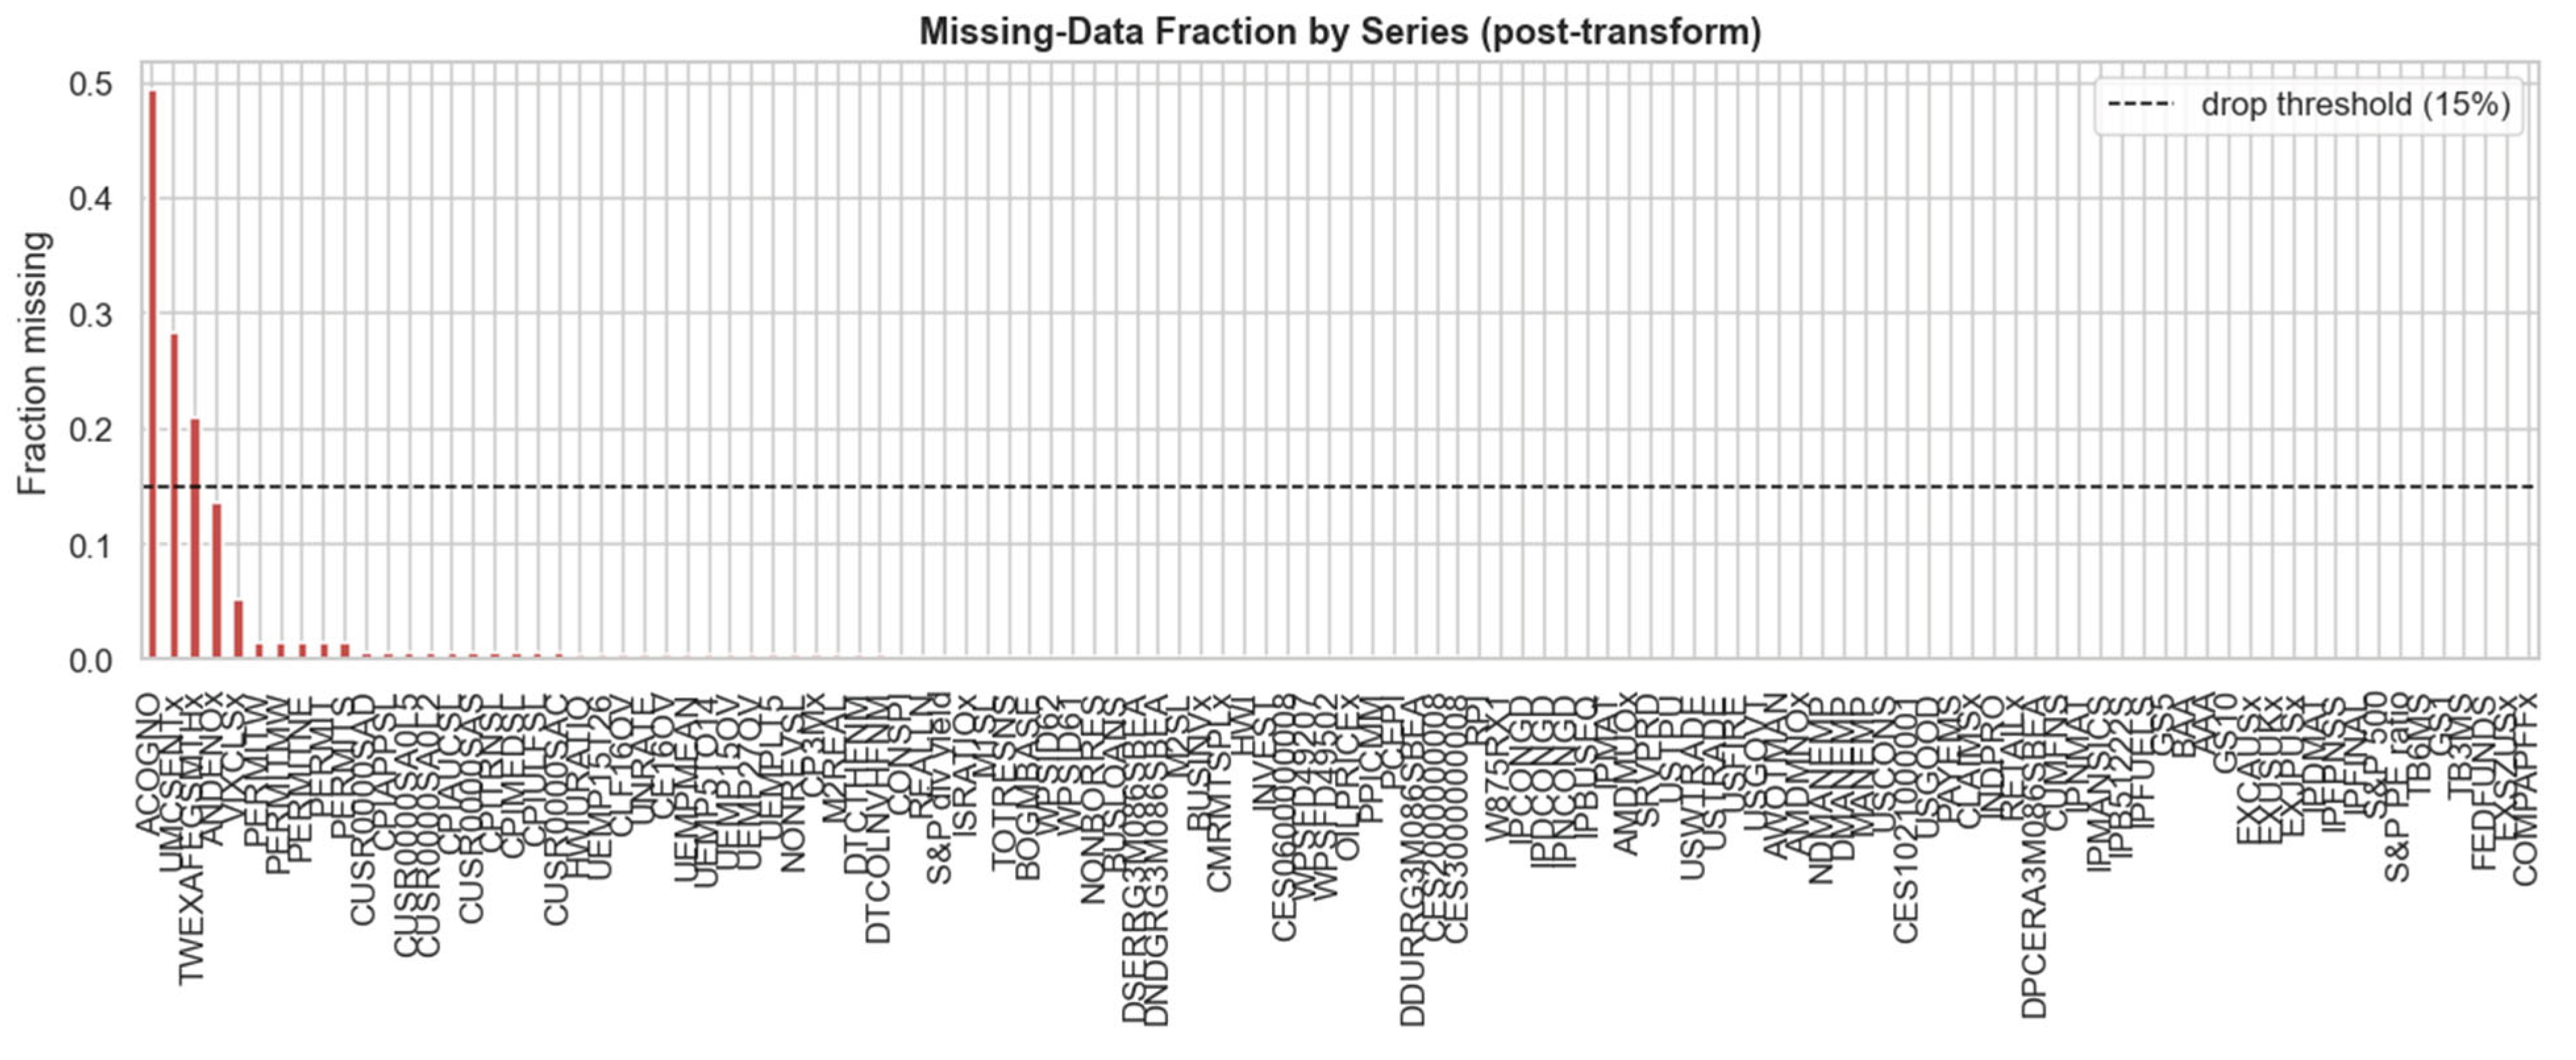
Figure 3.
Top 20 series by number of outliers detected using the Median Absolute Deviation (MAD) method with threshold = 10.
Figure 3.
Top 20 series by number of outliers detected using the Median Absolute Deviation (MAD) method with threshold = 10.
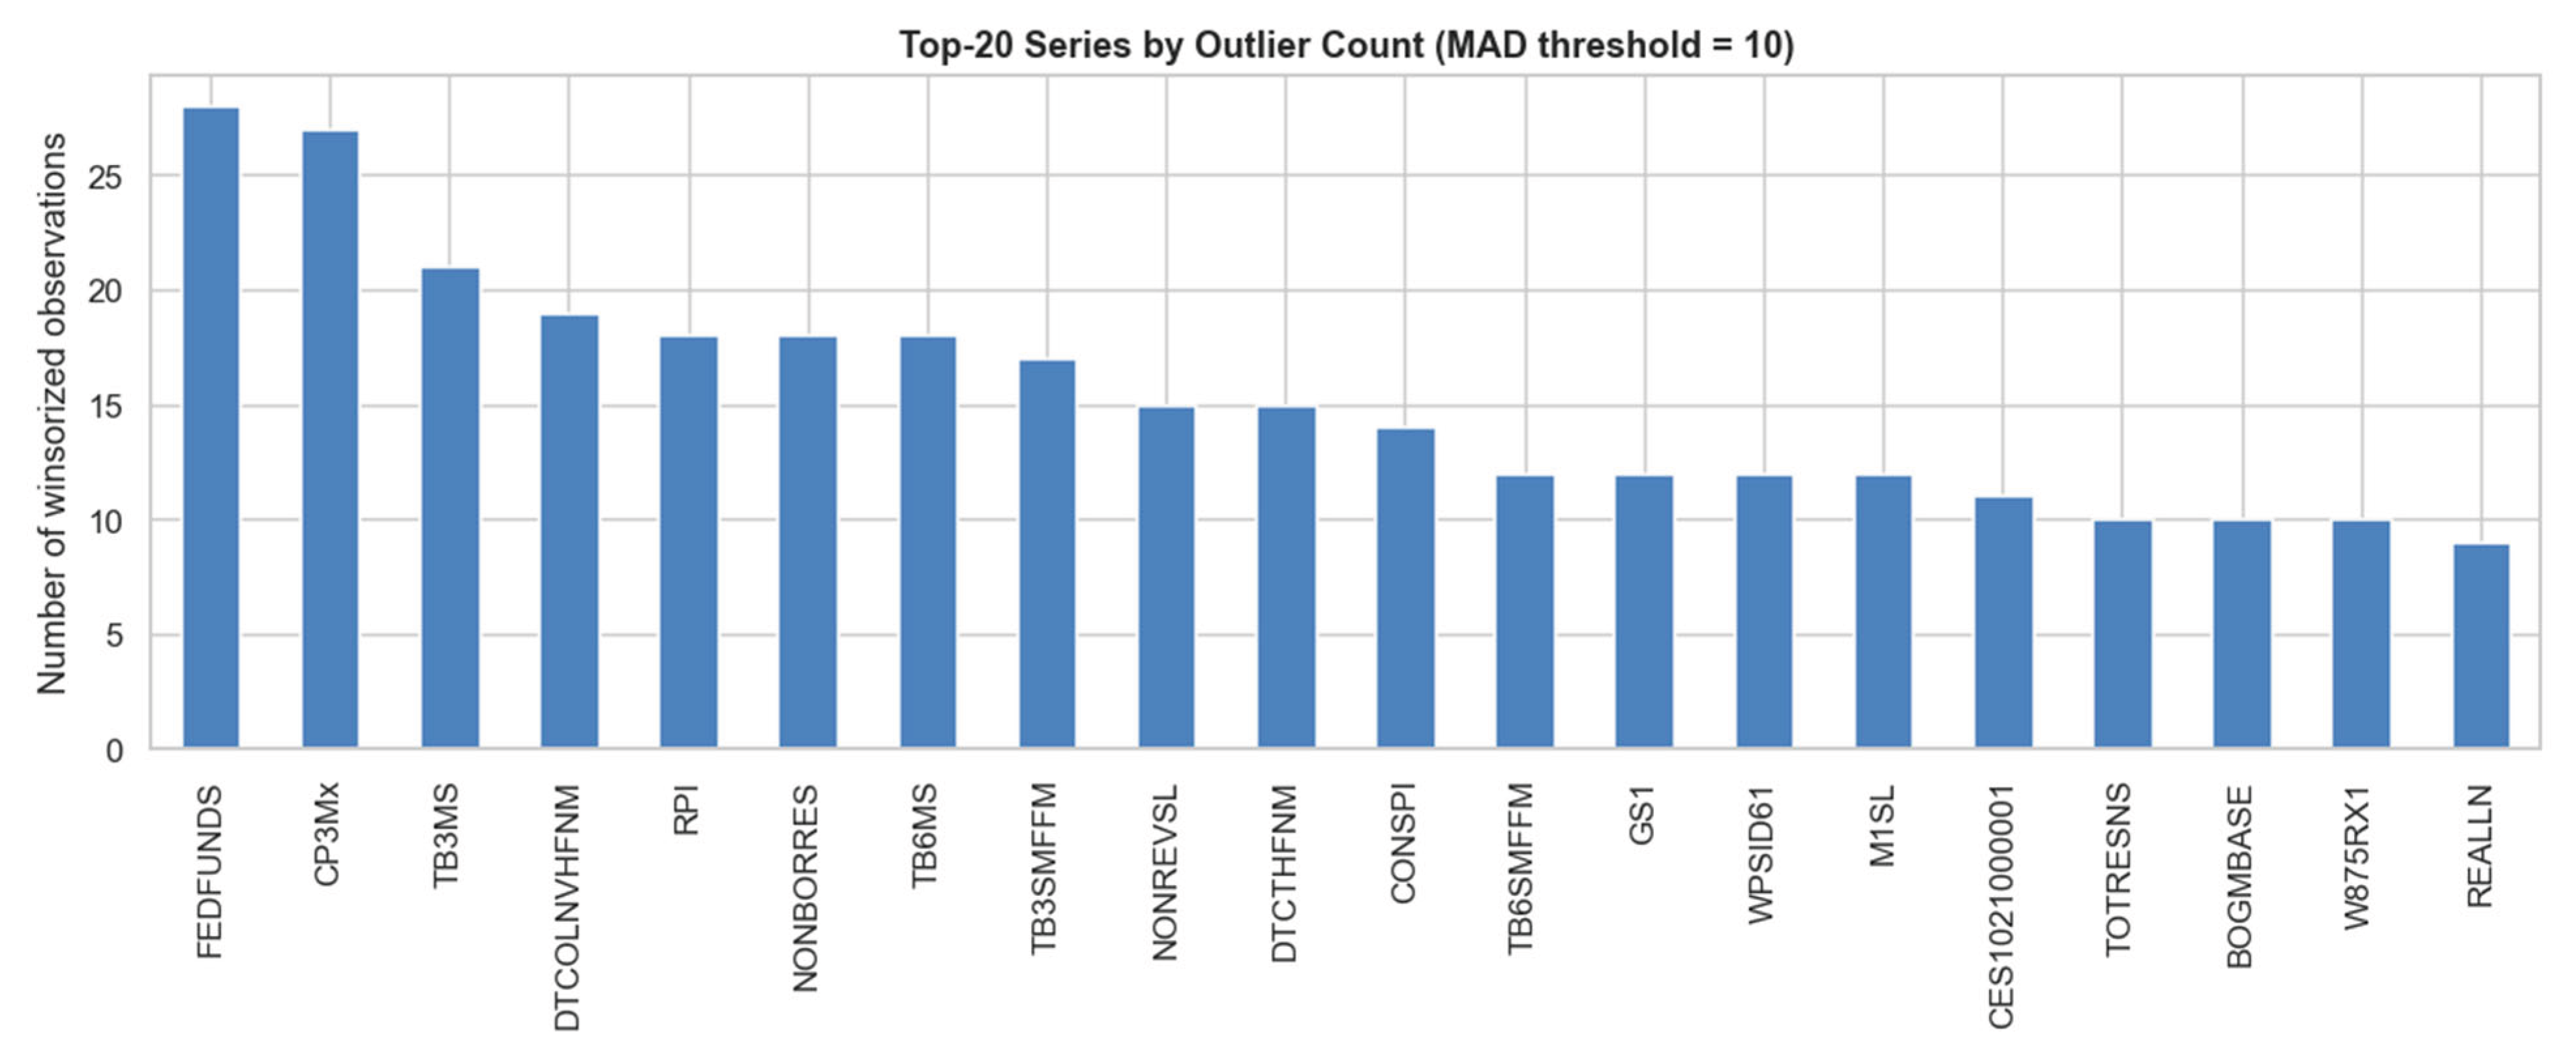
Figure 4.
Raw time series of selected headline macroeconomic indicators with NBER recession and known shock periods shaded in grey.
Figure 4.
Raw time series of selected headline macroeconomic indicators with NBER recession and known shock periods shaded in grey.
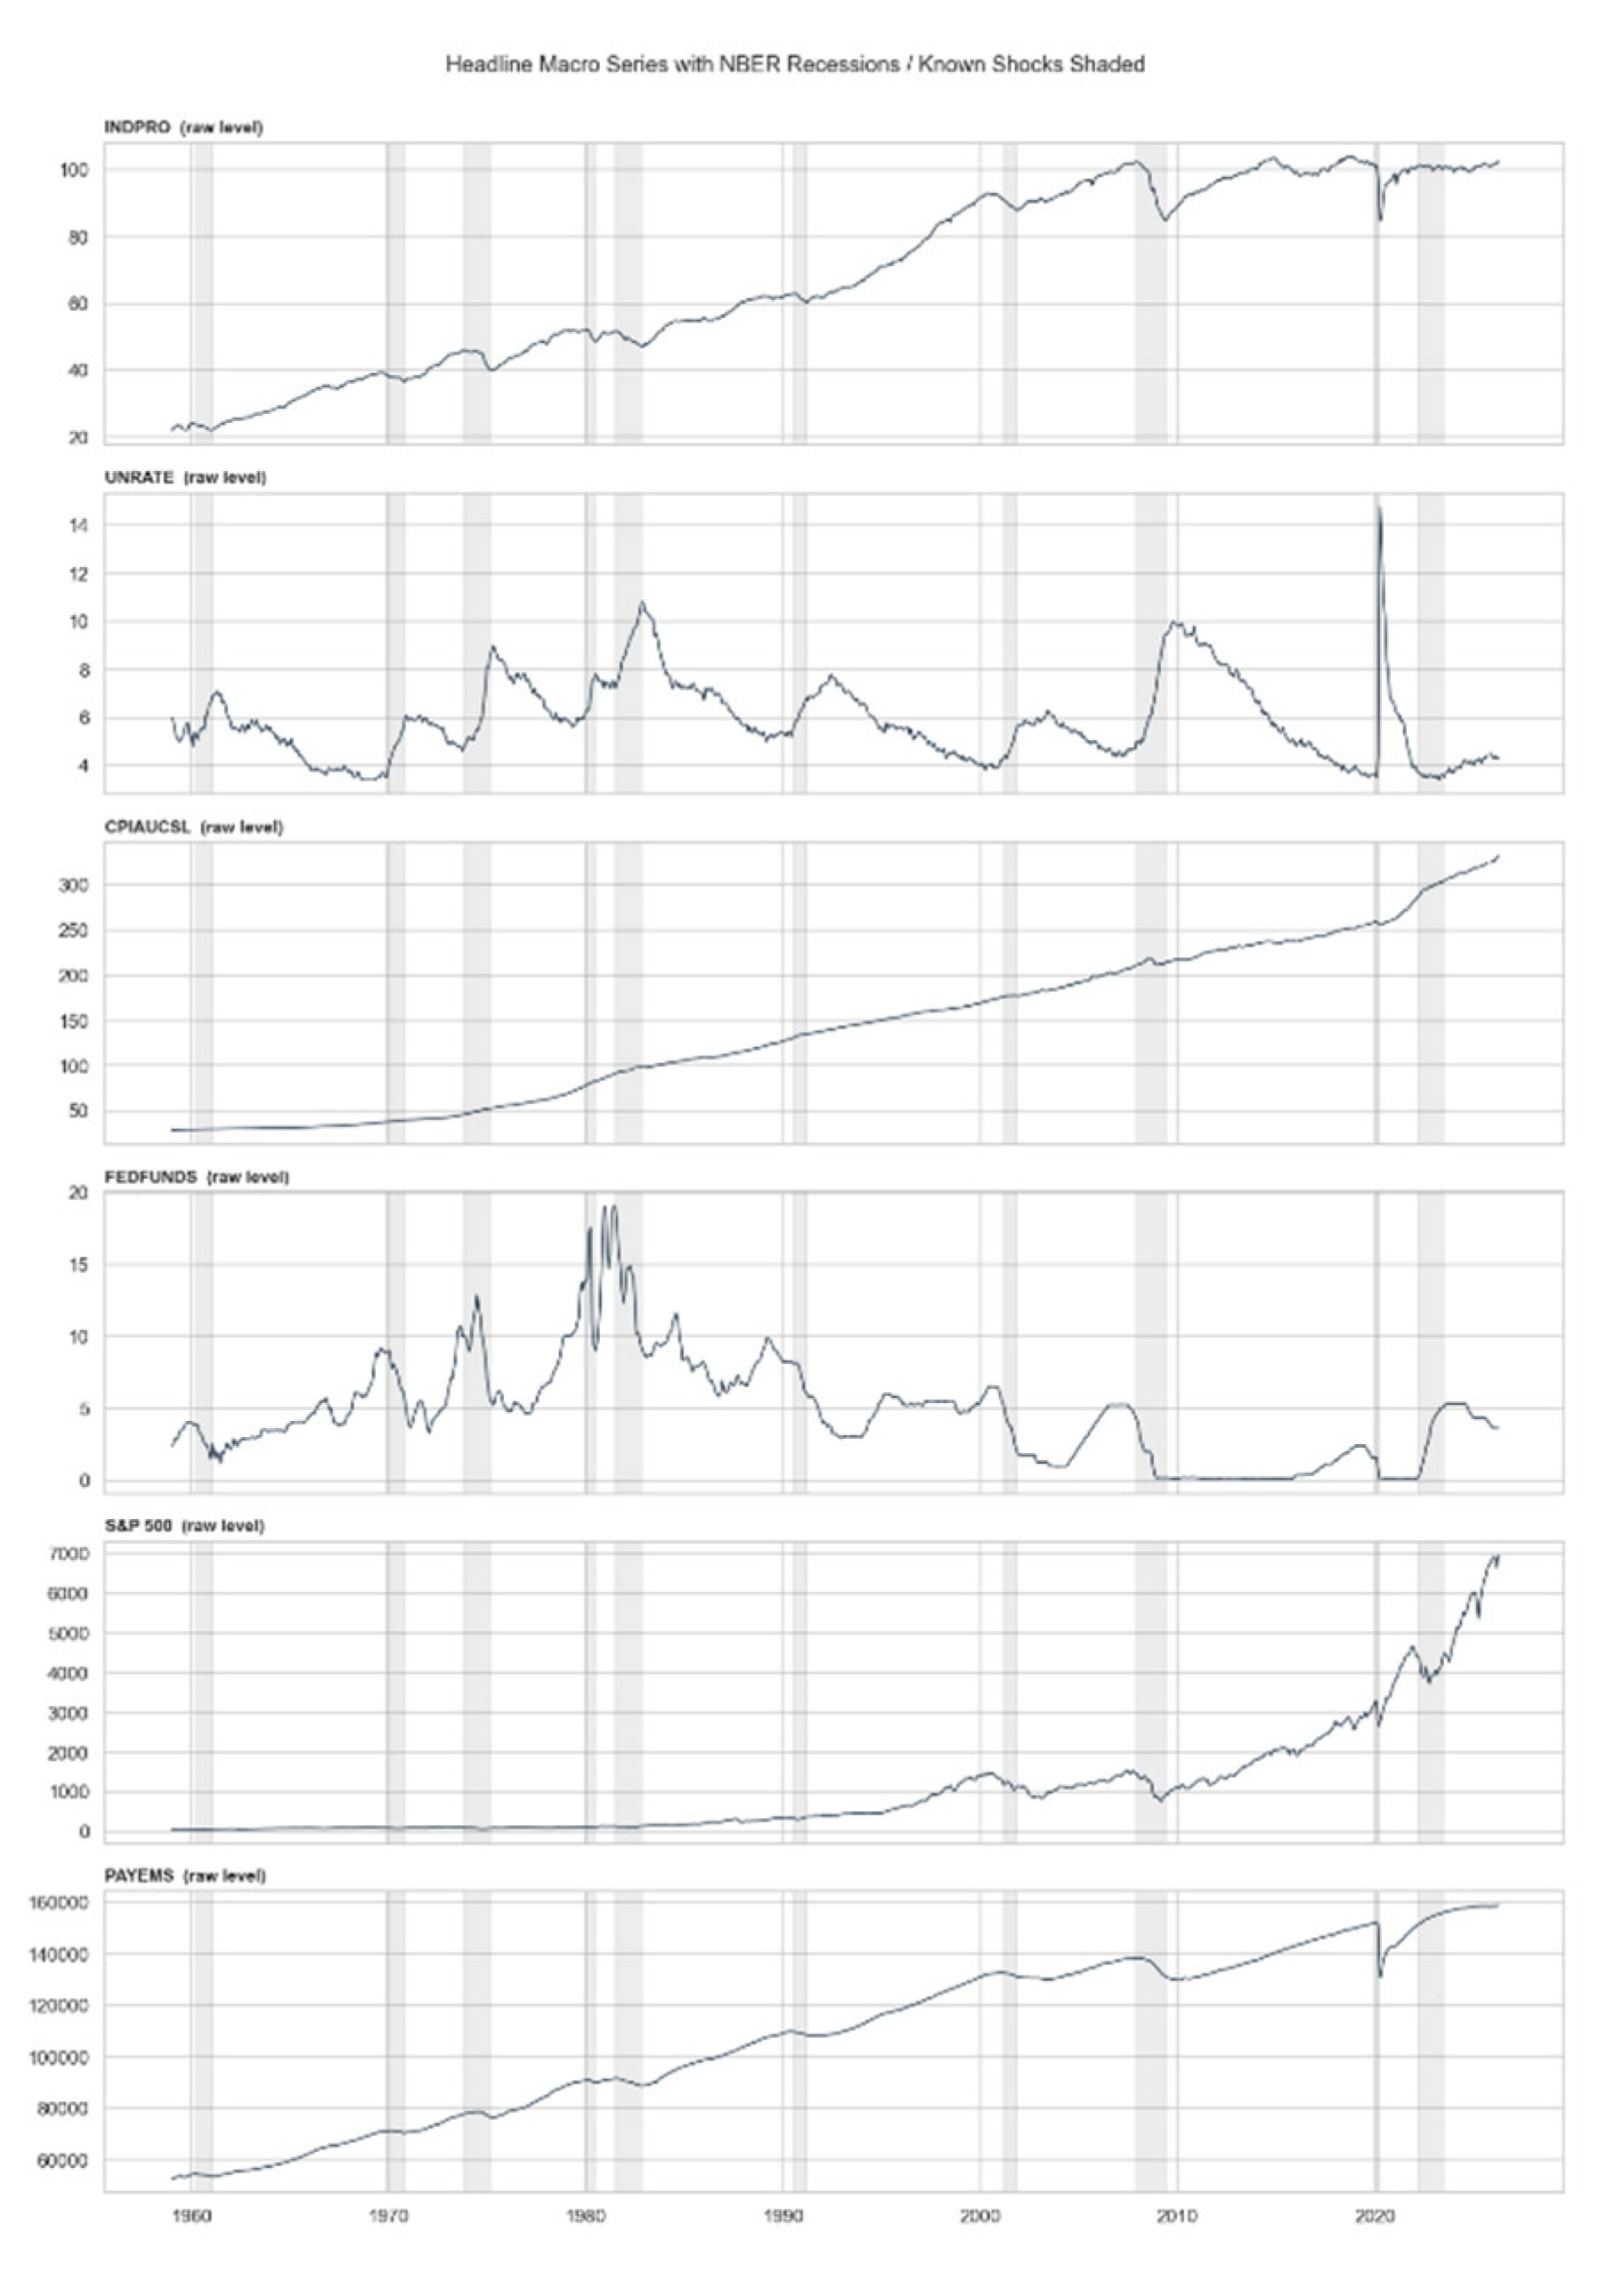
Figure 5.
Selected headline macroeconomic indicators after full pre-processing (stationarity transformation, outlier winsorization, and standardization).
Figure 5.
Selected headline macroeconomic indicators after full pre-processing (stationarity transformation, outlier winsorization, and standardization).
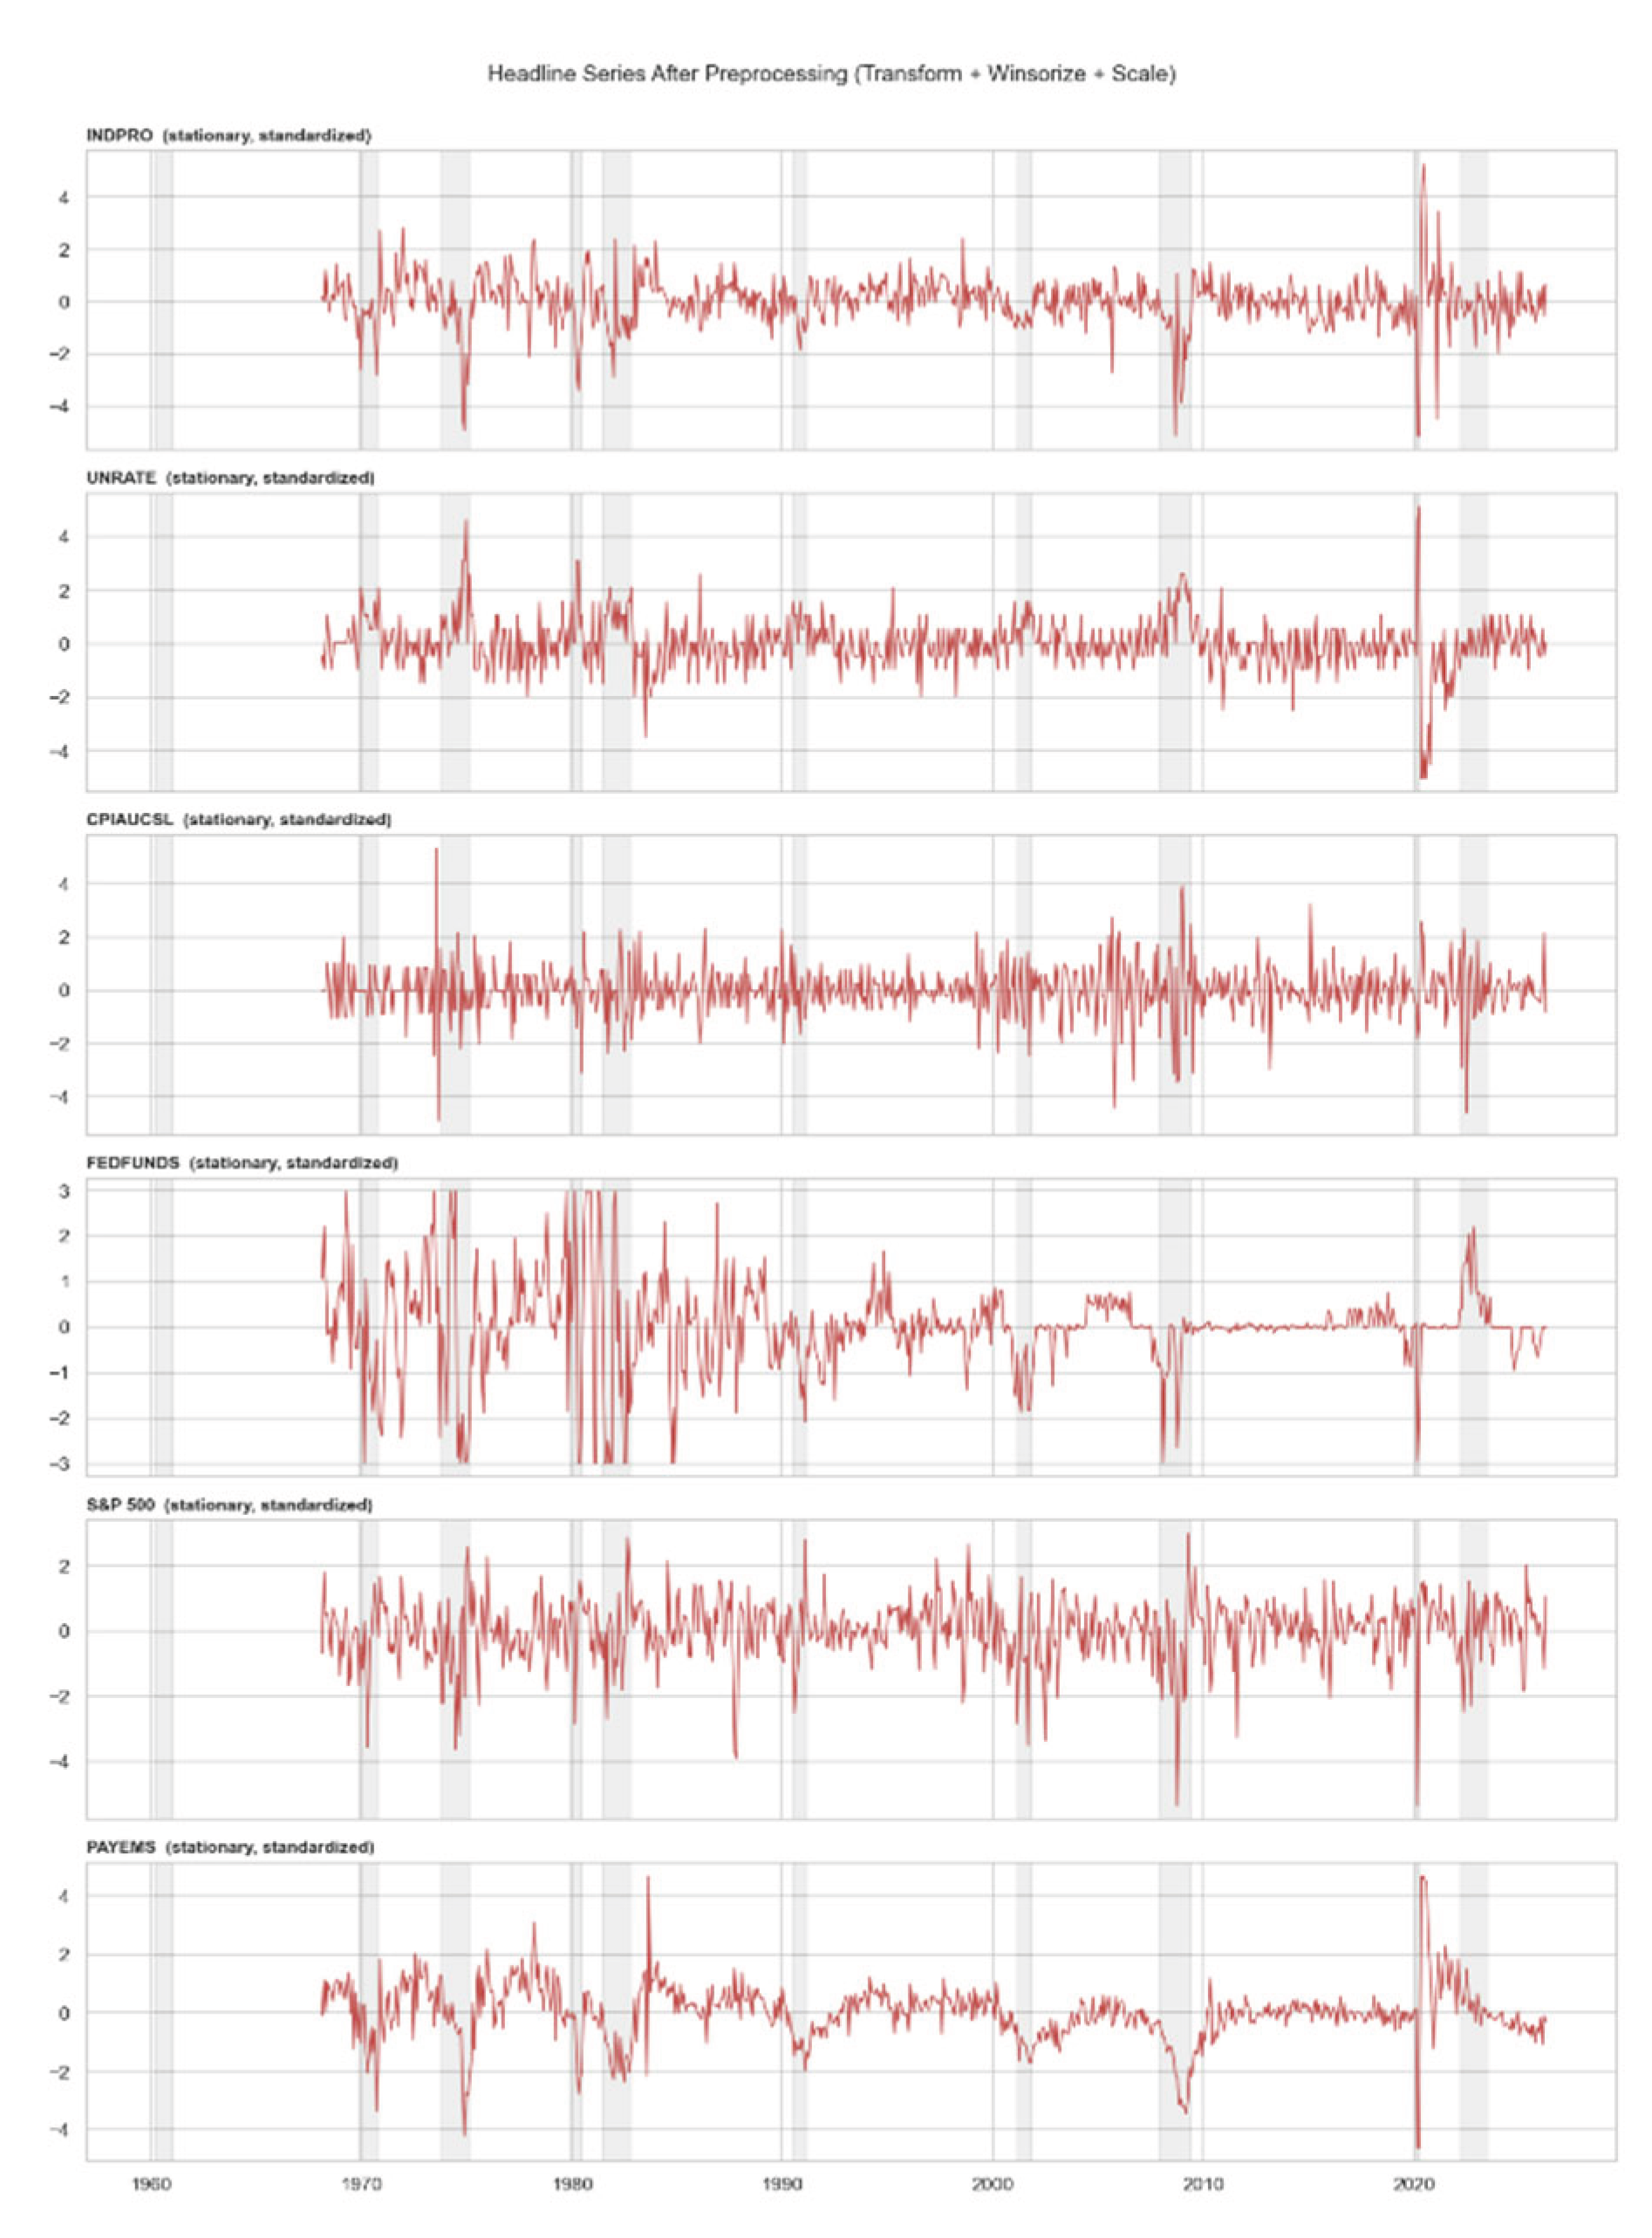
Figure 6.
Comparison of reconstruction error distributions between calm periods and known economic shock windows.
Figure 6.
Comparison of reconstruction error distributions between calm periods and known economic shock windows.
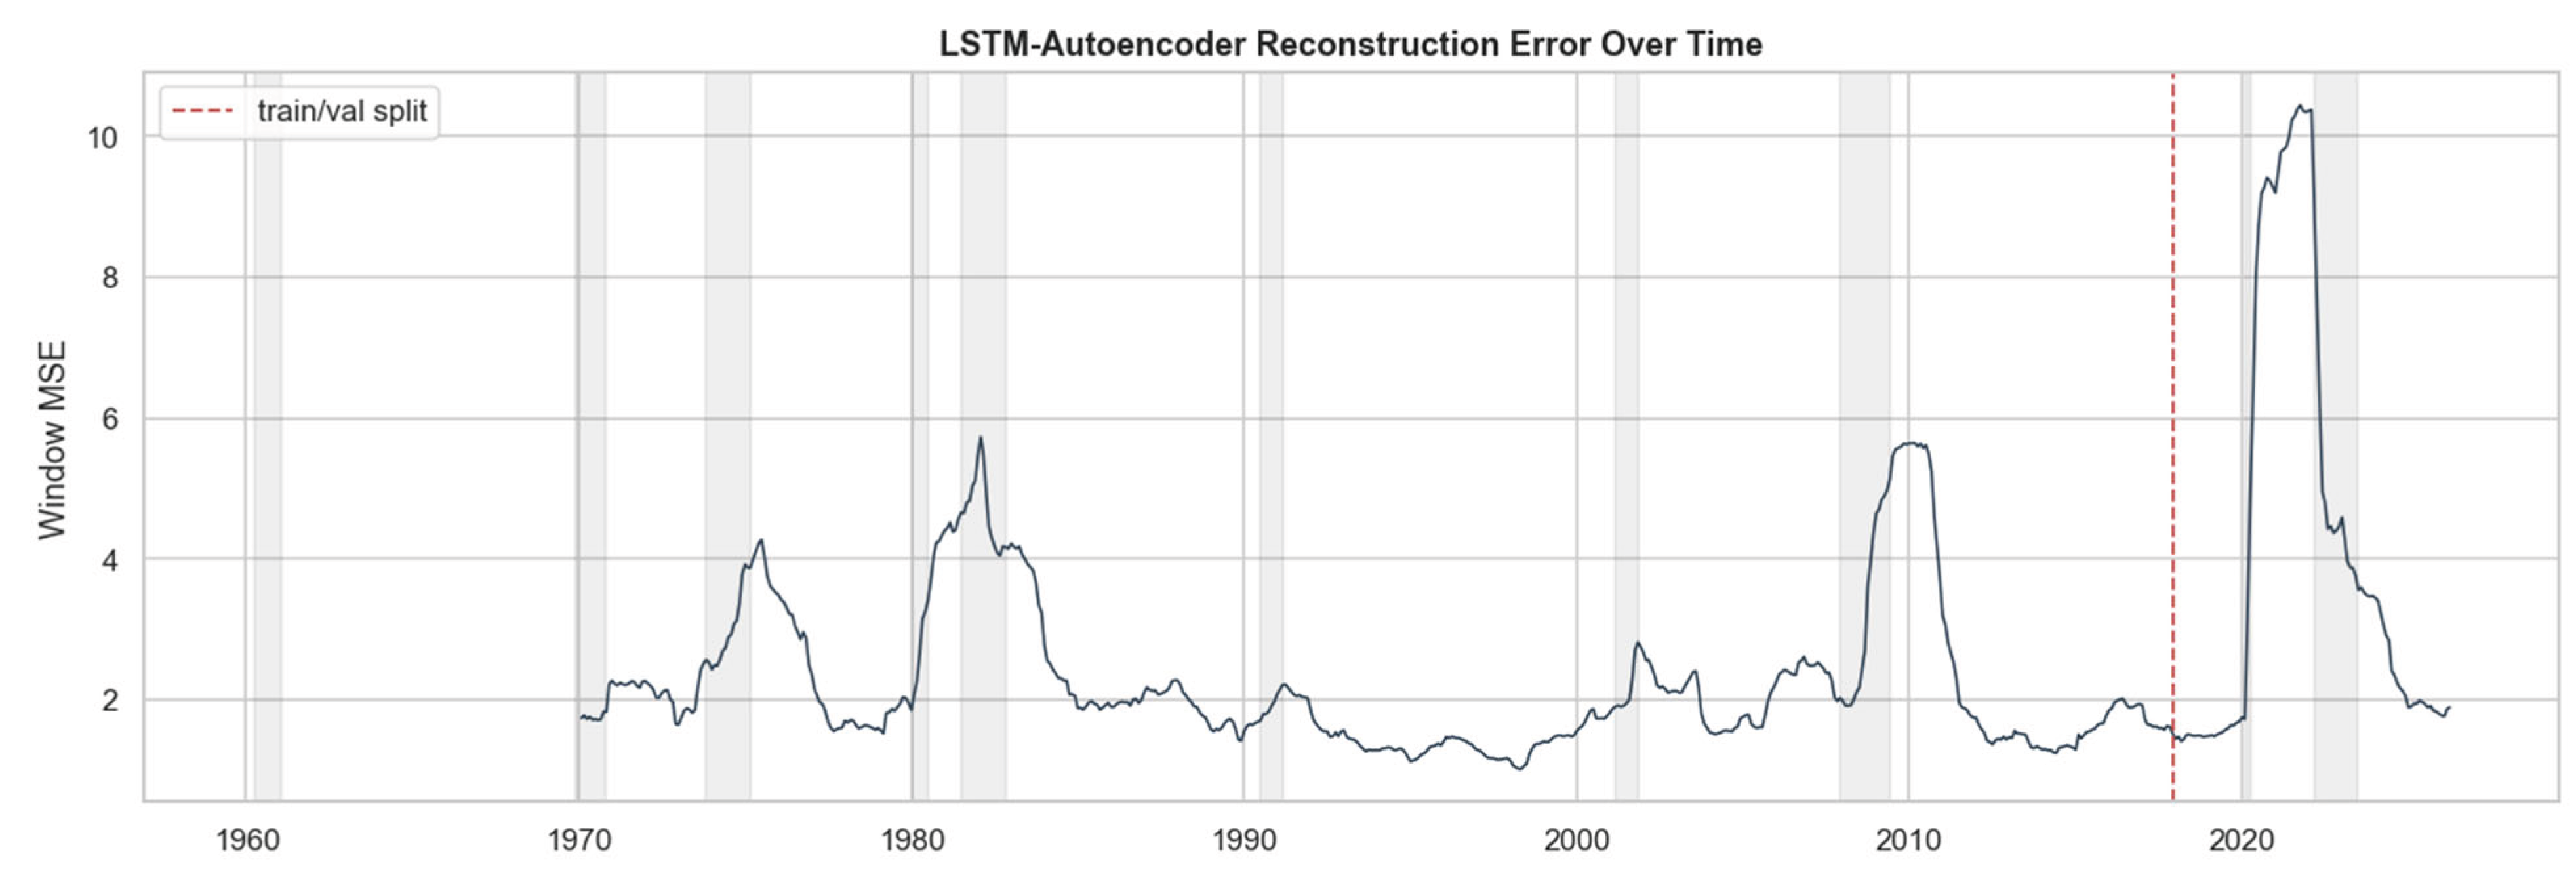
Figure 7.
Regime transition matrix showing the probability of moving from one regime to another. High diagonal values indicate strong regime persistence.
Figure 7.
Regime transition matrix showing the probability of moving from one regime to another. High diagonal values indicate strong regime persistence.
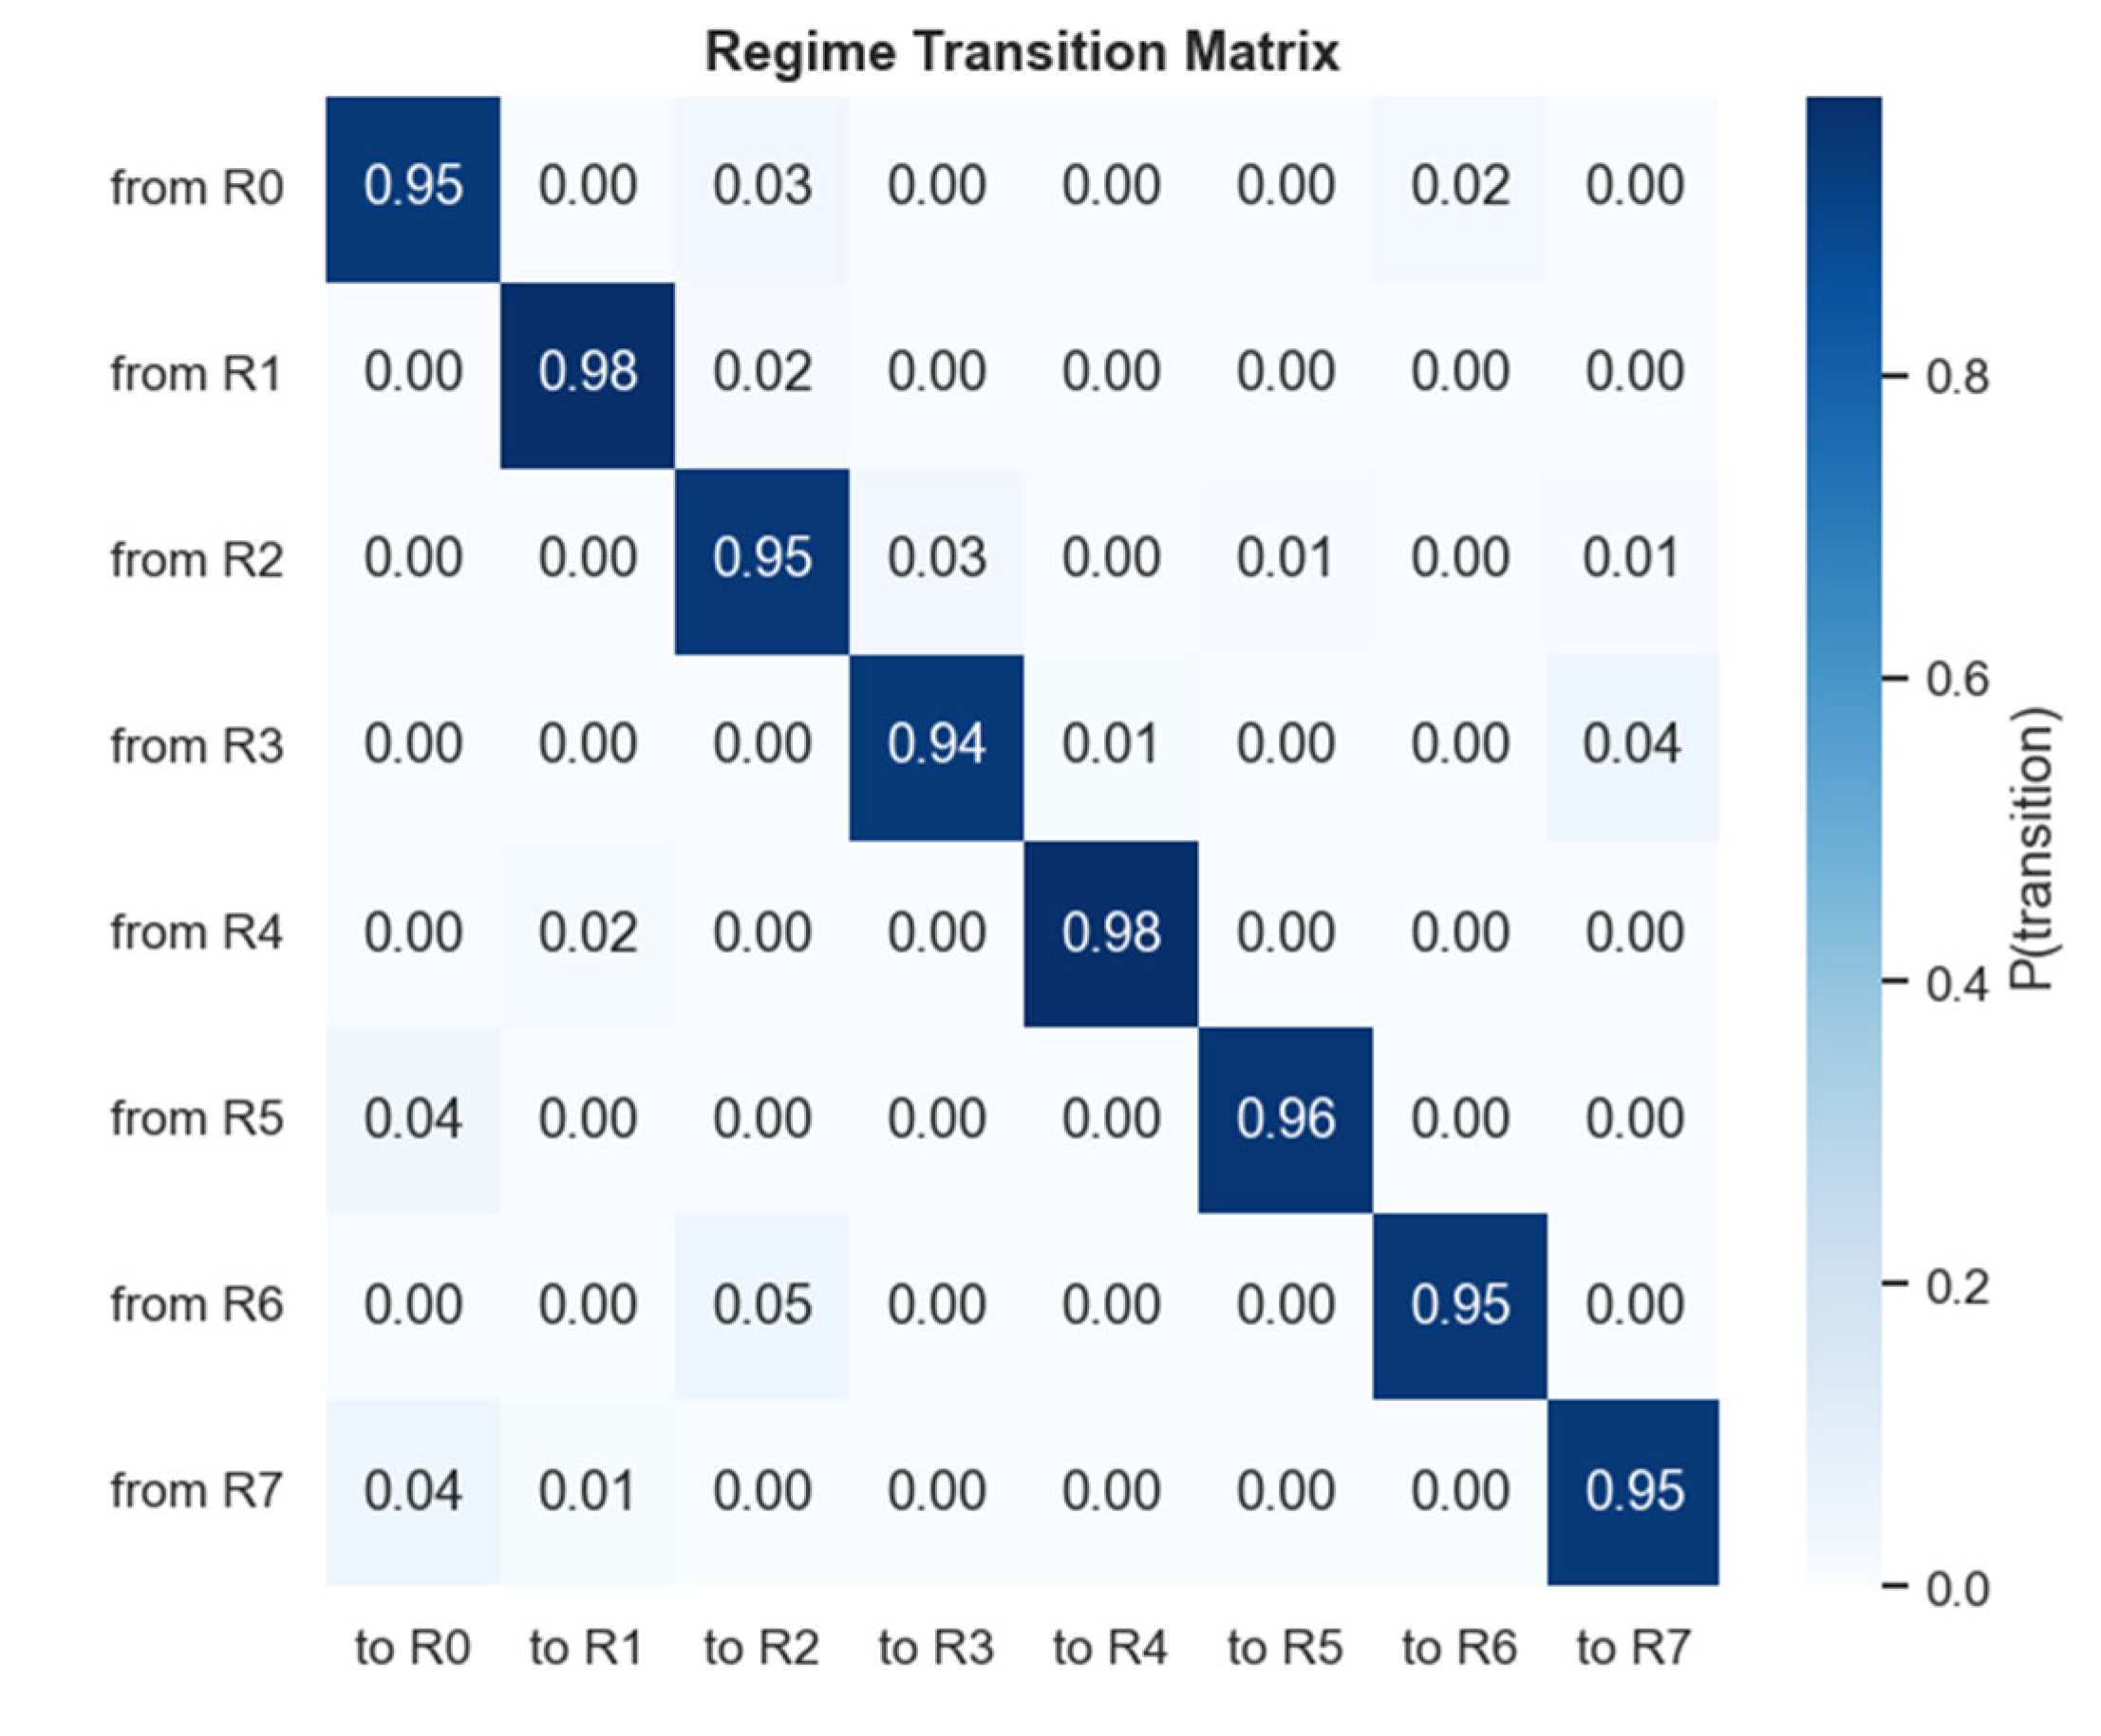
Figure 8.
Timeline of discovered regimes (coloured) with NBER recession and major economic shock windows shaded in grey.
Figure 8.
Timeline of discovered regimes (coloured) with NBER recession and major economic shock windows shaded in grey.
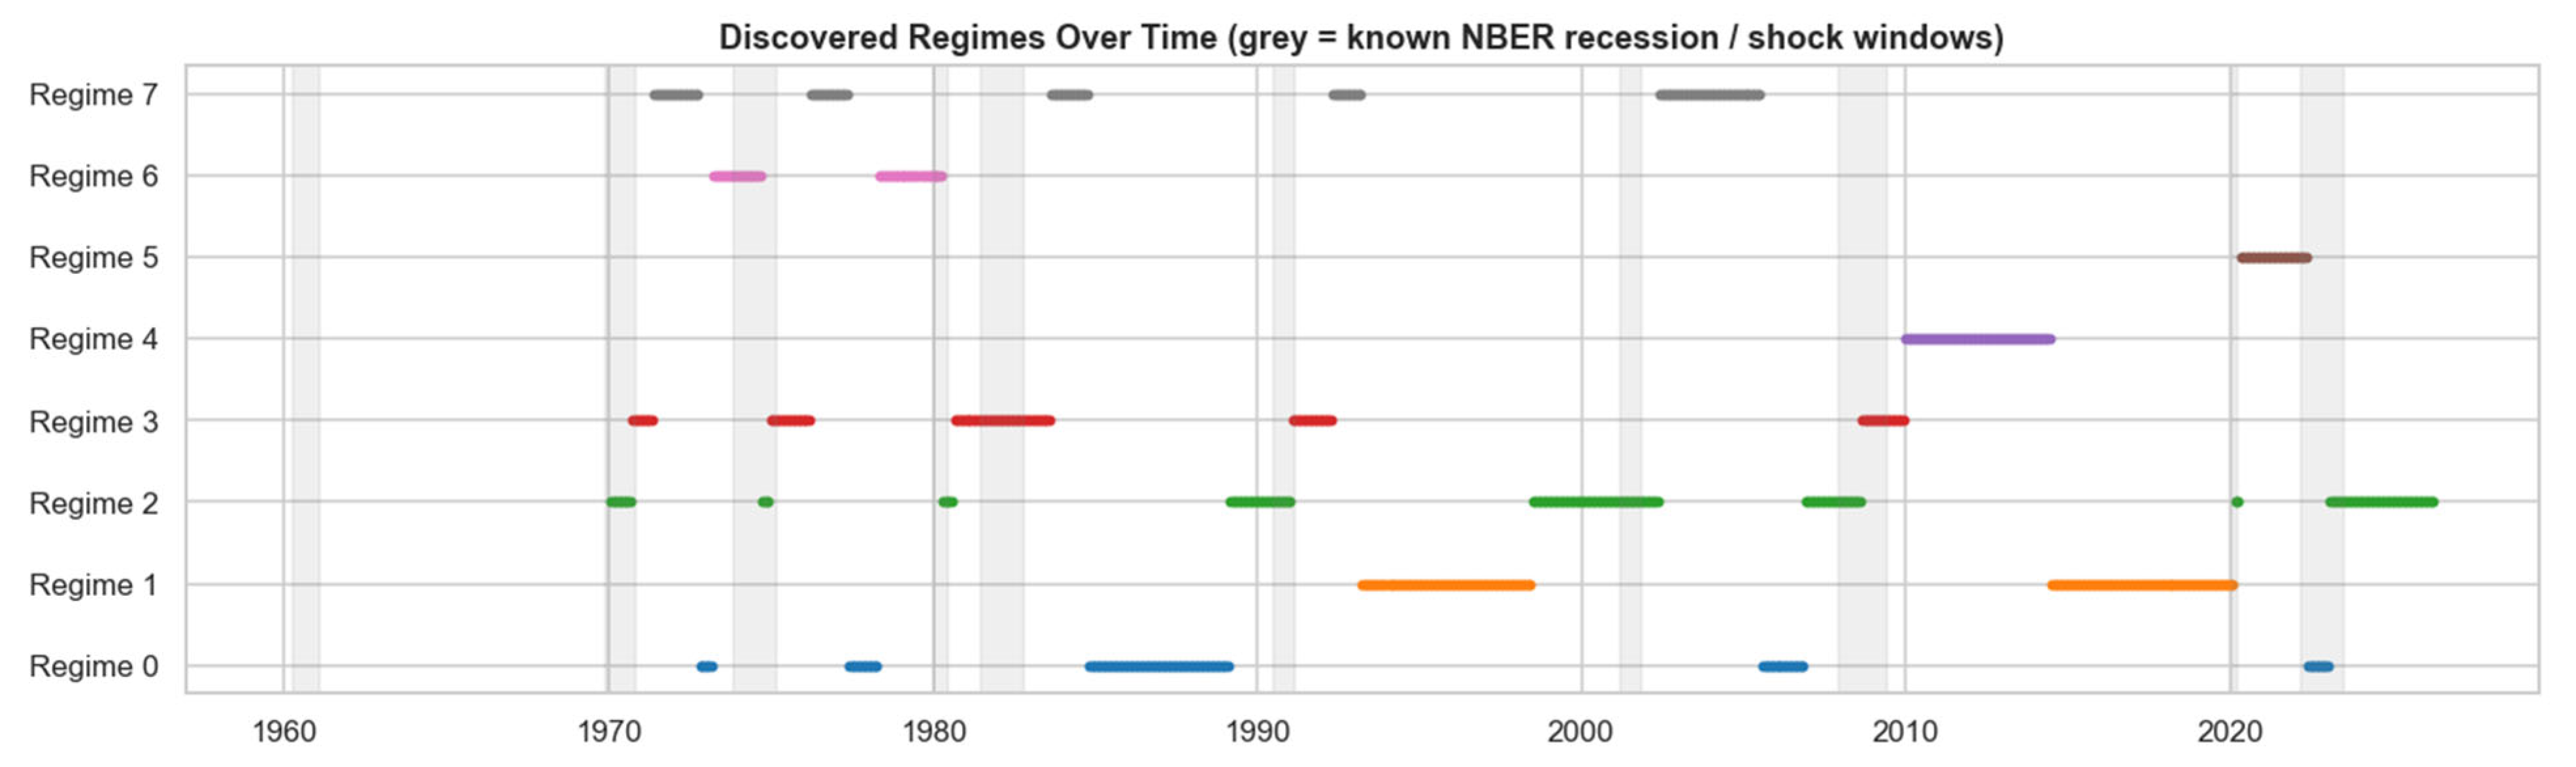
Figure 9.
The percentage overlap of each regime with known economic shocks.
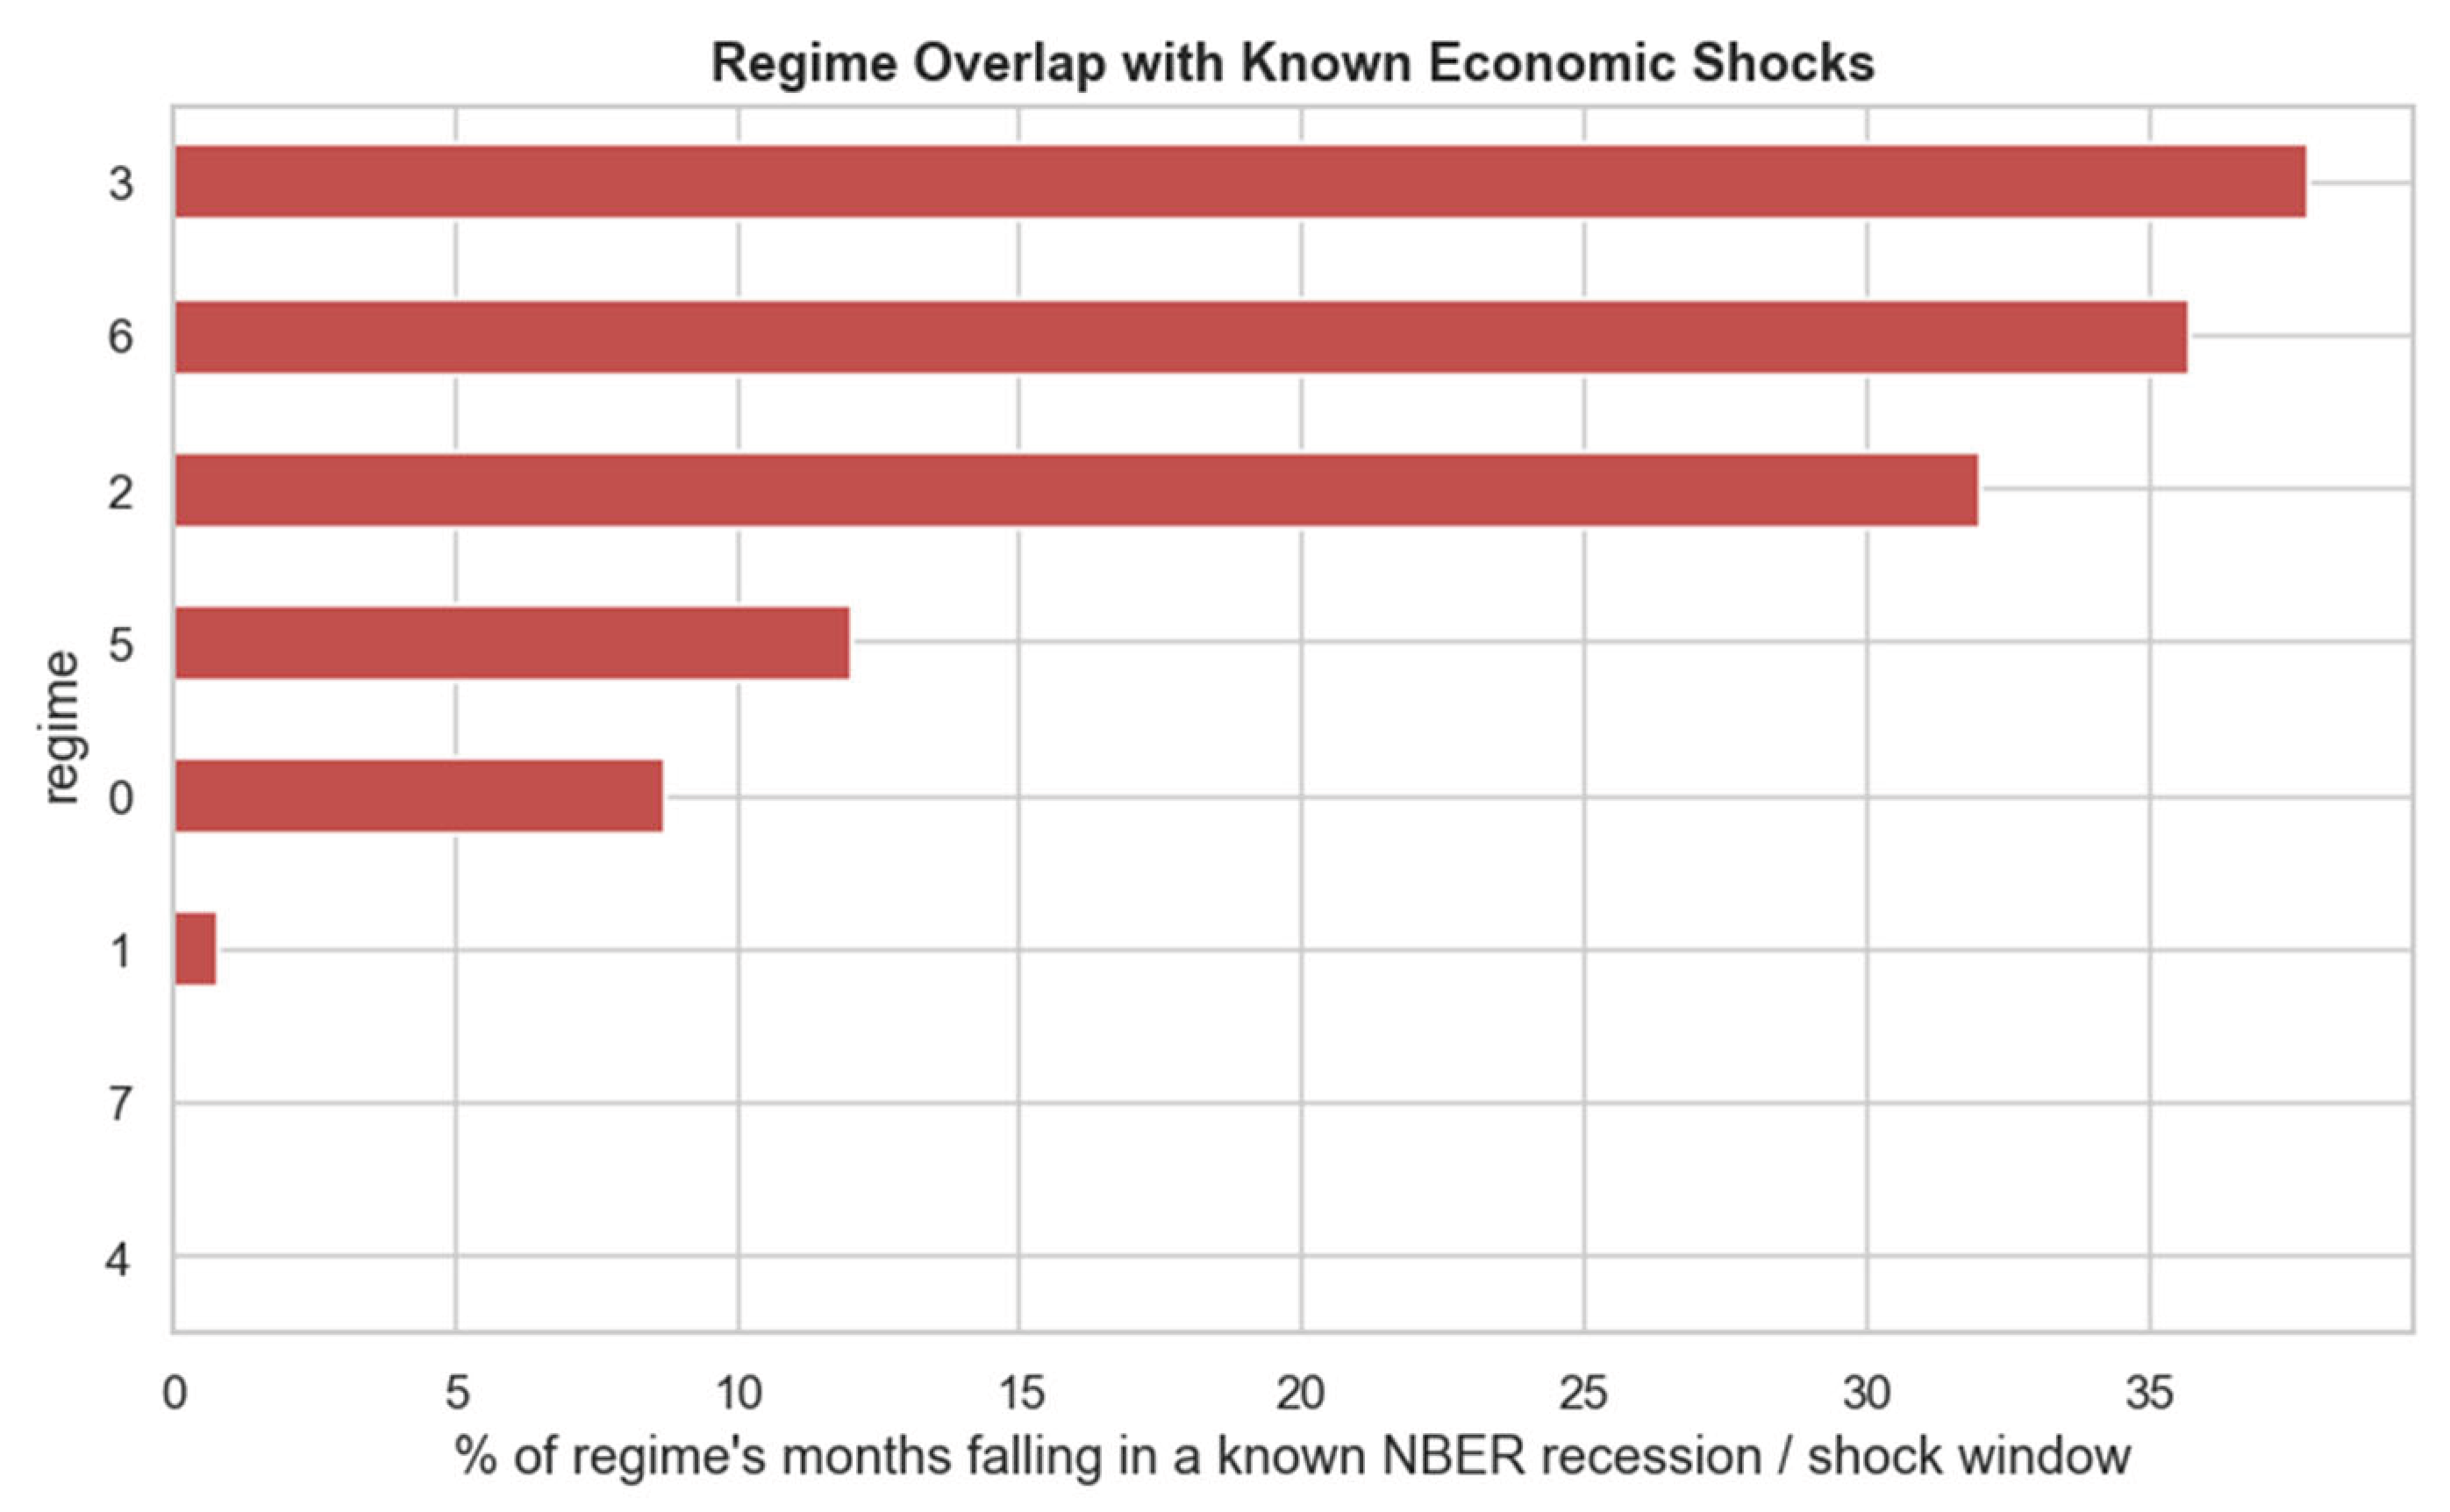
Figure 10.
Validates the economic relevance of the discovered regimes.
Disclaimer/Publisher’s Note: The statements, opinions and data contained in all publications are solely those of the individual author(s) and contributor(s) and not of MDPI and/or the editor(s). MDPI and/or the editor(s) disclaim responsibility for any injury to people or property resulting from any ideas, methods, instructions or products referred to in the content. |
© 2026 by the authors. Licensee MDPI, Basel, Switzerland. This article is an open access article distributed under the terms and conditions of the Creative Commons Attribution (CC BY) license (http://creativecommons.org/licenses/by/4.0/).
Copyright: This open access article is published under a Creative Commons CC BY 4.0 license, which permit the free download, distribution, and reuse, provided that the author and preprint are cited in any reuse.