
Submitted:
14 November 2026
Posted:
17 November 2026
You are already at the latest version
Abstract
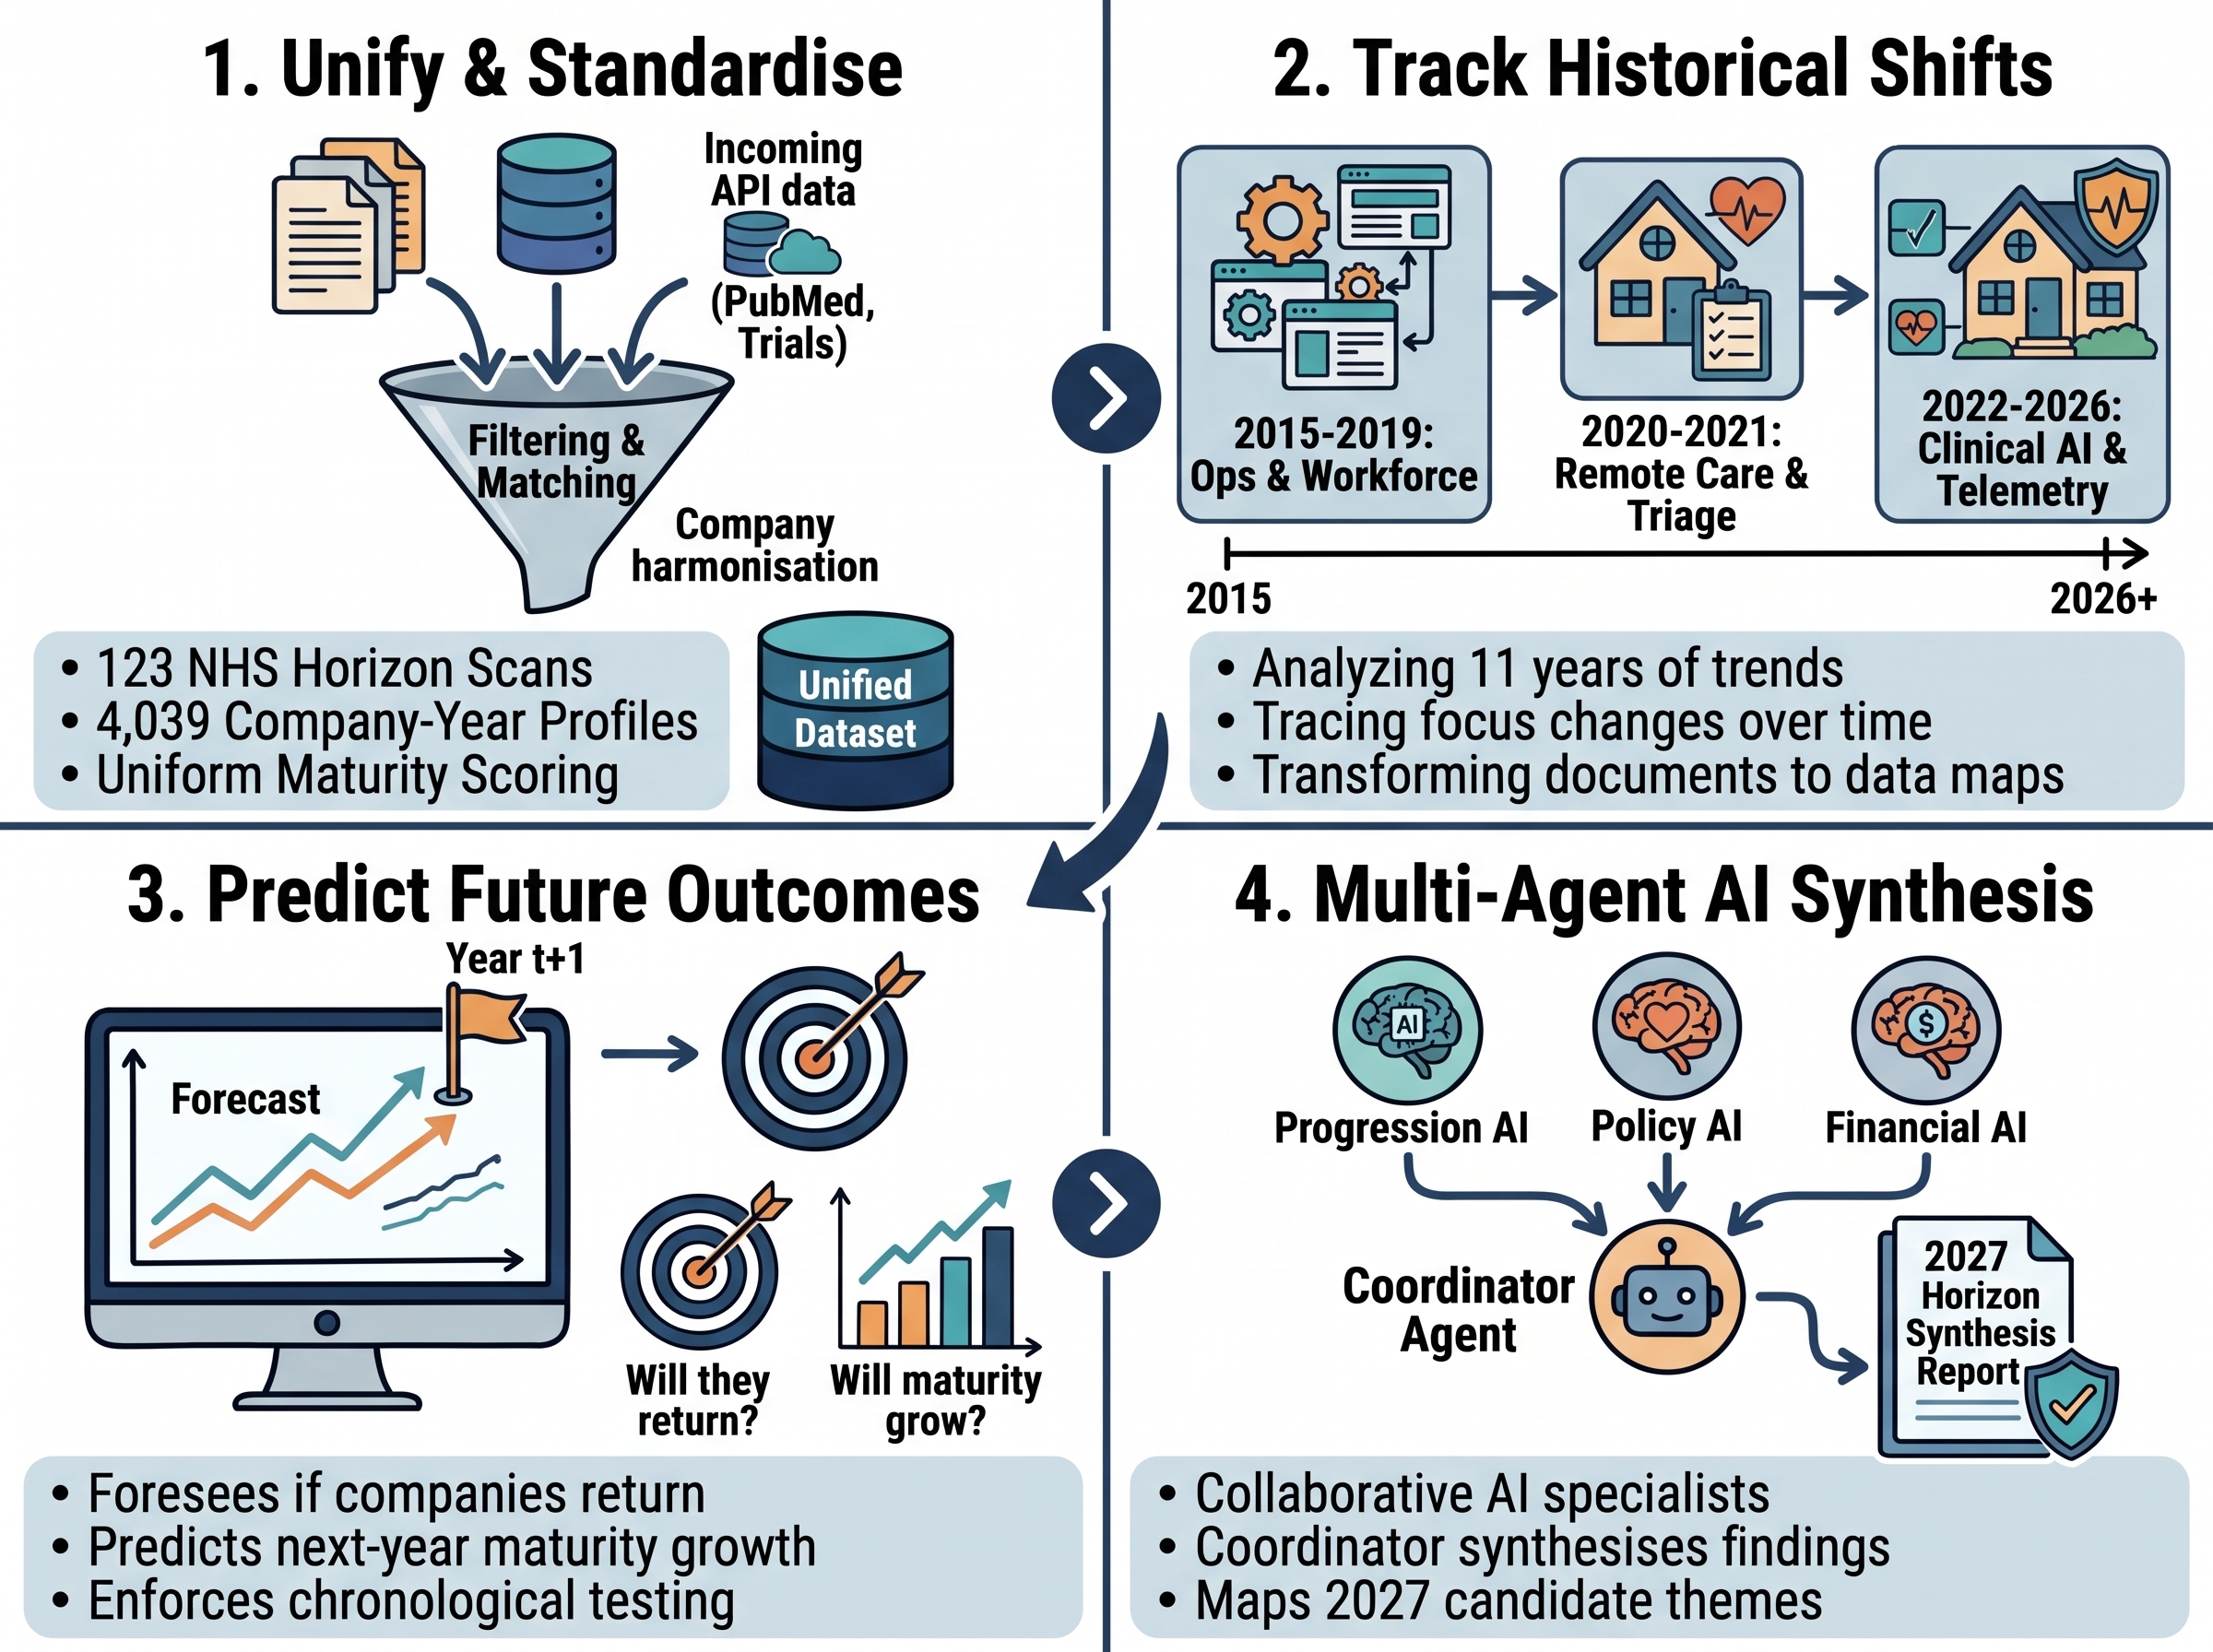
Background: Increasing volumes of heterogeneous digital-health intelligence challenge conventional horizon-scanning methods and their ability to examine how technologies, clinical priorities and innovation pathways evolve over time. This study developed an agentic AI-assisted methodology for longitudinal digital-health horizon scanning. Methods: We analysed 123 NHS horizon scans conducted in 2015 and annually from 2019 to 2026, comprising 4,039 company-year profiles. Horizon-scan records were integrated with policy, clinical, funding and media evidence. Entity harmonisation, transformer-based semantic representations, TF-IDF analysis, machine learning and semantic clustering were used to characterise thematic evolution and estimate next-year corpus reappearance and future documented maturity. Performance was evaluated using nested company-grouped and rolling-origin validation, and candidate themes were contextualised through human-reviewed multi-agent synthesis. Results: The corpus shifted from enterprise, workforce and operational technologies towards condition-specific clinical applications, including oncology, women’s health, cardiovascular care, cognitive assessment, neurodevelopmental conditions and imaging artificial intelligence. Under nested company-grouped validation, XGBoost estimated next-year corpus reappearance with an F1 score of 0.67, ROC-AUC of 0.89 and average precision of 0.72. Extra Trees estimated future documented maturity with R2=0.40and RMSE =0.96, compared with R2=0.27and RMSE =1.05for direct carry-forward. Chronological performance was more variable across annual cohorts. Conclusions: The framework provides a structured and traceable approach for transforming historical horizon scans into longitudinal thematic intelligence, company-level estimates and candidate areas for further investigation. It is intended to augment expert-led horizon scanning rather than replace clinical, regulatory, procurement or commissioning judgement.
Keywords:
horizon scan
; digital health
; large language model
1. Introduction
Horizon scanning is a strategic foresight methodology for systematically identifying emerging technologies, developments, trends and signals that may have significant future effects [1,2]. Although definitions vary across disciplines, it generally involves examining diverse information sources to detect early indications of change and support proactive decision-making under uncertainty [3]. Initially developed within futures studies and technology forecasting, horizon scanning has subsequently been adopted across government, industry, defence and healthcare [4]. In health systems, it enables decision-makers to identify potentially disruptive innovations and prioritise technologies for further evaluation before widespread implementation.
Healthcare horizon scanning developed partly in response to the rapid expansion of medical innovation during the 1990s, when policymakers recognised that conventional health technology assessment frequently evaluated technologies only after they had entered clinical practice [5]. European agencies consequently established Early Awareness and Alert systems, and a 1997 workshop involving researchers and policymakers from 12 countries developed common principles for identifying innovations with potentially important clinical, organisational or economic effects [6]. This work contributed to the establishment of the EuroScan International Network in 1999 and subsequent methodological development, information sharing and international coordination [6,7]. By the late 2000s, formal horizon-scanning and early-awareness systems were operating across Europe, North America and Australasia to inform health technology assessment, reimbursement, procurement, service planning and resource allocation [8,9]. The value of these systems is particularly evident for innovations whose clinical, organisational and financial implications may become substantial before extensive real-world evidence is available. Horizon-scanning activities have examined advanced therapy medicinal products, including gene and cell therapies for oncology [10,11], adeno-associated viral-vector therapies for rare inherited disorders [12,13], and the infrastructure, evidence and affordability challenges associated with novel treatments [14]. They have also supported consideration of emerging therapeutic platforms and the integration of genomic medicine into routine care [15]. These examples illustrate the role of horizon scanning as an early mechanism for identifying developments requiring further assessment and preparedness, rather than as a replacement for formal evaluation.
Digital health creates additional challenges for conventional horizon scanning. Digital technologies may develop rapidly, change purpose or terminology, and generate relevant evidence across heterogeneous sources, including health-system reports, clinical registries, policy documents, public-funding databases, company announcements, media coverage and regulatory materials. Products may also be modified after deployment, integrated into wider platforms or applied in settings that differ from those originally intended. At the same time, the volume and diversity of digital health applications create substantial demands on manual analytical workflows [24]. Repeatedly locating, reconciling and interpreting information across thousands of technologies can therefore limit the scalability of conventional scanning and the ability to examine how technologies, implementation evidence and clinical priorities evolve longitudinally.
Machine learning and natural-language processing have increasingly been applied to technology foresight to address some of these challenges. Zhou et al. used deep neural networks and historical patent data to predict emerging technologies associated with Gartner hype cycles, illustrating the potential for computational methods to forecast technological trajectories [16]. Lee et al. incorporated bibliographic meta-knowledge, including abstracts, citations and disciplinary codes, into a deep-learning architecture for predicting the future growth potential of technology clusters [17]. Transformer-based approaches have also been applied in bio-healthcare to examine semantic relationships between scientific publications and patents and to anticipate areas of technology convergence [18]. Together, these studies indicate that computational methods can complement expert assessment by identifying patterns within volumes of information that would be difficult to examine manually.
A complementary strand of longitudinal digital-health research uses real-world Internet of Medical Things data to examine the behaviour of medical technologies after deployment. Recent studies of computed-tomography equipment illustrate this approach at several stages of prognostic and health management. Zhao et al. combined Bayesian Gaussian-process modelling with a condition-aware bidirectional long short-term memory network to detect transitions from gradual to accelerated degradation in CT X-ray tubes under changing operating conditions, using long-term operational data collected through the IoMT infrastructure of West China Hospital [19]. Yang et al. developed a physics-guided health indicator from filament-current behaviour and combined a bidirectional long short-term memory sequence-to-sequence model with cross-equipment transfer learning and uncertainty quantification to predict remaining useful life across hospitals and heterogeneous CT equipment [20]. Ma et al. extended this line of research through a dual-branch framework that integrated mechanism-driven degradation indicators with raw multidimensional sensor signals, condition-aware attention and multi-site validation to support risk-informed maintenance decisions [21]. These studies demonstrate the value of temporally ordered operational data for degradation modelling, early warning, remaining-useful-life prediction and maintenance planning [19,20,21].
Representation learning and text embeddings provide a further mechanism for analysing heterogeneous innovation intelligence. Embeddings transform unstructured text into continuous numerical representations that retain aspects of its semantic and syntactic relationships [22]. Advances in transformer architectures and contrastive pre-training have improved document-level retrieval and classification performance, enabling descriptions from different sources to be compared within a shared semantic space [23]. Within foresight and policy analysis, these representations can support the clustering of related technologies and the quantitative comparison of innovation descriptions with strategic documents. Hajikhani and Suominen, for example, applied computational text analysis to map science, technology and innovation artefacts against the 17 United Nations Sustainable Development Goals and their associated targets [24]. Such methods illustrate how high-dimensional semantic analysis can support policy-oriented classification at a scale that would be difficult to achieve through manual screening alone.
However, important limitations remain. Pre-trained embeddings are generally static and may not adequately capture changes in the meaning, maturity or use of an innovation over time. Temporal language-model research has shown that explicitly accounting for time can improve the identification of semantic change compared with static representations [25]. Text embeddings also do not inherently integrate continuous operational signals, such as funding levels, implementation breadth, regulatory milestones or changes in clinical evidence. More broadly, many computational foresight studies rely predominantly on patent or bibliographic information. These sources are valuable but may involve publication delays and may not capture the operational and commissioning contexts of digital health innovations under active consideration by healthcare systems [26]. Statistical models can identify associations and candidate patterns, but their outputs still require careful interpretation alongside clinical, regulatory, policy and organisational evidence.
These limitations create an opportunity to combine longitudinal health-system intelligence, semantic representation and predictive analysis with a structured synthesis stage. A multi-agent architecture may support this process by assigning defined interpretive tasks to separate language-model agents and consolidating their outputs under explicit constraints. Such a system could help organise heterogeneous quantitative findings into clinical, technological, operational, policy and regulatory perspectives. However, an agentic system should function as a transparent synthesis layer rather than as an independent source of evidence or a replacement for expert judgement. Its outputs require human review for numerical accuracy, correspondence with the underlying analyses, preservation of uncertainty and avoidance of unsupported causal or predictive claims.
NHS horizon scans provide a potentially valuable evidence base for developing and evaluating such an approach because they document innovations identified in response to particular clinical, technological and operational questions. Although individual scans differ in scope, format and commissioning purpose and were not originally designed as a longitudinal dataset, harmonising successive scans may enable changes in thematic emphasis, company visibility and documented maturity evidence to be studied over time. This study therefore developed an agentic AI-assisted methodology for the longitudinal analysis of NHS digital-health horizon scans. The objectives were to: (1) characterise changes in the clinical, technological and operational themes represented between 2015 and 2026; (2) construct longitudinal company-year profiles integrating horizon-scan records with policy, funding, clinical, media and organisational evidence; (3) evaluate models predicting subsequent corpus visibility and future documented maturity; (4) identify candidate themes for subsequent horizon-scanning cycles through semantic clustering; and (5) examine the feasibility of using a structured, human-reviewed multi-agent system to synthesise the resulting analytical outputs. The framework was intended to augment expert-led horizon scanning by supporting analysis at scale, rather than to replace formal health technology assessment, regulatory evaluation or professional judgement.
2. Methodology
2.1. Horizon-Scan Selection, Data Acquisition and Model-Development Framework
The source corpus comprised horizon scans undertaken by the Health Innovation Network in response to requests from NHS organisations and other public-sector NHS stakeholders. These requests addressed a range of clinical, technological, operational and service-transformation questions specified by NHS commissioners, providers and other system stakeholders. The scans therefore reflected practical NHS intelligence needs and were not originally designed as a single longitudinal research dataset.
All horizon scans available within the organisational archive for the study period were screened for eligibility, without restriction to a particular clinical condition, care pathway or technological theme. Scans were included where they: (1) had been conducted in response to a request from an NHS organisation or public NHS stakeholder; (2) represented a horizon-scanning or market-identification exercise involving multiple innovations, technologies, products or suppliers; (3) contained sufficient information to identify and describe the included technologies; and (4) focused wholly or partly on digital health technologies. Scans concerned exclusively with pharmaceuticals, non-digital medical devices or other non-digital interventions were excluded. Where a mixed scan included both digital and non-digital technologies, only the digital-health records were retained.
The source documents were extracted from the NHS and Health Innovation Network’s organisational archive between June 2026 and August 2026. External evidence retrieval and enrichment were completed on 31 August 2026. For each included scan, the scan year and principal commissioning topic were recorded. The annual distribution and commissioning scope of the 123 included horizon scans are summarised in Supplementary Table S1. Detailed scan-level metadata were retained internally for audit purposes but are not reproduced where they relate to restricted organisational workspaces.
Following eligibility screening, 123 horizon scans conducted in 2015 and annually from 2019 to 2026 were included and transformed into a longitudinal multimodal dataset comprising 4,039 unique company-year profiles. The scans included condition-specific, pathway-focused and cross-cutting digital-capability assessments, as well as scans addressing administrative or operational functions. Their outputs included narrative reports, technology or supplier profiles, structured spreadsheets and combined report-and-spreadsheet formats. Additional publicly accessible evidence was obtained from company websites, governmental registries and public repositories.
Before longitudinal analysis, the extracted records were manually standardised into a common structure containing the scan identifier, scan year, company or supplier name, product name, technology description, intended purpose, implementation evidence, reported benefits, interoperability information and regulatory status. Non-entity spreadsheet content, including section headings, geographic labels, summary fields and blank placeholder rows, was excluded. Following automated entity reconciliation, the resulting records underwent final manual quality control. Records were removed where review confirmed that they represented spreadsheet artefacts, headings or filters, duplicate non-innovation entries, incomplete records without an identifiable company or technology, or entries outside the digital-health inclusion criteria. This two-stage automated reconciliation and manual quality-control procedure yielded the 4,039 company-year profiles used in the principal analysis (see Section 2.6 for threshold sensitivity details).
The corpus therefore represents a retrospective census of eligible digital-health horizon scans available within the organisational archive, rather than a random or topic-balanced sample of the wider digital-health market. This inclusive approach preserved the breadth of NHS demand for horizon-scanning intelligence and enabled changes in the clinical, technological and operational priorities represented over time to be examined. Consequently, differences between years may reflect variation in the number, scope and commissioning priorities of the scans, as well as changes in the underlying innovation landscape.
Records were consolidated across temporal snapshots using the entity-harmonisation procedure described in Section 2.6. Reported financial values were transformed using log(1 + x) to reduce right skew. Linear interpolation between observed maturity scores was restricted to retrospective descriptive reconstruction and visualisation of historical trajectories. Interpolated values were not used to generate predictive features, supervised outcomes, hyperparameter selection or performance estimates.
The analytical framework was implemented in Python 3.10.20 on a Windows 10 environment. Data manipulation and numerical operations used pandas 2.3.3 and NumPy 2.2.5. Machine-learning pipelines and cross-validation procedures were implemented using scikit-learn 1.7.2, with XGBoost used for gradient-boosting models. High-dimensional document representations were generated using the sentence-transformers library and the pretrained all-mpnet-base-v2 model, while semantic clustering used HDBSCAN. Where supported, random_state=42 was used for model fitting, randomised hyperparameter sampling, principal-component analysis and permutation-importance procedures to support reproducibility.
Two company-grouped evaluation approaches were conducted. The initial analysis used five-fold GroupKFold, grouped by canonical company identifier, within RandomizedSearchCV for both hyperparameter selection and cross-validated performance reporting. This ensured that all annual profiles belonging to the same company remained within a single partition, but it did not include a separate outer evaluation loop. The initial results were retained for methodological transparency and baseline comparison. The analysis was subsequently repeated using nested company-grouped cross-validation. An outer five-fold GroupKFold, grouped by canonical company identifier, was reserved exclusively for performance estimation. Within each outer-training partition, hyperparameters were selected using RandomizedSearchCV with an inner three-fold company-grouped GroupKFold. Eight candidate configurations were evaluated per model. Classification searches optimised average precision, while regression searches optimised R2. The selected pipeline was refitted using the complete outer-training partition and evaluated once on the held-out outer fold. No company appeared in both the outer-training and outer-validation partitions. All data-dependent preprocessing was incorporated within the model pipeline and fitted only using the active training partition. Missing baseline maturity and policy-alignment values were imputed using training-partition medians, after which a maturity-score missingness indicator and squared-score term were constructed. StandardScaler was applied to Logistic Regression and Ridge Regression and fitted independently within each inner and outer training partition. Scaling was not applied to Random Forest, Extra Trees or XGBoost because their tree-based splitting procedures did not require standardised feature scales.
For Random Forest and Extra Trees, the search space comprised 50, 100, 200 or 300 estimators; maximum depths of 5, 10, 15, 20 or unrestricted depth; minimum split sizes of 2, 5 or 10; and minimum leaf sizes of 1, 2 or 4. Classification additionally considered balanced and balanced_subsample class weighting. For XGBoost, the search included 50, 100, 200 or 300 estimators; maximum depths of 3, 4, 6 or 8; learning rates of 0.03, 0.05 or 0.10; and row and feature subsampling values of 0.8 or 1.0. Logistic Regression considered C values of 0.01, 0.1, 1 and 10, with and without balanced class weighting. Ridge Regression considered alpha values of 0.1, 1, 10 and 100. In the initial non-nested analysis, the selected Extra Trees classification configuration used 200 estimators, a maximum depth of 15, a minimum split size of 2, a minimum leaf size of 2 and balanced_subsample weighting. The selected Extra Trees regression configuration used 300 estimators, unrestricted depth, a minimum split size of 2 and a minimum leaf size of 2. These initial settings were subsequently held constant in the fixed-configuration rolling-origin analysis described in Section 2.4. In the nested analysis, hyperparameters were selected independently within each outer-training partition. Consequently, no single global parameter configuration was applied across all five outer folds, and each outer-fold performance estimate was generated using the configuration selected solely from that fold’s training data.
Classification performance was evaluated using positive-class F1-score, area under the receiver operating characteristic curve (ROC-AUC) and average precision. Regression performance was evaluated using the coefficient of determination (R2) and root mean squared error (RMSE). For the initial analysis, metrics were reported across five non-nested company-grouped folds. For the revised nested analysis, performance was reported as the mean ± standard deviation across five held-out outer GroupKFold folds. The nested outer-fold estimates were used as the principal estimates of company-level generalisation, while the initial estimates were retained for methodological and baseline comparison.
For each held-out outer fold, validation-set size, positive-class prevalence, operating threshold, precision, recall, F1, average precision and ROC-AUC were retained. Precision, recall and F1 were calculated at the default probability threshold of 0.50, while average precision and ROC-AUC were calculated from the unthresholded predicted probabilities. Complete fold-level diagnostics are reported in Supplementary Table S6.
To contextualise predictive performance, the fitted models were compared with simple baseline references. For classification, analytical no-skill references were calculated using the observed positive-class prevalence of 34.79%. At this prevalence, an all-positive classifier would achieve an F1-score of 0.52, the no-skill average-precision reference was 0.35, and random discrimination corresponded to a ROC-AUC of 0.50. For regression, a mean-prediction DummyRegressor was evaluated using the same five-fold GroupKFold procedure and canonical company grouping as the fitted models. Within each fold, the baseline was fitted using only the training partition and assigned the training-fold mean maturity score to each held-out observation.
For regression, a direct carry-forward comparator was additionally evaluated to assess whether the fitted models improved on persistence in the documented-maturity score. The carry-forward comparator assigned the feature-year documented-maturity score Stas the predicted subsequent-year score, . The training-mean and carry-forward comparators were evaluated using the same eligible observations and held-out partitions as the fitted regression models. In the nested analysis, both comparators were calculated independently within each held-out outer fold. In the rolling-origin analyses, both comparators were calculated separately for each annual validation cohort using only the corresponding historical training window and directly observed subsequent-year outcomes. Complete comparisons are reported in Supplementary Table S7.
2.2. External Evidence Retrieval and Temporal Bounding
A programmatic retrieval pipeline was developed to enrich each standardised company-year profile with publicly accessible bibliographic, clinical-trial, funding and media evidence. Searches used the harmonised company name and, where available, product names and relevant technology terms from the corresponding horizon-scan record. Bibliographic and abstract metadata were retrieved using the National Center for Biotechnology Information Entrez Programming Utilities for PubMed. Clinical-trial records and study statuses were retrieved through the ClinicalTrials.gov application programming interface. Publicly reported research and innovation funding was retrieved through the UK Research and Innovation Gateway to Research application programming interface, while media mentions and publicly reported corporate developments were retrieved through the GDELT Project application programming interface.
Retrieved records were linked to the relevant company-year profile using the harmonised company identifier and the source dates associated with the returned evidence. To preserve temporal integrity, evidence used for a feature-year observation twas restricted to records published or available on or before 31 December of year t. Records published after that date were not included in the corresponding company-year feature representation. External evidence retrieval and enrichment were completed on 31 August 2026, as described in Section 2.1.
The retrieval workflow used repeatable application-programming-interface requests, local caching and exponential backoff to manage rate limits and temporary service failures. Cached responses preserved the retrieved source material and associated query context for audit and reproducibility. Returned records were standardised before incorporation into the company-year dossiers, and repeated records returned through the same source were consolidated to avoid duplicate contribution. An absence of returned evidence was treated as an absence of documented evidence within the queried public sources, rather than as confirmation that no corresponding publication, trial, funding award or media activity existed. The retrieved evidence was used to enrich the company-year profiles and support the semantic representations, policy-alignment analysis, maturity-evidence assessment and contextual funding, clinical and media indicators. The external sources did not independently define the classification or regression outcomes. Next-year corpus reappearance was derived from the harmonised horizon-scanning corpus, while future documented maturity was restricted to directly observed subsequent-year maturity scores.
2.3. Maturity Scoring Framework
To quantify the maturity evidence documented for each digital health innovation, a rule-based scoring framework was developed. The score was generated programmatically, with prespecified lexical patterns and numerical extraction rules applied consistently to the evidence available for every company-year profile. The framework comprised four dimensions: systems interoperability, implementation scope, realised benefits and regulatory compliance. The respective maximum scores were 2.5, 2.5, 2.0 and 1.0, producing a composite score ranging from 0 to 8.0.
The dimensions were initially selected on the basis of recurring considerations encountered through the author’s professional experience of NHS horizon scanning and commissioning-support activities, particularly when assessing whether an innovation had progressed beyond an early proposition towards implementation in health and care settings. They capture four distinct forms of maturity evidence relevant to such assessments: integration with existing information infrastructure; implementation beyond pilot activity and across identifiable sites or organisations; evidence of realised or quantified benefits; and applicable regulatory clearance. The selection of these dimensions was also supported by the peer-reviewed digital health literature. Liaw and Godinho’s review and synthesis of digital health maturity models characterises maturity as a multidimensional and evolving capability. The review identifies digital infrastructure, electronic health records and digital tools, readiness for information sharing, standards and interoperability, policy and regulatory environments, implementation, scale-up, and monitoring and evaluation as recurring components of digital health maturity models [27]. Moreover, implementation scope was included because digital health implementation research distinguishes initial testing or adoption from subsequent spread, scale-up and sustained use. Greenhalgh et al.’s NASSS framework examines the factors influencing the non-adoption, abandonment, scale-up, spread and sustainability of health and care technologies. It therefore supports treating progression from pilot activity to live implementation across multiple organisations or geographical areas as an observable dimension of maturity, recognising that deployment scale alone does not establish effectiveness or long-term sustainability [28]. Realised benefits were treated as a separate dimension because digital health evaluation frameworks distinguish technological or organisational readiness from evidence that an innovation produces clinical, operational, economic or patient-level value. Kidholm et al.’s [29] review of empirical applications of the Model for Assessment of Telemedicine describes an initial assessment of technological and organisational maturity followed by multidisciplinary evaluation of safety, clinical effectiveness, patient perspectives, economic effects and organisational consequences.
More broadly, Segur-Ferrer et al.’s [30] scoping review and thematic analysis of digital health technology assessment frameworks demonstrates that evaluating digital health technologies requires consideration of multiple domains, including their effects, implementation requirements, wider system implications and potential risks. This supports the use of a multidimensional composite framework rather than relying on any single indicator, such as the number of deployments or the availability of regulatory clearance.
These publications informed the conceptual basis for the four dimensions but did not prescribe the numerical weights applied in this study. The allocation of 2.5 points to systems interoperability, 2.5 to implementation scope, 2.0 to realised benefits and 1.0 to regulatory compliance was therefore a study-defined operationalisation designed to convert heterogeneous documentary evidence into a transparent and reproducible eight-point composite score. The framework was not intended to reproduce a formal health technology assessment, but to provide a structured index of the amount and strength of maturity-related evidence documented within each company-year dossier. Application of the scoring rules was deterministic: the same lexical and numerical evidence produced the same score without discretionary company-level adjustment. However, the selection of the four dimensions, their weights and the evidential thresholds remained study-defined. The resulting score should therefore be interpreted as a measure of documented maturity evidence within the assembled dossier, rather than as an independently validated measure of organisational maturity, clinical effectiveness, procurement readiness or commercial success.
Before programmatic scoring, the source horizon-scan records had been manually standardised into a common data structure. The same fields were used across records to capture company and product identifiers, technology descriptions, implementation evidence, reported benefits, interoperability information and regulatory status. This prior standardisation reduced variation arising from the heterogeneous formats of the original reports and spreadsheets and enabled the prespecified lexical, numerical and rule-based criteria to be applied consistently across company-year profiles. Missing maturity-related information was handled according to the availability and temporal applicability of evidence. Where an apparently missing field could be verified from another company-year profile for the same company, or from another source incorporated into the corresponding annual dossier, the verified information was added to the standardised record. Evidence from another source or company-year record was incorporated only where it referred to the same company and technology and the underlying source explicitly established that the evidence applied by the year being assessed. Year-specific evidence, including implementation activity, realised benefits and regulatory status, was not retrospectively assigned to an earlier year unless the source established that it was already applicable at that time. Where no corresponding evidence could be verified, the relevant scoring criterion received zero points. This treatment reflected the absence of documented evidence within the assembled company-year dossier rather than a conclusion that the company lacked the underlying capability. The approach was considered appropriate because fields such as implementation, realised benefits, interoperability and regulatory status were routinely captured across the horizon scans; nevertheless, variation in source completeness or public reporting may have resulted in some maturity evidence being under-recorded.

Table 1.
Multidimensional Maturity Scoring Framework and Lexical Evaluation Criteria.
| Maturity Dimension | Maximum Score | Evaluation Criteria and Lexical Triggers |
|---|---|---|
| Systems Interoperability | 2.5 |
+1.0: Explicit integration reference in text (e.g., “interoperable”, “EPR integration”, “bidirectional API”). +0.5 per indicator (up to +1.5): Specific named interoperability standards or NHS clinical systems (e.g., FHIR, HL7, SNOMED CT, DICOM, EMIS, SystmOne, Cerner, Epic, NHS App, Spine). |
| Implementation Scope | 2.5 |
+0.5: Documented active/live deployment in a health or care setting. +0.5 per indicator (up to +2.0): Regex extraction of quantified deployment scale (e.g., number of NHS Trusts, ICBs, hospitals, GP practices, or active patient/user volumes). |
| Realised Benefits | 2.0 |
1.0: Qualitative description of clinical, operational, or workforce benefits (e.g., “improves workflow”, “reduces clinician burden”) lacking numerical quantification. 2.0: Presence of regex-verified quantitative outcome indicators (e.g., %, £, $, hours/minutes saved, bed-days reduced, ROI, p-value, or statistically quantified trial endpoints). The highest applicable category was assigned; qualitative and quantitative points were not added together. |
| Regulatory Compliance | 1.0 |
+0.5: Documented compliance with baseline digital governance and safety standards (e.g., DTAC, DSPT, DCB0129, DCB0160, ISO 13485, ISO 27001). +0.5 to +1.0: High-tier medical device regulatory clearance (e.g., MHRA, UKCA, CE Mark Class IIa/IIb/III, or FDA 510(k)/De Novo). Isolated “Class I” self-certifications receive 0 points. |
| Composite maturity score | 8.0 | Sum of the four dimensions |
The composite maturity score was designed as a measure of documented maturity evidence within the assembled company-year dossier. It was not intended to represent an independently verified measure of organisational maturity, commercial viability, implementation readiness or clinical effectiveness. A score of zero indicated that qualifying evidence was not documented in the available sources under the specified criteria; it did not establish that the corresponding capability or activity was absent in practice.
The dimensions had conceptual and content support from the digital-health maturity, implementation and evaluation literature described above. However, the weighting and aggregation rules were developed for this study and were not validated against an established maturity instrument, a multi-expert panel or independently observed implementation, procurement and adoption outcomes. The score should therefore be interpreted as a structured evidence index with preliminary evidence of scoring concordance.
In the preliminary blinded concordance assessment, a second reviewer with relevant digital-health evaluation expertise independently applied the maturity-scoring rubric to 100 standardised company-year dossiers. The reviewer was blinded to the automated scores, predictive-model outputs and subsequent outcomes. The manually assigned total scores were broadly consistent with the automated scores, with differences of no more than 0.5 points on the 0-to-8 scale. The greatest variation concerned implementation scope, which encompassed heterogeneous evidence ranging from pilot activity and limited deployment to multisite implementation and routine use. This preliminary assessment supported manual-programmatic concordance within the reviewed sample while identifying implementation scope as the dimension most likely to require further rubric refinement. It did not constitute external construct validation against independently observed implementation or adoption outcomes.
2.4. Outcome Definition, Feature Engineering and Temporal Validation
The unit of analysis for supervised modelling was the deduplicated canonical company-year profile (i, t), representing canonical company iobserved in feature year t. The binary classification target, termed next-year corpus reappearance, was assigned a value of 1 when the same canonical company was recorded in at least one eligible horizon scan in calendar year t + 1, and 0 when it was absent from the corresponding observable outcome-year horizon-scanning corpus. Multiple records for the same canonical company in year t + 1 were consolidated and counted as one positive outcome. A company-year profile was eligible for classification only when the corresponding t + 1corpus was observable. The terminal 2026 cohort was therefore excluded because no 2027 outcome corpus was available; these observations were not treated as negative outcomes. Reappearance measured continued visibility within the assembled horizon-scanning evidence base and was not interpreted as commercial survival, continued trading, technology survival, clinical adoption, procurement, implementation or market success.
The regression target was the observed documented maturity score for canonical company iin year t + 1. Regression was restricted to company-year profiles for which a subsequent maturity score was directly observed. Companies without an observed maturity score in year t + 1were excluded from the regression sample and were not assigned an interpolated, carried-forward or otherwise imputed future value. The regression target and semantic predictors were temporally separated but originated from related types of documentary evidence. The semantic predictors represented information available within the company-year dossier at feature year t, whereas the regression target was the directly observed documented maturity score in year t + 1. No outcome-year text or maturity evidence was included in the feature-year predictors. This chronological separation prevented direct target leakage. However, the language present at year t could contain early indicators of implementation, interoperability, realised benefits or regulatory progress that were subsequently reflected in the documented maturity score at t + 1. The model may therefore have learned prospective textual correlates of the study-defined scoring framework. Regression performance was interpreted as the ability to estimate future documented maturity within that framework.
Unstructured text associated with each company-year profile included the originating horizon-scan descriptions and, where available, temporally eligible clinical-trial abstracts, funding announcements, publication metadata, media records and other evidence incorporated into the annual dossier. Text was encoded using the pretrained all-mpnet-base-v2 sentence-transformer model, producing a 768-dimensional semantic representation for each company-year profile. To preserve temporal integrity, only information available on or before 31 December of feature year twas included. A separate semantic representation was generated for every company-year profile rather than assigning one static embedding to a company across the complete study period. This enabled changes in clinical application, implementation evidence, terminology and operating context to be represented across successive years.This methodology was mirrored in the encoding of national strategic mandates. Annual policy documents, such as the NHS Long-Term Plan and 10 Year Plan, were processed using the identical transformer architecture to generate a corresponding annual policy vector. The cosine similarity between an entity’s annual embedding vector and the strategic policy vector was calculated for the specific target year to derive an alignment metric. This provided a quantitative measure of semantic synchronicity between the company’s operational focus and the prevailing national innovation mandates. The predictive pipeline also incorporated domain-specific features engineered to capture the dynamics of organisational development. To capture the semantic and temporal dynamics of organisational progression, the final feature vector X for each entity-year observation was constructed as a concatenated array of dense embeddings and engineered scalars. The feature space was defined as:
Where TEmb represents the 768-dimensional document embedding, log(1 + Funding) denotes the log-normalised financial backing, and Score represents the baseline composite maturity score. To capture non-linear maturity trajectories, a polynomial feature of the maturity score (Score2)) was included. Temporal dynamics were mapped using organisational maturity velocity (ν), representing the historical rate of change in the entity’s score, active tenure (tactive) denoting the duration within the observation window, and the feature observationyear (t) bridging the observation to the target prediction year. Finally, A represents the strategic alignment scalar. This metric translates the qualitative alignment between an entity’s operational focus and national strategic foresight into a bounded, continuous mathematical representation. The scalar is calculated using the cosine similarity between the entity’s high-dimensional document embedding and the macroeconomic policy embedding for the target year. Mathematically, this is defined as:
Where νc represents the 768-dimensional semantic embedding vector of the specific company, synthesised from its clinical abstracts, news signals, and horizon scan dossiers, νp represents the 768-dimensional policy embedding vector, synthesised from national strategic documents (e.g., the NHS Long Term Plan) valid for the target year, and ϵ is a vanishingly small constant (10-10) introduced to ensure numerical stability and prevent division by zero during computational processing. The resulting scalar approaches 1 when an entity’s technological focus is highly congruent with upcoming national priorities (e.g., an entity developing virtual ward infrastructure corresponding with policy mandates for remote monitoring). Conversely, values approaching 0 indicate orthogonality, suggesting the innovation, regardless of its individual technological merit, lacks immediate strategic relevance to the healthcare system’s stated objectives for that period. The revised nested pipeline additionally included a baseline-maturity missingness indicator.
To prevent data leakage across the longitudinal panel, four isolation constraints were enforced during feature construction and model cross-validation. First, during five-fold GroupKFold cross-validation, the harmonised canonical company identifier was passed as the grouping variable. Consequently, all annual records (t1, … , tk) belonging to a given company were confined to either the training partition or the held-out validation partition within each fold. Records from the same company in different years could therefore not appear in both partitions, preventing the models from learning entity-specific signatures from one annual record and being evaluated against another record from the same company. Second, where the same canonical company appeared in multiple horizon scans within a single calendar year, the records were consolidated and deduplicated before data partitioning to produce one observation per company-year. Third, strict temporal bounding was applied to prevent look-ahead bias. For each company-year observation in year t, unstructured-text embeddings, policy-alignment vectors and external evidence retrieved from PubMed, ClinicalTrials.gov, UKRI Gateway to Research and GDELT were restricted to records published on or before 31 December of year t. These predictors were used to estimate next-year corpus reappearance and future documented maturity score at t + 1. Observations from the terminal cohort for which an observed t + 1outcome was unavailable were excluded from supervised model training and cross-validated performance evaluation. Fourth, all data-dependent preprocessing transformations, including missing-value imputation, missingness-indicator construction, engineered-feature creation and StandardScaler normalisation where applicable, were fitted exclusively using the active training partition and subsequently applied to the corresponding held-out observations. Principal component analysis was used separately for the descriptive semantic visualisation reported in Section 3.3 and was not part of the nested predictive pipeline. Linear interpolation was not part of feature construction, target construction, model fitting, hyperparameter selection or performance evaluation. Its use was restricted to the retrospective descriptive trajectories described in Section 2.6.
In addition to company-grouped cross-validation, a rolling-origin sensitivity analysis was conducted to assess performance under chronological conditions. For each validation feature year t, model training was restricted to company-year observations from preceding feature years, and predictions were evaluated against observed outcomes at t + 1. The validation feature years were 2022, 2023, 2024 and 2025, corresponding to outcome years 2023, 2024, 2025 and 2026. The 2026 cohort was not used as a validation feature-year cohort because corresponding 2027 outcomes were unavailable. Predictors for a company-year observation in year t were restricted to information available by 31 December of year t. The checkpoint-derived feature representation combined the company-year text embedding, documented maturity score, squared maturity score, log-transformed funding and stored tabular indicators. Repeated evidence-level records were consolidated into one observation per standardised company and year before target construction. Classification assessed whether the company reappeared in the corpus at t + 1. Regression was restricted to observations with a directly observed maturity score at t + 1. No future maturity value was assigned to companies without an observed subsequent record.
Two rolling-origin specifications were evaluated using these annual cohorts. In both specifications, the held-out feature-year cohort and its t + 1 outcomes were not accessed during model fitting or decision-threshold selection. In the first specification, the Extra Trees classification and regression configurations selected through the initial company-grouped model-development procedure were held constant across the annual validation windows. For each feature year t, model fitting and data-dependent transformations were restricted to observations from preceding feature years. Classification was evaluated using the default probability threshold of 0.50 and a historical decision threshold selected by maximising positive-class F1 using company-grouped out-of-fold predictions generated exclusively within the historical training window. The selected thresholds were 0.10, 0.11, 0.17 and 0.29 for the 2022, 2023, 2024 and 2025 feature-year cohorts, respectively. This specification held the model configuration constant to support comparison of temporal transportability across annual cohorts. Results are reported in Supplementary Table S4a.
In the second specification, preprocessing, training-partition imputation, hyperparameter optimisation, model fitting and decision-threshold selection were repeated independently within each historical training window. Extra Trees hyperparameters were selected using RandomizedSearchCV with inner company-grouped cross-validation restricted to observations preceding the validation feature year. The selected model was refitted using the complete historical training window, and the classification threshold was selected from company-grouped out-of-fold predictions generated within the same window. The corresponding thresholds were 0.10, 0.13, 0.29 and 0.35 for the 2022, 2023, 2024 and 2025 feature-year cohorts. Results are reported in Supplementary Table S4b. All imputation and feature-construction parameters were re-estimated using that historical window.
Average precision and ROC-AUC were calculated from the predicted probabilities and were therefore unaffected by decision-threshold selection. Regression performance was assessed using R2and RMSE and compared with a baseline that assigned the historical-training-window mean maturity outcome to the held-out observations. Supplementary Table S4a reports annual and pooled estimates from the fixed-configuration specification. Supplementary Table S4b reports the annual results from the historically tuned specification. Pooled regression estimates calculated from the concatenated out-of-sample predictions across the four annual cohorts are reported separately in Supplementary Table S7, Panel C. The specifications were interpreted as complementary sensitivity analyses: S4a assessed temporal performance while holding model configuration constant, whereas S4b assessed performance when preprocessing and model selection were repeated using only information available before each validation cohort.
2.5. Feature Importance Analysis
To examine the dependence of held-out model predictions on the semantic representation and structured covariates, grouped permutation importance was evaluated for the classification and regression tasks. Importance was measured as the reduction in average precision for classification and the reduction in R2for regression after permutation of a predefined feature block within a held-out company-grouped validation fold. Each grouped permutation was repeated five times using different random seeds, and the resulting performance reductions were summarised across five GroupKFold validation folds. These folds maintained company-level separation but were used as a supplementary model-interpretation analysis rather than as part of the nested hyperparameter-selection procedure.
The initial feature-importance analysis had permuted each of the 768 embedding dimensions independently and summed the resulting marginal performance reductions. Because transformer-embedding dimensions are correlated, summing many separate marginal effects can accumulate finite-sample permutation noise and shared contributions, thereby inflating the apparent importance of the high-dimensional semantic representation relative to individual scalar features. The revised analysis therefore used grouped, or block, permutation importance. All 768 dimensions of the semantic representation were permuted simultaneously using the same row-permutation vector. This retained the internal structure of each donor embedding vector while breaking the joint relationship between the semantic representation and the outcome. Related scalar predictors were also evaluated as predefined blocks.
The full multimodal analysis comprised five feature blocks: the 768-dimensional semantic representation; baseline maturity, consisting of the feature-year score and its derived squared-score and missingness components; temporal dynamics, comprising feature year, active tenure and maturity velocity; policy alignment; and log-transformed reported funding. The semantic, baseline-maturity and temporal-dynamics blocks were each permuted jointly, while policy alignment and reported funding were permuted individually. Raw reductions in average precision or R2were treated as the primary importance estimates. For descriptive comparison, positive mean reductions were additionally normalised to sum to 100% within each task. Feature blocks with zero or negative mean reductions were assigned a normalised share of zero because their permutation did not impair held-out performance. These values describe predictive dependence within the fitted models and feature set and should not be interpreted as causal effects. As a sensitivity comparison, a restricted three-group specification comprising the semantic representation, feature year and log-transformed funding was analysed using both the original summed-marginal procedure and grouped block permutation. The comparison and the complete full-model grouped results are reported in Supplementary Table S5.
For the restricted three-group sensitivity analysis, the initial Extra Trees configurations were used for both tasks: the classification model used 200 estimators, a maximum depth of 15, a minimum split size of 2, a minimum leaf size of 2 and balanced_subsample weighting; the regression model used 300 estimators, unrestricted depth, a minimum split size of 2 and a minimum leaf size of 2. The full multimodal grouped analysis used an XGBoost classifier with 200 estimators, maximum depth 6, learning rate 0.05, row subsampling of 0.8 and feature subsampling of 0.8, and an Extra Trees regressor with 300 estimators, unrestricted depth, a minimum split size of 2 and a minimum leaf size of 2. Each model was refitted independently within each company-grouped training partition before permutation was applied to the corresponding held-out partition.
2.6. Entity Harmonisation, Descriptive Persistence and Maturity Trajectories
To construct a longitudinal dataset from heterogeneous and initially unstandardised horizon scans, a programmatic data-extraction and entity-harmonisation pipeline was developed. A central challenge was the fragmentation of company identities caused by changes and inconsistencies in corporate nomenclature across reporting years, including differences in punctuation, spacing, legal suffixes, parenthetical annotations and minor spelling variations. For example, the same organisation could be recorded as “Innovation X”, “Innovation X Ltd.” or a closely related orthographic variant in different scans. For construction of the principal dataset of 4,039 company-year profiles, raw company names were first normalised through lower-case conversion, punctuation removal, whitespace standardisation, and removal of common legal suffixes, including “Ltd”, “LLP”, “PLC” and “Inc”. Exact matches between normalised strings were resolved first. Remaining variants were compared using the full-string RapidFuzz fuzz.ratio similarity measure, with a threshold of 0.85. Candidate matches meeting the threshold were treated as potential links and reviewed using company and product names, technology descriptions and contextual information from the originating horizon scans. Records judged to represent the same organisation were assigned to a common canonical company identifier, while lexically similar but substantively distinct organisations were retained separately.
Entity-matching sensitivity was assessed by reconstructing the harmonised panel using full-string RapidFuzz fuzz.ratio thresholds of 0.80, 0.85, 0.90 and 0.95 while holding the source records, legal-name cleaning and company-year aggregation procedures constant. Similarity scores were normalised to a 0-to-1 scale. For each threshold, we calculated the number of canonical entities, company-year profiles and the prevalence of next-year reappearance. Canonical entities represent distinct harmonised organisations, whereas company-year profiles represent annual observations; a company observed in several years may therefore contribute multiple profiles. The threshold of 0.85 was selected following manual examination of 1,000 candidate record pairs sampled across the similarity-score distribution. Review considered the company and product names, technology descriptions and contextual information in the originating scans. Lower thresholds consolidated more name variants but increased false-positive linkage between distinct organisations. Higher thresholds retained more entities separately but failed to consolidate some genuine spelling, spacing, legal-name and product-vendor variants. Similarity was therefore used alongside contextual evidence rather than as the sole basis for resolving ambiguous records. Representative examples of consolidated and deliberately unmerged records are reported in Supplementary Table S2.
At the selected threshold, the automated sensitivity reconstruction produced 4,070 company-year observations. Final manual quality control removed 31 ineligible or duplicate observations, producing the 4,039-profile corpus used in the principal analysis. Because the alternative-threshold reconstructions were designed to isolate the effect of the similarity threshold, their reported profile counts precede this final record-level quality-control step. The complete sensitivity results are reported in Supplementary Table S3.
The empirical persistence analysis used a separate longitudinal dataset constructed from targeted annual follow-up files. This analysis was distinct from the principal entity-harmonisation procedure described in Section 2.1. The principal procedure was designed to determine whether heterogeneous records represented the same underlying organisation and therefore used legal-name normalisation, exact matching, full-string RapidFuzz fuzz.ratio similarity, and contextual review of company names, product names, technology descriptions and originating scan information. This context-rich procedure was appropriate for constructing canonical company identifiers and the company-year analytical panel. The annual follow-up files had a different structure and analytical purpose. They were designed to identify whether evidence associated with a previously observed company label remained identifiable in the next follow-up cycle, rather than to reconstruct canonical entities across the complete corpus. These files did not consistently contain the combination of product, technology-description and scan-context fields required to reproduce the contextual adjudication used in the principal harmonisation workflow. A label-based comparison was therefore required. Normalised company labels were compared across adjacent follow-up cycles using Python’s difflib.SequenceMatcher, supplemented by deterministic substring comparison, at a similarity threshold of 0.78. SequenceMatcher was selected for this descriptive task because it provides a transparent measure of character-sequence similarity for short name strings and can identify minor spelling, spacing and formatting differences when richer contextual fields are unavailable. The 0.78 threshold was selected as a pragmatic criterion for identifying likely continuity between adjacent-year labels while allowing for minor naming variation. Matches were interpreted as continued identifiability within the follow-up evidence, rather than definitive confirmation that two records represented the same legal entity.
SequenceMatcher was not used to construct canonical company identifiers, reconcile the principal company-year panel, define the supervised classification outcome, generate the maturity-regression target or modify the final dataset of 4,039 company-year profiles. The resulting persistence curve was treated as a separate descriptive analysis of continued visibility within the horizon-scanning evidence base and was not used to train, tune or evaluate the predictive models. The SequenceMatcher threshold of 0.78 and the normalised RapidFuzz fuzz.ratio threshold of 0.85 are not directly comparable. The algorithms calculate similarity differently, were applied to records containing different levels of contextual information, and addressed different analytical questions. The 0.78 threshold was therefore not a more permissive second stage of the principal entity-harmonisation workflow. Rather, RapidFuzz supported context-assisted canonical entity resolution for construction of the analytical panel, whereas SequenceMatcher supported a separate label-based assessment of descriptive persistence in structurally more limited follow-up files.
A further limitation was the intermittent absence of evidence for some companies during the longitudinal follow-up period. For descriptive presentation of companies recorded in non-consecutive years, missing intermediate maturity-score points were reconstructed through linear interpolation between directly observed scores. This procedure was used only to produce continuous descriptive maturity trajectories and was not used to generate predictive features or supervised outcomes. Interpolated values were identified separately from directly observed company-year scores and were not used to propagate information from a later observation backwards into the predictive feature vector of an earlier company-year profile. Consequently, the reconstructed trajectories should be interpreted as visual summaries assuming smooth change between observed scores, rather than as directly observed evidence of continuous organisational development. Accordingly, an interpolated point was never treated as an observed company-year record, was not eligible to define a classification or regression outcome, and did not contribute to model fitting, hyperparameter optimisation, historical decision-threshold selection or performance evaluation.
Building upon the separate longitudinal follow-up dataset, the framework evaluated continued corpus visibility and historical documented-maturity trajectories. Persistence duration was calculated for each matched company label as the inclusive interval between its initial and final identified appearances within the annual follow-up records. A non-parametric step-function analysis was used to estimate the proportion of followed innovations remaining represented across successive annual follow-up cycles. This was a descriptive analysis of continued visibility within the targeted evidence-collection process and was not interpreted as company survival, continued trading, clinical adoption, procurement or commercial success.
Descriptive documented-maturity trajectories were also generated for innovations represented in three or more annual follow-up records. The temporal evolution of their documented maturity scores was plotted to illustrate the evidence trajectories of repeatedly observed innovations. Directly observed scores were distinguished from interpolated points, and the trajectories were not used to validate continuous organisational progression or to classify innovations as objectively resilient, successful or mature.
2.7. Longitudinal Thematic Analysis of Horizon Scans
A longitudinal text-mining analysis was conducted to characterise changes in the terminology represented within the horizon-scanning corpus between 2015 and 2026. Horizon scans were available for 2015 and annually from 2019 onwards; no standalone horizon scans were available for 2016–2018. The 2015 cohort was retained as the earliest available baseline for the thematic analysis despite the absence of observations for the three subsequent years. The analysis used the unstructured descriptive text associated with each innovation record.
Term Frequency-Inverse Document Frequency (TF-IDF) vectorisation was applied to the annual text corpora. TF-IDF assigned each term a weight based on its frequency within the relevant annual corpus relative to its distribution across the complete corpus. Transformer-based document embeddings were used elsewhere in the analytical framework to represent broad semantic relationships, but exploratory clustering of the dense embeddings did not provide sufficiently specific annual descriptors for this analysis. TF-IDF was therefore used to identify clinical, technological and operational terms that were comparatively distinctive within each annual corpus. The resulting term weights were aggregated by year and ranked to generate annual linguistic profiles. The highest-weighted terms for each year were reviewed by the author and organised into descriptive clinical, technological and operational categories, including non-clinical operations, remote care, administrative workflows, oncology, cardiovascular health, cognitive health, women’s health, primary care and artificial intelligence. These labels were used to structure the descriptive results and were not treated as independently validated classifications or mutually exclusive topic assignments.
Annual linguistic profiles were compared to identify changes in the relative prominence of terms and descriptive categories across the available observation years. For presentation, the findings were organised into four periods: 2015–2019, 2020–2021, 2022–2023 and 2024–2026. These groupings were applied retrospectively to structure the results and were not treated as predefined developmental stages or statistically identified change points. The analysis was descriptive and exploratory. TF-IDF values represented the relative prominence of terms within the analysed corpus and were not interpreted as measures of market prevalence, clinical importance, technology performance or causal change. Differences in the number, scope, content and acquisition methods of the horizon scans across years may have affected the resulting term weights.
2.8. Agentic Synthesis
The multi-agent Large Language Model architecture functioned as a structured synthesis layer downstream of the statistical, semantic and machine-learning analyses. In this study, “agentic” referred to a role-separated workflow in which three specialist agents received predefined subsets of the structured analytical outputs and produced complementary interpretations that were subsequently consolidated by a Coordinator Agent and reviewed by a human. The architecture was implemented using Gemini 1.5 Flash. The agents did not independently retrieve evidence, generate model predictions, calculate maturity scores, determine regulatory compliance or decide which candidate themes would progress towards implementation or adoption. Role separation was used to divide the synthesis task into complementary analytical perspectives and to reduce the amount and variety of information processed within any individual prompt. Each specialist agent received a predefined subset of the structured analytical outputs and was instructed to interpret only those inputs relevant to its assigned perspective. The Coordinator Agent then compared the specialist outputs against the quantitative results, resolved inconsistencies and produced the consolidated synthesis. This architecture was intended to support structured interpretation and traceability.
The Innovation Progression Agent interpreted longitudinal changes in corpus composition, documented-maturity profiles and continued company visibility. The Policy & Ecosystem Agent interpreted candidate-theme clusters, their clinical, technological and operational characteristics, and their semantic correspondence with national policy documents. The Financial & Clinical Signal Agent contextualised funding, media, clinical, regulatory and maturity-related signals. The Coordinator Agent compared and consolidated the specialist outputs, resolved inconsistencies by reference to the supplied quantitative results, preserved uncertainty and replaced commercially sensitive company identities with generalised technological and clinical categories. Detailed de-identified role definitions and prompt templates are provided in Supplementary Note 1.
The agentic component was evaluated as a feasibility demonstration of structured synthesis. Its intended contribution was to organise and contextualise outputs from the preceding analytical stages, including longitudinal maturity profiles, semantic policy-alignment measures, predictive probabilities, candidate-theme clusters and external funding, clinical, regulatory and media signals. Role separation enabled these outputs to be considered from complementary perspectives before consolidation and supported more consistent coverage of the analytical domains. Bringing otherwise separate findings into a common structure also enabled convergent, divergent and potentially contradictory signals to be identified during human review. The wider AI-assisted workflow additionally supported repeatable enrichment of company-year profiles from multiple external sources, consistent application of predefined extraction and scoring rules, and longitudinal analysis of a corpus that would be resource intensive to update manually. The standardised company-year structure supported repeated updating while preserving the provenance and temporal context of the underlying evidence. These functions were intended to reduce the burden of evidence collation, reconciliation and first-pass synthesis and to provide an auditable starting point for expert review. Comparative improvements in time, cost, accuracy or analytical quality relative to conventional manual horizon scanning were not evaluated in this study.
The consolidated synthesis was reviewed by the lead author, who had access to the specialist-agent outputs, the Coordinator Agent output and the structured analytical materials supplied to the agents and had relevant experience in NHS digital-health horizon scanning and evidence synthesis. This was an internal, author-led review rather than an independent clinical, regulatory, procurement or horizon-scanning assessment. Numerical statements were compared with the corresponding tables, figures and model outputs, while thematic descriptions were checked against the HDBSCAN clusters, TF-IDF terms and de-identified source summaries. Statements were retained when they were traceable to the supplied inputs, numerically consistent and appropriately qualified. They were revised when their wording exceeded the strength of the evidence or required additional uncertainty or alternative explanations. Statements were removed when they lacked traceable support, introduced unverified causal or regulatory claims, disclosed commercially sensitive information or presented candidate themes as procurement, funding or implementation recommendations.
Human review resulted in substantive changes to the interpretation and decision-use framing of the synthesis rather than solely grammatical or stylistic editing. Claims concerning market growth, policy endorsement, regulatory readiness and procurement priority were removed or reframed as areas for further evidence review. Detailed technological content was retained where it was traceable to the supplied analytical inputs. A formal statement-level quantitative count of retained, revised and removed claims was not undertaken. Supplementary Note 2 is divided into two parts: Part A presents the reviewed agentic synthesis, while Part B documents source attribution, the human-review procedure, factuality and consistency checks, interpretive safeguards and limitations.
3. Results and Discussion
3.1. Dataset Composition, Documented Maturity and Entity-Matching Sensitivity
Analysis of the longitudinal dataset comprising 4,039 company-year profiles derived from 123 horizon scans showed substantial variation in the number of digital-health innovation profiles represented across the available observation years (Figure 1a). Initial observations included 99 unique innovations in 2015, rising to 389 in 2019, before declining to 124 in 2020 and 25 in 2021. The number of innovation profiles subsequently increased, reaching 723 in 2024 and a maximum of 1,750 in 2026. These figures describe the volume of innovations captured by the available horizon scans and should not be interpreted directly as changes in digital health market participation. The observed distribution may reflect variation in the number, scope, objectives, and data-acquisition methods of the scans conducted in each year.
The aggregate distribution of composite documented-maturity scores was strongly right-skewed (Figure 1b). Nearly 2,500 company-year profiles received a baseline maturity score of zero, while the overall mean was 0.59. The seventy-fifth percentile was 1.00 on the 0-to-8 scale, indicating that the maturity evidence documented for most profiles was limited. Only a small proportion of records contained evidence corresponding to the higher levels of interoperability, implementation scope, realised benefits or regulatory compliance captured by the scoring framework. These values describe maturity-related evidence documented in the available company-year dossiers rather than independently verified assessments of each innovation’s developmental stage.
A preliminary manual concordance assessment was conducted using 100 standardised company-year dossiers. A second reviewer with relevant digital-health evaluation expertise applied the maturity-scoring rubric while blinded to the automated scores, predictive-model outputs and subsequent outcomes. The independently assigned total scores were broadly consistent with the automated scores, with differences of no more than 0.5 points on the 0-to-8 scale. The greatest variation concerned implementation scope, which was the most heterogeneous dimension and required interpretation of evidence ranging from pilots and limited deployments to multisite implementation and routine use. This preliminary review supported manual-programmatic concordance within the reviewed sample while identifying implementation scope as the dimension most likely to require further rubric refinement.
The relationship between log-transformed reported funding and documented-maturity scores was weak (Figure 1c). Bivariate analysis showed a negligible negative linear correlation (r = −0.09). Company-year profiles with maturity scores between 0 and 4 were distributed across the observed funding range. Within this dataset, reported funding was therefore not strongly associated with the documented-maturity score.
The annual box-plot distributions further illustrated variation in the recorded maturity scores across the observation period (Figure 1d). In the 2015 cohort, the interquartile range extended from 1.0 to 2.0, the median was approximately 1.5, and the highest outlier reached 5.0. The median maturity score was zero in each annual cohort from 2020 to 2026. This indicates that at least half of the company-year profiles in each of these cohorts received no points under the documented maturity criteria. In 2021 and 2022, the distributions were comparatively narrow, with maximum observed scores of 0.5 and 1.0, respectively. Higher-scoring profiles were observed more frequently from 2023 onwards, with maximum scores of 2.5 in 2023 and 4.0 in 2024. In 2025, the upper quartile reached 1.0 and the maximum observed score reached 6.0. In 2026, the upper quartile increased to 1.5, while a group of higher-scoring profiles recorded values between 4.0 and 5.5. The later cohorts therefore combined a large concentration of profiles with little qualifying documented-maturity evidence and a smaller group with substantially higher scores.
The interpretation of these longitudinal distributions must account for differences in the coverage and acquisition of the underlying horizon scans. The relatively high median maturity score in 2015 was derived from a cohort of 99 innovation profiles and may reflect differences in the scope or selection criteria of the scans available for that year. Conversely, the much larger cohorts captured in later years may include a broader range of innovations, including records containing limited evidence of implementation, realised benefits, interoperability, or regulatory status. The increasing number of profiles represented in the later cohorts may also reflect changes in scanning capacity, source availability, search scope, and data-retrieval methods rather than expansion of the underlying digital health market alone. Accordingly, annual differences in innovation volume and maturity scores cannot be attributed solely to changes in the development of the digital health landscape. The maturity distributions should be interpreted as characteristics of the innovation evidence captured within each annual corpus. Differences in annual corpus composition may therefore partly explain the lower median scores and broader range of documented maturity evidence observed in the later cohorts.
Entity-matching sensitivity analysis demonstrated the expected trade-off between consolidation and separation of entity records (Supplementary Table S3). At the selected full-string similarity threshold of 0.85, the automated sensitivity reconstruction contained 2,326 canonical entities and 4,070 company-year observations, with a next-year reappearance prevalence of 23.90%. Following the final manual exclusion of 31 ineligible or duplicate observations, 4,039 company-year profiles remained in the principal analytical corpus. Canonical entities represent unique harmonised organisations, whereas company-year profiles represent annual observations; one entity may therefore contribute several profiles across the observation period.
Lowering the threshold to 0.80 consolidated more name variants, producing 2,204 canonical entities and 3,950 company-year profiles, with a reappearance prevalence of 25.04%. This more permissive configuration increased the risk of combining distinct organisations with lexically similar names. Increasing the threshold to 0.90 produced 2,353 canonical entities and 4,078 profiles, with a reappearance prevalence of 23.36%. At 0.95, the reconstruction contained 2,373 canonical entities and 4,080 profiles, with a prevalence of 22.96%. Panel size was therefore relatively stable between thresholds of 0.85 and 0.95, with the number of company-year profiles varying by ten observations and reappearance prevalence by 0.94 percentage points. However, stricter thresholds separated some genuine spelling, spacing, legal-name and product-vendor variants that had been correctly linked at 0.85.
The 0.85 threshold was retained following manual examination of 1,000 candidate record pairs. This review considered company names, product names, technology descriptions and scan context and indicated that 0.85 provided the preferred balance between consolidating genuine variants and retaining distinct organisations separately. The sensitivity results nevertheless showed that reappearance estimates remained partly dependent on entity-reconciliation choices, and this uncertainty was considered when interpreting the longitudinal findings. The reappearance prevalence reported in this sensitivity analysis was calculated across all eligible checkpoint company-year observations. It therefore pertains specifically to the entity-harmonisation sensitivity dataset.
3.2. Longitudinal Thematic Evolution of the Digital Health Landscape (2015–2026)
A longitudinal TF-IDF analysis identified changes in the relative prominence of clinical, technological, and operational terminology across horizon scans. During 2015–2019, the 2015 linguistic profile was characterised by broad health-service and non-clinical terminology. Prominent themes included workforce management, staff rostering, clinical documentation, and speech-recognition applications. This indicates that a substantial proportion of the innovations represented in 2015 addressed organisational and operational functions instead of named clinical conditions. This profile occurred during the early implementation of the Personalised Health and Care 2020 framework, which identified digital services, general practice transformation, out-of-hospital care, paper-free healthcare, system transactions, and the use of data for outcomes and research as national areas for action.
By 2019, the linguistic profile included terminology relating to mobile applications and supply-chain management, demonstrating the continued representation of both patient-facing digital interfaces and operational technologies. The terms outcomes and evidence were also prominent, with outcomes reaching an aggregated TF-IDF score of 107.91. This shows that descriptions of innovations in the 2019 corpus frequently referred to evidence and outcomes, although the analysis cannot determine whether this reflected changes in the technologies, changes in horizon-scanning criteria, or differences in how innovations were described. The NHS Long Term Plan, published in January 2019, placed emphasis on digital access, digitally enabled primary care, earlier diagnosis, prevention, mental healthcare, cancer, cardiovascular disease, dementia, and the potential application of AI. It also proposed a digital front door to NHS services and digital GP consultations for patients who wanted them. A general practice agreement published later that month supported digital appointments and introduced a patient right to web and video consultations by 2021.
During 2020–2021, the thematic profile changed from the combination of enterprise, application, and evidence-related terminology. In 2020, the most prominent terms included monitor (13.25), home (12.84), video (11.07), and remote (10.63), which indicates that remote communication, monitoring, and home-based care formed a distinct component of the innovations represented in that year’s corpus. Mental health terminology was also present, including references to anxiety and children and young people. The mental health content captured in 2020 was therefore relatively broad and population-focused.
The 2020 concentration of remote and home-monitoring terminology coincided with the national expansion of COVID Oximetry @home and COVID virtual wards. NHS England subsequently documented that virtual wards had already operated in some areas but were expanded as part of the NHS response to COVID-19, using pulse oximetry, remote monitoring, regular clinical contact, and supported discharge. The 2021 profile placed greater emphasis on service access, coordination, and operational processes. Prominent terms included triage (2.49), management (2.45), appointment (2.37), and patient flow (1.29). Compared with the remote-care terminology observed in 2020, the leading 2021 terms were more closely associated with managing entry into services, appointments, pathways, and movement through care settings. Condition-specific diagnostic terminology was less prominent among the leading terms reported for that year. The rollout of COVID virtual wards was recommended nationally in January 2021, and NHS England published guidance for establishing technology-enabled virtual wards in December 2021. The Digital Clinical Safety Strategy, published in September 2021, also established a national direction for maintaining and improving the safety of digital technologies that had expanded during this period.
During 2022–2023, the leading terminology became more condition-specific and clinically focused. The 2022 profile contained a strong concentration of oncology-related terms, including cancer (44.47), breast (17.09), diagnostic (16.21), and detection (15.32). This represented a difference from the predominantly administrative and pathway-management terminology observed in 2021. At the same time, remote and home-based care became more formally incorporated into national NHS planning. NHS England’s 2022/23 operational planning guidance established an expectation of 40–50 virtual ward beds per 100,000 people, while national implementation guidance defined virtual wards as services for patients who would otherwise require a secondary-care bed.
In 2023, the clinical profile was distributed across a wider set of themes. Women’s health-related terminology reached an aggregated TF-IDF score of 15.12. Cardiovascular health was also identifiable in 2023, with risk reaching a TF-IDF score of 13.70 in the context of cardiovascular risk stratification. Comparison of 2022 and 2023 indicates a broadening of condition-specific clinical terminology. The 2022 profile was concentrated primarily around cancer, breast applications, diagnosis, and detection, whereas the 2023 profile included women’s health, cardiovascular risk, and primary care. Both years contained more condition-specific terminology among their leading terms than the operational profile reported for 2021.
During 2024–2026, the annual profiles continued to contain condition-specific terminology, although the conditions and technological functions represented varied by year. In 2024, dementia reached a TF-IDF score of 51.21 and cognitive reached 45.05. Compared with the broader references to mental health, anxiety, and children and young people observed in 2020, the 2024 profile contained more condition-specific and assessment-oriented cognitive terminology. The 2025 profile contained a prominent cardiovascular theme. The term heart reached a TF-IDF score of 24.72, with associated descriptions referring to heart failure, atrial fibrillation, and continuous telemetry. This differed from the cardiovascular terminology captured in 2023, which focused more prominently on risk stratification. Across the two years, the descriptive focus of cardiovascular innovations therefore changed from risk-related terminology in 2023 towards named cardiac conditions and continuous monitoring in 2025. National cardiac transformation activity in 2025 included work on heart failure management at home and in the community, rapid treatment optimisation, integration between primary care and cardiology, and incorporation of heart-failure pathways into electronic patient records.
In 2026, mental, cognitive, and neurodevelopmental terminology remained prominent, but its focus differed from the dementia-related profile observed in 2024. Attention deficit hyperactivity disorder formed a substantial thematic cluster, with descriptions relating to ADHD assessment or diagnosis. Across the available years, the broader mental and cognitive health category therefore included general mental health and anxiety-related applications in 2020, dementia and cognitive assessment in 2024, and ADHD-focused applications in 2026. Artificial intelligence-related terminology was particularly prominent in 2026. AI was the highest-weighted term, with an aggregated TF-IDF score of 306.49, while clinical and data reached 150.44 and 140.57, respectively. These values show that AI, clinical, and data terminology were major components of the 2026 linguistic profile. Their simultaneous prominence occurred in a corpus that also contained ADHD diagnostics, prostate imaging, MRI algorithms, and other condition-specific applications.
Across the full observation period, there was an increase in the specificity of clinical terminology. The 2015 and 2019 profiles contained substantial enterprise, workforce, documentation, application, supply-chain, outcomes, and evidence terminology. The 2020 and 2021 profiles were characterised respectively by remote or home-based care and by service access and pathway management. From 2022 onwards, the leading annual terms more frequently referred to named diseases, populations, diagnostic functions, clinical settings, or specific technological applications. These included cancer and breast detection in 2022, women’s health, cardiovascular risk, and primary care in 2023, dementia and cognitive assessment in 2024, heart failure, atrial fibrillation, and continuous telemetry in 2025, and ADHD, prostate imaging, MRI algorithms, and AI in 2026.
3.3. Semantic Segmentation and Principal Component Analysis
To further examine the semantic organisation of the longitudinal corpus, PCA was applied to the 768-dimensional document embeddings to visualise relationships between broad categories of digital health innovation. Principal Component 1 explained 19.93% of the variance, while Principal Component 2 explained 7.38%, giving a cumulative explained variance of 27.31% for the two-dimensional projection. As illustrated in Figure 2a, a distinct cluster containing non-clinical innovations was visible along the negative axis of the first principal component. However, the distribution of the non-clinical cohort (n = 2,024) was divided across the projection. One subset formed a dense cluster along the negative axis, while another was dispersed across the semantic space occupied by the clinical innovations on the positive axis. The clinical categories, including oncology, cardiovascular health, neurology, and mental health, showed substantial overlap within the two-dimensional projection and did not form clearly separated clusters.
The non-clinical cohort was subsequently examined separately to characterise the functional categories contributing to its divided distribution (Figure 2b). The records were stratified into three descriptive themes: Corporate, Operations, and Clinical Operations [31]. The Corporate category encompassed administrative and infrastructural functions, including human resources, finance, and estates. The Operations category included logistical workflows such as booking, scheduling, and broader operational management. The Clinical Operations category comprised solutions that supported the delivery or coordination of care without directly providing clinical interventions, including patient interaction platforms, clinical communication systems, and medical transcription applications.
The isolated cluster along the negative axis was populated predominantly by Corporate and Operations solutions. In contrast, Clinical Operations innovations were located mainly within the right-hand region of the projection and overlapped with the principal clinical space. This distribution is consistent with differences in the language used to describe the three non-clinical categories. Clinical Operations records contained terminology associated with care delivery, patient interactions, clinical communication, medical documentation, and healthcare information systems. Their embeddings therefore shared semantic features with records describing clinical technologies. Corporate and Operations records were more frequently described using administrative, financial, workforce, estates, scheduling, and logistical terminology. Their concentration within the negative-axis cluster indicates that these records had a distinguishable linguistic profile within the first two principal components. The analysis therefore identified a broad semantic distinction between enterprise-oriented functions and innovations described using clinical or care-delivery terminology.
The overlap between Clinical Operations and clinical innovations also shows that a binary clinical versus non-clinical classification does not fully represent the semantic structure of the corpus. Clinical Operations occupied an intermediate analytical position: the applications did not directly provide diagnosis or treatment, but their descriptions frequently used language associated with clinical pathways and care delivery. This finding supports the use of functional subcategories when interpreting the longitudinal horizon-scanning corpus.
3.4. Predictive Framework Architecture and Performance Evaluation
The predictive component of the horizon-scanning methodology integrated multimodal evidence within a unified machine-learning pipeline (Figure 3). Unstructured inputs included historical horizon-scan descriptions, media coverage, clinical-trial records and temporally eligible external evidence incorporated into each company-year dossier. These inputs were transformed into semantic representations using a sentence-transformer model and combined with structured company-year features, including log-transformed reported funding, baseline documented maturity, active tenure, maturity velocity and contemporaneous semantic policy alignment. The resulting feature matrix represented information available for each company-year observation in feature year tand was used for two complementary tasks. The classification task estimated next-year corpus reappearance, defined in Section 2.4 as the presence of the same canonical company in at least one eligible horizon scan in year t + 1. The regression task estimated the directly observed documented maturity score one year ahead.
In the initial non-nested company-grouped analysis, model benchmarking showed differences in performance between the evaluated classification architectures and the simple baseline references reported in Table 2a. The positive outcome, defined as company reappearance in the subsequent annual horizon-scanning cycle, accounted for 34.79% of observations. This differs from the prevalence reported in the entity-harmonisation sensitivity analysis because that analysis included all eligible checkpoint company-year observations rather than the final outcome-eligible modelling sample. At this prevalence, an all-positive classifier would achieve an F1-score of approximately 0.52, the no-skill average-precision reference was approximately 0.35, and random discrimination corresponded to a ROC-AUC of 0.50. Random Forest and Extra Trees achieved the highest mean F1-scores, at 0.85 ± 0.17 and 0.85 ± 0.16, respectively, representing an absolute improvement of 0.33 over the all-positive reference. XGBoost achieved a mean F1-score of 0.83 ± 0.17, while Logistic Regression achieved 0.72 ± 0.15; both also exceeded the all-positive reference.
For future maturity-score prediction, the mean-prediction baseline achieved an R2of −0.006 ± 0.006 and an RMSE of 1.277 ± 0.143. In comparison, the fitted regression models achieved mean R2values of 0.58–0.59 and RMSE values of 0.52–0.53. The lowest fitted-model RMSE of 0.52 represented an absolute reduction of 0.757, or approximately 59%, relative to the mean-prediction baseline. The fitted regression models therefore demonstrated predictive performance beyond assigning the training-fold mean maturity score to held-out companies.
These results indicate that the models provided useful identification of the positive class relative to the prevalence-based average-precision reference and the approximate all-positive F1 baseline, particularly at the selected classification threshold. However, the mean ROC-AUC values, which ranged from 0.58 to 0.63, indicate limited ability to discriminate consistently between companies that did and did not reappear across the complete range of predicted probabilities. The comparatively large standard deviations across the classification metrics also indicate substantial variation in performance between cross-validation folds.
Random Forest and XGBoost achieved the highest mean average-precision scores, at 0.61 ± 0.15 and 0.61 ± 0.18, respectively, representing an absolute improvement of 0.26 over the prevalence-based no-skill reference. Logistic Regression achieved an average precision of 0.60 ± 0.15, followed by Extra Trees at 0.59 ± 0.16. Logistic Regression achieved the highest mean ROC-AUC, at 0.63 ± 0.14, followed by XGBoost at 0.59 ± 0.19, while Random Forest and Extra Trees achieved 0.58 ± 0.18 and 0.58 ± 0.16, respectively. Improvements in ROC-AUC were therefore more modest than those observed for F1-score and average precision. In the regression task, XGBoost achieved the highest mean coefficient of determination, with an R² of 0.59 ± 0.04 and an RMSE of 0.52 ± 0.01. Random Forest achieved an R² of 0.58 ± 0.04 and an RMSE of 0.52 ± 0.02. Extra Trees achieved an R² of 0.58 ± 0.03 and an RMSE of 0.53 ± 0.03, while Ridge Regression achieved an R² of 0.58 ± 0.02 and an RMSE of 0.53 ± 0.03. The similarity of the mean results across linear and tree-based approaches indicates that comparable predictive performance was obtained using models of differing complexity. XGBoost achieved the highest mean explained variance and, together with Random Forest, the lowest mean RMSE, although the overlapping variability across models does not establish a clear performance advantage. The initial non-nested classification results showed a marked difference between threshold-dependent and threshold-independent performance. F1 was calculated after converting predicted probabilities into binary classifications at the operating threshold, whereas ROC-AUC evaluated ranking across the complete probability distribution. The high initial F1 values, more modest ROC-AUC values and comparatively large fold-to-fold standard deviations therefore indicated sensitivity to the selected operating point and validation-fold composition. In addition, the same company-grouped cross-validation structure informed both hyperparameter selection and performance reporting, allowing model configurations and decision behaviour to become adapted to those particular folds. The initial estimates were consequently considered susceptible to model-selection optimism and were retained for methodological transparency rather than used as the principal performance estimates.
Under nested company-grouped cross-validation, XGBoost achieved the strongest and most balanced classification performance at the default probability threshold of 0.50, with precision of 0.712 ± 0.046, recall of 0.632 ± 0.066, F1 of 0.669 ± 0.049, ROC-AUC of 0.891 ± 0.022and average precision of 0.715 ± 0.037. Positive-class prevalence ranged from 22.7% to 26.0% across the five held-out outer folds. Logistic Regression achieved precision of 0.629 ± 0.060, recall of 0.389 ± 0.031, F1 of 0.480 ± 0.039, ROC-AUC of 0.824 ± 0.024 and average precision of 0.605 ± 0.049. Random Forest and Extra Trees retained ROC-AUC values of 0.851 ± 0.025and 0.822 ± 0.029, respectively, but their recall at the same 0.50 threshold was substantially lower, at 0.167 ± 0.095and 0.111 ± 0.024. Their corresponding F1 scores of 0.257 ± 0.112 and 0.190 ± 0.038 therefore reflected conservative classification at the selected operating threshold rather than an absence of ranking information. Complete fold-level validation-set sizes, positive-class prevalences, operating thresholds, precision, recall, F1, average precision and ROC-AUC are reported in Supplementary Table S6.
For future documented maturity, the training-fold mean baseline achieved R2 = −0.013 ± 0.018 and RMSE = 1.252 ± 0.136, while the direct carry-forward comparator achieved R2 = 0.266 ± 0.186and RMSE = 1.046 ± 0.113. Extra Trees achieved the strongest fitted-model performance, with R2 = 0.400 ± 0.098and RMSE = 0.955 ± 0.080. Relative to direct carry-forward, Extra Trees increased mean R2by 0.134 and reduced mean RMSE by 0.091. XGBoost and Random Forest also improved on carry-forward, achieving R2 = 0.351 ± 0.090and 0.325 ± 0.106, respectively, whereas Ridge Regression did not, with R2 = 0.157 ± 0.197. These results showed that persistence in baseline documented maturity was a strong comparator, while the stronger tree-based models retained additional predictive information beyond Stalone. Complete comparisons are reported in Supplementary Table S7, Panel A.
The initial non-nested and revised nested analyses produced different performance estimates. This difference was expected because the initial procedure used the same company-grouped cross-validation structure for hyperparameter selection and performance reporting, whereas the nested procedure reserved each outer fold exclusively for evaluation. Although company grouping in the initial analysis prevented records from the same organisation appearing in both training and validation partitions, repeated use of the grouped folds during model selection could favour configurations that performed well on those particular partitions. The higher initial estimates were therefore interpreted as susceptible to model-selection optimism. Table 2a was retained for methodological transparency, to document the original analytical specification and demonstrate how reported performance changed when hyperparameter selection was separated from outer-fold evaluation. It was not treated as a second, equally authoritative estimate of model performance. The nested outer-fold results in Table 2b were given interpretive priority because hyperparameter selection and fold-internal preprocessing were restricted to the corresponding outer-training partition. Nested company-grouped validation also had important limitations. The procedure did not preserve chronological ordering and could include later-year observations in training when evaluating a different company observed in an earlier year. It therefore assessed generalisation to previously unseen companies within the pooled multi-year corpus rather than prospective performance in a future scanning cycle. Each model was also trained on only the companies available in its outer-training partition, and the hyperparameter search was restricted to eight candidate configurations per model. The nested results should consequently be interpreted as less selection-biased internal estimates of company-level generalisation, not as external or prospective validation. Rolling-origin validation addressed the separate question of temporal transportability by restricting model development to preceding feature years. The validation designs were therefore interpreted together: Table 2b assessed transfer to unseen companies within the assembled corpus, while Supplementary Tables S4a and S4b assessed transportability to subsequent annual cohorts under changes in scanning scope, outcome prevalence and model-development specification.
Rolling-origin validation using the prespecified Extra Trees configurations provided a complementary assessment in which the classification and regression configurations were held constant across annual cohorts (Supplementary Table S4a). At the default probability threshold of 0.50, annual classification F1 ranged from 0.048 to 0.300, and pooled F1 across 1,654 out-of-sample predictions was 0.213. Applying decision thresholds selected within each historical training window increased annual F1 to between 0.080 and 0.603 and increased pooled F1 to 0.486. Annual average precision ranged from 0.203 to 0.750 and annual ROC-AUC from 0.507 to 0.708. Pooled average precision was 0.598 and pooled ROC-AUC was 0.749.
The strongest annual ranking performance occurred in the 2023 and 2024 feature-year cohorts, both of which achieved ROC-AUC values of 0.708. Their average-precision scores were 0.484 and 0.389, compared with positive-class prevalence baselines of 0.198 and 0.205, respectively. In the 2025 cohort, average precision was 0.750 against a prevalence of 0.724, while ROC-AUC was 0.507. The high absolute average precision in that cohort therefore largely reflected the high positive-class prevalence rather than strong within-cohort discrimination. For future documented maturity, annual R2ranged from 0.037 to 0.363, and model RMSE remained lower than the corresponding historical-training-window mean baseline in all four cohorts. Across 534 pooled out-of-sample predictions, R2was 0.271 and RMSE was 1.050. The pooled estimates combined cohorts with substantially different prevalence, scan coverage and composition and were therefore interpreted alongside the annual results.
The historically tuned rolling-origin specification provided a strict assessment of performance under chronological conditions, with preprocessing, hyperparameter selection, model fitting and decision-threshold selection restricted to the corresponding historical training window (Supplementary Table S4b).
At the default probability threshold of 0.50, annual classification F1-scores ranged from 0.048 to 0.421. Average precision ranged from 0.200 to 0.746, while annual ROC-AUC ranged from 0.510 to 0.709. The difference between the threshold-independent ranking metrics and thresholded F1 indicated that the default 0.50 operating point was not consistently aligned with the outcome distributions in the annual validation cohorts. For each validation cohort, the classification decision threshold was selected using company-grouped out-of-fold predictions generated exclusively within the corresponding historical training window. The selected thresholds were 0.10, 0.13, 0.29 and 0.35 for the 2022, 2023, 2024 and 2025 feature-year cohorts, respectively. Applying these historically selected thresholds increased annual F1 to between 0.218 and 0.669. The held-out feature-year cohort and its t + 1outcomes were not used during preprocessing, hyperparameter selection, model fitting or decision-threshold selection, preserving chronological separation between model development and evaluation.
Historical decision-threshold selection improved binary classification performance but did not alter the underlying predicted probabilities, average precision or ROC-AUC. The strongest within-cohort ranking performance occurred in the 2023 and 2024 feature-year cohorts. The 2023 cohort achieved average precision of 0.489 and ROC-AUC of 0.709, while the 2024 cohort achieved average precision of 0.374 and ROC-AUC of 0.680. These values exceeded the corresponding positive-class prevalence baselines of 0.198 and 0.205, indicating that the models retained some ability to rank companies by subsequent corpus reappearance in these cohorts. Discrimination was more limited in the 2022 and 2025 cohorts, where ROC-AUC values were 0.517 and 0.510, respectively. In the 2025 cohort, average precision was 0.746 against a positive-class prevalence of 0.724. Its high absolute average precision therefore largely reflected the high proportion of positive outcomes rather than strong separation between companies that did and did not reappear. Historical threshold selection nevertheless increased F1 in this cohort from 0.421 to 0.669. This improvement reflected selection of a more appropriate binary operating point and should not be interpreted as an improvement in probability ranking.
The prevalence of next-year corpus reappearance varied from 15.4% in the 2022 feature-year cohort to 72.4% in the 2025 cohort evaluated against 2026 outcomes. This substantial change coincided with differences in scan coverage and commissioning scope, including the broader 2026 evidence base, which contained 66 of the 123 included horizon scans. The observed reappearance outcome therefore reflected both company-level information and the opportunities for reappearance created by the composition and intensity of annual scanning activity. The year-specific estimates were consequently treated as the primary measures of chronological transportability.
Forward-validation performance for future documented maturity also varied between annual cohorts. Regression included only company-year observations with a directly observed maturity score at t + 1. Annual R2values ranged from 0.044 to 0.415, and model RMSE was lower than the historical-training-mean baseline in all four cohorts. For the 2022 feature-year cohort, RMSE decreased from 1.204 for the baseline to 0.883, with R2 = 0.181. For the 2023 cohort, RMSE decreased from 1.044 to 0.795, with R2 = 0.415. The 2024 cohort showed the smallest improvement, with RMSE decreasing from 1.156 to 1.086 and R2 = 0.044. For the 2025 feature-year cohort evaluated against 2026 outcomes, RMSE decreased from 1.363 to 1.078, with R2 = 0.311. These findings indicated that the historical feature representation contained information associated with subsequent documented maturity beyond the historical-mean baseline, although performance remained dependent on the annual cohort and historical training window.
Comparison with direct carry-forward showed substantial variation between annual cohorts. In the 2022 feature-year cohort, carry-forward achieved R2 = 0.686and RMSE = 0.547, outperforming both the fixed-configuration model, for which R2 = 0.247and RMSE =0.846, and the historically tuned model, for which R2 = 0.181 and RMSE = 0.883. The fitted models outperformed carry-forward in the 2023, 2024 and 2025 cohorts, although the difference was minimal in 2024. Across 534 pooled out-of-sample predictions, carry-forward achieved R2 = 0.251and RMSE = 1.064, compared with R2 = 0.271and RMSE = 1.050for the fixed-configuration model and R2 = 0.281and RMSE = 1.04 3for the historically tuned model. The fitted models therefore provided only modest pooled improvement beyond persistence under chronological validation, and this improvement was not consistent across all annual cohorts. Complete results are reported in Supplementary Table S7, Panels B and C.
The two rolling-origin specifications produced consistent overall conclusions but differed in some annual operating-point estimates. Historically tuned F1 was higher than the fixed-configuration result in the 2022, 2023 and 2025 cohorts, increasing from 0.080 to 0.218, from 0.394 to 0.482 and from 0.603 to 0.669, respectively. In the 2024 cohort, it decreased from 0.438 to 0.396. Repeating hyperparameter selection within each historical window therefore did not uniformly improve performance.
Threshold-independent discrimination remained cohort-dependent under both specifications. The 2023 ROC-AUC was almost unchanged, at 0.708 under the fixed configuration and 0.709 after historical retuning. In 2024, ROC-AUC decreased from 0.708 to 0.680, while discrimination remained close to random in 2025, at 0.507 and 0.510. These results indicate that annual variation could not be resolved solely through historical hyperparameter optimisation. The two specifications have complementary strengths and limitations. Holding the model configuration constant in Supplementary Table S4a supported controlled comparison between annual cohorts and allowed pooled prediction summaries. Historical-window optimisation in Supplementary Table S4b provided a stricter simulation of annual model redevelopment, but repeated model selection may be less stable in the smaller early training windows and was limited to eight sampled hyperparameter configurations per model.
The nested company-grouped and rolling-origin validation designs addressed different forms of generalisation. Nested company-grouped cross-validation evaluated performance for companies withheld from training within the pooled multi-year corpus while separating inner hyperparameter selection from outer-fold performance estimation. Rolling-origin validation assessed temporal transportability to subsequent annual cohorts under changing scan coverage, commissioning scope and outcome prevalence, with all model-development procedures restricted to preceding years. The stronger nested company-grouped results were therefore not interpreted as equivalent to prospective annual performance. Conversely, the more variable chronological estimates did not negate the company-level predictive associations observed within the pooled corpus.
To examine the feature blocks contributing to held-out predictions, grouped permutation importance was calculated for the classification and regression tasks. All 768 embedding dimensions were permuted simultaneously as one semantic block, while related scalar predictors were grouped into baseline-maturity and temporal-dynamics blocks. Raw reductions in average precision and R2were treated as the primary importance estimates, with positive mean reductions additionally normalised within each task for descriptive comparison.
In the full multimodal classification analysis, permutation of the temporal-dynamics block reduced average precision by 0.4215 ± 0.0332, corresponding to 92.4% of the normalised positive importance. Joint permutation of the semantic block reduced average precision by 0.0340 ± 0.0326, corresponding to 7.4%, while the baseline-maturity block accounted for 0.1%. Policy alignment and log-transformed reported funding produced no measurable mean reduction in average precision. Next-year corpus-reappearance predictions therefore depended predominantly on the temporal variables available to this fitted model. For future documented maturity, permutation of the baseline-maturity block reduced R2by 0.5222 ± 0.1369, corresponding to 75.6% of the normalised positive importance. Joint permutation of the semantic block reduced R2by 0.0898 ± 0.0425, corresponding to 13.0%, while permutation of the temporal-dynamics block reduced R2by 0.0790 ± 0.0242, corresponding to 11.4%. Policy alignment and log-transformed reported funding produced no measurable mean reduction. The regression model therefore depended primarily on documented maturity information already available in the feature year, with smaller incremental contributions from the semantic and temporal representations.
The grouped results changed the interpretation of the initial feature-importance analysis. In the reconstructed three-group sensitivity analysis, the normalised semantic contribution to classification decreased from 85.7% under summed marginal aggregation to 62.3% under block permutation. For regression, it decreased from 83.0% to 81.9%. These results support the reviewer’s concern that summing marginal effects across correlated embedding dimensions can overstate the semantic contribution, particularly in the classification task. The restricted three-group analysis and the full multimodal analysis addressed different feature specifications. The restricted analysis isolated the effect of replacing summed marginal importance with grouped block permutation while retaining the same three feature categories. The full multimodal analysis provided the preferred substantive interpretation because it evaluated the semantic representation alongside the complete set of structured feature blocks.
Permutation importance describes the dependence of predictions on feature blocks within the fitted models and does not establish causal relationships. The high regression importance of baseline maturity is also expected because the task estimated the subsequent value of the same documented-maturity construct. The semantic contribution may partly reflect documentary signals associated with the study-defined scoring framework rather than independently verified organisational development. These feature-importance estimates were calculated across held-out company-grouped folds using the specified fitted pipelines. They were not repeatedly recalculated within every nested hyperparameter-selection loop or rolling-origin window and should therefore be interpreted as a supplementary model-interpretation analysis rather than nested-validation performance estimates.
The application of the regression framework is illustrated through the longitudinal profile of a representative digital-health innovation (Figure 4c). Directly observed and separately identified interpolated maturity scores were plotted alongside the held-out one-year-ahead prediction. The model estimated an increase from a feature-year documented-maturity score of 0.0 to 2.2 in 2026. This example illustrates how the model supplemented the historical documentary trajectory with a subsequent-year estimate; it was not presented as evidence of actual organisational progression.
To extend the company-level predictions towards thematic identification, HDBSCAN clustering and TF-IDF term extraction were applied to the semantic representations of companies predicted to reappear in the subsequent horizon-scanning cycle (Figure 4d). This analysis generated candidate-theme clusters for subsequent investigation rather than direct forecasts of market development, procurement, implementation or clinical adoption. General Practice and Dietetics and Pharmacy recorded semantic policy-alignment scores of 0.76 and 0.73, respectively, while Community Nursing recorded 0.71, Medical Specialties 0.70 and Emergency Medicine 0.69. These values indicated greater semantic correspondence between the selected company descriptions and policy language relating to primary and community-facing settings.
3.5. Longitudinal Patterns Associated with Ecosystem Evolution
For the company-level longitudinal analyses, innovations identified in the original NHS horizon scans were followed through targeted annual scans of publicly available evidence. Innovations identified in the 2015 horizon scan were reviewed in each subsequent year, including 2016–2018, to reconstruct their longitudinal development and policy-alignment profiles. The same procedure was applied to innovations entering the dataset in later years, with annual follow-up continuing until the end of the observation period or the last year for which relevant information was identified. These reconstructed entity-year profiles were distinct from the annual corpora used for the thematic TF-IDF analysis, for which no standalone NHS horizon scans were available between 2016 and 2018.
The semantic similarity between the information identified for each innovation and the national policy documents applicable to the corresponding year was tracked longitudinally. The resulting annual profiles showed that the mean policy-alignment score remained relatively stable across the observation period, at approximately 0.60, although the variation in scores differed between clinical and non-clinical innovations during the earlier years (Figure 5a). By 2020, the variation in policy-alignment scores had narrowed, indicating greater consistency in the semantic similarity between innovation descriptions and the contemporaneous policy corpus. This pattern did not independently demonstrate structural harmonisation or policy-driven market convergence. The observed change followed the introduction of centralised digital health assessment frameworks, including the NICE Evidence Standards Framework, which was first published in December 2018 and subsequently updated [34]. Previous studies have described how these frameworks introduced more standardised expectations for evaluating digital health technologies [32,33]. A lead-lag analysis was subsequently conducted to examine the temporal distribution of public-funding and media signals relative to a company’s initial appearance in an NHS horizon scan (Figure 5b). Annual follow-up scans were used to retrieve relevant funding and media information before and after initial inclusion, where such information was available. The resulting profiles were aligned relative to the year of first inclusion, designated T0, allowing signals from innovations entering the dataset in different calendar years to be compared on a common temporal scale.
Public-funding intensity showed negative standardised values during the years preceding initial inclusion, approached the corpus mean at T0, and declined during the subsequent observation period. Media coverage remained below the standardised mean before initial inclusion and reached its highest observed level one year afterwards. Within the analysed evidence base, public-funding and media signals therefore showed different temporal profiles around initial horizon-scan inclusion. The funding measure was comparatively more prominent around the point of inclusion, whereas media coverage was more prominent afterwards. These patterns represent temporal associations and do not establish that funding caused horizon-scan inclusion, that inclusion generated subsequent media coverage, or that declining public funding reflected progression towards commercial viability.
The composite maturity score was also decomposed into its four constituent dimensions: systems interoperability, implementation scope, realised benefits, and regulatory compliance (Figure 5c). Maturity evidence identified through the original NHS horizon scans and targeted annual follow-up scans was used to construct the company-level profiles. Where intermediate maturity-score points were reconstructed through linear interpolation rather than calculated from newly identified evidence, they were labelled as interpolated points and used only for descriptive visualisation. They were not treated as directly observed company-year records.
Clinical diagnostic and care innovations recorded relatively higher regulatory-compliance and realised-benefit scores but lower implementation-scope scores. In contrast, non-clinical and operational innovations recorded relatively higher systems-interoperability and implementation-scope scores but lower regulatory-compliance scores. This difference was partly consistent with the construction of the maturity framework, because medical-device regulatory indicators were more likely to apply to clinical technologies than to administrative or operational systems. Lower regulatory scores among non-clinical innovations should therefore not be interpreted as evidence of poorer regulatory readiness, as the relevant criteria may not have been applicable to many technologies in this category. Similarly, lower implementation-scope scores among clinical innovations describe the evidence identified through the scanning process and do not independently establish that implementation constraints prevented their development or adoption.
Finally, continued visibility within the longitudinal horizon-scanning evidence base was examined to characterise the outcome used in the classification task (Figure 5d). Initial inclusion was defined by a company’s first appearance in an original NHS horizon scan. Subsequent visibility was assessed using information identified through the original scan records and targeted annual follow-up scans. An empirical persistence curve was generated to estimate the proportion of innovations for which relevant evidence of continued activity was identified across successive annual scanning cycles. The estimated persistence probability was 95.4% by the second year, 58.4% by the third year, and 27.6% by the fourth year. By the eighth year, 14.0% of the identified innovations remained visible within the evidence base, declining to 2.7% by the twelfth year.
The decline in persistence after the second annual cycle was interpreted as a reduction in continued visibility within the horizon-scanning corpus, rather than as direct evidence of clinical, commercial or implementation failure. Two non-exclusive mechanisms may contribute to this pattern. First, the thematic analysis in Section 3.2 showed that the clinical and operational priorities represented in the NHS horizon scans changed over time. The dominant focus shifted from remote monitoring in 2020 and pathway triage in 2021 to oncology in 2022, cardiovascular risk and women’s health in 2023, cognitive assessment in 2024, and ADHD and imaging artificial intelligence in 2026. Companies operating in domains that were not prioritised in subsequent scans could therefore disappear from the corpus despite remaining clinically active, commercially viable or deployed within health and care organisations.
Second, some loss of visibility may coincide with translational challenges as innovations move from initial identification and pilot activity towards wider implementation and procurement. However, the available horizon-scan records did not systematically document the reasons for non-reappearance. It was therefore not possible to distinguish companies that experienced limited clinical effectiveness, implementation or commercial difficulties from those omitted because of changing scan scope, reporting priorities or commissioning questions. The persistence curve should consequently be interpreted as a measure of sustained visibility within the observed NHS innovation-scanning ecosystem, rather than as a direct measure of clinical success, procurement, commercial survival or organisational performance.
These findings indicate that continued representation declined substantially as the follow-up interval increased. However, discontinuation of visibility within the evidence base cannot be treated as equivalent to company failure, market exit, or unsuccessful commercialisation. Relevant evidence may not have been identified because of changes in source availability, search coverage, company or product names, reporting practices, or the public visibility of company activity. The persistence analysis therefore characterises continued visibility within the longitudinal horizon-scanning evidence base and provides context for the difficulty of predicting visibility during the subsequent annual scanning cycle.
3.6. Agentic Foresight and System-Level Synthesis
The multi-agent synthesis integrated the historical thematic profiles, candidate-theme clusters, semantic policy-alignment scores, maturity trajectories, next-year corpus-reappearance probabilities, future documented-maturity estimates and external funding, clinical, regulatory and media signals. Using the role structure described in Section 2.8, the three specialist agents produced complementary interpretations that were consolidated by the Coordinator Agent and subjected to human review. The reviewed output was organised as a structured horizon-scanning synthesis for the 2027 analytical cycle and is presented in Supplementary Note 2. The synthesis contextualised the increase in company-year profiles represented within the evidence base, from 25 in the 2021 horizon-scan cohort to 1,750 in 2026, alongside changes in scan coverage, commissioning scope and data-acquisition methods. It did not interpret this increase solely as evidence of market expansion. The synthesis also incorporated the right-skewed distribution of documented-maturity scores, for which the overall mean was 0.59 and the seventy-fifth percentile was 1.00 on the 0-to-8 scale. Continued corpus visibility provided further longitudinal context: persistence was estimated at 95.4% by the second annual follow-up cycle, 58.4% by the third and 27.6% by the fourth. The synthesis interpreted this pattern as indicating that sustained representation became less common over longer follow-up periods, without treating non-reappearance as implementation failure, commercial attrition or company exit.
The documented-maturity sub-dimension profiles showed different patterns across the clinical and non-clinical categories. Clinical diagnostic and care innovations showed relatively higher mean documented scores for regulatory compliance and realised benefits but lower scores for implementation scope. Non-clinical and operational innovations showed relatively higher mean documented scores for interoperability and implementation scope but lower scores for regulatory compliance. The agents used these differences to identify areas requiring further examination but did not infer that individual innovations had failed because of a specific maturity dimension. The interpretation also accounted for the lower applicability of medical-device regulatory criteria to many non-clinical technologies.
The forward-looking synthesis identified greater semantic policy correspondence among candidate clusters associated with primary and community-facing care settings. General Practice, Dietetics and Pharmacy, and Community Nursing recorded policy-alignment scores of 0.76, 0.73, and 0.71, respectively. These scores were higher than those observed for candidate clusters associated with Medical Specialties and Emergency Medicine, which reached 0.70 and 0.69, respectively. Interpretation of the candidate-theme clusters for subsequent investigation also indicated increasing specificity in the technologies represented. Within diagnostic applications, the clusters included decentralised hardware designed to support quantitative measurements near the point of care. Other clusters contained wearable and remote-monitoring technologies described in relation to continuous physiological measurement, together with cognitive-assessment applications using behavioural or interaction-derived signals. Operational clusters included financial-management platforms and supply-chain analytics intended to support healthcare delivery functions.
The agentic stage converted heterogeneous numerical and textual outputs into a structured synthesis covering longitudinal ecosystem patterns, candidate themes, policy correspondence, maturity evidence and external signals. Its practical contribution was most apparent in bringing these outputs into a common interpretive structure, as summarised in Table 3. For example, semantic-policy similarities, future-visibility probabilities, maturity trajectories and funding or clinical signals could be considered together rather than reported as separate analytical outputs. The wider computational workflow also enabled company profiles to be enriched systematically from multiple external evidence sources and updated within a consistent company-year structure. These functions provided a traceable first-pass evidence base intended to support expert review. Comparative improvements in time, cost, workload, accuracy or analytical quality relative to conventional manual horizon scanning were not evaluated.
The detailed reviewed synthesis is presented in Part A of Supplementary Note 2, while Part B documents source attribution, the human-review procedure, criteria for retaining, revising or removing statements, interpretive safeguards and limitations. The synthesis was not evaluated against an independently produced expert horizon-scanning report, and the candidate themes were not prospectively validated. The agentic outputs should therefore be interpreted as a structured, human-reviewed organisation of the supplied analytical findings rather than as independent evidence, autonomous foresight or decision-ready commissioner advice.
4. Conclusions
The proliferation and increasing heterogeneity of digital health technologies require scalable methodologies capable of extending conventional horizon scanning beyond the assessment of innovations at a single point in time. This study developed an agentic AI-assisted analytical framework that uses historical NHS horizon scans to examine longitudinal thematic evolution and integrates these findings with company-level policy, funding, clinical, media, organisational, and maturity signals. Applied to 123 NHS horizon scans and 4,039 company-year profiles, the methodology identified changes from predominantly enterprise, workforce, documentation, and operational technologies towards more condition-specific clinical applications. The longitudinal analysis also demonstrated how the focus within recurrent clinical domains changed over time, including oncology, cardiovascular health, and mental, cognitive, and neurodevelopmental health.
The classification models estimated continued visibility within the longitudinal horizon-scanning evidence base during the subsequent annual scanning cycle. Under nested company-grouped cross-validation, XGBoost achieved an F1-score of 0.67, a ROC-AUC of 0.89 and an average precision of 0.72 for next-year corpus reappearance. Extra Trees achieved the strongest nested performance for future documented maturity, with an R2of 0.40 and an RMSE of 0.96. The direct carry-forward comparator confirmed that persistence in documented maturity accounted for substantial predictive performance. Under nested company-grouped validation, Extra Trees improved R2from 0.266 ± 0.186 for carry-forward to 0.400 ± 0.098 and reduced RMSE from 1.046 ± 0.113 to 0.955 ± 0.080. Under rolling-origin validation, the fitted models produced only modest pooled improvement over carry-forward and were outperformed by carry-forward in the earliest annual cohort. Future documented-maturity performance should therefore be interpreted as combining strong score persistence with smaller incremental information from the wider feature representation.
Grouped permutation analysis indicated that temporal dynamics contributed most strongly to next-year corpus-reappearance predictions, while baseline documented maturity contributed most strongly to future documented-maturity estimation. The semantic representation provided a smaller incremental contribution within the full multimodal models, while policy alignment and reported funding produced negligible incremental importance in these fitted models. These findings describe predictive dependence within the fitted models and should not be interpreted causally.
Across the two rolling-origin specifications, performance was lower and more variable than under nested company-grouped cross-validation. In the fixed-configuration specification, historical decision-threshold selection increased pooled F1 from 0.213 to 0.486. Annual ROC-AUC ranged from 0.507 to 0.708. Repeating preprocessing, hyperparameter optimisation and threshold selection within each historical training window changed several annual estimates but did not remove between-cohort variation. For future documented maturity, annual R2values were positive in all four cohorts, and model RMSE was lower than the historical-training-mean baseline in each cohort. These findings indicate that company-level generalisation within the pooled temporal corpus and transportability across subsequent annual cohorts are distinct properties. Continued visibility does not represent commercial success or adoption, and the predicted maturity score reflects the study’s composite scoring framework rather than an independently verified measure of implementation readiness. Because reasons for non-reappearance were not consistently reported, the analysis could not determine whether attrition reflected clinical or commercial failure, completion of a time-limited pilot, transition into routine procurement, reduced public reporting, or a change in the thematic priorities of subsequent horizon scans. The nested design reduced model-selection optimism by separating inner hyperparameter tuning from outer-fold performance estimation. However, it remained an internal evaluation within the assembled horizon-scanning corpus and did not preserve chronological ordering. Training partitions could contain later-year observations when evaluating a different company observed in an earlier year, and only eight candidate hyperparameter configurations were evaluated per model. The nested estimates should therefore be interpreted as internal measures of company-level generalisation rather than prospective or external validation. The rolling-origin analysis provided the complementary chronological assessment but remained sensitive to annual differences in scan coverage, cohort composition and outcome prevalence.
Linear interpolation was used only for the descriptive reconstruction and visualisation of maturity trajectories between observed company-year scores. It was not used to generate predictive features or supervised outcomes. Nevertheless, interpolation assumes smooth change between observed points and may obscure short-term variation in documented maturity evidence, documented implementation, realised benefits, interoperability or regulatory evidence. The reconstructed trajectories should therefore be interpreted as descriptive summaries rather than as directly observed evidence of continuous organisational development.
The methodology extended the longitudinal analysis through forward-looking semantic clustering. HDBSCAN and TF-IDF were applied to the semantic representations of companies predicted to remain visible during the subsequent scanning cycle, producing candidate clinical, technological, and operational themes for continued investigation. A structured multi-agent Large Language Model architecture subsequently contextualised the thematic profiles, company-level predictions, policy-alignment measures, maturity trajectories, and candidate clusters. The agentic component integrated and interpreted quantitative outputs generated by the preceding analytical stages; it did not independently generate the model predictions or establish that the candidate themes would progress towards implementation or adoption.
Future development should evaluate the methodology prospectively across subsequent horizon-scanning cycles, compare automated thematic outputs with independent expert assessment, and incorporate directly observed clinical, implementation, regulatory, and adoption outcomes where available. Further validation should also distinguish observed company development from changes in public visibility and source coverage. Overall, this study provides a scalable and traceable agentic AI-assisted methodology for converting heterogeneous historical NHS horizon scans into longitudinal thematic intelligence, company-level development indicators, and candidate areas for future investigation. The framework is intended to augment expert-led horizon scanning, supporting systematic evidence synthesis, temporal comparison, and prioritisation while maintaining the need for human review, methodological transparency, and independent validation. Although the framework was developed using UK-specific health-system requirements, including NHS policy priorities, DTAC assurance criteria and NICE evidence standards and evaluation guidance, its architecture may be adaptable to other health-system contexts. Such adaptation would require the policy-alignment vectors, maturity criteria, regulatory indicators and interpretation rules to be recalibrated against the relevant local evidence, governance and implementation environment.
Supplementary Materials
The following supporting information can be downloaded at the website of this paper posted on Preprints.org, Table S1: Annual distribution and commissioning scope of the 123 included horizon scans; Table S2. Representative entity-standardisation and reconciliation decisions; Table S3. Sensitivity of panel construction and next-year reappearance prevalence to the full-string RapidFuzz similarity threshold; Table S4a. Rolling-origin forward-validation performance of the Extra Trees models using fixed and historically selected classification thresholds; Table S4b. Rolling-origin forward-validation with historical-window hyperparameter optimisation; Table S5. Marginal and grouped permutation-importance analyses; Table S6. Fold-level classification diagnostics from nested company-grouped cross-validation; Table S7. Comparison of fitted regression models with mean-prediction and direct carry-forward baselines. S1: Agentic Prompts; S2: Agentic Report Generated.
Author Contributions
Conceptualization, A.R.G.; methodology, A.R.G.; software, A.R.G.; validation, A.R.G.; formal analysis, A.R.G.; investigation, A.R.G.; resources, A.R.G.; data curation, A.R.G.; writing—original draft preparation, A.R.G.; writing—review and editing, A.R.G.; visualization, A.R.G.; supervision, A.R.G.; project administration, A.R.G. The author has read and agreed to the published version of the manuscript.
Funding
This research received no external funding.
Institutional Review Board Statement
Not applicable.
Informed Consent Statement
Not applicable.
Data Availability Statement
The underlying horizon-scanning records and complete populated record-level company dataset cannot be shared publicly because portions of the source archive originated from restricted NHS and Health Innovation Network workspaces and contain commercially sensitive company, product and commissioning information. The manuscript and Supplementary Materials provide the inclusion criteria, extraction period, annual distribution and principal commissioning topics of the 123 included scans; the ten-field standardised record structure; de-identified entity-reconciliation examples; matching-threshold sensitivity analyses; model-development and validation procedures; and de-identified prompt templates. Analysis code and additional de-identified supporting materials may be made available upon reasonable request, subject to organisational information-governance review and confirmation that disclosure would not reveal confidential, commercially sensitive or restricted information.
Conflicts of Interest
The author declares no conflicts of interest.
References
- Amanatidou, E., et al., On concepts and methods in horizon scanning: Lessons from initiating policy dialogues on emerging issues. Science and Public Policy, 2012. 39(2): p. 208-221. [CrossRef]
- Meskó, B., et al., Exploring the Need for Medical Futures Studies: Insights From a Scoping Review of Health Care Foresight. J Med Internet Res, 2024. 26: p. e57148. [CrossRef]
- Garcia Gonzalez-Moral, S., et al., Looking at the fringes of MedTech innovation: a mapping review of horizon scanning and foresight methods. BMJ Open, 2023. 13(9): p. e073730. [CrossRef]
- O’Malley, S.P. and E. Jordan, Horizon scanning of new and emerging medical technology in Australia: Its relevance to Medical Services Advisory Committee health technology assessments and public funding. International Journal of Technology Assessment in Health Care, 2009. 25(3): p. 374-382. [CrossRef]
- Eriksson, I., et al., The Early Awareness and Alert System in Sweden: History and Current Status. 2017. Frontiers in Pharmacology. Volume 8–2017.
- Simpson, S., et al., Early identification and assessment of new and emerging health technologies: Actions, progress, and the future direction of an international collaboration—EuroScan. International Journal of Technology Assessment in Health Care, 2008. 24(4): p. 518-525. [CrossRef]
- Gutierrez-Ibarluzea, I., S. Simpson, and G. Benguria-Arrate, EARLY AWARENESS AND ALERT SYSTEMS: AN OVERVIEW OF EUROSCAN METHODS. International Journal of Technology Assessment in Health Care, 2012. 28(3): p. 301-307. [CrossRef]
- Packer, C., S. Simpson, and R.T. de Almeida, EUROSCAN INTERNATIONAL NETWORK MEMBER AGENCIES: THEIR STRUCTURE, PROCESSES, AND OUTPUTS. International Journal of Technology Assessment in Health Care, 2015. 31(1-2): p. 78-85. [CrossRef]
- Pichler, F.B., et al., Lifecycle HTA: promising applications and a framework for implementation. An HTAi Global Policy Forum Task Force report. International Journal of Technology Assessment in Health Care, 2024. 40(1): p. e50. [CrossRef]
- Iglesias-Lopez, C., et al., Current landscape of clinical development and approval of advanced therapies. Molecular Therapy Methods & Clinical Development, 2021. 23: p. 606-618. [CrossRef]
- Vignali, V., et al., Health horizons: Future trends and technologies from the European Medicines Agency’s horizon scanning collaborations. Frontiers in Medicine. 2022. Volume 9–2022. [CrossRef]
- Smith, J., et al., New and emerging technologies for the treatment of inherited retinal diseases: a horizon scanning review. Eye, 2015. 29(9): p. 1131-1140. [CrossRef]
- Bhatia, S., et al., Strengthening health systems for access to gene therapy in rare genetic disorders. Molecular Therapy Methods & Clinical Development, 2024. 32(2). [CrossRef]
- Hanna, E., et al., Advanced Therapy Medicinal Products: Current and Future Perspectives. Journal of Market Access & Health Policy. 2016. 4(1): p. 31036. [CrossRef]
- Correia, P.D., et al., Horizon scanning at EMA: preparing for the medicines of the future. 2026. Frontiers in Medicine. Volume 13–2026. [CrossRef]
- Zhou, Y., et al., Forecasting emerging technologies using data augmentation and deep learning. Scientometrics, 2020. 123(1): p. 1-29. [CrossRef]
- Lee, J.Y., S. Ahn, and D. Kim, Deep learning-based prediction of future growth potential of technologies. PLOS ONE, 2021. 16(6): p. e0252753. [CrossRef]
- Afifuddin, M. and W. Seo, Developing a predictive model for anticipating technology convergence: A transformer-based model and supervised learning approach. PLOS ONE, 2025. 20(6): p. e0326417. [CrossRef]
- Zhao, Y., et al., Hybrid Bayesian and deep learning-based degradation modeling for medical imaging equipment under multi-condition Internet of Medical Things data streams. Reliability Engineering & System Safety, 2027. 277: p. 112937. [CrossRef]
- Yang, J.-S., et al., Towards AI-Driven Smart Maintenance of Computed Tomography Equipment: From Health Indicator Design to Transferable Remaining Useful Life Prediction. 2026. [CrossRef]
- Ma, C., et al., Risk-oriented degradation modeling and maintenance decision support for computed tomography X-ray tubes using mechanism-informed learning. Reliability Engineering & System Safety, 2026. 275: p. 112837. [CrossRef]
- Worth Jr, P., Word Embeddings and Semantic Spaces in Natural Language Processing. International Journal of Intelligence Science, 2023. 13: p. 1-21.
- Neelakantan, et al., Text and Code Embeddings by Contrastive Pre-Training. arXiv, 2022.
- Hajikhani, A. and A. Suominen, Mapping the sustainable development goals (SDGs) in science, technology and innovation: application of machine learning in SDG-oriented artefact detection. Scientometrics, 2022. 127(11): p. 6661-6693. [CrossRef]
- Guy D. Rosin, K.R., Temporal Attention for Language Models. arXiv, 2022.
- van Rijn, T. and J.K. Timmis, Patent landscape analysis—Contributing to the identification of technology trends and informing research and innovation funding policy. Microbial Biotechnology, 2023. 16(4): p. 683-696.
- Liaw, S.-T. and M.A. Godinho, Digital health and capability maturity models—a critical thematic review and conceptual synthesis of the literature. Journal of the American Medical Informatics Association, 2023. 30(2): p. 393-406. [CrossRef]
- Greenhalgh, T., et al., Beyond Adoption: A New Framework for Theorizing and Evaluating Nonadoption, Abandonment, and Challenges to the Scale-Up, Spread, and Sustainability of Health and Care Technologies. J Med Internet Res, 2017. 19(11): p. e367. [CrossRef]
- Kidholm, K., et al., The Model for Assessment of Telemedicine (MAST): A scoping review of empirical studies. J Telemed Telecare, 2017. 23(9): p. 803-813. [CrossRef]
- Segur-Ferrer, J., et al., Methodological Frameworks and Dimensions to Be Considered in Digital Health Technology Assessment: Scoping Review and Thematic Analysis. J Med Internet Res, 2024. 26: p. e48694. [CrossRef]
- Zych, M.M., et al., Quality Assessment of Digital Health Apps: Umbrella Review. J Med Internet Res, 2024. 26: p. e58616. [CrossRef]
- ONE LONDON, A.C.f.V.B.H. A Framework for the safe, efficient and effective implementation, use and maintenance of AI in health and care in London. 2025.
- Spreafico, A.M.C., R. Tarricone, and A.D. Stern, Comprehensive policies for scaling systemic and equitable integration of digital health technologies. npj Digital Medicine, 2025. 8(1): p. 404. [CrossRef]
- Unsworth, H., et al., The NICE Evidence Standards Framework for digital health and care technologies–Developing and maintaining an innovative evidence framework with global impact. 2021. 7: p. 20552076211018617. [CrossRef]
- Yousef, Y., J. Keast, and H. Dambha-Miller, Streamlining regulation to Unlock Digital Health Innovation in the NHS. 2026. 12: p. 20552076261433141. [CrossRef]
Figure 1.
Landscape composition and documented-maturity distributions of digital-health innovations, 2015–2026. (a) Annual number of digital-health company-year profiles represented across the study period. Counts varied substantially and reached a maximum of 1,750 profiles in 2026. (b) Aggregate distribution of the composite documented-maturity score. The overall mean of 0.59 and seventy-fifth percentile of 1.00 are indicated by the dashed red and dotted green lines, respectively, highlighting the concentration of profiles containing limited qualifying maturity evidence. (c) Relationship between log-transformed reported funding and the composite documented-maturity score. (d) Annual box-plot distributions of documented-maturity scores by observation year.
Figure 1.
Landscape composition and documented-maturity distributions of digital-health innovations, 2015–2026. (a) Annual number of digital-health company-year profiles represented across the study period. Counts varied substantially and reached a maximum of 1,750 profiles in 2026. (b) Aggregate distribution of the composite documented-maturity score. The overall mean of 0.59 and seventy-fifth percentile of 1.00 are indicated by the dashed red and dotted green lines, respectively, highlighting the concentration of profiles containing limited qualifying maturity evidence. (c) Relationship between log-transformed reported funding and the composite documented-maturity score. (d) Annual box-plot distributions of documented-maturity scores by observation year.
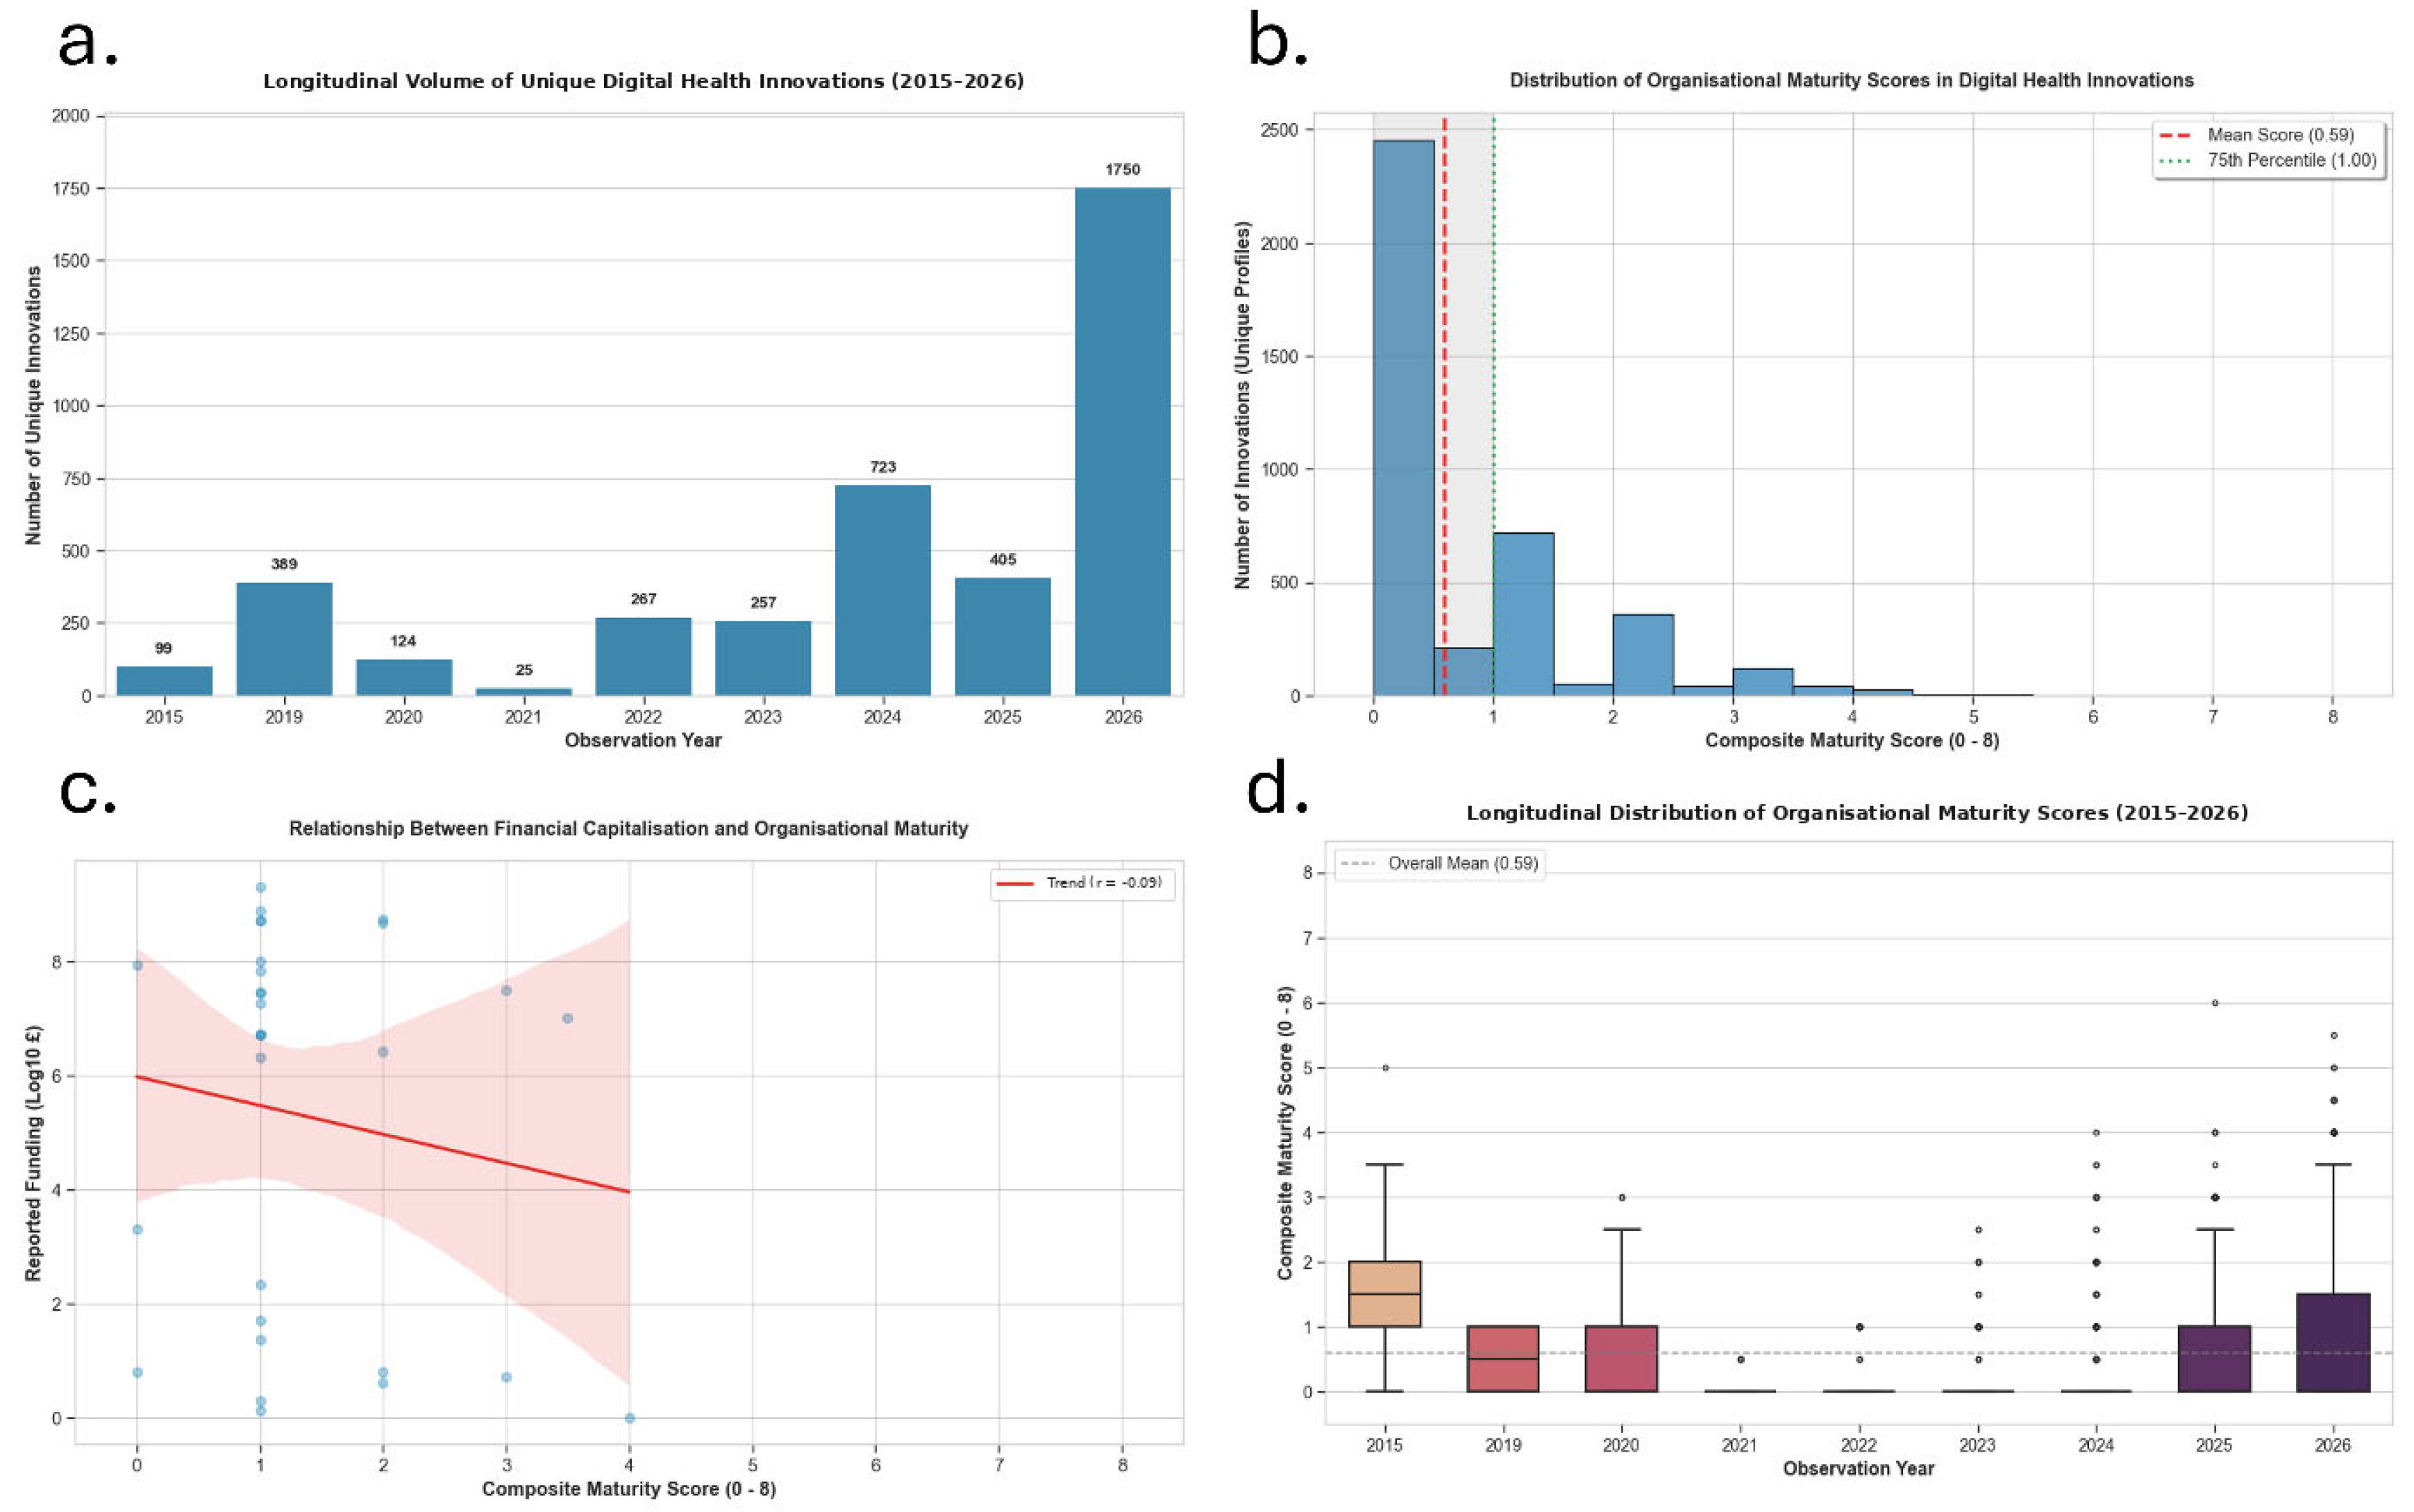
Figure 2.
Semantic segmentation and PCA of digital health innovations. (a) Two-dimensional PCA projection of document embeddings across the evaluated dataset. The scatter plot illustrates a structural bifurcation along Principal Component 1 (19.93% variance). Clinical innovations across diverse medical specialties overlap within the positive region of the first principal component. (b) Secondary PCA projection isolating the non-clinical cohort, stratified into Corporate, Operations, and Clinical Operations functional themes. The topological distribution reveals that the isolated negative-axis cluster is predominantly driven by agnostic Operations and Corporate enterprise solutions, whereas Clinical Operations applications overlap with the semantic space occupied by clinical innovations.
Figure 2.
Semantic segmentation and PCA of digital health innovations. (a) Two-dimensional PCA projection of document embeddings across the evaluated dataset. The scatter plot illustrates a structural bifurcation along Principal Component 1 (19.93% variance). Clinical innovations across diverse medical specialties overlap within the positive region of the first principal component. (b) Secondary PCA projection isolating the non-clinical cohort, stratified into Corporate, Operations, and Clinical Operations functional themes. The topological distribution reveals that the isolated negative-axis cluster is predominantly driven by agnostic Operations and Corporate enterprise solutions, whereas Clinical Operations applications overlap with the semantic space occupied by clinical innovations.
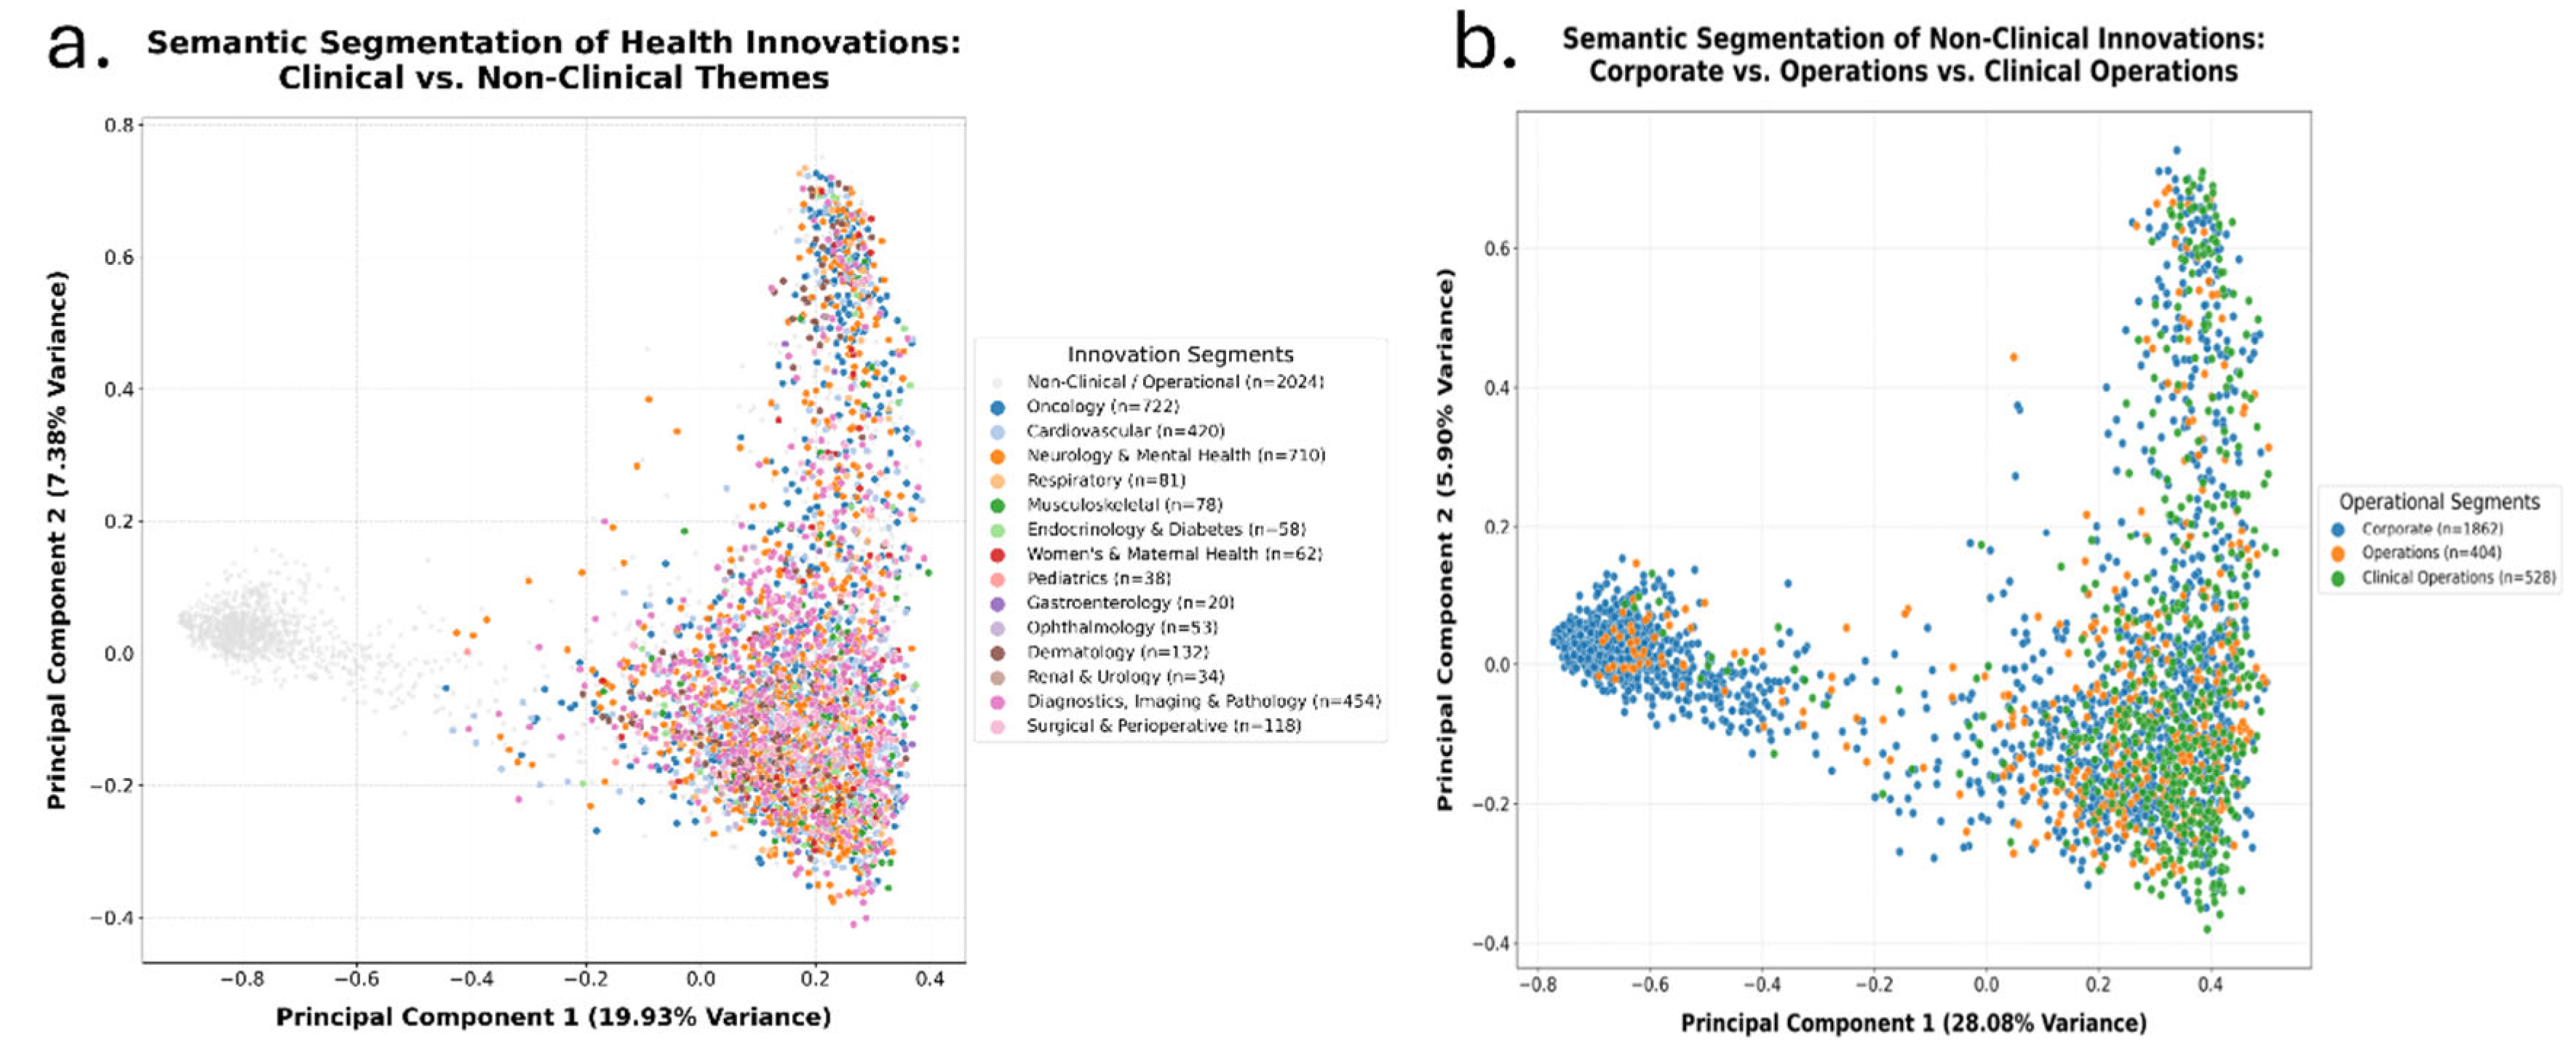
Figure 3.
Schematic representation of the multimodal predictive horizon-scanning architecture. Company-year profiles were constructed from historical horizon scans and temporally eligible external evidence. Semantic representations were combined with structured financial, maturity, temporal and policy-alignment features. The resulting feature vectors were evaluated through a classification task estimating next-year corpus reappearance and a regression task estimating the directly observed future documented maturity score. The schematic summarises the analytical workflow and does not imply prediction of commercial development, procurement, implementation or adoption.
Figure 3.
Schematic representation of the multimodal predictive horizon-scanning architecture. Company-year profiles were constructed from historical horizon scans and temporally eligible external evidence. Semantic representations were combined with structured financial, maturity, temporal and policy-alignment features. The resulting feature vectors were evaluated through a classification task estimating next-year corpus reappearance and a regression task estimating the directly observed future documented maturity score. The schematic summarises the analytical workflow and does not imply prediction of commercial development, procurement, implementation or adoption.
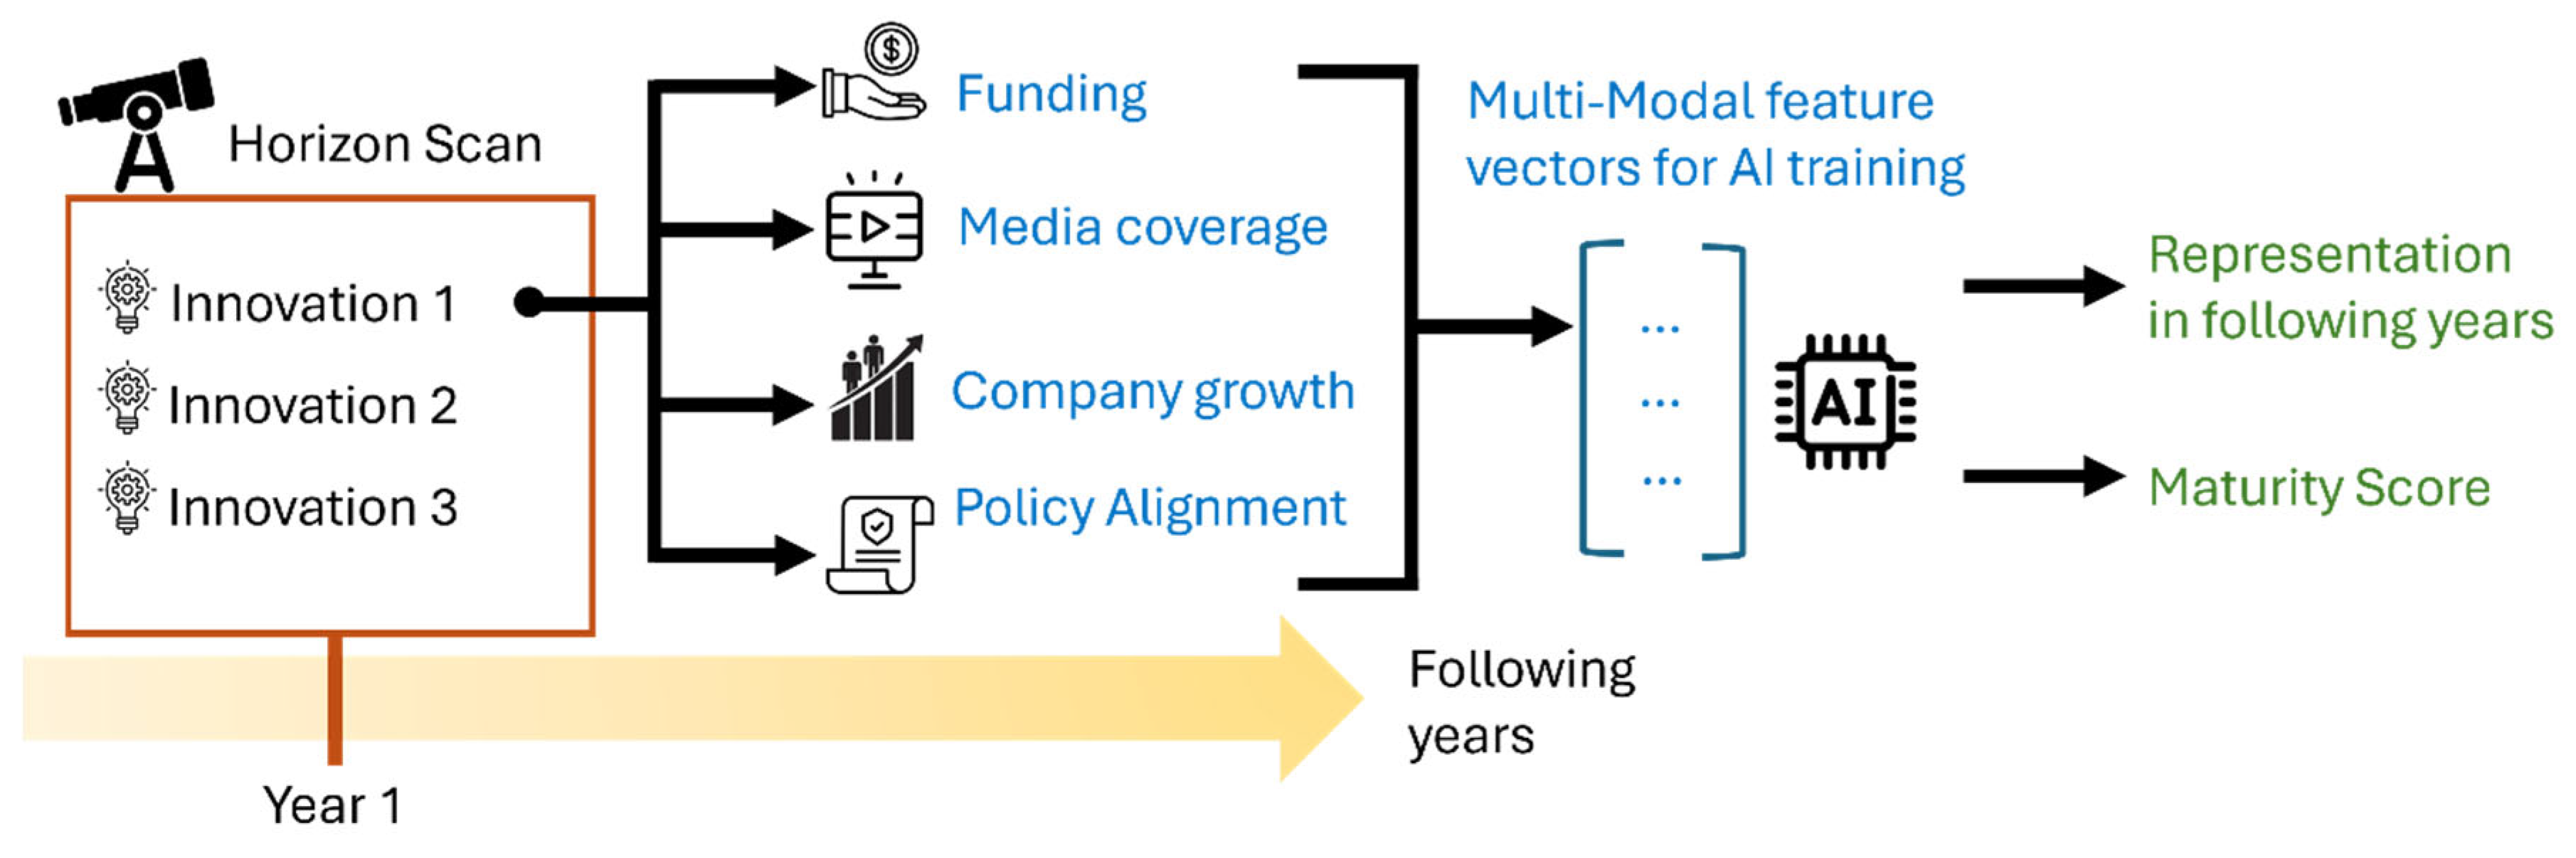
Figure 4.
(a) Grouped permutation importance for the regression model estimating future documented maturity. Bars show the normalised share of positive mean reductions in held-out R2following permutation of each feature block. (b) Grouped permutation importance for the classification model estimating next-year corpus reappearance. Bars show the normalised share of positive mean reductions in held-out average precision following permutation of each feature block. In both analyses, all 768 embedding dimensions were permuted simultaneously as one semantic block. (c) Representative documented-maturity trajectory from 2022–2026. The solid blue line shows directly observed documented-maturity scores, while the dashed orange line shows the held-out one-year-ahead prediction. Grey markers indicate linearly interpolated points used only for retrospective descriptive visualisation; they were not used as predictive features, supervised outcomes or observations in model evaluation. (d) Candidate themes for investigation in the subsequent analytical cycle. Themes were identified using HDBSCAN clustering and TF-IDF extraction applied to the semantic representations of companies predicted to reappear in the subsequent annual scanning cycle.
Figure 4.
(a) Grouped permutation importance for the regression model estimating future documented maturity. Bars show the normalised share of positive mean reductions in held-out R2following permutation of each feature block. (b) Grouped permutation importance for the classification model estimating next-year corpus reappearance. Bars show the normalised share of positive mean reductions in held-out average precision following permutation of each feature block. In both analyses, all 768 embedding dimensions were permuted simultaneously as one semantic block. (c) Representative documented-maturity trajectory from 2022–2026. The solid blue line shows directly observed documented-maturity scores, while the dashed orange line shows the held-out one-year-ahead prediction. Grey markers indicate linearly interpolated points used only for retrospective descriptive visualisation; they were not used as predictive features, supervised outcomes or observations in model evaluation. (d) Candidate themes for investigation in the subsequent analytical cycle. Themes were identified using HDBSCAN clustering and TF-IDF extraction applied to the semantic representations of companies predicted to reappear in the subsequent annual scanning cycle.
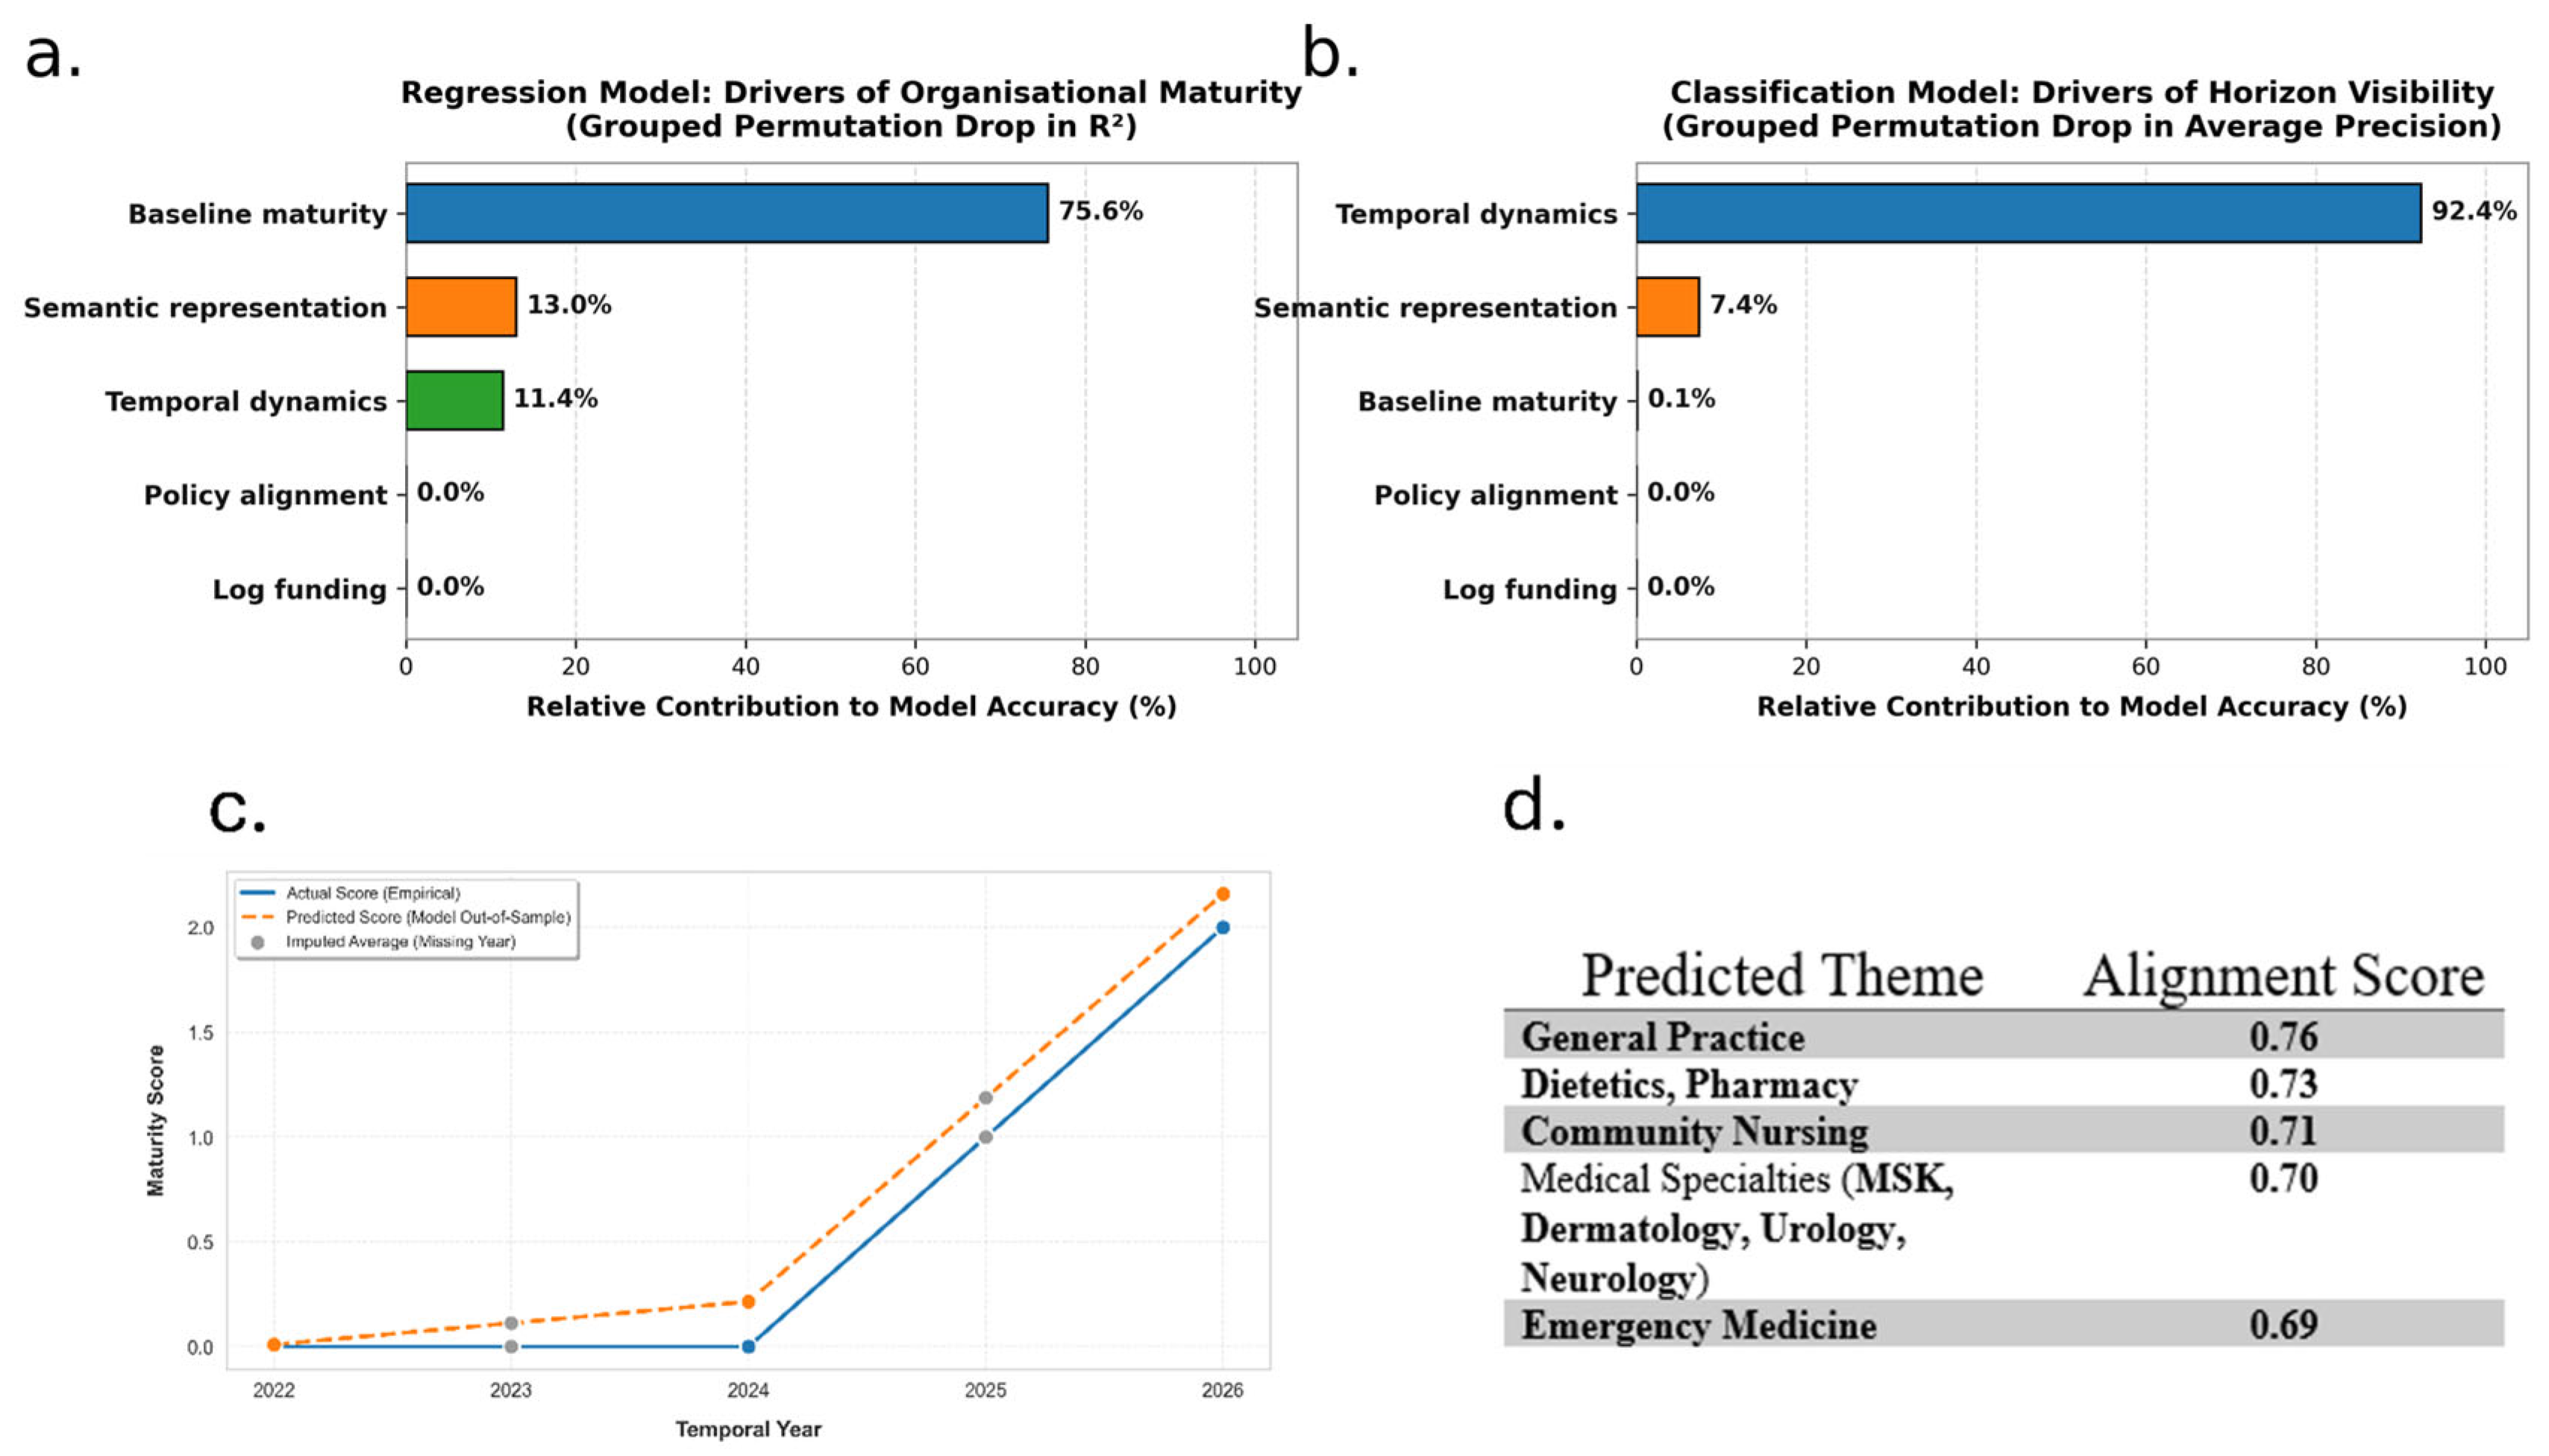
Figure 5.
Longitudinal policy correspondence, external evidence signals, documented-maturity dimensions and persistence within the targeted horizon-scanning evidence base. (a) Annual mean semantic policy-alignment scores for clinical and non-clinical innovation cohorts between 2015 and 2026. Shaded bands represent within-cohort variation. (b) Lead-lag profiles of standardised public-funding and media-signal intensity relative to the year of initial horizon-scan inclusion, designated T0. These profiles describe temporal associations and do not establish causal relationships between external signals and corpus inclusion. (c) Radar profile comparing the four constituent documented-maturity dimensions across clinical and non-clinical innovations. (d) Non-parametric persistence curve showing the estimated proportion of followed innovations for which relevant evidence remained identifiable across successive annual follow-up cycles. Persistence represents continued corpus visibility and not company survival, clinical adoption, procurement or commercial success.
Figure 5.
Longitudinal policy correspondence, external evidence signals, documented-maturity dimensions and persistence within the targeted horizon-scanning evidence base. (a) Annual mean semantic policy-alignment scores for clinical and non-clinical innovation cohorts between 2015 and 2026. Shaded bands represent within-cohort variation. (b) Lead-lag profiles of standardised public-funding and media-signal intensity relative to the year of initial horizon-scan inclusion, designated T0. These profiles describe temporal associations and do not establish causal relationships between external signals and corpus inclusion. (c) Radar profile comparing the four constituent documented-maturity dimensions across clinical and non-clinical innovations. (d) Non-parametric persistence curve showing the estimated proportion of followed innovations for which relevant evidence remained identifiable across successive annual follow-up cycles. Persistence represents continued corpus visibility and not company survival, clinical adoption, procurement or commercial success.
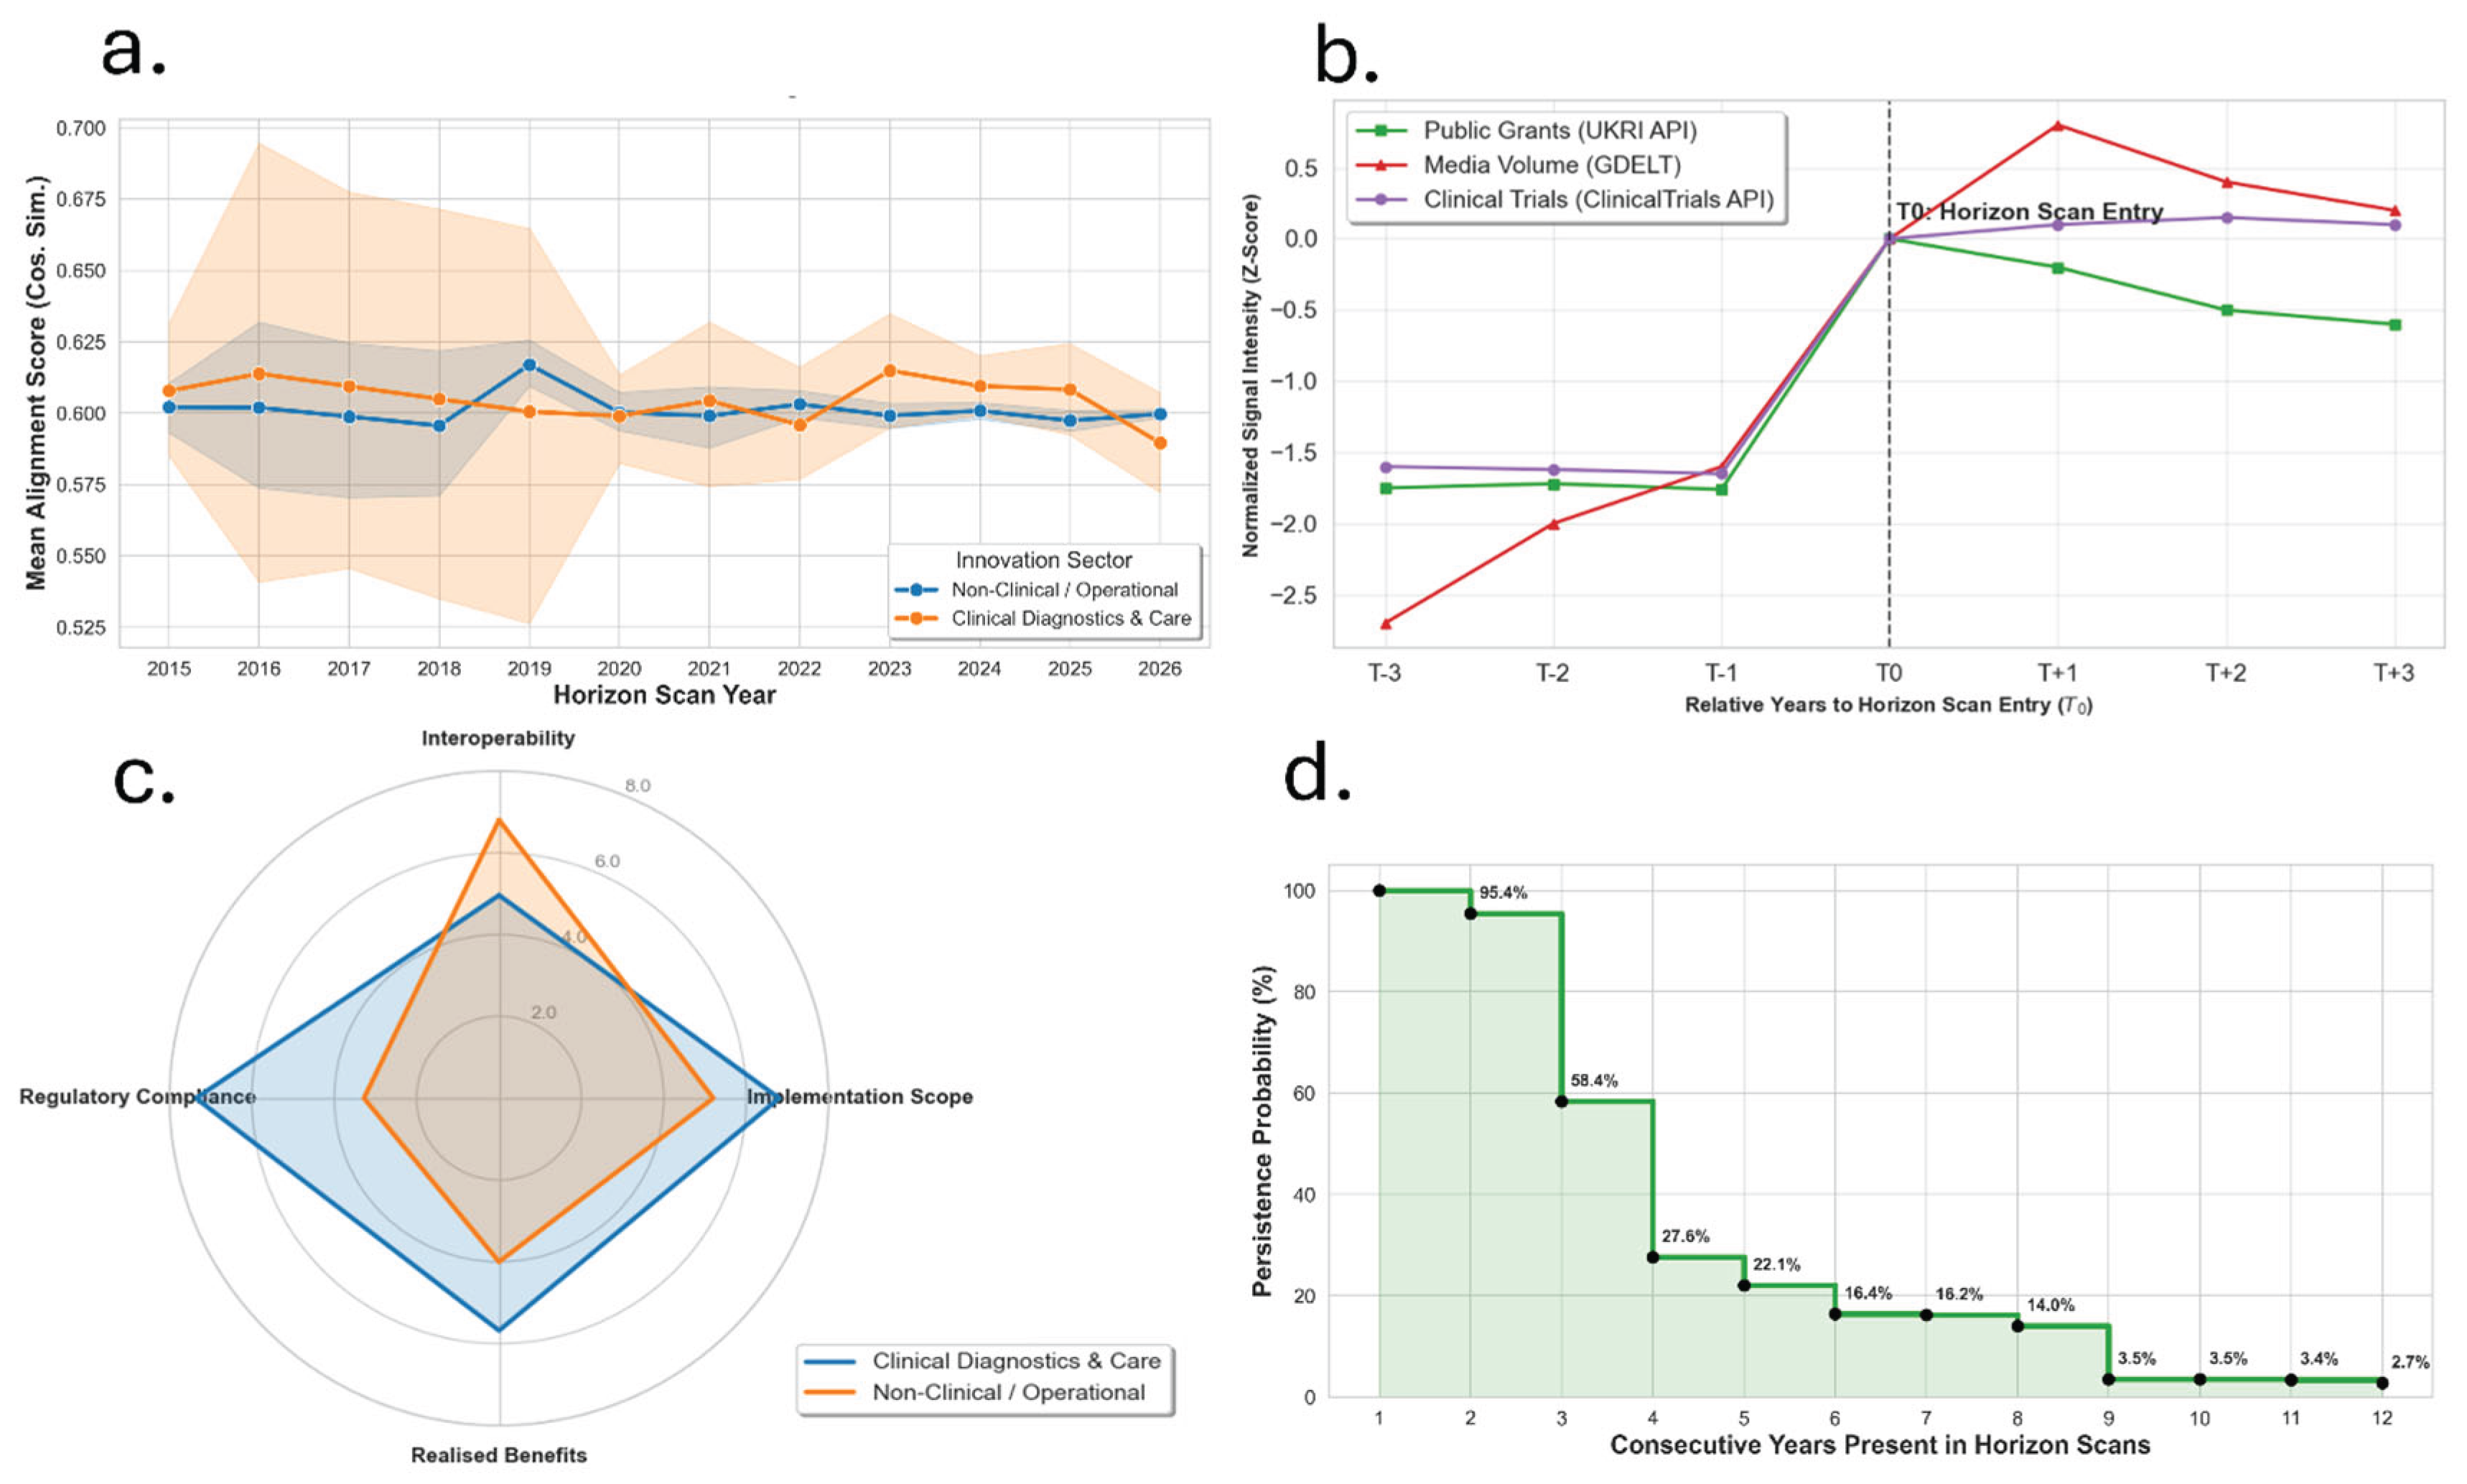
Table 2a.
Initial non-nested company-grouped cross-validation performance. Values are reported as mean ± standard deviation across the five GroupKFold cross-validation folds. For the classification task, the positive class was defined as company reappearance in the subsequent annual horizon-scanning cycle and represented 34.79% of observations. This established a prevalence-based no-skill reference of 0.348 for average precision. A classifier assigning every observation to the majority negative class would achieve a positive-class F1-score of 0, while a classifier assigning every observation to the positive class would achieve an approximate F1-score of 0.516 at the observed prevalence. These initial estimates are retained for methodological transparency and baseline comparison. Because the same company-grouped cross-validation structure informed hyperparameter selection and performance reporting, they may be affected by model-selection optimism and were not used as the principal estimates of company-level generalisation.
Table 2a.
Initial non-nested company-grouped cross-validation performance. Values are reported as mean ± standard deviation across the five GroupKFold cross-validation folds. For the classification task, the positive class was defined as company reappearance in the subsequent annual horizon-scanning cycle and represented 34.79% of observations. This established a prevalence-based no-skill reference of 0.348 for average precision. A classifier assigning every observation to the majority negative class would achieve a positive-class F1-score of 0, while a classifier assigning every observation to the positive class would achieve an approximate F1-score of 0.516 at the observed prevalence. These initial estimates are retained for methodological transparency and baseline comparison. Because the same company-grouped cross-validation structure informed hyperparameter selection and performance reporting, they may be affected by model-selection optimism and were not used as the principal estimates of company-level generalisation.
|
CLASSIFICATION MODELS |
ALGORITHM | F1 SCORE | ROC-AUC | AVERAGE PRECISION |
| Analytical no-skill reference | 0.52 | 0.5 | 0.35 | |
| Random Forest | 0.85±0.17 | 0.58±0.18 | 0.61±0.15 | |
| XGBoost | 0.83±0.17 | 0.59±0.19 | 0.61±0.18 | |
| Extra Trees | 0.85±0.16 | 0.58±0.16 | 0.59±0.16 | |
| Logistic Regression | 0.72±0.15 | 0.63±0.14 | 0.60±0.15 | |
|
REGRESSION MODELS |
ALGORITHM | R2SCORE | RMSE | |
| Mean-prediction baseline | −0.006 ± 0.006 |
1.277 ± 0.143 |
||
| XGBoost | 0.59±0.04 | 0.52±0.01 | ||
| Extra Trees | 0.58±0.03 | 0.53±0.03 | ||
| Ridge Regression | 0.58±0.02 | 0.53±0.03 | ||
| Random Forest | 0.58±0.04 | 0.52±0.02 | ||
Table 2b.
Revised nested company-grouped cross-validation performance. Values are reported as mean ± standard deviation across five held-out outer GroupKFold folds. Hyperparameter selection was conducted using inner three-fold GroupKFold restricted to each outer-training partition. These nested results were used for the principal interpretation of model performance. Comparisons with training-fold mean and direct carry-forward regression baselines are reported in Supplementary Table S7, Panel A.
Table 2b.
Revised nested company-grouped cross-validation performance. Values are reported as mean ± standard deviation across five held-out outer GroupKFold folds. Hyperparameter selection was conducted using inner three-fold GroupKFold restricted to each outer-training partition. These nested results were used for the principal interpretation of model performance. Comparisons with training-fold mean and direct carry-forward regression baselines are reported in Supplementary Table S7, Panel A.
|
CLASSIFICATION MODELS |
ALGORITHM | PRECISION | RECALL | F1 SCORE | ROC-AUC | AVERAGE PRECISION | |||
| Random Forest | 0.66±0.06 | 0.17±0.1 | 0.26±0.11 | 0.85±0.03 | 0.62±0.03 | ||||
| XGBoost | 0.71±0.05 | 0.63±0.07 | 0.67±0.05 | 0.89±0.02 | 0.72±0.04 | ||||
| Extra Trees | 0.68±0.09 | 0.11±0.02 | 0.19±0.0 | 0.82±0.03 | 0.58±0.06 | ||||
| Logistic Regression | 0.63±0.06 | 0.39±0.03 | 0.48±0.04 | 0.82±0.02 | 0.61±0.05 | ||||
|
REGRESSION MODELS |
ALGORITHM | R2 SCORE | RMSE | ||||||
| XGBoost | 0.35±0.09 | 0.99±0.07 | |||||||
| Extra Trees | 0.40±0.10 | 0.96±0.08 | |||||||
| Random Forest | 0.33±0.11 | 1.01±0.08 | |||||||
| Ridge Regression | 0.16±0.2 | 1.12±0.06 | |||||||
Table 3.
Functional comparison between conventional manual horizon scanning and the AI-assisted workflow evaluated in this study.
Table 3.
Functional comparison between conventional manual horizon scanning and the AI-assisted workflow evaluated in this study.
| Workflow component | Conventional manual approach | AI-assisted workflow in this study |
|---|---|---|
| Evidence retrieval | Analysts identify, search, reconcile and review relevant sources through an expert-led process | Structured retrieval from multiple external sources used to enrich company-year profiles |
| Entity reconciliation | Manual comparison of company and product names | Prespecified harmonisation and deduplication procedures, with manual resolution where required |
| Longitudinal structure | Often undertaken scan by scan | Company-year profiles analysed across successive cycles |
| Evidence assessment | Expert interpretation of heterogeneous documents | Deterministic maturity scoring and quantitative feature construction followed by expert interpretation |
| Prioritisation | Expert judgement and discussion |
Predictive probabilities and semantic clustering used to identify candidates for further evidence review; not used as evidence of procurement readiness, implementation or adoption |
| Synthesis | Analyst-led narrative preparation | Role-separated synthesis of supplied analytical outputs, followed by human review for traceability, numerical consistency, preservation of uncertainty and unsupported claims |
| Consistency | Supported by analyst expertise, standard operating procedures and documentation, with consistency dependent on their application. | Prespecified inputs, roles, scoring rules and review criteria |
| Final accountability | Human analyst | Human reviewer; agents did not make final decisions |
| Evidence of comparative superiority | Established professional practice | Not assessed in this study |
Disclaimer/Publisher’s Note: The statements, opinions and data contained in all publications are solely those of the individual author(s) and contributor(s) and not of MDPI and/or the editor(s). MDPI and/or the editor(s) disclaim responsibility for any injury to people or property resulting from any ideas, methods, instructions or products referred to in the content. |
© 2026 by the author. Licensee MDPI, Basel, Switzerland. This article is an open access article distributed under the terms and conditions of the Creative Commons Attribution (CC BY) license.
Copyright: This open access article is published under a Creative Commons CC BY 4.0 license, which permit the free download, distribution, and reuse, provided that the author and preprint are cited in any reuse.