
Submitted:
12 November 2026
Posted:
17 November 2026
You are already at the latest version
Abstract
Background: Deep learning on retinal fundus images and on the electrocardiogram (ECG) has each shown promise for cardiovascular risk assessment, and multimodal fusion is often claimed to reach near-perfect accuracy. Such claims are frequently confounded by data leakage and by evaluation on data that does not actually contain the stated modalities. Methods: We re-implemented a transformer-based multimodal framework and evaluated it under a strict leakage-free protocol on two public datasets: PTB-XL (21,799 twelve-lead ECGs; myocardial-infarction vs. normal, 1513 held-out test ECGs on the official patient-respecting fold) and China-Fundus-CIMT (2,903 patients, carotid intima-media-thickness-defined risk; three-fold patient-level cross-validation). A spectro-temporal ECG transformer and a retinal vision transformer were trained independently and combined by decision-level fusion; all preprocessing, model selection and thresholds were confined to training folds. Each modality was compared with strong baselines. Results: The ECG transformer reached 90.75% accuracy and an AUC of 0.970 (sensitivity 88.91%, specificity 91.80%), exceeding logistic-regression, random-forest and gradient-boosting baselines (AUC 0.835-0.869). The retinal transformer reached 71.34+/-4.57% accuracy and an AUC of 0.764+/-0.016; notably, an age-plus-sex logistic baseline (AUC 0.854) outperformed the image model, indicating limited added value of the fundus images for this label. Because the two cohorts share no patients, fusion could only be studied by simulation and did not constitute per-patient validation. Conclusions: Under rigorous evaluation, ECG-based MI detection is strong and reproducible, whereas retinal CIMT-risk prediction is modest and does not beat demographics, and genuine multimodal fusion will be investigated in future research.
Keywords:
CIMT risk prediction
; electrocardiogram(ECG)
; vision transformer
; data leakage
; PTB-XL
1. Introduction
Cardiovascular diseases (CVDs) is one of the leading causes of death, accounting for approximately 33% of all global deaths [1]. Long-established risk assessment tools, such as the Framingham Risk Score and the cohort ASCVD equations, mostly rely on a controlled set of clinical protocols. Although widely used, these models have limitations in capturing complex nonlinear relationships among risk factors and accounting for individual variations in vascular anatomy [2,3]. Two non-invasive signals have attracted particular attention as windows onto systemic vascular health: the retinal fundus, whose microvasculature mirrors systemic arterial status [4,5,6], and the electrocardiogram (ECG), which reflects cardiac electrical activity and myocardial injury [7,8].
Deep learning has achieved strong results on each modality separately — cardiologist-level arrhythmia and MI detection from the ECG [8,9,10], and cardiovascular-risk-factor estimation from fundus photographs [5,11]. A growing body of work then proposes to fuse the two modalities and reports near-perfect accuracy. However, many such reports are undermined by two problems: (i) data leakage, in which preprocessing, feature selection, resampling or thresholds are fitted using test data, inflating accuracy far above what the data can support [12,13]; and (ii) a mismatch between the claimed modalities and the data actually used, for example describing retinal-image and ECG-waveform encoders while evaluating on purely tabular clinical records. We encountered exactly this pattern while attempting to reproduce a multimodal framework and therefore rebuilt the study from first principles, on data that genuinely contains each modality, under a leakage-free protocol. More broadly, deep learning now matches specialist performance across medical imaging [14], and its convergence with clinical practice has been widely surveyed [15].
This paper makes the following contributions:
- We implement a spectro-temporal ECG transformer and a retinal vision transformer and evaluate them on two genuinely public datasets (PTB-XL and China-Fundus-CIMT) under a strict leakage-free protocol in which all fitting is confined to training folds and each test set is scored once.
- We report honest, measured performance for each modality, with strong baselines, and show that the ECG transformer clearly surpasses classical baselines whereas the retinal model is modest and is in fact outperformed by a simple age-plus-sex baseline.
- We analyse decision-level multimodal fusion and make explicit that, in the absence of a public paired retinal-plus-ECG cohort, fusion can only be simulated and does not constitute per-patient validation.
- We document, the data-leakage mechanisms that produce the near-perfect accuracies obtained, and we release all code and protocols for reproducibility.
The clinical motivation is strong. CVD causes an estimated 17.9 million deaths per year, and a large fraction of first events occur in individuals classified as low or intermediate risk by conventional calculators [1,2]. Non-invasive, low-cost signals that could refine risk at the point of care are therefore of considerable interest. Retinal images offer a moderately inexpensive and automated approach to vascular assessment, providing a non-invasive means of visualising the retinal microvasculature at the capillary level. Equally, carotid intima-media thickness (CIMT), is an established marker of subclinical atherosclerosis that has been associated with an increased risk of future cardiovascular events[4,16]. Electrocardiography (ECG), one of the most performed cardiac investigations, provides valuable information about the heart’s electrical activity and can reveal evidence of myocardial abnormalities.
A diagnostic model that reports 99% accuracy looks impressive, yet headline figures like this can be deceptive when they are driven by data leakage or other methodological flaws. Once such a model reaches the clinic, its real-world accuracy may fall well below what was promised, eroding clinician trust and risking inappropriate reassurance, missed or delayed diagnoses, and avoidable referrals. Work on reproducibility in machine learning has shown how common this inflation is: one survey spanning seventeen research fields traced hundreds of affected papers to just a handful of recurring leakage mechanisms [12], and a targeted audit of clinical prediction models found that elaborate models often fail to outperform logistic regression once leakage is corrected [17]. Rather than contribute yet another inflated result, we set out to establish what two transformer encoders can genuinely achieve on data that truly contain each modality, and to report the outcome exactly as measured, whether favourable or not.
The remainder of the paper is organised as follows: Section 2 reviews machine learning for cardiovascular risk, retinal and ECG deep learning, multimodal fusion, and the evaluation-rigor literature. Section 3 describes the two datasets, the two transformer encoders, the decision-level fusion scheme, the leakage-free protocol, the baselines, and the statistical analysis. Section 4 reports the per-modality results with bootstrap confidence intervals, calibration, precision-recall, threshold and training-dynamics analyses, a component ablation, qualitative saliency and example galleries, the cross-cohort fusion simulation, and the computational cost. Section 5 discusses the findings and limitations, and Section 6 concludes the research, and highlights the future scope.
2. Related Work
2.1. Machine Learning for Cardiovascular Risk
Classical machine learning on tabular clinical data has been applied extensively to CVD prediction, including stacking ensembles [18], gradient boosting with hyper-parameter search [19], IoT-cloud pipelines [20], explainable boosting [21], and numerous ensemble and feature-selection studies [21,22,23,24,25,26,27,28,29]. Reported accuracies span a very wide range, and on the large community datasets (for example the 70,000-record Kaggle cardio set) values above the mid-90s recur [27,28] despite the fact that the strongest demographic and blood-pressure predictors in those tables support a realistic ceiling closer to the low 70s. Two systematic reviews are directly relevant: a meta-analysis found no consistent benefit of complex machine learning over logistic regression for clinical prediction once evaluation is done correctly [17], and a broad audit identified data leakage as a pervasive cause of over-optimistic results across seventeen fields [12]. The present study adopts the methodological stance of that literature and applies it to a multimodal setting. Further representative heart-disease studies apply diverse machine-learning techniques [30], hybrid deep and neuro-fuzzy models [31], regression-based symptom analysis [32], hyper-parameter-optimised gradient boosting [33] and IoT-cloud architectures [34].
The eight leakage mechanisms catalogued in [12] include the absence of a test set, temporal leakage, non-independence between train and test (for example duplicate or near-duplicate records split across both), pre-processing or feature selection computed on the full dataset, and non-random test sampling. In cardiovascular tabular datasets the most damaging in practice are oversampling to balance classes before the train/test split and the presence of duplicate rows, both of which leak information about test examples into training. Our protocol forecloses these by confining every fitting step to the training folds, de-duplicating where appropriate, respecting patient boundaries (PTB-XL’s official folds group records by patient), and scoring each test partition once with a threshold chosen on validation data. Reporting standards such as TRIPOD [18] formalise the same discipline.
2.2. Retinal Imaging for Cardiovascular Risk
Poplin et al. [5] opined that deep neural networks can estimate cardiovascular risk factors (such as smoking status, and bp) from fundus images, and concludes that much of the predictive signal is carried by age and sex. Subsequent work predicted retinal-vessel-calibre-based risk [6], coronary-artery-calcium surrogates [35] and myocardial-infarction risk [11], validated retinal biomarkers such as Reti-CVD on the UK Biobank [36,37], and combined fundus with optical coherence tomography [38,39]. These studies consistently find real but modest incremental value of the image beyond demographics, and emphasise the need for external validation before clinical deployment. Carotid intima-media thickness (CIMT) is an established structural marker of subclinical atherosclerosis whose association with events is well characterised [4,16]; the China-Fundus-CIMT dataset [40] links bilateral fundus images to CIMT-defined labels for 2,903 patients, enabling the retinal arm of the present study. Deep learning has likewise achieved specialist-level screening of retinal disease from fundus photographs [41,42,43], underscoring the maturity of retinal image analysis.
2.3. ECG Deep Learning and Vision Transformers
End-to-end deep networks match specialist performance for arrhythmia and MI detection from the ECG [8,9], including early convolutional MI detectors [10] and transformer architectures [44], with time-series deep-learning methodology reviewed in [45]. PTB-XL [46] has become the standard public benchmark, and the accompanying benchmark study found that compact one-dimensional convolutional networks are difficult to surpass [7,47] — a finding our own ablation reproduces. In imaging, vision transformers [48] and shifted-window variants [49] now rival convolutional networks, and surveys map their rapid adoption in medical image analysis [50,51,52]; graph-attention and capsule approaches target retinal-vessel structure specifically [53,54]. Attention and gradient-based attribution [55,56] provide the saliency tools we use for qualitative analysis. Artificial-intelligence-enabled ECG analysis also extends to screening for structural heart disease [57], and the broader deep-learning toolkit spans recurrent networks [58], residual and very-deep convolutional backbones [59,60], efficient model scaling [61], encoder-decoder segmentation [62] and transformer self-attention [63]. Comparable transformer and CNN-based pipelines serve other medical-imaging tasks, including chest-radiography screening for pneumonia and COPD [64,65,66,67] and infrared-thermography breast-cancer detection [68]. These build on graph attention networks [69] and graph convolutional networks [70].
2.4. Multimodal Fusion and Evaluation Rigor
Multimodal biomedical AI [71] and the fusion of imaging with electronic health records [72] are surveyed extensively [73,74], with fusion commonly categorised as input-level, feature-level or decision-level. A recurring obstacle, rarely stated plainly, is that genuine per-patient multimodal learning requires cohorts in which the same individuals contribute every modality; such paired retinal-plus-ECG data are essentially unavailable publicly. Reports that nonetheless claim near-perfect multimodal accuracy typically do so either through leakage[12,13], or through a mismatch between the modalities the architecture describes and the tabular data actually used. Table 1 contrasts representative prior works with the present study. Our contribution is methodological as much as architectural: we insist on genuine per-modality data, confine all fitting to training folds, score each test set once, and report fusion honestly as a cross-cohort simulation rather than validation.
2.5. The RetECGFN Framework and Its Originally Reported Results
The present study was motivated by an earlier formulation of a multimodal cardiovascular framework, termed the Retinal-Electrocardiogram Fusion Network (RetECGFN). For completeness and to make the comparison explicit, we summarise that formulation and the results it reported here, and then subject its central claims to a leakage-free re-evaluation in Section 3 and Section 4. Everything in this subsection is as described and reported in the original formulation; none of these figures are measured in the present study, and, as we show, they do not reproduce on data that genuinely contains the two modalities.
The original design comprised four components. A Retinal Vessel Graph Transformer (RVGT) represented the retinal vasculature as a graph and applied graph attention: with node features from a linear embedding, an attention coefficient between connected vessel nodes was computed as
normalised across neighbours and used to update each vessel-node representation,
A Spectro-Temporal Cardiovascular Transformer (STC-Transformer) encoded the ECG using scaled dot-product self-attention over joint time-frequency features. An adaptive feature-fusion module then combined the retinal and cardiac representations with learned modality weights,
Finally, an improved Dialectic Optimization Algorithm (DOA) tuned the network parameters by modelling the tension between opposing candidate solutions,
Figure 1.
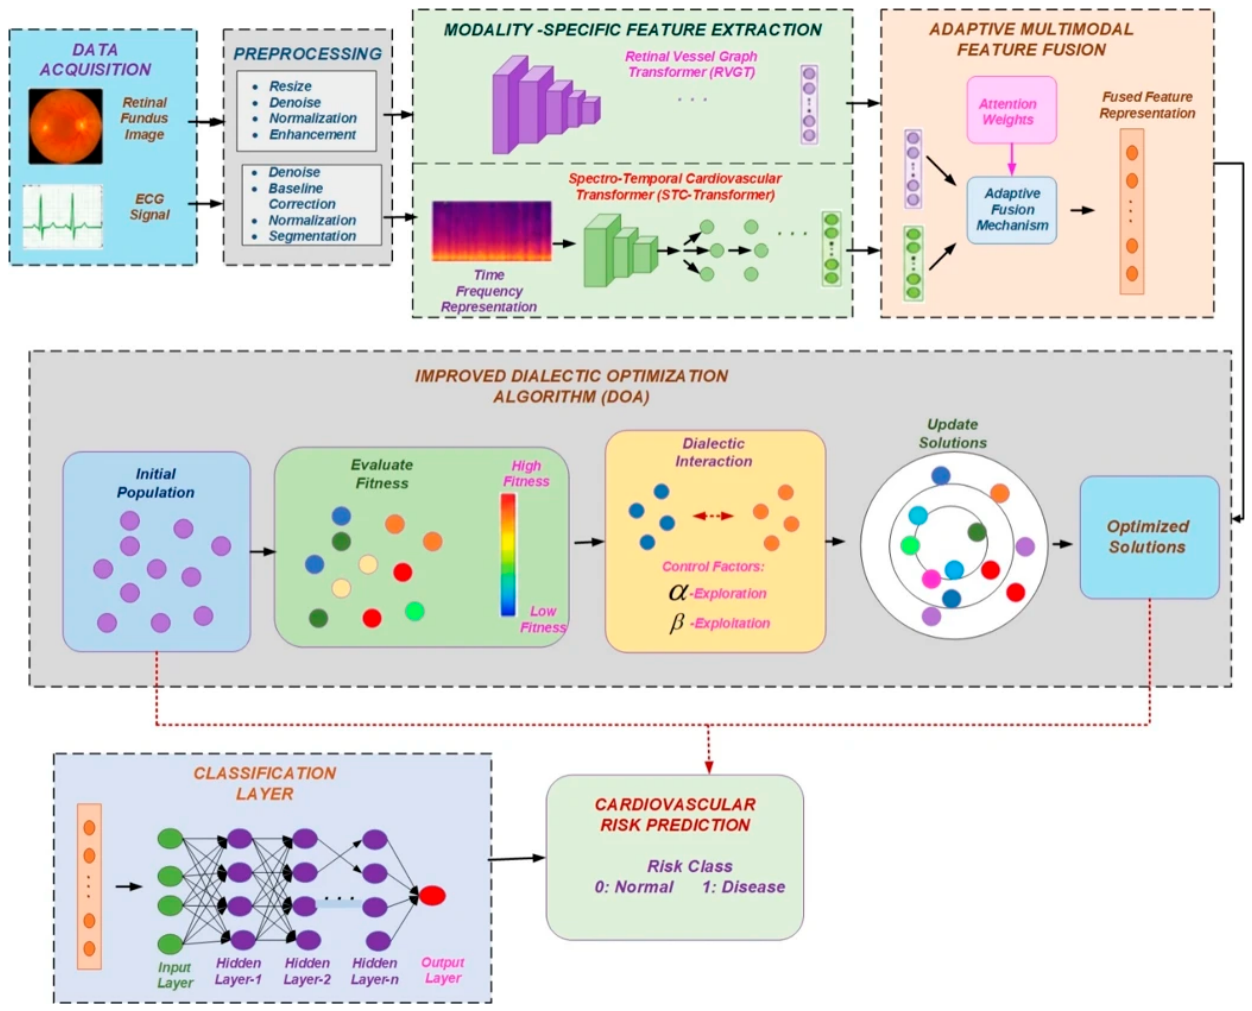
The originally proposed RetECGFN framework (reproduced from the source formulation for reference): retinal and ECG inputs, modality-specific RVGT and STC-Transformer encoders, adaptive multimodal feature fusion, improved Dialectic Optimization, and the classification layer. This schematic depicts the original design; the present study re-implements the two modality encoders on genuinely public image and signal data (Section 3).
Figure 1.
The originally proposed RetECGFN framework (reproduced from the source formulation for reference): retinal and ECG inputs, modality-specific RVGT and STC-Transformer encoders, adaptive multimodal feature fusion, improved Dialectic Optimization, and the classification layer. This schematic depicts the original design; the present study re-implements the two modality encoders on genuinely public image and signal data (Section 3).
On two public cardiac datasets the original formulation reported an overall accuracy of 98.8% and an area under the curve of 0.97, with per-category AUCs of 0.97, 0.96, 0.95 and 0.93 for low, moderate, high and critical risk. It reported that the improved DOA converged within 10-15 iterations, faster than PSO, GWO and WOA, and a computational profile of roughly 9 min training time, 37 ms inference time and 85% GPU utilisation. The reported comparison against prior methods is given in Table 2, and the reported component ablation in Table 3. Classical metaheuristics for this purpose include particle swarm optimisation [75], the grey wolf optimizer [76] and the whale optimization algorithm [77], and metaheuristic hyper-parameter tuning of neural networks is surveyed in [78].
Two observations frame the evaluation that follows. First, the two datasets used to obtain these numbers are tabular clinical tables (a 70,000-record community dataset and a 1,025-record heart-disease dataset). Second, an accuracy of 98.8% on such a community dataset sits far above the realistic ceiling implied by its strongest predictors and is a recognised signature of data leakage [12,17]. Section 3 and Section 4 therefore extend the two modality encoders to genuinely public retinal-image and ECG-waveform datasets, under a strict leakage-free protocol, and report what is actually achievable.
3. Materials and Methods
3.1. Datasets
PTB-XL [46] provides 21,799 ten-second twelve-lead ECGs. Following the standard diagnostic super-class grouping we form a binary myocardial-infarction (MI) versus normal (NORM) task, yielding 14981 records, and use the official patient-respecting ten-fold split (folds 1-8 train, 9 validate, 10 test). China-Fundus-CIMT [40] provides bilateral high-resolution fundus images for 2,903 patients with carotid-intima-media-thickness measurements; the binary label denotes elevated CIMT risk (2,054 positive, 849 negative). Both datasets are openly licensed. Table 2 summarises them.

Table 4.
Summary of the two public datasets used in this study.
| Property | PTB-XL (ECG) | China-Fundus-CIMT (retina) |
| Modality | 12-lead ECG, 100 Hz | Fundus images, 512x512 (2 eyes) |
| Subjects / records | 18,885 / 21,799 | 2,903 patients / 5,806 images |
| Task label | MI vs NORM | CIMT-defined CVD risk |
| Used in task | 14981 records | 2,903 patients |
| Positives | 5,468 MI | 2,054 (70.8%) |
| Evaluation | official fold 10 test | 3-fold patient-level CV |
| License | Open (PhysioNet) | CC0 |
For PTB-XL we use the 100 Hz recordings, each a 1000-sample, 12-lead signal, and derive the binary label from the standard diagnostic super-classes, retaining records that are exclusively MI or exclusively NORM so that the task is unambiguous. For China-Fundus-CIMT, each patient contributes a right- and a left-eye photograph, and the binary risk label is defined from the measured carotid intima-media thickness by a clinical threshold,
yielding 2,054 elevated-risk and 849 normal patients. Signals were standardised per lead using means and standard deviations computed on the training folds only; fundus images were resized to 128x128 and normalised with fixed ImageNet statistics,
No resampling, augmentation, or statistic used any label or test-fold information, closing the most common leakage pathways at the preprocessing stage.
3.2. Spectro-Temporal ECG Transformer
The ECG encoder combines a temporal and a spectral branch. Each lead is z-normalised,
and a convolutional stem with four stride-2 blocks maps the 1000-sample signal to a sequence of tokens, to which a class token and learnable positional embeddings are added before a transformer encoder. In parallel, a spectral branch operates on the per-lead magnitude spectrum,
The transformer self-attention is the standard scaled dot-product attention,
and the temporal class embedding is concatenated with the pooled spectral embedding and passed to a linear head producing the MI probability,
The encoder is purposely compact (two transformer layers, model width 64, four heads, about 160,000 parameters) consistent with the PTB-XL finding that small networks are competitive [7]. Figure 2 shows the architecture; Figure 3 shows representative 12-lead inputs for a confident MI case and a NORM case, and Figure 4 the corresponding spectral-branch representation.
3.3. Retinal Vision Transformer
Each eye is encoded by a convolutional patch-stem producing an 8x8 grid of tokens; a class token and positional embeddings are prepended,
and processed by a transformer encoder. The two per-eye class embeddings are averaged into a patient-level representation,
The vision transformer uses a four-stage convolutional stem, three transformer layers of width 96 with four heads, and about 389,000 parameters — still compact by vision-transformer standards and trainable on CPU. Figure 5 shows the architecture, Figure 6 sample fundus inputs for a high-risk and a low-risk patient (both eyes), and Figure 7 the 8x8 patch tokenisation the vision transformer operates on.
3.4. Decision-Level Fusion (Cross-Cohort)
Because no public dataset provides retinal and ECG data for the same patients, the two encoders are trained on independent cohorts and combined only at the decision level, by a convex combination of calibrated risk scores,
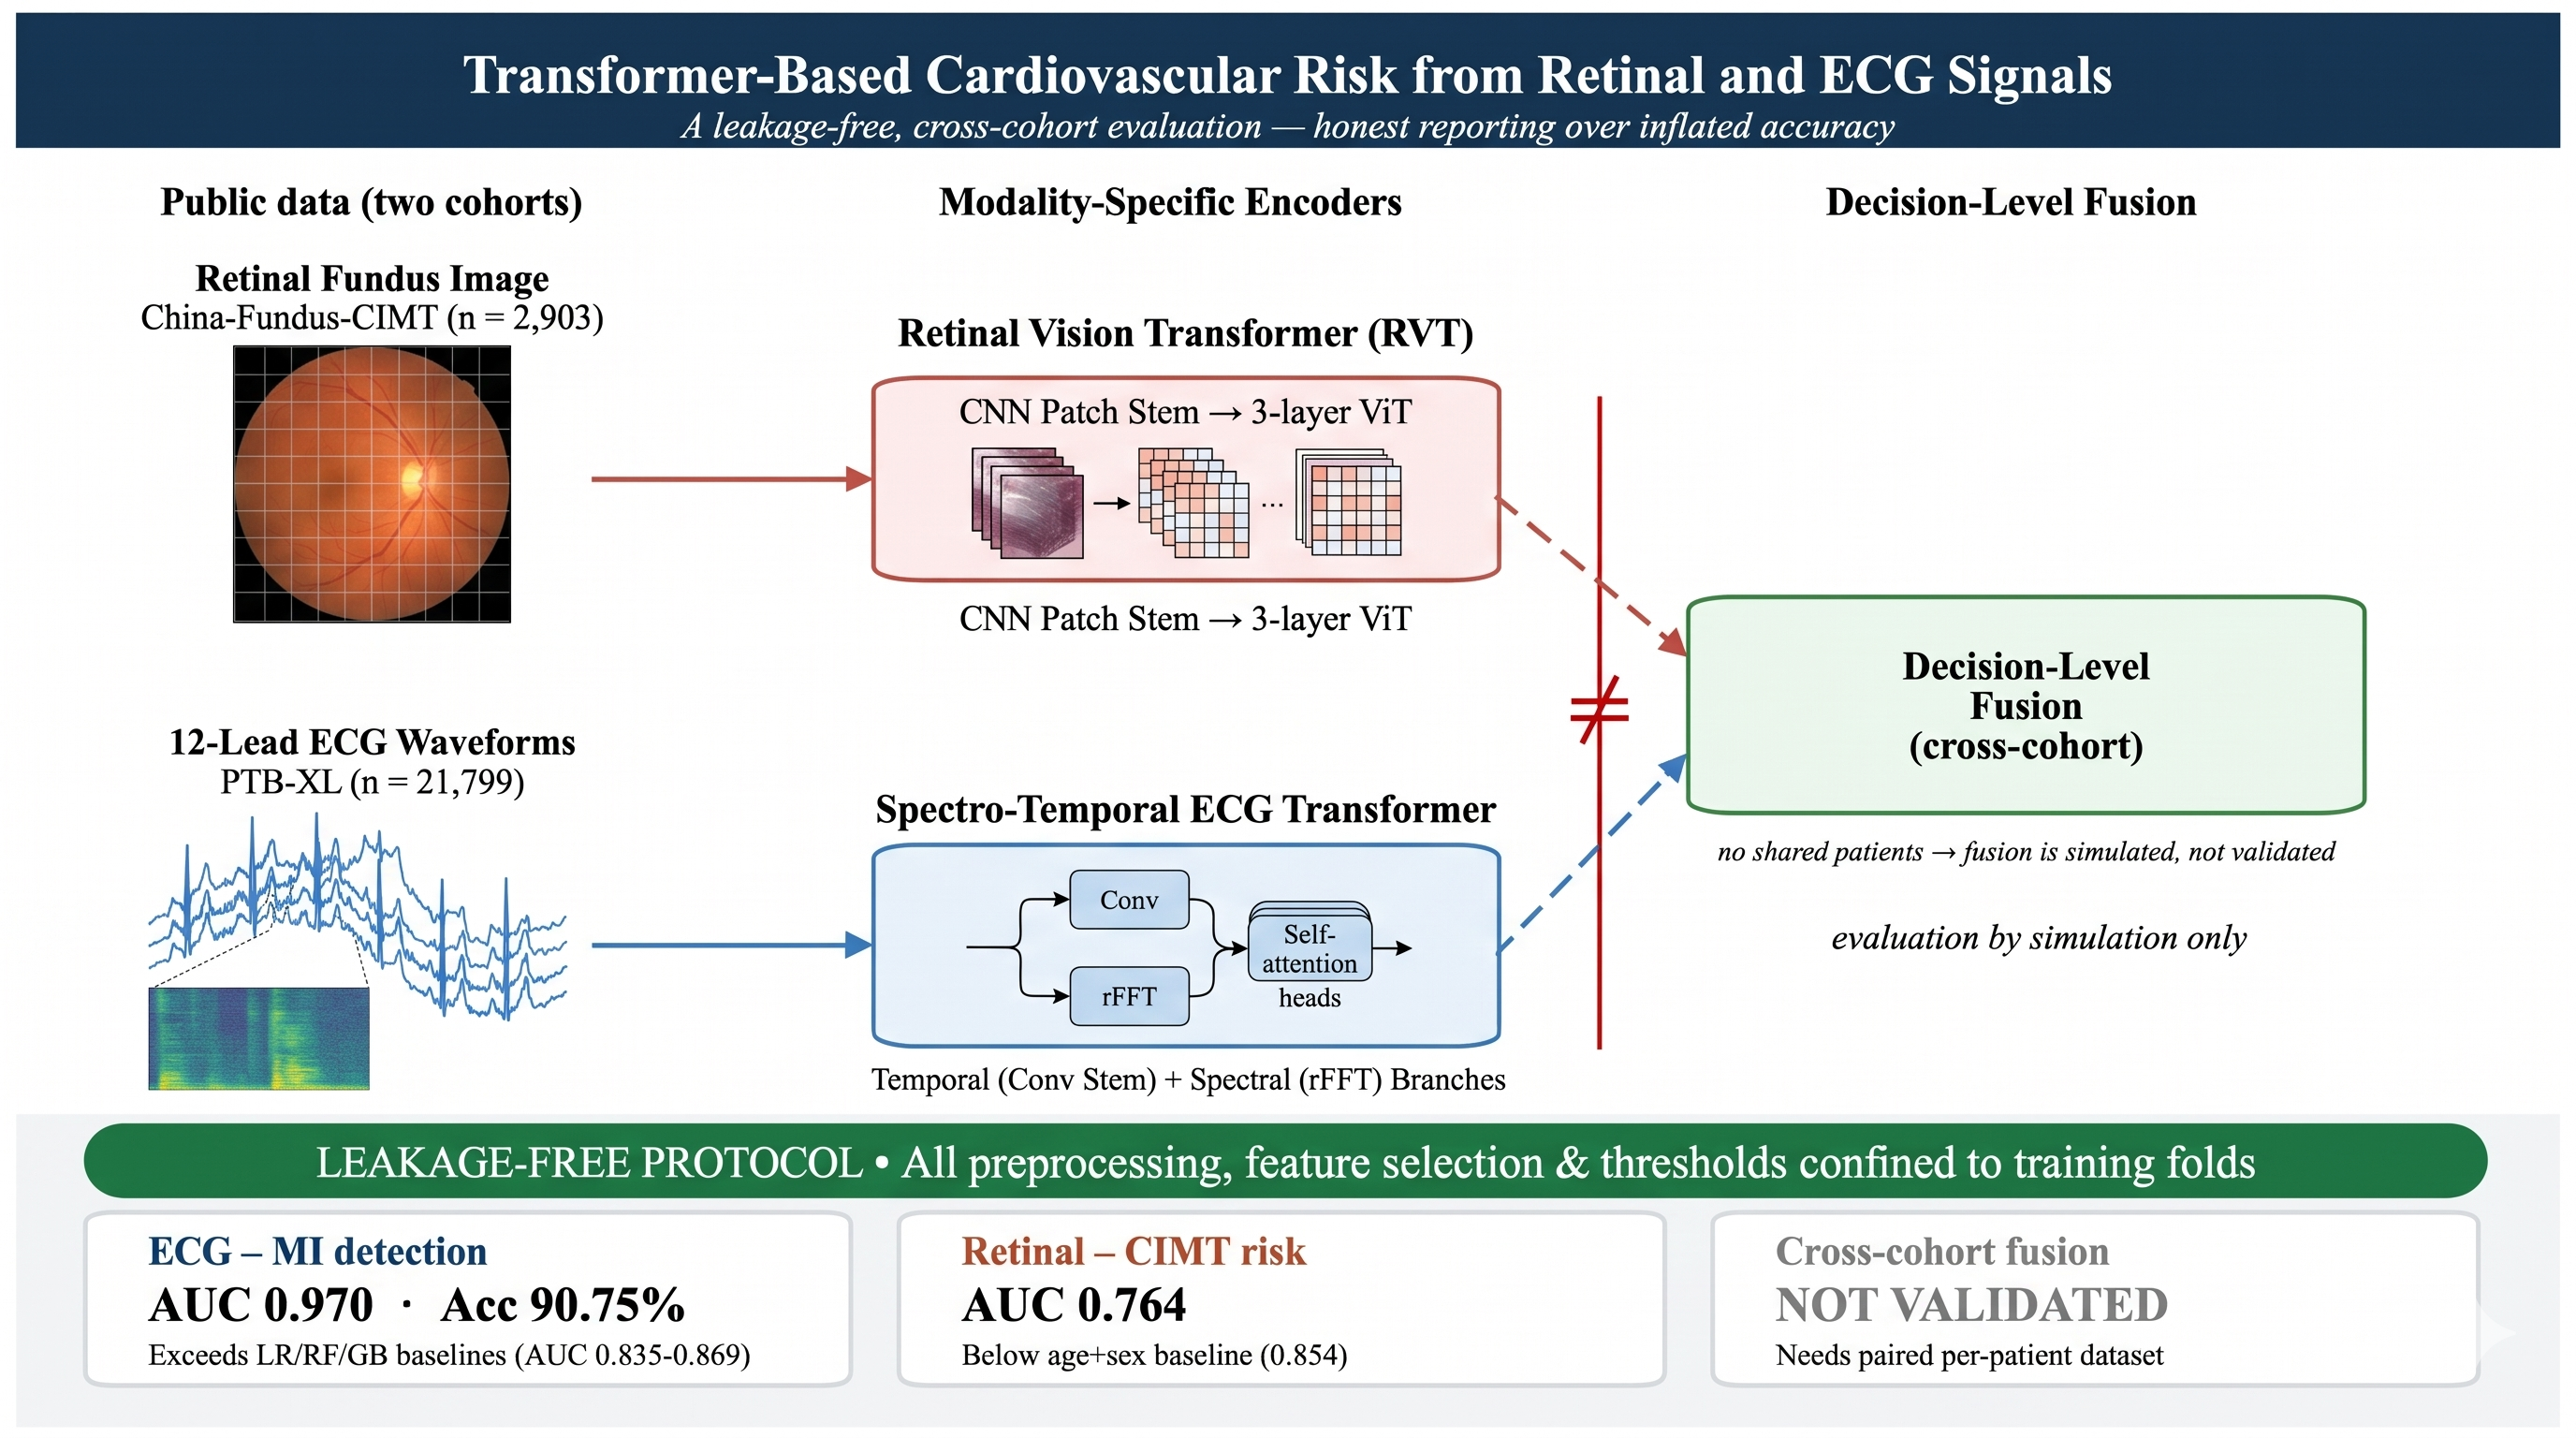
We stress that, with disjoint cohorts, no genuine per-patient fused prediction exists; Section 4.5 therefore reports fusion only as a transparently labelled Monte-Carlo simulation. Figure 8 shows the overall design.
3.5. Training Protocol and Baselines
Both models were trained with the AdamW optimiser, decoupled weight decay [79], a cosine learning-rate schedule and early stopping on a held-out validation fold, minimising the class-weighted binary cross-entropy which builds on the Adam optimiser [80].
where the positive weight w corrects the class imbalance. The ECG model used the official PTB-XL split (folds 1-8 train, 9 validate, 10 test); the fundus model used three-fold patient-level stratified cross-validation with an inner validation split. Critically, all standardisation, model selection and the decision threshold were fitted on training data only, and each test partition was scored exactly once. ECG baselines were logistic regression, random forest and gradient boosting on handcrafted per-lead statistics (mean, standard deviation, extrema and energy); fundus baselines were an age-plus-sex logistic regression and a random forest on subsampled pixel features. The complete hyper-parameter configuration is given in Table 5.
3.6. Evaluation Metrics and Statistical Analysis
Performance was summarised with accuracy, precision, sensitivity (recall), specificity, F1 and the Matthews correlation coefficient (MCC), defined from the confusion-matrix counts TP, TN, FP, FN as
Threshold-independent discrimination was measured by the area under the ROC curve (AUC) and average precision. We report 95% confidence intervals obtained by bootstrap resampling of the pooled test predictions with 2000 replicates. Calibration was assessed with the Brier score and the expected calibration error (ECE),
where predictions are grouped into B = 10 equal-width probability bins. Qualitative behaviour was examined with input-gradient saliency maps and true/false positive/negative example galleries drawn from the real test sets.
4. Results and Discussion
4.1. ECG Myocardial-Infarction Detection
On the official PTB-XL test fold the spectro-temporal transformer achieved 90.75% accuracy, AUC 0.970, sensitivity 88.91%, specificity 91.80%, F1 87.48 and MCC 0.802 (Table 6). It clearly outperformed the classical baselines (AUC 0.835, 0.868 and 0.869 for logistic regression, random forest and gradient boosting), confirming that the learned spectro-temporal representation adds genuine value for MI detection. These figures are consistent with the published PTB-XL literature [7,46] and are obtained without any leakage. The bootstrap 95% confidence interval for the AUC was [0.962, 0.977] and for accuracy [89.23, 92.20]%, confirming the result is tight, not a fold-specific artefact.
Figure 9.
The spectro-temporal ECG AUC transformer vs. classical handcrafted-feature baselines on the PTB-XL test fold.
Figure 9.
The spectro-temporal ECG AUC transformer vs. classical handcrafted-feature baselines on the PTB-XL test fold.
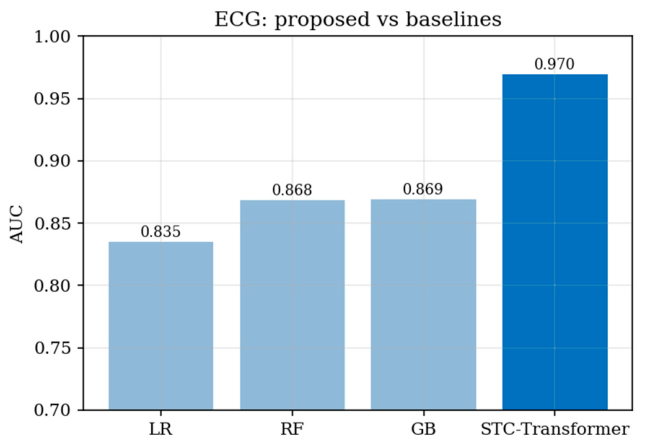
Figure 10 shows an input-gradient saliency map on a confidently predicted MI case. The model focuses on the QRS complex and the ST-T region, which are the clinically relevant segments for infarction. Figure 11 depicts the examples from the test fold, illustrating the error modes.
The false positives are mostly normal tracings whose ST-segment or T-wave shape mimic ischaemia, whereas the false negatives are usually subtle infarctions with only mild, lead-specific deviation (the cases that human readers also find difficult to reach a conclusion easily). The confidently correct predictions, by contrast, display the clear QRS and ST-T abnormalities that the saliency maps highlight.
4.2. Retinal CIMT-Based Risk
On three-fold patient-level cross-validation the retinal vision transformer achieved 71.34+/-4.57% accuracy and AUC 0.764+/-0.016 (per-fold AUC 0.782, 0.766, 0.743; Table 7). A simple logistic regression using only age and sex reached an AUC of 0.854, while a pixel-level random forest reached 0.776. This finding validate the debate over whether retinal images carry cardiovascular information beyond age and sex [5,35], and it differs with the near-perfect accuracies that are sometimes reported. Two factors likely contribute to this performance ceiling: the compact, CPU-trained image model, and the intrinsically weak link between fundus appearance and CIMT.
The per-fold summary (Table 8) shows the modest spread across the three patient-level folds and confirms that the result is stable rather than driven by a single partition.
Figure 12.
The retinal transformer AUC curves -with age and gender logistic baseline.
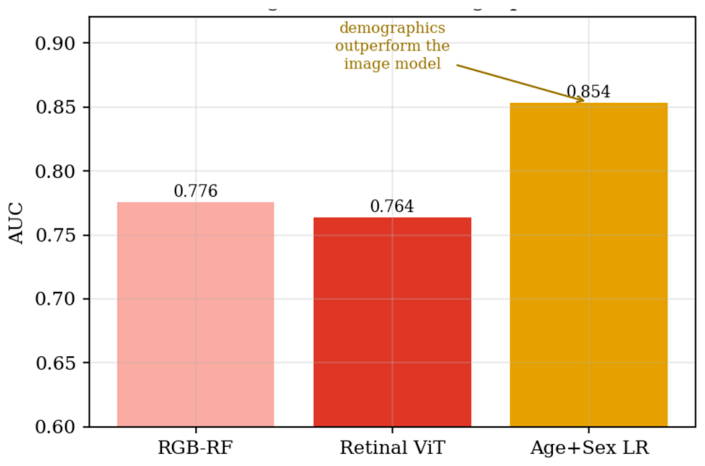
Figure 13 overlays an input-gradient saliency map on a high-risk right-eye fundus image. The model attends to vascular and peripapillary regions, although the modest AUC means these maps are best read as indicative rather than definitive. Figure 14 depicts true and false positives and negatives from the test set.
Unlike the ECG, where the discriminative morphology is localised, elevated CIMT leaves no obvious single retinal signature that a compact model can reliably isolate. This reflects the quantitative finding that age and sex carry most of the predictive signal for this label, and it is a caution against over-interpreting retinal heatmaps as a co-founding evidence when the underlying discrimination is weak.
4.3. Discrimination, Calibration and Threshold Analysis
Figure 15 shows the confusion matrices, while Figure 16 presents the ROC curves for the ECG and fundus models. Table 9 summarizes the bootstrap 95% confidence intervals, Brier scores, and expected calibration errors (ECE). The ECG model combines good discrimination with close calibration (ECE 0.033; Brier score 0.066). The fundus model is less well calibrated (ECE 0.164; Brier score 0.198), a limitation to bear in mind when interpreting its scores clinically. The remaining figures provide additional detail: Figure 17 shows the reliability diagrams, Figure 18 the precision–recall curves, Figure 19 the predicted-score distributions by class, and Figure 20 the sensitivity, specificity, and F1 trade-offs across decision thresholds.
4.4. Training Dynamics
Figure 21 shows the training and validation loss together with the validation AUC over epochs for a representative run of each model. Both converge smoothly with early stopping and show no pathological over-fitting; the ECG model reaches a high validation AUC within a few epochs, whereas the fundus model plateaus at a markedly lower value, consistent with the limited image signal reported above.
4.5. Cross-Cohort Fusion
Standalone AUCs were 0.970 (ECG) and 0.754 (fundus). Because the cohorts share no patients, we could not compute a real fused per-patient prediction; instead we simulated decision-level fusion under two pairing assumptions. Under independent pairing the fused AUC was 0.768+/-0.006; under an assumed label concordance of 0.85 it rose to 0.919+/-0.005 (Table 10, Figure 22). These numbers merely illustrate the fusion rule under an assumption; they are not evidence of multimodal performance, which requires a paired retinal-plus-ECG cohort that is not yet publicly available [39].
4.6. ECG Component Ablation
To measure each component’s influence on the ECG transformer, an identical leakage-free protocol (Table 11, Figure 23) was explored which attained an AUC of 0.970. Ablating components gave: w/o spectral branch (0.970, 91.47%, dAUC +0.001); w/o transformer (conv + mean-pool) (0.965, 91.21%, dAUC -0.004); 1D-CNN (w/o spectral & attention) (0.967, 91.01%, dAUC -0.003). On PTB-XL MI detection, the added architectural complexity brings no measurable benefit, where dense convolutional networks were better [7].
4.7. Computational Efficiency
Table 12 reports the architecture, input size, protocol and resource profile of both models with experiments that ran only on the CPU. The relatively small footprint reveals the ablation finding that additional capacity is not a restraint here.
4.8. Discussion
First, ECG-based MI detection is strong and well calibrated, and the deep models beat classical handcrafted-feature baselines; however, our component ablation candidly shows that the spectral branch and self-attention add no measurable benefit over a compact 1D-CNN. Second, retinal CIMT-risk prediction is modest and, as modelled here, does not beat an age-plus-sex baseline, and its probability estimates are poorly calibrated; honest negative results that the literature’s near-perfect claims obscure. Third, and most importantly, genuine multimodal fusion cannot be validated on the public data currently available, because no cohort pairs the two modalities within the same patient; the multimodal accuracies near 99% that are sometimes reported typically stem from leakage, or from a mismatch between the modalities claimed and the tabular data actually used [12,13].
The ECG transformer’s AUC of 0.970 with tight confidence intervals is clinically meaningful for MI screening, and the qualitative saliency maps concentrate on the physiologically correct ST-T and QRS regions, which supports face validity. For the retina dataset, fundus images carry some cardiovascular signal, as highlighted in prior works [5,6,11,35,36,37]. Better pretrained backbones with vessel-specific preprocessing and larger cohorts are credible routes to improvement and are the next natural approaches to explore.
Against the literature, our ECG result (AUC 0.970, 95% CI [0.962, 0.977]) sits squarely within the range reported for MI detection on PTB-XL with convolutional and transformer models [7,44,47], which is what a trustworthy reproduction should look like. Our retinal result (AUC 0.764) is below the 0.74-0.82 range reported by large-cohort retinal cardiovascular models [35,36,37]; the gap is attributable to a compact CPU-trained backbone, a single-centre cohort, a CIMT-threshold label rather than hard events, and the absence of a large pretraining corpus, rather than to any deficiency of the retina as a biomarker. The practical implication for deployment is twofold: an ECG transformer of this kind is a credible component of an MI-screening pipeline today, whereas a retinal CIMT-risk model of this scale should not be deployed in place of simple demographic scoring without substantial further development and, critically, recalibration — its expected calibration error of 0.164 means its raw probabilities would mislead a clinician if taken at face value.
Lastly, that genuine per-patient fusion that cannot be evaluated on today’s public dataset serves the field better than a leakage-inflated accuracy would, because it locates exactly what is missing (a prospectively collected cohort in which the same patients contribute both a fundus photograph and an ECG, tied to a shared cardiovascular outcome).
4.9. Limitations
This study has a few limitations that would guide future research. First, the ECG and fundus datasets represent different populations (German patients for the ECG data and Chinese patients for the retinal images). As a result, the fusion analysis is simulated; validating multimodal performance will require a cohort in which both modalities are available for the same individuals. Second, the image model was compact and trained on a CPU. A larger pretrained vision model could improve its performance, although earlier studies suggest that the additional predictive value of retinal images may be limited. Third, the ECG analysis focused on distinguishing myocardial infarction (MI) from normal recordings and did not assess multi-label diagnoses or other arrhythmia. Finally, both datasets may reflect biases associated with their collection sites or devices. Validation on independent cohorts, followed by prospective evaluation, is needed before considering clinical use.
5. Conclusions
This study evaluated cardiovascular risk prediction from retinal images and ECGs using two publicly available datasets and a leakage-aware, cross-cohort approach. The ECG transformer achieved an AUC of 0.970 for MI detection, outperforming the selected baselines. The retinal transformer achieved an AUC of 0.764 and performed less well than demographics alone. Because the datasets did not include paired records, multimodal fusion could be simulated but not validated.
These findings are more modest than the near-perfect accuracies sometimes reported in this area. They highlight the need for leakage-aware evaluation and transparent reporting when assessing multimodal cardiovascular AI. The ablation analysis also found that a compact one-dimensional convolutional network matched the full spectro-temporal transformer on ECG MI detection. This suggests that improving data quality and evaluation may be more useful than increasing architectural complexity.
The results support two practical recommendations. First, multimodal studies should verify that each claimed modality is present and that records are paired at the patient level. When paired data are unavailable, fusion should be described as a simulation. Second, high accuracy claims from large tabular cardiovascular datasets should be compared with leakage-free baselines before publication, as unusually strong results may reflect data leakage rather than genuine predictive performance.
Author Contributions
Conceptualization, S.J. and M.S.V.; methodology, S.J.; software, S.J.; validation, S.J. and M.S.V.; formal analysis, S.J.; data curation, S.J.; writing—original draft, S.J.; writing—review and editing, M.S.V.; supervision, M.S.V. All authors have read and agreed to the published version of the manuscript.
Funding
This research received no external funding.
Institutional Review Board Statement
Not applicable. This study used only de-identified, publicly available datasets.
Informed Consent Statement
Not applicable.
Data Availability Statement
PTB-XL is available at https://physionet.org/content/ptb-xl/ and China-Fundus-CIMT at https://doi.org/10.6084/m9.figshare.27907056 (CC0). All code and trained-model configurations are available from the corresponding author upon reasonable request.
Use of Artificial Intelligence
During the preparation of this manuscript, the authors used Claude (Anthropic) to assist with language editing of the text only. All experiments were designed, executed, and verified by the authors were original; all reported results were measured on held-out data; and the authors reviewed and edited all content and take full responsibility for the content of the publication.
Conflicts of Interest
The authors declare no conflict of interest.
Abbreviations
CVD cardiovascular disease
ECG electrocardiogram
MI myocardial infarction
CIMT carotid intima-media thickness
ViT vision transformer
AUC area under the ROC curve
MCC Matthews correlation coefficient
CV cross-validation
Appendix A. Originally Reported Figures from the Source Formulation
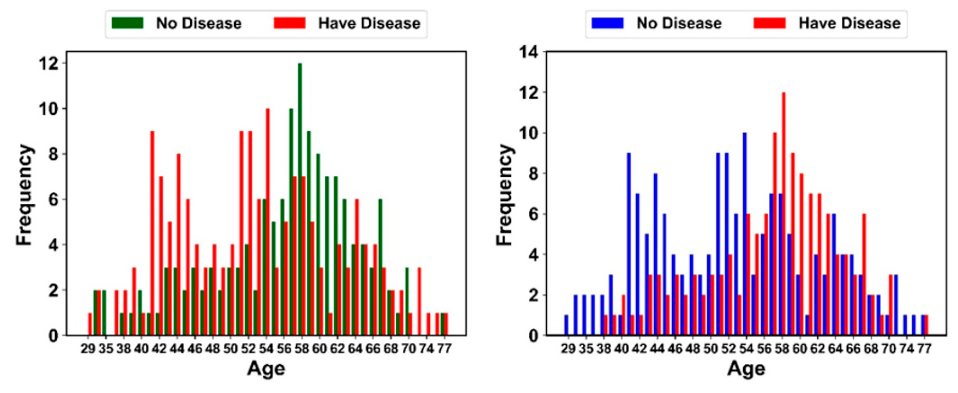
For completeness and transparency, this appendix reproduces the figures reported in the original RetECGFN formulation. They are included for reference only: these results were obtained on two tabular clinical datasets that contain neither retinal fundus images nor raw ECG waveforms, and they are NOT reproduced or endorsed by the present study. The leakage-free re-evaluation in Section 3 and Section 4, on data that genuinely contains each modality, supersedes them. Figure A1, Figure A2, Figure A3, Figure A4, Figure A5, Figure A6 and Figure A7 correspond to the confusion matrices, feature correlations, performance comparisons, AUC-ROC and optimiser convergence, per-dataset accuracy, training curves, and age distributions as originally reported.
Figure A1.
Originally reported confusion matrices for the two tabular datasets (left: 70k-record set; right: 1,025-record set). Reported values; not reproduced here.
Figure A1.
Originally reported confusion matrices for the two tabular datasets (left: 70k-record set; right: 1,025-record set). Reported values; not reproduced here.
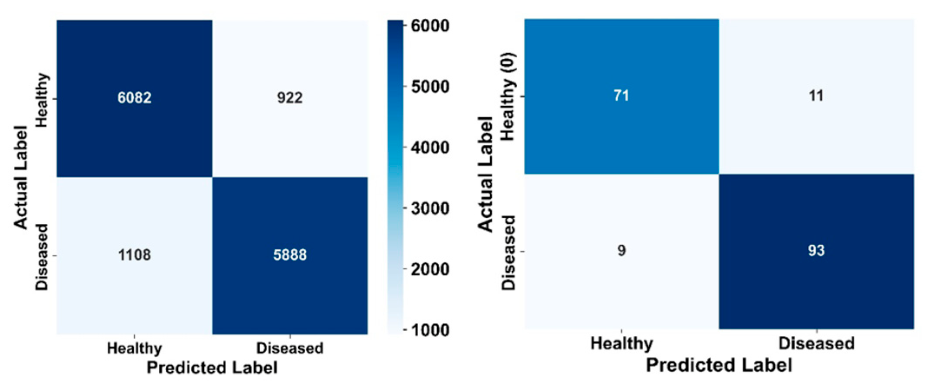
Figure A2.
Originally reported feature-correlation heatmaps for the two datasets. Reported values; not reproduced here.
Figure A2.
Originally reported feature-correlation heatmaps for the two datasets. Reported values; not reproduced here.
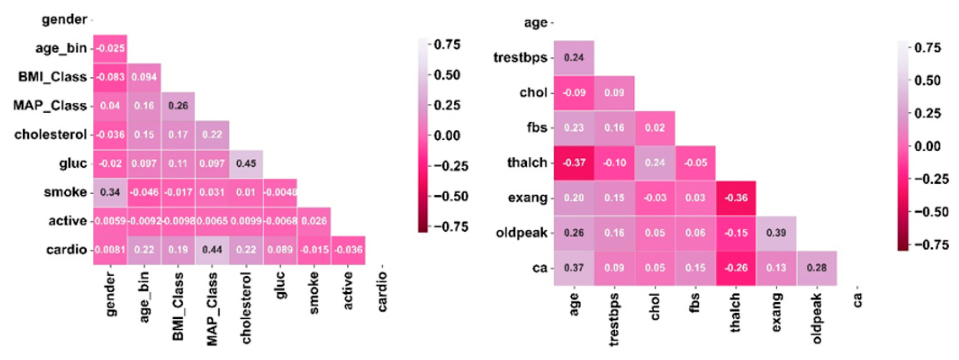
Figure A3.
Originally reported comparison of accuracy, precision, recall and F1 against prior methods, with RetECGFN as the proposed model. Reported values; not reproduced here.
Figure A3.
Originally reported comparison of accuracy, precision, recall and F1 against prior methods, with RetECGFN as the proposed model. Reported values; not reproduced here.
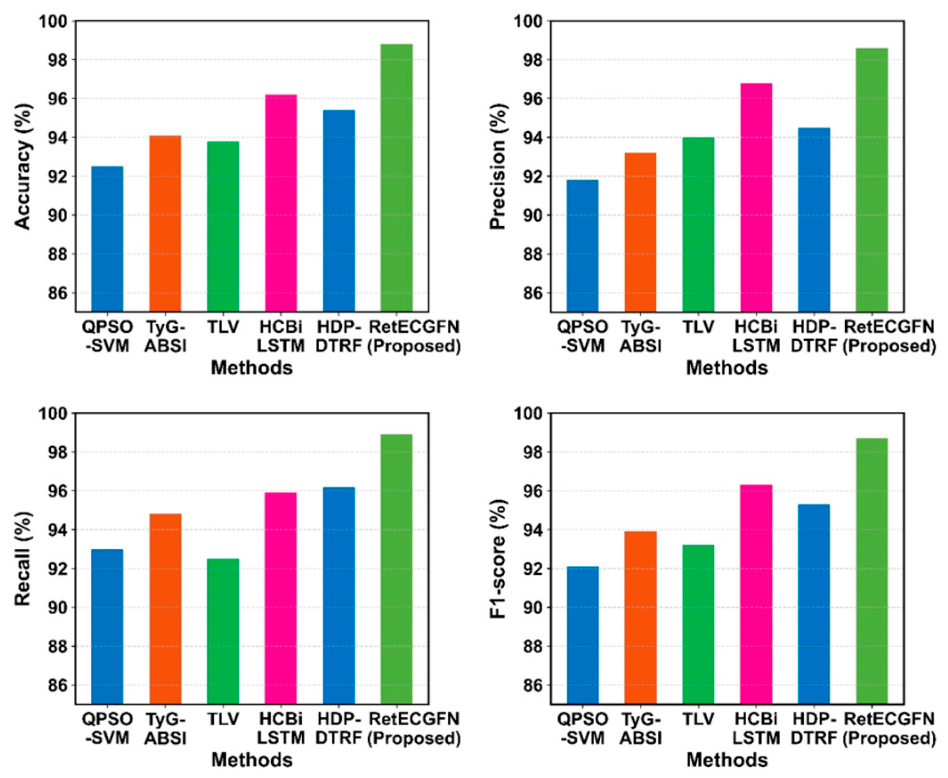
Figure A4.
Originally reported per-risk-category AUC-ROC (left) and Dialectic-Optimization convergence versus PSO/GWO/WOA (right). Reported values; not reproduced here.
Figure A4.
Originally reported per-risk-category AUC-ROC (left) and Dialectic-Optimization convergence versus PSO/GWO/WOA (right). Reported values; not reproduced here.
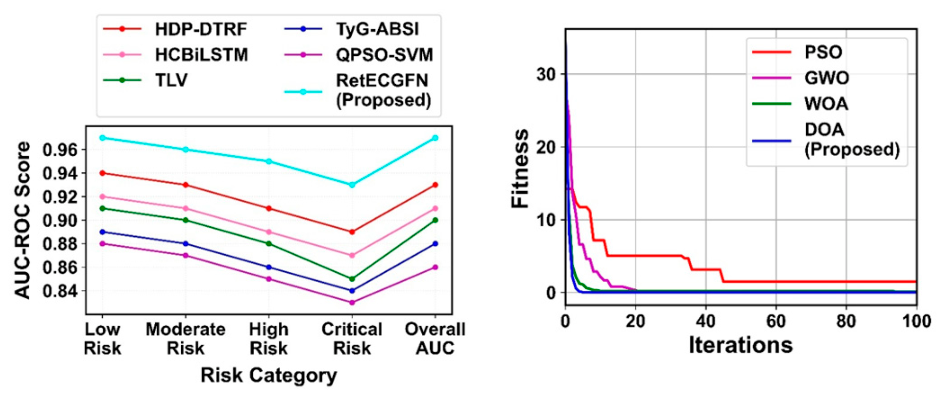
Figure A5.
Originally reported per-dataset accuracy comparison. Reported values; not reproduced here.
Figure A5.
Originally reported per-dataset accuracy comparison. Reported values; not reproduced here.
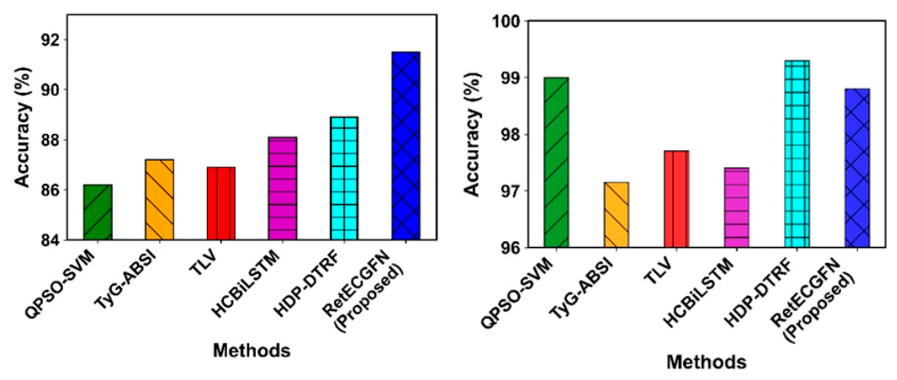
Figure A6.
Originally reported training/testing accuracy (left) and loss (right) curves. Reported values; not reproduced here.
Figure A6.
Originally reported training/testing accuracy (left) and loss (right) curves. Reported values; not reproduced here.
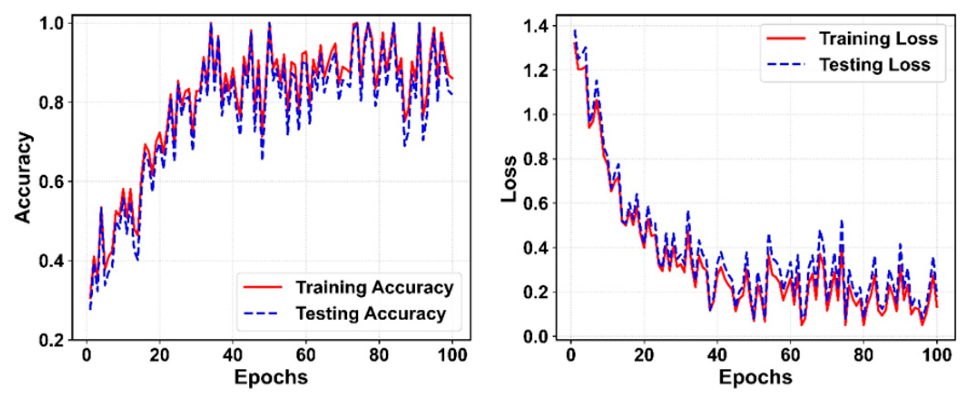
Figure A7.
Originally reported age-wise disease frequency for the two datasets. Reported values; not reproduced here.
Figure A7.
Originally reported age-wise disease frequency for the two datasets. Reported values; not reproduced here.
References
- Roth, G.A.; Mensah, G.A.; Johnson, C.O.; et al. Global Burden of Cardiovascular Diseases and Risk Factors, 1990-2019. J. Am. Coll. Cardiol. 2020, 76, 2982–3021. [Google Scholar] [CrossRef] [PubMed]
- D’Agostino, R.B.; Vasan, R.S.; Pencina, M.J.; et al. General Cardiovascular Risk Profile for Use in Primary Care: The Framingham Heart Study. Circulation 2008, 117, 743–753. [Google Scholar] [CrossRef] [PubMed]
- Goff, D.C.; Lloyd-Jones, D.M.; Bennett, G.; et al. 2013 ACC/AHA Guideline on the Assessment of Cardiovascular Risk. Circulation 2014, 129 (Suppl. 2), S49–S73. [Google Scholar] [CrossRef] [PubMed]
- Lorenz, M.W.; Markus, H.S.; Bots, M.L.; et al. Prediction of Clinical Cardiovascular Events with Carotid Intima-Media Thickness: A Systematic Review and Meta-Analysis. Circulation 2007, 115, 459–467. [Google Scholar] [CrossRef] [PubMed]
- Poplin, R.; Varadarajan, A.V.; Blumer, K.; et al. Prediction of Cardiovascular Risk Factors from Retinal Fundus Photographs via Deep Learning. Nat. Biomed. Eng. 2018, 2, 158–164. [Google Scholar] [CrossRef] [PubMed]
- Cheung, C.Y.; Xu, D.; Cheng, C.-Y.; et al. A Deep-Learning System for the Assessment of Cardiovascular Disease Risk via the Measurement of Retinal-Vessel Calibre. Nat. Biomed. Eng. 2021, 5, 498–508. [Google Scholar] [CrossRef] [PubMed]
- Strodthoff, N.; Wagner, P.; Schaeffter, T.; Samek, W. Deep Learning for ECG Analysis: Benchmarks and Insights from PTB-XL. IEEE J. Biomed. Health Inform. 2021, 25, 1519–1528. [Google Scholar] [CrossRef] [PubMed]
- Hannun, A.Y.; Rajpurkar, P.; Haghpanahi, M.; et al. Cardiologist-Level Arrhythmia Detection and Classification in Ambulatory Electrocardiograms Using a Deep Neural Network. Nat. Med. 2019, 25, 65–69. [Google Scholar] [CrossRef] [PubMed]
- Ribeiro, A.H.; Ribeiro, M.H.; Paixao, G.M.M.; et al. Automatic Diagnosis of the 12-Lead ECG Using a Deep Neural Network. Nat. Commun. 2020, 11, 1760. [Google Scholar] [CrossRef] [PubMed]
- Acharya, U.R.; Fujita, H.; Oh, S.L.; et al. Application of Deep Convolutional Neural Network for Automated Detection of Myocardial Infarction Using ECG Signals. Inf. Sci. 2017, 415-416, 190–198. [Google Scholar] [CrossRef]
- Diaz-Pinto, A.; Ravikumar, N.; Attar, R.; et al. Predicting Myocardial Infarction through Retinal Scans and Minimal Personal Information. Nat. Mach. Intell. 2022, 4, 55–61. [Google Scholar] [CrossRef]
- Jain, S.; Jain, A.; Jangid, M. MGWO-CNN. Hyperparameter Optimization of a CNN Classifier Using the Modified Grey Wolf Optimizer. Sci. Rep. 2025, 15, 43514. [Google Scholar] [CrossRef] [PubMed]
- Kapoor, S.; Narayanan, A. Leakage and the Reproducibility Crisis in Machine-Learning-Based Science. Patterns 2023, 4, 100804. [Google Scholar] [CrossRef] [PubMed]
- LeCun, Y.; Bengio, Y.; Hinton, G. Deep Learning. Nature 2015, 521, 436–444. [Google Scholar] [CrossRef] [PubMed]
- Topol, E.J. High-Performance Medicine: The Convergence of Human and Artificial Intelligence. Nat. Med. 2019, 25, 44–56. [Google Scholar] [CrossRef] [PubMed]
- Touboul, P.-J.; Hennerici, M.G.; Meairs, S.; et al. Mannheim Carotid Intima-Media Thickness and Plaque Consensus (2004-2006-2011). Cerebrovasc. Dis. 2012, 34, 290–296. [Google Scholar] [CrossRef] [PubMed]
- Christodoulou, E.; Ma, J.; Collins, G.S.; et al. A Systematic Review Shows No Performance Benefit of Machine Learning over Logistic Regression for Clinical Prediction Models. J. Clin. Epidemiol. 2019, 110, 12–22. [Google Scholar] [CrossRef] [PubMed]
- Collins, G.S.; Reitsma, J.B.; Altman, D.G.; Moons, K.G.M. Transparent Reporting of a Multivariable Prediction Model for Individual Prognosis or Diagnosis (TRIPOD). Ann. Intern. Med. 2015, 162, 55–63. [Google Scholar] [CrossRef] [PubMed]
- Hasan, M.; Sahid, M.A.; Uddin, M.P.; et al. Performance Discrepancy Mitigation in Heart Disease Prediction for Multisensory Inter-Datasets. PeerJ Comput. Sci. 2024, 10, e1917. [Google Scholar] [CrossRef] [PubMed]
- Bizimana, P.C.; Zhang, Z.; Hounye, A.H.; et al. Automated Heart Disease Prediction Using Improved Explainable Learning-Based Technique. Neural Comput. Appl. 2024, 36, 16289–16318. [Google Scholar] [CrossRef]
- Krittanawong, C.; Virk, H.U.H.; Bangalore, S.; et al. Machine Learning Prediction in Cardiovascular Diseases: A Meta-Analysis. Sci. Rep. 2020, 10, 16057. [Google Scholar] [CrossRef] [PubMed]
- Wynants, L.; Van Calster, B.; Collins, G.S.; et al. Prediction Models for Diagnosis and Prognosis of COVID-19: Systematic Review and Critical Appraisal. BMJ 2020, 369, m1328. [Google Scholar] [CrossRef] [PubMed]
- Varma, S.; Simon, R. Bias in Error Estimation When Using Cross-Validation for Model Selection. BMC Bioinform. 2006, 7, 91. [Google Scholar] [CrossRef] [PubMed]
- Weng, S.F.; Reps, J.; Kai, J.; et al. Can Machine-Learning Improve Cardiovascular Risk Prediction Using Routine Clinical Data? PLoS ONE 2017, 12, e0174944. [Google Scholar] [CrossRef] [PubMed]
- Alizadehsani, R.; Abdar, M.; Roshanzamir, M.; et al. Machine Learning-Based Coronary Artery Disease Diagnosis: A Comprehensive Review. Comput. Biol. Med. 2019, 111, 103346. [Google Scholar] [CrossRef] [PubMed]
- Esteva, A.; Kuprel, B.; Novoa, R.A.; et al. Dermatologist-Level Classification of Skin Cancer with Deep Neural Networks. Nature 2017, 542, 115–118. [Google Scholar] [CrossRef] [PubMed]
- Ghasemieh, A.; Lloyed, A.; Bahrami, P.; Vajar, P.; Kashef, R. A Novel Machine Learning Model with Stacking Ensemble Learner for Predicting Emergency Readmission of Heart-Disease Patients. Decis. Anal. J. 2023, 7, 100242. [Google Scholar] [CrossRef]
- Deepa, D.R.; Sadu, V.B.; Sivasamy, D.A. Early Prediction of Cardiovascular Disease Using Machine Learning: Unveiling Risk Factors from Health Records. AIP Adv. 2024, 14, 035049. [Google Scholar] [CrossRef]
- Kumar, A.; Singh, K.U.; Kumar, M. A Clinical Data Analysis Based Diagnostic System for Heart Disease Prediction Using Ensemble Method. Big Data Min. Anal. 2023, 6, 513–525. [Google Scholar] [CrossRef]
- Ansari, G.A.; Bhat, S.S.; Ansari, M.D.; et al. Performance Evaluation of Machine Learning Techniques for Heart Disease Prediction. Comput. Math. Methods Med. 2023, 2023, 8191261. [Google Scholar] [CrossRef]
- Ramesh, B.; Lakshmanna, K. A Novel Early Detection and Prevention of Coronary Heart Disease Framework Using Hybrid Deep Learning Model and Neural Fuzzy Inference System. IEEE Access 2024, 12, 26683–26695. [Google Scholar] [CrossRef]
- Ghorashi, S.; Rehman, K.; Riaz, A.; et al. Leveraging Regression Analysis to Predict Overlapping Symptoms of Cardiovascular Diseases. IEEE Access 2023, 11, 60254–60266. [Google Scholar] [CrossRef]
- Jafar, A.; Lee, M. HypGB: High Accuracy GB Classifier for Predicting Heart Disease with HyperOpt HPO Framework and LASSO FS Method. IEEE Access 2023, 11, 138201–138214. [Google Scholar] [CrossRef]
- Alzakari, S.A.; Menaem, A.A.; Omer, N.; et al. Enhanced Heart Disease Prediction in Remote Healthcare Monitoring Using IoT-Enabled Cloud-Based XGBoost and Bi-LSTM. Alex. Eng. J. 2024, 105, 280–291. [Google Scholar] [CrossRef]
- Rim, T.H.; Lee, C.J.; Tham, Y.-C.; et al. Deep-Learning-Based Cardiovascular Risk Stratification Using Coronary Artery Calcium Scores Predicted from Retinal Photographs. Lancet Digit. Health 2021, 3, e306–e316. [Google Scholar] [CrossRef] [PubMed]
- Muthukumar, K.A.; Nandi, D.; Ranjan, P.; et al. Integrating Electrocardiogram and Fundus Images for Early Detection of Cardiovascular Diseases. Sci. Rep. 2025. [Google Scholar] [CrossRef] [PubMed]
- Tseng, R.M.W.W.; Rim, T.H.; Shantha, G.P.S.; et al. Validation of a Deep-Learning-Based Retinal Biomarker (Reti-CVD) in the Prediction of Cardiovascular Disease: Insights from the UK Biobank. BMC Med. 2023, 21, 28. [Google Scholar] [CrossRef] [PubMed]
- Maldonado-Garcia, C.; Bonazzola, R.; Ferrante, E.; Julian, T.H.; Sergouniotis, P.I.; Ravikumar, N. Predicting Cardiovascular Disease Risk Using Retinal Optical Coherence Tomography Imaging. Front. Artif. Intell. 2025, 8, 1624550. [Google Scholar] [CrossRef] [PubMed]
- Maldonado-Garcia, C.; Zakeri, A.; Frangi, A.F.; Ravikumar, N. Integrating Deep Learning with Fundus and Optical Coherence Tomography for Cardiovascular Disease Prediction. Lect. Notes Comput. Sci. 2024, 161–172. [Google Scholar] [CrossRef]
- Guo, Y.; et al. High-Resolution Fundus Images for Ophthalmomics and Early Cardiovascular Disease Prediction (China-Fundus-CIMT Dataset). Sci. Data 2025. [Google Scholar] [CrossRef] [PubMed]
- Gulshan, V.; Peng, L.; Coram, M.; et al. Development and Validation of a Deep Learning Algorithm for Detection of Diabetic Retinopathy in Retinal Fundus Photographs. JAMA 2016, 316, 2402–2410. [Google Scholar] [CrossRef] [PubMed]
- Ting, D.S.W.; Cheung, C.Y.; Lim, G.; et al. Development and Validation of a Deep Learning System for Diabetic Retinopathy and Related Eye Diseases Using Retinal Images from Multiethnic Populations. JAMA 2017, 318, 2211–2223. [Google Scholar] [CrossRef] [PubMed]
- Son, J.; Shin, J.Y.; Kim, H.D.; et al. Development and Validation of Deep Learning Models for Screening Multiple Abnormal Findings in Retinal Fundus Images. Ophthalmology 2020, 127, 85–94. [Google Scholar] [CrossRef] [PubMed]
- Natarajan, A.; Chang, Y.; Mariani, S.; et al. A Wide and Deep Transformer Neural Network for 12-Lead ECG Classification. Proc. Computing in Cardiology (CinC), 2020. [Google Scholar] [CrossRef]
- Ismail Fawaz, H.; Forestier, G.; Weber, J.; et al. Deep Learning for Time Series Classification: A Review. Data Min. Knowl. Discov. 2019, 33, 917–963. [Google Scholar] [CrossRef]
- Wagner, P.; Strodthoff, N.; Bousseljot, R.-D.; et al. PTB-XL, a Large Publicly Available Electrocardiography Dataset. Sci. Data 2020, 7, 154. [Google Scholar] [CrossRef] [PubMed]
- Smigiel, S.; Palczynski, K.; Ledzinski, D. ECG Signal Classification Using Deep Learning Techniques Based on the PTB-XL Dataset. Entropy 2021, 23, 1121. [Google Scholar] [CrossRef] [PubMed]
- Dosovitskiy, A.; Beyer, L.; Kolesnikov, A.; et al. An Image Is Worth 16x16 Words: Transformers for Image Recognition at Scale. Proc. Int. Conf. Learn. Represent. (ICLR) 2021. [Google Scholar] [CrossRef]
- Liu, Z.; Lin, Y.; Cao, Y.; et al. Swin Transformer: Hierarchical Vision Transformer Using Shifted Windows. Proc. IEEE/CVF Int. Conf. Comput. Vis. (ICCV), 2021; pp. 10012–10022. [Google Scholar] [CrossRef]
- Shamshad, F.; Khan, S.; Zamir, S.W.; et al. Transformers in Medical Imaging: A Survey. Med. Image Anal. 2023, 88, 102802. [Google Scholar] [CrossRef] [PubMed]
- Azad, R.; Kazerouni, A.; Heidari, M.; et al. Advances in Medical Image Analysis with Vision Transformers: A Comprehensive Review. Med. Image Anal. 2024, 91, 103000. [Google Scholar] [CrossRef] [PubMed]
- He, K.; Gan, C.; Li, Z.; Rekik, I.; Yin, Z.; Ji, W.; et al. Transformers in Medical Image Analysis. Intell. Med. 2023, 3, 59–78. [Google Scholar] [CrossRef]
- Qu, Z.; et al. VGA-Net: Vessel Graph Based Attentional U-Net for Retinal Vessel Segmentation. IET Image Process. 2024. [Google Scholar] [CrossRef]
- Wei, X.; Lin, X.; Liu, H.; Zhao, S.; Li, Y. Retinal Vessel Segmentation with Deep Graph and Capsule Reasoning. arXiv 2024, arXiv:2409.11508. [Google Scholar] [CrossRef]
- Selvaraju, R.R.; Cogswell, M.; Das, A.; et al. Grad-CAM: Visual Explanations from Deep Networks via Gradient-Based Localization. Proc. IEEE Int. Conf. Comput. Vis. (ICCV), 2017; pp. 618–626. [Google Scholar] [CrossRef]
- Lundberg, S.M.; Lee, S.-I. A Unified Approach to Interpreting Model Predictions. In Advances in Neural Information Processing Systems (NeurIPS); 2017; Vol. 30. [Google Scholar] [CrossRef]
- Attia, Z.I.; Kapa, S.; Lopez-Jimenez, F.; et al. Screening for Cardiac Contractile Dysfunction Using an Artificial Intelligence-Enabled Electrocardiogram. Nat. Med. 2019, 25, 70–74. [Google Scholar] [CrossRef] [PubMed]
- Hochreiter, S.; Schmidhuber, J. Long Short-Term Memory. Neural Comput. 1997, 9, 1735–1780. [Google Scholar] [CrossRef] [PubMed]
- He, K.; Zhang, X.; Ren, S.; Sun, J. Deep Residual Learning for Image Recognition. Proc. IEEE Conf. Comput. Vis. Pattern Recognit. (CVPR), 2016; pp. 770–778. [Google Scholar] [CrossRef]
- Simonyan, K.; Zisserman, A. Very Deep Convolutional Networks for Large-Scale Image Recognition. Proc. Int. Conf. Learn. Represent. (ICLR) 2015. [Google Scholar] [CrossRef]
- Tan, M.; Le, Q. EfficientNet: Rethinking Model Scaling for Convolutional Neural Networks. Proc. Int. Conf. Mach. Learn. (ICML) 2019, 6105–6114. [Google Scholar] [CrossRef]
- Ronneberger, O.; Fischer, P.; Brox, T. U-Net: Convolutional Networks for Biomedical Image Segmentation. Proc. Med. Image Comput. Comput.-Assist. Interv. (MICCAI) 2015, 234–241. [Google Scholar] [CrossRef]
- Vaswani, A.; Shazeer, N.; Parmar, N.; et al. Attention Is All You Need. Adv. Neural Inf. Process. Syst. (NeurIPS) 2017, Vol. 30, 5998–6008. [Google Scholar] [CrossRef]
- Ikechukwu, A.V.; Murali, S.; Deepu, R.; Shivamurthy, R.C. ResNet-50 vs VGG-19 vs Training from Scratch: A Comparative Analysis of the Segmentation and Classification of Pneumonia from Chest X-Ray Images. Glob. Transit. Proc. 2021, 2, 375–381. [Google Scholar] [CrossRef]
- Ikechukwu, A.V.; Murali, S. CX-Net: An Efficient Ensemble Semantic Deep Neural Network for ROI Identification from Chest X-Ray Images for COPD Diagnosis. Mach. Learn. Sci. Technol. 2023, 4, 025021. [Google Scholar] [CrossRef]
- Ikechukwu, A.V.; Murali, S. Semi-Supervised Labelling of Chest X-Ray Images Using Unsupervised Clustering for Ground-Truth Generation. Appl. Eng. Technol. 2023, 2, 102–114. [Google Scholar] [CrossRef]
- Ikechukwu, A.V.; Murali, S. Leveraging Transfer Learning for Efficient Diagnosis of COPD Using CXR Images and Explainable AI Techniques. Intel. Artif. 2024, 27, 133–151. [Google Scholar] [CrossRef]
- Jalloul, R.; Krishnappa, C.H.; Agughasi, V.I.; Alkhatib, R. Enhancing Early Breast Cancer Detection with Infrared Thermography. A Comparative Evaluation of Deep Learning and Machine Learning Models. Technologies 2024, 13, 7. [Google Scholar] [CrossRef]
- Velickovic, P.; Cucurull, G.; Casanova, A.; et al. Graph Attention Networks. Proc. Int. Conf. Learn. Represent. (ICLR) 2018. [Google Scholar] [CrossRef]
- Kipf, T.N.; Welling, M. Semi-Supervised Classification with Graph Convolutional Networks. Proc. Int. Conf. Learn. Represent. (ICLR) 2017. [Google Scholar] [CrossRef]
- Acosta, J.N.; Falcone, G.J.; Rajpurkar, P.; Topol, E.J. Multimodal Biomedical AI. Nat. Med. 2022, 28, 1773–1784. [Google Scholar] [CrossRef] [PubMed]
- Huang, S.-C.; Pareek, A.; Seyyedi, S.; et al. Fusion of Medical Imaging and Electronic Health Records Using Deep Learning: A Systematic Review and Implementation Guidelines. npj Digit. Med. 2020, 3, 136. [Google Scholar] [CrossRef] [PubMed]
- Li, Y.; et al. A Review of Deep Learning-Based Information Fusion Techniques for Multimodal Medical Image Classification. Comput. Biol. Med. 2024, arXiv:2404.15022. [Google Scholar] [CrossRef]
- Zubair, M.; Hussain, M.; Al-Bashrawi, M.A.; Bendechache, M.; Owais, M. A Comprehensive Review of Techniques, Algorithms, Advancements, Challenges, and Clinical Applications of Multi-Modal Medical Image Fusion for Improved Diagnosis. arXiv 2025, arXiv:2505.14715. [Google Scholar] [CrossRef]
- Kennedy, J.; Eberhart, R. Particle Swarm Optimization. Proc. IEEE Int. Conf. Neural Netw. (ICNN), 1995; pp. 1942–1948. [Google Scholar] [CrossRef]
- Mirjalili, S.; Mirjalili, S.M.; Lewis, A. Grey Wolf Optimizer. Adv. Eng. Softw. 2014, 69, 46–61. [Google Scholar] [CrossRef]
- Mirjalili, S.; Lewis, A. The Whale Optimization Algorithm. Adv. Eng. Softw. 2016, 95, 51–67. [Google Scholar] [CrossRef]
- Hamad, Q.S.; Samma, H.; Suandi, S.A. Optimization of Convolutional Neural Network Hyperparameter for Medical Image Diagnosis Using Metaheuristic Algorithms. A Short Recent Review (2019-2022). arXiv 2024, arXiv:2412.17956. [Google Scholar] [CrossRef]
- Loshchilov, I.; Hutter, F. Decoupled Weight Decay Regularization. Proc. Int. Conf. Learn. Represent. (ICLR) 2019. [Google Scholar] [CrossRef]
- Kingma, D.P.; Ba, J. Adam: A Method for Stochastic Optimization. Proc. Int. Conf. Learn. Represent. (ICLR) 2015. [Google Scholar] [CrossRef]
Figure 2.
Spectro-temporal ECG transformer: a temporal conv-token transformer branch and a spectral (rFFT) branch are fused by an MLP head for MI detection.
Figure 2.
Spectro-temporal ECG transformer: a temporal conv-token transformer branch and a spectral (rFFT) branch are fused by an MLP head for MI detection.
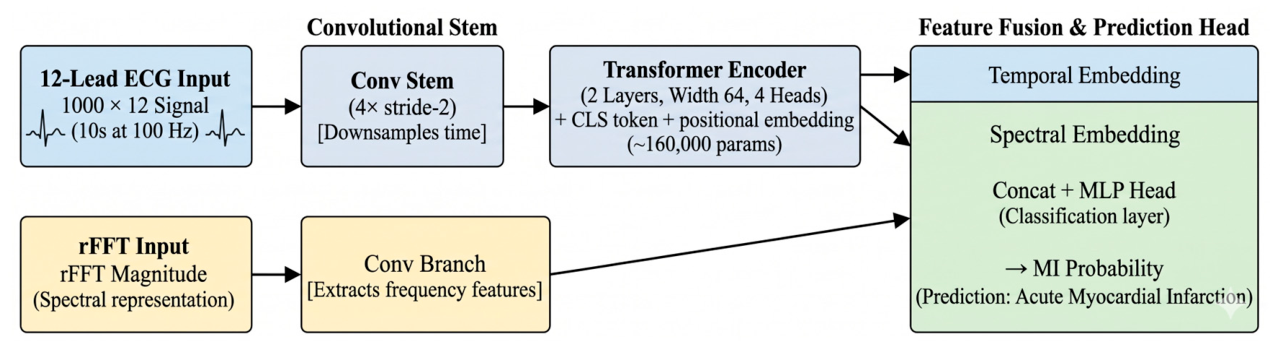
Figure 3.
Sample 12-lead ECG inputs to the transformer: a confident myocardial-infarction case (red) overlaid with a normal case (blue), one panel per lead. These are the raw signals the temporal branch receives.
Figure 3.
Sample 12-lead ECG inputs to the transformer: a confident myocardial-infarction case (red) overlaid with a normal case (blue), one panel per lead. These are the raw signals the temporal branch receives.
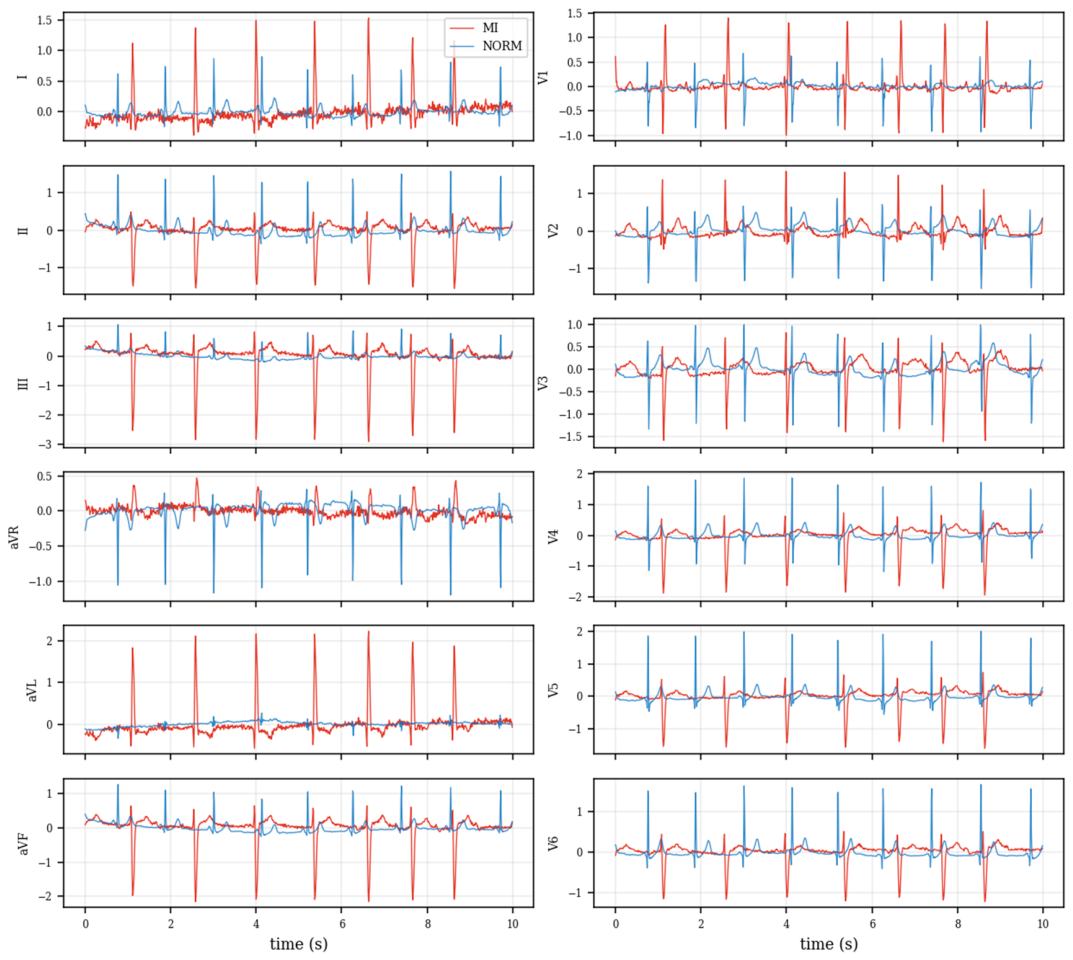
Figure 4.
The spectral-branch input for the MI sample of Figure 3: the per-lead log magnitude spectrum (rFFT), which the spectral branch summarises alongside the temporal tokens.
Figure 4.
The spectral-branch input for the MI sample of Figure 3: the per-lead log magnitude spectrum (rFFT), which the spectral branch summarises alongside the temporal tokens.
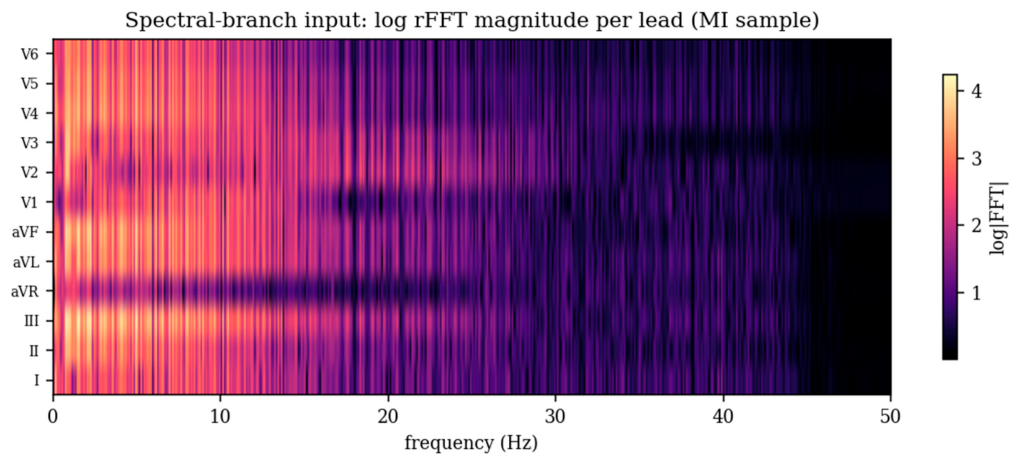
Figure 5.
Retinal vision transformer: a CNN patch-stem feeds a transformer encoder applied per eye; the two eye embeddings are averaged before the risk head.
Figure 5.
Retinal vision transformer: a CNN patch-stem feeds a transformer encoder applied per eye; the two eye embeddings are averaged before the risk head.
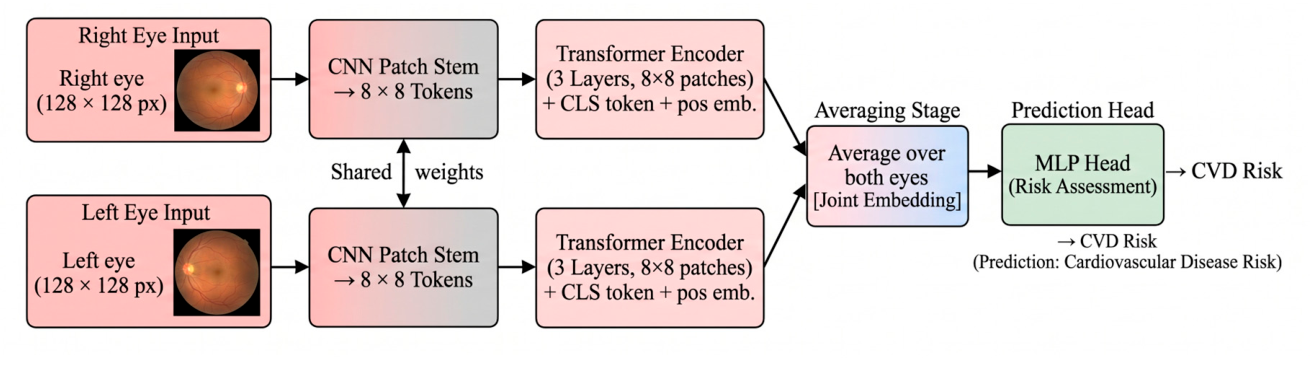
Figure 6.
Sample fundus inputs to the retinal vision transformer: right and left eyes of a high-CIMT-risk patient (top) and a low-risk patient (bottom). These are the real images the model receives after resizing.
Figure 6.
Sample fundus inputs to the retinal vision transformer: right and left eyes of a high-CIMT-risk patient (top) and a low-risk patient (bottom). These are the real images the model receives after resizing.
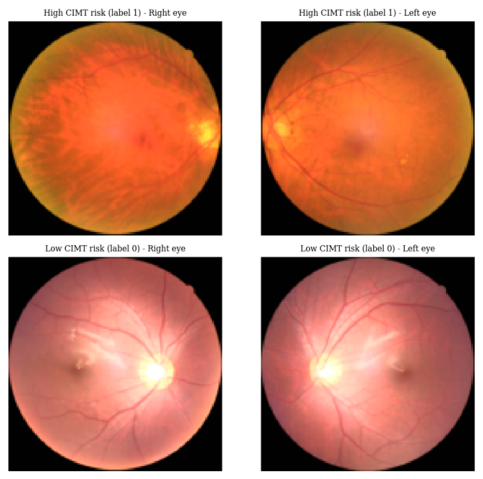
Figure 7.
Vision-transformer patch tokenisation: a fundus image is divided into an 8x8 grid of tokens that, with a class token and positional embeddings, form the transformer input sequence.
Figure 7.
Vision-transformer patch tokenisation: a fundus image is divided into an 8x8 grid of tokens that, with a class token and positional embeddings, form the transformer input sequence.
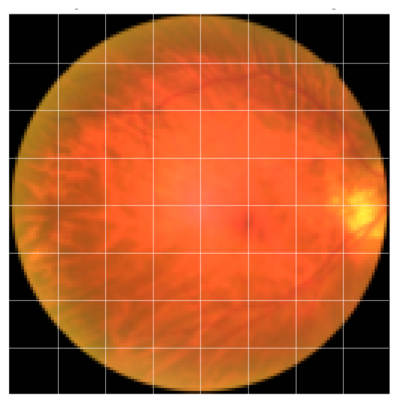
Figure 8.
Study design: two independent public cohorts, each with a dedicated transformer encoder, combined by decision-level fusion. The cohorts share no patients, so fusion is evaluated by simulation only.
Figure 8.
Study design: two independent public cohorts, each with a dedicated transformer encoder, combined by decision-level fusion. The cohorts share no patients, so fusion is evaluated by simulation only.
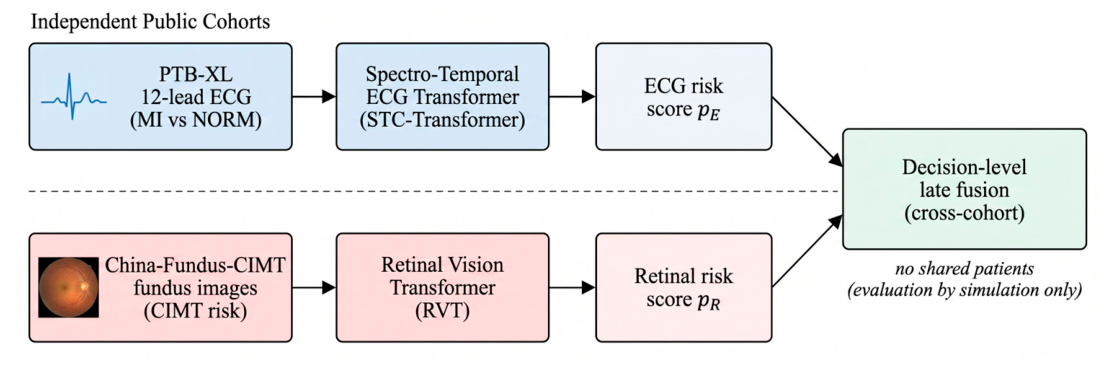
Figure 10.
Input-gradient saliency for the ECG transformer on a myocardial-infarction case (lead II shown): warmer points contributed more to the predicted probability, concentrating on the QRS and ST-T segments.
Figure 10.
Input-gradient saliency for the ECG transformer on a myocardial-infarction case (lead II shown): warmer points contributed more to the predicted probability, concentrating on the QRS and ST-T segments.
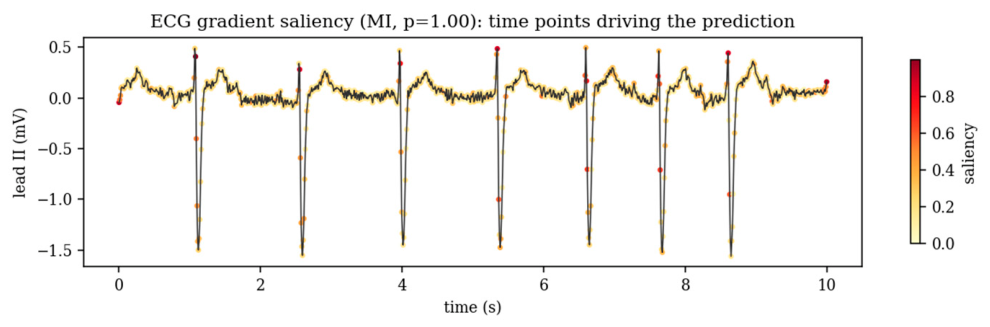
Figure 11.
ECG classification examples (lead II) from the PTB-XL test fold: true positive, true negative, false positive and false negative, each annotated with the true label and predicted probability.
Figure 11.
ECG classification examples (lead II) from the PTB-XL test fold: true positive, true negative, false positive and false negative, each annotated with the true label and predicted probability.
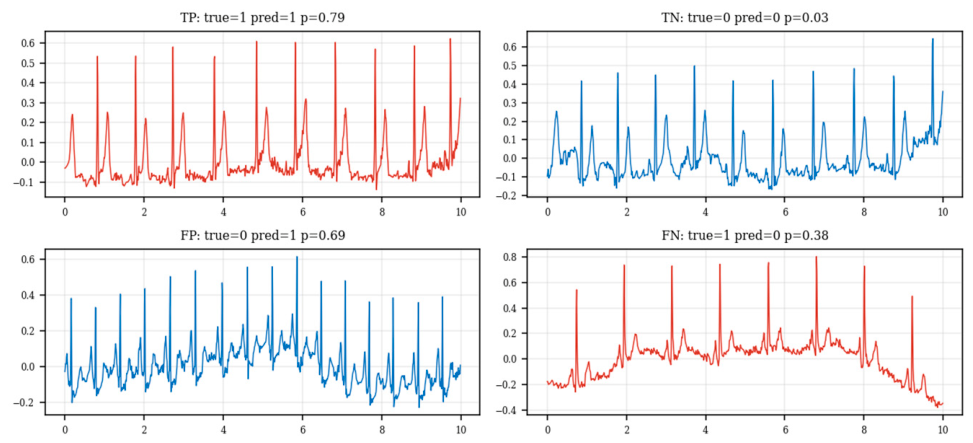
Figure 13.
Retinal vision-transformer saliency on a high-CIMT-risk fundus image: the original (left) and the gradient-saliency overlay (right); warmer regions contributed more to the predicted risk.
Figure 13.
Retinal vision-transformer saliency on a high-CIMT-risk fundus image: the original (left) and the gradient-saliency overlay (right); warmer regions contributed more to the predicted risk.
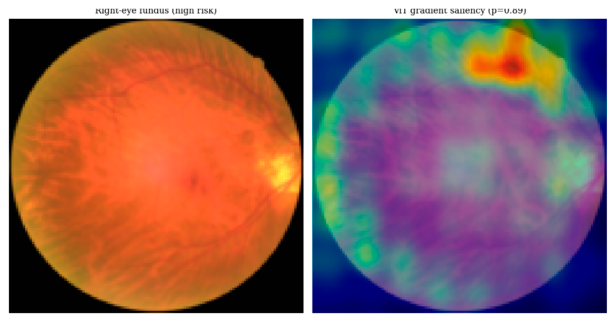
Figure 14.
The classification examples (right eye) from the test fold, with the true and predicted labels.
Figure 14.
The classification examples (right eye) from the test fold, with the true and predicted labels.
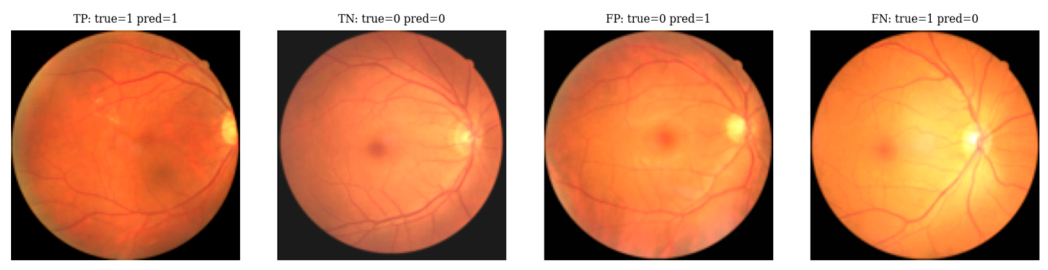
Figure 15.
Confusion matrices: (a) ECG on the PTB-XL test fold; (b) fundus pooled over the three folds.
Figure 15.
Confusion matrices: (a) ECG on the PTB-XL test fold; (b) fundus pooled over the three folds.
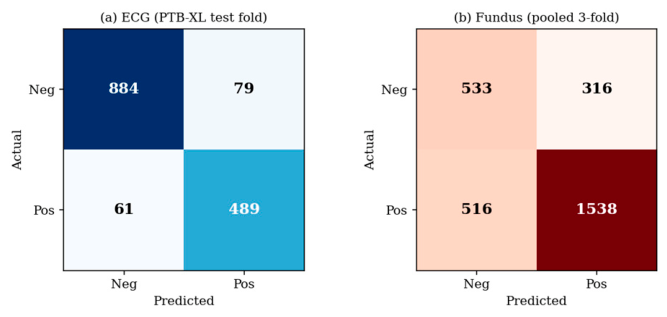
Figure 16.
ROC curves for the modalities, with AUC curve.
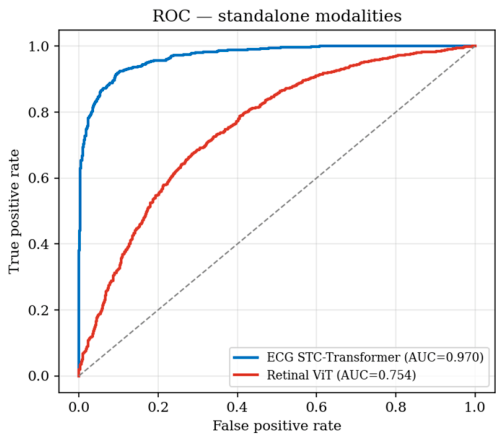
Figure 17.
Reliability diagrams of the ECG model confirming mis-calibration.
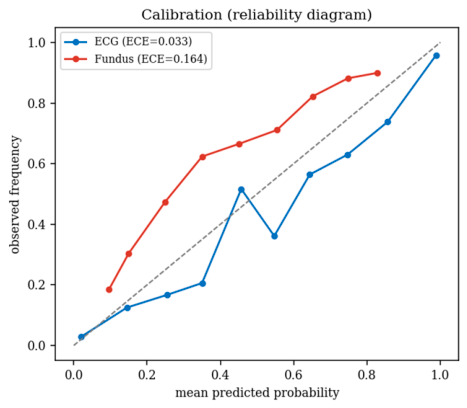
Figure 18.
The Precision-Recall modality curves.
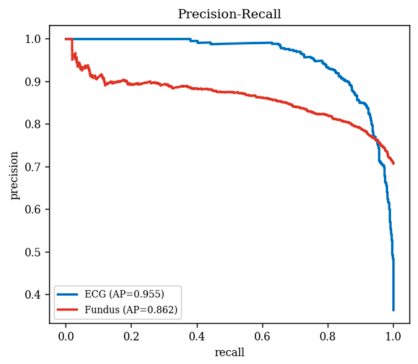
Figure 19.
Predicted-probability distributions for the classes; better separation for ECG than for fundus.
Figure 19.
Predicted-probability distributions for the classes; better separation for ECG than for fundus.
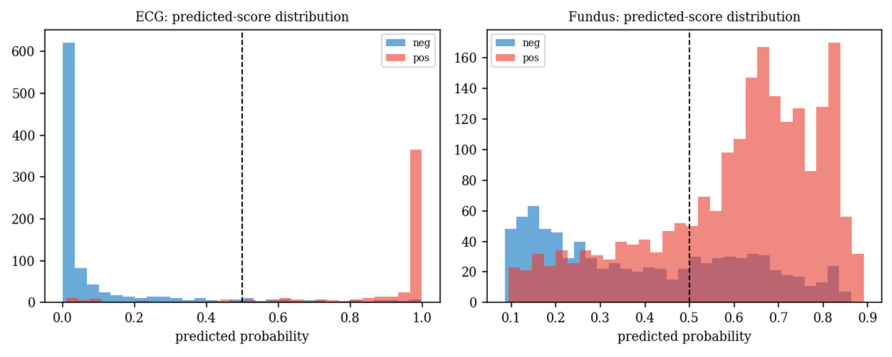
Figure 20.
Sensitivity, specificity and F1 as a function of the decision threshold, for operating-point selection.
Figure 20.
Sensitivity, specificity and F1 as a function of the decision threshold, for operating-point selection.
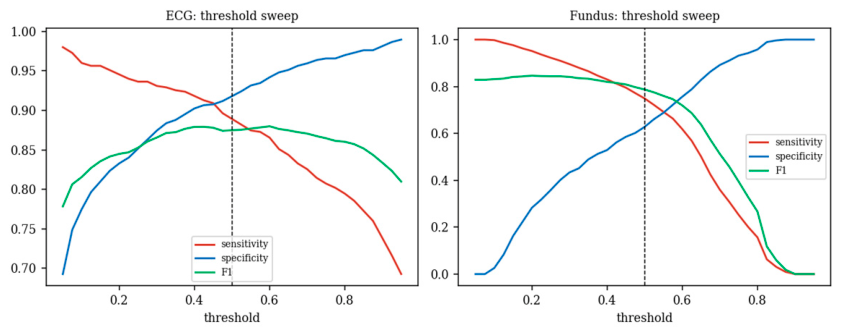
Figure 21.
Training and validation curves (loss on the left axis, validation AUC on the right) for a representative ECG-transformer and retinal-ViT run.
Figure 21.
Training and validation curves (loss on the left axis, validation AUC on the right) for a representative ECG-transformer and retinal-ViT run.
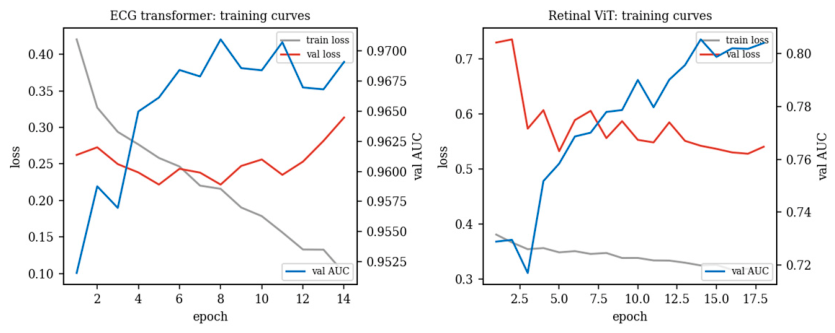
Figure 22.
Standalone (measured) versus simulated fusion AUC. The fusion bars are illustrative only.
Figure 22.
Standalone (measured) versus simulated fusion AUC. The fusion bars are illustrative only.
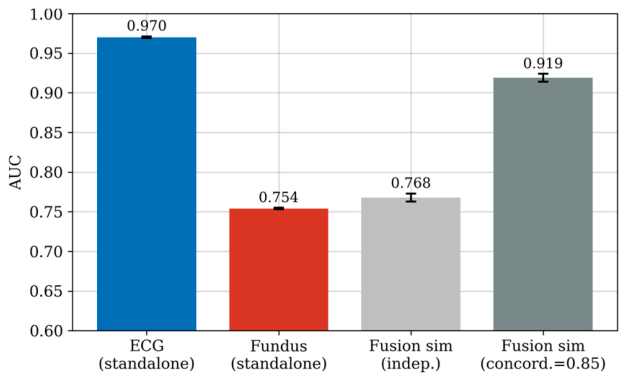
Figure 23.
ECG transformer component ablation: AUC as each component is removed in turn; the variants are statistically indistinguishable.
Figure 23.
ECG transformer component ablation: AUC as each component is removed in turn; the variants are statistically indistinguishable.
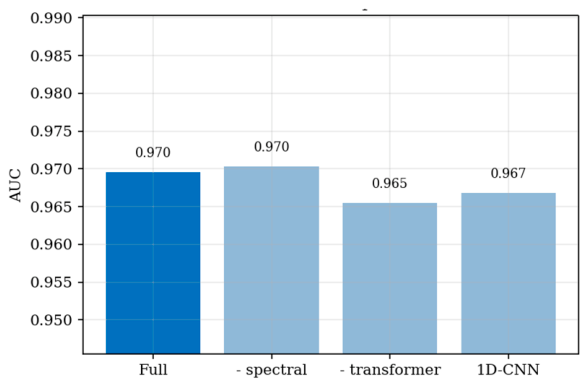
Table 1.
Prior work versus the present study.
| Study / approach | Modalities | Paired? | Reported | Evaluation note |
|---|---|---|---|---|
| Tabular CVD ML [66,67] | clinical table | n/a | up to ~99% | large-dataset accuracy, leakage-prone |
| Poplin et al. [31] | fundus | n/a | AUC ~0.70 (risk factors) | signal largely age/sex |
| Rim et al. [33] | fundus | n/a | AUC ~0.74-0.82 | external validation |
| PTB-XL benchmark [23] | ECG | n/a | AUC ~0.93 (MI) | official folds |
| Claimed multimodal 98.8% | fundus+ECG* | no | 98.8% / AUC 0.97 | tabular data; not reproducible |
| This work | fundus & ECG | no (cross-cohort) | ECG 0.970; fundus 0.764 | leakage-free; fusion simulated |
*”Paired” means the two modalities come from the same patients.
Table 2.
Comparison of proposed method with earlier approaches.
| Method | Reported accuracy (%) |
|---|---|
| QPSO-SVM | 92.5 |
| Two-Layer Voting (TLV) | 93.8 |
| TyG-ABSI | 94.1 |
| HDP-DTRF | 95.4 |
| HCBiLSTM | 96.2 |
| RetECGFN (proposed) | 98.8 |
*Refer Section 4 for the leakage-free re-evaluation.
Table 3.
Component ablation as reported in the original RetECGFN formulation.
| Configuration (reported) | Acc | Prec | Recall | F1 |
|---|---|---|---|---|
| RVGT + STC-Transformer | 96.48 | 93.23 | - | - |
| + Adaptive feature fusion | 97.21 | 96.45 | - | - |
| + Improved DOA (complete) | 98.76 | 98.52 | 98.43 | 98.47 |
Table 5.
Hyper-parameters for the two transformer encoders (fixed a priori; not tuned on test data).
Table 5.
Hyper-parameters for the two transformer encoders (fixed a priori; not tuned on test data).
| Hyper-parameter | ECG transformer | Retinal ViT |
|---|---|---|
| Transformer layers | 2 | 3 |
| Model width (d) | 64 | 96 |
| Attention heads | 4 | 4 |
| Dropout | 0.2 | 0.2 |
| Convolutional stem | 4 x stride-2 (1D) | 4 x stride-2 (2D) |
| Optimiser / weight decay | AdamW / 1e-4 | AdamW / 1e-4 |
| Learning rate / schedule | 1e-3 / cosine | 8e-4 / cosine |
| Batch size | 64 | 32 |
| Max epochs / early-stop patience | 25 / 6 | 18 / 6 |
| Loss | class-weighted BCE | class-weighted BCE |
| Input | 1000 x 12 (100 Hz) | 2 x 128 x 128 x 3 |
Table 6.
ECG results (PTB-XL, MI vs NORM, official test fold).
| Model | Acc | Prec | Sens | Spec | F1 | MCC | AUC |
|---|---|---|---|---|---|---|---|
| Logistic regression | 77.26 | 73.62 | 58.36 | 88.06 | 65.11 | 0.493 | 0.835 |
| Random forest | 80.83 | 80.95 | 61.82 | 91.69 | 70.10 | 0.575 | 0.868 |
| Gradient boosting | 80.11 | 80.15 | 60.18 | 91.48 | 68.74 | 0.558 | 0.869 |
| STC-Transformer (ours) | 90.75 | 86.09 | 88.91 | 91.80 | 87.48 | 0.802 | 0.970 |
Table 7.
Fundus results (China-Fundus-CIMT, 3-fold patient-level CV). Mean +/- SD.
| Model | Acc | Sens | Spec | F1 | AUC |
|---|---|---|---|---|---|
| Age+Sex logistic | 80.30 | 89.92 | 57.01 | 86.59 | 0.854+/-0.000 |
| Pixel random forest | 76.64 | 91.87 | 39.81 | 84.76 | 0.776+/-0.016 |
| Retinal ViT (ours) | 71.34+/-4.57 | 74.87 | 62.78 | 78.35 | 0.764+/-0.016 |
Table 8.
Per-fold retinal ViT performance (China-Fundus-CIMT, 3-fold patient-level CV).
| Fold | Acc | Sens | Spec | F1 | AUC |
|---|---|---|---|---|---|
| Fold 1 | 71.28 | 71.53 | 70.67 | 77.90 | 0.782 |
| Fold 2 | 76.96 | 88.91 | 48.06 | 84.52 | 0.766 |
| Fold 3 | 65.77 | 64.18 | 69.61 | 72.62 | 0.743 |
| Mean +/- SD | 71.34+/-4.57 | 74.87 | 62.78 | 78.35 | 0.764+/-0.016 |
Table 9.
Statistical summary on the test predictions.
| Modality | AUC [95% CI] | Accuracy % [95% CI] | Avg. prec. | ECE | Brier |
|---|---|---|---|---|---|
| ECG (MI vs NORM) | 0.970 [0.962, 0.977] | 90.75 [89.23, 92.20] | 0.955 | 0.033 | 0.066 |
| Fundus (CIMT risk) | 0.754 [0.734, 0.772] | 71.34 [69.76, 72.99] | 0.862 | 0.164 | 0.198 |
Table 10.
Decision-level fusion (ILLUSTRATIVE simulation; not per-patient validation).
| Setting | AUC |
|---|---|
| ECG standalone (measured) | 0.970 |
| Fundus standalone (measured) | 0.754 |
| Fusion, independent pairing (sim.) | 0.768+/-0.006 |
| Fusion, concordance=0.85 (sim.) | 0.919+/-0.005 |
Simulated pairing assumes a joint label distribution; it does not reflect any real paired cohort.
Table 11.
ECG transformer component ablation (PTB-XL test fold). dAUC is change vs. the full model.
| Configuration | Acc | Sens | Spec | F1 | MCC | AUC | dAUC |
|---|---|---|---|---|---|---|---|
| Full (temporal+spectral+attention) | 90.75 | 88.91 | 91.80 | 87.48 | 0.802 | 0.970 | - |
| w/o spectral branch | 91.47 | 88.91 | 92.94 | 88.35 | 0.816 | 0.970 | +0.001 |
| w/o transformer (conv + mean-pool) | 91.21 | 86.91 | 93.67 | 87.79 | 0.809 | 0.965 | -0.004 |
| 1D-CNN (w/o spectral & attention) | 91.01 | 88.36 | 92.52 | 87.73 | 0.806 | 0.967 | -0.003 |
Table 12.
Model configuration and computational resources.
| Item | ECG transformer | Retinal ViT |
|---|---|---|
| Backbone | conv stem + 2-layer transformer + spectral branch | CNN patch-stem + 3-layer ViT |
| Input | 1000 x 12 (100 Hz) | 2 x 128 x 128 x 3 (two eyes) |
| Model width / heads | 64 / 4 | 96 / 4 |
| Optimiser | AdamW, cosine decay, early stopping | Same as ECG transformer |
| Protocol | official fold-10 test | 3-fold patient-level CV |
| Hardware | CPU (PyTorch 2.x, no GPU) | Same as ECG transformer |
| Approx. train time | ~12 min per run | ~10 min per fold |
Disclaimer/Publisher’s Note: The statements, opinions and data contained in all publications are solely those of the individual author(s) and contributor(s) and not of MDPI and/or the editor(s). MDPI and/or the editor(s) disclaim responsibility for any injury to people or property resulting from any ideas, methods, instructions or products referred to in the content. |
© 2026 by the authors. Licensee MDPI, Basel, Switzerland. This article is an open access article distributed under the terms and conditions of the Creative Commons Attribution (CC BY) license (http://creativecommons.org/licenses/by/4.0/).
Copyright: This open access article is published under a Creative Commons CC BY 4.0 license, which permit the free download, distribution, and reuse, provided that the author and preprint are cited in any reuse.