

Submitted:
15 November 2026
Posted:
17 November 2026
You are already at the latest version
Abstract
Background/Objectives: To estimate eyeglass use and reported difficulty seeing among Mexican children and adolescents and examine social and geographic differences. Methods: We analyzed repeated cross-sections of Mexico’s National Health and Nutrition Surveys (ages 2–9 years in 2018–2019 and 2–19 years in 2021–2025). Survey-weighted models estimated differences in eyeglass use and difficulty seeing without glasses by household wellbeing, residence, household language, region and sex at ages 5–19 years in 2022–2025. Results: Among 27,409 participants aged 5–19 years in 2021–2025, 17.5% (95% confidence interval [CI], 16.5–18.6) wore glasses and 7.6% (95% CI, 7.0–8.3) reported difficulty seeing and wore none. In 2022–2025 (n = 20,388), adjusted eyeglass use was lower in the lowest versus highest wellbeing quintile (−18.7 percentage points; 95% CI, −21.6 to −15.7), in rural versus urban localities (−13.8 points; 95% CI, −15.7 to −11.9), and in households with versus without Indigenous-language speakers (−8.5 points; 95% CI, −11.6 to −5.4). All corresponding global Holm-adjusted P values were < .001. In the same comparisons, differences in difficulty seeing without glasses were 0.4 (95% CI, −2.0 to 2.8), −1.3 (−2.9 to 0.2), and −0.2 (−2.5 to 2.1) points, respectively. Conclusions: Eyeglass use was markedly lower in disadvantaged groups, without a clear corresponding gradient in reported difficulty seeing without glasses. Measured visual acuity is needed to distinguish unrecognized need from a lower frequency of refractive error.
Keywords:
eyeglasses
; refractive errors
; child
; adolescent
; health inequalities
; rural health
; health surveys
; Mexico
1. Introduction
Uncorrected refractive error is the leading cause of vision impairment in children. [1] Childhood vision impairment is associated with poorer educational outcomes, [2] and providing free glasses improved mathematics test scores by 0.11 SD (95% CI, 0.01 to 0.21) in a cluster-randomized trial in China. [3] The burden of myopia is also increasing: a meta-analysis of 276 studies estimated that its prevalence among children and adolescents rose from 24.3% to 35.8% over 1990–2023, with higher prevalence in urban areas and among girls. [4]
Effective refractive error coverage (eREC) monitors progress in refractive correction. In 2021, the World Health Assembly endorsed a 40-percentage-point increase in eREC by 2030. [5] This indicator requires measured uncorrected and corrected visual acuity. [6] Available multi-country estimates are restricted to adults aged 50 years and older, among whom distance eREC was 34.5% in Latin America and the Caribbean; the authors identified younger populations, particularly children, as a priority for data collection. [7] Reporting across relevant ages, socioeconomic groups and geographic areas has also been recommended. [8] Where acuity is not measured, national household surveys asking about glasses and difficulty seeing provide a partial view of vision-related functioning.
In Mexico, evidence in children comes mainly from school programs and local studies. Among 3.86 million public primary school students screened in 2013–14, only 16.3% of those with confirmed refractive error and information on eyeglass use already wore glasses. [9] Prescription glasses were used by 20% of children aged 12–13 years with bilateral myopia in Monterrey, [10] while 13.4% of children given free spectacles in Oaxaca wore them at an unannounced visit. [11] These studies identify gaps in refractive correction but do not describe eyeglass use across social groups in the general population. In a US national survey, adolescents from low-income families more often reported poor vision, and Mexican American adolescents more often had visual acuity worse than 20/40 in the better-seeing eye. [12]
ENSANUT 2018–19 and ENSANUT Continua 2021–2025 include vision questions from the UNICEF/Washington Group Child Functioning Module, which was field tested in Mexico. [13,14] The module asks about glasses before asking about difficulty seeing. Published analyses have described functioning difficulties, including severe difficulty seeing in 0.6% of children aged 5–17 years in 2021–2023, [15] but not glasses use.
We used ENSANUT 2018–19 and ENSANUT Continua 2021–2025 to estimate eyeglass use and reported difficulty seeing at ages 2–19 years and examine differences by household wellbeing, rural residence, Indigenous-language household, region and sex. Our main question was whether groups with lower eyeglass use reported more difficulty seeing without glasses. Secondary analyses compared children in 2018–19 and 2021–2025 and examined screen time among adolescents.
2. Methods
2.1. Study Design and Data Sources
We conducted repeated cross-sectional analyses of ENSANUT 2018–19 and ENSANUT Continua 2021–2025, multistage, stratified cluster probability surveys of residents of private dwellings in Mexico. [16,17,18,19,20,21] In 2018–19, one preschool child (0–4 years), one school-age child (5–9 years) and one adolescent (10–19 years) were selected per dwelling; [16] from 2021, all preschool children in the household were included, together with one school-age child and one adolescent. [17,18] Fieldwork in 2025 was planned for August to December. [21] We obtained public-use databases, questionnaires and variable catalogs from the Instituto Nacional de Salud Pública (INSP). [22] The 2025 methodology also describes institutional oversamples; [21] we used the ENSANUT Continua files as released and added no other dataset. All records meeting each analytical definition were included; no prospective sample-size calculation was undertaken. The analysis used de-identified public-use records. The original survey reports describe approval by the Instituto Nacional de Salud Pública ethics, research, and biosafety committees for the 2018–19 and 2022 surveys, [16,18] and ethics and biosafety committee approval, informed consent, and assent and parental consent for minors in 2025. [21] The authors did not seek separate ethics review for this secondary analysis.
Reporting was guided by the STROBE recommendations for cross-sectional studies. [23] The completed checklist is provided in Supplementary Table S1.
2.2. Participants and Analysis-specific Populations
The functioning module applies from 2 years of age. In 2018–19, its vision questions appeared only in the child questionnaire (0–9 years), contributing participants aged 2–9 years. In 2021–2025, they appeared in the child (2–9 years) and adolescent (10–19 years) questionnaires. We included participants aged 2–19 years with a usable survey weight and recorded answers on glasses use and difficulty seeing. Seven records without a usable weight, all from 2021, were excluded before survey construction.
Pooled 2021–2025 estimates covered ages 2–19 years, with ages 5–19 years as the main summary because the item for children aged 2–4 years differs (Supplementary Table S2). Social and geographic comparisons covered ages 5–19 years in 2022–2025, when the household wellbeing index was available. Period comparisons covered ages 2–9 years in 2018–19 and 2021–2025 (Figure 1; Table 1). Screen-time analyses used adolescents who also completed the physical activity questionnaire in 2022–2025.
2.3. Glasses Use and Difficulty Seeing
The vision questions follow the UNICEF/Washington Group Child Functioning Module at ages 2–17 years; [13,14] participants aged 18–19 years answer separate adult items with the same wording and responses. The questionnaire first asks whether the participant wears glasses, including contact lenses from 5 years of age. Wearers then report difficulty seeing with their glasses; non-wearers report difficulty seeing. Responses are no difficulty, some difficulty, a lot of difficulty, or cannot see. Caregivers answered for children younger than 10 years and adolescents answered for themselves, although the child module was designed for mothers or primary caregivers. [13] Supplementary Table S2 gives wording and variable names by round.
Glasses use was an affirmative response to the first question. Any difficulty seeing included some difficulty, a lot of difficulty or cannot see. The second main outcome, difficulty seeing without glasses, identified participants reporting at least some difficulty who did not wear glasses. We also described wearers with residual difficulty and participants reporting a lot of difficulty or inability to see, the recommended disability threshold. [14] We used the lower threshold because most moderate functioning impairments are reported as some difficulty [24] and, in population-based surveys of mostly adults, the higher threshold identified only 10–39% of people with measured distance vision impairment, compared with 67–85% for the lower threshold. [25] These outcomes do not measure acuity or refraction; difficulty seeing without glasses does not establish who would benefit from correction.
2.4. Social and Geographic Dimensions
Household wellbeing was the INSP-released quintile of the wellbeing index for 2022–2025. The index, described for 2022, is the first principal component of eight dwelling and asset variables; [26] we retained each round’s quintiles, with the highest as reference. Rural localities had fewer than 2,500 inhabitants, with urban residence as reference. Indigenous-language households had at least one roster member reported to speak an Indigenous language, with other households as reference. States were assigned to the eight ENSANUT regions, using Pacific North as reference. [18] Male sex was the reference for comparisons by sex. Age was entered categorically in single years.
2.5. Survey Design, Pooling and Missing Data
Survey designs were constructed from all released child and adolescent records with usable weights in the relevant rounds, including children younger than 2 years, before restriction to analytical domains. State- or round-exclusion sensitivities rebuilt the design without those records. Designs used questionnaire-specific expansion weights, strata and primary sampling units (PSUs), with identifiers prefixed by year. Variances were estimated by Taylor linearisation, using the conservative grand-mean adjustment for singleton strata, including those arising within domains. [27]
Independent ENSANUT Continua samples can be combined for pooled analysis. [20] Following an ENSANUT precedent, [28] we divided annual weights by the number of pooled rounds in which each state had records. Sinaloa was absent in 2024 and 2025: its divisor was three in 2021–2025 and two in 2022–2025, compared with five and four elsewhere. The resulting target is the average of available annual populations; missing state-years were not imputed. The 2018–19 sample retained its released weights.
All estimates used observed-outcome domains. Three children lacked vision responses, and no participant in the social and geographic analysis lacked a dimension variable (Supplementary Table S3). No imputation was performed. For 39 adolescents whose difficulty response appeared under the other age band’s item, we used that recorded response.
2.6. Statistical Analyses and Sensitivity Analyses
We reported unweighted counts and survey-weighted prevalence with 95% confidence intervals on the logit scale. Estimates by survey round used annual weights and the geography available in each round. We did not fit a linear trend or perform pairwise tests between years. Population totals were estimated for the 2025 round with its annual weights.
Separate survey-weighted quasibinomial logistic models evaluated each dimension for glasses use, difficulty seeing without glasses and any difficulty seeing. Adjustment included categorical single-year age, sex and survey round; comparisons by sex adjusted for age and round only. These models do not estimate mutually independent social effects. Package-based predictive margins and their joint covariance yielded standardized probabilities and absolute percentage-point differences over the fitting population. [29] Probability intervals used a logit transformation; contrast intervals were pointwise t intervals with residual survey degrees of freedom. Differences were calculated from unrounded estimates.
Global Wald F tests were Holm-adjusted within the ten primary tests (five dimensions for each main outcome), the five tests for any difficulty seeing, the four period-comparison tests, and the three outcomes within each screen-time model. Sensitivities retained their corresponding families; reference contrasts were additionally Holm-adjusted within dimension. We described, without testing, the proportion without glasses among participants reporting difficulty and the proportion wearing glasses among those with glasses or difficulty. Because wearers report difficulty with correction, these proportions partly reflect how common glasses use is.
Sensitivity analyses of the social and geographic comparisons used the average-stratum variance for singleton strata; restricted all rounds to the 31 states present throughout; excluded the 2023 round, the smallest and the one with state oversamples; [19] added 2021 for the dimensions that do not need the wellbeing index; were stratified by respondent (caregiver at 5–9 years, self-report at 10–19 years); adjusted the five dimensions for each other; and used annual weights without the pooling divisor.
Secondary analyses compared children in 2018–19 and in 2021–2025, adjusting for age and sex, and described estimates at adjacent ages on either side of the change of respondent (10 years) and of instrument (18 years). Screen time was the sum of reported daily hours of television, video games and computer, tablet or telephone use, from answer bands coded at their midpoints (9 hours for the open upper band), and was analyzed with the weights, strata and PSUs of the physical activity questionnaire. Model 1 adjusted for age, sex and round, and Model 2 also for wellbeing, residence and household language; screen time entered in four categories and, in a further Model 2, as hours per day.
The supplement reports estimates by survey round (Supplementary Table S4) and by single year of age (Supplementary Table S5), combinations of glasses use and difficulty (Supplementary Table S6), complete model results (Supplementary Table S7), sensitivity analyses (Supplementary Table S8 and 9) and secondary analyses (Supplementary Table S10 and S11).
2.7. Software and Reproducibility
The original workflow was run in R 4.3.3, with tidyverse packages for preparation, survey (version 4.5) for weighted analyses, ggplot2 for figures and flextable for tables. Supplementary Methods provide detailed harmonization and analytical definitions.
3. Results
3.1. Study Population
The child questionnaire files of the six rounds and the adolescent questionnaire files of 2021–2025 held 58,854 records, of which 58,847 had usable weights (758 strata and 7,173 PSUs across the six rounds). After exclusion of 7,239 children younger than 2 years, 51,608 participants aged 2–19 years remained and 51,605 had recorded answers (Figure 1; Table 1). The 2018–19 round contributed 17,755 children aged 2–9 years and the 2021–2025 rounds 33,850 participants, 27,409 of them aged 5–19 years. The social and geographic analysis included 20,388 participants aged 5–19 years from 2022–2025.
3.2. Glasses Use and Difficulty Seeing by Age and Sex
In 2021–2025, 17.5% (95% CI, 16.5 to 18.6) of children and adolescents aged 5–19 years wore glasses, 11.5% (10.8 to 12.2) reported any difficulty seeing and 7.6% (7.0 to 8.3) reported difficulty seeing and did not wear glasses (Table 2). A further 3.8% wore glasses and still reported difficulty, and 0.6% reported a lot of difficulty or could not see. Among children aged 2–4 years, 1.2% wore glasses.
Glasses use increased from 8.7% at 5–9 years to 16.2% at 10–14 years and 27.8% at 15–19 years. Single-year estimates were 1.7% at 5 years and 30.0% at 19 years, with irregularities between adjacent ages (Figure 2A; Supplementary Table S5). The sex difference emerged in adolescence: at 15–19 years, 34.9% (31.9 to 37.9) of girls and 20.3% (18.0 to 22.8) of boys wore glasses (Figure 2B). Across the caregiver/self-report boundary, glasses use was similar at 8–9 and 10–11 years (13.3% and 12.7%), while difficulty seeing without glasses was 4.0% and 8.0%. Across the instrument boundary, difficulty was 8.8% at 16–17 years and 13.2% at 18–19 years (Supplementary Table S10).
Among participants aged 5–19 years who reported difficulty seeing, 66.6% (95% CI, 63.1 to 69.9) did not wear glasses (Supplementary Table S6). With the annual weights of the 2025 round, which covers 31 states, an estimated 5.79 million (95% CI, 5.09 to 6.49) children and adolescents aged 5–19 years wore glasses and 2.38 million (95% CI, 2.01 to 2.75) reported difficulty seeing and wore none. Estimates by survey round are provided in Supplementary Table S4 and Supplementary Figure S1.
3.3. Social and Geographic Differences
Adjusted glasses use decreased across wellbeing quintiles, from 26.0% in the highest to 7.3% in the lowest (difference, -18.7 percentage points; 95% CI, -21.6 to -15.7; Table 3; Figure 3). It was 7.4% in rural versus 21.2% in urban localities (-13.8 points; 95% CI, -15.7 to -11.9), and 10.2% in Indigenous-language versus 18.7% in other households (-8.5 points; 95% CI, -11.6 to -5.4). Girls wore glasses more often than boys (21.1% versus 14.8%; 6.3 points; 95% CI, 4.2 to 8.4). Regional probabilities ranged from 10.9% in the Peninsula to 28.7% in Mexico City and the State of Mexico (Figure 4). All five global Holm-adjusted p values were <.001.
Difficulty seeing without glasses showed no clear corresponding gradient. Adjusted probabilities were 7.4% in the lowest and 6.9% in the highest wellbeing quintile (difference, 0.4 points; 95% CI, -2.0 to 2.8), 7.0% in rural and 8.3% in urban localities (-1.3 points; 95% CI, -2.9 to 0.2), and 7.8% in Indigenous-language and 8.0% in other households (-0.2 points; 95% CI, -2.5 to 2.1). Intermediate quintiles were 1.2 to 2.1 points above the highest, with intervals including zero. The difference between girls and boys was 0.7 points (95% CI, -0.7 to 2.1), and regional probabilities ranged from 6.6% to 9.8%. Global Holm-adjusted p values ranged from .501 to .898.
Any difficulty seeing, with or without glasses, was less frequent in rural localities (-4.6 points; 95% CI, -6.3 to -2.9) and in Indigenous-language households (-3.1 points; 95% CI, -5.6 to -0.6) and more frequent among girls (2.8 points; 95% CI, 1.2 to 4.5); the five global Holm-adjusted p values were below .05 (Supplementary Table S7). Any difficulty is the sum of difficulty without glasses and difficulty despite glasses, so these differences come mainly from participants who wear glasses and still report difficulty.
Participants who reported difficulty seeing were therefore more often without glasses in the less advantaged groups: 81.1% (69.7 to 88.9) in the lowest wellbeing quintile and 58.9% (49.0 to 68.3) in the highest; 81.8% in rural and 63.2% in urban localities; and 85.0% and 65.0% in households with and without Indigenous-language speakers. Glasses wearers were 49.6%, 51.5% and 56.2% of those who wore glasses or reported difficulty in these three groups, compared with 78.9%, 71.9% and 70.0% in the respective comparison groups (Supplementary Table S6).
3.4. Sensitivity Analyses
Under the alternative singleton rule, point estimates were unchanged and global inference was the same (Supplementary Table S8). With the common 31-state support, the wellbeing and rural contrasts in glasses use were -18.6 and -14.0 points, and annual weights without the pooling divisor changed no contrast by more than 0.2 points. Excluding the 2023 round left the gradients in glasses use in place (-17.8 points for wellbeing and -13.2 for residence). In that analysis difficulty seeing without glasses was lower in rural than in urban localities (-2.0 points; 95% CI, -3.3 to -0.8; global Holm-adjusted p = .013) and higher in the second and third than in the highest wellbeing quintile (3.3 points; 95% CI, 1.1 to 5.4; and 2.3 points; 95% CI, 0.2 to 4.4), with a global Holm-adjusted p value for wellbeing of .141. With 2021 added, the rural contrast in difficulty seeing without glasses was -1.4 points (95% CI, -2.7 to -0.2; global Holm-adjusted p = .139).
Lower glasses use in the lowest wellbeing quintile and in rural localities was present under both respondents and was more marked under self-report: the wellbeing contrast was -8.6 points (-11.7 to -5.5) at 5–9 years and -23.6 points (-27.6 to -19.6) at 10–19 years, and the rural contrast -7.2 points (-9.2 to -5.1) and -17.1 points (-19.6 to -14.5) (Supplementary Table S9). Under caregiver report the contrast for household language was -5.0 points (-8.1 to -1.9), with a global Holm-adjusted p value of .134. Difficulty seeing without glasses did not differ by wellbeing, residence or household language in either stratum. When the five dimensions were adjusted for each other, the contrasts in glasses use were -14.3 points (-17.5 to -11.0) for wellbeing, -9.5 points (-11.7 to -7.3) for residence and -1.8 points (-5.6 to 1.9) for household language; for difficulty seeing without glasses, the rural contrast was -1.8 points (-3.5 to -0.1) and that of the second wellbeing quintile 2.4 points (0.1 to 4.6), with global Holm-adjusted p values of .274 and 1.000.
3.5. Children in 2018–19 and in 2021–2025
Among children aged 5–9 years, adjusted glasses use was 6.9% in 2018–19 and 8.7% in 2021–2025, a difference of 1.8 points (95% CI, 0.5 to 3.0; global Holm-adjusted p = .016); with Sinaloa excluded from both periods it was 1.9 points (0.7 to 3.2). Difficulty seeing without glasses did not differ between periods (0.3 points; 95% CI, -0.5 to 1.1), and neither did glasses use at 2–4 years (0.2 points; 95% CI, -0.3 to 0.8) (Supplementary Table S10).
3.6. Screen Time
The screen-time sample included 7,085 adolescents (Supplementary Table S3). Mean reported time was 6.3 hours per day (95% CI, 6.1 to 6.5), ranging from 4.6 hours in the lowest to 7.1 hours in the highest wellbeing quintile (Supplementary Figure S2). In Model 1, adjusted glasses use was 10.6% below 2 hours and 25.8% at 6 hours or more (difference, 15.2 points; 95% CI, 10.6 to 19.8; global Holm-adjusted p <.001). In Model 2, the difference attenuated to 7.0 points (95% CI, 1.4 to 12.6; global Holm-adjusted p=.165); the odds ratio per additional hour was 1.04 (95% CI, 1.01 to 1.07). No clear association with difficulty seeing without glasses was observed in either model (Model 2 difference, 1.3 points; 95% CI, -3.8 to 6.4; Supplementary Table S11).
4. Discussion
4.1. Principal Findings
Eyeglass use was substantially lower in poorer, rural, and Indigenous-language households. Regional estimates also varied. Reported difficulty seeing without glasses showed no clear corresponding gradient.
4.2. Glasses Use and Difficulty Seeing in Context
In Mexico’s 2013–14 school screening program, 16.3% of students with confirmed refractive error and known eyeglass use wore glasses. [9] In our survey, two-thirds of participants reporting difficulty seeing wore none. The latter estimate is based on reported difficulty. The prevalence of a lot of difficulty or inability to see (0.6%) agreed with a prior ENSANUT estimate from three overlapping rounds. [15]
Girls wore glasses more often than boys from adolescence, without a corresponding difference in difficulty seeing without glasses. A review also found greater wear among girls who had received spectacles. [30] Use was highest in Mexico City and the State of Mexico. Both are among the four states that held 54.2% of medical specialists in 2017. [31] We did not measure local eye-care supply or refractive error.
4.3. Interpreting the Social Gradient
Lower eyeglass use could reflect unrecognized or uncorrected need, a lower frequency of refractive error, or both.
Children with longstanding vision difficulties may not recognize them, and caregivers may not notice them. Reported difficulty without glasses doubled from ages 8–9 to 10–11, when age, questionnaire, and respondent changed together. Proxy underreporting has been documented in adults. [32] The survey questions capture only part of measured distance vision impairment, [25] and earlier Mexican school screening found a high proportion of uncorrected refractive error. [9] We did not measure barriers to eye care.
A meta-analysis found higher odds of myopia in urban than rural children (odds ratio, 2.6), [33] and myopia has been associated with family income and parental education. [34] Local Mexican studies reported 9.7% myopia in rural children aged 6–12 years [35] and 44% in Monterrey children aged 12–13 years, [10] using different methods. Screen time was higher in the highest wellbeing quintile and has been associated with myopia in a dose-response meta-analysis. [36]
Measured uncorrected and corrected acuity could distinguish these explanations. [6] In sensitivity analyses, intervals excluding zero indicated less difficulty without glasses in rural localities or more difficulty in intermediate wellbeing quintiles. Glasses wearers made up a smaller share of participants with glasses or difficulty in disadvantaged groups, a measure that partly reflects the frequency of glasses use. The household-language contrast in use attenuated after mutual adjustment.
The glasses-use difference between extreme screen-time categories attenuated from 15.2 to 7.0 points after social adjustment. Screen time also increased with socioeconomic level in ENSANUT 2012. [37] The cross-sectional association cannot establish an effect on refraction.
4.4. Implications
Mexico’s 2025 school health strategy offers vision checks and free glasses to primary school students. [38] Free glasses increase wear compared with prescriptions alone, [39] and cost is a recognized barrier. [40] Sustained wear after distribution remains a concern. [11,41] Our estimates identify groups and regions with low use before the strategy could reasonably be evaluated in the 2025 survey. [21]
Differences in survey design limit interpretation of the 2018–19 versus 2021–2025 comparison as a trend. Adding measured uncorrected and corrected acuity would permit estimation of effective refractive error coverage in children and adolescents. [8]
4.5. Strengths and Limitations
Six national probability samples, harmonized vision items, and sensitivity analyses addressing respondent, round, geography, and variance estimation strengthen the analysis.
The surveys did not measure acuity or refraction. Difficulty varied around the switch to self-report at age 10 and the instrument change at age 18. Eyeglass use does not establish indication, regularity, or adequacy, and wearers’ unaided difficulty was unknown. The lower difficulty threshold favors sensitivity over specificity. [25] The main confidence intervals still allowed differences of about 3 percentage points.
Wellbeing quintiles were round-specific and available only in 2022–2025. Primary models adjusted for age, sex and round, while social dimensions overlapped. The small rural–urban difference in difficulty seeing without glasses depended on the rounds included. Sinaloa’s absence in 2024 and 2025 cannot be recovered through weighting, and differences between the 2018–19 and Continua designs limit period comparisons. Screen time was self-reported in bands and summed across devices, counting simultaneous use more than once. Finally, these cross-sectional surveys exclude children outside private dwellings and do not support causal inference.
5. Conclusions
Mexico’s national surveys can monitor eyeglass use across social groups. Adding measured visual acuity would help assess whether low use reflects differences in refractive error, recognition, or access to correction.
Supplementary Materials
The following supporting information can be downloaded at the website of this paper posted on Preprints.org. The supplement contains the harmonization methods, supplementary tables, and two figures on survey-round estimates and screen time.
Author Contributions
Martín Roberto Basile-Alvarez: Conceptualization; Methodology; Software; Validation; Formal analysis; Investigation; Resources; Data Curation; Writing - Original Draft; Writing - Review & Editing; Visualization; Project administration. Enrique C. Guerra: Conceptualization; Methodology; Software; Validation; Formal analysis; Investigation; Resources; Data Curation; Writing - Original Draft; Writing - Review & Editing; Visualization; Project administration. Miguel Ángel Castro-Monreal: Validation; Investigation; Writing - Original Draft; Writing - Review & Editing. Andrea Malagón-Liceaga: Validation; Writing - Review & Editing. Mary Lady González-Suriel: Validation; Writing - Review & Editing. Erick André Escalante-Buendía: Validation; Writing - Review & Editing. José Roberto Arreola-Martínez: Validation; Writing - Review & Editing. Jesús Enrique Arreola-Martínez: Validation; Writing - Review & Editing. Priscila Verduzco-Martínez: Validation; Writing - Review & Editing.
Funding
This research received no specific grant from any funding agency in the public, commercial, or not-for-profit sectors. The study received no support from SECIHTI.
Institutional Review Board Statement
This secondary analysis used de-identified public-use ENSANUT data. The Methods describe the published ethics approvals for the source surveys. The authors did not seek separate ethics review for this secondary analysis. This retrospective analysis involved no participant contact or intervention and used only de-identified public-use records, consistent with the no-risk category described in Article 17(I) of Mexico’s Reglamento de la Ley General de Salud en Materia de Investigación para la Salud (https://www.diputados.gob.mx/LeyesBiblio/regley/Reg_LGS_MIS.pdf).
Informed Consent Statement
The 2025 ENSANUT methodology reports informed consent and, for minors, participant assent and parental consent. This analysis used only the released de-identified records and involved no participant contact.
Data Availability Statement
De-identified public-use data from the 2018–19 and 2021–2025 National Health and Nutrition Surveys are available from the Instituto Nacional de Salud Pública.22.
Conflicts of Interest
Enrique C. Guerra receives a PhD scholarship from the Secretaría de Ciencia, Humanidades, Tecnología e Innovación (SECIHTI), Mexico, separate from this study. The authors report no other disclosures.
Declaration of generative AI
The authors declare that cloud-based AI-assisted tools (ChatGPT, OpenAI, San Francisco, CA, US; primarily GPT-5.6 Sol) were used to support specific aspects of this work, including writing and readability improvements and code generation for parts of the analysis. These tools were not used to generate the research question or study design, interpret the findings, or formulate the conclusions. All AI-assisted output was directed, reviewed, tested, and revised by the authors, who take full responsibility for the final manuscript.
References
- World Health Organization. SPECS 2030. Accessed November 10, 2026. https://www.who.int/initiatives/specs-2030.
- Burton, M.J.; Ramke, J.; Marques, A.P.; et al. The Lancet Global Health Commission on Global Eye Health: vision beyond 2020. Lancet Glob. Health 2021, 9(4), e489–e551. [Google Scholar] [CrossRef]
- Ma, X.; Zhou, Z.; Yi, H.; et al. Effect of providing free glasses on children’s educational outcomes in China: cluster randomized controlled trial. BMJ 2014, 349, g5740. [Google Scholar] [CrossRef]
- iang, J.; Pu, Y.; Chen, J.; et al. Global prevalence, trend and projection of myopia in children and adolescents from 1990 to 2050: a comprehensive systematic review and meta-analysis. Br. J. Ophthalmol. 2025, 109(3), 362–371. [Google Scholar] [CrossRef]
- World Health Assembly. Decision WHA74(12): integrated people-centred eye care, including preventable vision impairment and blindness. Seventy-fourth World Health Assembly, Geneva; May 31, 2021. Accessed November 10, 2026. https://apps.who.int/gb/ebwha/pdf_files/WHA74/A74(12)-en.pdf.
- McCormick, I.; Mactaggart, I.; Bastawrous, A.; Burton, M.J.; Ramke, J. Effective refractive error coverage: an eye health indicator to measure progress towards universal health coverage. Ophthalmic Physiol. Opt. 2020, 40(1), 1–5. [Google Scholar] [CrossRef]
- Bourne, R.R.A.; Cicinelli, M.V.; Sedighi, T.; et al. Effective refractive error coverage in adults aged 50 years and older: estimates from population-based surveys in 61 countries. Lancet Glob. Health 2022, 10(12), e1754–e1763. [Google Scholar] [CrossRef]
- Keel, S.; Müller, A.; Block, S.; et al. Keeping an eye on eye care: monitoring progress towards effective coverage. Lancet Glob. Health 2021, 9(10), e1460–e1464. [Google Scholar] [CrossRef]
- Ramírez-Ortiz, M.A.; Amato-Almanza, M.; Romero-Bautista, I.; et al. A large-scale analysis of refractive errors in students attending public primary schools in Mexico. Sci. Rep. 2023, 13(1), 13509. [Google Scholar] [CrossRef]
- illarreal, G.M.; Ohlsson, J.; Cavazos, H.; Abrahamsson, M.; Mohamed, J.H. Prevalence of myopia among 12- to 13-year-old schoolchildren in northern Mexico. Optom. Vis. Sci. 2003, 80(5), 369–373. [Google Scholar] [CrossRef]
- astanon Holguin, A.M.; Congdon, N.; Patel, N.; et al. Factors associated with spectacle-wear compliance in school-aged Mexican children. Invest Ophthalmol. Vis. Sci. 2006, 47(3), 925–928. [Google Scholar] [CrossRef]
- domfeh, J.; Jastrzembski, B.G.; Oke, I. Association of race, ethnicity, and socioeconomic status with visual impairment in adolescent children in the US. JAMA Ophthalmol. 2022, 140(10), 1006–1010. [Google Scholar] [CrossRef]
- oeb, M.; Mont, D.; Cappa, C.; De Palma, E.; Madans, J.; Crialesi, R. The development and testing of a module on child functioning for identifying children with disabilities on surveys. I: Background. Disabil. Health J. 2018, 11(4), 495–501. [Google Scholar] [CrossRef]
- appa, C.; Mont, D.; Loeb, M.; et al. The development and testing of a module on child functioning for identifying children with disabilities on surveys. III: Field testing. Disabil. Health J. 2018, 11(4), 510–518. [Google Scholar] [CrossRef]
- ázquez-Salas, R.A.; Allen-Leigh, B.; Hubert, C.; et al. Dificultad del funcionamiento en población infantil. Salud Publica Mex. 2024, 66(4), 349–358. [Google Scholar] [CrossRef]
- omero-Martínez, M.; Shamah-Levy, T.; Vielma-Orozco, E.; et al. Encuesta Nacional de Salud y Nutrición 2018-19: metodología y perspectivas. Salud Publica Mex. 2019, 61(6), 917–923. [Google Scholar] [CrossRef]
- omero-Martínez, M.; Barrientos-Gutiérrez, T.; Cuevas-Nasu, L.; et al. Metodología de la Encuesta Nacional de Salud y Nutrición 2021. Salud Publica Mex. 2021, 63(6), 813–818. [Google Scholar] [CrossRef]
- omero-Martínez, M.; Barrientos-Gutiérrez, T.; Cuevas-Nasu, L.; et al. Metodología de la Encuesta Nacional de Salud y Nutrición 2022 y Planeación y diseño de la Ensanut Continua 2020-2024. Salud Publica Mex. 2022, 64(5), 522–529. [Google Scholar] [CrossRef]
- omero-Martínez, M.; Shamah-Levy, T.; Barrientos-Gutiérrez, T.; et al. Encuesta Nacional de Salud y Nutrición 2023: metodología y avances de la Ensanut Continua 2020-2024. Salud Publica Mex. 2023, 65(4), 394–401. [Google Scholar] [CrossRef]
- omero-Martínez, M.; Shamah-Levy, T.; Barrientos-Gutiérrez, T.; et al. Metodología y análisis de la Encuesta Nacional de Salud y Nutrición Continua 2020-2024. Salud Publica Mex. 2024, 66(6), 879–885. [Google Scholar] [CrossRef]
- omero-Martínez, M.; Shamah-Levy, T.; Barrientos-Gutiérrez, T.; et al. Diseño metodológico de la Ensanut Continua y sus sobremuestras ISSSTE y Salud Casa por Casa. Salud Publica Mex. 2025, 67(5), 506–514. [Google Scholar] [CrossRef]
- nstituto Nacional de Salud Pública. Encuesta Nacional de Salud y Nutrición: public-use databases, questionnaires and catalogues, 2018-19 and 2021–2025. Accessed October 2, 2026. https://ensanut.insp.mx/.
- von Elm, E.; Altman, D.G.; Egger, M.; Pocock, S.J.; Gøtzsche, P.C.; Vandenbroucke, J.P.; STROBE Initiative. The Strengthening the Reporting of Observational Studies in Epidemiology (STROBE) statement: guidelines for reporting observational studies. Lancet 2007, 370(9596), 1453–1457. [Google Scholar] [CrossRef]
- Sprunt, B.; McPake, B.; Marella, M. The UNICEF/Washington Group Child Functioning Module—Accuracy, Inter-Rater Reliability and Cut-Off Level for Disability Disaggregation of Fiji’s Education Management Information System. Int. J. Environ. Res. Public Health 2019, 16(5), 806. [Google Scholar] [CrossRef]
- oggs, D.; Kuper, H.; Mactaggart, I.; et al. Exploring the Use of Washington Group Questions to Identify People with Clinical Impairments Who Need Services including Assistive Products: Results from Five Population-Based Surveys. Int. J. Environ. Res. Public Health 2022, 19(7), 4304. [Google Scholar] [CrossRef]
- orales-Ruán, C.; Mayorga-Borbolla, E.; Arango-Angarita, A.; Méndez-Gómez Humarán, I.; Vizuet-Vega, N.I. Características sociodemográficas de hogares y población de la Encuesta Nacional de Salud y Nutrición Continua 2022. Salud Publica Mex. 2023, 65 (suppl 1), S7–S14. [Google Scholar] [CrossRef]
- umley, T. Computations for survey variances: svyCprod. survey package documentation. Accessed October 3, 2026. https://r-survey.r-forge.r-project.org/pkgdown/docs/reference/svyCprod.html.
- eyes-García, A.; Basto-Abreu, A.; Reyes-Sánchez, F.; et al. Prevalencia de diabetes y control glucémico en México, Ensanut 2021-2024. Salud Publica Mex. 2025, 67(6), 622–632. [Google Scholar] [CrossRef]
- umley, T. Predictive marginal means: svypredmeans. survey package documentation. Accessed November 10, 2026. https://r-survey.r-forge.r-project.org/pkgdown/docs/reference/svypredmeans.html.
- orjaria, P.; McCormick, I.; Gilbert, C. Compliance and Predictors of Spectacle Wear in Schoolchildren and Reasons for Non-Wear: A Review of the Literature. Ophthalmic Epidemiol. 2019, 26(6), 367–377. [Google Scholar] [CrossRef]
- einze-Martin, G.; Olmedo-Canchola, V.H.; Bazán-Miranda, G.; Bernard-Fuentes, N.A.; Guízar-Sánchez, D.P. Los médicos especialistas en México. Gac. Med. Mex. 2018, 154(3), 342–351. [Google Scholar] [CrossRef]
- lkasabi, M. Differences in Proxy-Reported and Self-Reported Disability in the Demographic and Health Surveys. J. Surv. Stat. Methodol. 2021, 9(2), 335–351. [Google Scholar] [CrossRef]
- udnicka, A.R.; Kapetanakis, V.V.; Wathern, A.K.; et al. Global variations and time trends in the prevalence of childhood myopia, a systematic review and quantitative meta-analysis: implications for aetiology and early prevention. Br. J. Ophthalmol. 2016, 100(7), 882–890. [Google Scholar] [CrossRef]
- organ, I.G.; Wu, P.-C.; Ostrin, L.A.; et al. IMI Risk Factors for Myopia. Invest Ophthalmol. Vis. Sci. 2021, 62(5), 3. [Google Scholar] [CrossRef]
- arcia-Lievanos, O.; Sanchez-Gonzalez, L.; Espinosa-Cruz, N.; Hernandez-Flores, L.A.; Salmeron-Leal, L.; Torres-Rodriguez, H.D. Myopia in schoolchildren in a rural community in the State of Mexico, Mexico. Clin. Optom. (Auckl) 2016, 8, 53–56. [Google Scholar] [CrossRef]
- a, A.; Lee, Y.J.; Lee, M.; Shim, S.R.; Kim, Y.K. Digital Screen Time and Myopia: A Systematic Review and Dose-Response Meta-Analysis. JAMA Netw. Open 2025, 8(2), e2460026. [Google Scholar] [CrossRef]
- anssen, I.; Medina, C.; Pedroza, A.; Barquera, S. Screen time in Mexican children: findings from the 2012 National Health and Nutrition Survey (ENSANUT 2012). Salud Publica Mex. 2013, 55(5), 484–491. [Google Scholar] [CrossRef]
- ecretaría de Educación Pública. Subsecretaría de Educación Básica informa sobre la estrategia “Vive Saludable, Vive Feliz”. March 22, 2025. Accessed November 10, 2026. https://educacionbasica.sep.gob.mx/subsecretaria-de-educacion-basica-informa-sobre-la-estrategia-vive-saludable-vive-feliz/.
- vans, J.R.; Morjaria, P.; Powell, C. Vision screening for correctable visual acuity deficits in school-age children and adolescents. Cochrane Database Syst. Rev. 2018, 2(2), CD005023. [Google Scholar] [CrossRef]
- urnett, A.M.; Yashadhana, A.; Lee, L.; Serova, N.; Brain, D.; Naidoo, K. Interventions to improve school-based eye-care services in low- and middle-income countries: a systematic review. Bull. World Health Organ. 2018, 96(10), 682–694D. [Google Scholar] [CrossRef]
- hirar, N.; Dudeja, S.; Duggal, M.; et al. Compliance to spectacle use in children with refractive errors- a systematic review and meta-analysis. BMC Ophthalmol. 2020, 20(1), 71. [Google Scholar] [CrossRef]
Figure 1.
Participant selection, Mexico’s National Health and Nutrition Surveys, 2018–2019 and 2021–2025. Children younger than 2 years are outside the functioning module and remain in the survey design. The three analysis populations are not mutually exclusive: participants aged 5–19 years from 2022–2025 are part of the pooled 2021–2025 population.
Figure 1.
Participant selection, Mexico’s National Health and Nutrition Surveys, 2018–2019 and 2021–2025. Children younger than 2 years are outside the functioning module and remain in the survey design. The three analysis populations are not mutually exclusive: participants aged 5–19 years from 2022–2025 are part of the pooled 2021–2025 population.
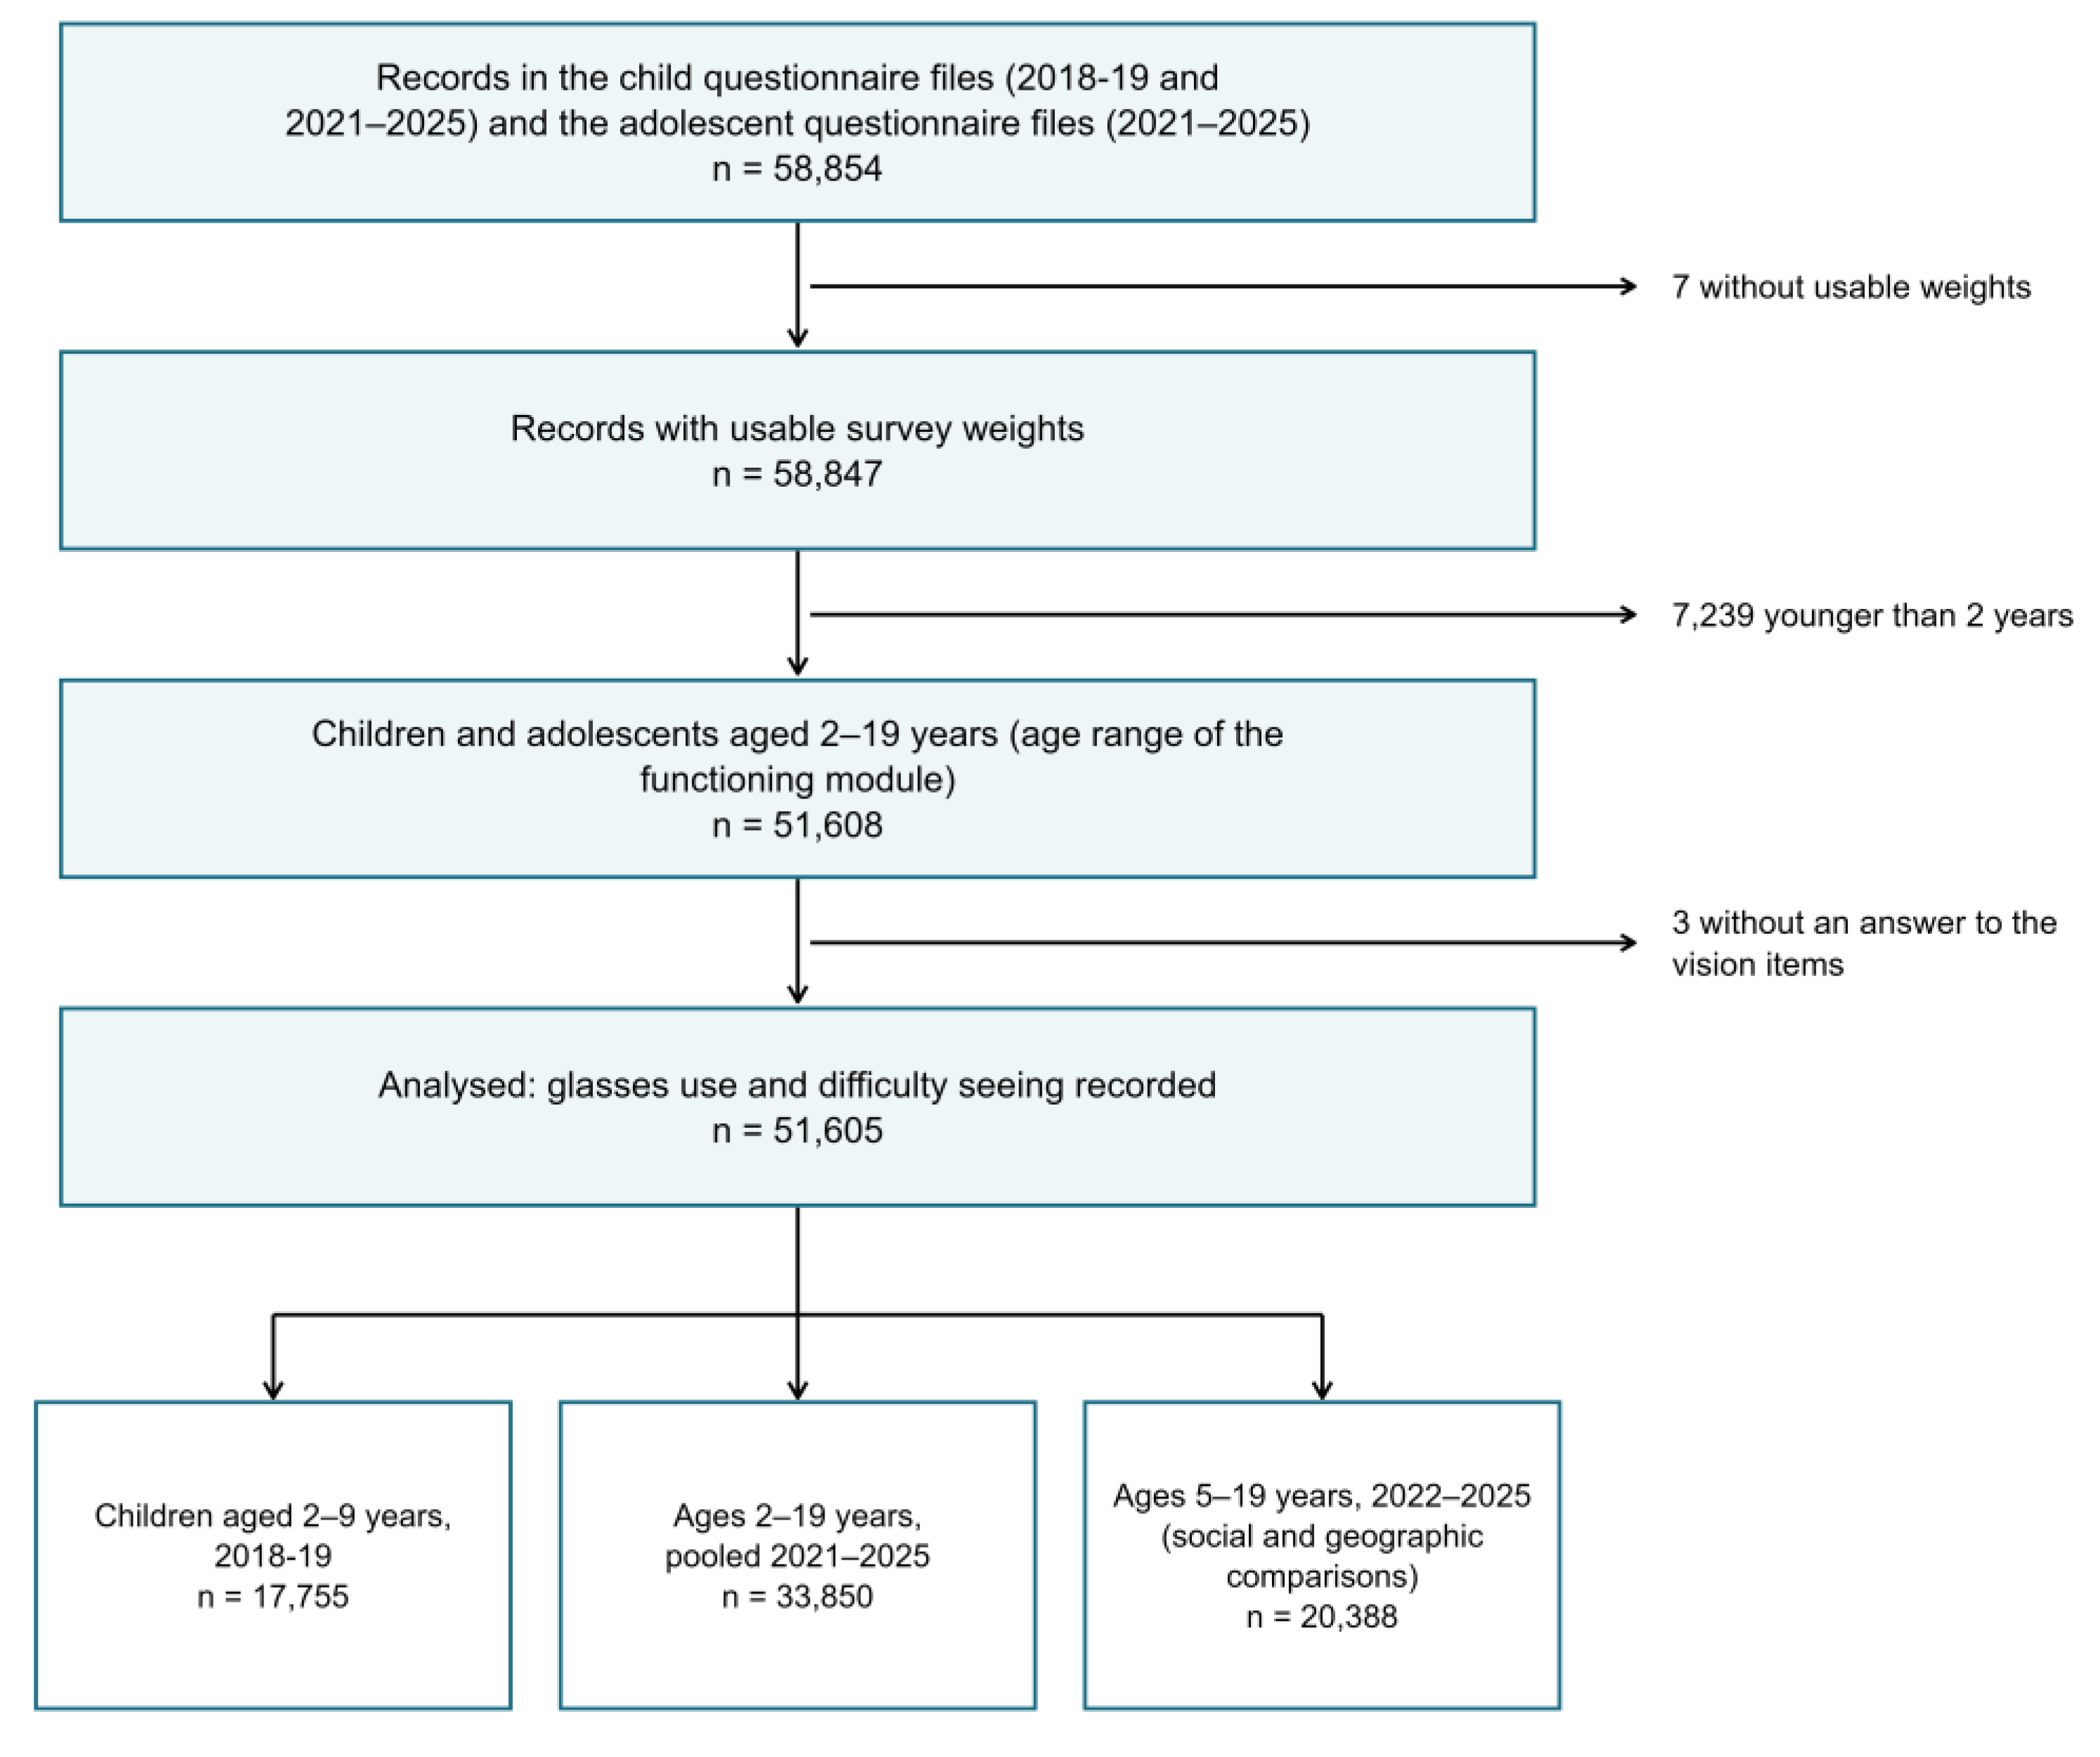
Figure 2.
Glasses use and difficulty seeing without glasses by single year of age, 2021–2025. A, glasses use and difficulty seeing without glasses. B, glasses use by sex. Points show survey-weighted prevalence and shaded bands pointwise 95% confidence intervals. The dashed line marks the change from caregiver report to self-report at 10 years of age.
Figure 2.
Glasses use and difficulty seeing without glasses by single year of age, 2021–2025. A, glasses use and difficulty seeing without glasses. B, glasses use by sex. Points show survey-weighted prevalence and shaded bands pointwise 95% confidence intervals. The dashed line marks the change from caregiver report to self-report at 10 years of age.
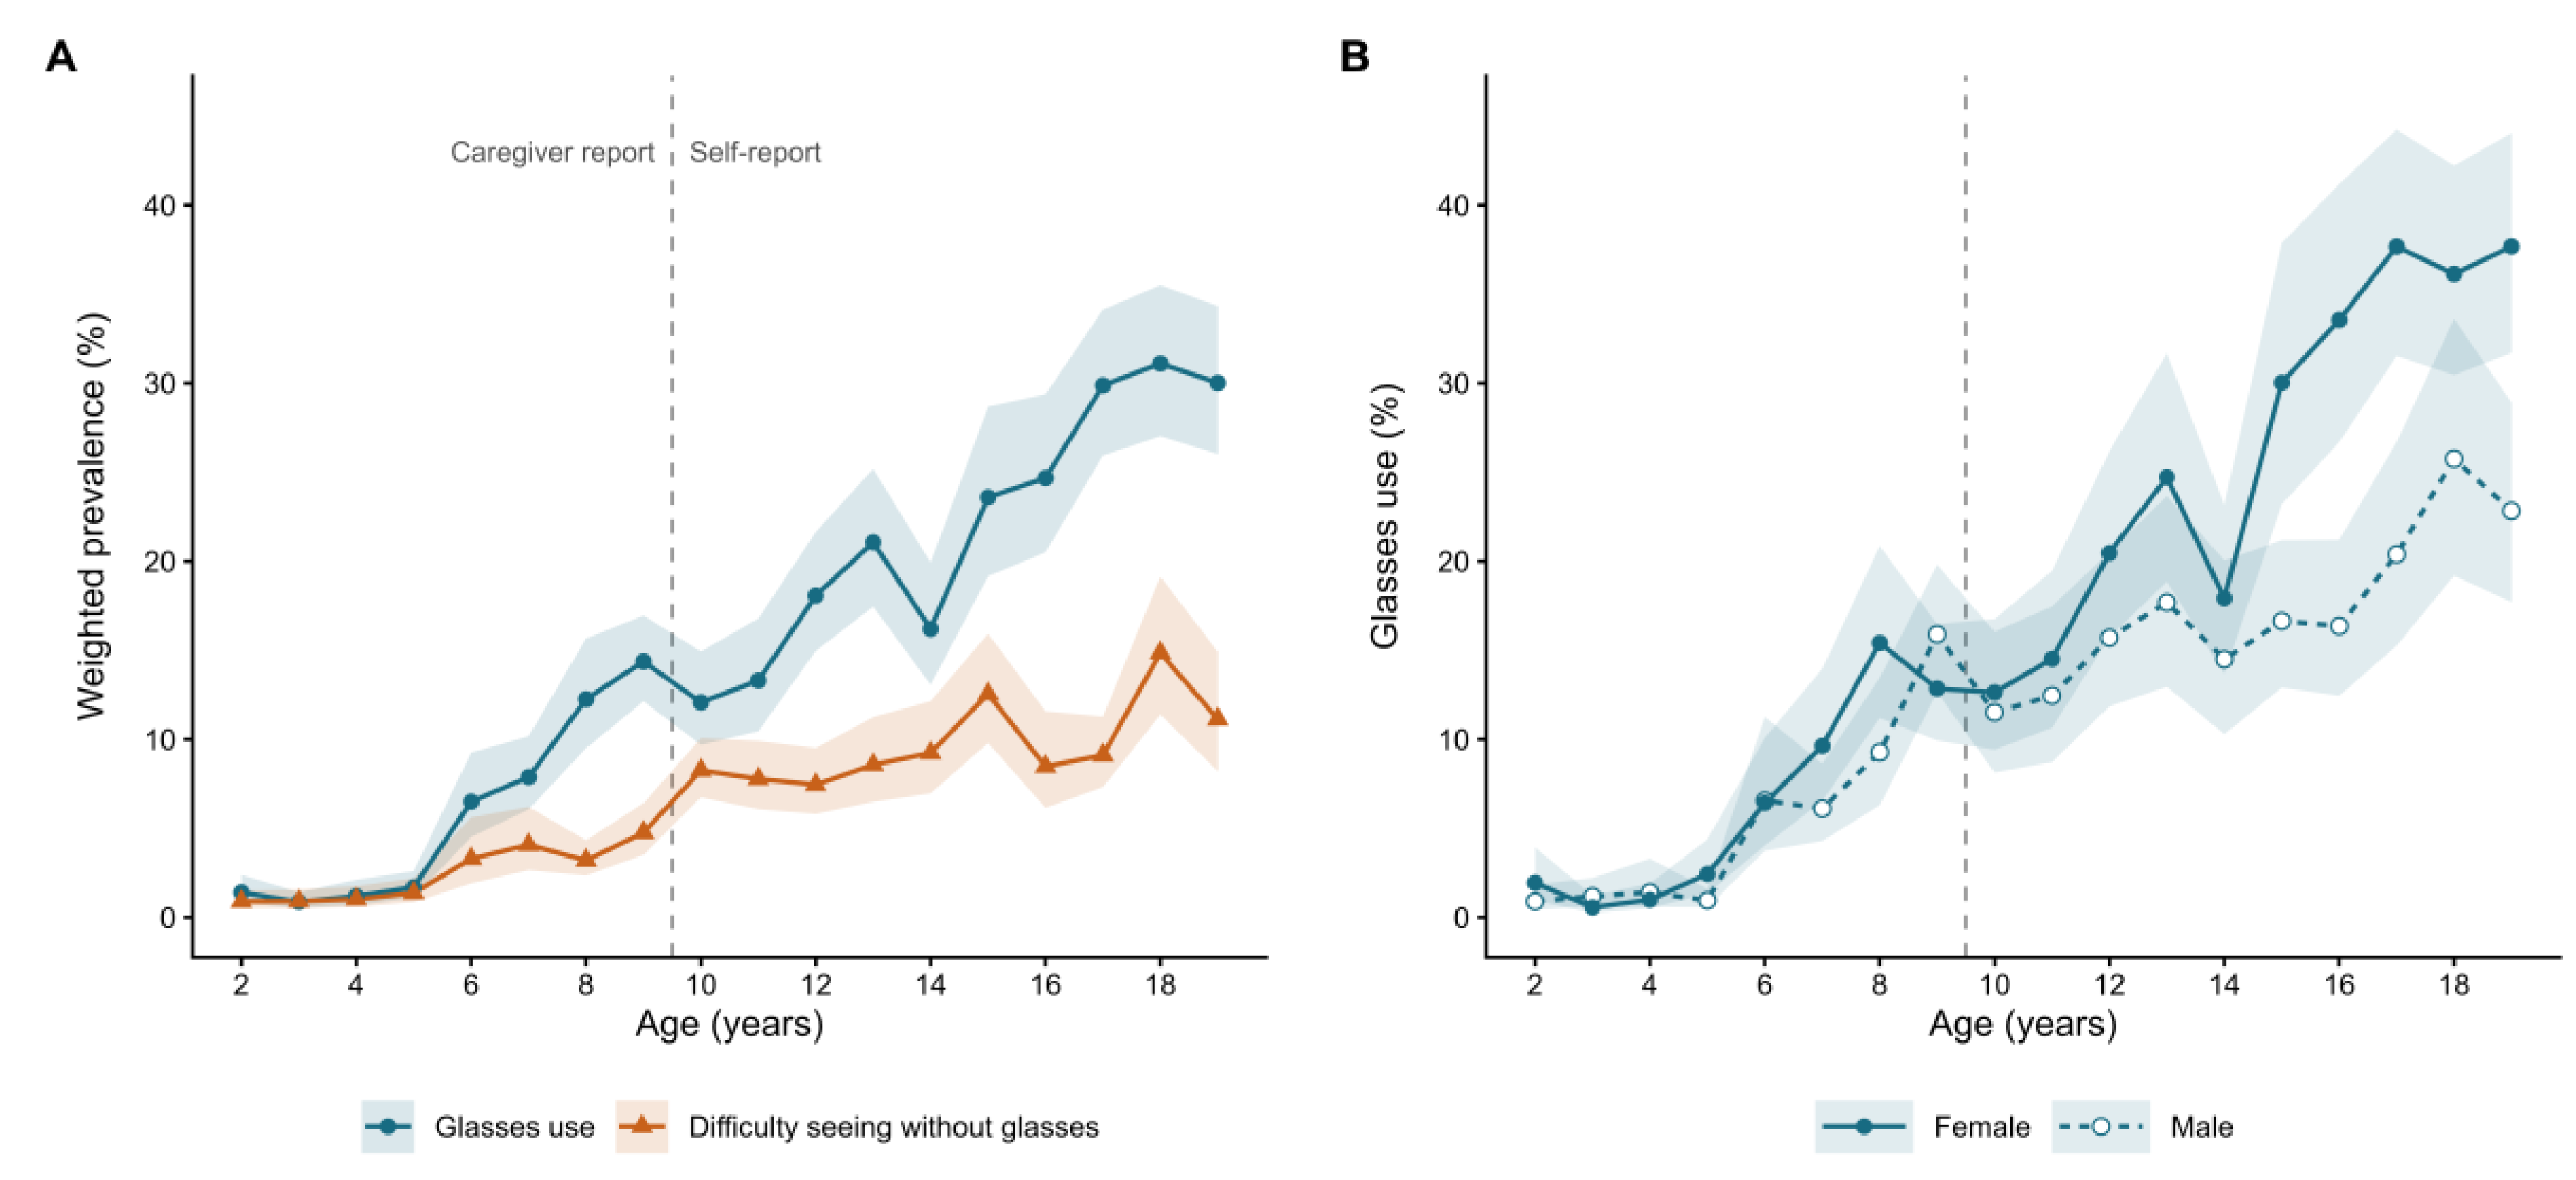
Figure 3.
Social differences in glasses use and in difficulty seeing without glasses, ages 5–19 years, 2022–2025. A, adjusted probabilities. B, absolute differences from reference categories, in percentage points, with pointwise 95% confidence intervals. Models were adjusted for single year of age, sex and survey round (age and round for the comparison by sex). References are the highest wellbeing quintile, urban residence, households without Indigenous-language speakers and male sex.
Figure 3.
Social differences in glasses use and in difficulty seeing without glasses, ages 5–19 years, 2022–2025. A, adjusted probabilities. B, absolute differences from reference categories, in percentage points, with pointwise 95% confidence intervals. Models were adjusted for single year of age, sex and survey round (age and round for the comparison by sex). References are the highest wellbeing quintile, urban residence, households without Indigenous-language speakers and male sex.
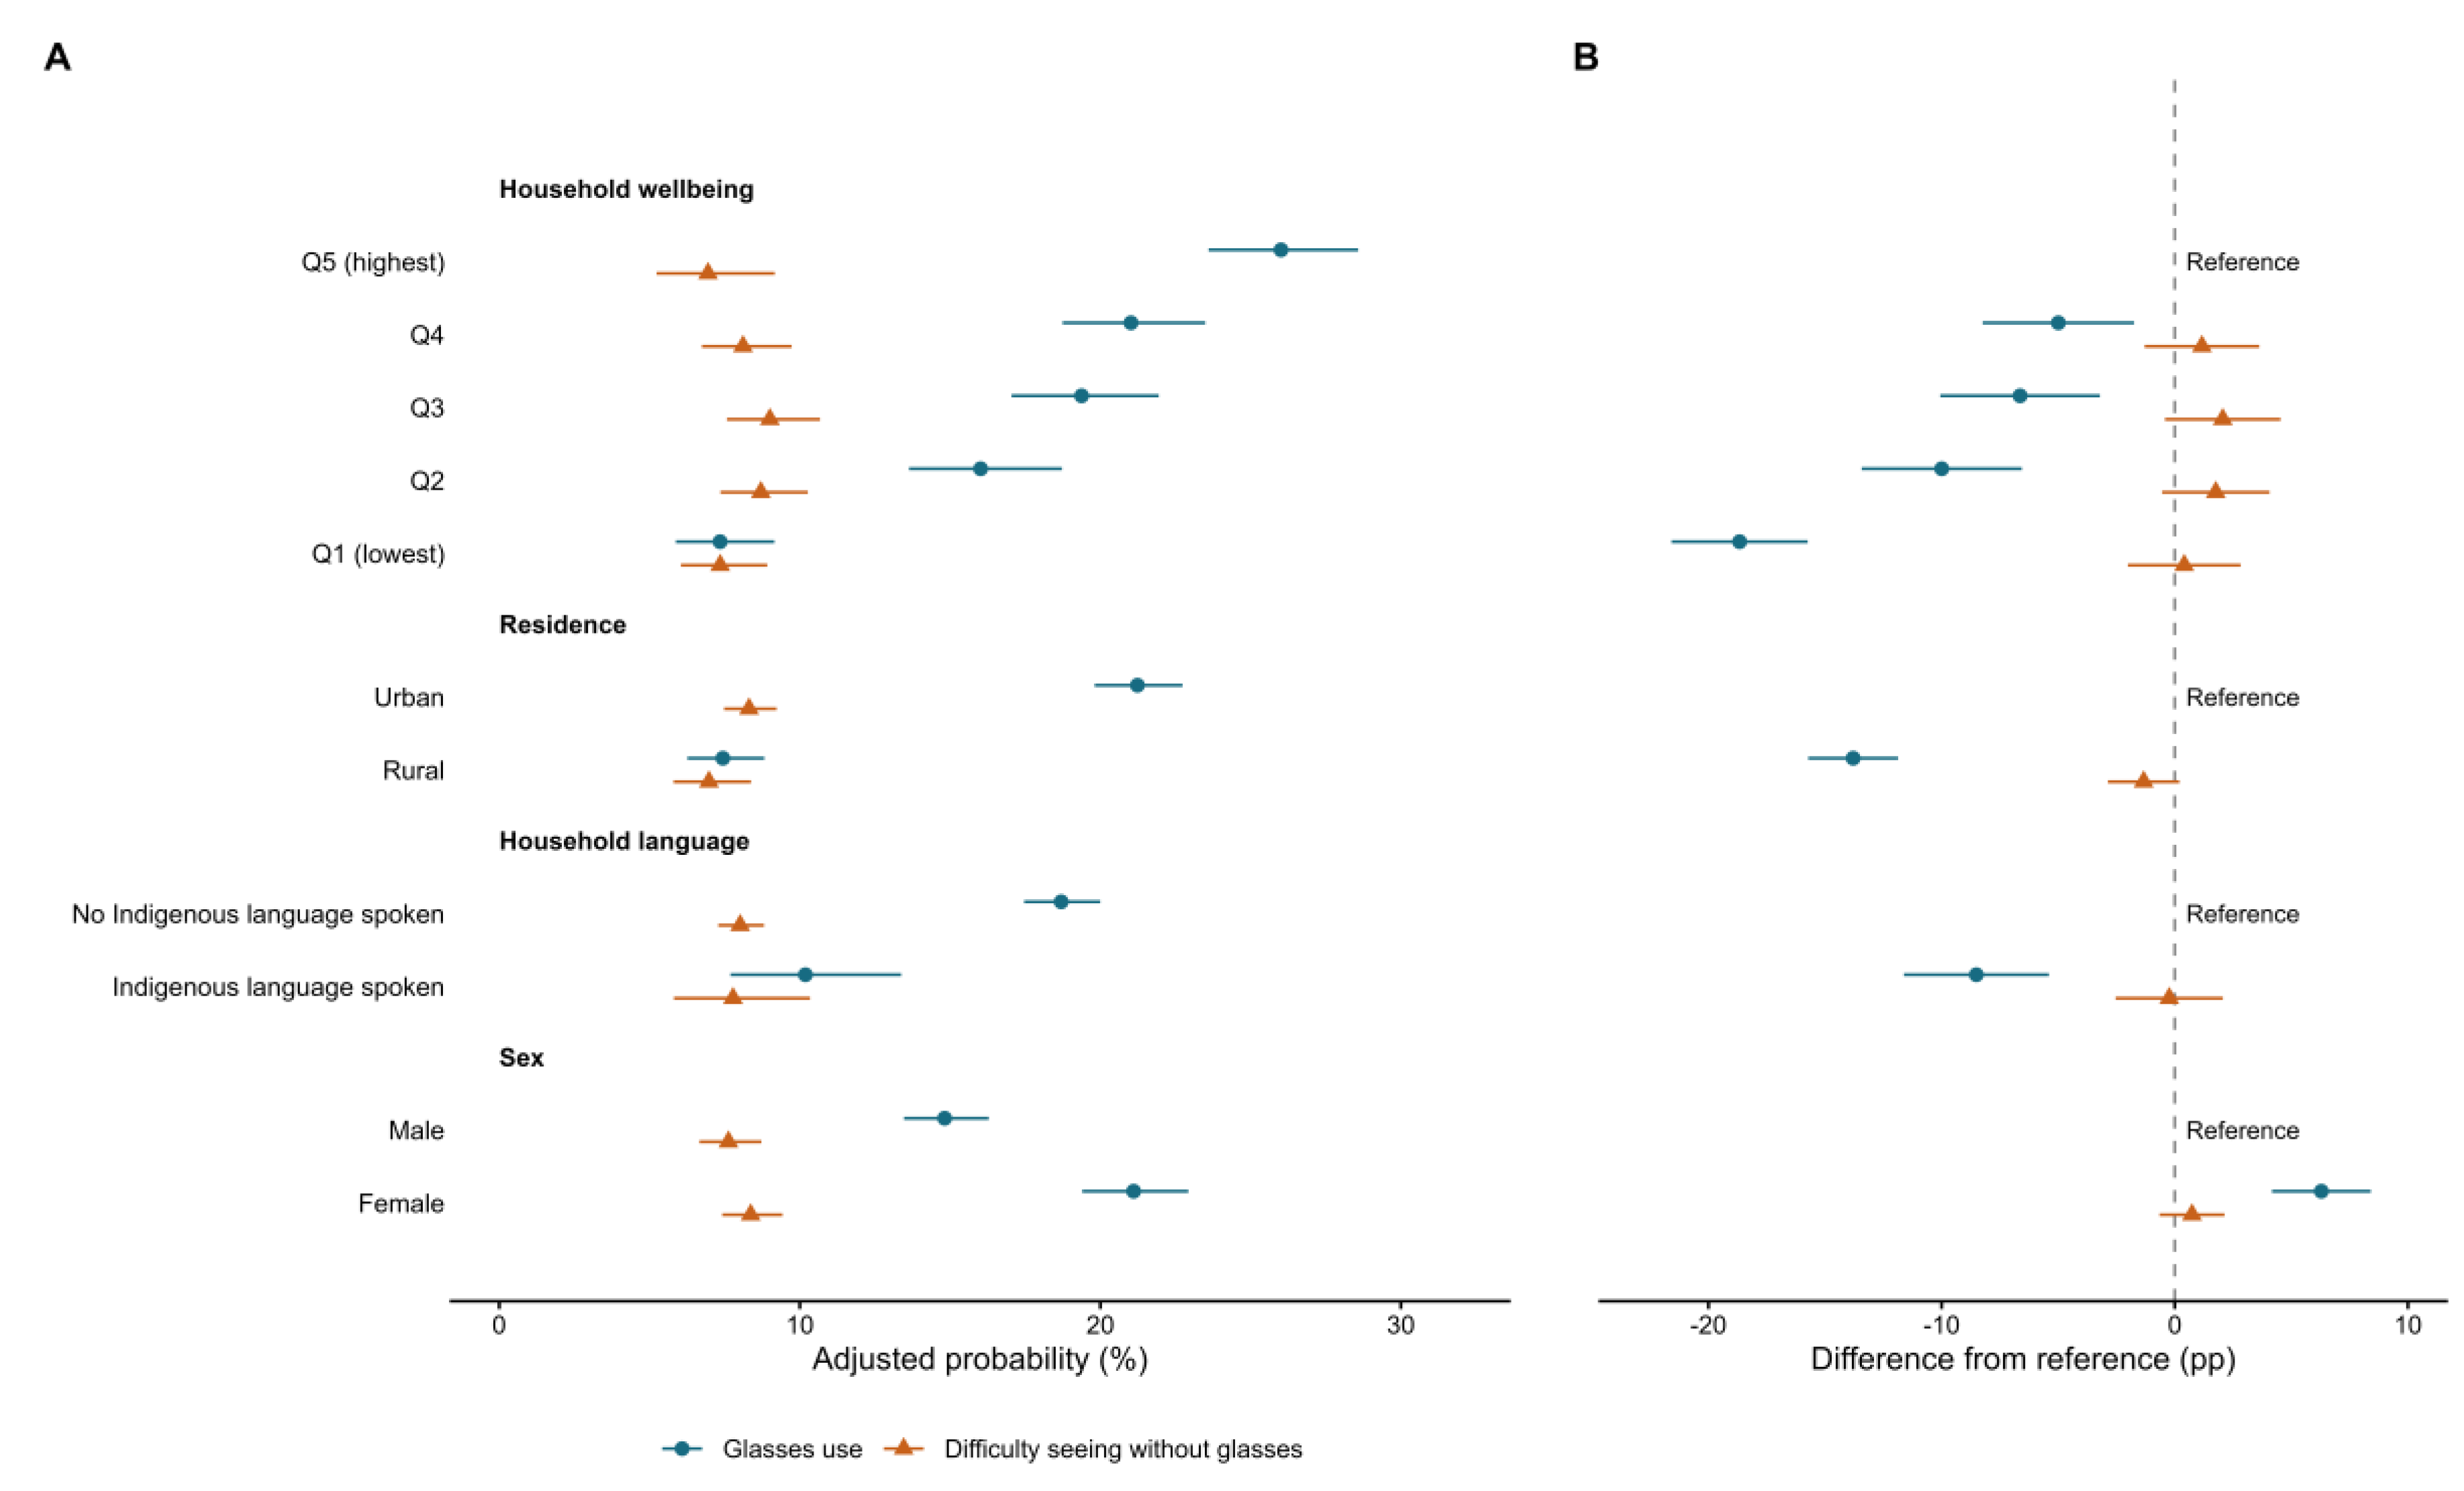
Figure 4.
Regional estimates of glasses use and of difficulty seeing without glasses, ages 5–19 years, 2022–2025. A and B, adjusted regional probabilities on a common color scale; state boundaries do not indicate state-level estimates. C, adjusted regional probabilities with pointwise 95% confidence intervals. Boundaries: Instituto Nacional de Estadística y Geografía via geoBoundaries 2020 (CC BY 3.0 IGO).
Figure 4.
Regional estimates of glasses use and of difficulty seeing without glasses, ages 5–19 years, 2022–2025. A and B, adjusted regional probabilities on a common color scale; state boundaries do not indicate state-level estimates. C, adjusted regional probabilities with pointwise 95% confidence intervals. Boundaries: Instituto Nacional de Estadística y Geografía via geoBoundaries 2020 (CC BY 3.0 IGO).
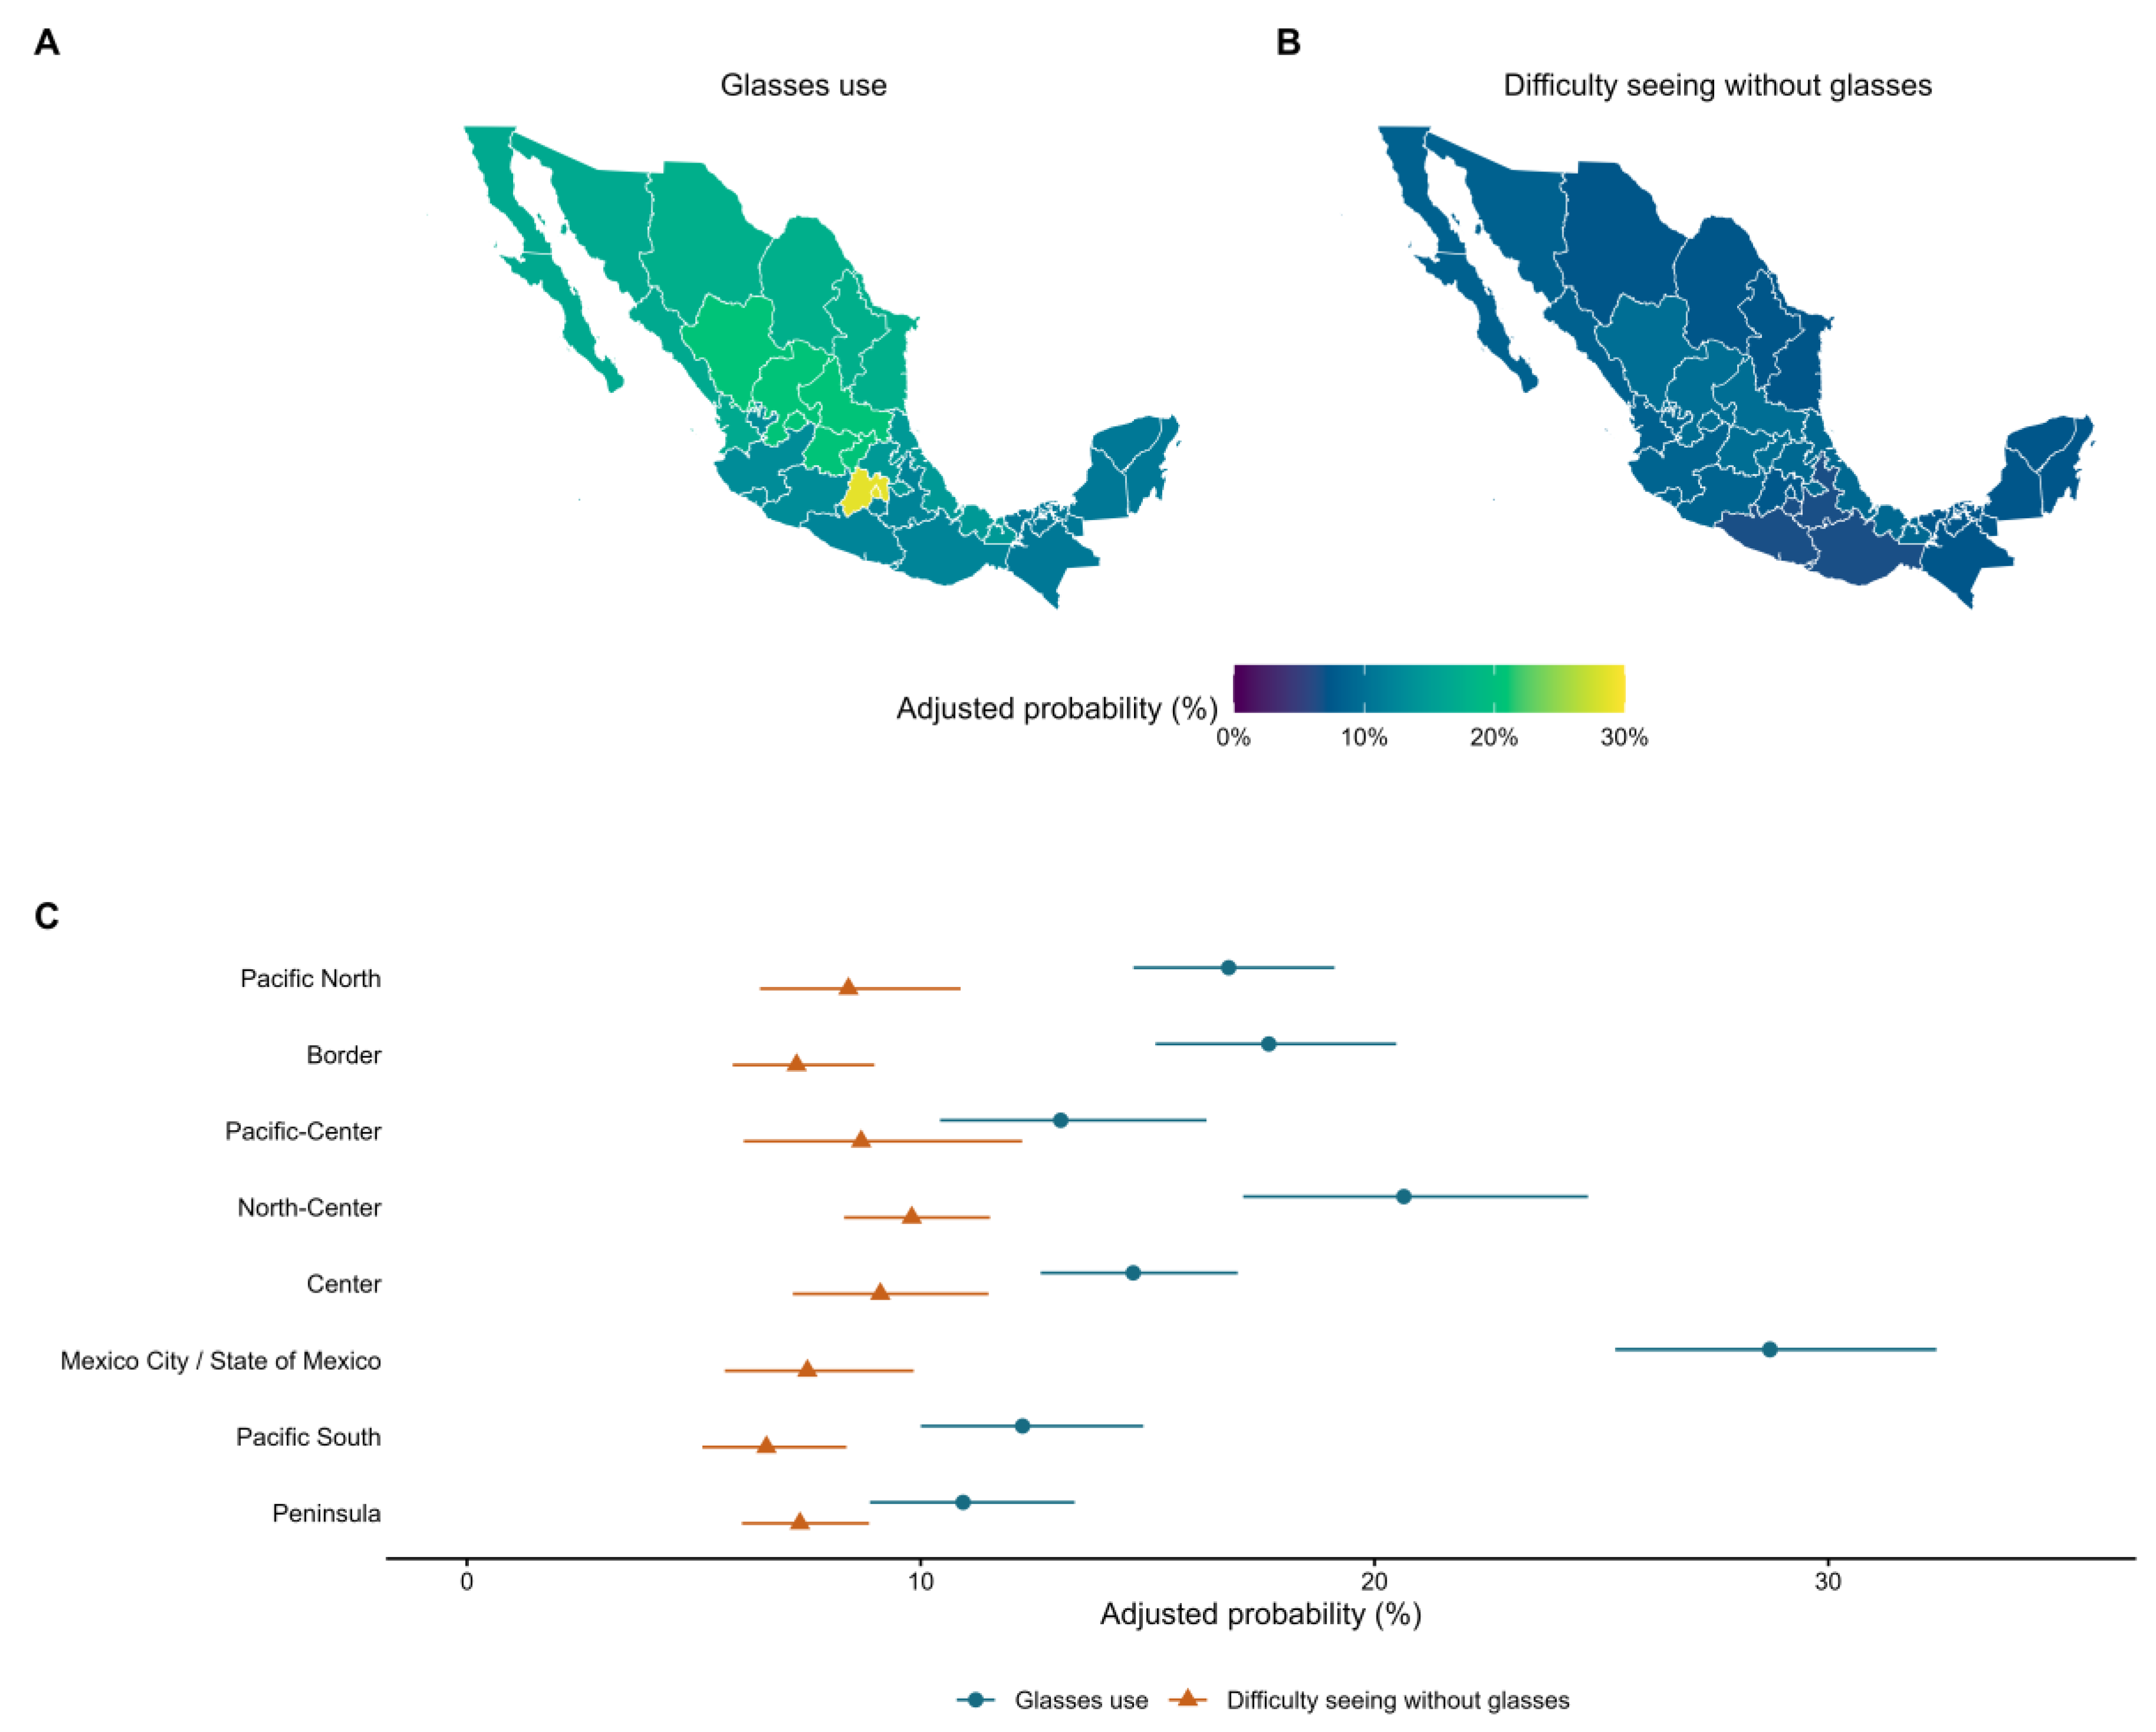

Table 1.
Study population by survey round.
| Year | Child records | Adolescent records | Aged 2–19 years, usable weight | Analysed | States | Age, mean (SD) | Female, n (weighted %) | Rural, n (weighted %) | Indigenous-language household, n (weighted %) |
|---|---|---|---|---|---|---|---|---|---|
| 2018-19 | 21,495 | Not asked | 17,758 | 17,755 | 32 | 5.6 (2.3) | 8,655 (48.6) | 5,764 (28.2) | 2,001 (10.9) |
| 2021 | 5,573 | 4,152 | 8,824 | 8,824 | 32 | 10.4 (5.2) | 4,447 (49.4) | 2,461 (24.5) | 734 (8.5) |
| 2022 | 4,538 | 3,547 | 7,275 | 7,275 | 32 | 10.5 (5.1) | 3,597 (49.6) | 1,971 (24.4) | 706 (10.1) |
| 2023 | 2,490 | 1,924 | 3,971 | 3,971 | 32 | 10.6 (5.1) | 1,968 (49.4) | 1,082 (24.9) | 232 (8.6) |
| 2024 | 4,311 | 3,730 | 7,303 | 7,303 | 31 | 10.5 (5.1) | 3,645 (49.4) | 2,031 (24.0) | 690 (7.8) |
| 2025 | 3,695 | 3,399 | 6,477 | 6,477 | 31 | 10.5 (5.1) | 3,201 (49.4) | 2,029 (24.4) | 906 (11.5) |
Counts are unweighted. Age, sex, residence and household language are described among analyzed participants with annual survey weights; the age SD is descriptive, not a standard error. In 2018–19 the vision items were asked in the child questionnaire only, so that round contributes children aged 2–9 years. Sinaloa is absent from the 2024 and 2025 public files. Abbreviation: SD, standard deviation.
Table 2.
Glasses use and reported difficulty seeing by age group and sex, 2021–2025.
| Age group (years) | Sex | n | Glasses use, % (95% CI) | Any difficulty seeing, % (95% CI) | Difficulty seeing without glasses, % (95% CI) | Difficulty seeing despite glasses, % (95% CI) | A lot of difficulty or cannot see, % (95% CI) |
|---|---|---|---|---|---|---|---|
| 2–4 | All | 6,441 | 1.2 (0.8 to 1.6) | 1.0 (0.7 to 1.4) | 0.9 (0.7 to 1.3) | 0.1 (0.0 to 0.3) | 0.22 (0.10 to 0.47) |
| Male | 3,264 | 1.2 (0.7 to 1.8) | 1.0 (0.7 to 1.5) | 0.9 (0.6 to 1.4) | 0.1 (0.0 to 0.5) | 0.12 (0.03 to 0.53) | |
| Female | 3,177 | 1.1 (0.7 to 1.8) | 1.0 (0.7 to 1.5) | 1.0 (0.6 to 1.5) | 0.0 (0.0 to 0.1) | 0.32 (0.13 to 0.76) | |
| 5–9 | All | 10,660 | 8.7 (7.7 to 9.8) | 5.0 (4.3 to 5.8) | 3.4 (2.8 to 4.1) | 1.7 (1.3 to 2.1) | 0.33 (0.21 to 0.52) |
| Male | 5,428 | 7.9 (6.7 to 9.3) | 5.7 (4.6 to 6.9) | 3.9 (3.0 to 5.0) | 1.8 (1.3 to 2.4) | 0.34 (0.19 to 0.62) | |
| Female | 5,232 | 9.5 (8.0 to 11.2) | 4.4 (3.5 to 5.4) | 2.8 (2.2 to 3.7) | 1.5 (1.1 to 2.2) | 0.33 (0.17 to 0.63) | |
| 10–14 | All | 8,863 | 16.2 (14.7 to 17.9) | 11.6 (10.5 to 12.8) | 8.3 (7.4 to 9.3) | 3.3 (2.7 to 4.1) | 0.54 (0.35 to 0.83) |
| Male | 4,549 | 14.4 (12.4 to 16.6) | 10.3 (8.8 to 12.1) | 7.3 (6.2 to 8.7) | 3.0 (2.1 to 4.2) | 0.35 (0.21 to 0.59) | |
| Female | 4,314 | 18.2 (16.1 to 20.6) | 13.0 (11.4 to 14.7) | 9.3 (8.0 to 10.7) | 3.7 (2.9 to 4.7) | 0.75 (0.42 to 1.34) | |
| 15–19 | All | 7,886 | 27.8 (25.9 to 29.8) | 17.9 (16.5 to 19.4) | 11.3 (10.0 to 12.7) | 6.6 (5.6 to 7.7) | 0.94 (0.67 to 1.31) |
| Male | 3,751 | 20.3 (18.0 to 22.8) | 14.7 (12.7 to 17.1) | 11.1 (9.1 to 13.4) | 3.7 (2.9 to 4.6) | 1.05 (0.67 to 1.65) | |
| Female | 4,135 | 34.9 (31.9 to 37.9) | 20.9 (18.9 to 23.1) | 11.6 (9.8 to 13.6) | 9.3 (7.7 to 11.2) | 0.83 (0.51 to 1.35) | |
| 5–19 | All | 27,409 | 17.5 (16.5 to 18.6) | 11.5 (10.8 to 12.2) | 7.6 (7.0 to 8.3) | 3.8 (3.4 to 4.3) | 0.60 (0.47 to 0.76) |
| Male | 13,728 | 14.1 (13.0 to 15.4) | 10.2 (9.2 to 11.2) | 7.4 (6.6 to 8.3) | 2.8 (2.3 to 3.4) | 0.57 (0.42 to 0.78) | |
| Female | 13,681 | 21.0 (19.5 to 22.6) | 12.8 (11.8 to 13.9) | 7.9 (7.1 to 8.8) | 4.9 (4.2 to 5.7) | 0.64 (0.44 to 0.91) |
Survey-weighted prevalence with pooled 2021–2025 weights; n is unweighted. Any difficulty seeing is some difficulty, a lot of difficulty or cannot see; participants who wear glasses answer about seeing with them. Difficulty seeing without glasses: reports difficulty and does not wear glasses. Difficulty seeing despite glasses: wears glasses and still reports difficulty. Caregivers answered for children younger than 10 years; adolescents answered for themselves. Abbreviation: CI, confidence interval.
Table 3.
Social and geographic differences in eyeglass use and difficulty seeing without glasses, ages 5–19, 2022–2025.
Table 3.
Social and geographic differences in eyeglass use and difficulty seeing without glasses, ages 5–19, 2022–2025.
| Dimension | Category | n | Glasses use | Difficulty without glasses | ||||
|---|---|---|---|---|---|---|---|---|
| Adjusted % (95% CI) | Difference pp (95% CI) | Global Holm p | Adjusted % (95% CI) | Difference pp (95% CI) | Global Holm p | |||
| Household wellbeing | Q5 (highest) | 3,834 | 26.0 (23.6 to 28.6) | Reference | <0.001 | 6.9 (5.2 to 9.2) | Reference | 0.898 |
| Q4 | 3,909 | 21.0 (18.7 to 23.5) | -5.0 (-8.2 to -1.7) | 8.1 (6.7 to 9.7) | 1.2 (-1.3 to 3.6) | |||
| Q3 | 4,157 | 19.4 (17.0 to 21.9) | -6.6 (-10.1 to -3.2) | 9.0 (7.6 to 10.7) | 2.1 (-0.4 to 4.5) | |||
| Q2 | 4,143 | 16.0 (13.6 to 18.7) | -10.0 (-13.4 to -6.6) | 8.7 (7.4 to 10.3) | 1.8 (-0.5 to 4.1) | |||
| Q1 (lowest) | 4,345 | 7.3 (5.9 to 9.2) | -18.7 (-21.6 to -15.7) | 7.4 (6.0 to 8.9) | 0.4 (-2.0 to 2.8) | |||
| Residence | Urban | 14,614 | 21.2 (19.8 to 22.7) | Reference | <0.001 | 8.3 (7.5 to 9.2) | Reference | 0.501 |
| Rural | 5,774 | 7.4 (6.3 to 8.8) | -13.8 (-15.7 to -11.9) | 7.0 (5.8 to 8.4) | -1.3 (-2.9 to 0.2) | |||
| Household language | No Indigenous language spoken | 18,393 | 18.7 (17.5 to 20.0) | Reference | <0.001 | 8.0 (7.3 to 8.8) | Reference | 0.898 |
| Indigenous language spoken | 1,995 | 10.2 (7.7 to 13.4) | -8.5 (-11.6 to -5.4) | 7.8 (5.8 to 10.3) | -0.2 (-2.5 to 2.1) | |||
| Region | Pacific North | 2,852 | 16.8 (14.7 to 19.1) | Reference | <0.001 | 8.4 (6.5 to 10.9) | Reference | 0.501 |
| Border | 2,958 | 17.7 (15.2 to 20.5) | 0.9 (-2.6 to 4.3) | 7.3 (5.9 to 9.0) | -1.1 (-3.8 to 1.5) | |||
| Pacific-Center | 1,580 | 13.1 (10.4 to 16.3) | -3.7 (-7.4 to -0.04) | 8.7 (6.1 to 12.2) | 0.3 (-3.5 to 4.0) | |||
| North-Center | 4,466 | 20.6 (17.1 to 24.7) | 3.9 (-0.5 to 8.2) | 9.8 (8.3 to 11.5) | 1.4 (-1.3 to 4.1) | |||
| Center | 1,834 | 14.7 (12.6 to 17.0) | -2.1 (-5.2 to 1.0) | 9.1 (7.2 to 11.5) | 0.7 (-2.3 to 3.7) | |||
| Mexico City / State of Mexico | 1,188 | 28.7 (25.3 to 32.4) | 11.9 (7.8 to 16.0) | 7.5 (5.7 to 9.8) | -0.9 (-3.9 to 2.1) | |||
| Pacific South | 2,488 | 12.2 (10.0 to 14.9) | -4.5 (-7.8 to -1.3) | 6.6 (5.2 to 8.4) | -1.8 (-4.5 to 0.9) | |||
| Peninsula | 3,022 | 10.9 (8.9 to 13.4) | -5.9 (-9.0 to -2.7) | 7.3 (6.1 to 8.9) | -1.1 (-3.6 to 1.5) | |||
| Sex | Male | 10,273 | 14.8 (13.5 to 16.3) | Reference | <0.001 | 7.6 (6.7 to 8.7) | Reference | 0.898 |
| Female | 10,115 | 21.1 (19.4 to 22.9) | 6.3 (4.2 to 8.4) | 8.4 (7.4 to 9.4) | 0.7 (-0.7 to 2.1) | |||
Standardized probabilities from survey-weighted logistic models adjusted for single year of age, sex and survey round (age and round for the comparison by sex); each dimension was examined in a separate model. Differences are category minus reference, in percentage points, with pointwise 95% confidence intervals. The ten global Wald tests share one Holm family. n is unweighted. Difficulty without glasses: reports difficulty seeing and does not wear glasses. Differences were computed from unrounded estimates. Abbreviations: CI, confidence interval; pp, percentage points.
Disclaimer/Publisher’s Note: The statements, opinions and data contained in all publications are solely those of the individual author(s) and contributor(s) and not of MDPI and/or the editor(s). MDPI and/or the editor(s) disclaim responsibility for any injury to people or property resulting from any ideas, methods, instructions or products referred to in the content. |
© 2026 by the authors. Licensee MDPI, Basel, Switzerland. This article is an open access article distributed under the terms and conditions of the Creative Commons Attribution (CC BY) license (http://creativecommons.org/licenses/by/4.0/).
Copyright: This open access article is published under a Creative Commons CC BY 4.0 license, which permit the free download, distribution, and reuse, provided that the author and preprint are cited in any reuse.