

Submitted:
13 November 2026
Posted:
17 November 2026
You are already at the latest version
Abstract
Background: Governments justify international student recruitment by expected economic2
returns, notably stronger trade links with students’ home countries. Cross-sectional studies3
report sizeable student–trade associations, but whether within-pair changes in student4
stocks precede trade changes is unclear. Methods: Combining 377,413 UNESCO records5
of mobile tertiary students with CEPII BACI goods and OECD–WTO services trade, a6
pre-specified Poisson pseudo-maximum-likelihood gravity model with pair, exporter–year7
and importer–year fixed effects was estimated for 43 OECD and EU hosts and 205 partners8
(2014–2023). Results: The elasticity of host exports with respect to the lagged student9
stock is 0.0109 (pair-clustered SE 0.0081; p= 0.180; 78,753 observations). Pre-specified10
variants give small, mostly insignificant coefficients; stocks measured after the trade year11
predict trade as strongly as lagged stocks, including when all timings share one sample;12
restricting to completely reported pairs or well-covered host-years changes little. Without13
pair fixed effects the coefficient is 17 times larger. Conclusions: No significant association14
could be detected over the period studied, though this does not show that none exists:15
post-graduation networks fall outside this horizon. The cross-sectional association reflects16
persistent pair characteristics. Expected trade gains are a weak basis for programmes such17
as Stipendium Hungaricum, whose overall return this study does not evaluate
Keywords:
international student mobility
; internationalisation of higher education
; bilateral trade
; structural gravity
; PPML
; education networks
; Stipendium Hungaricum
; Central and Eastern Europe
1. Introduction
The internationalisation of higher education is no longer justified only by academic or cultural aims. National strategies increasingly present international students as an economic asset: they pay fees, spend locally, may stay as skilled workers, and—after graduation—may act as “bridges” between their host and home countries [3,19,35]. The bridge argument is particularly attractive to policymakers because it promises benefits beyond the higher-education sector itself. Former students who know the language, institutions and business practices of the host country could lower information and trust frictions in bilateral trade, in the same way that the migration literature has documented for immigrant diasporas [27,29,49]. Soft-power rationales for student recruitment, prominent in policy documents in the United Kingdom and elsewhere, rest on similar reasoning [6,38].
Hungary is a clear example of this policy logic. The Stipendium Hungaricum scholarship programme, launched in 2013, was designed to internationalise Hungarian higher education and to strengthen ties with non-EU partner countries, in line with the government’s “Eastern Opening” and later “Southern Opening” foreign economic policies [5,30,59]. The number of internationally mobile tertiary students in Hungary rose from 20,694 in 2013 to 39,947 in 2022 according to the data used in this paper (an increase of 93%). Whether such expansion produces measurable trade returns is a legitimate question for public evaluation, both in Hungary and in the other Central and Eastern European (CEE) countries that compete for international students.
The empirical evidence is less settled than the policy discourse suggests. Studies of education networks have found that countries hosting more students from a partner country also trade more with it [42,43,63]. Most of this evidence comes from single host countries and relies mainly on cross-sectional variation, which is difficult to separate from time-invariant pair characteristics such as distance, language, colonial history, or long-standing economic and political ties. These characteristics are known to drive both student flows [1,9,48] and trade [28]. Modern structural gravity methods address this problem with directed pair fixed effects and multilateral-resistance controls [4,22,62], but they have rarely been applied to student stocks across many host countries at once.
This paper tests one hypothesis, stated and operationalised before estimation in a written analysis plan:
H1 (trade-network channel, country-pair level). Larger bilateral stocks of internationally mobile tertiary students from origin country j studying in host country i are associated with higher subsequent bilateral trade between i and j (host exports to the origin in particular), conditional on structural-gravity fixed effects (pair, exporter–year, importer–year).
What is new here, relative to the existing student–trade studies, is the combination of identification strategy, scope and research design, and not the question itself. Earlier work on education networks estimates the association for a single host country—the United Kingdom [43], Australia [42] or China [63]—from differences between partner countries, usually with time-invariant gravity controls. Such designs cannot separate a network effect from the persistent ties that make a pair both student-intensive and trade-intensive. This paper makes four specific additions.
First, it moves the test from the cross-section to the within-pair dimension on a multilateral panel: bilateral student stocks from the UNESCO Institute for Statistics (UIS) for 43 OECD and EU host countries and 205 partner countries, linked to product-level goods trade from CEPII BACI and to bilateral services trade from the OECD–WTO BaTIS dataset, estimated with the three-way fixed-effects Poisson pseudo-maximum-likelihood (PPML) specification that is now standard in trade-policy evaluation [18,53,56,62]. To our knowledge this is the first application of this design to student stocks across many host countries simultaneously. Second, the outcome, regressor, lag, sample, fixed effects, robustness checks and decision rule were fixed in a written analysis plan before estimation, so the reported result does not depend on specification search—a safeguard that is rare in this literature and that makes a null result interpretable rather than merely unpublished. Third, the paper does not stop at reporting a small coefficient: it decomposes the familiar positive association into its cross-pair and within-pair components, bounds the effect size that the design could have detected, and tests the timing of the association with placebo leads, which allows the null to be distinguished from a lack of statistical power. Fourth, it separates the trade-network channel from the direct economic channels of internationalisation (Section 2.2) and tests only the former, so that the result is not read as a statement about the overall economic contribution of international students.
The remainder of the paper is organised as follows. Section 2 reviews the literature and develops the hypothesis. Section 3 describes the data. Section 4 presents the estimation strategy and the pre-specified analysis plan. Section 5 reports the results, Section 6 discusses them with particular attention to Hungary and CEE, Section 7 sets out the limitations, and Section 8 concludes.
2. Literature and Hypothesis
2.1. Networks, Information Frictions and Trade
Gravity models explain bilateral trade by economic size and trade costs. A large literature argues that trade costs include informal barriers—incomplete information about foreign markets, contract enforcement problems and lack of trust—that personal networks can reduce. Rauch [49] showed that proximity and common language matter more for differentiated goods than for goods traded on organised exchanges. He interpreted this as evidence that search and matching frictions are important when products are heterogeneous. Ethnic Chinese networks are associated with substantially more trade, especially in differentiated products [50]. Business and social networks also raise trade between French regions [17], and network structure helps explain the dynamics of firms’ entry into export markets [15].
The migration–trade literature applies this reasoning to diasporas. Early studies for the United States and Canada found that immigrant stocks are positively associated with trade with the immigrants’ home countries [27,29]. Later work extended this result to OECD data [24], revisited it with improved specifications [23], and studied it within countries using regional variation [13,47]. Peri [47] found that the effect of immigrants on Spanish exports works almost entirely through the extensive margin, which is consistent with immigrants lowering the fixed costs of exporting. Because migrants choose where to live, these associations may partly reflect reverse causality. Natural experiments based on refugee settlement address this concern. In the United States, states that received more Vietnamese refugees saw faster export growth to Vietnam after the trade embargo was lifted [46]. Using the exogenous allocation of political refugees across US states, Steingress [58] estimates that a 10% increase in recent immigrants raises imports from their country of origin by 1.0% and exports by 0.8%. Related designs show that resident networks shape corporate connections [16], that ancestry shapes foreign direct investment [14], and that migrants promote FDI flows and knowledge diffusion [7,20,31,34]. Network-analytic approaches have also been applied to the migration–trade link [41].
2.2. Direct and Indirect Economic Effects: What This Paper Tests
The economic effects of international students reach the host economy through channels that differ in size, timing and measurability, and it is useful to separate them before interpreting any single estimate.
The direct channel is contemporaneous and monetary. International students pay tuition and living expenses; in the balance of payments these flows are recorded as exports of education-related services. The magnitudes are substantial and well documented. For Hungary, Alpek B. [2] estimate with an input–output model that the consumption expenditure of international students in 2020 generated around 20,000 jobs and more than HUF 67 billion of income in the national economy, of which about HUF 53 billion were wages and salaries. For the United States, Bound [12] document how tuition from students from abroad has become a structural component of university finance, and Bound [11] show that this revenue motive is strong enough to shape recruitment: between 1996 and 2012, a 10% reduction in state appropriations raised foreign undergraduate enrolment at public research universities by about 16%. Regional and destination-level studies find similar expenditure effects at a smaller geographical scale [40]. These effects occur while the students are present, are proportional to their number, and are measured by expenditure surveys and institutional accounts—not by the design used here.
A second, intermediate channel operates through the labour market: graduates who stay in the host country add to its supply of skilled labour, and those who leave may transfer knowledge and institutions to their home countries [21,33,55,57].
The indirect channel—the subject of this paper—is the trade-network or “bridge” effect: former students lower information and trust frictions between the host and their home country, and bilateral trade rises as a result. Unlike the direct channel, it is a stock effect with a long delay: it requires graduates to have left the university and to have reached positions in which they influence trade decisions. The three channels are complementary, and they are not substitutes in policy evaluation. A null result for the trade-network channel therefore says nothing about the direct expenditure and tuition effects, which this design does not measure, and nothing about the labour-market channel. Whenever this paper reports that no association could be detected, the statement concerns the indirect trade channel alone.
2.3. International Students as a Network Channel
International students differ from the migrants studied in this literature. They are younger, usually better educated, and more often temporary, and many return home or move on to third countries after graduation [21,44,45]. These features cut both ways for the trade channel. On the one hand, students acquire language skills, host-country contacts and an attachment to their university and host country, which can later become business ties. Return migration can also transmit knowledge [33] and institutions [57]. On the other hand, student stocks are small compared with migrant stocks, and any network effect is likely to appear only after graduates enter the labour market, which implies a lag of several years.
Direct evidence on students and trade is limited. Murat [43] studies the United Kingdom’s trade with 167 partner countries in 1999–2009 and reports that education networks—current students, former students and alumni associations—are positively associated with both British exports and imports, with stronger effects for partners whose institutions and culture differ from the UK’s, including post-communist economies. Min [42] relate international student flows to Australia to its bilateral market integration with source countries. Zeng [63] examine how Chinese education for foreign students relates to trade. These studies share two features: each concerns a single host country, and identification relies largely on differences between partner countries. A parallel literature on the determinants of student mobility shows that the same variables that drive trade—distance, common language, colonial ties, income and migrant networks—also drive student flows [1,9,10,32,36,51,60]. The network structure of student mobility has become more unequal and centralised over time [54], and destination choices reflect both supply-side and demand-side forces [25,39]. Measures of soft power that may be correlated with student recruitment are also positively associated with exports [52]. A positive cross-sectional association between student stocks and trade is therefore expected even if students have no causal effect on trade.
2.4. Hypothesis and Testable Implications
If students build networks that lower bilateral trade costs, an increase in the stock of students from j in i should be followed by an increase in trade between i and j. This should hold after controlling for everything that is constant within a pair and for all shocks that affect a country’s trade with all partners in a given year. H1 focuses on host exports to the origin because the bridge argument usually refers to exporters in the host country, but the mechanism applies in both directions, so host imports are examined as well. The design has three testable implications. (i) The coefficient on the lagged student stock in a three-way fixed-effects gravity model should be positive. (ii) It should be robust to the choice of lag, to the exclusion of the largest English-speaking destinations, and to the estimator. (iii) Future student stocks should not predict current trade; if they do, the association is more likely to reflect reverse causality (trade attracting students) or common pair-specific shocks than a network effect.
3. Data
3.1. Bilateral Student Stocks
Student data come from the UIS Data API (https://api.uis.unesco.org), which publishes, for each reporting host country, the number of internationally mobile tertiary students (ISCED levels 5–8) by country of origin. The series are UIS indicators 26421–26651 (“Inbound internationally mobile students from [region]: Students from [country], both sexes”). All 217 indicators were retrieved on 11 November 2026 for 2005–2024, which gave 377,413 records. Origin names were matched to ISO 3166 alpha-3 codes, and the “unknown countries” categories were dropped. For OECD and EU members, UIS draws on the joint UNESCO–OECD–Eurostat (UOE) data collection. Internationally mobile students are defined by the country of prior education or, where that is unavailable, by usual residence or citizenship. Values reported as nil were coded as zero. Missing records were treated as missing and never replaced by zeros.
The host set is OECD-38 ∪ EU-27 (43 countries). All 43 have bilateral UIS data for at least some years in 2013–2022 and are present in BACI. Bilateral reporting is not complete for every host-year. Across the 397 host-years in the main sample, the sum of bilateral records covers on average 93.5% (median 98.5%) of the total inbound mobile students reported by UIS for that host-year (indicator 26637); 45 host-years have coverage below 80%. Table A1 in Appendix A lists the hosts, years and coverage ratios. The 34 hosts observed in every year from 2013 to 2022 together hosted 1.92 million internationally mobile students in 2013 and 3.25 million in 2022 (Figure 1a).
3.2. Trade Flows and Gravity Covariates
Goods trade comes from CEPII BACI, HS 2012 nomenclature, version V202601 (https://www.cepii.fr), which reconciles exporter and importer declarations from UN Comtrade [26]. The 6-digit product flows were summed to annual bilateral FOB values in thousand current US dollars for 2012–2024. BACI records only positive flows; host–partner pairs missing from BACI in a given year were coded as zero trade. Services trade comes from the OECD–WTO Balanced Trade in Services dataset (BaTIS; OECD SDMX dataflow DSD_BATIS@DF_BATIS, version 1.0): total services (EBOPS item S), exports, balanced values, in million current US dollars, 2010–2024. BaTIS reconciles reported and estimated bilateral services flows. Its values are therefore partly model-based, which is taken into account when interpreting the services results. Time-invariant gravity covariates (population-weighted distance, contiguity, common official language, colonial relationship) and a time-varying regional trade agreement (RTA) indicator, available up to 2021, come from the CEPII Gravity database, version V202211.
3.3. Estimation Sample
The unit of observation is a directed host–partner pair in trade year t. The main sample includes host i in year t if UIS reports bilateral data for i in year , and partner j if a student record exists for . With trade years 2014–2023 this gives 79,902 observations on 8,568 directed pairs, 43 hosts and 205 partners. In 30.5% of observations the lagged student stock is zero, and 5.3% of observations have zero goods exports. Table 1 reports descriptive statistics. Student stocks are highly skewed: the median pair has 6 students from the partner in the host, while the mean is 421.
4. Methods
4.1. Structural Gravity Specification
Following the structural gravity literature [4,28,62], the main specification (M1) is
where denotes goods exports from host i to partner j in year t and is the stock of internationally mobile students from j enrolled in i in year . The directed pair fixed effect absorbs all time-invariant bilateral determinants of trade (distance, language, colonial history, long-standing political ties, and the long-run component of student flows). The exporter–year and importer–year fixed effects and absorb multilateral resistance terms, output and expenditure, exchange rates and all other country-level shocks [22]. The coefficient is therefore identified only from changes over time in a pair’s student stock relative to the host’s and the partner’s changes with all other countries. This is the within-pair variation relevant for H1.
The model is estimated by PPML. PPML is consistent under heteroskedasticity, keeps zero trade flows, and with three-way fixed effects is the standard gravity estimator [18,37,53,56]. PPML with exporter–year, importer–year and pair fixed effects is consistent for a fixed number of periods, although its cluster-robust standard errors can be biased downward in small panels [61]. Standard errors are clustered by directed pair. The regressor keeps pairs with zero students. For large stocks, is approximately the elasticity of exports with respect to the student stock. Estimation used pyfixest 0.70 (fepois), with singleton fixed-effect groups and pairs with only zero trade removed by the estimator. During the preparation of this study, the authors used a generative AI tool (Claude, Anthropic) to write data-retrieval scripts and statistical analysis code and to draft text; all code, outputs and text were reviewed by the authors (see Acknowledgments).
4.2. Pre-Specified Analysis Plan and Decision Rule
Before any regression was run, a written analysis plan fixed the outcome, regressor, lag, sample, fixed effects, clustering, robustness checks and the decision rule. The plan is included in the replication package. Under the decision rule, H1 is supported if with in M1 and the lead placebo does not show a significant lead coefficient of comparable or larger size. H1 is partially supported if M1 is positive and significant but the placebo or the robustness checks indicate reverse causality or fragility. H1 is not supported if or in M1.
The pre-specified robustness checks are as follows. R1: the student stock measured at t, or instead of . R2: host imports from the partner () as the outcome. R3: exclusion of the United States, the United Kingdom and Australia as hosts. R4a: CEE hosts only (BGR, CZE, EST, HRV, HUN, LTU, LVA, POL, ROU, SVK, SVN). R4b: an interaction of the student stock with a Hungary-host indicator in the full sample; a Hungary-only regression cannot identify importer–year effects. R5: OLS of on for positive flows and positive stocks (intensive margin). R6: M1 augmented with the student stock at as a placebo, for trade years 2014–2021. R7: BaTIS total services exports as the outcome. R8: M1 with the CEPII RTA indicator, for trade years 2014–2021.
Two kinds of analysis were added after the plan was written and are labelled exploratory throughout. First, a gravity model without pair fixed effects but with the standard time-invariant gravity covariates shows how much of the association comes from cross-sectional variation (E1). Second, regressions that include only a lead of the student stock ( or ) complete the timing profile (E2). Section 7.1 lists these and all other deviations from the plan.
5. Results
5.1. Cross-Sectional and Within-Pair Variation
Figure 2 shows the raw pattern behind the regressions. Panel (a) plots log exports against the log student stock after removing exporter–year and importer–year fixed effects only. The association is strong and positive (correlation 0.344). Panel (b) also removes pair fixed effects. Within pairs over time, the residual variation in student stocks is much smaller (standard deviation 0.42 log points, compared with 1.34 across pairs), and the correlation with residual exports is close to zero (0.002).
5.2. Main Specification
Table 2, column (1), reports M1. The PPML coefficient on is 0.0109 with a pair-clustered standard error of 0.0081 (; 95% confidence interval [—0.0050, 0.0268]), based on 78,753 observations and 8,416 pair clusters. Under the pre-specified decision rule, H1 is not supported. The point estimate is positive but small. It implies that a 10% larger student stock is associated with 0.10% higher host exports, and a doubling with 0.76%. The upper bound of the confidence interval rules out elasticities above 0.0268, which corresponds to at most 1.88% more exports for a doubling of the student stock. With a standard error of 0.0081, the design has about 80% power at the 5% level to detect an elasticity of approximately 0.023 (2.8 standard errors). Effects of the size suggested by cross-sectional estimates would therefore have been detected.
5.3. Pre-Specified Robustness Checks
Columns (2)–(5) of Table 2 and Table 3 report the pre-specified variants, and Figure 3 summarises them. All 9 single-coefficient variants (R1–R5, R7, R8) give positive point estimates (9 of 9). Only 2 of the 9 are significant at the 5% level: the contemporaneous stock (t: 0.0228, SE 0.0089, ) and the stock at (0.0184, SE 0.0083, ). The coefficient is 0.0123 (). For host imports (R2), the coefficient is 0.0063 (), so there is no evidence of an import-side channel either.
Excluding the three largest English-speaking destinations hardly changes the estimate (0.0126, , 40 hosts). In the 11 CEE hosts the coefficient is 0.0128 (), similar to the full sample but less precise. The Hungary interaction (R4b) is —0.0276 (SE 0.0229, ). The point estimate for Hungary is thus below the sample average, but the difference is imprecisely estimated and not significant. The OLS intensive-margin estimate (R5) is 0.0102 (), close to the PPML estimate. Services exports (R7) give 0.0137 (). Adding the RTA indicator for 2014–2021 (R8) gives 0.0043 (); the same model without the RTA control on the same sample gives 0.0043, so the lower estimate reflects the shorter period rather than the control.
5.4. Timing: Placebo Leads
The placebo test (R6, Table 3, column 5) is the most informative check for interpretation. In the R6 sample (trade years 2014–2021), the coefficient on the lagged stock is 0.0022 without the lead and 0.0006 () once the student stock at is added, while the lead coefficient is 0.0129 (SE 0.0080, ). The lead is larger than the lag in this sample but not significant at the 5% level. The exploratory lead-only regressions (Table 4, columns 3–4) confirm the pattern: the stock at has a coefficient of 0.0230 (), and the stock at has 0.0172 (). Figure 4 plots the full timing profile. Student stocks measured one or two years after the trade year predict trade at least as well as stocks measured one to three years before it. A network channel in which current students become future business contacts predicts the opposite pattern. The profile is more consistent with trade growth attracting students, or with common pair-specific shocks—such as deepening economic, political or migration relations—that raise both.
5.5. Exploratory Analysis: Why Cross-Sectional Estimates Are Larger
Table 4, column (2), reports the exploratory gravity model without pair fixed effects but with log distance, contiguity, common official language and colonial ties. The student coefficient is 0.1886 (SE 0.0200, ), about 17 times the M1 estimate, and implies 14.0% more exports for a doubling of the student stock. This is the variation used in much of the existing literature, and its size is comparable to typical migrant–trade elasticities. Its sharp drop once pair fixed effects are added shows that the cross-sectional association mainly reflects persistent pair-level factors that are correlated with both student stocks and trade. Standard gravity covariates do not fully capture these factors.
5.6. Sample Composition and Reporting Completeness
The analyses in this subsection were added in response to peer review. They are not part of the pre-specified plan, they do not enter the decision rule, and they leave M1 as the main specification. They address two questions about the data: whether the differences between timings in Table 2 come from the timing or from the sample, and whether incomplete UIS reporting drives the result.
5.6.1. All Timings on One Sample
Each column of Table 2 uses the largest sample available for its own timing, so the samples are not identical (they range from 77,446 to 78,753 observations) and the coefficients are not strictly comparable. Table 5 re-estimates the whole timing profile on identical observations. Column (2) restricts all four pre-specified timings to the 72,644 observations for which the student stock is reported at t, , and (8,038 pair clusters). Column (3) restricts all six timings, leads included, to the 60,457 observations reported from to (trade years 2014–2022).
Two conclusions follow. First, part of the apparent lag pattern is a sample effect. On its own sample the coefficient is 0.0184 (), but on the common support of column (2) it is 0.0121 (SE 0.0086, ), no longer distinguishable from zero; the coefficient falls from 0.0123 to 0.0083. The main specification is almost unchanged (0.0081 against 0.0109). The contemporaneous stock remains the largest and the only significant lag on the common sample (0.0218, ). Second, the timing pattern that motivates the interpretation in Section 6 is not a product of differing samples. On the single sample of column (3), the coefficients on the leads (0.0198 at , ; 0.0167 at , ) are larger than the coefficient on the pre-specified lag (0.0052, ), exactly as in Figure 4. Differences of this size remain small in absolute terms: the largest coefficient estimated on a common sample (0.0218) implies 1.52% higher exports for a doubling of the student stock.
5.6.2. Completeness of UIS Reporting
UIS bilateral reporting is incomplete in two distinct ways: a host may not report its origin breakdown in every year, so a country pair is observed in some years only, and in a given host-year the sum of the bilateral records may fall short of the total inbound stock that the same host reports (mean coverage 93.5%, see Section 3). Because the model is identified from within-pair changes, both forms of incompleteness could in principle attenuate the estimate or select the pairs that identify it. Table 6 reports how the main coefficient moves when the sample is restricted along each dimension.
Of the 8,568 directed pairs in the main sample, 6,915 (80.7%) have a complete record in all ten trade years. Restricting the estimation to these pairs gives 0.0073 (SE 0.0082, , 68,300 observations), and requiring at least eight of ten years gives 0.0086 (); both are slightly below the main estimate and both are statistically indistinguishable from zero. The 826 pairs reported in fewer than eight years cannot be estimated separately, because the three-way fixed-effect model does not converge on so sparse a subsample; the interaction in the full sample provides the comparison instead, and the difference between complete-record and other pairs is —0.0255 (SE 0.0335, ), that is, not significant.
The host-year dimension behaves differently. Restricting the sample to host-years whose bilateral records cover at least 90% of the reported total inbound stock leaves the coefficient at 0.0115 (SE 0.0110, ), and the 80% threshold gives 0.0083 (). Low-coverage host-years—8,132 observations, 10.2% of the sample, in 11 hosts—again do not support a separate three-way fixed-effect model, but in the interaction specification the coefficient for well-covered host-years is 0.0128 (SE 0.0082, ) while the difference for low-coverage host-years is —0.0140 (SE 0.0052, ). Incomplete bilateral reporting thus does attenuate the measured association, as classical measurement error would predict, and this is the one dimension on which the data quality demonstrably matters. The attenuation is nevertheless not what produces the null: in the better-measured part of the data the coefficient is 0.0128 with a 95% confidence interval of [—0.0032, 0.0289], a range that still excludes the elasticities implied by cross-sectional estimates. Removing the poorly reported units moves the estimate by less than one standard error and does not reveal an effect.
6. Discussion
6.1. What the Null Result Does and Does Not Show
Under the pre-specified decision rule, H1 is not supported: within country pairs, a growing stock of international students from a partner country was not followed by a measurable rise in the host’s exports to that country over a horizon of one to three years in 2014–2023. The wording matters. The analysis establishes that no significant association could be detected over the period studied with this design; it does not establish that international students have no effect on trade, and still less that internationalisation has no economic effect. A non-significant coefficient is a statement about what the data can distinguish from zero, not a demonstration of absence.
What the estimates do deliver is an upper bound. With a standard error of 0.0081, the 95% confidence interval of the main specification is [—0.0050, 0.0268]: elasticities above 0.0268 are inconsistent with the data, which corresponds to at most 1.88% more exports for a doubling of the student stock, far below the 14.0% implied by the cross-sectional estimate (Table 4). The interval is equally consistent with a true effect of zero and with a small positive effect of the order of 0.26% per 10% more students. Effects that are economically negligible at this horizon, effects that are concentrated in sectors or periods this aggregate design cannot isolate, and effects that appear only after the observation window all remain possible. Three interpretations of the pattern are consistent with the evidence, and they are not mutually exclusive.
First, the network effect may exist but act over a longer period than the panel can capture; Section 6.2 develops this point, which the design cannot rule out and which is the most likely reason for a true effect to go undetected here. Within the observable horizon, however, the data show no build-up: the coefficient (0.0184, and 0.0121 on the common sample of Table 5) is not larger than the contemporaneous or lead coefficients.
Second, the positive associations in the literature may largely reflect selection and common determinants. Students choose destinations with which their home countries already have close economic, linguistic and historical ties [1,9,60]. Some of these ties are not captured by standard gravity covariates but are absorbed by pair fixed effects. The strong cross-sectional association (Figure 2a; Table 4) and its near disappearance within pairs (Figure 2b) support this explanation.
Third, causality may partly run from trade to students. Trade and investment relations raise awareness of the host country, create demand for host-specific skills, and can fund scholarships and corporate sponsorship. The significant lead coefficients (Figure 4) fit this explanation. They are also consistent with shared pair-specific shocks, for example a bilateral political rapprochement that increases both trade and scholarship places. The present design cannot separate these two explanations.
6.2. The Horizon Problem: Networks Form After Graduation
The most important qualification of these results is one of timing, and it follows from the mechanism itself rather than from the statistics. The bridge argument does not claim that enrolled students trade; it claims that former students do, once they have graduated, returned or moved on, and have reached positions in firms, ministries or agencies where they influence sourcing, sales and investment decisions. The relevant explanatory variable for that mechanism is the accumulated stock of alumni, not the current stock of students, and the two are separated by a long delay.
The arithmetic of that delay is unfavourable to any ten-year panel. A student who enters a bachelor’s programme in the host country in year t graduates around or ; a master’s or doctoral graduate finishes later. Several further years normally pass before a graduate holds a position with discretion over trade relationships; the migration–trade literature that does find network effects studies communities established over decades [14,43,46]. A cohort that arrived in 2014—the first trade year of this panel—would therefore be expected to affect trade from the early 2020s at the very earliest, and a large part of the expansion analysed here, including the growth of Stipendium Hungaricum intakes after 2013, is still too recent for its graduates to have reached that stage. The design identifies the effect of current student stocks on trade within one to three years. If the true channel is an alumni-stock channel with a ten- to twenty-year lag, this design cannot detect it even if it is strong, and the null reported here is uninformative about it.
Two further considerations sharpen the point. The pair fixed effects, which remove the persistent component of each bilateral relationship, also absorb exactly the slow-moving accumulation of alumni that the long-run mechanism predicts: an effect that builds up smoothly over decades is largely indistinguishable from a pair-specific level. And UIS does not publish bilateral alumni stocks; constructing them from enrolment data would require assumptions about completion, duration and return rates that these data cannot verify, which is why no such variable is used here. The appropriate test of the long-run channel is therefore not a longer version of this regression but a different design: graduate tracking data linked to employers, alumni registers matched to firm-level export records, or panels that span the two to three decades over which the mechanism is supposed to operate.
6.3. Policy Relevance for Hungary and Central and Eastern Europe
6.3.1. The Central and Eastern European Subsample
The 11 CEE hosts are of independent interest: they entered the international student market late, expanded fast from a low base, and justify recruitment in explicitly economic terms. The pre-specified subsample estimate (R4a) is 0.0128 with a pair-clustered standard error of 0.0095 (), on 21,982 observations and 2,205 pair clusters, with a 95% confidence interval of [—0.0059, 0.0314].
Three things can be said on this basis, and a fourth cannot. The point estimate is positive, slightly larger than the full-sample estimate (0.0109), and statistically indistinguishable both from zero and from the full-sample coefficient; there is no evidence that the trade return to student recruitment is different in CEE than in older host countries. The interval implies that a doubling of the student stock from a partner country is associated with between —0.41% and 2.20% higher exports to it—an upper bound that is economically small and far below the cross-sectional benchmark of 14.0%. Precision is lower than in the full sample: with 0.0095 as the standard error, the subsample has about 80% power only against elasticities of roughly 0.027 or more, so moderate positive effects cannot be excluded even though large ones can. What cannot be said is anything about an individual CEE country. The subsample pools 11 hosts and the coefficient is a common slope across them; it does not license statements about Poland, Czechia or Hungary separately, and the Hungary-specific interaction discussed below illustrates how wide country-level intervals become.
Two features of these economies suggest caution in interpreting even the sign. CEE exports are dominated by intermediate goods traded inside multinational production networks, where sourcing decisions are made by corporate headquarters rather than through the kind of personal, trust-based contacts the network mechanism describes; and the CEE expansion of international education is recent enough that its graduates are, in the main, still at the beginning of their careers (Section 6.2). Both would attenuate a measured network effect in this period without implying that none will emerge later. Neither is tested here; they are offered as hypotheses for research with longer panels and firm-level data.
6.3.2. Hungary and Stipendium Hungaricum
For Hungary, the number of internationally mobile students nearly doubled between 2013 and 2022 (Figure 1b), a growth that coincided with the expansion of the Stipendium Hungaricum programme and with the Eastern and Southern Opening foreign economic strategies [5,30,59]. It is tempting to read the results of this paper as an evaluation of that programme. They are not, and the limits should be stated precisely.
This is a multi-country study in which Hungary is one of 43 hosts. Hungary enters the design in two ways only: as part of the CEE subsample, and through the pre-specified interaction R4b, which estimates the difference between the Hungarian slope and the common slope as —0.0276 (SE 0.0229, ), with a confidence interval of [—0.0724, 0.0172]. That interval is wide—the interaction has about 80% power only against differences of roughly 0.064 or more—so the negative point estimate should not be interpreted as evidence that Hungary performs worse than other hosts. A single host country with ten years of data cannot support a country-specific conclusion in this design, and no Hungary-only regression is possible here because importer–year effects are not identified from one exporter.
Nor does the design observe the programme itself. Stipendium Hungaricum scholarships are one component of Hungary’s international student intake, and the UIS data used here do not distinguish scholarship holders from fee-paying and exchange students; no programme-level allocation, cost or cohort information enters the estimation. What the paper does provide for the Hungarian debate is the general pattern across 43 OECD and EU hosts: in that broad evidence, growth in student stocks is not followed by measurable growth in bilateral exports within one to three years. Any claim that scholarship places will pay for themselves through trade would need evidence of a kind that this literature, including this paper, has not produced.
6.3.3. Implications for Policy Justification
The appropriate conclusion is narrow. Expected bilateral trade gains are a weak basis on which to justify scholarship and recruitment programmes, at least over a ten-year horizon, because no association of the size assumed in such arguments can be found in the data; and where trade objectives are nevertheless stated, they should be accompanied by an evaluation design capable of detecting them—cohort-level tracking of graduates’ careers and employers, firm-level export data linked to alumni registers, or quasi-experimental variation in scholarship allocation.
This is not a recommendation to reduce such programmes, and it is not an assessment of their economic and social return, which this study does not evaluate. The direct channel alone—tuition, fees and student expenditure—is measurable and substantial: for Hungary, Alpek B. [2] estimate that international students’ consumption generated around 20,000 jobs and more than HUF 67 billion of income in 2020, an effect that is contemporaneous and that falls entirely outside the present design (Section 2.2). Scholarship programmes also pursue goals this paper does not measure: development cooperation, diplomacy and soft power [6,38], the academic and financial sustainability of universities [12,30], the supply of skilled labour in the host country [21,55], and democratic and institutional spillovers in origin countries [57]. A full cost–benefit assessment of Stipendium Hungaricum would have to weigh those returns, together with the programme’s costs and its foreign-policy objectives, against the long-run trade channel examined here—which this evidence neither confirms nor refutes beyond the medium-term horizon it can observe.
6.4. Relation to the Literature
The contrast with earlier education-network studies [42,43,63] is largely explained by identification. Those studies examine single hosts and rely mostly on differences between partner countries, where this paper also finds a strong positive association. The within-pair, multi-host design used here follows the approach that the trade-policy literature adopted to estimate the effects of trade agreements [8,37,62]. It is more demanding and, for these data, gives estimates close to zero. A similar shift has taken place in the migration–trade literature, where causal designs usually find smaller effects than early cross-sectional work [46,58]. Migrant stocks, however, are larger, more permanent and more often involved in business than student stocks. Any network effect of students is therefore likely to be smaller than that of migrants and harder to detect.
7. Limitations
Several limitations qualify the findings. (1) Horizon. This is the binding limitation, set out in full in Section 6.2. The panel covers trade years 2014–2023 with student stocks from 2011–2023, so network effects that need more than about three years to appear, or that act through the cumulated stock of alumni rather than the current stock of students, are not identified; slow accumulation of alumni is moreover partly absorbed by the pair fixed effects. UIS does not publish bilateral alumni stocks, and building them from enrolment stocks would require assumptions about duration of study and return rates that the data cannot verify. Accordingly, the result should be read as a null for the medium-run current-student channel, not for the long-run alumni channel. (2) Measurement. UIS bilateral records do not fully cover every host-year (mean coverage 93.5%). The definition of mobility (prior education, residence or citizenship) differs across hosts, and some values are national or UIS estimates. Within-host changes in definition are absorbed by exporter–year effects only if they affect all partners proportionally. Section 5.6 quantifies this: restricting the sample to completely reported pairs or to well-covered host-years leaves the estimate small and insignificant, although the association is measurably weaker in poorly covered host-years (difference —0.0140, ), which is consistent with attenuation by measurement error. (3) Aggregation. Total goods trade may hide effects in differentiated goods or in specific services, such as education-related travel, where network effects are expected to be strongest [47,49]. The services extension uses balanced BaTIS values, which are partly model-based. (4) Inference. Three-way PPML cluster-robust standard errors can be biased downward in short panels [61]. Such a bias would strengthen rather than weaken the null finding for M1, but it would overstate the significance of the lead coefficients. (5) Causality. The design removes time-invariant pair heterogeneity and country-year shocks but does not use exogenous variation in student stocks. The lead pattern shows that time-varying pair-specific factors remain, so neither a positive nor a zero coefficient can be read as a causal effect. (6) External validity. The hosts are high- and upper-middle-income OECD and EU countries. Results may differ for major non-OECD destinations, such as China, Russia or the Gulf states, which are not included in the host set.
7.1. Deviations from the Analysis Plan
All pre-specified models were estimated as planned. The following additions were made after the plan was written and are labelled exploratory: (a) the gravity model without pair fixed effects (E1); (b) the lead-only regressions (E2); (c) the same-sample comparisons for R6 and R8 (M1 estimated on the R6 and R8 samples), reported in the text; and (d) the residualised binned scatter plots (Figure 2).
A further set of analyses was added at the revision stage in response to peer review and is reported in Section 5.6: (e) the timing profile re-estimated on identical samples (Table 5); and (f) the reporting-completeness sensitivity analysis (Table 6). These were specified after the results of the pre-specified models were known, and they are reported as robustness evidence rather than as tests of H1.
None of these additions changes the decision on H1, which is based solely on M1, and no observation was dropped from, and no specification changed in, the main model. The plan also referred to dataset versions and sample definitions; all were implemented as stated.
8. Conclusions
This paper tested whether larger bilateral stocks of international students are followed by more trade between host and origin countries, using a pre-specified three-way fixed-effects PPML gravity design for 43 OECD and EU hosts in 2014–2023. The main estimate is small and statistically insignificant (0.0109, SE 0.0081), so H1 is not supported under the pre-specified decision rule. Most pre-specified variants give the same result; student stocks measured after the trade year predict trade as strongly as stocks measured before it, including when every timing is estimated on one identical sample; and restricting the data to completely reported country pairs or to well-covered host-years does not change the picture. Across country pairs, student stocks and trade are strongly correlated, but that correlation reflects persistent pair characteristics rather than within-pair dynamics.
The finding should be stated as what it is: over the decade examined, and with a design that identifies medium-run within-pair changes, no significant association between student stocks and subsequent bilateral trade could be detected, and elasticities above 0.0268 can be ruled out. This is not evidence that international students have no economic effect. The direct effects—tuition, fees and local expenditure—are substantial and are not measured here, and the network mechanism itself predicts that business ties form after graduation, on a horizon this panel cannot observe.
For policy, the results imply that expected short- to medium-term bilateral trade gains are a weak basis for justifying international student recruitment, including programmes such as Stipendium Hungaricum, whose overall economic and social return this study does not evaluate; the case for such programmes rests on educational, scientific, diplomatic, fiscal and labour-market grounds that require their own evaluation. Future research should study the long-run role of alumni with micro-data linking graduates to firms, and use exogenous variation in scholarship allocation.
Supplementary Materials
The following supporting information can be downloaded at the website of this paper posted on Preprints.org.
Author Contributions
All authors contributed equally to this work. All authors have read and agreed to the published version of the manuscript.
Funding
This research received no external funding.
Institutional Review Board Statement
Not applicable. The study uses only publicly available aggregate country-level statistics.
Informed Consent Statement
Not applicable.
Data Availability Statement
All data are publicly available. Bilateral student stocks: UNESCO Institute for Statistics Data API, indicators 26421–26651 and 26637 (https://api.uis.unesco.org/api/public), accessed 11 November 2026. Goods trade: CEPII BACI HS12 V202601 (https://www.cepii.fr/DATA_DOWNLOAD/baci/data/BACI_HS12_V202601.zip). Gravity covariates: CEPII Gravity V202211 (https://www.cepii.fr/DATA_DOWNLOAD/gravity/data/Gravity_csv_V202211.zip). Services trade: OECD–WTO BaTIS, OECD SDMX dataflow OECD.SDD.TPS DSD_BATIS@DF_BATIS 1.0 (https://sdmx.oecd.org/public/rest/data/OECD.SDD.TPS,DSD_BATIS@DF_BATIS,1.0/). The complete replication package is provided as Supplementary Material with this submission and will be deposited in a public repository at before publication. It contains: the pre-specified analysis plan (analysis_plan.md); twelve numbered scripts (00–11) that reproduce every step from download to the final numbers, tables and figures; the processed panel and all intermediate datasets (processed/); the raw UIS and BaTIS responses (raw/); the machine-generated macro files numbers.tex and numbers_review.tex, from which every number quoted in this manuscript is taken; the LaTeX tables and figures; run logs and the software environment; and the DOI verification log for all references (refs/doi_verification_log.json). The two CEPII archives (BACI, 1.27 GB; Gravity, 0.21 GB) are not redistributed because of their size; code/00_download.py retrieves them and logs/cepii_sha256.txt records the SHA-256 checksums of the files used. No data were simulated or imputed.
Acknowledgments
During the preparation of this manuscript, the authors used Claude (Anthropic) for the purposes of data retrieval scripting, statistical analysis code, and drafting of text. The authors have reviewed and edited the output and take full responsibility for the content of this publication.
Conflicts of Interest
The authors declare no conflicts of interest.
Abbreviations
The following abbreviations are used in this manuscript:
| BACI | Base pour l’Analyse du Commerce International (CEPII) |
| BaTIS | OECD–WTO Balanced Trade in Services dataset |
| CEE | Central and Eastern Europe |
| CEPII | Centre d’Études Prospectives et d’Informations Internationales |
| FE | Fixed effects |
| ISCED | International Standard Classification of Education |
| PPML | Poisson pseudo-maximum likelihood |
| RTA | Regional trade agreement |
| UIS | UNESCO Institute for Statistics |
| UOE | UNESCO–OECD–Eurostat joint data collection |
Appendix A. Host Countries and UIS Coverage

Table A1.
Host countries in the main sample: trade years covered, mean annual stock of mobile students (sum over origins, ) and mean UIS coverage ratio (sum of bilateral records / reported total inbound).
Table A1.
Host countries in the main sample: trade years covered, mean annual stock of mobile students (sum over origins, ) and mean UIS coverage ratio (sum of bilateral records / reported total inbound).
| Host | Years | Students | Coverage | Host | Years | Students | Coverage |
|---|---|---|---|---|---|---|---|
| AUS | 2014–2023 | 357,644 | 0.97 | ISL | 2014–2023 | 1,515 | 1.00 |
| AUT | 2014–2023 | 71,901 | 0.97 | ISR | 2014–2015 | 7,744 | 0.75 |
| BEL | 2014–2023 | 40,039 | 0.75 | ITA | 2014–2023 | 81,050 | 0.97 |
| BGR | 2014–2023 | 14,656 | 1.00 | JPN | 2014–2023 | 91,550 | 0.55 |
| CAN | 2014–2023 | 228,287 | 0.96 | KOR | 2014–2023 | 82,254 | 0.99 |
| CHE | 2014–2023 | 51,128 | 0.95 | LTU | 2014–2023 | 5,484 | 0.88 |
| CHL | 2014–2023 | 7,778 | 0.93 | LUX | 2014–2023 | 3,360 | 1.00 |
| COL | 2015–2023 | 4,604 | 0.98 | LVA | 2014–2023 | 7,167 | 1.00 |
| CRI | 2018–2019 | 2,723 | 1.00 | MEX | 2018–2022 | 14,990 | 0.45 |
| CYP | 2014–2023 | 9,544 | 1.00 | MLT | 2014–2023 | 1,796 | 1.00 |
| CZE | 2014–2023 | 45,113 | 1.00 | NLD | 2014–2020 | 68,463 | 0.77 |
| DEU | 2014–2023 | 256,439 | 0.87 | NOR | 2014–2023 | 10,645 | 0.95 |
| DNK | 2014–2023 | 31,800 | 1.00 | NZL | 2014–2023 | 44,595 | 0.97 |
| ESP | 2014–2023 | 71,363 | 1.00 | POL | 2014–2023 | 54,380 | 0.97 |
| EST | 2014–2023 | 3,938 | 0.99 | PRT | 2014–2023 | 29,284 | 1.00 |
| FIN | 2014–2023 | 19,677 | 0.83 | ROU | 2014–2023 | 28,170 | 1.00 |
| FRA | 2014–2023 | 232,653 | 0.95 | SVK | 2014–2023 | 12,372 | 1.00 |
| GBR | 2014–2023 | 487,185 | 0.99 | SVN | 2014–2023 | 4,215 | 0.98 |
| GRC | 2017–2023 | 21,380 | 0.85 | SWE | 2014–2023 | 23,042 | 0.78 |
| HRV | 2014–2023 | 3,240 | 0.96 | TUR | 2014–2023 | 125,568 | 0.94 |
| HUN | 2014–2023 | 30,311 | 1.00 | USA | 2014–2022 | 889,054 | 0.98 |
| IRL | 2014–2023 | 19,603 | 0.97 |
References
- Abbott, A.; Silles, M. Determinants of International Student Migration. In The World Economy; 2016; pp. 395621–635. [Google Scholar] [CrossRef]
- Alpek, B.L.; Császár, M.Z.; Tóth, Á.D.; Czimre, K. Impacts of the international students’ consumption expenditures on the national economy in Hungary, 2020. Reg. Stat. 2022, 124176–199. [Google Scholar] [CrossRef]
- Altbach, P. G.; Knight, J. The Internationalization of Higher Education: Motivations and Realities. J. Stud. Int. Educ. 2007, 113–4290–305. [Google Scholar] [CrossRef]
- Anderson, J. E.; van Wincoop, E. Gravity with Gravitas: A Solution to the Border Puzzle. In American Economic Review; 2003; pp. 931170–192. [Google Scholar] [CrossRef]
- Árendás, Z. Student Mobilities to an `Offbeat’ or `Onbeat’ Destination? The Stipendium Hungaricum Scholarship Programme in Illiberal Hungary. Eur. J. Education611e70392 2026. [Google Scholar] [CrossRef]
- Atkinson, C. Does Soft Power Matter? A Comparative Analysis of Student Exchange Programs 1980–2006. In Foreign Policy Analysis; 2010; pp. 611–22. [Google Scholar] [CrossRef]
- Bahar, D.; Rapoport, H. Migration, Knowledge Diffusion and the Comparative Advantage of Nations. Econ. J. 2018, 128612F273–F305. [Google Scholar] [CrossRef]
- Baier, S. L.; Bergstrand, J. H. Do free trade agreements actually increase members’ international trade? J. Int. Econ. 2007, 71172–95. [Google Scholar] [CrossRef]
- Beine, M.; Noël, R.; Ragot, L. Determinants of the international mobility of students. Econ. Educ. Rev. 2014, 4140–54. [Google Scholar] [CrossRef]
- Bessey, D. International student migration to Germany. In Empirical Economics; 2012; pp. 421345–361. [Google Scholar] [CrossRef]
- Bound, J.; Braga, B.; Khanna, G.; Turner, S. A Passage to America: University Funding and International Students. Am. Econ. J. Econ. Policy 2020, 12197–126. [Google Scholar] [CrossRef]
- Bound, J.; Braga, B.; Khanna, G.; Turner, S. The Globalization of Postsecondary Education: The Role of International Students in the US Higher Education System. J. Econ. Perspect. 2021, 351163–184. [Google Scholar] [CrossRef]
- Bratti, M.; De Benedictis, L.; Santoni, G. On the pro-trade effects of immigrants. In Review of World Economics; 2014; pp. 1503557–594. [Google Scholar] [CrossRef]
- Burchardi, K. B.; Chaney, T.; Hassan, T. A. Migrants, Ancestors, and Foreign Investments. Rev. Econ. Stud. 2019, 8641448–1486. [Google Scholar] [CrossRef]
- Chaney, T. The Network Structure of International Trade. Am. Econ. Rev. 2014, 104113600–3634. [Google Scholar] [CrossRef]
- Cohen, L.; Gurun, U. G.; Malloy, C. Resident Networks and Corporate Connections: Evidence from World War II Internment Camps. J. Financ. 2017, 721207–248. [Google Scholar] [CrossRef]
- Combes, P.-P.; Lafourcade, M.; Mayer, T. The trade-creating effects of business and social networks: evidence from France. J. Int. Econ. 2005, 6611–29. [Google Scholar] [CrossRef]
- Correia, S.; Guimarães, P.; Zylkin, T. Fast Poisson estimation with high-dimensional fixed effects. Stata J. Promot. Commun. Stat. Stata 2020, 20195–115. [Google Scholar] [CrossRef]
- de Wit, H.; Altbach, P. G. Internationalization in higher education: global trends and recommendations for its future. In Policy Reviews in Higher Education; 2021; pp. 5128–46. [Google Scholar] [CrossRef]
- Docquier, F.; Lodigiani, E. Skilled Migration and Business Networks. In Open Economies Review; 2010; pp. 214565–588. [Google Scholar] [CrossRef]
- Dreher, A.; Poutvaara, P. Foreign Students and Migration to the United States. In World Development3981294–1307; 2011. [Google Scholar] [CrossRef]
- Fally, T. Structural gravity and fixed effects. J. Int. Econ. 2015, 97176–85. [Google Scholar] [CrossRef]
- Felbermayr, G. J.; Jung, B.; Toubal, F. Ethnic Networks, Information, and International Trade: Revisiting the Evidence. Ann. Econ. Stat. 2010, 97/9841. [Google Scholar] [CrossRef]
- Felbermayr, G. J.; Toubal, F. Revisiting the Trade-Migration Nexus: Evidence from New OECD Data. World Dev. 2012, 405928–937. [Google Scholar] [CrossRef]
- Findlay, A. M. An Assessment of Supply and Demand-side Theorizations of International Student Mobility. Int. Migr. 2011, 492162–190. [Google Scholar] [CrossRef]
- Gaulier, G.; Zignago, S. BACI: International Trade Database at the Product-Level (the 1994-2007 Version). SSRN Electron. J. 2010. [Google Scholar] [CrossRef]
- Gould, D. M. Immigrant Links to the Home Country: Empirical Implications for U.S. Bilateral Trade Flows. Rev. Econ. Statistics762302 1994. [Google Scholar] [CrossRef]
- Head, K.; Mayer, T. Gravity Equations: Workhorse,Toolkit, and Cookbook. In Handbook of International Economics Handbook of international economics; Elsevier, 2014; pp. 131–195. [Google Scholar] [CrossRef]
- Head, K.; Ries, J. Immigration and Trade Creation: Econometric Evidence from Canada. Can. J. Econ. 1998, 31147. [Google Scholar] [CrossRef]
- Janik, H.; Naárné Tóth, Z. A Stipendium Hungaricum program szerepe a magyar agrár-felsooktatás nemzetköziesítésében. Külügyi Szle. 2021, 204184–202. [Google Scholar] [CrossRef]
- Javorcik, B. S.; Özden, Ç.; Spatareanu, M.; Neagu, C. Migrant networks and foreign direct investment. J. Dev. Econ. 2011, 942231–241. [Google Scholar] [CrossRef]
- Kahanec, M.; Králiková, R. Pulls of International Student Mobility. SSRN Electron. J. 2011. [Google Scholar] [CrossRef]
- Kahn, S.; MacGarvie, M. Do return requirements increase international knowledge diffusion? Evidence from the Fulbright program. Res. Policy 2016, 4561304–1322. [Google Scholar] [CrossRef]
- Kerr, W. R. Ethnic Scientific Communities and International Technology Diffusion. Rev. Econ. Stat. 2008, 903518–537. [Google Scholar] [CrossRef]
- Knight, J. Internationalization Remodeled: Definition, Approaches, and Rationales. J. Stud. Int. Educ. 2004, 815–31. [Google Scholar] [CrossRef]
- Kondakci, Y. Student mobility reviewed: attraction and satisfaction of international students in Turkey. In Higher Education; 2011; pp. 625573–592. [Google Scholar] [CrossRef]
- Larch, M.; Wanner, J.; Yotov, Y. V.; Zylkin, T. Currency Unions and Trade: A PPML Re-assessment with High-dimensional Fixed Effects. Oxf. Bull. Econ. Stat. 2019, 813487–510. [Google Scholar] [CrossRef]
- Lomer, S. Soft power as a policy rationale for international education in the UK: a critical analysis. In Higher Education; 2017; pp. 744581–598. [Google Scholar] [CrossRef]
- Marginson, S. Dynamics of National and Global Competition in Higher Education. In Higher Education; 2006; pp. 5211–39. [Google Scholar] [CrossRef]
- Mendoza-Jiménez, J.; García-Rodriguez, F. J.; García-González, C. G. International Student Mobility and Its Impact on Destination Countries. In Fudan Journal of the Humanities and Social Sciences; 2026; pp. 192277–302. [Google Scholar] [CrossRef]
- Metulini, R.; Sgrignoli, P.; Schiavo, S.; Riccaboni, M. The network of migrants and international trade. In Economia Politica; 2018; pp. 353763–787. [Google Scholar] [CrossRef]
- Min, B. S.; Falvey, R. International student flows for university education and the bilateral market integration of Australia. In Higher Education; 2018; pp. 755871–889. [Google Scholar] [CrossRef]
- Murat, M. Out of Sight, Not Out of Mind. Educ. Netw. Int. Trade. World Dev. 2014, 5853–66. [Google Scholar] [CrossRef]
- Oosterbeek, H.; Webbink, D. Does Studying Abroad Induce a Brain Drain? Economica78310347–366 2011. [Google Scholar] [CrossRef]
- Parey, M.; Waldinger, F. Studying Abroad and the Effect on International Labour Market Mobility: Evidence from the Introduction of ERASMUS. Econ. J. 2011, 121551194–222. [Google Scholar] [CrossRef]
- Parsons, C.; Vézina, P.-L. Migrant Networks and Trade: The Vietnamese Boat People as a Natural Experiment. Econ. J. 2018, 128612F210–F234. [Google Scholar] [CrossRef]
- Peri, G.; Requena-Silvente, F. The trade creation effect of immigrants: evidence from the remarkable case of Spain. Can. J. Econ. Can. D’économique 2010, 4341433–1459. [Google Scholar] [CrossRef]
- Perkins, R.; Neumayer, E. Geographies of educational mobilities: exploring the uneven flows of international students. Geogr. J. 2014, 1803246–259. [Google Scholar] [CrossRef]
- Rauch, J. E. Networks versus markets in international trade. J. Int. Econ. 1999, 4817–35. [Google Scholar] [CrossRef]
- Rauch, J. E.; Trindade, V. Ethnic Chinese Networks in International Trade. In Review of Economics and Statistics; 2002; pp. 841116–130. [Google Scholar] [CrossRef]
- Rodríguez González, C.; Bustillo Mesanza, R.; Mariel, P. The determinants of international student mobility flows: an empirical study on the Erasmus programme. In Higher Education; 2011; pp. 624413–430. [Google Scholar] [CrossRef]
- Rose, A. K. Like Me, Buy Me: The Effect of Soft Power on Exports. Econ. Politics 2016, 282216–232. [Google Scholar] [CrossRef]
- Santos Silva, J.; Tenreyro, S. Further simulation evidence on the performance of the Poisson pseudo-maximum likelihood estimator. Econ. Lett. 2011, 1122220–222. [Google Scholar] [CrossRef]
- Shields, R. Globalization and International Student Mobility: A Network Analysis. Comp. Educ. 2013, Review, 574609–636. [Google Scholar] [CrossRef]
- Shih, K. Do international students crowd-out or cross-subsidize Americans in higher education? J. Public Econ. 2017, 156170–184. [Google Scholar] [CrossRef]
- Silva, J. M. C. S.; Tenreyro, S. The Log of Gravity. In The Review of Economics and Statistics; 2006; pp. 884641–658. [Google Scholar] [CrossRef]
- Spilimbergo, A. Democracy and Foreign Education. Am. Econ. Rev. 2009, 991528–543. [Google Scholar] [CrossRef]
- Steingress, W. The causal impact of migration on US trade: Evidence from political refugees. Can. J. Econ. Can. D’économique 2018, 5141312–1338. [Google Scholar] [CrossRef]
- Tong, L. Higher education internationalization and diplomacy: Successes mixed with challenges. A case study of Hungary’s Stipendium Hungaricum scholarship program. Hung. Educ. Res. J. 2021, 104382–400. [Google Scholar] [CrossRef]
- Wei, H. An empirical study on the determinants of international student mobility: a global perspective. In Higher Education; 2013; pp. 661105–122. [Google Scholar] [CrossRef]
- Weidner, M.; Zylkin, T. Bias and consistency in three-way gravity models. J. Int. Econ. 2021, 132103513. [Google Scholar] [CrossRef]
- Yotov, Y. V.; Piermartini, R.; Monteiro, J.-A.; Larch, M. An Advanced Guide to Trade Policy Analysis: The Structural Gravity Model An advanced guide to trade policy analysis: The structural gravity model. WTO 2016. [Google Scholar] [CrossRef]
- Zeng, C.; Guo, J.; Zheng, Y. The impact of international student education on facilitating global trade: A case study of chinese education for foreign students in China. Int. J. Educ. Dev. 2026, 120103460. [Google Scholar] [CrossRef]
Figure 1.
Internationally mobile tertiary students, 2013–2022. (a) Total stock in the 34 host countries with bilateral UIS data in every year 2013–2022 (excluded because of gaps: COL, CRI, ESP, GRC, ISL, ISR, MEX, NLD, USA). (b) Total stock in Hungary (sum of bilateral UIS records). (c) The eight largest origin countries of mobile students in Hungary in 2022, compared with 2013. Source: UIS Data API, authors’ calculations.
Figure 1.
Internationally mobile tertiary students, 2013–2022. (a) Total stock in the 34 host countries with bilateral UIS data in every year 2013–2022 (excluded because of gaps: COL, CRI, ESP, GRC, ISL, ISR, MEX, NLD, USA). (b) Total stock in Hungary (sum of bilateral UIS records). (c) The eight largest origin countries of mobile students in Hungary in 2022, compared with 2013. Source: UIS Data API, authors’ calculations.
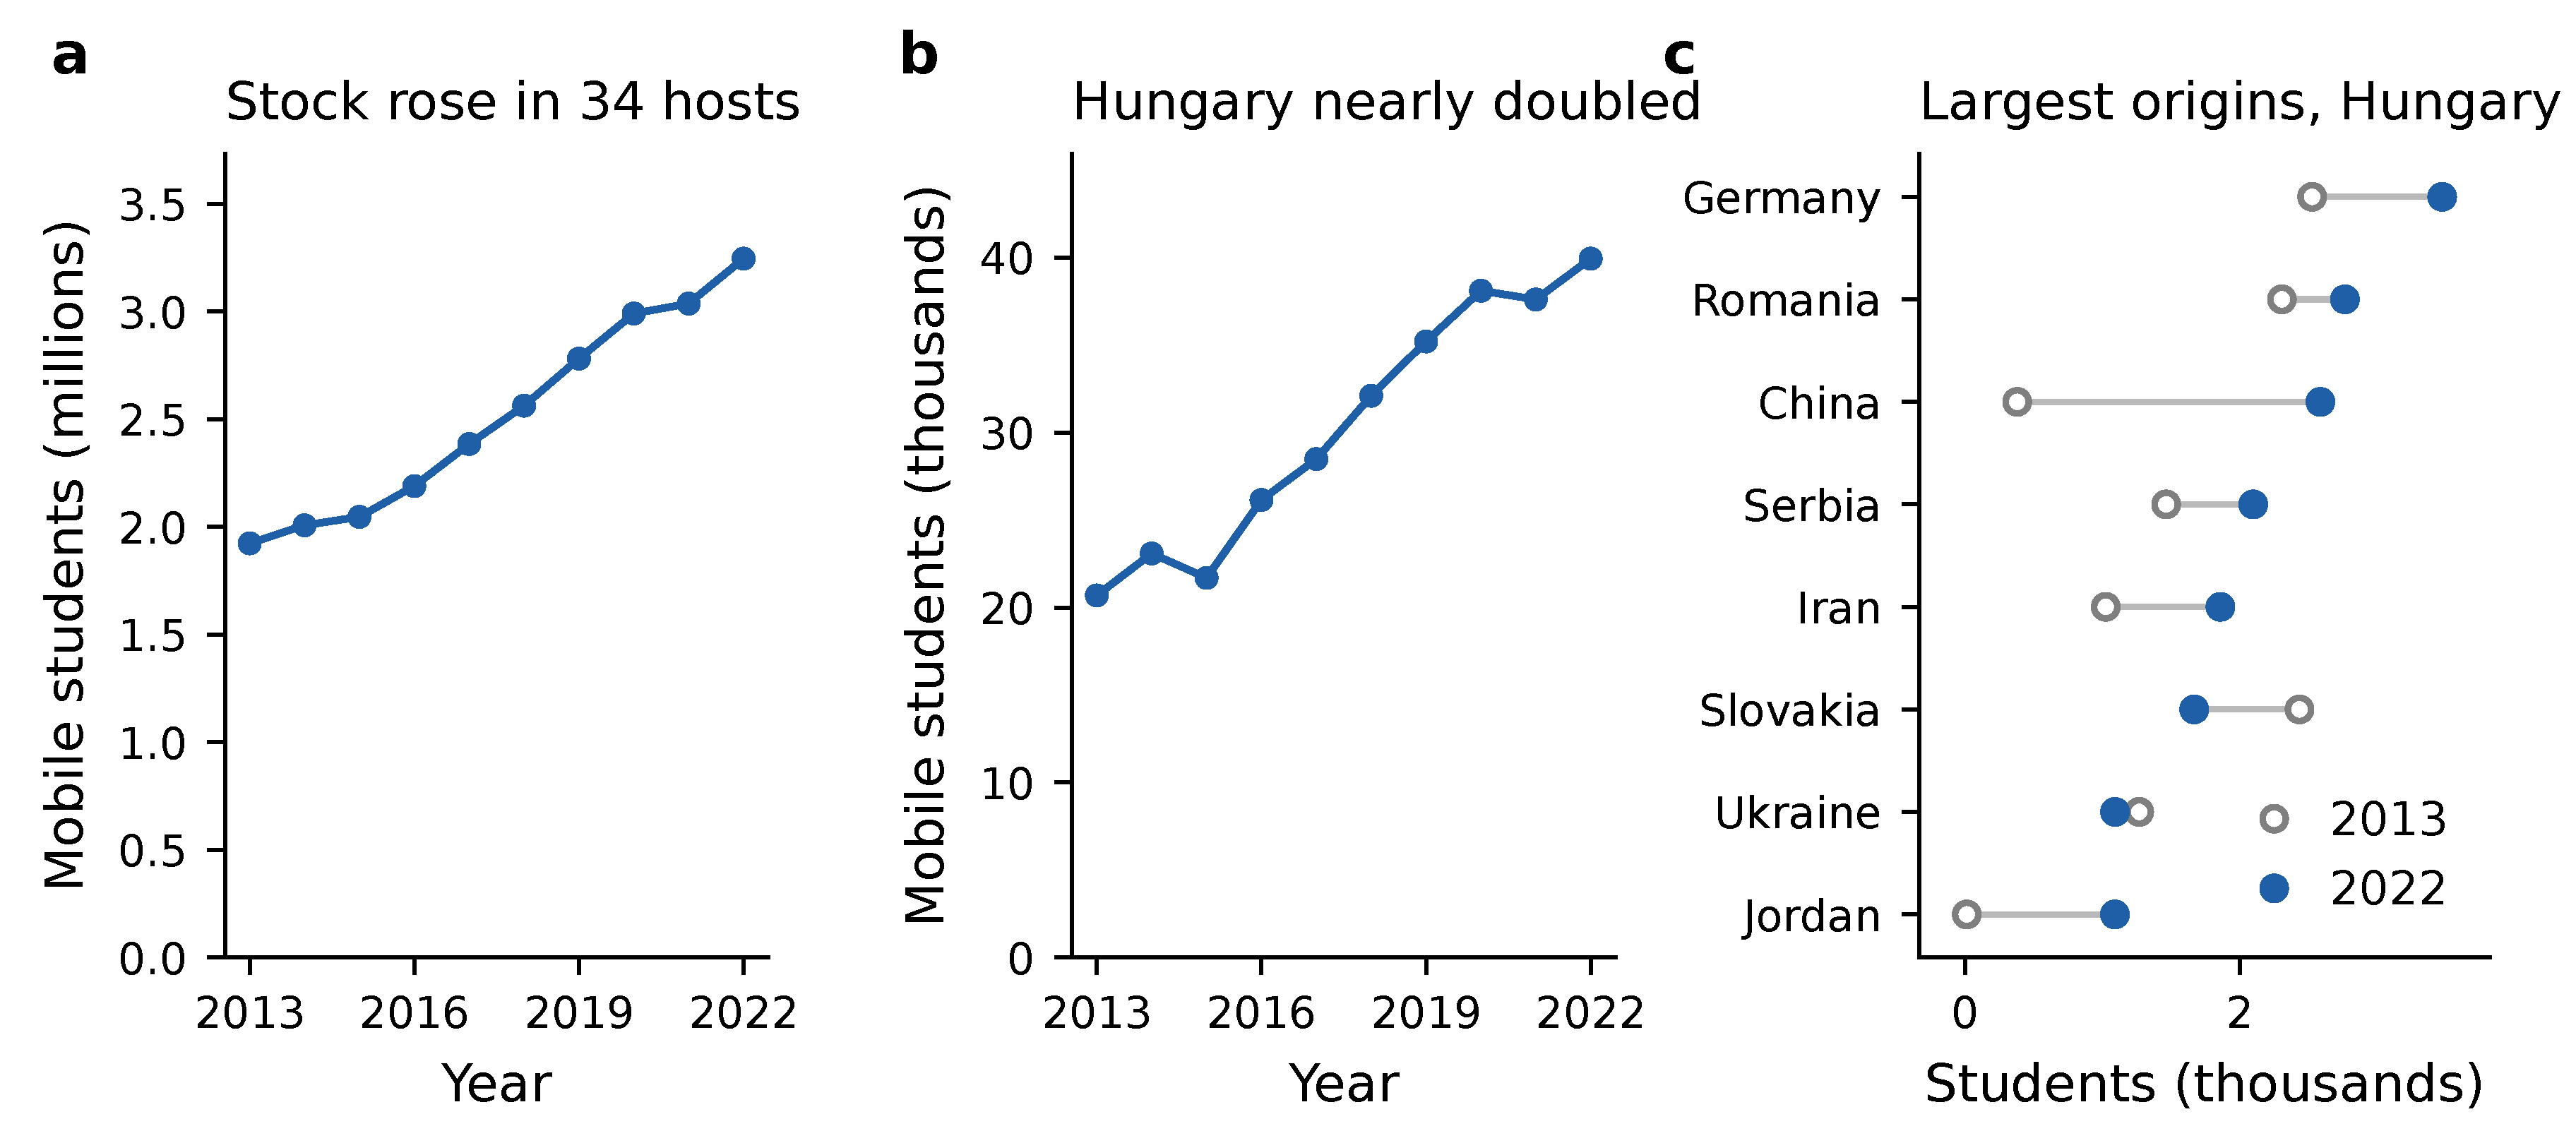
Figure 2.
Student stocks and host exports: variation across pairs versus within pairs. Binned scatter plots (20 quantile bins) of residualised ln exports against residualised ln(1+students at ) for observations with positive exports in the main sample (trade years 2014–2023). (a) Residuals after exporter–year and importer–year fixed effects. (b) Residuals after pair, exporter–year and importer–year fixed effects. Grey lines are OLS fits through all observations. Note the different vertical scales.
Figure 2.
Student stocks and host exports: variation across pairs versus within pairs. Binned scatter plots (20 quantile bins) of residualised ln exports against residualised ln(1+students at ) for observations with positive exports in the main sample (trade years 2014–2023). (a) Residuals after exporter–year and importer–year fixed effects. (b) Residuals after pair, exporter–year and importer–year fixed effects. Grey lines are OLS fits through all observations. Note the different vertical scales.
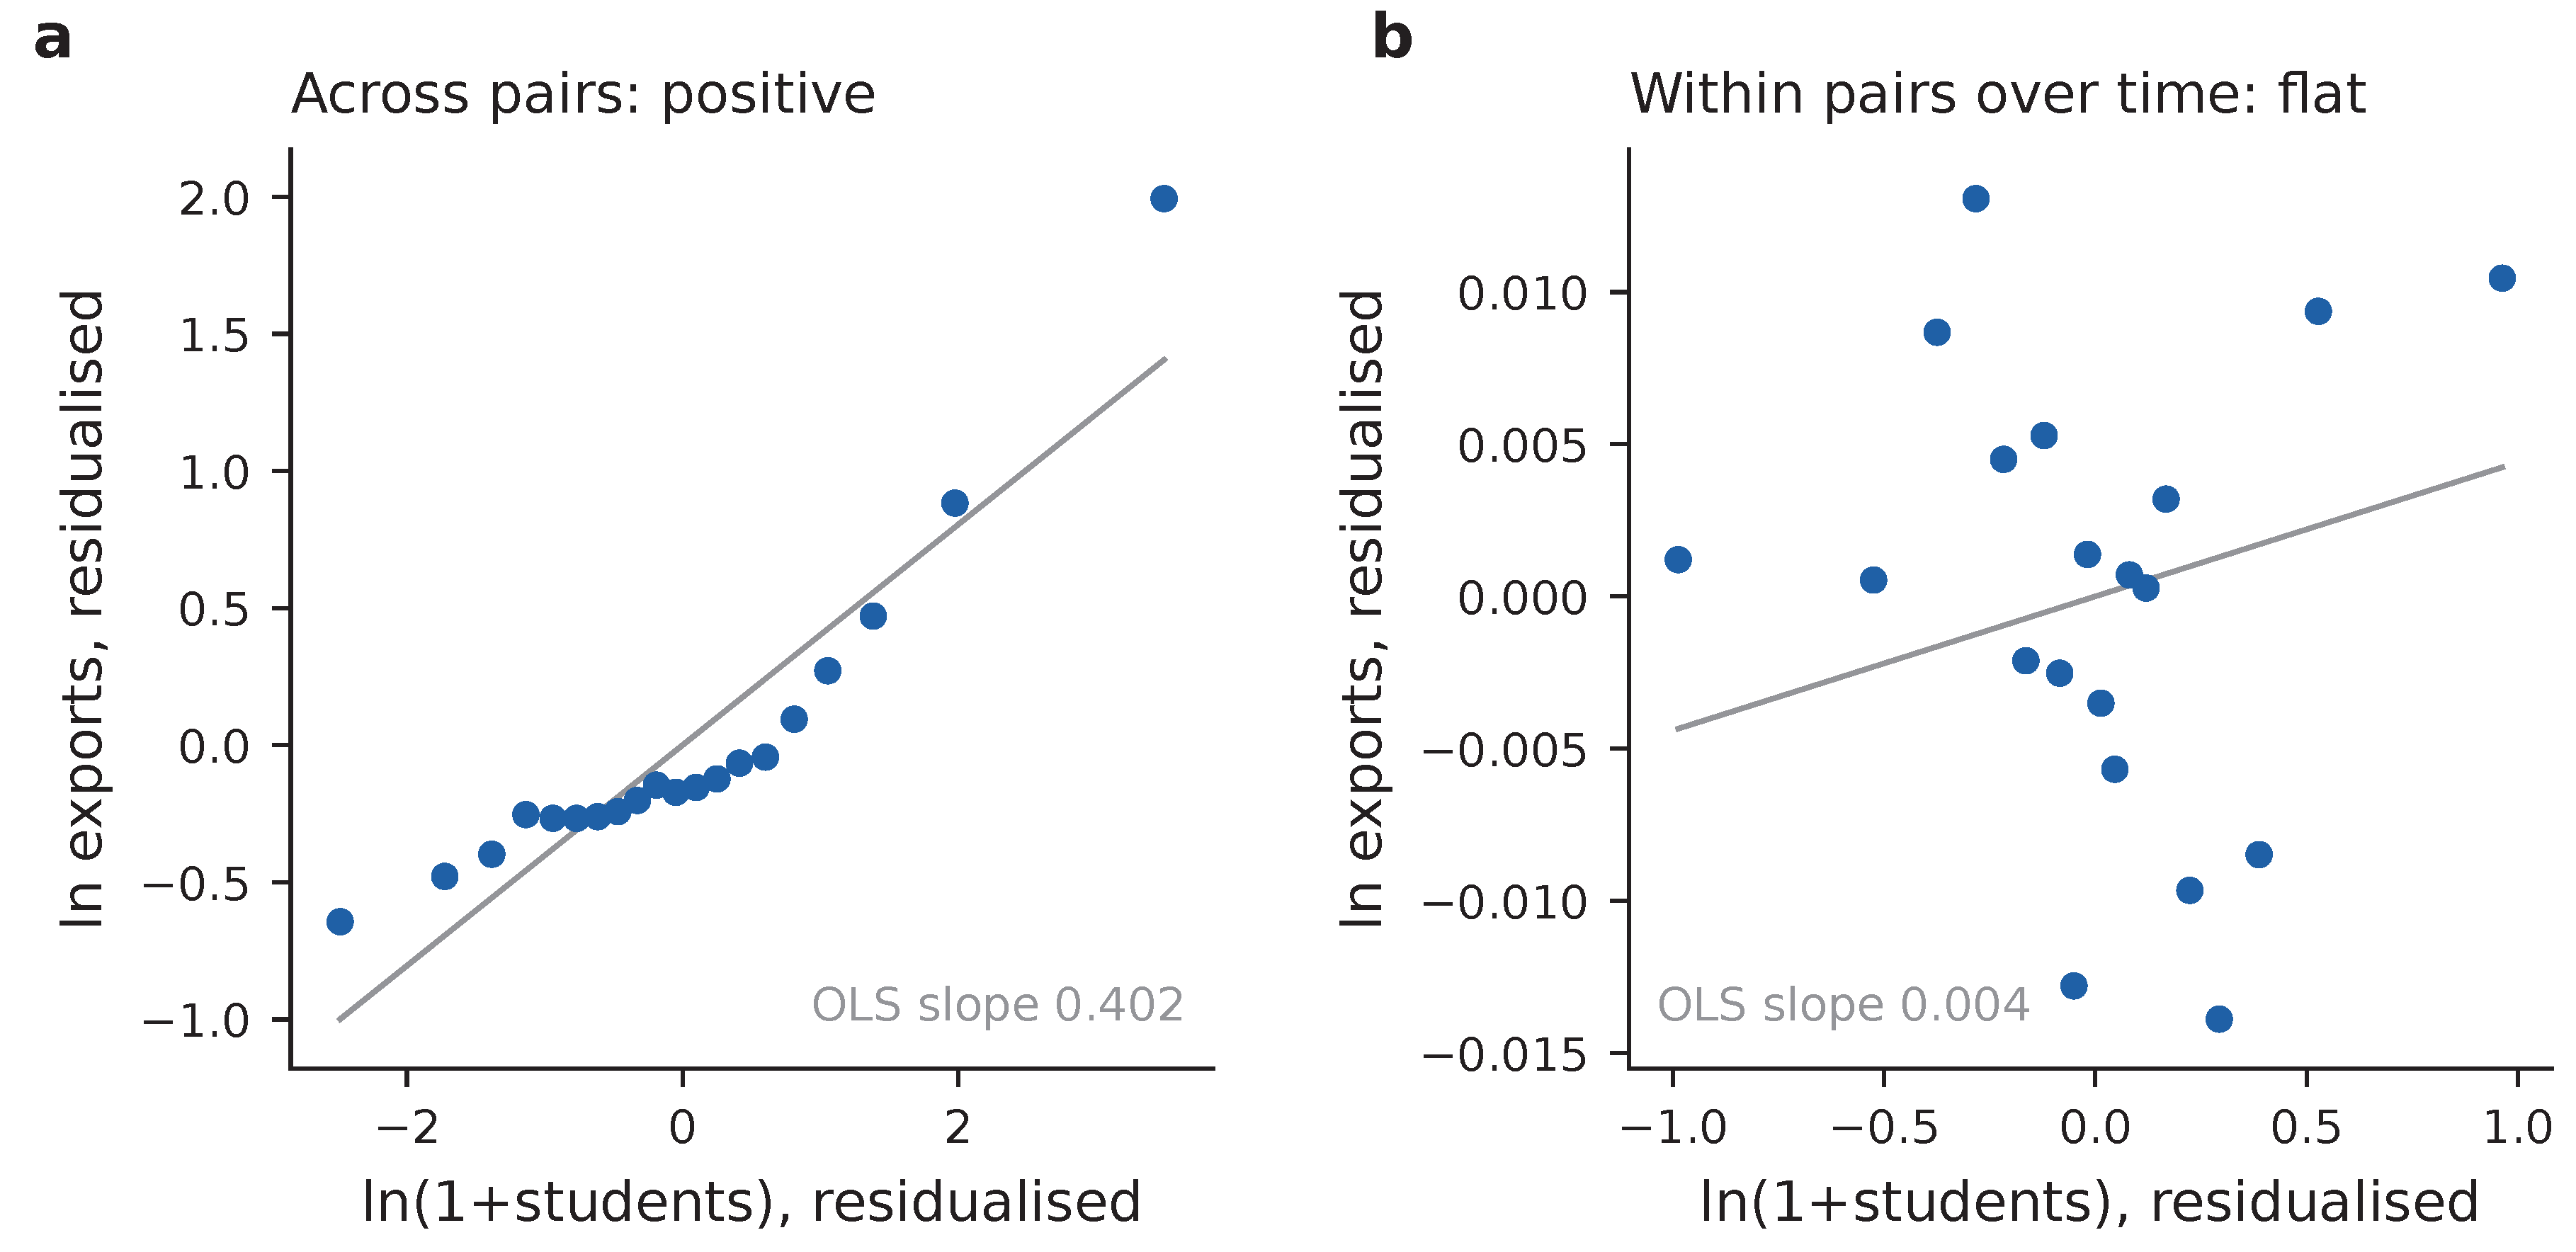
Figure 3.
Coefficients on the student stock across the pre-specified specifications. Points are PPML estimates (R5: OLS) with 95% confidence intervals based on pair-clustered standard errors. M1 (blue) is the main specification; the brown point is the placebo lead coefficient in R6. R4b shows the difference between Hungary and the other hosts. All specifications include pair, exporter–year and importer–year fixed effects; numbers of observations are reported in Table 2 and Table 3.
Figure 3.
Coefficients on the student stock across the pre-specified specifications. Points are PPML estimates (R5: OLS) with 95% confidence intervals based on pair-clustered standard errors. M1 (blue) is the main specification; the brown point is the placebo lead coefficient in R6. R4b shows the difference between Hungary and the other hosts. All specifications include pair, exporter–year and importer–year fixed effects; numbers of observations are reported in Table 2 and Table 3.
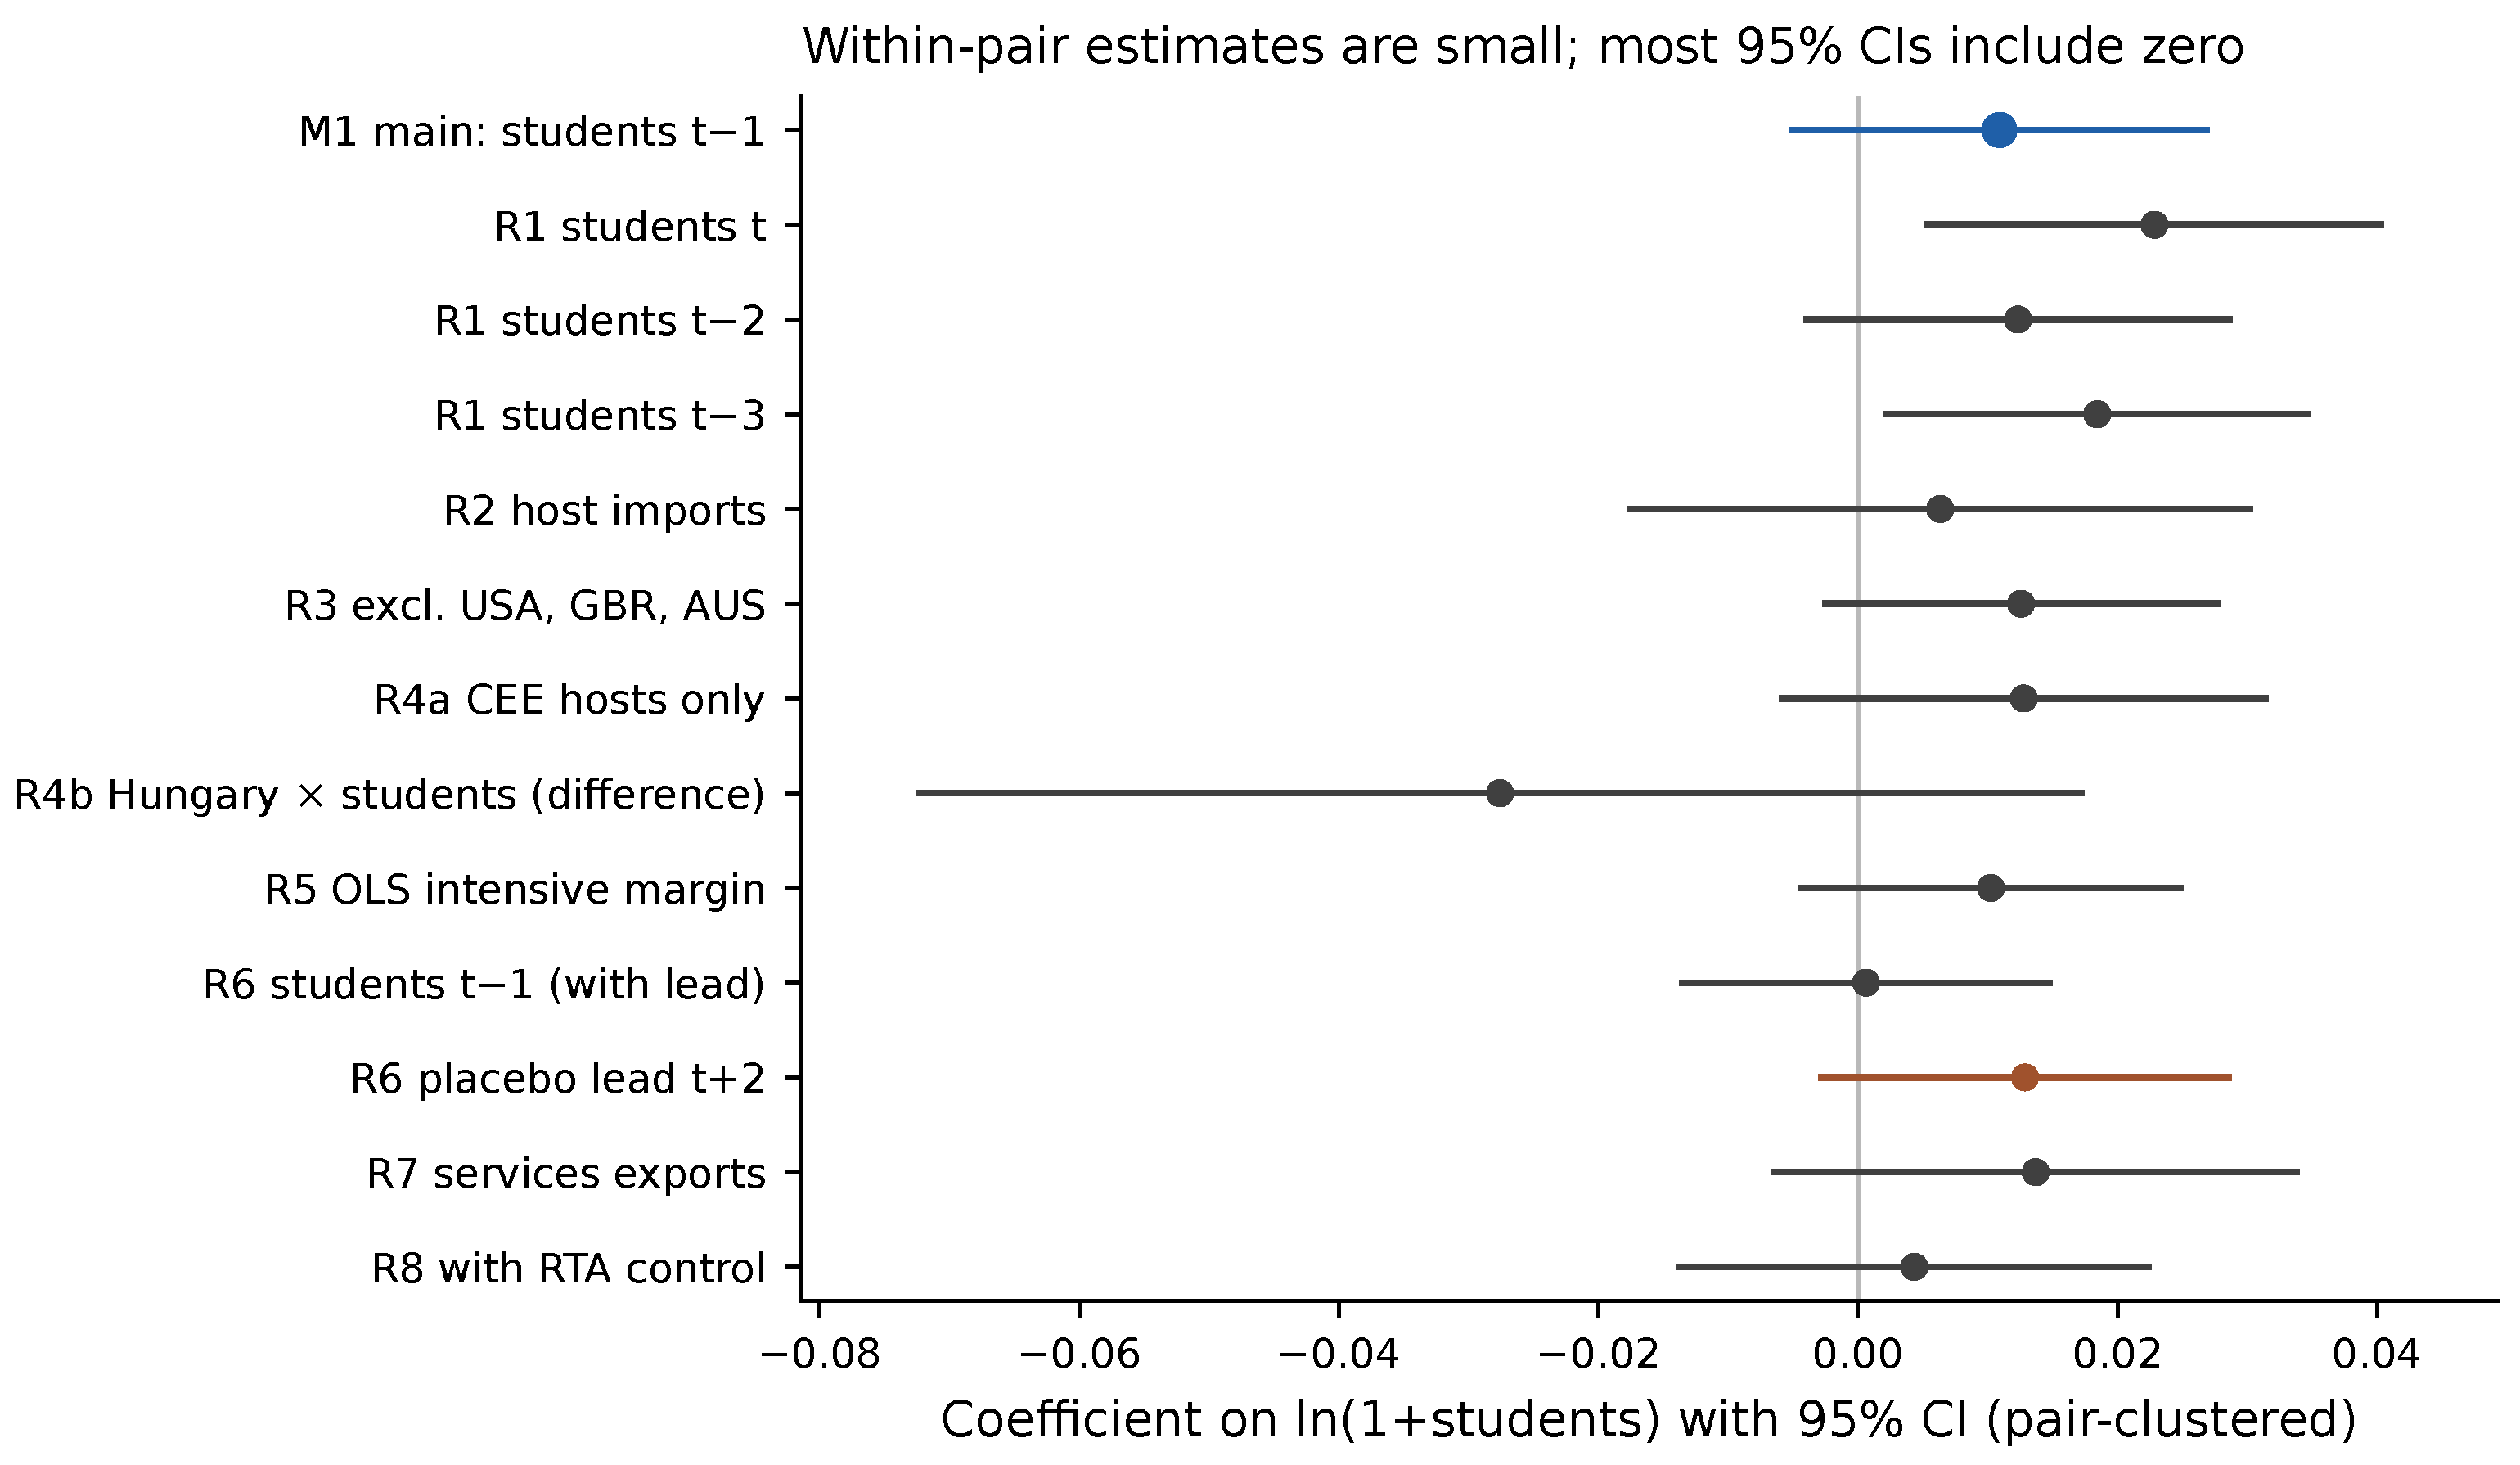
Figure 4.
Timing profile of the student–trade association. Each point is the coefficient on ln(1+students) from a separate PPML regression of host exports in year t on the student stock measured in the indicated year, with pair, exporter–year and importer–year fixed effects and 95% confidence intervals (pair-clustered). Filled markers: pre-specified lags (M1, R1). Open markers: exploratory lead-only regressions (E2). Samples differ slightly by timing because of data availability (Table 2 and Table 4).
Figure 4.
Timing profile of the student–trade association. Each point is the coefficient on ln(1+students) from a separate PPML regression of host exports in year t on the student stock measured in the indicated year, with pair, exporter–year and importer–year fixed effects and 95% confidence intervals (pair-clustered). Filled markers: pre-specified lags (M1, R1). Open markers: exploratory lead-only regressions (E2). Samples differ slightly by timing because of data availability (Table 2 and Table 4).
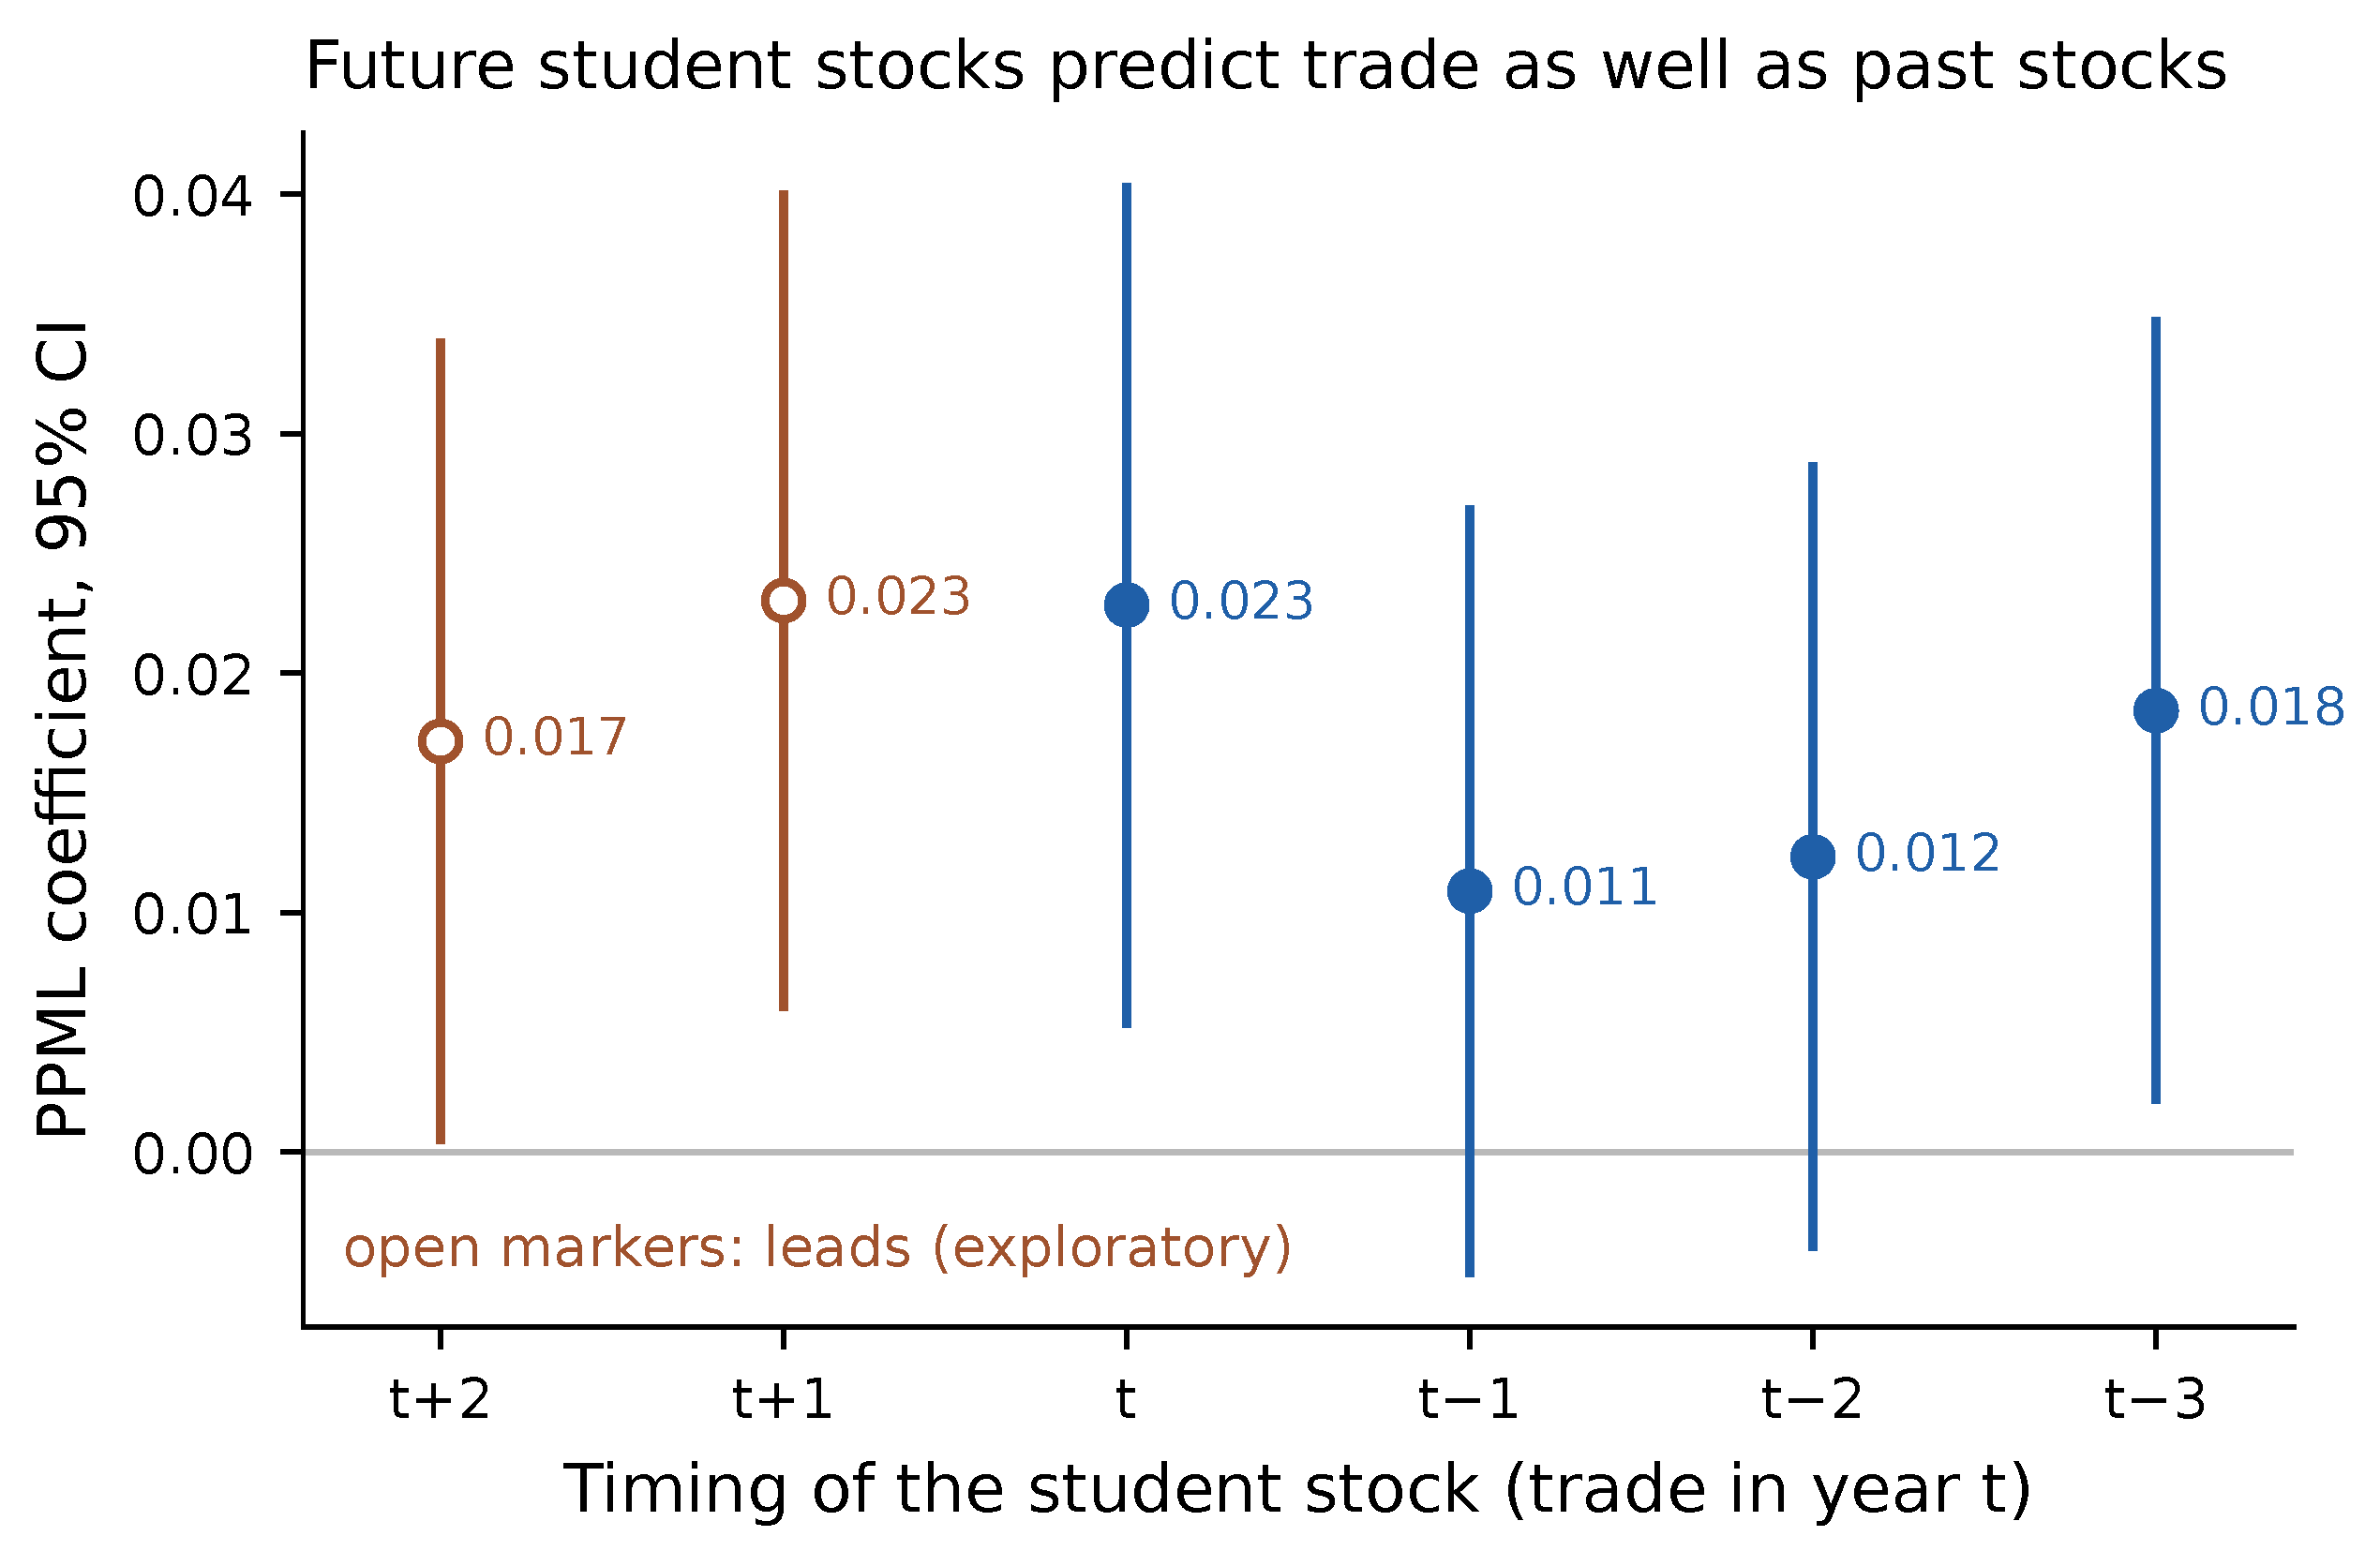
Table 1.
Descriptive statistics of the main estimation sample (trade years 2014–2023).
| Variable | Obs. | Mean | Median | P90 | Share zero (%) |
|---|---|---|---|---|---|
| Goods exports host→partner, (thousand USD) | 79,902 | 1,222,031 | 20,516 | 1,476,704 | 5.3 |
| Goods imports partner→host, (thousand USD) | 79,902 | 1,301,698 | 7,115 | 1,601,205 | 8.1 |
| Services exports host→partner (million USD, BaTIS) | 75,215 | 512 | 16 | 673 | 0.1 |
| Mobile students from partner in host, | 79,902 | 421 | 6 | 445 | 30.5 |
Sample: host country i in OECD-38 ∪ EU-27 with UIS bilateral data in ; partner j = all matched origin countries. Means and percentiles rounded to integers.
Table 2.
Main specification (M1) and pre-declared lag and direction variants (R1, R2).
| (1) M1 | (2) t | (3) | (4) | (5) Imports | |
|---|---|---|---|---|---|
| ln(1+S), | 0.0109 | 0.0063 | |||
| (0.0081) | (0.0122) | ||||
| ln(1+S), t | 0.0228** | ||||
| (0.0089) | |||||
| ln(1+S), | 0.0123 | ||||
| (0.0083) | |||||
| ln(1+S), | 0.0184** | ||||
| (0.0083) | |||||
| Outcome | |||||
| Pair, exp.-year, imp.-year FE | Yes | Yes | Yes | Yes | Yes |
| Trade years | 2014–23 | 2014–23 | 2014–23 | 2014–23 | 2014–23 |
| Observations | 78,753 | 78,204 | 78,310 | 77,446 | 78,599 |
| Pair clusters | 8,416 | 8,230 | 8,409 | 8,412 | 8,399 |
PPML unless stated; dependent variable in levels (thousand USD; BaTIS: million USD). Standard errors clustered by directed pair in parentheses. * , ** , *** . S = stock of internationally mobile tertiary students from the partner country enrolled in the host country (UIS). Column (5): host imports from the origin country.
Table 3.
Pre-declared robustness checks R3–R8.
| (1) R3 | (2) R4a | (3) R4b | (4) R5 | (5) R6 | (6) R7 | (7) R8 | |
|---|---|---|---|---|---|---|---|
| ln(1+S), | 0.0126 | 0.0128 | 0.0114 | 0.0006 | 0.0137 | 0.0043 | |
| (0.0077) | (0.0095) | (0.0083) | (0.0072) | (0.0103) | (0.0092) | ||
| ln(1+S), × Hungary | −0.0276 | ||||||
| (0.0229) | |||||||
| ln S, (OLS) | 0.0102 | ||||||
| (0.0074) | |||||||
| ln(1+S), (lead) | 0.0129 | ||||||
| (0.0080) | |||||||
| RTA (CEPII) | 0.0538* | ||||||
| (0.0314) | |||||||
| Estimator | PPML | PPML | PPML | OLS | PPML | PPML | PPML |
| Trade years | 2014–23 | 2014–23 | 2014–23 | 2014–23 | 2014–21 | 2014–23 | 2014–21 |
| Observations | 73,107 | 21,982 | 78,753 | 54,744 | 61,152 | 75,205 | 59,058 |
| Pair clusters | 7,810 | 2,205 | 8,416 | 6,600 | 8,028 | 8,063 | 7,869 |
PPML unless stated; dependent variable in levels (thousand USD; BaTIS: million USD). Standard errors clustered by directed pair in parentheses. * , ** , *** . S = stock of internationally mobile tertiary students from the partner country enrolled in the host country (UIS). R3 excludes USA, GBR and AUS as hosts; R4a restricts hosts to 11 CEE EU members; R4b interacts the student variable with a Hungary-host dummy; R5 is OLS on ln exports for positive flows and positive stocks (regressor ln S); R6 adds the stock at ; R7 uses BaTIS total services exports; R8 adds the CEPII RTA dummy. All columns include pair, exporter-year and importer-year FE.
Table 4.
Exploratory (not pre-declared) comparisons: cross-sectional gravity without pair fixed effects and lead-only regressions.
Table 4.
Exploratory (not pre-declared) comparisons: cross-sectional gravity without pair fixed effects and lead-only regressions.
| (1) M1 | (2) No pair FE | (3) Lead | (4) Lead | |
|---|---|---|---|---|
| ln(1+S), | 0.0109 | 0.1886*** | ||
| (0.0081) | (0.0200) | |||
| ln distance | −0.6954*** | |||
| (0.0367) | ||||
| Contiguity | 0.3098*** | |||
| (0.0705) | ||||
| Common official language | −0.1597* | |||
| (0.0847) | ||||
| Colonial link | −0.1532 | |||
| (0.1196) | ||||
| ln(1+S), lead only | 0.0230*** | 0.0172** | ||
| (0.0086) | (0.0085) | |||
| Pair FE | Yes | No | Yes | Yes |
| Exp.-year, imp.-year FE | Yes | Yes | Yes | Yes |
| Trade years | 2014–23 | 2014–23 | 2014–23 | 2014–22 |
| Observations | 78,753 | 79,900 | 74,924 | 67,395 |
PPML unless stated; dependent variable in levels (thousand USD; BaTIS: million USD). Standard errors clustered by directed pair in parentheses. * , ** , *** . S = stock of internationally mobile tertiary students from the partner country enrolled in the host country (UIS). Columns (3)–(4): the regressor is ln(1+S) measured at or only (row label “lead only”).
Table 5.
Timing of the student–trade association estimated on identical samples.
| (1) Own sample | (2) Common support, lags | (3) Common support, lags and leads | ||||
|---|---|---|---|---|---|---|
| Student stock measured at | (SE) | Obs. | (SE) | Obs. | (SE) | Obs. |
| 0.0184** | 77,446 | 0.0121 | 72,644 | 0.0186* | 60,457 | |
| (0.0083) | (0.0086) | (0.0096) | ||||
| 0.0123 | 78,310 | 0.0083 | 72,644 | 0.0129 | 60,457 | |
| (0.0083) | (0.0085) | (0.0082) | ||||
| (M1) | 0.0109 | 78,753 | 0.0081 | 72,644 | 0.0052 | 60,457 |
| (0.0081) | (0.0082) | (0.0081) | ||||
| t | 0.0228** | 78,204 | 0.0218** | 72,644 | 0.0174** | 60,457 |
| (0.0089) | (0.0092) | (0.0088) | ||||
| (lead) | 0.0230*** | 74,924 | – | – | 0.0198** | 60,457 |
| (0.0086) | (0.0081) | |||||
| (lead) | 0.0172** | 67,395 | – | – | 0.0167* | 60,457 |
| (0.0085) | (0.0087) | |||||
PPML with pair, exporter–year and importer–year fixed effects; dependent variable: host goods exports in levels (thousand USD). Standard errors clustered by directed pair in parentheses. * , ** , *** . S = stock of internationally mobile tertiary students from the partner country enrolled in the host country (UIS). Column (1) reproduces the estimates of Table 2 and Table 4, each on the largest sample available for that timing. Column (2) restricts all four pre-specified timings to the observations for which the stock is reported at t, , and (72,644 observations). Column (3) restricts all six timings to the observations for which the stock is reported at through (60,457 observations, trade years 2014–2022). The leads are exploratory (E2); the lags are pre-specified (M1, R1).
Table 6.
Sensitivity of the main estimate to the completeness of UIS bilateral reporting.
| Sample / specification | (SE) | 95% CI | Obs. | Pair clusters |
|---|---|---|---|---|
| Reference | ||||
| M1, all reporting pairs | 0.0109 | [−0.0050, 0.0268] | 78,753 | 8,416 |
| (0.0081) | ||||
| (a) Completeness of the pair record (trade years 2014–2023) | ||||
| Pairs reported in all 10 years | 0.0073 | [−0.0088, 0.0235] | 68,300 | 6,830 |
| (0.0082) | ||||
| Pairs reported in at least 8 of 10 years | 0.0086 | [−0.0077, 0.0248] | 75,130 | 7,634 |
| (0.0083) | ||||
| Pairs reported in fewer than 8 years | not estimablea | 3,715 | – | |
| All pairs, incomplete-record pairs (main term) | 0.0344 | [−0.0286, 0.0973] | 78,753 | 8,416 |
| (0.0321) | ||||
| × complete record (difference) | −0.0255 | [−0.0911, 0.0401] | 78,753 | 8,416 |
| (0.0335) | ||||
| (b) Coverage of the host-year record (bilateral records / reported total inbound, ) | ||||
| Host-years with coverage ≥ 90% | 0.0115 | [−0.0102, 0.0331] | 64,015 | 7,411 |
| (0.0110) | ||||
| Host-years with coverage ≥ 80% | 0.0083 | [−0.0106, 0.0272] | 70,075 | 8,021 |
| (0.0096) | ||||
| Host-years with coverage < 80% | not estimablea | 8,132 | – | |
| All host-years, coverage ≥ 80% (main term) | 0.0128 | [−0.0032, 0.0289] | 78,351 | 8,416 |
| (0.0082) | ||||
| × coverage < 80% (difference) | −0.0140*** | [−0.0242, −0.0038] | 78,351 | 8,416 |
| (0.0052) | ||||
PPML with pair, exporter–year and importer–year fixed effects; dependent variable: host goods exports in levels (thousand USD). Standard errors clustered by directed pair in parentheses. * , ** , *** . S = stock of internationally mobile tertiary students from the partner country enrolled in the host country (UIS). a The three-way fixed-effect model does not converge on this subsample (the iterative demeaning fails): the surviving observations are too few relative to the number of pair and country-year effects. The corresponding interaction row, estimated on the full sample, gives the same comparison. Panel (a): a pair is counted as reported in a trade year if the UIS stock at exists for that pair. Panel (b): coverage is the ratio of the sum of bilateral UIS records to the total inbound mobile stock reported by UIS for the same host-year (indicator 26637), measured in the student year .
Disclaimer/Publisher’s Note: The statements, opinions and data contained in all publications are solely those of the individual author(s) and contributor(s) and not of MDPI and/or the editor(s). MDPI and/or the editor(s) disclaim responsibility for any injury to people or property resulting from any ideas, methods, instructions or products referred to in the content. |
© 2026 by the authors. Licensee MDPI, Basel, Switzerland. This article is an open access article distributed under the terms and conditions of the Creative Commons Attribution (CC BY) license (http://creativecommons.org/licenses/by/4.0/).
Copyright: This open access article is published under a Creative Commons CC BY 4.0 license, which permit the free download, distribution, and reuse, provided that the author and preprint are cited in any reuse.