

Submitted:
13 November 2026
Posted:
17 November 2026
You are already at the latest version
Abstract
Evidence on place-based rural investment from resource-dependent, post-socialist and fiscally centralised economies is scarce. We assess Kazakhstan's Auyl–El Besigi programme, which financed infrastructure in selected villages in 2019–2025. Programme exposure was reconstructed from 1106 final amended budget decisions for the main sample of 135 rural districts, drawn from a broader collection of 1298 distinct decisions for 2019–2026, and linked to official statistics and Visible Infrared Imaging Radiometer Suite (VIIRS) night-time lights. Callaway–Sant'Anna difference-in-differences estimates against not-yet-funded districts cover a window ending in 2021 (2022 as a robustness check); later years are analysed descriptively. Early-funded districts had about twice the rural population of later entrants. After covariate adjustment, short-run estimates are small and imprecise: 0.021 log points for night-time light (95% confidence interval −0.035 to 0.076) and 0.008 for average wages (−0.006 to 0.022). No robust short-run district-level effect was detectable using the available administrative and satellite indicators. Trends to 2024–2025 are similar across entry groups, and larger recorded allocations coincide descriptively with faster wage growth. The findings highlight a broader evaluation problem for centrally financed place-based programmes in data-constrained institutional settings: without settlement-level project, expenditure and service-quality records, economically meaningful local effects may remain undetectable in aggregate administrative data.
Keywords:
place-based policy
; rural infrastructure
; social well-being
; public investment
; budget accountability
; staggered difference-in-differences
; night-time lights
; Kazakhstan
1. Introduction
Over the past two decades, place-based policies have returned to the centre of development debates. Persistent, and in some countries widening, gaps between prosperous and lagging territories have weakened the presumption that spatially blind policies will by themselves spread the gains of growth [1,2]. Lagging places are now seen not only as an equity concern but also as a source of economic and political risk [3], and governments increasingly target public money at specific localities rather than at individuals [4,5,6]. Welfare theory is, however, ambivalent about such spending: a place-based transfer raises aggregate welfare only when it corrects a genuine local market failure or delivers public goods that markets underprovide, and otherwise it mainly relocates activity or capitalises into local prices [4].
The empirical evidence on the returns to place-based investment is extensive but uneven. In high-income settings, well-identified studies find that large regional programmes can raise employment and output in targeted areas, with effects that depend strongly on local absorptive capacity and the quality of government [7,8,9,10,11,12]. Satellite data now allow such programmes to be evaluated at a finer spatial scale than official statistics permit [13]. Infrastructure and public services appear to be more cost-effective than tax incentives, particularly in distressed labour markets [14]. In developing economies, rural roads have been found to reduce poverty and widen market access in Bangladesh and Vietnam [15,16], while evidence from India indicates that new roads mainly reallocate labour out of agriculture, with modest effects on consumption [17,18,19]; recent studies of road upgrading in Tanzania and of rural roads and entrepreneurship in India also report effects that differ across households and groups [20,21]. Electrification raised rural employment in South Africa and development outcomes in Brazil [22,23], and school construction raised schooling and wages in Indonesia [24]. Two lessons are directly relevant here. Single investments often have small effects unless complementary services are provided [25], and better connectivity can raise as well as lower out-migration, because it reduces the cost of leaving [26].
Much less is known about place-based rural investment in economies that combine four features: dependence on natural resources, a post-socialist legacy of centrally planned settlement systems, very low population density and a fiscally centralised system in which rural local governments depend on transfers from higher-level budgets [27,28,29]. In such settings, large programmes are designed and financed at the centre, the capacity of local bodies to use additional funds is uncertain, and the dispersion of small settlements raises the cost of providing services. Kazakhstan is a clear case. Regional disparities in output per capita have widened despite strong aggregate growth [30,31,32,33,34], international reviews have recommended a more place-based approach to regional policy [35], and rural districts depend heavily on transfers [36]. At the start of 2023, the country had 6295 rural settlements, home to about 7.5 million people, or 38.2% of the population [37]. Official estimates put the share of the rural population with incomes below the subsistence minimum at 6.7% in the fourth quarter of 2021, compared with 3.6% in urban areas [38], and weak social and transport infrastructure has been linked to the depopulation of vulnerable regions [39].
In 2019 the government launched the special project Auyl–El Besigi (“The village is the cradle of the nation”) to bring rural settlements up to national standards for infrastructure and services [40,41]. Rather than covering all villages, the programme concentrated funds on settlements classified as having development potential [42] and financed intra-village roads, housing and utility networks, water supply, and education, health, culture and sports facilities. According to the Ministry of National Economy, about 7.6 thousand projects were carried out in about 2.5 thousand villages between 2019 and 2025; from 2026 such projects are financed from local budgets through general-purpose transfers [43]. Official reporting has concentrated on outputs, while parliamentary and audit reviews have questioned the dispersion of funds, the selection of projects and their social effectiveness [44,45]. The academic literature on the programme is so far descriptive [46,47].
This study is part of a research programme on the social well-being of the rural population of Kazakhstan. Social well-being is a multidimensional concept that includes access to services, safety, health, social ties and subjective satisfaction, and in the capability approach these are valued in their own right [48,49]. Wages, employment, entrepreneurship, population retention and local economic activity are not measures of social well-being. They are, however, its economic foundations: they determine household resources, the viability of local services and whether people stay in rural areas. A programme that improves living conditions without strengthening these foundations may still raise well-being, but such gains may depend more heavily on continued public funding. This article examines the economic foundations; it does not measure social well-being directly.
We ask whether districts that received Auyl–El Besigi funding earlier experienced changes in local economic activity, wages, unemployment, migration, population and business activity relative to districts that had not yet been funded. Although targeted financing continued until 2025, almost all rural districts had received a first allocation by 2022, so a credible comparison group of not-yet-funded districts exists only for the first years. The evidence therefore has three levels, which we keep separate throughout: (i) causal short-run difference-in-differences estimates in a window ending in 2021 (Section 6 and Section 7.1); (ii) robustness checks of these estimates, including a window ending in 2022 (Section 7.2, Section 7.3 and Section 7.4); and (iii) non-causal descriptive evidence: outcome trends after the estimation window, up to 2024 or 2025 depending on the indicator, and associations between outcomes and the intensity of recorded allocations (Section 7.5 and Section 8).
Settlement-level records of project spending are not publicly available. We therefore reconstruct programme exposure from district budgets, which list programme allocations as separate budget lines and are published with all amendments in the Adilet legal information system [50]. The measure is the planned allocation recorded in the final amended version of each district budget, not audited expenditure. Programme exposure was reconstructed from 1106 final amended budget decisions for the main sample of 135 rural districts, drawn from a broader collection of 1298 distinct decisions for 2019–2026; treatment timing uses those for 2019–2023. We link these allocations to official district statistics [51] and to satellite-measured night-time lights, which provide a consistent proxy for local activity where small-area statistics are scarce [52,53,54]. We estimate group-time average treatment effects with not-yet-funded districts as controls [55,56], compare them with an imputation estimator that allows for oblast-by-year shocks [57], and assess pre-trends, anticipation, covariate balance, common support, inference with few clusters [58], sensitivity to violations of parallel trends [59], misclassification of treatment timing, spillovers and the statistical power of the design.
Two findings stand out. First, funding was not allocated at random: districts funded in 2019 had on average 55.0 thousand rural residents in 2018, compared with 25.6 thousand in districts first funded in 2021–2023, and this selection accounts for the higher wages of funded districts in unadjusted comparisons. Second, after adjustment for pre-programme characteristics, the short-run estimates are small and imprecise. No robust short-run district-level effect was detectable using the available administrative and satellite indicators. The confidence intervals exclude, for example, increases in the average wage of more than about 2% in the first years after funding, but they do not exclude smaller, later or more localised effects.
The paper makes three contributions. First, to the best of our knowledge, it is the first district-level quasi-experimental assessment of the early stage of Auyl–El Besigi, and it adds evidence on a large national rural investment programme from a resource-dependent, post-socialist, sparsely populated and fiscally centralised economy, settings that are under-represented in a literature that draws mainly on Europe, North America and South Asia. Second, it shows how adopted local budgets, which are published with all amendments, can be used to measure the timing and size of a national programme when project-level data are not released, and it documents the measurement error and misclassification that this entails. Third, it links the evaluation of place-based policy to budget accountability: the difficulty of assessing a programme that disbursed several hundred billion tenge is itself a policy finding, relevant to the transfer of rural investment to local budgets that Kazakhstan began in 2026 [43] and to similar choices in other Central Asian and transition economies.
The remainder of the paper is organised as follows. Section 2 reviews the literature and sets out the hypotheses. Section 3 describes the programme. Section 4 presents the data and the construction of the treatment measure, and Section 5 the identification strategy. Section 6 reports the causal estimates and Section 7 the diagnostics, robustness checks and the descriptive allocation gradient within the estimation window. Section 8 presents descriptive evidence for the period after the estimation window. Section 9 discusses the interpretation of the findings, and Section 10, Section 11 and Section 12 set out policy implications, limitations and conclusions. Additional tables are provided in Supplementary File S3.
2. Literature Review and Conceptual Framework
2.1. Place-Based Policy in Resource-Dependent and Fiscally Centralised Economies
The case for place-based intervention rests on the argument that institutions, agglomeration and local public goods shape opportunities in ways that mobility alone does not correct [1,2]. Its critics stress that subsidies tied to places can trap people in low-productivity locations and that benefits accrue partly to landowners [4,5]. Remoteness from urban agglomerations is itself associated with higher rural poverty [60], which implies that the returns to the same investment may differ sharply between peri-urban and remote settlements. Evidence from European structural funds shows that these returns depend on regional absorptive capacity and government quality [10,11], a point of particular relevance where implementation is delegated to local executive bodies with limited own revenues. In Kazakhstan, programmes of this kind are designed and largely financed at the centre, including from the National Fund, which accumulates oil revenues, while district and rural-okrug bodies implement them with limited fiscal autonomy [28,61]. Fiscal federalism theory suggests that such an arrangement can weaken the link between local needs and spending [27,62], and it places a premium on transparent reporting of what was spent where. The literature on regional resilience adds that regions differ in how they absorb and recover from shocks, depending on their economic structure and institutions [63]; this is relevant here because the programme overlapped with the COVID-19 pandemic.
In terms of government quality, Kazakhstan occupies an intermediate position. In the Worldwide Governance Indicators [64], where higher estimates indicate better governance, Kazakhstan's government effectiveness estimate rose from −0.19 in 2018, the year before the programme started, to 0.10 in 2025, the highest among the Central Asian republics (Uzbekistan −0.20, Tajikistan −0.69, Kyrgyz Republic −0.85 and Turkmenistan −1.15 in 2025). Its control-of-corruption estimate, however, remained negative (−0.51 in 2018 and −0.26 in 2025) [65]. The capacity of the state to deliver projects has thus improved, while weaknesses in public financial management persist: the Supreme Audit Chamber found that programme projects were selected without regard to the condition of existing facilities, that expected economic effects were not defined for all projects, and that neither the central administrators nor local executive bodies kept a systematic record of project characteristics [45]. Both observations matter for interpreting the returns to the programme.
2.2. Public Capital and Rural Infrastructure
The macroeconomic literature finds a positive but heterogeneous output elasticity of public capital, with larger effects for core infrastructure [66,67]. Micro-evidence on transport infrastructure shows that lower trade costs raise real incomes [68], although effects on growth can be modest [69]. For rural areas, the main documented channels are market access and price convergence [16,18], occupational reallocation out of agriculture [17], shifts in agricultural production [19], and labour supply responses to utilities [22]. Because intra-village roads accounted for more than 3 thousand of the more than 5.4 thousand Auyl–El Besigi projects implemented in 2019–2023 [70], evidence on road quality and maintenance is especially relevant [71].
2.3. Social Well-Being and Its Economic Foundations
The capability approach treats poverty as a deprivation of the real freedoms that people value, and treats access to schools, health care, water and safe roads as conversion factors that turn incomes into well-being [48,49]. From this perspective, improved services are a welfare outcome in their own right, not only an input into earnings, and spatial inequality within countries often reflects unequal access to such public goods [72]. Rural social well-being nevertheless rests on economic foundations. Household earnings and employment determine the resources available to families; entrepreneurship sustains local services and tax bases; population retention determines whether schools, clinics and shops remain viable; and local economic activity reflects the density of these interactions. We therefore treat wages, unemployment, business activity, migration, population and night-time lights as economic preconditions of social well-being. They are not direct measures of it, and a programme may improve well-being through better services without changing them in the short run.
Fiscal federalism theory adds that the allocation of public goods depends on how transfers are designed and on the incentives of the governments that spend them [27,62]. Auyl–El Besigi combined central targeting criteria with local selection and implementation, so its effects may reflect both the size of the transfers and local capacity to convert them into functioning assets.
2.4. Hypotheses
We translate these arguments into testable hypotheses, each linked to a distinct channel (Figure 1).
H1 (investment and activity channel). Recorded programme allocations raise public fixed investment and local economic activity, measured by night-time lights, in funded districts relative to districts not yet funded.
H2 (labour channel). Programme allocations raise wages and reduce unemployment; part of any short-run effect may reflect temporary construction jobs and should fade after project completion.
H3 (entrepreneurial channel). Programme allocations increase the number of active individual entrepreneurs.
H4 (migration channel). Programme allocations reduce net out-migration and slow rural population decline; because better connectivity can also lower the cost of leaving, the sign of this effect is an empirical question [26,73].
H5 (descriptive allocation gradient). Districts with larger recorded allocations per rural resident exhibit more favourable subsequent outcome changes, without implying a causal dose–response relationship.
H1–H4 are causal hypotheses and are tested with the difference-in-differences design (Section 6 and Section 7). H5 is descriptive and is examined with conditional associations (Section 7.5 and Section 8.3).
3. Institutional Background of the Auyl–El Besigi Programme
Auyl–El Besigi was launched following instructions announced at the congress of the then ruling party on 27 February 2019, with the Ministry of National Economy as administrator and a project office coordinating regional offices under oblast akims [40]. Its stated objective was to bring rural settlements up to the System of Regional Standards, which defines the minimum set of facilities and services for each category of settlement [41]. The programme was subsequently embedded in the State Programme for Regional Development for 2020–2025 [74] and in the national project “Strong Regions”, which included the modernisation of support and satellite villages under Auyl–El Besigi as a separate measure [75].
Targeting relied on a classification of rural settlements by development potential. Under the 2019 criteria, settlements received points for demographic (up to 50), infrastructure (up to 30) and economic (up to 20) indicators, adjusted by a geospatial coefficient, and support settlements in clusters scoring above a threshold were classified as having high potential [42]. Support villages were grouped with surrounding satellite villages into rural clusters; in 2019 the government reported 1150 clusters comprising 3477 settlements [76], and in 2022 parliament was informed of 1173 support and 2388 satellite settlements selected out of 6316 [44]. The criteria were revised in 2025 [77]. Lists of eligible settlements were approved by local executive bodies in agreement with the central authority for regional development [78], and projects were implemented by local executive bodies as budget investment projects [45].
Financing combined targeted transfers from the republican budget with local co-financing [40]; part of the targeted transfers came from the National Fund [45,61], and from 2023 part of the programme funds was included in general-purpose transfers to local budgets [78]. Roads dominated the project portfolio: of the more than 5.4 thousand projects implemented in 2019–2023, more than 3 thousand concerned intra-village roads, 1.7 thousand social facilities and 578 housing and utility facilities [70]. For the whole period of targeted financing, 2019–2025, the Ministry of National Economy reported about 7.6 thousand projects in 2.5 thousand support and satellite villages, with 900 housing and utility facilities, 2.4 thousand social facilities and more than 4.3 thousand intra-village roads built or repaired [43]. Table 1 summarises the scale of the programme as reported by official sources. Reported totals are not always consistent across releases [79,80], because they refer to different dates, to plans or completed projects, and to republican funds only or to all sources; Table 1 therefore lists them separately rather than adding them up. This is one reason why we measure programme exposure from final amended district budgets rather than from aggregate announcements.
Implementation problems have been documented. By the beginning of 2022 only 18% of the selected villages had been covered, and members of parliament criticised the dispersion of funds and per-resident allocations that differed roughly threefold across regions [44]. The Supreme Audit Chamber's assessment of 2023 spending reported that 97.2% of the allocated funds had been executed, but it also found that financing from the National Fund did not comply with Article 23 of the Budget Code, that projects were selected on the basis of the presence of facilities rather than their condition, that economic effects were not defined for all projects, that monitoring by local executive bodies was weak and that six projects were not completed on schedule [45]. From 2026, projects of this kind are financed from local budgets through general-purpose transfers [43]. The 2019–2025 period of targeted financing thus provides a policy cycle with staggered entry, the setting for which modern difference-in-differences estimators were designed [82].
4. Data and Measurement
4.1. Unit of Analysis and Sample
Project-level records of spending by settlement are not publicly available for the country as a whole: the open sources we could identify cover only a small fraction of the roughly 2.5 thousand participating villages. The analysis is therefore carried out at the district level, where both programme allocations and outcomes are observed for the whole country. The unit of observation is the district–year. To keep units comparable over time, districts are harmonised to the 174 second-level administrative units of the 2017 geoBoundaries layer for Kazakhstan [83]. Districts created later from existing ones (Kegen, Zhetysai, Keles, Aksuat and Samar) are merged with their parent districts, and the reorganisation of oblasts in 2022 [84] is handled through a crosswalk between the district codes of the national statistical database and the 2017 polygons. The four districts formed on 1 January 2024 by separation from existing units (Ulken Naryn, Markakol, Makanshy and Zhanasemey) are assigned to the units from which they were separated [85]; because the village of Zhetygen was separated from the Iliysky district as the city of Alatau [86], the population of the Iliysky unit at 1 January 2025 is not comparable with earlier years and is treated as missing. Units that contain a city of oblast significance or a large industrial area (19 units) are excluded from the main sample, because their night-time lights and labour markets are dominated by urban activity. The main sample consists of the 135 rural units for which budget decisions are available for every year from 2019 to 2022. To assess spillovers, two districts are treated as neighbours if their 2017 polygons share a boundary; the resulting list of 433 neighbouring pairs is derived from the geoBoundaries polygons [83] and included in Supplementary File S1.
4.2. Recorded Programme Budget Allocations
Programme exposure is measured from the annual budgets of districts. Each district maslikhat (local representative body) adopts a three-year district budget, which is amended during the year, and the consolidated texts of these decisions, including all amendments, are published in the Adilet legal information system [50]. In the expenditure appendix of each budget, programme spending appears as separate budget programmes whose titles name the project, for example “Implementation of measures for social and engineering infrastructure in rural settlements within the framework of the Auyl–El Besigi project” (current spending) and “Development of social and engineering infrastructure in rural settlements within the framework of the Auyl–El Besigi project” (capital spending). These programmes are administered by the district departments for housing and utilities, education, culture and construction. We collected the decisions on district budgets for the periods 2019–2021 to 2026–2028 and, for each district and year, took the first year of the three-year budget in its final amended version. The recorded allocation of district d in year t is the sum of all budget programmes whose titles refer to the project, in thousand tenge; it is converted into tenge per rural resident using the rural population at the start of the year; where an allocation is recorded but the rural population is not published (7 district-years in 2021 in the main sample), the per-resident amount is treated as missing rather than as zero. Throughout the paper we refer to this measure as the recorded programme budget allocation. It is a planned allocation recorded in the final amended district budget, not audited expenditure.
The budget data come from three collections (Supplementary File S1). The first contains 732 decisions on the budgets for 2019–2021 to 2023–2025 and defines treatment timing. Decisions for every year from 2019 to 2022 are available for 154 of the 174 harmonised units; the main gaps are the Ayagoz and Zharma districts in 2019–2020 and the Baidibek district in 2019. Coverage for 2023 is incomplete (76 units), so 2023 is used only to define late treatment cohorts. The second collection (480 decisions on the budgets for 2023–2025, 2024–2026 and 2025–2027) covers 135 of the 135 districts of the main sample in 2023, 127 in 2024 and 128 in 2025. The third (167 decisions on the budgets for 2026–2028, collected on 2 November 2026) covers 133 districts of the main sample; the 2026 amounts are the plans in force on that date and may still be amended. The 81 decisions on the 2023–2025 budgets in the first collection (covering 76 units) were collected again in the second, with identical recorded amounts, so the three collections contain 1298 distinct decisions for the budget years 2019–2026: 1106 of districts in the main sample, 166 of districts in other harmonised units, and 26 of districts that cannot be assigned to a 2017 unit. The later collections are used only in Section 7.5 and Section 8 and do not change the treatment timing. In the main sample, total recorded allocations amounted to Kazakhstani tenge (KZT) 22.0 billion in 2019, 50.8 billion in 2020, 40.2 billion in 2021, 42.2 billion in 2022, 78.6 billion in 2025 and 24.6 billion in 2026 (Figure 2b). These allocations combine republican targeted transfers, which are distributed by oblast in the government resolutions implementing the republican budget [61], with local co-financing; since 2026, such projects are financed from local budgets through general-purpose transfers [43]. Part of the programme funds does not appear as a separate line in district budgets (Section 4.3).
The treatment timing Gd is the first year in which the district budget records a positive allocation to the programme. In the main sample, 44 units were first funded in 2019, 52 in 2020, 20 in 2021, 8 in 2022 and 2 in 2023, and 9 units show no programme line in 2019–2023. Table 2 reports the number of funded and not-yet-funded districts in each year.
4.3. Measurement Error and Treatment Misclassification
The treatment measure is subject to three sources of error. First, recorded allocations are plans. Even in their final amended version, they may differ from actual spending because of under-execution, delays or reallocation late in the year; the audit of 2023 spending reported execution of 97.2% of allocated targeted transfers at the national level [45], but execution rates by district are not published in consolidated form. The Open Budgets portal publishes, for some administrators, reports on the implementation of budget programmes with planned and actual expenditure [87]. Of the 857 Auyl–El Besigi programme pages listed on the portal, 108 reports with a positive planned amount and an identifiable report year could be matched to 50 districts of the main sample for 2019–2025: 30 from district departments, 77 from rural okrugs and 1 from an oblast department (Supplementary File S1). The median ratio of actual to planned expenditure in these reports was 100%, and 79% of reports showed execution of at least 95%; 17% recorded no actual expenditure, which may reflect non-execution or incomplete reporting. Summed over all reports, actual expenditure was KZT 18.7 billion against KZT 22.6 billion planned (83%). The planned amount in a single district-level report was usually smaller than the recorded allocation for the same district and year (median ratio 0.56 in 23 district-years; equal in 4), as expected when the recorded allocation sums the programme lines of several administrators. In 2 district-years without a recorded programme line, a district-level report shows planned spending. These reports cover too few districts to replace the recorded allocations as the treatment measure. They indicate that most planned amounts in the reports were spent, but that a minority of allocations was not executed in the year recorded. Measurement error in amounts mainly affects the allocation gradient (Section 7.5); it affects the timing analysis only if a district recorded an allocation that was not spent in the same year. Second, part of the programme funds did not pass through district budgets as separate lines. Some funds were transferred to the budgets of rural okrugs, the sub-district level of local government, and appear in district budgets only as transfers to lower-level budgets. Other projects were implemented through oblast-level programmes. In several decisions without a programme line, the text of the decision refers to programme transfers received from higher-level budgets; for example, the 2022 budget of the Mamlyut district records such a transfer in the text but no separate programme line in the expenditure appendix. Districts without a recorded line are therefore not reliably untreated, and they are not used as a never-treated control group. The second collection confirms this: 8 of the 9 districts of the main sample without a programme line in the decisions that define treatment timing recorded an allocation in 2023–2025. In windows ending in 2021 or 2022 these districts are not-yet-funded comparison districts under either classification. Third, for 6 districts one or more years before the first recorded allocation are not covered by available decisions, so their timing is uncertain.
These errors can misclassify the timing of treatment. If a district was in fact funded earlier than recorded, it serves as a control while already treated, which biases estimated effects towards zero when effects are positive. We address this in four ways: an alternative treatment date that also counts transfers mentioned in the text of budget decisions; re-estimation excluding districts with uncertain timing and districts without a programme line; assignment of districts without a line to the modal entry year (2020); and a simulation in which the recorded first year of a random share of districts is shifted by one year in either direction (Section 7.3).
4.4. Outcomes and Covariates
Outcomes and covariates come from the Taldau information and analytical system of the Bureau of National Statistics [51], which publishes annual indicators for districts (Table 3). Population and rural population at 1 January are available for 2009–2025, and births and deaths for 2009–2025. Net migration by district is not published for 2015–2022; for those years it is derived as the change in population minus natural increase. Its value for 2021, the year of the national population census [88], shows large jumps in many districts and is excluded from the estimation. The unemployment rate is available for 2014–2025 except 2019. The average monthly nominal wage is available for 2012–2025, and fixed investment by source of financing for 2013 and 2015–2025. The number of active individual entrepreneurs is available only from 2018 and that of active legal entities only from 2020; the latter is not analysed, and the former has a single pre-programme year. The data were downloaded on 29 October 2026; population at 1 January 2025, published later, was added on 2 November 2026 after checking that the same download reproduces the 2023 and 2024 values of the panel exactly. Net migration and the number of active individual entrepreneurs for 2025 were not yet available in Taldau on 2 November 2026, and no annual district indicators for 2026 have been published.
Local economic activity is measured by annual Visible Infrared Imaging Radiometer Suite (VIIRS) night-time light radiance [89,90]. We use the annual 500 m series derived from the Earth Observation Group annual composites [91] and restrict it to the observed years 2012–2024, since the values for 2000–2011 in that series are extrapolated. The series used has no annual layer for 2025 (latest version v0.4, checked on 2 November 2026). Files for 2022–2024 are stored with a scale factor of 10 and are rescaled to the units of earlier years. Measurement error in popular night-light products can bias estimated policy impacts [92]. Because rural settlements emit weak light, the main measure is the sum of radiance of pixels between 1 and 20 nW·cm−2·sr−1 within each unit; total radiance is used as an alternative. Poverty and direct measures of social well-being are not published at the district level: official poverty indicators are available only for oblasts by urban and rural area [93]. The outcomes are therefore the economic foundations discussed in Section 2.3. Pre-programme covariates are 2018 values of log rural population, the rural share of population, the log average wage and log night-time light per 1000 residents. Population values for 2018 are missing in Taldau for 13 districts and are replaced by the geometric mean of the 2017 and 2019 values.
5. Identification Strategy and Econometric Methods
5.1. Causal Framework
Figure 1 summarises the assumed causal structure. Pre-programme characteristics that determined how many eligible settlements a district had and when it received funding also affect outcomes and are therefore conditioned on; unobserved local selection, concurrent policies and shocks, including the COVID-19 pandemic, are the main threats to identification and are addressed through the design and the checks described below.
5.2. Staggered Difference-in-Differences
Let Gd denote the first year with a recorded allocation in district d and Ydt an outcome. Because nearly all rural districts were eventually funded, identification comes from differences in the timing of entry. Following Callaway and Sant'Anna [55], the parameter of interest is the group-time average treatment effect on the treated:
identified under two assumptions. The first is conditional parallel trends: conditional on the 2018 covariates, the average outcome of districts first funded in year g would have evolved like that of districts not yet funded in year t. Because larger districts were funded first (Section 6.1), unconditional comparisons are confounded by district size, and the assumption is plausible only after conditioning on size, rural share, wages and night-time light; it cannot be tested directly, and the pre-trend tests and sensitivity bounds in Section 7.1 show how far conclusions depend on it. Conditioning also requires common support: for each funded cohort, comparable not-yet-funded districts must exist. Support is adequate for the 2019 and 2020 cohorts but limited for the 2021 cohort, which is compared with a small pool (Section 6.1). The second assumption is no anticipation, which we examine because budgets are adopted in December of the preceding year. Few districts remain unfunded after 2021, and districts without a recorded line are not a clean control group (Section 4.3). The main estimation window therefore ends in 2021, when the comparison pool still comprises 19 districts (39 in 2020); a window ending in 2022 is used as a check. Extending the staggered design to 2025 would require additional assumptions: after 2022 the only districts without a recorded allocation are those without a programme line, which may have been funded through other budgets, so later effects would be identified either by treating these districts as untreated or by extrapolating pre-treatment trends [82,94]; similar problems of sparse comparison groups arise in evaluations of rural development measures elsewhere [95]. We do not make these assumptions and treat later years descriptively (Section 8). Treatment is absorbing: once a district has been funded, it remains in the treated group. We report an unconditional specification and a doubly robust specification [56] that conditions on the 2018 covariates listed in Section 4.4. Group-time effects are aggregated into an overall ATT, weighting by cohort size, and into event-time effects
which are plotted with pointwise 95% confidence intervals. With a window ending in 2021, post-treatment effects are identified mainly for e = 0 and e = 1, so all estimates refer to the short run.
ATT(g, t) = E[Ydt(g) − Ydt(0) | Gd = g],
θ(e) = Σg 1{g + e ≤ T} P(G = g | G + e ≤ T) ATT(g, g + e),
5.3. Imputation Estimator and COVID-19
As an alternative estimator, we implement the imputation approach of Borusyak et al. [57]: unit and year effects are estimated on untreated observations only, untreated outcomes are imputed for treated observations, and the average difference over treated observations up to two years after entry is the ATT. A second version replaces year effects with oblast-by-year effects, so that funded districts are compared only with not-yet-funded districts of the same oblast in the same year. Both estimators avoid the comparisons between already-treated units that bias conventional two-way fixed-effects regressions when effects vary across cohorts [96,97,98]. The 2020 and 2021 cohorts entered during the COVID-19 pandemic. District-level pandemic indicators are not available, so we use two specifications that allow for it: oblast-by-year effects, which absorb shocks common to districts of the same oblast, including regional lockdowns, and estimates that exclude 2020 from the estimation sample.
5.4. Spillovers
If programme projects affected neighbouring districts, for example through commuting or the use of new facilities, not-yet-funded districts next to funded ones would be contaminated controls. Using the list of districts that share a boundary (Section 4.1), we classify a district-year as exposed when at least one neighbouring district has a recorded allocation in that year or earlier. Within the imputation framework with district and year effects, we then (a) impute untreated outcomes only from observations that are both untreated and unexposed, and (b) estimate the spillover as the average difference between observed and imputed outcomes of untreated but exposed district-years. Standard errors come from a district bootstrap with 199 replications.
5.5. Diagnostics and Inference
We assess identification with six diagnostics. First, we report standardised mean differences (SMDs) of the 2018 covariates between each cohort and its comparison pool, before and after inverse-probability weighting by the estimated propensity score, together with the overlap of propensity scores. Second, we test jointly whether the five pre-treatment event-time coefficients (e = −5, …, −1) are zero, using a Wald statistic based on the influence functions of the estimator. Third, because district budgets for year t are adopted in December of year t − 1, we report the coefficient for e = −1 separately and re-estimate the model allowing for one year of anticipation. Fourth, standard errors for the Callaway–Sant'Anna estimates are obtained by the multiplier bootstrap with 999 replications and clustering by district. Because funding was allocated through oblasts and there are only 14 oblasts in the sample, we also report wild cluster bootstrap p-values and confidence intervals with the oblast as cluster, using the six-point weights of Webb [58] and 9999 replications applied to the influence function of the estimator. Fifth, we report minimum detectable effects (MDEs) at 80% power and a 5% significance level, computed as 2.8 times the standard error, to show which effect sizes the design could have detected [99]. Sixth, because pre-trend tests have limited power and passing them does not establish parallel trends [100], we compute the sensitivity bounds of Rambachan and Roth [59]. For this purpose the event study is re-estimated with a fixed reference period (e = −1), which leaves the post-period coefficients unchanged, and the pre-period coefficients e = −5, …, −2 are used, the same pre-treatment years as in the Wald test. We report robust 95% confidence sets for the average of the effects in the year of first funding and one year later under two restrictions on the post-treatment violation of parallel trends: relative magnitudes (ΔRM), under which the violation between consecutive post-treatment periods is at most M̄ times the largest such violation before treatment, and smoothness (ΔSD), under which the slope of the differential trend changes by at most M per period; M = 0 allows a linear differential trend. The ΔRM sets use the conditional least-favourable construction and the ΔSD intervals the fixed-length construction described in [59]. Both were computed in Python and checked against reference values from the R package HonestDiD of Rambachan and Roth (Supplementary File S2).
5.6. Descriptive Allocation Gradient (H5)
H5 is examined with conditional associations, not with a causal design. Within the estimation window, outcomes are related to cumulative recorded allocations per rural resident (in tens of thousands of tenge) for 2012–2021, with district and year (or oblast-by-year) fixed effects (Section 7.5). After the window, long differences relate the change in each outcome from 2018 to the latest available year to the cumulative allocation for 2019–2025, conditional on the 2018 covariates and oblast fixed effects, for the districts with decisions and per-resident amounts for every year (Section 8.3). Supplementary specifications use the number of funded years, current and development spending separately, the mean cumulative allocation of neighbouring districts as a simple spatial lag [101], interactions with above-median 2018 rural population and wages, and panel regressions with the annual allocation and its first and second lags (Supplementary File S3). A causal dose–response interpretation would require stronger assumptions than the binary design, because districts that received more may differ in how they would have responded [102]. In addition, allocation amounts may respond to local conditions; recorded allocations are plans, so random errors in amounts attenuate the associations; and amounts per rural resident rise mechanically when the rural population falls, which biases the association with population downwards. All intensity coefficients are therefore reported as descriptive conditional associations.
6. Results
6.1. Roll-Out and Selection
Figure 2 shows the roll-out of recorded programme allocations across the 135 rural districts of the main sample. By the end of 2020, 96 districts had received a first allocation (Table 2). Among funded districts, the median recorded allocation in the first year was about KZT 14 thousand per rural resident, compared with an average monthly wage of about KZT 103 thousand in 2018. Table 4 compares districts by year of entry. Early entrants were much larger: districts first funded in 2019 had on average 55.0 thousand rural residents in 2018, compared with 25.6 thousand in districts first funded in 2021–2023. Average wages and unemployment rates differed little across groups. The timing of funding was therefore strongly related to district size and rural share.
Covariate balance between each cohort and its comparison pool is reported in Table S1 (Supplementary File S3). Before weighting, the largest absolute standardised mean difference among the model covariates is 0.87 for the 2019 cohort, 0.68 for the 2020 cohort and 1.03 for the 2021 cohort, mainly because of differences in rural population and rural share. Propensity-score weighting reduces it to 0.26, 0.19 and 0.38, respectively. Balance is therefore acceptable for the two large cohorts but remains imperfect for the 2021 cohort, which is compared with a small pool of 19 districts. Common support is also limited for later cohorts: 9 districts of the 2020 cohort and 13 of the 2021 cohort have propensity scores outside the range observed in their comparison pool, and Section 7.3 shows that excluding them does not change the conclusions.
6.2. Average Effects
Table 5 reports the average effects. Without covariates, recorded allocations are associated with a 0.031 log-point higher average wage (95% CI 0.007 to 0.055), a 0.082 percentage point higher unemployment rate, 0.040 log points more active individual entrepreneurs and −0.394 log points lower fixed investment financed from local budgets. Most of these differences disappear once the 2018 characteristics of districts are taken into account, consistent with the selection documented above. In the doubly robust specification, the estimated effect on rural night-time light is 0.021 log points (95% CI −0.035 to 0.076), on the average wage 0.008 (95% CI −0.006 to 0.022), on net migration −0.495 per 1000 residents (95% CI −3.729 to 2.740) and on log rural population −0.003 (95% CI −0.009 to 0.002). Effects on fixed investment are imprecisely estimated and centred near zero. The imputation estimator with oblast-by-year effects gives the same qualitative picture, with a positive but imprecise estimate for night-time light (0.062, standard error 0.059).
The doubly robust estimate for the unemployment rate is 0.068 percentage points (95% CI 0.000 to 0.135). It is not significant with the wild cluster bootstrap by oblast (p = 0.10) or in the imputation estimator, it falls to 0.020 when the window is extended to 2022, and it changes sign when one year of anticipation is allowed (Section 7.1). For active individual entrepreneurs, the doubly robust estimate is negative (−0.031) while the imputation estimate is positive (0.038); this indicator has only one pre-programme year, so its pre-trends cannot be tested. We therefore do not interpret either outcome as evidence of a programme effect. No robust short-run district-level effect was detectable using the available administrative and satellite indicators.
6.3. Dynamics
Figure 3 plots the event-time estimates from the doubly robust specification. Before funding, the coefficients for night-time light, wages, unemployment and migration fluctuate around zero. In the year of first funding, the estimate for night-time light is −0.019 (standard error 0.028); one year later it is 0.126 (0.056). This second-year estimate rests mainly on comparisons of the 2019 and 2020 cohorts with the small group of districts funded from 2021 onwards, and it is not reproduced when the window is extended to 2022 (0.013, standard error 0.057). Wages, unemployment and migration show no clear change after funding.
7. Diagnostics and Robustness
7.1. Pre-Trends, Anticipation and Inference
Table 6 reports the diagnostics for the four main outcomes. The joint Wald tests do not reject the hypothesis that the five pre-treatment coefficients are zero (p = 0.47 for night-time light, 0.15 for wages, 0.48 for unemployment and 0.32 for net migration). The coefficient for the year before funding is not significant for night-time light, wages or migration; for unemployment it is −0.102 (p = 0.07), and allowing one year of anticipation turns the unemployment estimate negative (−0.182, standard error 0.076). The positive unemployment estimate in Table 5 is therefore not robust to the timing assumption. The wild cluster bootstrap with 14 oblast clusters gives p-values of 0.49 for night-time light, 0.34 for wages, 0.10 for unemployment and 0.73 for migration. The unconditional wage estimate remains significant with oblast clustering (p < 0.001), which indicates that the difference between the unconditional and covariate-adjusted results reflects selection rather than imprecision.
The lower part of Table 6 shows how far conclusions depend on exact parallel trends. For wages and net migration, the average effect in the first two years is not distinguishable from zero under parallel trends, and the robust sets only widen as violations are allowed: for wages they contain changes from about −0.031 to 0.047 log points with M̄ = 1. For net migration the sets become very wide, and with M̄ = 1 the set is not bounded within the search range, because the pre-period coefficients are themselves imprecise. For night-time light, the second-year estimate that is significant under parallel trends (95% CI 0.029 to 0.224) remains so only for small violations: its ΔRM set excludes zero up to M̄ = 0.5 but not at M̄ = 0.75, and the ΔSD interval excludes zero with a linear differential trend (0.001 to 0.184) but not with M = 0.5 SE. The average unemployment effect behaves similarly: its ΔRM set excludes zero only up to M̄ = 0.1, and its ΔSD interval (0.007 to 0.152 with a linear trend) includes zero with M = 0.5 SE. These estimates therefore rest on parallel trends holding almost exactly, which the anticipation check above already questions for unemployment. When all available pre-periods are used, the earliest coefficients are estimated from single cohorts and are very imprecise, and the ΔRM sets for all four outcomes reach the edge of the search range from M̄ = 1 (Supplementary File S2).
7.2. COVID-19 and Oblast-Level Shocks
Specifications that allow for oblast-level shocks, including those caused by the COVID-19 pandemic, lead to the same conclusion (Table S2 in Supplementary File S3). With oblast-by-year effects, the imputation estimates are 0.062 for night-time light, 0.005 for wages, 0.110 for unemployment and 0.358 for net migration, and none is significant with standard errors from a district bootstrap. Excluding 2020 from the estimation sample gives 0.019 (0.072) for night-time light and 0.011 (0.013) for wages (standard errors in parentheses). The only estimate that becomes significant in these checks is that for unemployment with oblast-by-year effects when the bootstrap resamples oblasts (standard error 0.046); given the pre-period dip and the anticipation result in Section 7.1, we do not regard this as evidence of a programme effect.
7.3. Misclassification, Common Support and Sample Composition
The results are not sensitive to the treatment-timing errors described in Section 4.3 (Table S2). Using the alternative treatment date that also counts transfers mentioned in the text of budget decisions, assigning districts without a programme line to 2020, excluding these districts or excluding districts with uncertain timing changes the doubly robust estimates for night-time light, wages and migration very little. When the recorded first year of 10% to 30% of districts is shifted at random by one year, the simulated estimates remain centred close to the baseline (Table S2). Excluding the 22 funded districts outside the region of common support gives estimates of −0.022 (0.047) for night-time light and 0.010 (0.007) for wages, and leaving out one oblast at a time, the estimate for night-time light ranges from −0.034 to 0.036 and that for wages from 0.002 to 0.022.
7.4. Spillovers to Neighbouring Districts
Spillovers to neighbouring districts do not change the conclusion (Table S2). When untreated outcomes are imputed only from untreated district-years without a funded neighbour, the estimated effect on night-time light is 0.020 (0.093) and that on wages 0.023 (0.052) (standard errors in parentheses). Because most not-yet-funded districts had a funded neighbour from 2020 onwards, this specification can impute outcomes for only 140 of the 256 funded district-years and is correspondingly less precise. The estimated spillover on not-yet-funded districts with a funded neighbour is 0.008 (0.064) for night-time light, 0.008 (0.031) for wages, −0.054 (0.071) for unemployment and −2.141 (3.338) for net migration; none is statistically significant.
7.5. Descriptive Allocation Gradient within the Estimation Window
Table S3 (Supplementary File S3) relates outcomes in 2012–2021 to cumulative recorded allocations per rural resident. Districts with an additional KZT 10 thousand per rural resident had 0.027 log points more rural night-time light (standard error 0.014; 0.026 with oblast-by-year effects), and the associations with wages, unemployment, migration and population are close to zero. These coefficients are descriptive conditional associations (Section 5.6). They show that night-time light was somewhat higher where recorded allocations were larger, but they do not identify the effect of additional spending, and they are not confirmed by the causal estimates in Table 5.
8. Post-Estimation-Window Descriptive Evidence, 2023–2025
The causal estimates in Section 6 and Section 7 refer to the first one or two years after entry. This section describes how outcomes developed after the estimation window, while targeted financing continued until 2025, up to the latest year published (2025 for wages, unemployment, local-budget investment and rural population; 2024 for night-time light, net migration and individual entrepreneurs; no outcome data for 2026 have been published). Because almost all districts had been funded by then, none of the comparisons in this section has a counterfactual interpretation.
8.1. Outcome Trajectories by Entry Group
Figure 4 plots group means from 2012 to the latest year, and Table S4 (Supplementary File S3) reports mean changes before and after 2021. Rural night-time light grew in all groups. Between 2018 and 2021 it grew by 0.544 log points in districts first funded in 2019 and by 0.442 in districts first funded in 2021–2023, and between 2021 and 2024 the order was reversed (0.361 and 0.457). Average wages grew almost identically in all groups, by 0.537 to 0.557 log points between 2021 and 2025, and unemployment declined in every group. Rural population fell in all groups and fell faster in the smaller districts funded later or without a programme line (−0.144 and −0.218 log points between 2021 and 2025, against −0.060 in the 2019 cohort), continuing differences visible before the programme (Figure 4d). The group without a programme line is not an unfunded group in these years: 8 of its 9 districts recorded an allocation in 2023–2025. Overall, the trajectories do not show a divergence in favour of early entrants after the estimation window.
8.2. Allocations Recorded for 2026
District budgets continued to record allocations to the programme in 2026, after the switch to financing through general-purpose transfers [43], but on a smaller scale (Figure 2b,c). In the 126 districts of the main sample covered in both 2025 and 2026, the recorded allocations for 2026 amount to KZT 23.0 billion, 31% of the KZT 74.9 billion recorded for 2025. A programme line appears in 60 of the 133 districts covered in 2026, against 106 of 128 in 2025, and the median allocation per rural resident among districts with a line was KZT 7.5 thousand, against 14.8 thousand. Because outcomes for 2026 are not yet published, these allocations are not related to outcomes.
8.3. Descriptive Allocation Gradient over 2019–2025 (H5)
For the 114 districts of the main sample with decisions and per-resident amounts for every year from 2019 to 2025, cumulative recorded allocations averaged KZT 94 thousand per rural resident (median 83 thousand; 90th percentile 174 thousand). In the long differences (Table S5 in Supplementary File S3), districts with an additional KZT 10 thousand per rural resident had 0.003 log points faster wage growth between 2018 and 2025 (standard error 0.001), or about 3.1% at the mean cumulative allocation. The association is of similar sign for current and for development spending, for the cumulative allocation for 2019–2022 in all districts (0.006) and for the number of funded years (0.012), and in panel regressions with the allocation and its two lags (sum of coefficients 0.014, standard error 0.003). For night-time light, unemployment and rural population, the long-difference associations are close to zero, with minimum detectable associations of 0.008, 0.015 and 0.003 per KZT 10 thousand; the allocation of neighbouring districts is not associated with any outcome, and none of the 12 interaction coefficients is significant at the 5% level.
H5 is therefore supported descriptively for wages only. The wage association is not found in the causal estimates for the first years after entry (Table 5), and it may reflect characteristics of districts that received larger per-resident allocations, such as their size or the timing of their entry, rather than consequences of the allocations. Because amounts per rural resident rise when the rural population falls, the negative association of allocations with rural population in the panel regressions (−0.018, standard error 0.006) is partly mechanical.
9. Discussion
9.1. Statistical Power and Interpretation of Null Results
Statistically insignificant estimates do not show that the programme had no effect [99]. They should be read together with the confidence intervals and the effects the design could detect. The minimum detectable effects in Table 6 are 0.078 log points for night-time light (about 8.1%), 0.019 for the average wage (about 1.9%), 0.088 percentage points for unemployment and 4.321 per 1000 residents for net migration. The design therefore had reasonable power to detect moderate changes in wages and night-time light at the district level, but not small ones. The 95% confidence intervals exclude increases in the average wage of more than about 2% and increases in rural night-time light of more than about 8% in the first years after funding. These intervals assume parallel trends. If post-treatment violations as large as the largest pre-treatment one are allowed (ΔRM, M̄ = 1), the confidence set for the average wage effect in the first two years widens to −0.031 to 0.047 log points (Table 6). Increases as large as the upper limits under parallel trends would be plausible only if programme spending were large relative to district economies, whereas the median first-year allocation was about KZT 14 thousand per rural resident, against an average monthly wage of about KZT 103 thousand in 2018. Smaller effects, and effects that emerge only after several years, cannot be ruled out.
9.2. Spatial Aggregation, Unmeasured Outcomes and the Observation Period
Three features of the data limit what the design can detect. First, programme projects were concentrated in selected support and satellite villages, which account for only part of each district's population. If effects arise only in funded settlements that contain a share s of a district's population (or rural light), the district effect is approximately s times the settlement effect, so the minimum detectable effect at the settlement level is the district-level minimum detectable effect divided by s; effects may also be offset if activity moved from neighbouring villages. With s = 0.8, the programme's target coverage of rural residents for 2025 [40], the design could have detected settlement-level effects of about 2.4% on wages and 10.2% on rural night-time light; with s = 0.5 these thresholds rise to about 3.8% and 16.8%, and with s = 0.25 to about 7.8% and 36.3%. Settlement-level effects below these thresholds are compatible with our results. The implementation reports on the Open Budgets portal (Section 4.3) contain 49 result indicators naming individual projects in 23 districts, of which 69% name a settlement [87]; these records are too few to construct settlement-level outcomes.
Second, the outcomes are economic foundations of social well-being (Section 2.3), not the condition of the infrastructure built, the use of new facilities or the subjective well-being of rural residents. Official statistics on incomes and living conditions are published only by oblast [93], and the district statistics available for this study (Table 3) contain no indicators of infrastructure quality or subjective well-being. The programme may have improved these dimensions even where district economic aggregates did not change.
Third, the post-treatment period is short. Comparisons with not-yet-funded districts are possible only for the first one or two years after entry, whereas roads, water supply and social facilities may affect economic outcomes with a delay. In the window ending in 2022, the doubly robust estimator cannot be computed beyond the year after entry, because the comparison group shrinks to 11 districts. Estimates without covariates for two and three years after entry (for wages three years after entry, 0.072, standard error 0.029; for night-time light −0.035, 0.096) compare the large early-funded districts with this small group, are subject to the selection documented in Section 6.1, and are not interpreted as effects. The descriptive evidence in Section 8 cannot replace a comparison group for the later years.
9.3. Interpretation in Light of the Literature
Several features of the programme are consistent with small short-run effects on economic outcomes. First, most projects concerned intra-village roads [70]. Even new rural roads have been found to reallocate labour rather than to raise consumption substantially [17], and the returns to road investment depend on road quality and maintenance [71]. Second, single investments tend to have limited effects unless they are combined with complementary services [25]. Third, the programme was aimed mainly at living conditions and services, which in the capability approach are welfare outcomes in their own right [48,49] and which district statistics do not measure. The absence of a detectable migration response is consistent with the ambiguous theoretical prediction that better infrastructure can both retain residents and lower the cost of leaving [26].
9.4. Relevance beyond Kazakhstan and Scope of the Findings
Most of the findings are specific to Kazakhstan's institutional setting: rural districts depend heavily on transfers from higher-level budgets [36], programme funds were distributed from the republican budget to oblasts by government resolution and spent through district budgets [61], and larger districts were funded first. Where local governments raise more of their own revenue, or select projects through competitive or participatory procedures, both the allocation of funds and its consequences may differ, so the estimates should not be read as evidence about place-based rural investment in general.
Two contributions are transferable. The first is methodological: where project-level data are not released, programme exposure can be reconstructed from adopted and amended local budgets, which record the timing and size of allocations for every district; the same approach can be applied wherever local budget decisions are published. The second concerns evaluation policy: with district aggregates, even a large programme may leave no detectable short-run trace, so territorial policies that finance projects in selected settlements can be evaluated only if settlement-level records of projects, expenditure and service quality are kept and published.
10. Policy Implications
From 2026, projects of this kind are financed from local budgets through general-purpose transfers [43]. The findings suggest that this transition should be accompanied by measures that make future spending evaluable. The Supreme Audit Chamber has already noted that no systematic record of project characteristics, such as cost, implementation period and capacity, is kept either by central administrators or by local executive bodies [45]. We propose six measures.
First, an open registry of projects at the settlement level should record, for every project, the settlement and its classifier code, the type of facility, the implementing body and the budget programme from which it is financed. Second, actual expenditure and the start and completion dates of each project should be published for all administrators, not only planned allocations, so that execution can be compared with plans; the implementation reports now on the Open Budgets portal cover only part of the administrators and years (Section 4.3). Third, project sites should be geocoded, which would allow evaluations based on satellite data and on distances to services. Fourth, baseline indicators of infrastructure and service provision should be recorded in each settlement before projects begin. Fifth, the quality and use of services, such as road condition, water supply reliability and the use of new social facilities, should be measured after completion, because these are the outcomes through which the programme was expected to improve social well-being. Sixth, the programme should be re-evaluated three to five years after the end of dedicated financing, when longer-run effects on population, employment and entrepreneurship can be observed. Together, these measures would strengthen budget accountability and allow local governments to direct rural investment to the settlements where it has the largest effect.
A recent pilot illustrates a possible shift from infrastructure support for territories towards targeted support for rural families. In October 2026 the Ministry of National Economy announced the pilot project “Rural Development Team” in Turkestan, Zhambyl, West Kazakhstan, Pavlodar and Kostanay oblasts [103]. Teams of specialists in employment, entrepreneurship, agriculture and social and legal assistance are to work individually with each family to help its members find jobs, acquire skills, start their own businesses and raise their incomes, with a “village manager” coordinating the work at district level; preferential microcredit at 2.5% per year under the Auyl Amanaty project is to be one of its instruments [103]. The pilot was launched after the period studied here and is not used in our analysis. Because the pilot targets household incomes, employment and entrepreneurship, which are the economic foundations examined in this article, its effects could be evaluated if baseline indicators were recorded and outcome data published from the start, as proposed above.
11. Limitations
The main limitations follow from the data and the timing of the programme. The causal estimates cover only the first one or two years after funding (Section 9.2), balance and common support are weaker for the 2021 cohort (Section 6.1), and the sensitivity bounds show that some estimates depend on parallel trends holding almost exactly (Section 7.1). Exposure is measured from planned allocations rather than audited expenditure, funds passed through rural okrug or oblast budgets are not observed, and actual expenditure could be checked only for 108 implementation reports covering 50 districts (Section 4.3). Outcomes are measured at the district level, whereas projects were implemented in particular villages, and the condition of the infrastructure, the use of new facilities and subjective well-being are not observed (Section 9.2). Recorded allocations for 2024–2026 are missing for a few districts whose decisions were not found in Adilet; the business indicators have at most one pre-programme year; net migration for 2015–2022 is derived from population changes; net migration, individual entrepreneurs and night-time light are not yet available for 2025, and no outcome data for 2026. Many intensity coefficients were estimated, so a few conventionally significant ones would be expected by chance. The programme coincided with other rural support measures and with the COVID-19 pandemic, which year and oblast-by-year effects absorb only insofar as they did not vary with the timing of funding. Finally, the evidence comes from a single country (Section 9.4).
12. Conclusions
This paper assesses the early stage of Kazakhstan's Auyl–El Besigi programme. Programme exposure was reconstructed from 1106 final amended budget decisions for the main sample of 135 rural districts, drawn from a broader collection of 1298 distinct decisions for 2019–2026, and linked to official statistics and night-time lights. Districts funded earlier were systematically larger, and after accounting for this selection the causal short-run estimates for night-time light, wages, unemployment, migration and population are small and imprecise. No robust short-run district-level effect was detectable using the available administrative and satellite indicators. This conclusion holds in the robustness checks, but the confidence intervals and minimum detectable effects show that smaller, later or more localised effects cannot be excluded, so the results do not show that the programme was ineffective. Descriptively, outcome trends after the estimation window were similar across entry groups, and larger recorded allocations coincided with faster wage growth but not with changes in the other outcomes. Effects within funded villages, on the quality and use of infrastructure and services, and in the longer run remain open questions; answering them requires settlement-level records of projects, expenditure and service outcomes, which would also strengthen the accountability of rural investment now financed from local budgets.
Supplementary Materials
The following supporting information can be downloaded at the website of this paper posted on Preprints.org. File S1: District–year panel, analysis sample, list of the 732 district budget decisions for 2019–2023 with links, programme budget lines, recorded allocations and 480 decisions for 2023–2025 and 167 decisions for 2026–2028, 177 reports on the implementation of Auyl–El Besigi budget programmes from the Open Budgets portal with their project indicators, district adjacency and data dictionary (Excel workbook); File S2: Reproducible code (Python), with Part A rebuilding File S1 from the collected raw data and Part B reproducing all estimates, tables and figures from File S1; File S3: Additional tables (Table S1: covariate balance by cohort; Table S2: robustness of the average effects, including misclassification simulations and spillover checks; Table S3: descriptive allocation gradient, 2012–2021; Table S4: mean change in outcomes by entry group; Table S5: allocation intensity and subsequent outcome changes, all specifications).
Author Contributions
Conceptualization, B.A., A.M. (Aisulu Moldabekova) and A.M. (Aigul Myltykbayeva); methodology, B.A. and A.M. (Aisulu Moldabekova); software, B.A.; validation, B.A. and A.M. (Aigul Myltykbayeva); formal analysis, B.A.; investigation, B.A.; resources, B.A. and A.M. (Aisulu Moldabekova); data curation, B.A.; writing—original draft preparation, B.A.; writing—review and editing, A.M. (Aisulu Moldabekova) and A.M. (Aigul Myltykbayeva); visualization, B.A.; supervision, A.M. (Aisulu Moldabekova); project administration, A.M. (Aigul Myltykbayeva). All authors have read and agreed to the published version of the manuscript.
Funding
This research received no external funding.
Institutional Review Board Statement
Not applicable.
Informed Consent Statement
Not applicable.
Data Availability Statement
All data used in this study are publicly available from the Taldau information and analytical system of the Bureau of National Statistics of the Republic of Kazakhstan (https://taldau.stat.gov.kz), the Adilet legal information system (https://adilet.zan.kz), the Open Budgets portal (https://budget.egov.kz), Zenodo (https://doi.org/10.5281/zenodo.17294744) and geoBoundaries (https://www.geoboundaries.org). The compiled district–year panel, the registers of the 732 district budget decisions for 2019–2023, 480 decisions for 2023–2025 and 167 decisions for 2026–2028 with links to their texts, the 177 Open Budgets implementation reports with links, and the reproducible analysis code are provided in Supplementary Files S1 and S2.
Acknowledgments
This article is part of the doctoral research of Bauyrzhan Antonov on the topic “Social Well-Being of the Rural Population in Kazakhstan: Assessment and Economic Mechanisms for Improvement”. The authors gratefully acknowledge the institutional support of Al-Farabi Kazakh National University; the Institute of Economics, Science Committee of the Ministry of Science and Higher Education of the Republic of Kazakhstan; the International University of Transportation and Humanities; and Narxoz University (all in Almaty, Kazakhstan).
Conflicts of Interest
The authors declare no conflicts of interest.
Abbreviations
The following abbreviations are used in this manuscript:
| ATT | Average treatment effect on the treated |
| CI | Confidence interval |
| DR | Doubly robust |
| KZT | Kazakhstani tenge |
| MDE | Minimum detectable effect |
| SE | Standard error |
| SMD | Standardised mean difference |
| VIIRS | Visible Infrared Imaging Radiometer Suite |
References
- Barca, F.; McCann, P.; Rodríguez-Pose, A. The case for regional development intervention: Place-based versus place-neutral approaches. J. Reg. Sci. 2012, 52, 134–152. [Google Scholar] [CrossRef]
- Iammarino, S.; Rodríguez-Pose, A.; Storper, M. Regional inequality in Europe: Evidence, theory and policy implications. J. Econ. Geogr. 2019, 19, 273–298. [Google Scholar] [CrossRef]
- Rodríguez-Pose, A. The revenge of the places that don't matter (and what to do about it). Camb. J. Reg. Econ. Soc. 2018, 11, 189–209. [Google Scholar] [CrossRef]
- Kline, P.; Moretti, E. People, places, and public policy: Some simple welfare economics of local economic development programs. Annu. Rev. Econ. 2014, 6, 629–662. [Google Scholar] [CrossRef]
- Neumark, D.; Simpson, H. Place-based policies. In Handbook of Regional and Urban Economics; Duranton, G., Henderson, J.V., Strange, W.C., Eds.; Elsevier: Amsterdam, The Netherlands, 2015; Volume 5B, pp. 1197–1287. [Google Scholar] [CrossRef]
- Moretti, E. Place-based policies and geographical inequalities. Oxf. Open Econ. 2024, 3, i625–i633. [Google Scholar] [CrossRef]
- Kline, P.; Moretti, E. Local economic development, agglomeration economies, and the big push: 100 years of evidence from the Tennessee Valley Authority. Q. J. Econ. 2014, 129, 275–331. [Google Scholar] [CrossRef]
- Busso, M.; Gregory, J.; Kline, P. Assessing the incidence and efficiency of a prominent place based policy. Am. Econ. Rev. 2013, 103, 897–947. [Google Scholar] [CrossRef]
- Becker, S.O.; Egger, P.H.; von Ehrlich, M. Going NUTS: The effect of EU Structural Funds on regional performance. J. Public Econ. 2010, 94, 578–590. [Google Scholar] [CrossRef]
- Becker, S.O.; Egger, P.H.; von Ehrlich, M. Absorptive capacity and the growth and investment effects of regional transfers: A regression discontinuity design with heterogeneous treatment effects. Am. Econ. J. Econ. Policy 2013, 5, 29–77. [Google Scholar] [CrossRef]
- Rodríguez-Pose, A.; Garcilazo, E. Quality of government and the returns of investment: Examining the impact of cohesion expenditure in European regions. Reg. Stud. 2015, 49, 1274–1290. [Google Scholar] [CrossRef]
- von Ehrlich, M.; Overman, H.G. Place-based policies and spatial disparities across European cities. J. Econ. Perspect. 2020, 34, 128–149. [Google Scholar] [CrossRef]
- Bachtrögler-Unger, J.; Dolls, M.; Krolage, C.; Schüle, P.; Taubenböck, H.; Weigand, M. EU cohesion policy on the ground: Analyzing small-scale effects using satellite data. Reg. Sci. Urban Econ. 2023, 103, 103954. [Google Scholar] [CrossRef]
- Bartik, T.J. Using place-based jobs policies to help distressed communities. J. Econ. Perspect. 2020, 34, 99–127. [Google Scholar] [CrossRef]
- Khandker, S.R.; Bakht, Z.; Koolwal, G.B. The poverty impact of rural roads: Evidence from Bangladesh. Econ. Dev. Cult. Change 2009, 57, 685–722. [Google Scholar] [CrossRef] [PubMed]
- Mu, R.; van de Walle, D. Rural roads and local market development in Vietnam. J. Dev. Stud. 2011, 47, 709–734. [Google Scholar] [CrossRef]
- Asher, S.; Novosad, P. Rural roads and local economic development. Am. Econ. Rev. 2020, 110, 797–823. [Google Scholar] [CrossRef]
- Aggarwal, S. Do rural roads create pathways out of poverty? Evidence from India. J. Dev. Econ. 2018, 133, 375–395. [Google Scholar] [CrossRef]
- Shamdasani, Y. Rural road infrastructure & agricultural production: Evidence from India. J. Dev. Econ. 2021, 152, 102686. [Google Scholar] [CrossRef]
- Dumas, C.; Játiva, X. Better roads, better off? Evidence on upgrading roads in Tanzania. World Bank. Econ. Rev. 2025, 39, 104–123. [Google Scholar] [CrossRef]
- Brahma, A.; Soundararajan, V. Do rural roads promote inclusive entrepreneurship? J. Econ. Behav. Organ. 2026, 241, 107381. [Google Scholar] [CrossRef]
- Dinkelman, T. The effects of rural electrification on employment: New evidence from South Africa. Am. Econ. Rev. 2011, 101, 3078–3108. [Google Scholar] [CrossRef]
- Lipscomb, M.; Mobarak, A.M.; Barham, T. Development effects of electrification: Evidence from the topographic placement of hydropower plants in Brazil. Am. Econ. J. Appl. Econ. 2013, 5, 200–231. [Google Scholar] [CrossRef]
- Duflo, E. Schooling and labor market consequences of school construction in Indonesia: Evidence from an unusual policy experiment. Am. Econ. Rev. 2001, 91, 795–813. [Google Scholar] [CrossRef]
- Gebresilasse, M. Rural roads, agricultural extension, and productivity. J. Dev. Econ. 2023, 162, 103048. [Google Scholar] [CrossRef]
- Morten, M.; Oliveira, J. The effects of roads on trade and migration: Evidence from a planned capital city. Am. Econ. J. Appl. Econ. 2024, 16, 389–421. [Google Scholar] [CrossRef]
- Oates, W.E. An essay on fiscal federalism. J. Econ. Lit. 1999, 37, 1120–1149. [Google Scholar] [CrossRef]
- Pomfret, R. The Central Asian Economies in the Twenty-First Century: Paving a New Silk Road; Princeton University Press: Princeton, NJ, USA, 2019. [Google Scholar] [CrossRef]
- Turganbayev, Y.; Diener, A.C. Kazakhstan's evolving regional economic policy: Assessing strategies of post-socialist development. Eurasian Geogr. Econ. 2018, 59, 657–684. [Google Scholar] [CrossRef]
- Rodríguez-Pose, A.; Bartalucci, F.; Rau, G. One Kazakhstan, multiple nations: On a growing regional divide amidst economic dynamism. Asia-Pac. J. Reg. Sci. 2025, 9, 629–651. [Google Scholar] [CrossRef]
- Nurlanova, N.; Alzhanova, F.; Saparbek, N.; Dnishev, F. Inclusive development: Assessment of regional inequality in Kazakhstan and measures to reduce it. Probl. Perspect. Manag. 2023, 21, 734–743. [Google Scholar] [CrossRef]
- Sermagambet, U.; Satpayeva, Z.; Smagulova, G.; Urban, W.; Yessenzhigitova, R. Socio-economic inequality in Kazakhstani regions: Assessment and impact on regional development management. Probl. Perspect. Manag. 2022, 20, 487–500. [Google Scholar] [CrossRef]
- Duisen, G.; Aidarkhanova, G.; Kelinbayeva, R.; Aitzhanova, D.; Dyldaev, M.; Tojiyeva, Z. Spatial differentiation of human capital across Kazakhstan's regions: A composite index with GIS-based mapping. Sustainability 2025, 17, 11000. [Google Scholar] [CrossRef]
- Tleuberdinova, A.; Nurlanova, N.; Andreyeva, G.; Alzhanova, F. Regional and sectoral wage disparities as a reflection of inequality: The case of Kazakhstan. Probl. Perspect. Manag. 2024, 22, 444–459. [Google Scholar] [CrossRef]
- OECD. Regional Policies to Support Diversification and Productivity Growth in Kazakhstan; OECD Publishing: Paris, France, 2020. [Google Scholar] [CrossRef]
- Kalymbetova, A.; Tubekova, D.; Tazhibayeva, R.; Kaltayeva, S.; Keneshbayev, B. Fiscal decentralization and rural ecotourism: Assessing the capacity of local budgets to improve life quality in Kazakhstan. Public Munic. Financ. 2026, 15, 115–128. [Google Scholar] [CrossRef]
- Government of the Republic of Kazakhstan. Resolution No. 270 of 28 March 2023 On Approval of the Concept for the Development of Rural Territories of the Republic of Kazakhstan for 2023–2027. Available online: https://adilet.zan.kz/rus/docs/P2300000270 (accessed on 29 October 2026).
- Accounts Committee for Control over Execution of the Republican Budget. Conclusion on the Report of the Government of the Republic of Kazakhstan on the Execution of the Republican Budget for 2021; Nur-Sultan, Kazakhstan, 2022. Available online: https://www.gov.kz/uploads/2022/6/27/d87b2d7b5f173a8f4757abf15464381d_original.8070539.pdf (accessed on 29 October 2026).
- Kireyeva, A.A.; Vasa, L.; Nurlanova, N.K.; Lee, J.W.; Moldabekova, A. Factors causing depopulation of vulnerable regions: Evidence from Kazakhstan, 2009–2019. Reg. Stat. 2023, 13, 559–580. [Google Scholar] [CrossRef]
- Prime Minister of the Republic of Kazakhstan. Improving the Quality of Rural Life: By 2025 the “Auyl–El Besigi” Project Will Cover 80% of All Rural Residents. 29 April 2019. Available online: https://primeminister.kz/ru/improving-quality-of-life-in-rural-areas-project-aul-el-besigi-to-cover-80-of-all-rural-residents-by-2025-18350 (accessed on 29 October 2026).
- Ministry of National Economy of the Republic of Kazakhstan and Other Ministries. Joint Order On Approval of the System of Regional Standards for Settlements. (MNE Order No. 29 of 20 April 2019 et al.; State Registration No. 18592 of 26 April 2019; repealed by Joint Order of 5 May 2026 No. 47 et al.). Available online: https://adilet.zan.kz/rus/docs/V1900018592 (accessed on 29 October 2026).
- Ministry of National Economy of the Republic of Kazakhstan. Order No. 81 of 13 September 2019 On Approval of Criteria for Determining Rural Settlements. (State Registration No. 19394 of 18 September 2019; repealed by Order No. 72 of 30 July 2025). Available online: https://adilet.zan.kz/kaz/docs/V1900019394 (accessed on 29 October 2026).
- Ministry of National Economy of the Republic of Kazakhstan. A New Impulse for the Development of Kazakhstan's Regions: Infrastructure, Jobs and Rural Support. 12 March 2026. Available online: https://www.gov.kz/memleket/entities/economy/press/news/details/1179266?lang=ru (accessed on 29 October 2026).
- Rau, A.P. Co-Report at the Government Hour, Mazhilis of the Parliament of the Republic of Kazakhstan, 28 February 2022. Available online: https://parlam.kz/mazhilis/download/18200 (accessed on 29 October 2026).
- Supreme Audit Chamber of the Republic of Kazakhstan. Conclusion of the Supreme Audit Chamber on the Report of the Government of the Republic of Kazakhstan on the Execution of the Republican Budget for 2023; Approved by Resolution of the Mazhilis of the Parliament No. 17-VIII-PRK of 21 June 2024; Section 2.5. pp. 251–258. Available online: https://www.gov.kz/uploads/2024/6/24/9fb806d6f5c9e71055ae5213099d9478_original.4559373.pdf (accessed on 29 October 2026).
- Kalykova, B.B. Rural territories of Kazakhstan: Realities, problems and solutions. Probl. AgriMarket (In Russian) 2020, (3), 209–215. [Google Scholar] [CrossRef]
- Chulanova, Z.; Brimbetova, N.; Satybaldin, A.; Dzhanegizova, A. Poverty in the Kazakhstan regions: Assessing the influence of key indicators on differences in its level. Sustainability 2024, 16, 6752. [Google Scholar] [CrossRef]
- Sen, A. Development as Freedom; Oxford University Press: Oxford, UK, 1999. [Google Scholar]
- Robeyns, I. The capability approach: A theoretical survey. J. Hum. Dev. 2005, 6, 93–117. [Google Scholar] [CrossRef]
- Institute of Legislation and Legal Information of the Republic of Kazakhstan. Adilet Legal Information System of Regulatory Legal Acts: Decisions of District Maslikhats on District Budgets for 2019–2021 to 2023–2025. Available online: https://adilet.zan.kz (accessed on 29 October 2026).
- Bureau of National Statistics of the Agency for Strategic Planning and Reforms of the Republic of Kazakhstan. Taldau Information and Analytical System. Available online: https://taldau.stat.gov.kz (accessed on 29 October 2026).
- Henderson, J.V.; Storeygard, A.; Weil, D.N. Measuring economic growth from outer space. Am. Econ. Rev. 2012, 102, 994–1028. [Google Scholar] [CrossRef] [PubMed]
- Donaldson, D.; Storeygard, A. The view from above: Applications of satellite data in economics. J. Econ. Perspect. 2016, 30, 171–198. [Google Scholar] [CrossRef]
- Gibson, J.; Olivia, S.; Boe-Gibson, G.; Li, C. Which night lights data should we use in economics, and where? J. Dev. Econ. 2021, 149, 102602. [Google Scholar] [CrossRef]
- Callaway, B.; Sant'Anna, P.H.C. Difference-in-differences with multiple time periods. J. Econom. 2021, 225, 200–230. [Google Scholar] [CrossRef]
- Sant'Anna, P.H.C.; Zhao, J. Doubly robust difference-in-differences estimators. J. Econom. 2020, 219, 101–122. [Google Scholar] [CrossRef]
- Borusyak, K.; Jaravel, X.; Spiess, J. Revisiting event-study designs: Robust and efficient estimation. Rev. Econ. Stud. 2024, 91, 3253–3285. [Google Scholar] [CrossRef]
- Webb, M.D. Reworking wild bootstrap-based inference for clustered errors. Can. J. Econ. 2023, 56, 839–858. [Google Scholar] [CrossRef]
- Rambachan, A.; Roth, J. A more credible approach to parallel trends. Rev. Econ. Stud. 2023, 90, 2555–2591. [Google Scholar] [CrossRef]
- Partridge, M.D.; Rickman, D.S. Distance from urban agglomeration economies and rural poverty. J. Reg. Sci. 2008, 48, 285–310. [Google Scholar] [CrossRef]
- Government of the Republic of Kazakhstan. Resolutions on the Implementation of the Laws on the Republican Budget: No. 808 of 7 December 2018 (as Amended by No. 203 of 17 April 2019); No. 908 of 6 December 2019; No. 840 of 10 December 2020; No. 872 of 9 December 2021; No. 987 of 6 December 2022; No. 1108 of 12 December 2023. Available online: https://adilet.zan.kz (accessed on 29 October 2026).
- Boadway, R.; Shah, A. Fiscal Federalism: Principles and Practice of Multiorder Governance; Cambridge University Press: Cambridge, UK, 2009. [Google Scholar] [CrossRef]
- Breglia, G.; Modica, M. A world of shocks: Mapping multi-shock and multilayer resilience, assessing resilience markers and drivers. Reg. Stud. 2025, 59, 2579631. [Google Scholar] [CrossRef]
- Kaufmann, D.; Kraay, A.; Mastruzzi, M. The Worldwide Governance Indicators: Methodology and analytical issues. Hague J. Rule Law 2011, 3, 220–246. [Google Scholar] [CrossRef]
- World Bank. Worldwide Governance Indicators, 2026 Update; World Bank: Washington, DC, USA, 2026; Available online: https://www.worldbank.org/en/publication/worldwide-governance-indicators (accessed on 29 October 2026).
- Aschauer, D.A. Is public expenditure productive? J. Monet. Econ. 1989, 23, 177–200. [Google Scholar] [CrossRef]
- Bom, P.R.D.; Ligthart, J.E. What have we learned from three decades of research on the productivity of public capital? J. Econ. Surv. 2014, 28, 889–916. [Google Scholar] [CrossRef]
- Donaldson, D. Railroads of the Raj: Estimating the impact of transportation infrastructure. Am. Econ. Rev. 2018, 108, 899–934. [Google Scholar] [CrossRef]
- Banerjee, A.; Duflo, E.; Qian, N. On the road: Access to transportation infrastructure and economic growth in China. J. Dev. Econ. 2020, 145, 102442. [Google Scholar] [CrossRef]
- Ministry of National Economy of the Republic of Kazakhstan. On the Development of Rural Territories. Information and Reference Materials for the Government Meeting of 19 March 2024. Available online: https://primeminister.kz/assets/media/ism-ot-19032024.pdf (accessed on 29 October 2026).
- Gertler, P.J.; Gonzalez-Navarro, M.; Gračner, T.; Rothenberg, A.D. Road maintenance and local economic development: Evidence from Indonesia's highways. J. Urban Econ. 2024, 143, 103687. [Google Scholar] [CrossRef]
- Kanbur, R.; Venables, A.J. (Eds.) Spatial Inequality and Development; Oxford University Press: Oxford, UK, 2005. [Google Scholar] [CrossRef]
- Cañal-Fernández, V.; Álvarez, A. The role of infrastructures in rural depopulation: An econometric analysis. Econ. Agrar. Recur. Nat. 2022, 22, 31–52. [Google Scholar] [CrossRef]
- Government of the Republic of Kazakhstan. Resolution No. 990 of 27 December 2019 On Approval of the State Programme for Regional Development for 2020–2025. (repealed by Resolution No. 733 of 23 September 2022). Available online: https://adilet.zan.kz/rus/docs/P1900000990 (accessed on 29 October 2026).
- Government of the Republic of Kazakhstan. Resolution No. 729 of 12 October 2021 On Approval of the National Project “Strong Regions—A Driver of the Country's Development”. (repealed by Resolution No. 828 of 22 September 2023, effective 1 January 2024). Available online: https://adilet.zan.kz/rus/docs/P2100000729 (accessed on 29 October 2026).
- Prime Minister of the Republic of Kazakhstan. Over 4 Thousand New Jobs to Be Created in 2019 in Villages as Part of “Aul – El Besigi” Project. 7 August 2019. Available online: https://primeminister.kz/en/news/press/bolee-4-tysyach-novyh-rabochih-mest-na-sele-budet-sozdano-v-ramkah-proekta-auyl-el-besigi-v-2019-godu (accessed on 29 October 2026).
- Deputy Prime Minister—Minister of National Economy of the Republic of Kazakhstan. Order No. 50 of 10 June 2025 On Approval of Criteria for Determining the Potential of Rural Settlements. Available online: https://adilet.zan.kz/rus/docs/G25NT000050 (accessed on 29 October 2026).
- Ministry of National Economy of the Republic of Kazakhstan. Reply to Deputy Request No. DZ-337 of 22 September 2023. Astana, Kazakhstan, 2023. Available online: https://www.parlam.kz/ru/mazhilis/News/GetFile/3f15a30e0f6a4795b032e893966ca3ff?ext=.pdf (accessed on 29 October 2026).
- Ministry of National Economy of the Republic of Kazakhstan. 2025, a Thousand New Projects Worth KZT 176.4 Billion Are Being Implemented in Kazakhstan's Villages. 8 May 2025. Available online: https://www.gov.kz/memleket/entities/economy/press/news/details/992296 (accessed on 29 October 2026).
- Ministry of National Economy of the Republic of Kazakhstan. “Auyl–El Besigi”: Large-Scale Projects for the Future of the Village. 21 February 2025. Available online: https://www.gov.kz/memleket/entities/economy/press/news/details/943146?lang=ru (accessed on 29 October 2026).
- Prime Minister of the Republic of Kazakhstan. “Auyl–El Besigi”: 3.5 Thousand Villages to Be Fully Modernised in Kazakhstan. 17 January 2023. Available online: https://primeminister.kz/ru/news/auyl-yel-besigi-35-thousand-villages-to-be-fully-modernised-in-kazakhstan-1701440 (accessed on 29 October 2026).
- Baker, A.; Callaway, B.; Cunningham, S.; Goodman-Bacon, A.; Sant'Anna, P.H.C. Difference-in-differences designs: A practitioner's guide. J. Econ. Lit. 2026, 64, 498–557. [Google Scholar] [CrossRef]
- Runfola, D.; Anderson, A.; Baier, H.; Crittenden, M.; Dowker, E.; Fuhrig, S.; Goodman, S.; Grimsley, G.; Layko, R.; Melville, G.; et al. geoBoundaries: A global database of political administrative boundaries. PLoS ONE 2020, 15, e0231866. [Google Scholar] [CrossRef] [PubMed]
- President of the Republic of Kazakhstan. Decree No. 887 of 3 May 2022 On Certain Issues of the Administrative-Territorial Structure of the Republic of Kazakhstan. Available online: https://adilet.zan.kz/rus/docs/U2200000887 (accessed on 29 October 2026).
- President of the Republic of Kazakhstan. Decree No. 424 of 28 December 2023 On Certain Issues of the Administrative-Territorial Structure of the Republic of Kazakhstan. Adilet legal information system. Available online: https://adilet.zan.kz (accessed on 3 November 2026).
- President of the Republic of Kazakhstan. Decree No. 432 of 9 January 2024 On Changes in the Administrative-Territorial Structure of Almaty Oblast. Adilet legal information system. Available online: https://adilet.zan.kz (accessed on 3 November 2026).
- Open Budgets Portal of the Republic of Kazakhstan. Budget Programmes and Reports on Their Implementation. Programmes Referring to Auyl–El Besigi. Available online: https://budget.egov.kz (accessed on 31 October 2026).
- Bureau of National Statistics of the Republic of Kazakhstan. National Population Census 2021: Population by Ethnicity, Settlements and Age. Available online: https://stat.gov.kz/ru/national/2021/ (accessed on 29 October 2026).
- Elvidge, C.D.; Baugh, K.; Zhizhin, M.; Hsu, F.C.; Ghosh, T. VIIRS night-time lights. Int. J. Remote Sens. 2017, 38, 5860–5879. [Google Scholar] [CrossRef]
- Elvidge, C.D.; Zhizhin, M.; Ghosh, T.; Hsu, F.-C.; Taneja, J. Annual time series of global VIIRS nighttime lights derived from monthly averages: 2012 to 2019. Remote Sens. 2021, 13, 922. [Google Scholar] [CrossRef]
- Hengl, T. Annual Time Series of Global VIIRS Nighttime Lights for 2000–2024 at 500-m Spatial Resolution Extrapolated Using Logistic Regression, Version 0.4. Zenodo 2025. [Google Scholar] [CrossRef]
- Kim, B.; Gibson, J.; Boe-Gibson, G. Measurement errors in popular night lights data may bias estimated impacts of economic sanctions: Evidence from closing the Kaesong Industrial Zone. Econ. Inq. 2024, 62, 375–389. [Google Scholar] [CrossRef]
- Bureau of National Statistics of the Republic of Kazakhstan. Main Indicators of Income Differentiation of the Population of the Republic of Kazakhstan; Astana, Kazakhstan, 2024. Available online: https://stat.gov.kz/api/iblock/element/157464/file/ru/ (accessed on 29 October 2026).
- de Chaisemartin, C.; D'Haultfœuille, X. Difference-in-differences estimators of intertemporal treatment effects. Rev. Econ. Stat. 2026, 108, 863–880. [Google Scholar] [CrossRef]
- Esposti, R. Evaluating policy impact under sparse and staggered adoption. A synthetic difference-in-differences application to EU rural development measures. Eval. Program Plan. 2026, 116, 102751. [Google Scholar] [CrossRef] [PubMed]
- Goodman-Bacon, A. Difference-in-differences with variation in treatment timing. J. Econom. 2021, 225, 254–277. [Google Scholar] [CrossRef]
- de Chaisemartin, C.; D'Haultfœuille, X. Two-way fixed effects and differences-in-differences with heterogeneous treatment effects: A survey. Econom. J. 2023, 26, C1–C30. [Google Scholar] [CrossRef]
- Sun, L.; Abraham, S. Estimating dynamic treatment effects in event studies with heterogeneous treatment effects. J. Econom. 2021, 225, 175–199. [Google Scholar] [CrossRef]
- Abadie, A. Statistical nonsignificance in empirical economics. Am. Econ. Rev. Insights 2020, 2, 193–208. [Google Scholar] [CrossRef]
- Roth, J.; Sant'Anna, P.H.C.; Bilinski, A.; Poe, J. What's trending in difference-in-differences? A synthesis of the recent econometrics literature. J. Econom. 2023, 235, 2218–2244. [Google Scholar] [CrossRef]
- Butts, K. JUE Insight: Difference-in-differences with geocoded microdata. J. Urban Econ. 2023, 133, 103493. [Google Scholar] [CrossRef]
- Callaway, B.; Goodman-Bacon, A.; Sant'Anna, P.H.C. Event studies with a continuous treatment. AEA Pap. Proc. 2024, 114, 601–605. [Google Scholar] [CrossRef]
- Pravda, Kazakhstanskaya. A “Rural Development Team” Is Being Launched in Five Regions of Kazakhstan. Available online: https://kazpravda.kz/n/v-pyati-regionah-kazahstana-zapuskayut-komandu-razvitiya-sela/ (accessed on 30 October 2026).
Figure 1.
Directed acyclic graph of the assumed causal structure linking Auyl–El Besigi investment to rural outcomes. Solid arrows denote assumed causal paths; dashed arrows denote unobserved selection and spillovers; the dotted arrow denotes possible correlation between programme timing and concurrent policies. Source: authors.
Figure 1.
Directed acyclic graph of the assumed causal structure linking Auyl–El Besigi investment to rural outcomes. Solid arrows denote assumed causal paths; dashed arrows denote unobserved selection and spillovers; the dotted arrow denotes possible correlation between programme timing and concurrent policies. Source: authors.
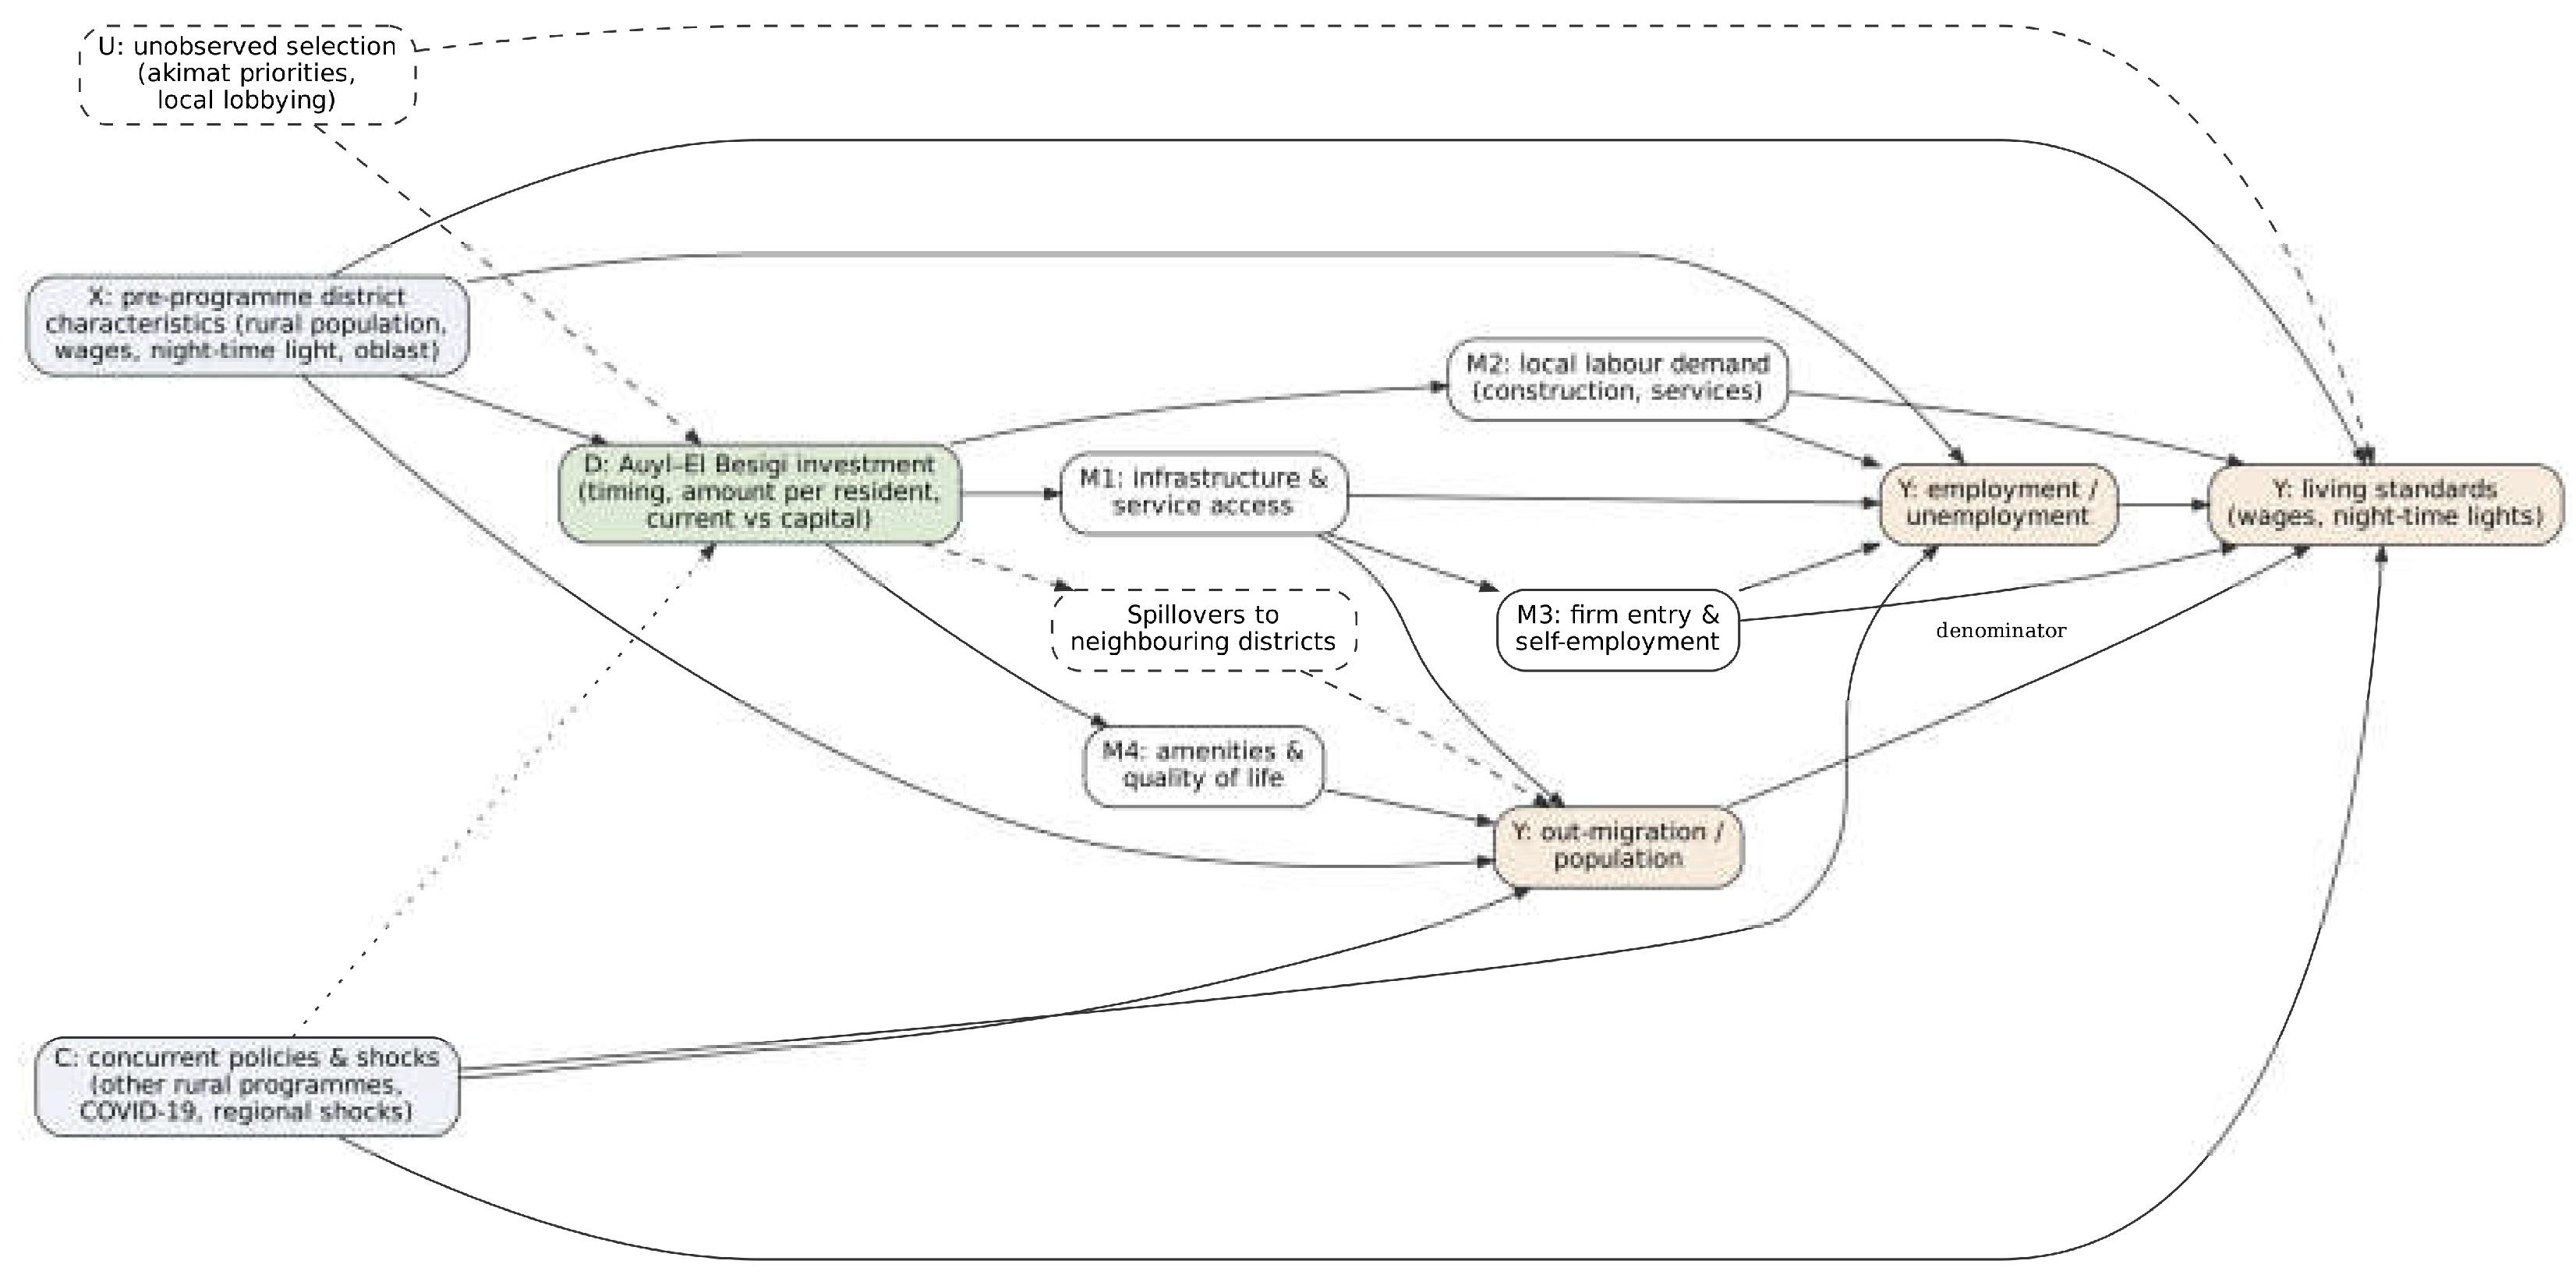
Figure 2.
Roll-out of Auyl–El Besigi allocations in the main sample of 135 rural districts: (a) number of districts by first year with a programme line in the district budget (decisions for 2019–2023, used for treatment timing); (b) total recorded allocations by year, 2019–2026, with the number of districts with a programme line and the number of districts covered by budget decisions inside each bar (2026, grey: plans in force on 2 November 2026); (c) recorded allocation per rural resident in districts with a programme line, 2019–2026 (boxes show the interquartile range and median; whiskers show 1.5 times the interquartile range; 2026 amounts divided by the rural population at 1 January 2025). Source: authors' calculations from district budget decisions [50] and Taldau [51].
Figure 2.
Roll-out of Auyl–El Besigi allocations in the main sample of 135 rural districts: (a) number of districts by first year with a programme line in the district budget (decisions for 2019–2023, used for treatment timing); (b) total recorded allocations by year, 2019–2026, with the number of districts with a programme line and the number of districts covered by budget decisions inside each bar (2026, grey: plans in force on 2 November 2026); (c) recorded allocation per rural resident in districts with a programme line, 2019–2026 (boxes show the interquartile range and median; whiskers show 1.5 times the interquartile range; 2026 amounts divided by the rural population at 1 January 2025). Source: authors' calculations from district budget decisions [50] and Taldau [51].
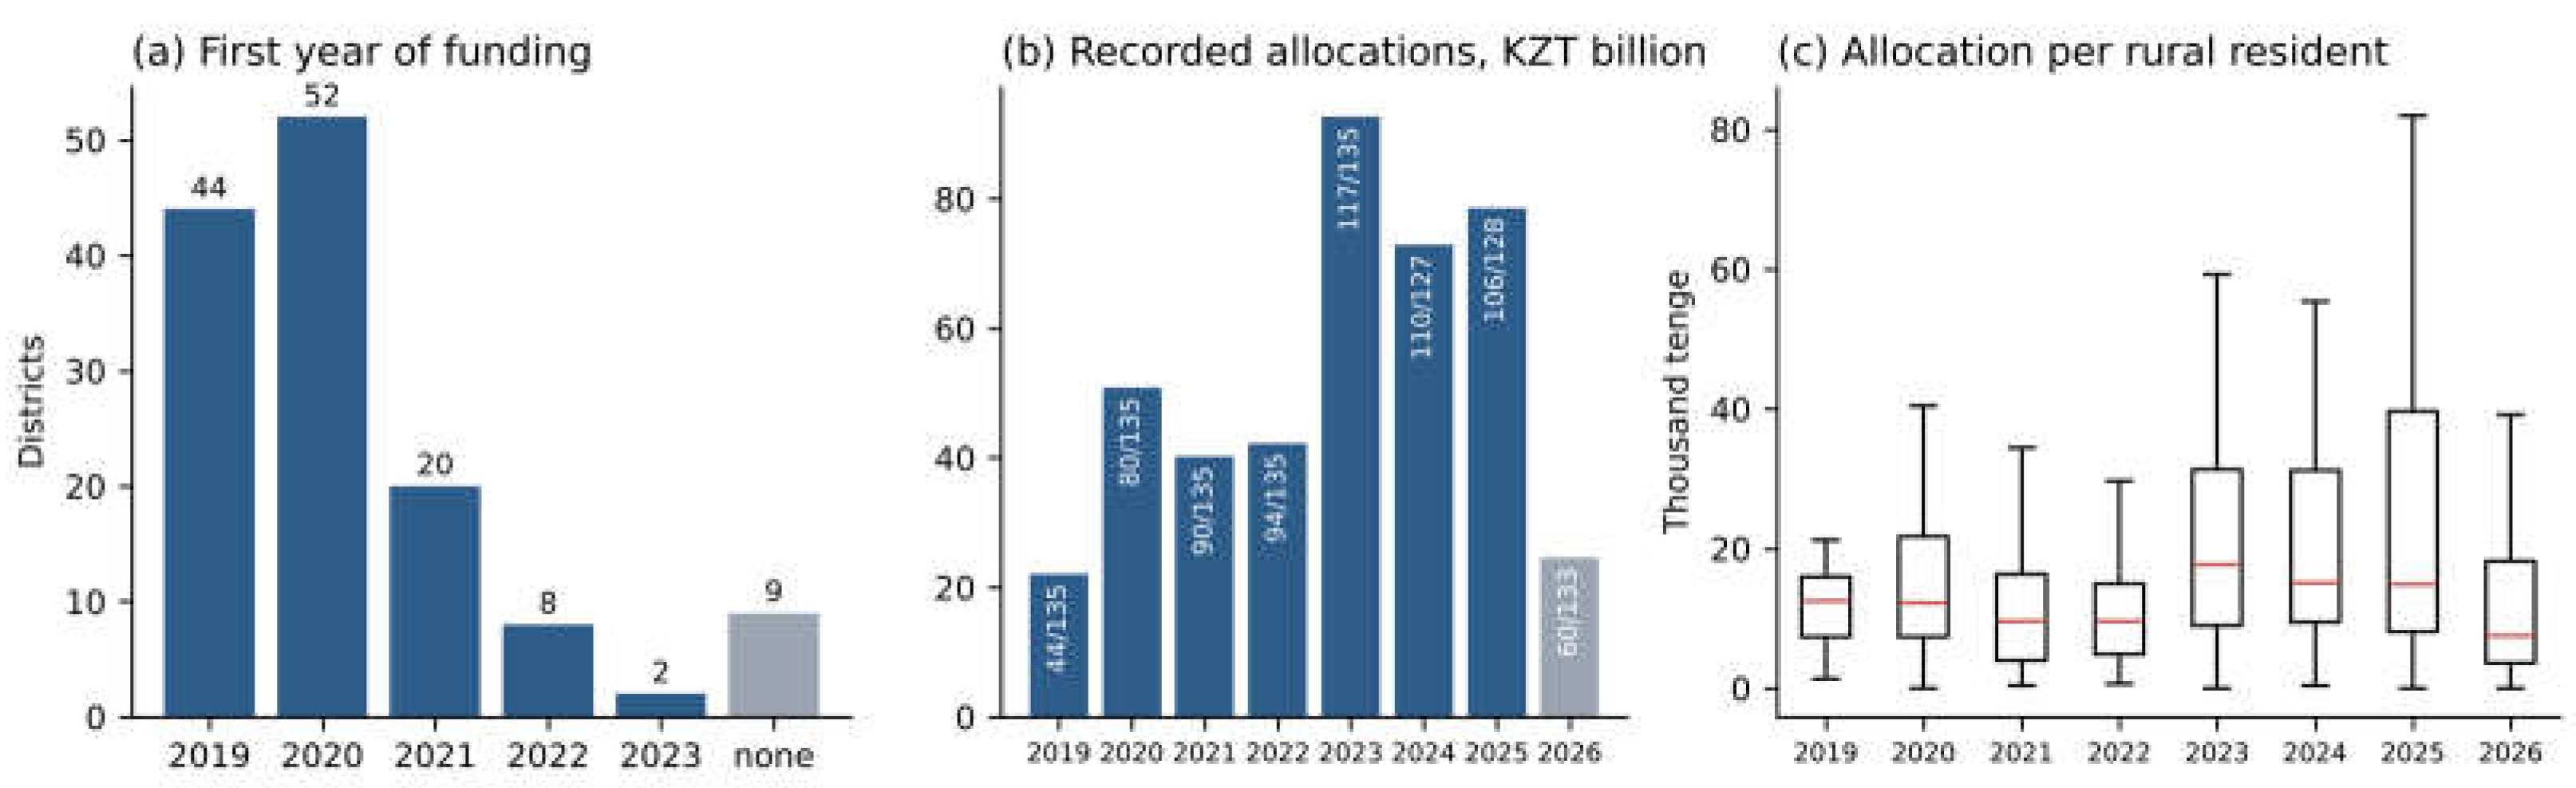
Figure 3.
Event-time effects of recorded Auyl–El Besigi allocations (doubly robust Callaway–Sant'Anna estimates, window 2012–2021): (a) log rural night-time light; (b) log average wage; (c) unemployment rate, percentage points; (d) net migration per 1000 residents. Points are estimates and bars pointwise 95% confidence intervals; the dashed line marks the first year of funding. The window ends in 2021 because few districts remain unfunded afterwards (Table 2; Section 5.2). Source: authors' calculations.
Figure 3.
Event-time effects of recorded Auyl–El Besigi allocations (doubly robust Callaway–Sant'Anna estimates, window 2012–2021): (a) log rural night-time light; (b) log average wage; (c) unemployment rate, percentage points; (d) net migration per 1000 residents. Points are estimates and bars pointwise 95% confidence intervals; the dashed line marks the first year of funding. The window ends in 2021 because few districts remain unfunded afterwards (Table 2; Section 5.2). Source: authors' calculations.
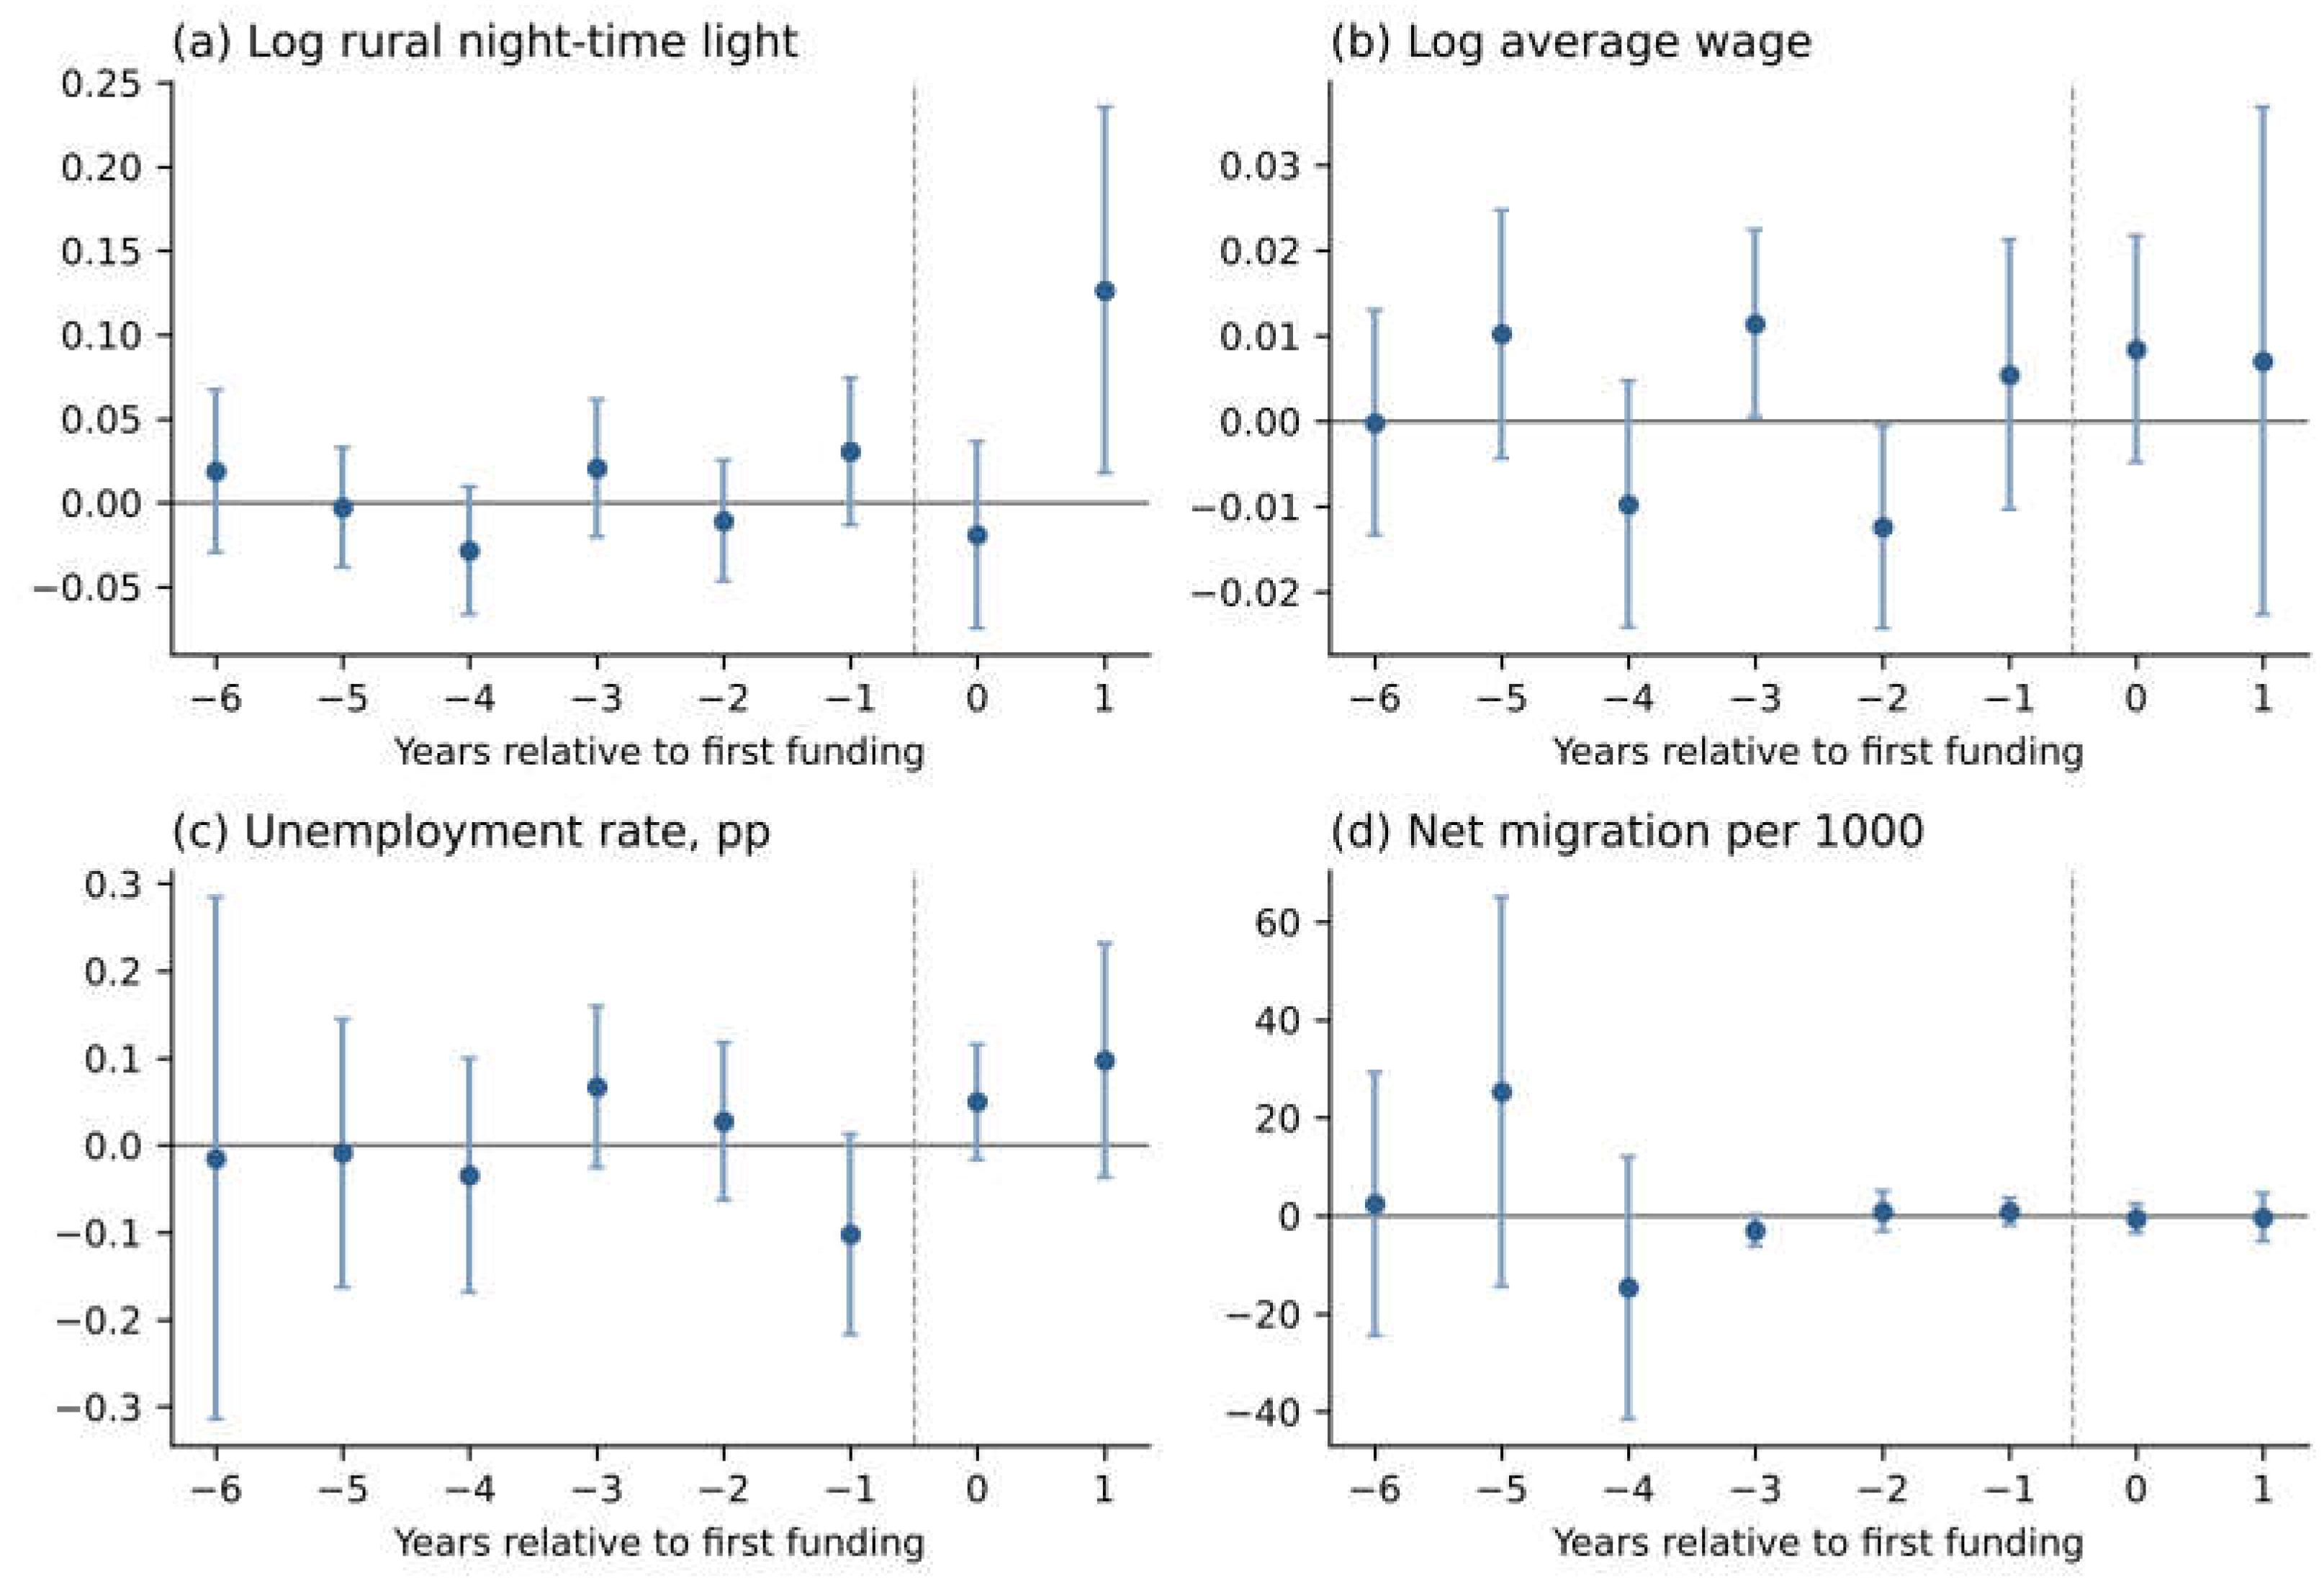
Figure 4.
Outcomes by year of first recorded allocation, main sample, 2012 to the latest published year: (a) log rural night-time light; (b) log average wage; (c) unemployment rate, %; (d) log rural population; (e) net migration per 1000 residents (from 2015; 2021 excluded); (f) log fixed investment financed from local budgets. Group means; the dashed line marks the start of the programme and the shaded area the years after the main estimation window. Descriptive; no causal interpretation. Source: authors' calculations from Taldau [51], night-time lights [91] and district budget decisions [50].
Figure 4.
Outcomes by year of first recorded allocation, main sample, 2012 to the latest published year: (a) log rural night-time light; (b) log average wage; (c) unemployment rate, %; (d) log rural population; (e) net migration per 1000 residents (from 2015; 2021 excluded); (f) log fixed investment financed from local budgets. Group means; the dashed line marks the start of the programme and the shaded area the years after the main estimation window. Descriptive; no causal interpretation. Source: authors' calculations from Taldau [51], night-time lights [91] and district budget decisions [50].
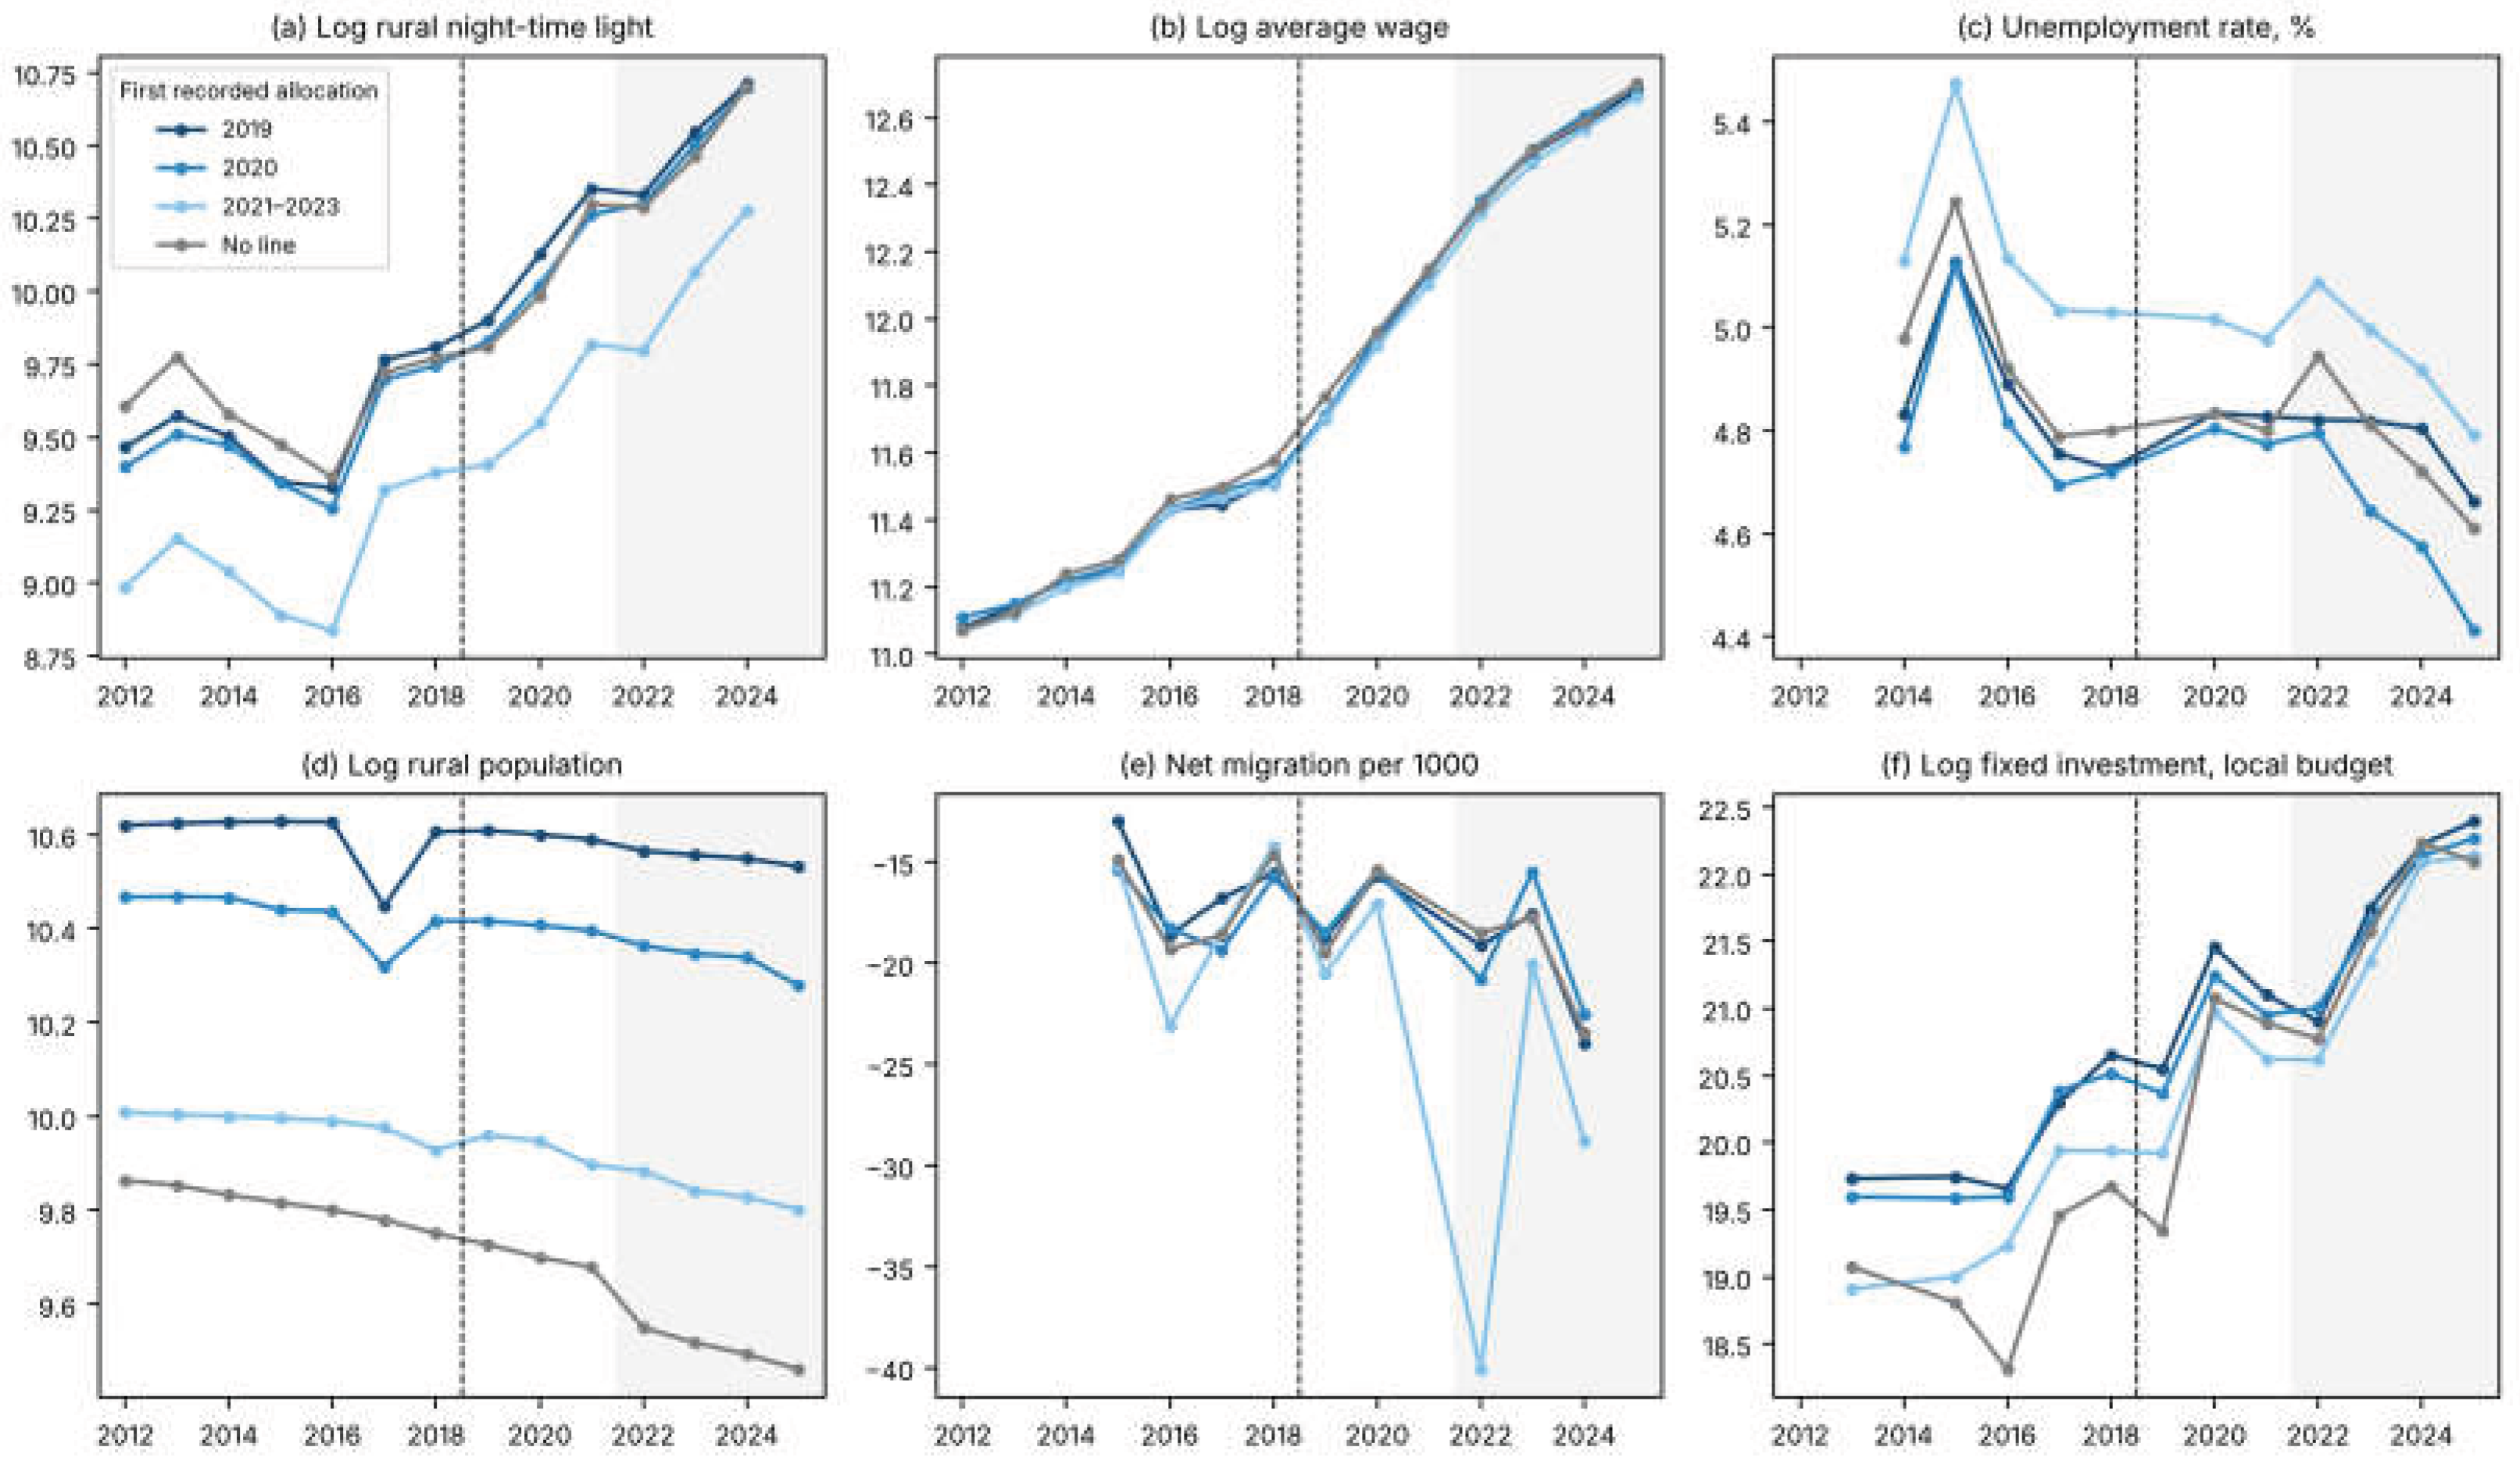

Table 1.
Scale of the Auyl–El Besigi programme as reported in official sources, 2019–2026.
| Period | Reported coverage and funding | Source |
| 2019 | 1150 rural clusters comprising 3477 eligible settlements | [76] |
| 2019–2021 | 665 villages covered by 1 January 2022 (18% of the selected settlements) | [44] |
| 2023 (plan) | About 1.5 thousand projects in 736 villages; KZT 143 billion | [81] |
| 2023 (targeted transfers) | 434 projects; KZT 91.9 billion allocated from the republican budget and the National Fund, 97.2% executed | [45] |
| 2019–2023 | About 1.8 thousand support and satellite villages; more than 5.4 thousand projects, including more than 3 thousand intra-village roads; KZT 524 billion from the republican budget | [70] |
| 2024 (plan) | KZT 179 billion allocated from the republican budget; about 1.4 thousand projects planned in more than 500 villages (reported 19 March 2024) | [70] |
| 2025 (plan) | About 1000 projects in 500 settlements; KZT 176.4 billion (reported 8 May 2025) | [79] |
| 2019–2025 (completed) | About 7.6 thousand projects in 2.5 thousand support and satellite villages: 900 housing and utility facilities, 2.4 thousand social facilities, more than 4.3 thousand intra-village roads (reported 12 March 2026) | [43] |
| 2026 | Infrastructure projects in rural settlements financed from local budgets through general-purpose transfers under the Budget Code | [43] |
Note: Figures are reproduced as reported (nominal tenge); they are announcements and administrative totals, not audited expenditure, and are not used in the estimation. Figures for different periods are not additive: plans for 2023–2025 were reported before the end of the year, the 2019–2023 total refers to republican funds only, and the 2019–2025 counts refer to completed projects. A single official total of programme funding for 2019–2025 was not found. KZT, Kazakhstani tenge.
Table 2.
Funded and not-yet-funded districts by year, main sample (135 districts).
| Year | Newly funded | Funded (cumulative) | Not yet funded: later cohorts | Not yet funded: no programme line | Comparison pool (total) |
| 2019 | 44 | 44 | 82 | 9 | 91 |
| 2020 | 52 | 96 | 30 | 9 | 39 |
| 2021 | 20 | 116 | 10 | 9 | 19 |
| 2022 | 8 | 124 | 2 | 9 | 11 |
Note: A district is funded from the first year in which its final amended budget records a positive Auyl–El Besigi allocation. The comparison pool in year t consists of districts first funded after t and districts without a recorded programme line. The table ends in 2022 because the main estimation window ends in 2021 and the check window in 2022 (Section 5.2). Decisions for 2023 are available for only 76 of the 174 units; they are used only to identify the 2 districts first funded in 2023, which remain in the comparison pool in every year shown (Section 4.2). Source: authors' calculations from district budget decisions [50].
Table 3.
Variables, units and data availability for the district–year panel.
| Variable | Definition and unit | Years | Source |
| Recorded programme allocation | Budget programmes of the final amended district budget referring to Auyl–El Besigi; thousand tenge and tenge per rural resident | 2019–2026 (2023–2025 and 2026: later collections) | [50] |
| Treatment timing | First year with a positive recorded allocation | 2019–2023 | [50] |
| Reported actual expenditure | Planned and actual expenditure in reports on the implementation of Auyl–El Besigi programmes; used only to check execution (Section 4.3) | 2019–2025, 50 districts | [87] |
| Population | Total and rural population at 1 January, persons | 2009–2025 | [51], index 703831 |
| Net migration | Published net migration (2010–2014, 2023–2024); derived as population change minus natural increase otherwise | 2009–2024 | [51], indices 703872, 703831, 703839, 703847 |
| Unemployment rate | Unemployed as share of labour force, % | 2014–2025 (not 2019) | [51], index 702944 |
| Average wage | Average monthly nominal wage, tenge | 2012–2025 | [51], index 702972 |
| Fixed investment | Investment in fixed capital: total and local budget; tenge | 2013, 2015–2025 | [51], index 701827 |
| Individual entrepreneurs | Number of active individual entrepreneurs | 2018–2024 | [51], index 19722418 |
| Night-time lights | Sum of radiance of pixels 1–20 nW·cm−2·sr−1 (rural light) and total radiance | 2012–2024 | [91] |
| Boundaries and adjacency | 2017 second-level administrative units (174 polygons); pairs of districts sharing a boundary (433) | — | [83] |
Note: All indicators are published at the district level; values for units formed by merging districts are sums, and wages and unemployment rates are population-weighted averages. Monetary values are nominal; monetary outcomes enter in logs, so common price changes are absorbed by year effects. Taldau indicators are available at https://taldau.stat.gov.kz/ru/NewIndex/GetIndex/ followed by the index number.
Table 4.
Characteristics of districts in 2018 by year of first recorded allocation.
| 2018 characteristic | Funded 2019 | Funded 2020 | Funded 2021–2023 | No programme line |
| Number of districts | 44 | 52 | 30 | 9 |
| Rural population, thousand | 55.0 | 51.9 | 25.6 | 18.4 |
| Rural share of population, % | 98.7 | 87.9 | 86.3 | 62.4 |
| Average monthly wage, thousand tenge | 103.3 | 102.9 | 102.9 | 108.4 |
| Unemployment rate, % | 4.7 | 4.7 | 5.0 | 4.8 |
| Rural night-time light per 1000 residents | 610 | 585 | 566 | 775 |
Note: Group means. Rural night-time light is the sum of radiance of pixels between 1 and 20 nW·cm−2·sr−1 per 1000 residents. The last funded group pools the 20, 8 and 2 districts first funded in 2021, 2022 and 2023, because the later cohorts are small. Source: authors' calculations.
Table 5.
Average effects of recorded Auyl–El Besigi allocations on district outcomes.
| Outcome (years) | No covariates | Doubly robust (DR) | DR 95% CI | DR wild cluster bootstrap p (oblast) | Imputation, oblast × year FE |
| Log rural night-time light (2012–2021) | 0.026 (0.044) | 0.021 (0.028) | −0.035 to 0.076 | 0.49 | 0.062 (0.059) |
| Log total night-time light (2012–2021) | 0.053 (0.057) | 0.035 (0.029) | −0.022 to 0.092 | — | 0.093 (0.068) |
| Log average wage (2012–2021) | 0.031** (0.012) | 0.008 (0.007) | −0.006 to 0.022 | 0.34 | 0.005 (0.014) |
| Unemployment rate (pp) (2014–2021, excl. 2019) | 0.082* (0.044) | 0.068** (0.034) | 0.000 to 0.135 | 0.10 | 0.110 (0.086) |
| Net migration per 1000 (2012–2020) | 0.760 (1.239) | −0.495 (1.650) | −3.729 to 2.740 | 0.73 | 0.358 (3.244) |
| Log rural population (2012–2021) | 0.011 (0.021) | −0.003 (0.003) | −0.009 to 0.002 | — | 0.006 (0.008) |
| Log fixed investment (2015–2021) | −0.084 (0.084) | 0.017 (0.092) | −0.164 to 0.198 | — | 0.046 (0.096) |
| Log fixed investment, local budget (2015–2021) | −0.394** (0.166) | −0.083 (0.169) | −0.414 to 0.248 | — | −0.032 (0.129) |
| Log active individual entrepreneurs (2018–2021) | 0.040** (0.020) | −0.031 (0.020) | −0.069 to 0.008 | — | 0.038** (0.016) |
Note: Callaway–Sant'Anna estimates with not-yet-funded districts as controls, aggregated over all group-time cells; 135 districts. The doubly robust (DR) specification conditions on 2018 log rural population, rural share, log average wage and log night-time light per 1000 residents. Standard errors in parentheses from a multiplier bootstrap clustered by district (999 replications). Wild cluster bootstrap with 14 oblast clusters and Webb weights (9999 replications). The imputation estimator uses district and oblast-by-year effects estimated on untreated observations; standard errors from a district bootstrap (199 replications). *** p < 0.01, ** p < 0.05, * p < 0.1. Source: authors' calculations.
Table 6.
Identification diagnostics and inference for the main outcomes (doubly robust specification).
Table 6.
Identification diagnostics and inference for the main outcomes (doubly robust specification).
| Diagnostic (DR specification) | Rural light (log) | Average wage (log) | Unemploy ment (pp) | Net migration per 1000 |
| Joint Wald test of pre-period coefficients (e = −5 to −1): χ2(5) | 4.55 | 8.06 | 4.53 | 5.91 |
| p-value | 0.47 | 0.15 | 0.48 | 0.32 |
| Coefficient at e = −1 (SE) | 0.031 (0.023) | 0.005 (0.008) | −0.102 (0.056) | 0.784 (1.344) |
| ATT allowing one year of anticipation (SE) | 0.000 (0.059) | −0.004 (0.020) | −0.182 (0.076) | −0.995 (1.663) |
| Wild cluster bootstrap by oblast: p-value | 0.49 | 0.34 | 0.10 | 0.73 |
| Wild cluster bootstrap by oblast: 95% CI | −0.035 to 0.076 | −0.008 to 0.024 | −0.010 to 0.145 | −3.134 to 2.144 |
| Minimum detectable effect (80% power, 5% level) | 0.078 | 0.019 | 0.088 | 4.321 |
| Minimum detectable effect, oblast-clustered | 0.081 | 0.023 | 0.110 | 3.826 |
| Rambachan–Roth sensitivity: average event-time effect, e = 0 and 1 (SE) | 0.054 (0.031) | 0.008 (0.008) | 0.073 (0.034) | −0.46 (1.72) |
| 95% CI under parallel trends | −0.007 to 0.114 | −0.008 to 0.024 | 0.006 to 0.140 | −3.83 to 2.91 |
| Relative magnitudes ΔRM, M̄ = 0.5: 95% confidence set | −0.021 to 0.144 | −0.017 to 0.033 | −0.045 to 0.201 | −27.84 to 26.33 |
| Relative magnitudes ΔRM, M̄ = 1: 95% confidence set | −0.053 to 0.188 | −0.031 to 0.047 | −0.138 to 0.285 | not bounded |
| Smoothness ΔSD, M = 0 (linear trend): 95% CI | −0.025 to 0.086 | −0.009 to 0.027 | 0.007 to 0.152 | −2.08 to 6.01 |
| Smoothness ΔSD, M = 0.5 SE: 95% CI | −0.083 to 0.099 | −0.017 to 0.042 | −0.004 to 0.225 | −6.31 to 5.89 |
| Smoothness ΔSD, M = 1 SE: 95% CI | −0.115 to 0.130 | −0.031 to 0.049 | −0.031 to 0.286 | −8.90 to 7.38 |
Note: Wald statistics and the e = −1 coefficient use the analytical variance from the influence functions. The anticipation estimate shifts the reference period one year earlier. Wild cluster bootstrap: Webb six-point weights, 9999 replications, 14 oblast clusters, symmetric percentile interval. MDE = 2.8 × standard error. Rambachan–Roth sensitivity: event study with reference period e = −1 and pre-periods e = −5 to −2; target is the average of the effects at e = 0 and 1; standard errors from the influence functions, clustered by district. M̄ is relative to the largest pre-treatment violation; M is expressed in units of the standard error of the target. “Not bounded”: the confidence set reaches the edge of the search range of ±20 standard errors. Source: authors' calculations.
Disclaimer/Publisher’s Note: The statements, opinions and data contained in all publications are solely those of the individual author(s) and contributor(s) and not of MDPI and/or the editor(s). MDPI and/or the editor(s) disclaim responsibility for any injury to people or property resulting from any ideas, methods, instructions or products referred to in the content. |
© 2026 by the authors. Licensee MDPI, Basel, Switzerland. This article is an open access article distributed under the terms and conditions of the Creative Commons Attribution (CC BY) license (http://creativecommons.org/licenses/by/4.0/).
Copyright: This open access article is published under a Creative Commons CC BY 4.0 license, which permit the free download, distribution, and reuse, provided that the author and preprint are cited in any reuse.