

Submitted:
13 November 2026
Posted:
16 November 2026
You are already at the latest version
Abstract
Regional policy often presents the recruitment of foreign students as a lever for local2
development, but regional-level evidence is scarce. This study tests whether European3
NUTS-2 regions whose higher-education institutions enrol a larger share of foreign students4
subsequently reach higher real GDP per capita. Institution-level data from the European5
Tertiary Education Register (ETER) are aggregated to regions and linked with Eurostat6
regional accounts. The analysis plan was fixed before estimation. The pre-registered7
specification is a two-way fixed-effects panel with region and country-by-year effects,8
covering 1,922 region-years in 216 regions of 21 countries (2013–2022). A one-percentage-9
point higher foreign-student share in the previous year is associated with 0.090% higher10
real GDP per capita (95% CI−0.077 to 0.257; p= 0.290). Alternative outcomes, lags,11
subsamples, measures and the absolute number of foreign students give similar null results.12
Only a cross-sectional long difference is positive (p= 0.014); its variation lies between13
regions over a decade, not within regions. Shift-share instruments are weak, so no causal14
claim is made. The hypothesis is not supported at this scale and horizon. That is not15
evidence of no economic value: a calibration shows that a NUTS-2 annual panel cannot16
detect the local demand effects single institutions plausibly generate
Keywords:
internationalisation of higher education
; international students
; regional development
; NUTS-2
; ETER
; two-way fixed effects
; shift-share instrument
; pre-registration
; Central and Eastern Europe
1. Introduction
Universities are among the most persistent institutions in European cities and regions. They are increasingly expected to contribute to local prosperity, not only to teaching and research. Over the past two decades many have also become more international: they recruit students and staff from abroad, take part in exchange programmes and present themselves as nodes in global knowledge networks [1,2,3]. National and regional strategies often link these two roles. Attracting international students is described as a way to fill skill gaps, raise demand for local services, connect regional firms to foreign markets and make second-tier cities more attractive. In Central and Eastern Europe (CEE) the argument has become especially prominent. There, internationalisation is seen as a way to offset demographic decline in domestic student cohorts and to integrate lagging regions into European knowledge flows [4,5].
The policy context reinforces this expectation. At the European level, credit mobility through Erasmus+ and the objective of a European Education Area have made cross-border study a normal part of higher education. National governments have added programmes to attract degree-seeking students from outside the European Union. Examples are scholarship schemes for students from partner countries, such as Hungary’s Stipendium Hungaricum programme launched in the 2010s, English-taught degree programmes and simplified visa procedures. Universities themselves, facing tighter public budgets and shrinking domestic cohorts, have treated international recruitment as a strategic priority [3,6]. Many of these strategies are justified partly in regional terms: international students are expected to raise the visibility of university towns, to fill vacancies in local labour markets after graduation, and to strengthen links between regional firms and foreign markets. These expectations are rarely evaluated against regional economic data.
The claim that internationalised universities make their regions richer is plausible, but it has seldom been tested at the scale at which regional policy operates. A large literature documents that universities, research and graduates matter for regional development [7,8,9]. A separate literature studies the determinants and individual consequences of international student mobility [10,11,12,13]. These two strands rarely meet. Evidence on international students’ economic contributions comes mostly from the United States and the United Kingdom and concerns specific margins: innovation [14,15], university finances [16,17,18] and the global allocation of talent [19,20]. Whether European regions with more internationalised higher-education systems subsequently perform better in aggregate economic terms is an open empirical question.
This article addresses that question with a pre-registered regional panel. Institution-level data from the European Tertiary Education Register (ETER) [21,22] are aggregated to the NUTS-2 level. The resulting measure is the share of foreign students in tertiary enrolment (ISCED 5–7) for 2011–2021. It is linked to Eurostat regional accounts for 2013–2022. The hypothesis (H2) is that regions with a higher foreign-student share subsequently attain higher real GDP per capita, conditional on region fixed effects and country-by-year fixed effects. The main specification, outcome, lag, sample, controls and inference were written down and archived before any regression was estimated. A small number of data-quality checks added afterwards are labelled as post hoc throughout.
The answer is a precisely estimated null for the short-to-medium run. A one-percentage-point increase in the foreign-student share within a region is associated with a 0.090% change in real GDP per capita one year later. The 95% confidence interval runs from −0.077% to 0.257%. Scaled to a typical within-region change (one standard deviation, 1.84 percentage points), the estimate is 0.17%, and the interval rules out effects larger than 0.47%. The null holds for alternative outcomes (GDP in purchasing power standards, gross value added, employment, labour productivity), alternative lags, the CEE subsample, the sample without capital-city regions, and degree-mobile and Erasmus-based measures. It also holds when the treatment is the absolute number of foreign students rather than their share, and under corrections for a data-coding problem in ETER. A cross-sectional long-difference specification over the whole period gives a positive and statistically significant association, but its identifying variation is between regions over a decade rather than within regions over the year. Shift-share instruments are too weak to support causal statements in either direction. A statistically insignificant coefficient is evidence about the size of an association at a given scale and horizon, not proof that no effect exists; the article is explicit about this throughout.
The article makes four contributions. Substantively, it provides the first Europe-wide NUTS-2 test, to our knowledge, of the link between the internationalisation of higher education and subsequent regional economic performance, and it separates within-region dynamics from persistent cross-regional differences. Existing regional evidence treats universities as undifferentiated institutions and is largely cross-sectional; existing evidence on international students is national, institutional or individual, and concentrated in the United States and the United Kingdom. The regional margin on which European policy actually operates has not been tested on comparable data. Methodologically, it documents how ETER can be used for regional measurement and where this requires care: coverage thresholds, suppression codes and the switch from NUTS 2021 to NUTS 2024 in Eurostat’s regional accounts. Analytically, it does not stop at the null but asks what a design of this scale could have detected. A calibration in Section 6.2 shows that the local demand effect of a single internationalising institution is roughly an order of magnitude smaller than the minimum detectable effect of a NUTS-2 annual panel, which turns a null result into a specific instruction about the spatial resolution future work needs. Regarding research practice, it shows how a pre-specified design with transparent reporting turns an insignificant coefficient into an informative bound for policy: short-run gains in regional GDP per capita from internationalisation are, at most, small.
2. Literature and Hypothesis
2.1. Universities and Regional Development
The view that universities are engines of regional development rests on several channels. On the demand side, universities and their students spend money locally, and these expenditure effects can be large relative to small regional economies [23]. On the supply side, universities raise the local stock of human capital, generate knowledge spillovers and foster innovation and entrepreneurship. The broader regional literature confirms that human capital is among the strongest correlates of regional income [9,24,25]. Social returns to education may exceed private returns because educated workers raise the productivity of others [26].
Empirical studies of universities as such support these mechanisms but also highlight heterogeneity and identification problems. Using data on some 15,000 universities in 78 countries, Valero and Van Reenen [8] find that increases in the number of universities are followed by higher regional GDP per capita, with spillovers to neighbouring regions. Historical and quasi-experimental studies from the United States link the establishment and research activity of universities to local invention and economic growth [27,28,29,30]. European evidence points in the same direction for Germany [31] and Italy, both for university expansion and innovation [32] and for university efficiency and local growth [33]. At the same time, conceptual work stresses that universities’ regional roles are multiple and sometimes contradictory, and that they depend on the regional innovation system in which universities are embedded [7,34,35]. A recurring empirical caveat concerns graduate mobility. Because graduates move, producing degrees in a region does not translate one-to-one into regional human capital [36,37,38,39].
2.2. International Students as a Regional Resource
International students add specific channels to this general picture. First, they are an additional source of human capital that the region did not have to produce. If they stay after graduation, they enlarge the regional pool of skilled labour. Second, they bring cultural and cognitive diversity, which has been associated with higher productivity and innovation in cities and local labour markets [40,41]. The innovation effects of migration, however, depend on migrants’ skills and on local absorptive capacity [42]. Third, international students can act as “pipelines” that connect local actors to distant knowledge and markets. This complements the “local buzz” of agglomerations [43] and helps overcome cognitive and institutional distance [44]. Fourth, in systems where international students pay higher fees, they cross-subsidise domestic teaching and research. Evidence from the United States and the United Kingdom suggests that they do not crowd out domestic students and can expand overall capacity [16,17,18].
Studies of international graduate students in the United States find that they contribute measurably to patenting and scientific output [14,15]. The global market for talent has become an important driver of where innovative activity concentrates [19,20]. At the level of individuals, student mobility raises subsequent international labour mobility: exposure to Erasmus increases the probability of later working abroad [11]. This creates a tension for host regions. Mobility that builds networks also makes it more likely that graduates leave. In Europe, institutional internationalisation is itself highly stratified. Research-intensive, reputable institutions in core countries attract disproportionate shares of foreign students and staff [45]. Institutional rationales for internationalising range from reputation to financial necessity [6]. Student flows follow migrant networks, costs and perceived quality [10], and are shaped by both supply-side and demand-side factors [12,13].
2.3. What “Internationalisation” Means Here
Internationalisation of higher education is a multidimensional process, and the term is used loosely in policy documents. Following Knight [1] and de Wit and Altbach [3], at least five dimensions can be distinguished: (i) inward and outward student mobility, both degree-seeking and credit-based; (ii) academic staff mobility and the international recruitment of faculty; (iii) internationalisation of research, visible in co-authorship, international research funding and participation in European consortia; (iv) internationalisation at home, meaning English-taught provision, international curricula and joint or double degrees; and (v) institutional partnerships, branch campuses and alliances such as the European Universities Initiative. These dimensions are correlated but far from identical. Institutions can recruit fee-paying students without internationalising their research, and research-intensive universities can be internationally embedded with few foreign students [6,45].
This article measures only the first dimension, and within it only the inward flow. Three indicators are used: the share of foreign students by citizenship (the main measure), the share of degree-mobile students by country of prior education, and incoming Erasmus students per 100 enrolled. They capture, respectively, the stock of non-national students, the stock of students who moved in order to study, and short-term credit mobility. Staff mobility, international research income, co-publication and formal partnerships are not measured, because ETER does not report them consistently across countries and years for the whole 2011–2021 window, and no comparable NUTS-2 series exists elsewhere. The hypothesis, the results and the conclusions of this article therefore concern the student dimension of internationalisation. An effect operating through international research or staff recruitment would not be captured by the treatment used here, and the null result reported below says nothing about those channels. This is a restriction of scope, not a claim that the student dimension is the most important one; Section 6.5 returns to it.
2.4. Expected Magnitudes and Timing
Two features of these mechanisms matter for empirical design. The first is magnitude. Expenditure effects scale with the number of students relative to the regional economy. Even in strongly internationalised regions, foreign students are a small fraction of the resident population, so direct demand effects on regional GDP per capita should be modest. Human-capital effects scale with the number of graduates who stay and with their productivity relative to the incumbent workforce. The retention literature suggests that a large share of graduates leaves the region of study [36,37,38]. International graduates face additional legal and linguistic barriers to staying. Knowledge-network effects are the hardest to quantify. They may be large for specific firms or sectors while remaining small in aggregate output.
The second feature is timing. Spending responds immediately, but it is the smallest channel. Human-capital and innovation channels unfold over several years: students must graduate, enter local labour markets and accumulate experience, and the innovations they contribute to take time to diffuse [26,27]. Network effects may take even longer, as alumni progress into positions in which they influence trade and investment decisions. Annual panel regressions with short lags therefore mainly capture the fast channels. Specifications that compare changes over a decade can capture slower, cumulative channels. They are, however, more exposed to confounding trends. For this reason the analysis plan combined a short-lag two-way fixed-effects test with a long-difference specification and a shift-share instrument. Shift-share designs that rely on serially correlated inflows can mix short- and long-run responses [46]. Their results must therefore be read alongside the direct timing evidence.
A related consideration is the counterfactual. In countries where total tertiary enrolment is fixed or declining, a rising foreign-student share in a region partly reflects falling domestic enrolment rather than additional students. The economic implications of such a compositional change differ from those of an expansion. Country-by-year fixed effects absorb national demographic trends, but not region-specific ones. Composition effects of this kind are one reason why the coefficient on the share should not be read as the effect of adding international students to an otherwise unchanged university.
2.5. Gaps and Hypothesis
Three gaps motivate the present study. First, most evidence on the economic role of international students concerns national systems or individual institutions, not regions. Second, regional studies of universities rarely distinguish the international dimension of higher education. Third, much of the regional evidence is cross-sectional. It is therefore exposed to the obvious concern that prosperous, urbanised and research-intensive regions both attract foreign students and grow for other reasons [5,47,48]. The relationship between internationalisation and regional performance may also differ between core regions and the CEE periphery. In the CEE periphery, internationalisation started from a low base and accelerated during the 2010s.
The hypothesis tested here is stated in its pre-registered form:
H2. European regions whose higher-education systems are more internationalised (a higher share of international students in tertiary enrolment) experience higher subsequent regional economic performance, conditional on region and country-by-year fixed effects.
The hypothesis concerns within-region changes. Region fixed effects absorb all time-invariant differences between regions, such as the presence of a large old university, a capital-city function or historical prosperity. Country-by-year effects absorb national business cycles, national higher-education and migration policies, and exchange-rate movements. The test therefore asks whether a region whose foreign-student share rises faster than that of other regions in the same country subsequently also grows faster in real GDP per capita.
3. Data
3.1. Measuring Internationalisation from ETER
Eurostat publishes international (degree-mobile) student counts only at the national level (tables educ_uoe_mobs01–06). The regional measure is therefore built from ETER, the reference dataset on European higher-education institutions (HEIs) [21]. The full public dump of 26 March 2024 [22] contains 31,228 HEI-year records for 3,497 institutions and reference years 2011–2021. Each HEI is assigned to the NUTS-2 region of its main seat, coded consistently in the NUTS 2021 classification across all years. ETER reports total enrolment at ISCED levels 5–7 and its breakdown into foreign students (by citizenship), degree-mobile students (by country of prior education) and, separately, incoming Erasmus students.
The main measure is the foreign-student share: the sum of foreign students over all HEIs in a region divided by their total ISCED 5–7 enrolment, in percent. It is preferred to the degree-mobile share because it is available for many more countries. The degree-mobile share is missing, for example, for Poland, Italy, Czechia and Slovakia. The degree-mobile share and Erasmus incoming students per 100 students serve as alternative measures. Two rules ensure that regional aggregates are not driven by partial reporting. A region-year enters only if HEIs reporting both foreign and total enrolment account for at least 90% of ETER enrolment in that region, and only if they enrol at least 500 students. Of the 3,362 region-year aggregates (331 regions), 2,937 satisfy these rules. ETER replaces small counts (1–3) with the suppression code ‘s’. Following the pre-registered plan, these cells are set to the midpoint, 2. They make up 11.6% of HEI-years with a reported foreign-student count. Section 5.2 shows that this choice interacts with a coding problem in a few large institutions and reports a post hoc correction.
3.2. Outcomes and Controls
The main outcome is the logarithm of real GDP per capita. It is constructed from the Eurostat volume index of regional GDP (2020 = 100; nama_10r_2gvagr) and average regional population (nama_10r_3popgdp). Because the volume index is normalised separately for each region, its level is not comparable across regions. Region fixed effects absorb this normalisation, which is why the measure is valid only in specifications with region fixed effects or in differences. Alternative outcomes are GDP per inhabitant in purchasing power standards (nama_10r_2gdp), the volume index of gross value added, employment in persons (nama_10r_3empers), the employment rate of those aged 20–64 (lfst_r_lfe2emprt) and the real labour productivity index (nama_10r_2rlp). The controls are pre-determined regional characteristics measured at : log population density (demo_r_d3dens) and the share of the population aged 25–64 with tertiary attainment (edat_lfse_04). Gross domestic expenditure on R&D as a percentage of GDP (rd_e_gerdreg) is added in a robustness check, because its many gaps would otherwise reduce the sample. Table 1 lists all sources.
3.3. Validity of the Regional Measure
Three checks support the use of ETER as a regional measurement instrument. First, ETER aims to cover the degree-awarding higher-education institutions of participating countries [21]. In the estimation sample, total ISCED 5–7 enrolment in ETER can be compared with Eurostat’s regional enrolment statistics (educ_uoe_enra11) for 1,059 region-years. The median ratio is 89%, and the interquartile range runs from 75% to 99%. Ratios below 100% are expected, because ETER covers short-cycle and small non-university providers only partly and assigns students to the region of the institution’s main seat. Second, the foreign-student share is computed within the HEIs that report both the numerator and the denominator. Missing reports therefore reduce precision but do not mechanically bias the share, provided reporting is unrelated to internationalisation conditional on the coverage threshold. Third, the measure reproduces well-known national patterns. Shares are high in Austria and Switzerland, which attract many students from neighbouring German-speaking countries, and low in Southern and Eastern European systems with less English-taught provision.
Two caveats remain. Citizenship-based counts classify long-term resident foreigners as international students and naturalised mobile students as domestic. This matters most in countries with large resident immigrant populations. The degree-mobile measure avoids this problem but is available for fewer countries. In addition, students are assigned to the region of their institution’s main seat, so students at branch campuses in other regions are misallocated. Both caveats add measurement error to the treatment and, in a fixed-effects design, attenuate the estimated coefficient. The post hoc checks in Section 5.2 assess the most visible form of this error.
3.4. NUTS Versions and Sample
ETER codes regions in NUTS 2021. At the time of download (November 2026), Eurostat’s regional accounts were published in NUTS 2024. Changes to NUTS-2 codes between the two versions mark boundary changes. The 5 affected regions (NL31, NL33, PT16, PT17, PT18) are therefore dropped rather than mapped approximately; all other codes are identical in the two versions. The main sample consists of EU-27 and EFTA regions with valid foreign-student shares and non-missing outcomes and controls. Norway and Switzerland have no regional GDP volume series, and countries with a single usable region are absorbed by the country-by-year effects. The estimation sample therefore contains 1,922 region-years in 216 regions of 21 countries, for outcome years 2013–2022.
Table 2 reports descriptive statistics. The average foreign-student share in the estimation sample is 8.74% (SD 6.62). After removing region and country-by-year means, however, the standard deviation of the treatment is only 1.84 percentage points, compared with 6.62 in the pooled data. Most variation in internationalisation is therefore cross-sectional and persistent, which matters for statistical power. Figure 1 maps the 2019–2021 average. Among countries with several regions, the median regional share is highest in Austria and Switzerland, followed by Ireland, Belgium, Germany and France. It is lowest in Croatia, Greece, Romania and Poland, and southern Italy also stands out with low shares. Figure 2 shows that the median CEE region more than quadrupled its foreign-student share, from 1.5% in 2011 to 6.9% in 2021. The median of the other EU and EFTA regions rose from 7.4% to 11.0%.
4. Empirical Strategy
4.1. Pre-Registered Main Specification
The main specification, fixed in the analysis plan before estimation, is
where is real GDP per capita of region r in year t (2013–2022) and is the foreign-student share in percent in the previous year. and are population density and tertiary attainment. are region fixed effects and are country-by-year fixed effects. Because the treatment is in percentage points, is the percentage change in real GDP per capita associated with a one-point higher share. Standard errors are clustered by region, which allows arbitrary serial correlation within regions [49]. No outlier trimming or specification search was performed. Estimation uses the pyfixest package for Python. Data retrieval scripts and analysis code were written with the assistance of a generative AI tool (Claude, Anthropic), and all code and outputs were checked by the authors. The decision rule was stated in advance. H2 is supported if and the 95% confidence interval excludes zero. Otherwise it is not supported, and the interval is used to bound plausible effect sizes.
Equation (1) is a two-way fixed-effects design with a continuous, time-varying treatment. Its coefficient is a variance-weighted average of within-region associations. With heterogeneous effects and dynamic responses, such averages can be hard to interpret [50]. The specification does not identify a causal effect if regional shocks to economic prospects also affect foreign enrolment. For example, a new university campus, a booming local labour market or targeted scholarship programmes could move both. It is best read as a test of whether within-region changes in internationalisation precede changes in output. Spatial dependence is a further concern, and the specification makes no strong spatial assumptions [51].
4.2. Secondary and Robustness Specifications
Pre-registered secondary specifications vary one element at a time:
- the growth form, in which the dependent variable is the annual log change in real GDP per capita;
- alternative outcomes;
- treatment lags of 0, 2 and 3 years;
- a specification with GERD as an additional control and one without controls;
- subsamples: CEE regions, regions other than those containing the national capital, EU-27 only, and the eight Hungarian regions (the last flagged as descriptive because of the small number of clusters);
- the alternative internationalisation measures.
To exploit the persistent cross-sectional variation, a long-difference specification relates the change in log real GDP per capita between 2012–2014 and 2020–2022 (three-year averages) to the change in the foreign-student share between 2011–2013 and 2019–2021. It conditions on initial log real GDP per capita, initial density, initial tertiary attainment and country fixed effects, with heteroskedasticity-robust standard errors. A reverse-timing regression of on with the fixed effects of Equation (1) asks whether income changes precede changes in internationalisation.
4.3. Shift-Share Instruments
To address endogeneity, the plan specified a shift-share (Bartik) instrument in the tradition of the immigration literature [52]. The instrument for is , where is the region’s foreign-student share in 2011–2012 (2013 if earlier years are missing). is an origin-push index for host country c:
where is the number of degree-mobile students from origin o enrolled in all other consistently reporting European host countries, and is host c’s 2013 origin mix (Eurostat educ_uoe_mobs02, 27 hosts with complete data 2013–2021). For hosts without a complete origin breakdown (in the sample: DE, EL, ES, IT, NL, SI), the pooled 2013 origin mix is used. An alternative instrument replaces with the leave-one-out growth of foreign students in the rest of the country.
The identifying assumption is that base-year shares are uncorrelated with subsequent regional output shocks, conditional on the fixed effects [53]. Alternatively, it is that the shifts are as good as randomly assigned [54]. With a single national shift per country-year, inference must also account for correlated shares [55]. Shift-share designs can additionally conflate short- and long-run responses when inflows are serially correlated [46]. Instrument strength is assessed with the cluster-robust first-stage F statistic (the squared t statistic for a single instrument). Conventional and robust thresholds are taken from [56,57].
4.4. Statistical Power
A null result is only informative if the design had a realistic chance of detecting effects of interest. The standard error of the main coefficient (0.085 in percentage terms) implies a minimum detectable effect of 0.24% of real GDP per capita per percentage point of foreign-student share. This is computed for a two-sided test at the 5% level with 80% power, as 2.8 times the standard error. Scaled to a one-standard-deviation within-region change, the minimum detectable effect is 0.44%. The design is therefore powered to detect effects of roughly half a percent of regional GDP per capita for a typical within-region change in internationalisation, but not much smaller effects. Effects below this threshold may exist, and the confidence intervals reported below show which magnitudes the data exclude.
4.5. Deviations from the Analysis Plan
The analysis plan was archived before estimation. Three deviations occurred, and all are reported. First, after inspecting Figure 2b, two data-quality checks were added that the plan did not contain. One treats the ETER suppression code ‘s’ as missing, and the other drops region-years with implausible year-on-year jumps. Both are labelled as post hoc, and neither replaces the pre-registered test. Second, the plan expected EU-27 and EFTA regions in the main sample. Because Norway and Switzerland lack regional GDP volume series and single-region countries are absorbed by the country-by-year effects, the effective sample is the 21 EU countries listed in Appendix B. Third, for host countries without a complete origin breakdown in Eurostat’s mobility statistics, the origin-push shift uses pooled European origin weights. The plan foresaw this fallback in general terms, but the list of affected countries became known only during construction.
A fourth group of analyses was added after peer review and is labelled as such wherever it appears: the decomposition of the treatment into the number of foreign students and total enrolment (Section 5.4), the extended data-quality checks (Section 5.5), the Hungarian descriptive evidence and bootstrap inference (Section 5.6), the diagnostics of the long-difference result (Section 5.7) and the calibration of measurement scale (Section 6.2). None of them replaces the pre-registered test, whose estimate and all pre-registered robustness checks are identical to those obtained before review. No observations were dropped and no specification was changed in order to alter the main result. Apart from the specifications listed in this section and in the analysis plan, no other regression was estimated.
5. Results
5.1. Main Estimates
Table 3 reports the main results. In the pre-registered specification (column 1), the coefficient is 0.090 (SE 0.085; ; N = 1,922; 216 regions). A one-percentage-point higher foreign-student share is associated with 0.090% higher real GDP per capita one year later. The 95% confidence interval runs from −0.077% to 0.257%. H2 is therefore not supported. The estimate is positive but small and statistically indistinguishable from zero. Columns 2–7 show that the conclusion depends on none of the specification choices. Dropping the controls gives 0.098 (SE 0.090). Adding GERD gives 0.116 (SE 0.093) in a smaller sample. In the growth form, the coefficient is −0.003 (SE 0.023). Lags of 0, 2 and 3 years give coefficients between 0.078 and 0.102, none of them statistically significant (Table 3).
Figure 3a visualises the main estimate. After partialling out the fixed effects and controls, the binned relationship between the residual foreign-student share and residual real GDP per capita is nearly flat. There is no sign that a non-linear relationship is masked by the linear fit.
To put the null result into perspective, consider the plausible magnitudes it excludes. A one-standard-deviation within-region change in the foreign-student share (1.84 percentage points) is associated with a 0.17% change in real GDP per capita. The 95% interval runs from −0.14% to 0.47%. Effects of the size often invoked in policy debates are thus inconsistent with the data at the horizon studied, for instance an extra percentage point of regional GDP per capita for a realistic increase in internationalisation.
5.2. Robustness
Table 4 and Figure 4 summarise the robustness checks. None of the alternative outcomes yields a significant association. The coefficient for GDP per capita in PPS is 0.109 (SE 0.074), for real GVA 0.114 (SE 0.080), for employment 0.041 (SE 0.061) and for real labour productivity 0.073 (SE 0.085). The employment rate has a negative point estimate of −0.052 percentage points per point of foreign-student share (). This is not significant at the 5% level and is not interpreted further. The EU-27 estimate is identical to the main one, because no EFTA region remains in the effective sample. In the CEE subsample the coefficient is 0.133 (SE 0.110; 54 regions). Excluding capital-city regions gives 0.087 (SE 0.082). For the eight Hungarian regions the point estimate is larger, 0.330, but very imprecise (SE 0.334). With so few clusters this estimate is descriptive only. The degree-mobile measure (0.037, SE 0.038; 149 regions) and Erasmus incoming students (0.299, SE 0.372) also give insignificant coefficients.
Table 4 also lists two post hoc data-quality checks that the analysis plan did not contain. They address suppression codes in ETER and are discussed in detail, together with four further checks requested by a reviewer, in Section 5.5. The Hungarian subsample estimate is examined in Section 5.6.
5.3. Identification Checks
Table 5 reports the identification checks. The long-difference specification (Panel A) yields a positive and statistically significant coefficient. Regions whose foreign-student share rose by one percentage point more between 2011–13 and 2019–21 saw 0.196% more growth in real GDP per capita between 2012–14 and 2020–22 (SE 0.079; ; 193 regions), conditional on initial income, density, tertiary attainment and country effects. Figure 3b shows that the spread of regions around this slope is large. The reverse-timing regression (Panel B) shows no association between lagged income and the current foreign-student share (−0.155 percentage points per log point, SE 3.842). This estimate is so imprecise that it neither supports nor rules out reverse causality.
Both shift-share instruments are weak. The origin-push instrument has a first-stage F of 0.20 (Panel C), and the leave-one-out instrument 1.09 (Panel D), far below any conventional threshold [56,57]. The corresponding 2SLS estimates (4.377, SE 7.973; and −0.511, SE 1.020) are therefore uninformative and are not interpreted. Within countries and years, the interaction between base-year regional shares and national inflow shifts does not predict which regions’ foreign-student shares rise. A plausible explanation is the rapid catch-up of initially less internationalised regions, visible in Figure 2: growth in foreign enrolment was not proportional to initial shares. The reduced forms (−0.613, SE 0.413; and −0.056, SE 0.097) show no significant relationship between the instruments and regional output either.
5.4. Share or Headcount? Numerator and Denominator
A rising foreign-student share need not mean more foreign students. In countries with shrinking domestic cohorts it can also reflect a falling denominator, and the economic implications of the two cases differ. This subsection, added at the request of a reviewer, separates them. It is a robustness analysis; the pre-registered treatment remains the share.
The decomposition is first descriptive. Across the 2,077 consecutive region-year pairs in the estimation universe, the share rose in 1,419 of them. In 7.3% of those increases the number of foreign students did not rise, so the increase was arithmetically driven by the denominator alone. Falling total enrolment contributed more often than that figure suggests: total enrolment fell in 47.0% of the region-years in which the share rose. A variance decomposition of the annual change in the log share into the growth of the numerator and the (negative) growth of the denominator attributes 97.7% to foreign enrolment and 2.3% to total enrolment. Over the decade the pattern is the same. Of the 218 regions observed in both 2013 and 2021, 166 increased their share; in only 6 of them did the foreign headcount fail to rise, although total enrolment fell in 74 of them. Shrinking domestic enrolment therefore amplifies measured internationalisation in many European regions, but it is not what generates it.
Table 6 re-estimates the main specification with the treatment in levels. The elasticity of real GDP per capita with respect to the number of foreign students at is 0.053 per 100 log points (SE 0.218; ), that is, 0.005% for a 10% larger foreign student body, with a 95% interval of −0.038% to 0.048%. Adding domestic enrolment (total minus foreign) as a separate regressor leaves the foreign coefficient at 0.080 (SE 0.232), while domestic enrolment itself enters with −0.550 (SE 0.925; ). Holding total enrolment constant, the share coefficient is 0.100 (SE 0.093), close to the pre-registered 0.090. Neither the numerator nor the denominator of the treatment carries a detectable association with regional output, and the null of the main specification is not an artefact of composition.
5.5. ETER Reporting Problems and the Robustness of the Null
Inspecting Figure 2b revealed a data-quality problem that the analysis plan did not anticipate. ETER replaces counts of 1–3 by the suppression code ‘s’, and the pre-registered rule sets such cells to the midpoint, 2. In some institutions the code is evidently applied to much larger values. The most extreme case in the sample is an institution in FR10, coded ‘s’ in 2014 although its reported foreign enrolment in other years ranges from 1,703 to 4,855. Under the pre-registered rule such cells produce artificial collapses and rebounds in the regional share, visible for several Hungarian regions in 2013–2015. The problem is not rare: ‘s’ codes occur at least once in 179 of the 248 regions of the estimation universe and affect 27.4% of the region-years used in the main specification. Three further features of ETER reporting matter. Coverage varies over time, which the 90% threshold handles only in part; institutions report the numerator and the denominator in different years, which the within-HEI construction of the share handles; and students are assigned to the main seat of the institution, which cannot be corrected at all.
Table 7 reports how the main estimate responds to these problems. Treating every ‘s’ code as missing, which drops region-years whose coverage then falls below the threshold, gives 0.054 (SE 0.103; ). Dropping the 40 region-years (of 2,591 with a defined change) whose share jumps by more than five percentage points gives 0.090 (SE 0.095). Restricting the sample to the regions never affected by an ‘s’ code gives −0.239 (SE 0.154; ), and adding the jump filter to that restriction gives −0.221 (SE 0.097; ). Finally, using only the outcome years 2016–2022, after which the Hungarian suppression artefacts disappear, gives 0.026 (SE 0.105).
Two points deserve emphasis. First, none of these corrections produces a positive and significant association; the null is robust to all of them. Second, the two rows restricted to never-suppressed regions are negative, and the stricter of the two is significant at the 5% level. These subsamples retain 49 of the 216 regions of the main sample, and the regions that survive are a selected group: they host large institutions whose counts are never small enough to be suppressed. The negative sign in a heavily selected fifth of the data is reported for completeness. It is not evidence that internationalisation reduces regional income, and it is not interpreted further.
5.6. The Hungarian Regions
The reviewer process asked for a closer look at Hungary, where the policy interest in internationalisation is high. Table 8 provides the descriptive background and the subsample estimates. Internationalisation in Hungary rose steeply but very unevenly. By 2021 4 of the seven non-capital regions had a higher foreign-student share than Budapest (10.8%), and the median non-capital region reached 11.1%. The largest increase is in HU23 (Pécs), from 0.02% in 2013 to 18.79% in 2021, followed by HU32 (Debrecen) and HU12. Two regions, HU22 (Gyor, Sopron) and HU31 (Miskolc, Eger), remained below 4%. The pattern is consistent with the concentration of English-language medical, dental and veterinary programmes in a few provincial university towns rather than with a nationwide shift. The table also shows why the early years must be read with care: the near-zero shares of HU12, HU21, HU23 and HU31 before 2016 coincide with ‘s’ codes on their main institutions and are measurement artefacts.
The Hungary-only estimate is 0.330 (SE 0.334), with a 95% interval of −0.459 to 1.119. The interval spans everything from a sizeable negative effect to an effect an order of magnitude larger than the European point estimate, so it is uninformative. With 8 clusters, cluster-robust standard errors are unreliable [49,58]; a wild cluster bootstrap with Rademacher weights, enumerating all 256 sign changes under the null, gives . Replacing the treatment by the ‘s’-as-missing measure, which removes the pre-2016 artefacts, raises the point estimate to 1.939 with an analytic p of 0.019; the bootstrap p for the same estimate is 0.137, and the bootstrap interval, −0.412 to 4.291, includes zero. Restricting the Hungarian sample to 2016–2022 gives 0.448 (SE 0.432). Nothing in this group of estimates can carry weight. Eight regions, nine years and a measurement artefact in the early years are not a basis for a country-specific conclusion, and these numbers should not be cited as Hungarian evidence for or against an effect. What they do establish is the shape of the Hungarian case: a small number of provincial university towns, each dominated by one institution, in regions whose economies are far larger than the institution. Section 6.2 shows why that configuration is invisible to a NUTS-2 panel.
5.7. Why the Long Difference Differs from the Panel
The one positive and significant result in the paper is the long difference of Panel A of Table 5. Because it is the result most easily over-interpreted, this subsection asks where its identifying variation comes from. Table 9 and Figure 5 collect the evidence.
The two designs use different variation. In the main estimation sample the standard deviation of the foreign-student share is 6.62 percentage points; after removing country-by-year means it is 4.58 points, and after removing region means as well only 1.84 points. The two-way fixed-effects design therefore works with 16.1% of the variance that survives country-by-year differencing, and with 7.7% of the total variance of the treatment. The long difference discards the annual dimension and compares decade-long changes across regions; 46.2% of the variance of those decade-long changes lies within countries, which is what the country fixed effects exploit.
The difference between the two results is one of precision rather than of magnitude. Restricting the two-way fixed-effects specification to the 193 regions of the long-difference sample gives 0.137 (SE 0.085; ), above the full-sample estimate. Estimating the same relationship in eight-year differences with country-by-year effects gives 0.204 (SE 0.126; ), which is the long-difference point estimate of 0.196 almost exactly, but with an interval that includes zero. Figure 5 shows the whole ladder: the coefficient rises monotonically from −0.005 at a one-year horizon (SE 0.030) to 0.204 at eight years, and the confidence interval widens with it. The long difference is thus the end point of a smooth horizon profile, not a separate finding.
Two features of the cross-section explain why it reaches significance where the eight-year panel difference does not. First, inference: the long difference has one observation per region and heteroskedasticity-robust standard errors, whereas the panel differences are clustered by region and overlap in time. Second, conditioning: dropping the initial-condition controls from the long difference moves the estimate to 0.215 (SE 0.134; ), no longer significant, so a substantial part of the result rests on conditioning on initial income, that is, on convergence. Dropping the country fixed effects instead inflates the coefficient to 0.786 (SE 0.137), confirming that the raw cross-country correlation between internationalisation and growth is several times larger than anything identified within countries. The result is not driven by one country: leave-one-country-out estimates range from 0.145 (FI) to 0.235 (PT) and remain significant at 5% in 27 of 31 cases.
Timing offers one piece of reassurance and no confirmation. A placebo regression of earlier output growth (2012–14 to 2015–17) on the later change in the foreign-student share (2015–17 to 2018–20) gives −0.177 (SE 0.152; ): regions that internationalised later were not already growing faster, which is what a simple reverse-causality or pre-trend story would predict. The sequentially ordered version, later growth on the earlier change in the share, gives 0.313 (SE 0.202; ), positive but not significant. Taken together, the evidence says that the long-difference association is a conditional cross-regional relationship over a decade which the within-region annual design can neither confirm nor exclude. It is consistent with a slow, cumulative effect; it is equally consistent with regions on favourable long-run trajectories both internationalising and growing. The data cannot separate the two, and the long difference is reported here as hypothesis-generating only.
6. Discussion
6.1. Interpreting the Null Result
The central finding is that within-region increases in the share of foreign students in tertiary enrolment were not followed by measurable increases in regional real GDP per capita in 2013–2022. This holds within countries and years, and over horizons of up to three years. It is consistent across outcomes, lags, subsamples, measures and the absolute number of foreign students.
The logic of this result needs to be stated carefully, because a non-significant coefficient is easily over-read. The estimate does not establish that internationalisation has no effect on regional economies. It establishes that, in this design, at this spatial scale and over this horizon, no clear association between the two is detectable, and that effects above a certain size are inconsistent with the data. The confidence interval is the informative part: it rules out gains larger than 0.47% of real GDP per capita for a one-standard-deviation within-region change in internationalisation, while remaining compatible with everything below that bound, including effects that are real but small, effects that operate on outcomes other than aggregate output, and effects that appear after the sample period. Absence of evidence at one scale and horizon is not evidence of absence. The three subsections that follow ask, in turn, what magnitudes this design could have seen, how the result compares with the literature, and what it leaves open.
Several features of the setting make a small short-run effect plausible. First, the scale of the treatment is modest. In the estimation sample, foreign students make up on average 8.74% of tertiary enrolment, and a much smaller fraction of the regional population, so their direct spending is small relative to regional GDP [23]. Second, the channels most emphasised in the literature (human capital retention, innovation, network building) operate with long lags and only partly locally. Graduates are mobile [36,37,38], and international mobility during studies raises later mobility abroad [11]. A region can thus educate many foreign students without retaining them. Third, the innovation evidence for international students concerns highly selected doctoral and graduate populations in research universities [14,15]. The ETER measure pools all ISCED 5–7 students, including programmes recruited for fee income rather than research capacity [6,16].
The contrast between the null two-way fixed-effects estimate and the positive long-difference estimate was examined in Section 5.7. Three findings there constrain its interpretation. The two estimates do not disagree about magnitude: the same relationship measured in eight-year differences within countries gives 0.204 (SE 0.126), essentially the long-difference coefficient, but cannot be distinguished from zero. The significance of the cross-section depends on conditioning on initial income, without which it disappears (0.215; ). And the coefficient rises smoothly with the horizon rather than appearing only in the decade comparison. One reading of that profile is that the effects of internationalisation build up slowly, consistent with the cumulative nature of human-capital and agglomeration effects [8,24,26]. A second is that regions on a favourable long-run trajectory expanded internationalisation and grew faster for common reasons, for example because they host expanding research universities [45,47]; initial income and human capital are controlled, but region-specific trends are not. The placebo test in Section 5.7 rules out the simplest version of the second reading, since later internationalisation does not predict earlier growth, but it does not rule out a common slow-moving driver. The weak instruments prevent going further. The long-difference result is therefore hypothesis-generating, not a confirmation of H2, and it is not reported here as evidence of a slow effect.
6.2. What a NUTS-2 Panel Can Detect: A Calibration
A reviewer observed, correctly, that regional GDP need not capture what international students contribute to a local economy, and that the places where the contribution is visible are university towns rather than NUTS-2 regions. This subsection makes that argument quantitative, using the panel itself and arithmetic that requires no currency conversion.
Take HU33 (Dél-Alföld, the region of Szeged and Kecskemét) in 2022 as a representative provincial case: 1,203 thousand inhabitants, 25,571 tertiary students, GDP per capita of EUR 12,700 (PPS 19,700), and a regional economy of about EUR 15.3 billion. Tertiary students are 21.3 per thousand inhabitants; the median non-capital CEE region in the sample is almost identical at 22.5 per thousand (37 regions). A one-percentage-point increase in the foreign-student share means about 256 additional international students in such a region. Suppose each of them spends locally a fraction of regional GDP per capita, which for between 25% and 40% is EUR 3,175 to EUR 5,080 a year, an order of magnitude consistent with the local university-impact literature [23]. The direct demand effect is then 0.0053% to 0.0085% of regional GDP. Applying a local income multiplier of 1.3 to 1.8 gives 0.007% to 0.015% of regional GDP per percentage point of foreign-student share. The same calculation for the median non-capital CEE region gives 0.016% at the upper end.
The minimum detectable effect of the design is 0.24% per percentage point (Section 4.4). The demand channel is therefore roughly 16 times smaller than what this panel could detect, even under generous assumptions about spending and multipliers. For a single institution the gap is larger still. An institution with 700 international students accounts for 2.74 percentage points of tertiary enrolment in HU33, implying a demand effect of 0.019% to 0.042% of regional GDP; the present estimate for a change of that size is 0.25%, with a 95% interval from −0.21% to 0.70%. The institution-level magnitude sits comfortably inside that interval, which is to say that the panel is silent about it.
Three consequences follow. First, the null result and the local impact studies routinely produced for individual universities are not in conflict; they are measuring different things at different resolutions, and a NUTS-2 annual panel cannot adjudicate the latter. Second, the aggregation itself destroys the signal: a university town is a small part of a NUTS-2 region, so a concentrated local effect is diluted by the surrounding territory, a classic instance of the dependence of spatial estimates on the size and shape of the units [59]. Third, the useful test of demand-side effects is not a larger panel of regions but a finer spatial scale: NUTS-3 units, LAU-level municipalities or travel-to-work areas around university towns, with outcomes such as local employment, business registrations, retail turnover and rents rather than regional GDP per capita. Where administrative microdata allow it, student-level and firm-level linkage is better still. The present design should be read as establishing an upper bound at the regional scale, and as an argument for moving the question down one or two levels of spatial aggregation.
6.3. Comparison with Previous Evidence
How does the null result relate to the positive associations between universities and regional development reported in the literature? Three differences in design are relevant. First, the treatment differs. Most studies examine the presence, number, research intensity or efficiency of universities [8,31,32,33]. The present study examines one dimension of their student body, holding the universities themselves fixed through region fixed effects. A region can become more internationalised without any change in its universities’ size or research capacity, for example through the recruitment of fee-paying students into existing programmes. Second, the horizon differs. Studies that find large effects often exploit long-run variation over decades [8,27] or discrete shocks with strong first stages [28,29]. Here, the within-region variation spans a decade, and most of it is short-run. Third, the outcome differs. Studies of international students in the United States find effects on patents and scientific output [14,15], but such effects need not translate into measurable changes in aggregate regional GDP within a few years.
The positive long-difference association fits the cross-sectional and long-run evidence in the literature better than the short-run panel estimates do. Regions that internationalised more over the decade also grew more, conditional on initial income, density, tertiary attainment and country. The magnitude, 0.196% of real GDP per capita per percentage point, is about twice the panel estimate, but it remains economically modest. Whether this reflects slow causal effects or regional trajectories that attract both foreign students and growth cannot be decided with the present data. It identifies a hypothesis for future work with stronger identification.
The results also speak to the literature on diversity and regional innovation [40,41,42]. That literature usually measures diversity in the resident workforce rather than among students. Students are a transient population; their contribution to workforce diversity depends on retention, which international mobility can reduce [11]. The absence of short-run output effects is therefore consistent with the view that the regional benefits of international students depend on whether they stay and integrate into local labour markets.
6.4. Central and Eastern Europe and Hungary
The CEE regions are the most interesting group for policy, because their internationalisation rose fastest. The CEE coefficient is similar to the full-sample estimate and also insignificant. The Hungarian case illustrates both the policy interest and the measurement challenges. Several Hungarian regions outside Budapest, notably those hosting large universities with medical faculties, reached foreign-student shares well above the Budapest level by 2021 (Figure 2b). In ETER, however, part of the 2013–2015 series is affected by suppression codes. With eight regions, the Hungarian estimate cannot be distinguished from zero or from effects several times the European average. Country-specific conclusions will require municipal or institution-level outcomes, longer series or quasi-experimental variation, such as the opening of new programmes or scholarship schemes.
6.5. Limitations
Six limitations qualify the findings, and each of them bounds what the null result can be taken to mean.
Concept. Only the student dimension of internationalisation is measured (Section 2.3). Staff mobility, international research income and co-publication, joint programmes and institutional partnerships are not observed at NUTS-2 level for this period. If the economic payoff of internationalisation runs mainly through research collaboration or the recruitment of international faculty, this design would not see it, and nothing reported here speaks to those channels.
Measurement. ETER covers most but not all tertiary enrolment, its coverage varies over time, and the foreign-student variable is citizenship-based, so it includes long-term resident foreigners and excludes naturalised mobile students. Students are assigned to the main seat of their institution, which misplaces branch-campus enrolment. The coverage thresholds and the checks in Section 5.5 reduce but cannot eliminate measurement error, which attenuates estimates toward zero.
Outcome. The outcome is aggregate regional output. Regional GDP per capita is a coarse instrument for the economic contribution of international students: it nets their consumption against imports, records their spending only where it is produced, and says nothing about who in the region gains. Local consumption, employment in student-serving services, housing demand, business formation and the revenue that fee income brings to universities are all plausible margins that regional GDP compresses into a single number or omits [16,18,23]. Distributional effects, sectoral effects, fiscal effects on universities and effects on sending regions are not studied, and these may be where the benefits are concentrated [17,18,19].
Horizon. The window 2013–2022 is short relative to the mechanisms at stake. International students must graduate, obtain work permits, enter local labour markets, accumulate experience and, in some cases, found firms before their presence can register in regional output; evidence on immigrant innovation and entrepreneurship suggests that these effects appear years after entry and are concentrated among particular groups [14,19,60]. The large expansion of international enrolment in Central and Eastern Europe occurred in the second half of the window, so for many regions the panel observes the inflow and not its consequences. The sample also includes the COVID-19 shock: country-by-year effects absorb national shocks, but regional exposure differed by economic structure. The horizon profile in Figure 5 is consistent with effects that need more than a decade to appear, and a panel that ends in 2022 cannot test that.
Spatial scale. The treatment is concentrated in university towns while the outcome is measured over whole NUTS-2 regions, which typically contain one such town and a large non-university hinterland. Section 6.2 shows that the resulting dilution is severe enough to place plausible demand-side effects roughly 16 times below the minimum detectable effect. Estimates of this kind depend on the size and shape of the spatial units [59], and the units used here are almost certainly too large for the question.
Identification. The two-way fixed-effects estimates are conditional associations, not causal effects. Both shift-share instruments have first-stage F statistics far below any usable threshold, so the instrumental-variable estimates are uninformative and no causal claim is made anywhere in this article. Reverse causality is not ruled out by the data, only bounded by the reverse-timing and placebo regressions, both of which are imprecise.
6.6. Implications for Policy and Research
For regional policy, the results caution against justifying internationalisation strategies mainly by expected short-run gains in regional GDP. The data are consistent with modest benefits at best on that horizon. Internationalisation may still be valuable for other reasons: the financial sustainability of universities in shrinking domestic markets, academic quality and international connectivity, or long-run talent attraction. The weaker the evidence for automatic regional spillovers, the more weight falls on complementary policies. These include retaining graduates, links between universities and regional firms, and institutional quality in lagging regions [34,35,48]. For research, three steps follow. One is to obtain regional series of international graduates and stay rates. Another is to build longer panels that allow distributed-lag and event-study designs around discrete internationalisation shocks. The third is to use shift-share designs at the level of fields or institutions, where the shares have more variation [53,54].
7. Conclusions
This article asked whether European NUTS-2 regions whose higher-education systems become more internationalised subsequently become richer. Following a pre-registered design that combines institution-level ETER data with Eurostat regional accounts, no clear association is detectable for 2013–2022. Within regions and relative to other regions in the same country and year, a one-percentage-point higher foreign-student share is associated with a 0.090% change in real GDP per capita (95% CI −0.077 to 0.257). The result holds across outcomes, lags, subsamples, measures, the absolute number of foreign students and a series of data-quality corrections.
Three qualifications belong in the same sentence as the result. First, this is a null finding, not a demonstration of absence. The data are inconsistent with gains above 0.47% of regional GDP per capita for a typical within-region change in internationalisation; everything below that bound remains possible, including effects on outcomes this study does not measure. Second, no causal interpretation is available in either direction. Both shift-share instruments are too weak to use, so the estimates are conditional associations; the article makes no causal claim, and neither should readers of it. Third, scale and horizon are binding. A calibration in Section 6.2 shows that the local demand effect of a single internationalising university is roughly 16 times smaller than what a NUTS-2 annual panel can detect, and the mechanisms that would generate larger effects — graduate retention, entrepreneurship, innovation, trade and investment links built by alumni — operate over horizons longer than the decade observed here. The positive cross-sectional long difference is consistent with such slow accumulation, but equally consistent with favourable regional trajectories that produce both internationalisation and growth, and it is reported as a hypothesis rather than as support for H2.
The hypothesis is therefore not supported in the tested form, at this spatial scale and over this horizon. For urban and regional policy, the implication is not that internationalisation is economically irrelevant, but that its case should rest on mechanisms that can be observed and nurtured locally — graduate retention, links between universities and regional firms, the financial sustainability of institutions in shrinking domestic markets — rather than on the expectation of automatic gains in regional output. For research, the implication is a change of resolution: the question should be asked of university towns and their labour markets, with outcomes closer to the mechanisms than regional GDP per capita.
Supplementary Materials
The following supporting information can be downloaded at the website of this paper posted on Preprints.org, The replication package (code, processed data, analysis plan, download log with checksums and reference verification table) is provided as supplementary material.
Author Contributions
All authors contributed equally to this work. All authors have read and agreed to the published version of the manuscript.
Funding
This research received no external funding.
Institutional Review Board Statement
Not applicable.
Informed Consent Statement
Not applicable.
Data Availability Statement
All data are publicly available. ETER data: Zenodo, https://doi.org/10.5281/zenodo.10879501 (CC BY 4.0). Eurostat data: Eurostat dissemination API, dataset codes listed in Table 1, retrieved on 11 November 2026. NUTS boundaries: Eurostat GISCO. The code, processed panel, analysis plan and the scripts that generate every number, table and figure in this article are provided in the supplementary replication package and will be deposited in a public repository upon acceptance.
Acknowledgments
During the preparation of this manuscript, the authors used Claude (Anthropic) for the purposes of data retrieval scripting, statistical analysis code, and drafting of text. The authors have reviewed and edited the output and take full responsibility for the content of this publication.
Conflicts of Interest
The authors declare no conflicts of interest.
Abbreviations
The following abbreviations are used in this manuscript:
| CEE | Central and Eastern Europe |
| ETER | European Tertiary Education Register |
| FE | Fixed effects |
| GERD | Gross domestic expenditure on research and development |
| GVA | Gross value added |
| HEI | Higher-education institution |
| ISCED | International Standard Classification of Education |
| NUTS | Nomenclature of Territorial Units for Statistics |
| PPS | Purchasing power standards |
| 2SLS | Two-stage least squares |
Appendix A. Data Construction Protocol
The regional panel is built by the replication code in four steps. All steps are deterministic and use only the downloaded raw files.
Step 1: HEI records. Each ETER record (HEI × reference year) is retained if it has a valid NUTS-2 code (four characters, not an extra-regio code) and a positive numeric total of ISCED 5–7 enrolment. Foreign, degree-mobile and Erasmus-incoming counts are converted to numbers. The ETER special code ‘s’ (values 1–3 suppressed for confidentiality) is set to 2, and the codes ‘m’ (missing), ‘a’ (not applicable), ‘x’, ‘xc’, ‘xr’ (included elsewhere), ‘nc’ (not collected) and ‘c’ (confidential) are treated as missing.
Step 2: Regional aggregation. For each region and year, total ETER enrolment is summed over all retained HEIs. For each measure, the numerator and the denominator are summed over the HEIs that report the measure. A share is computed only if these HEIs account for at least 90% of total ETER enrolment in the region and for at least 500 students.
Step 3: Outcomes and controls. Eurostat tables are filtered to NUTS-2 codes. Regions whose code differs between NUTS 2021 and NUTS 2024 (NL31, NL33, PT16, PT17, PT18) are dropped. Real GDP per capita is the log of the GDP volume index minus the log of average population. All controls enter with a one-year lag.
Step 4: Instruments. Base-year shares, origin-push shifts and leave-one-out national growth rates are constructed as described in Section 4. They use Eurostat educ_uoe_mobs02 (total of both sexes, ISCED 5–8, individual origin countries only).
A download log with URLs, retrieval dates and MD5 checksums, the processed panel and the analysis plan are part of the replication package.
Appendix B. Estimation Sample
The main estimation sample contains NUTS-2 regions in the following countries (ISO codes, with EL for Greece): AT, BE, BG, CZ, DE, DK, EL, ES, FI, FR, HU, IE, IT, LT, NL, PL, PT, RO, SE, SI, SK. Countries in the ETER data but not in the estimation sample were excluded for one of five reasons: no regional GDP volume series (Norway, Switzerland); a single usable NUTS-2 region (e.g., Cyprus, Estonia, Luxembourg, Malta), which the country-by-year effects absorb; no ETER foreign-student counts (Latvia); missing lagged controls for the NUTS 2021 regions (Croatia, where Eurostat’s population-density series is available mainly for the earlier regional breakdown); or non-membership in the EU-27/EFTA (candidate countries and the United Kingdom).
References
- Knight, J. Internationalization Remodeled: Definition, Approaches, and Rationales. Journal of Studies in International Education 2004, 8, 5–31. [CrossRef]
- Teichler, U. The Changing Debate on Internationalisation of Higher Education. Higher Education 2004, 48, 5–26. [CrossRef]
- de Wit, H.; Altbach, P.G. Internationalization in higher education: global trends and recommendations for its future. Policy Reviews in Higher Education 2021, 5, 28–46. [CrossRef]
- Rodríguez-Pose, A. The revenge of the places that don’t matter (and what to do about it). Cambridge Journal of Regions, Economy and Society 2018, 11, 189–209. [CrossRef]
- Iammarino, S.; Rodriguez-Pose, A.; Storper, M. Regional inequality in Europe: evidence, theory and policy implications. Journal of Economic Geography 2019, 19, 273–298. [CrossRef]
- Seeber, M.; Cattaneo, M.; Huisman, J.; Paleari, S. Why do higher education institutions internationalize? An investigation of the multilevel determinants of internationalization rationales. Higher Education 2016, 72, 685–702. [CrossRef]
- Drucker, J.; Goldstein, H. Assessing the Regional Economic Development Impacts of Universities: A Review of Current Approaches. International Regional Science Review 2007, 30, 20–46. [CrossRef]
- Valero, A.; Van Reenen, J. The economic impact of universities: Evidence from across the globe. Economics of Education Review 2019, 68, 53–67. [CrossRef]
- Gennaioli, N.; La Porta, R.; Lopez-de Silanes, F.; Shleifer, A. Human Capital and Regional Development. The Quarterly Journal of Economics 2013, 128, 105–164. [CrossRef]
- Beine, M.; Noël, R.; Ragot, L. Determinants of the international mobility of students. Economics of Education Review 2014, 41, 40–54. [CrossRef]
- Parey, M.; Waldinger, F. Studying Abroad and the Effect on International Labour Market Mobility: Evidence from the Introduction of ERASMUS. The Economic Journal 2011, 121, 194–222. [CrossRef]
- Findlay, A.M. An Assessment of Supply and Demand-side Theorizations of International Student Mobility. International Migration 2011, 49, 162–190. [CrossRef]
- King, R.; Raghuram, P. International Student Migration: Mapping the Field and New Research Agendas. Population, Space and Place 2013, 19, 127–137. [CrossRef]
- Chellaraj, G.; Maskus, K.E.; Mattoo, A. The Contribution of International Graduate Students to US Innovation. Review of International Economics 2008, 16, 444–462. [CrossRef]
- Stuen, E.T.; Mobarak, A.M.; Maskus, K.E. Skilled Immigration and Innovation: Evidence from Enrolment Fluctuations in us Doctoral Programmes. The Economic Journal 2012, 122, 1143–1176. [CrossRef]
- Bound, J.; Braga, B.; Khanna, G.; Turner, S. A Passage to America: University Funding and International Students. American Economic Journal: Economic Policy 2020, 12, 97–126. [CrossRef]
- Shih, K. Do international students crowd-out or cross-subsidize Americans in higher education? Journal of Public Economics 2017, 156, 170–184. [CrossRef]
- Machin, S.; Murphy, R. Paying out and crowding out? The globalization of higher education. Journal of Economic Geography 2017, 17, 1075–1110. [CrossRef]
- Kerr, S.P.; Kerr, W.; Özden, Ç.; Parsons, C. Global Talent Flows. Journal of Economic Perspectives 2016, 30, 83–106. [CrossRef]
- Bound, J.; Braga, B.; Khanna, G.; Turner, S. The Globalization of Postsecondary Education: The Role of International Students in the US Higher Education System. Journal of Economic Perspectives 2021, 35, 163–184. [CrossRef]
- Lepori, B.; Lambrechts, A.A.; Wagner-Schuster, D.; Zahradnik, G. The European Tertiary Education Register, the reference dataset on European Higher Education Institutions. Scientific Data 2023, 10, 438. [CrossRef]
- Wagner-Schuster, D.; Lepori, B.; Zahradnik, G.; Lambrechts, A.; Schön, L. ETER – Full Dataset (csv; March 26th, 2024). Zenodo dataset, 2024. [CrossRef]
- Pastor, J.M.; Pérez, F.; Fernández de Guevara, J. Measuring the local economic impact of universities: an approach that considers uncertainty. Higher Education 2013, 65, 539–564. [CrossRef]
- Gennaioli, N.; La Porta, R.; Lopez De Silanes, F.; Shleifer, A. Growth in regions. Journal of Economic Growth 2014, 19, 259–309. [CrossRef]
- Rodríguez-Pose, A.; Tselios, V. Education and Income Inequality in the Regions of the European Union. Journal of Regional Science 2009, 49, 411–437. [CrossRef]
- Moretti, E. Estimating the social return to higher education: evidence from longitudinal and repeated cross-sectional data. Journal of Econometrics 2004, 121, 175–212. [CrossRef]
- Andrews, M.J. How Do Institutions of Higher Education Affect Local Invention? Evidence from the Establishment of US Colleges. American Economic Journal: Economic Policy 2023, 15, 1–41. [CrossRef]
- Hausman, N. University Innovation and Local Economic Growth. The Review of Economics and Statistics 2022, 104, 718–735. [CrossRef]
- Kantor, S.; Whalley, A. Knowledge Spillovers from Research Universities: Evidence from Endowment Value Shocks. The Review of Economics and Statistics 2014, 96, 171–188. [CrossRef]
- Goldstein, H.; Renault, C. Contributions of Universities to Regional Economic Development: A Quasi-experimental Approach. Regional Studies 2004, 38, 733–746. [CrossRef]
- Schubert, T.; Kroll, H. Universities’ effects on regional GDP and unemployment: The case of Germany. Papers in Regional Science 2016, 95, 467–490. [CrossRef]
- Cowan, R.; Zinovyeva, N. University effects on regional innovation. Research Policy 2013, 42, 788–800. [CrossRef]
- Agasisti, T.; Barra, C.; Zotti, R. Research, knowledge transfer, and innovation: The effect of Italian universities’ efficiency on local economic development 2006–2012. Journal of Regional Science 2019, 59, 819–849. [CrossRef]
- Gunasekara, C. Reframing the Role of Universities in the Development of Regional Innovation Systems. The Journal of Technology Transfer 2006, 31, 101–113. [CrossRef]
- Uyarra, E. Conceptualizing the Regional Roles of Universities, Implications and Contradictions. European Planning Studies 2010, 18, 1227–1246. [CrossRef]
- Abel, J.R.; Deitz, R. Do colleges and universities increase their region’s human capital? Journal of Economic Geography 2012, 12, 667–691. [CrossRef]
- Faggian, A.; McCann, P. Human capital, graduate migration and innovation in British regions. Cambridge Journal of Economics 2008, 33, 317–333. [CrossRef]
- Haapanen, M.; Tervo, H. Migration of the Highly Educated: Evidence from Residence Spells of University Graduates. Journal of Regional Science 2012, 52, 587–605. [CrossRef]
- Winters, J.V. Human capital, higher education institutions, and quality of life. Regional Science and Urban Economics 2011, 41, 446–454. [CrossRef]
- Ottaviano, G.I.; Peri, G. The economic value of cultural diversity: evidence from US cities. Journal of Economic Geography 2006, 6, 9–44. [CrossRef]
- Gagliardi, L. Does skilled migration foster innovative performance? Evidence from British local areas. Papers in Regional Science 2015, 94, 773–795. [CrossRef]
- Bratti, M.; Conti, C. The effect of immigration on innovation in Italy. Regional Studies 2018, 52, 934–947. [CrossRef]
- Bathelt, H.; Malmberg, A.; Maskell, P. Clusters and knowledge: local buzz, global pipelines and the process of knowledge creation. Progress in Human Geography 2004, 28, 31–56. [CrossRef]
- Boschma, R. Proximity and Innovation: A Critical Assessment. Regional Studies 2005, 39, 61–74. [CrossRef]
- Lepori, B.; Seeber, M.; Bonaccorsi, A. Competition for talent. Country and organizational-level effects in the internationalization of European higher education institutions. Research Policy 2015, 44, 789–802. [CrossRef]
- Jaeger, D.; Ruist, J.; Stuhler, J. Shift-Share Instruments and the Impact of Immigration. NBER Working Paper 24285, National Bureau of Economic Research, Cambridge, MA, USA, 2018. [CrossRef]
- Crescenzi, R.; Rodriguez-Pose, A.; Storper, M. The territorial dynamics of innovation: a Europe United States comparative analysis. Journal of Economic Geography 2007, 7, 673–709. [CrossRef]
- Rodríguez-Pose, A.; Ketterer, T. Institutional change and the development of lagging regions in Europe. Regional Studies 2020, 54, 974–986. [CrossRef]
- Cameron, A.C.; Gelbach, J.B.; Miller, D.L. Bootstrap-Based Improvements for Inference with Clustered Errors. Review of Economics and Statistics 2008, 90, 414–427. [CrossRef]
- de Chaisemartin, C.; D’Haultfœuille, X. Two-Way Fixed Effects Estimators with Heterogeneous Treatment Effects. American Economic Review 2020, 110, 2964–2996. [CrossRef]
- Gibbons, S.; Overman, H.G. Mostly Pointless Spatial Econometrics? Journal of Regional Science 2012, 52, 172–191. [CrossRef]
- Card, D. Immigrant Inflows, Native Outflows, and the Local Labor Market Impacts of Higher Immigration. Journal of Labor Economics 2001, 19, 22–64. [CrossRef]
- Goldsmith-Pinkham, P.; Sorkin, I.; Swift, H. Bartik Instruments: What, When, Why, and How. American Economic Review 2020, 110, 2586–2624. [CrossRef]
- Borusyak, K.; Hull, P.; Jaravel, X. Quasi-Experimental Shift-Share Research Designs. The Review of Economic Studies 2022, 89, 181–213. [CrossRef]
- Adão, R.; Kolesár, M.; Morales, E. Shift-Share Designs: Theory and Inference. The Quarterly Journal of Economics 2019, 134, 1949–2010. [CrossRef]
- Stock, J.H.; Yogo, M. Testing for Weak Instruments in Linear IV Regression. In Identification and Inference for Econometric Models; Andrews, D.W.K.; Stock, J.H., Eds.; Cambridge University Press: Cambridge, UK, 2005; pp. 80–108. [CrossRef]
- Olea, J.L.M.; Pflueger, C. A Robust Test for Weak Instruments. Journal of Business & Economic Statistics 2013, 31, 358–369. [CrossRef]
- MacKinnon, J.G.; Webb, M.D. Wild Bootstrap Inference for Wildly Different Cluster Sizes. Journal of Applied Econometrics 2017, 32, 233–254. [CrossRef]
- Briant, A.; Combes, P.P.; Lafourcade, M. Dots to boxes: Do the size and shape of spatial units jeopardize economic geography estimations? Journal of Urban Economics 2010, 67, 287–302. [CrossRef]
- Hunt, J. Which Immigrants Are Most Innovative and Entrepreneurial? Distinctions by Entry Visa. Journal of Labor Economics 2011, 29, 417–457. [CrossRef]
Figure 1.
Foreign-student share in ISCED 5–7 enrolment by NUTS-2 region, mean of valid years 2019–2021. Regions are coded in NUTS 2021. Grey regions have no valid ETER data: either the region was not reported (e.g., the United Kingdom after 2016, Latvia, Slovenia after 2016) or reporting HEIs cover less than 90% of regional enrolment. Sources: ETER, Eurostat GISCO.
Figure 1.
Foreign-student share in ISCED 5–7 enrolment by NUTS-2 region, mean of valid years 2019–2021. Regions are coded in NUTS 2021. Grey regions have no valid ETER data: either the region was not reported (e.g., the United Kingdom after 2016, Latvia, Slovenia after 2016) or reporting HEIs cover less than 90% of regional enrolment. Sources: ETER, Eurostat GISCO.
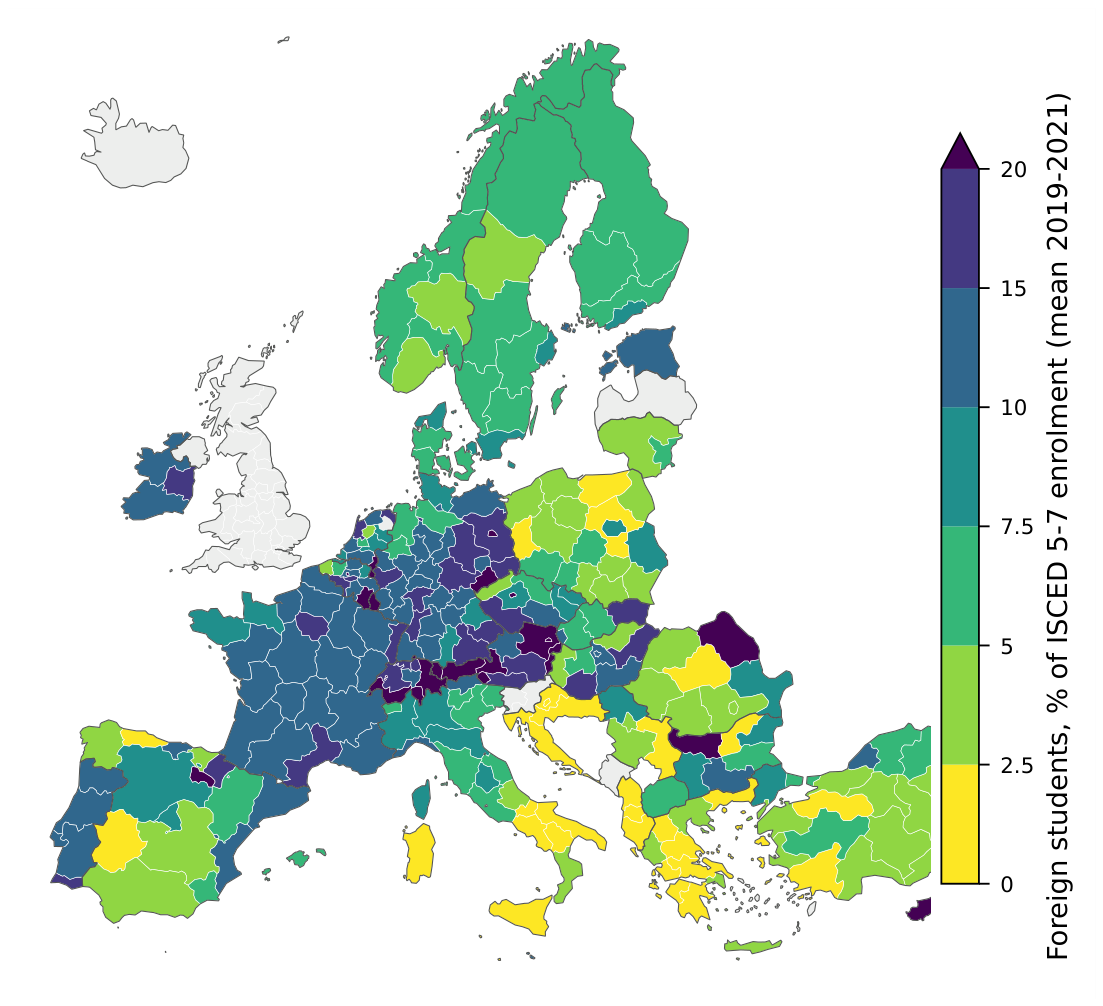
Figure 2.
Foreign-student shares over time. (a) Median (line) and interquartile range (band) across NUTS-2 regions with valid data in Central and Eastern Europe (BG, CZ, EE, HR, HU, LT, LV, PL, RO, SI, SK) and in other EU and EFTA countries. (b) Hungarian NUTS-2 regions. ETER has no Hungarian foreign-student data for 2012. The collapse of several regions in 2013–2015 reflects suppression codes on large institutions, not a real decline (Section 5.2).
Figure 2.
Foreign-student shares over time. (a) Median (line) and interquartile range (band) across NUTS-2 regions with valid data in Central and Eastern Europe (BG, CZ, EE, HR, HU, LT, LV, PL, RO, SI, SK) and in other EU and EFTA countries. (b) Hungarian NUTS-2 regions. ETER has no Hungarian foreign-student data for 2012. The collapse of several regions in 2013–2015 reflects suppression codes on large institutions, not a real decline (Section 5.2).
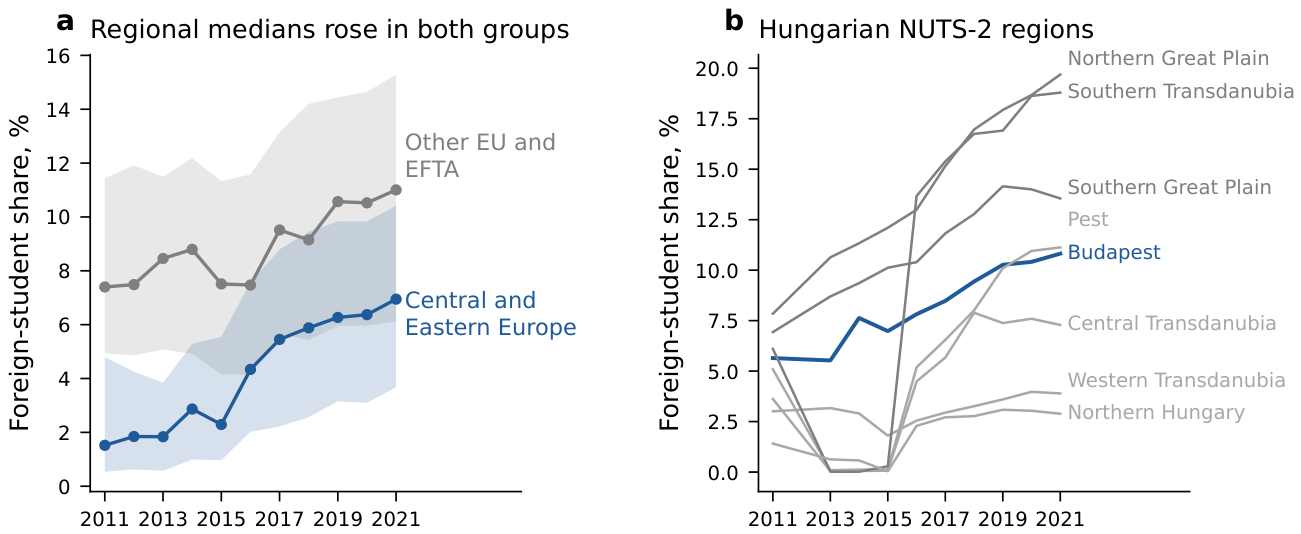
Figure 3.
Residual relationships. (a) Real GDP per capita against the lagged foreign-student share, both residualised on region and country-by-year fixed effects and the controls (Frisch–Waugh–Lovell). Grey dots are region-years (N = 1,922); diamonds are means of 20 quantile bins; the line has the slope of Table 3, column 1. Axes are cropped at the 0.5th and 99.5th percentiles. (b) Long difference: change in log real GDP per capita (2012–14 to 2020–22) against the change in the foreign-student share (2011–13 to 2019–21), both residualised on country fixed effects and initial conditions (N = 193 regions).
Figure 3.
Residual relationships. (a) Real GDP per capita against the lagged foreign-student share, both residualised on region and country-by-year fixed effects and the controls (Frisch–Waugh–Lovell). Grey dots are region-years (N = 1,922); diamonds are means of 20 quantile bins; the line has the slope of Table 3, column 1. Axes are cropped at the 0.5th and 99.5th percentiles. (b) Long difference: change in log real GDP per capita (2012–14 to 2020–22) against the change in the foreign-student share (2011–13 to 2019–21), both residualised on country fixed effects and initial conditions (N = 193 regions).
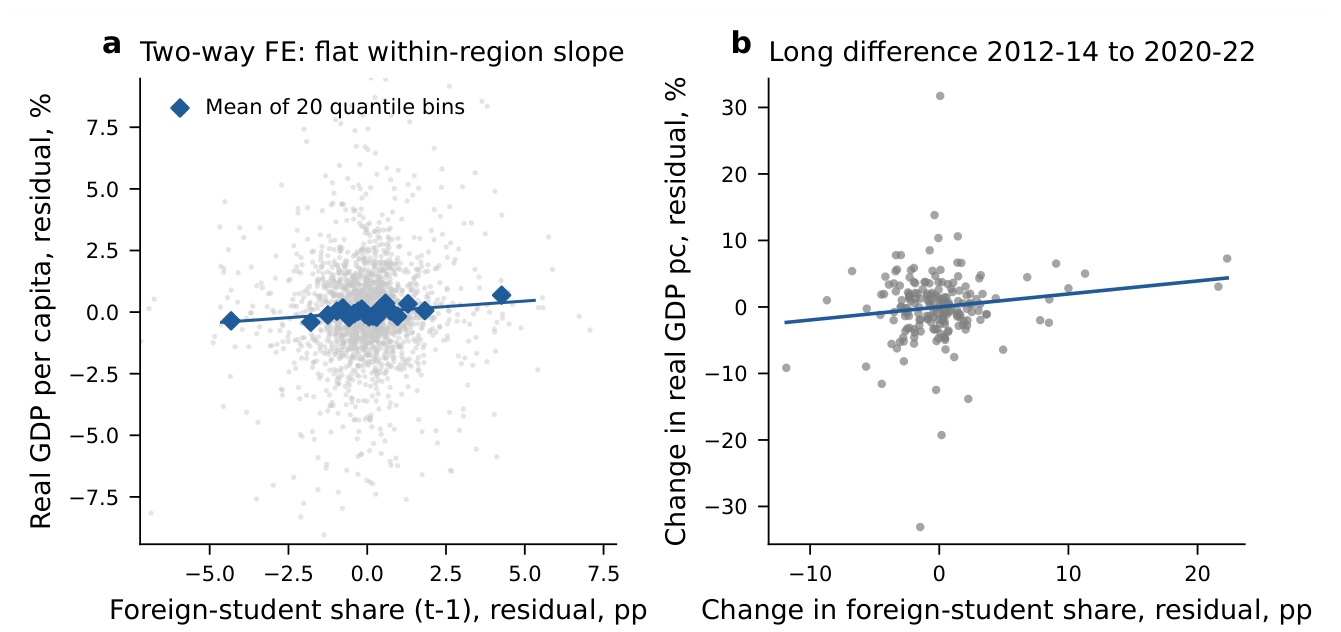
Figure 4.
Coefficient estimates and 95% confidence intervals across specifications. All outcomes are in logs; the coefficient is the percentage change associated with a one-percentage-point higher internationalisation measure. All rows except the last use region and country-by-year fixed effects and SEs clustered by region; the long difference is a cross-section with country fixed effects and robust SEs. The Hungarian interval is truncated by the axis limits. Erasmus and employment-rate results, which are on different scales, are reported in Table 4.
Figure 4.
Coefficient estimates and 95% confidence intervals across specifications. All outcomes are in logs; the coefficient is the percentage change associated with a one-percentage-point higher internationalisation measure. All rows except the last use region and country-by-year fixed effects and SEs clustered by region; the long difference is a cross-section with country fixed effects and robust SEs. The Hungarian interval is truncated by the axis limits. Erasmus and employment-rate results, which are on different scales, are reported in Table 4.
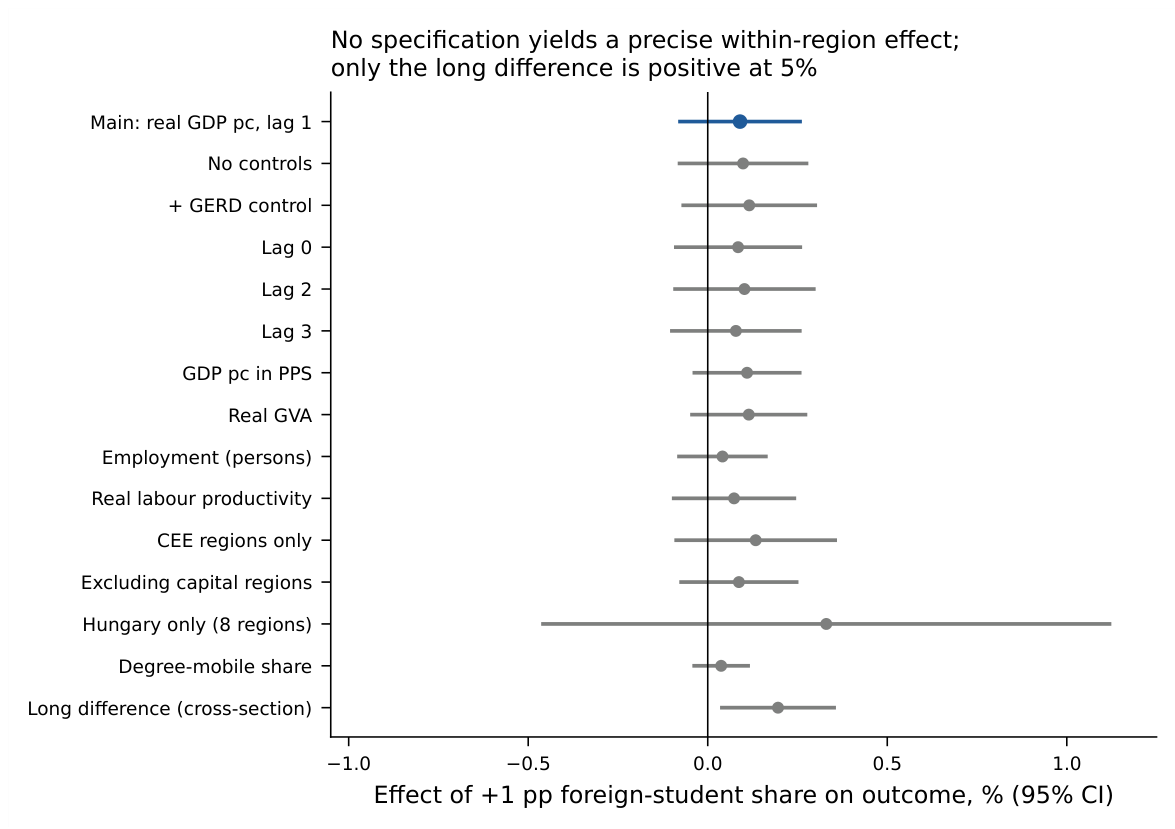
Figure 5.
The association between the foreign-student share and real GDP per capita at horizons of one to 8 years. Each point is the coefficient (multiplied by 100) from a regression of the k-year change in ln real GDP per capita on the k-year change in the lagged foreign-student share, with country-by-year fixed effects and standard errors clustered by NUTS-2 region; bars are 95% confidence intervals. The dotted line is the pre-registered main estimate of Table 3, column 1; the dashed line and the shaded band are the long-difference estimate of Table 5, Panel A, and its 95% interval.
Figure 5.
The association between the foreign-student share and real GDP per capita at horizons of one to 8 years. Each point is the coefficient (multiplied by 100) from a regression of the k-year change in ln real GDP per capita on the k-year change in the lagged foreign-student share, with country-by-year fixed effects and standard errors clustered by NUTS-2 region; bars are 95% confidence intervals. The dotted line is the pre-registered main estimate of Table 3, column 1; the dashed line and the shaded band are the long-difference estimate of Table 5, Panel A, and its 95% interval.
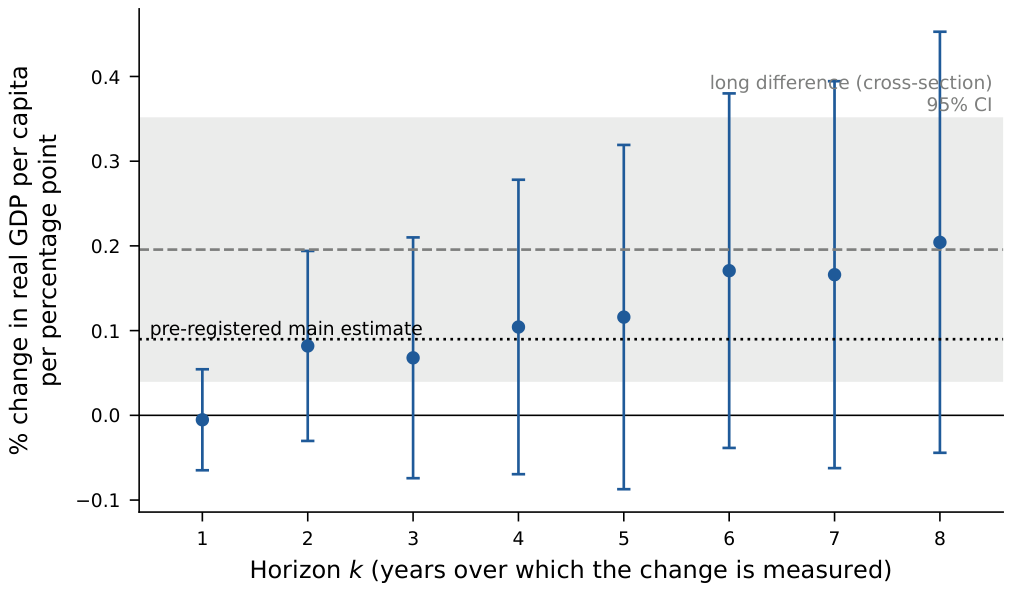

Table 1.
Data sources.
| Variable | Definition | Source (code) |
|---|---|---|
| Foreign-student share | Foreign students (citizenship) / total ISCED 5–7 enrolment, HEIs aggregated to NUTS-2, % | ETER, Zenodo dump 26 March 2024 |
| Degree-mobile share | Students with prior education abroad / total ISCED 5–7 enrolment, % | ETER |
| Erasmus incoming | Incoming Erasmus students per 100 enrolled | ETER |
| Real GDP per capita | ln(GDP volume index) − ln(average population) | Eurostat nama_10r_2gvagr, nama_10r_3popgdp |
| GDP per capita, PPS | GDP per inhabitant in PPS (EU27_2020) | Eurostat nama_10r_2gdp |
| Real GVA | GVA volume index (2020 = 100) | Eurostat nama_10r_2gvagr |
| Employment | Employed persons (thousands), all NACE activities | Eurostat nama_10r_3empers |
| Employment rate | Employed / population aged 20–64, % | Eurostat lfst_r_lfe2emprt |
| Labour productivity | Real labour productivity per person, index | Eurostat nama_10r_2rlp |
| Population density | Persons per km2 | Eurostat demo_r_d3dens |
| Tertiary attainment | Population 25–64 with ISCED 5–8, % | Eurostat edat_lfse_04 |
| GERD | Gross domestic expenditure on R&D, % of GDP | Eurostat rd_e_gerdreg |
| Origin-specific mobility | Degree-mobile students by host and origin country, ISCED 5–8 | Eurostat educ_uoe_mobs02 |
| Boundaries | NUTS 2021, 1:20 million | Eurostat GISCO |
Table 2.
Descriptive statistics, main estimation sample (1,922 region-years, 216 NUTS-2 regions, 21 countries, 2013–2022).
Table 2.
Descriptive statistics, main estimation sample (1,922 region-years, 216 NUTS-2 regions, 21 countries, 2013–2022).
| Variable | N | Mean | SD | P10 | Median | P90 |
|---|---|---|---|---|---|---|
| Foreign-student share, % (t-1) | 1,922 | 8.74 | 6.62 | 1.61 | 7.59 | 16.15 |
| Degree-mobile student share, % (t-1) | 1,212 | 8.18 | 7.35 | 1.06 | 7.33 | 13.90 |
| Erasmus incoming per 100 students (t-1) | 1,300 | 1.36 | 1.01 | 0.36 | 1.11 | 2.61 |
| GDP per capita, PPS | 1,922 | 28,915 | 11,341 | 16,100 | 27,350 | 43,390 |
| Growth of real GDP per capita | 1,922 | 0.015 | 0.042 | −0.027 | 0.016 | 0.058 |
| Employment rate 20-64, % | 1,922 | 71.71 | 8.55 | 59.71 | 73.10 | 81.20 |
| Population density, per km2 | 1,922 | 305 | 777 | 39 | 118 | 438 |
| Tertiary attainment 25-64, % (t-1) | 1,922 | 28.95 | 9.36 | 17.61 | 27.55 | 41.99 |
| GERD, % of GDP (t-1) | 1,345 | 1.46 | 1.14 | 0.38 | 1.16 | 2.90 |
Notes: Foreign, degree-mobile and Erasmus shares are aggregated from ETER; all other variables are from Eurostat. Statistics refer to the observations used in the main specification; the degree-mobile, Erasmus and GERD rows have fewer observations because of reporting gaps. Growth is the annual log change in real GDP per capita.
Table 3.
Two-way fixed-effects estimates of regional real GDP per capita on the foreign-student share.
Table 3.
Two-way fixed-effects estimates of regional real GDP per capita on the foreign-student share.
| (1) Main | (2) No ctrl. | (3) GERD | (4) Growth | (5) Lag 0 | (6) Lag 2 | (7) Lag 3 | |
|---|---|---|---|---|---|---|---|
| Foreign-student share | |||||||
| (0.085) | (0.090) | (0.093) | (0.023) | (0.088) | (0.098) | (0.090) | |
| p-value | 0.290 | 0.275 | 0.216 | 0.906 | 0.338 | 0.298 | 0.387 |
| Treatment lag (years) | 1 | 1 | 1 | 1 | 0 | 2 | 3 |
| Controls () | Yes | No | +GERD | Yes | Yes | Yes | Yes |
| Region, country×year FE | Yes | Yes | Yes | Yes | Yes | Yes | Yes |
| Obs. | 1,922 | 1,973 | 1,317 | 1,922 | 1,730 | 1,910 | 1,716 |
| Regions | 216 | 220 | 182 | 216 | 216 | 212 | 212 |
Notes: Dependent variable: ln real GDP per capita in columns (1)–(3) and (5)–(7), and its annual log change in column (4). Coefficients are multiplied by 100, so they read as the percentage (column 4: percentage-point growth) change associated with a one-percentage-point higher foreign-student share. Controls: ln population density and tertiary attainment (25–64), both at . Standard errors clustered by NUTS-2 region are in parentheses. *, **, ***. Observations in singleton fixed-effect cells are dropped.
Table 4.
Robustness: alternative outcomes, samples and measures (lag 1, region and country×year FE).
Table 4.
Robustness: alternative outcomes, samples and measures (lag 1, region and country×year FE).
| Specification | Coef. | SE | p | N | Regions |
|---|---|---|---|---|---|
| Alternative outcomes | |||||
| ln GDP per capita, PPS | 0.109 | 0.074 | 0.143 | 1,949 | 219 |
| ln real GVA | 0.114 | 0.080 | 0.155 | 1,922 | 216 |
| ln employment (persons) | 0.041 | 0.061 | 0.505 | 1,949 | 219 |
| Employment rate 20–64 (pp)a | −0.052 | 0.029 | 0.075 | 2,022 | 226 |
| ln real labour productivity per person | 0.073 | 0.085 | 0.391 | 1,914 | 212 |
| Alternative samples | |||||
| EU-27 only | 0.090 | 0.085 | 0.290 | 1,922 | 216 |
| Central and Eastern Europe | 0.133 | 0.110 | 0.232 | 474 | 54 |
| Excluding capital-city regions | 0.087 | 0.082 | 0.289 | 1,743 | 195 |
| Hungary only (8 regions)b | 0.330 | 0.334 | 0.355 | 72 | 8 |
| Alternative internationalisation measures | |||||
| Degree-mobile student share | 0.037 | 0.038 | 0.327 | 1,212 | 149 |
| Erasmus incoming per 100 students | 0.299 | 0.372 | 0.423 | 1,359 | 213 |
| Post hoc data-quality checks (not pre-registered) | |||||
| ETER code ‘s’ treated as missing | 0.054 | 0.103 | 0.605 | 1,626 | 207 |
| Dropping year-on-year jumps >5 pp | 0.090 | 0.095 | 0.348 | 1,894 | 216 |
Notes: Coefficients on the internationalisation measure at , multiplied by 100 for log outcomes. Unless stated otherwise the outcome is ln real GDP per capita, with the controls of Table 3 and SEs clustered by region. a Coefficient in percentage points per percentage point (not scaled). b Only eight clusters; cluster-robust inference is unreliable and the estimate is descriptive.
Table 5.
Identification checks: long difference, reverse timing and shift-share instrumental variables.
Table 5.
Identification checks: long difference, reverse timing and shift-share instrumental variables.
| Estimate | Coef. | SE | p | N | Regions |
|---|---|---|---|---|---|
| A. Long difference (cross-section, country FE, robust SE) | |||||
| foreign share (2011–13 to 2019–21) | 0.196 | 0.079 | 0.014 | 193 | 193 |
| B. Reverse timing: foreign sharet on ln real GDP per capitat − 1 | |||||
| ln real GDP per capita ()a | −0.155 | 3.842 | 0.968 | 1,730 | 216 |
| C. Shift-share IV: base share × origin-push shift | |||||
| First stage: instrumentb | −0.140 | 0.310 | – | 1,663 | 203 |
| First-stage F (cluster-robust) | 0.20 | ||||
| Reduced form: instrument | −0.613 | 0.413 | 0.139 | 1,663 | 203 |
| OLS, same sample | 0.115 | 0.081 | – | 1,663 | 203 |
| 2SLS: foreign share () | 4.377 | 7.973 | 0.584 | 1,663 | 203 |
| D. Shift-share IV: base share × leave-one-out national growth | |||||
| First stage: instrumentb | 0.109 | 0.104 | – | 1,655 | 198 |
| First-stage F (cluster-robust) | 1.09 | ||||
| Reduced form: instrument | −0.056 | 0.097 | 0.566 | 1,655 | 198 |
| OLS, same sample | 0.116 | 0.081 | – | 1,655 | 198 |
| 2SLS: foreign share () | −0.511 | 1.020 | 0.617 | 1,655 | 198 |
Notes: Outcome coefficients are multiplied by 100 (% per percentage point). Panels C and D: outcome years 2014–2022, region and country×year FE, controls as in Table 3, SEs clustered by region. a Percentage points of foreign share per log point of GDP per capita (not scaled). b First-stage coefficients are unscaled (pp of foreign share per unit of the instrument). Both instruments are weak (), so the 2SLS estimates are not interpreted.
Table 6.
Reviewer-requested robustness: the foreign-student share versus the absolute number of foreign students.
Table 6.
Reviewer-requested robustness: the foreign-student share versus the absolute number of foreign students.
| Specification | Coef. | SE | 95% CI | p | N | Reg. |
|---|---|---|---|---|---|---|
| A. Treatment measured as a share (% change in real GDP per capita per percentage point) | ||||||
| Foreign-student share (), pre-registered | 0.090 | 0.085 | [−0.077, 0.257] | 0.290 | 1,922 | 216 |
| + ln total enrolment of reporting HEIs | 0.100 | 0.093 | [−0.083, 0.282] | 0.284 | 1,922 | 216 |
| coefficient on ln total enrolment | −0.509 | 1.485 | [−3.436, 2.418] | 0.732 | 1,922 | 216 |
| B. Treatment measured in levels (% change in real GDP per capita per log point of the regressor) | ||||||
| ln foreign students () | 0.053 | 0.218 | [−0.376, 0.482] | 0.808 | 1,951 | 219 |
| ln foreign students, controlling for domestic enrolment | 0.080 | 0.232 | [−0.377, 0.537] | 0.731 | 1,951 | 219 |
| coefficient on ln domestic enrolment | −0.550 | 0.925 | [−2.373, 1.273] | 0.553 | 1,951 | 219 |
| ln foreign students, controlling for total enrolment | 0.079 | 0.237 | [−0.389, 0.547] | 0.740 | 1,951 | 219 |
| coefficient on ln total enrolment | −0.345 | 0.923 | [−2.164, 1.475] | 0.709 | 1,951 | 219 |
| ln domestic enrolment (), alone | −0.197 | 0.709 | [−1.595, 1.200] | 0.781 | 1,956 | 219 |
Notes: Outcome: ln real GDP per capita. All specifications use region and country×year fixed effects, the controls of Table 3 and standard errors clustered by NUTS-2 region. Coefficients are multiplied by 100. Foreign students, domestic enrolment (total minus foreign) and total enrolment are counts in the ETER institutions that report both the numerator and the denominator, summed to the region. These analyses were added at the request of a reviewer and are not part of the pre-registered analysis plan; the pre-registered test remains the first row.
Table 7.
Sensitivity of the main estimate to ETER reporting and suppression problems.
| Specification | Coef. | SE | 95% CI | p | N | Reg. |
|---|---|---|---|---|---|---|
| Pre-registered main specification (‘s’ ) | 0.090 | 0.085 | [−0.077, 0.257] | 0.290 | 1,922 | 216 |
| ‘s’ treated as missing | 0.054 | 0.103 | [−0.150, 0.257] | 0.605 | 1,626 | 207 |
| Dropping year-on-year jumps pp | 0.090 | 0.095 | [−0.098, 0.278] | 0.348 | 1,894 | 216 |
| Regions never affected by an ‘s’ code | −0.239 | 0.154 | [−0.550, 0.071] | 0.128 | 362 | 49 |
| Regions never affected by ‘s’, no pp jumps | −0.221 | 0.097 | [−0.416, −0.025] | 0.028 | 357 | 49 |
| Outcome years 2016–2022 only | 0.026 | 0.105 | [−0.181, 0.232] | 0.807 | 1,370 | 216 |
Notes: Outcome: ln real GDP per capita; foreign-student share at ; region and country×year fixed effects; controls as in Table 3; standard errors clustered by region; coefficients multiplied by 100. In ETER, counts of 1–3 are replaced by the suppression code ‘s’. The pre-registered rule sets them to 2; in some large institutions the code is applied to values that are clearly much larger, which produces artificial collapses in the regional share. ‘s’ codes occur at least once in 179 of the 248 regions of the estimation universe and affect 27.4% of the region-years used in the main specification. The fourth and fifth rows therefore retain a small and selected group of regions (large institutions only); their negative coefficients are reported for completeness and are not evidence of a negative effect. All rows except the first are post hoc or reviewer-requested checks.
Table 8.
The eight Hungarian NUTS-2 regions: internationalisation 2013–2021 and subsample estimates.
Table 8.
The eight Hungarian NUTS-2 regions: internationalisation 2013–2021 and subsample estimates.
| Region | Main university town | Share 2013 | Share 2021 | Foreign 2013 | Foreign 2021 | ‘s’ years |
|---|---|---|---|---|---|---|
| HU11 | Budapest | 5.53 | 10.82 | 8,196 | 15,606 | 14 |
| HU12 | Gödöllo | 0.09 | 11.13 | 15 | 1,470 | 2 |
| HU21 | Veszprém | 0.05 | 7.29 | 8 | 747 | 4 |
| HU22 | Gyor, Sopron | 3.17 | 3.90 | 648 | 573 | 1 |
| HU23 | Pécs | 0.02 | 18.79 | 4 | 3,898 | 2 |
| HU31 | Miskolc, Eger | 0.63 | 2.89 | 145 | 434 | 4 |
| HU32 | Debrecen | 10.63 | 19.69 | 3,852 | 6,311 | 2 |
| HU33 | Szeged, Kecskemét | 8.70 | 13.55 | 2,417 | 3,404 | 1 |
| Hungary-only estimates (outcome: ln real GDP per capita; coefficient × 100) | ||||||
| Specification | Coef. | SE | 95% CI | p | N | |
| Foreign-student share () | 0.330 | 0.334 | [−0.459, 1.119] | 0.355 | 72 | |
| ‘s’ treated as missing | 1.939 | 0.635 | [0.437, 3.442] | 0.019 | 54 | |
| outcome years 2016–2022 | 0.448 | 0.432 | [−0.573, 1.469] | 0.334 | 56 | |
Notes: Shares are percentages of ISCED 5–7 enrolment in the reporting ETER institutions of the region; ‘Foreign’ is the corresponding headcount. ‘s’ years counts the HEI-years in 2013–2021 in which an institution of the region reported the suppression code ‘s’ for foreign students; the very low shares of HU12, HU21, HU23 and HU31 before 2016 are an artefact of that code, not a real absence of foreign students. Estimates use region and year fixed effects, the controls of Table 3 and SEs clustered by region. With only 8 clusters, cluster-robust inference is unreliable: wild cluster bootstrap p-values (Rademacher weights, all 256 sign changes enumerated, null imposed) are 0.445 and 0.137 for the first two rows. The Hungarian estimates are descriptive and must not be read as country-specific evidence.
Table 9.
Where the long-difference association comes from.
| Specification | Coef. | SE | 95% CI | p | N | Reg. |
|---|---|---|---|---|---|---|
| A. Within-region (annual) variation | ||||||
| Two-way FE, pre-registered main specification | 0.090 | 0.085 | [−0.077, 0.257] | 0.290 | 1,922 | 216 |
| Two-way FE, regions of the long-difference sample | 0.137 | 0.085 | [−0.030, 0.305] | 0.107 | 1,815 | 193 |
| Eight-year differences, country×year FE | 0.204 | 0.126 | [−0.044, 0.453] | 0.107 | 581 | 205 |
| B. Between-region (decade) variation: long difference | ||||||
| Long difference, country FE and initial conditions | 0.196 | 0.079 | [0.040, 0.352] | 0.014 | 193 | 193 |
| without initial conditions | 0.215 | 0.134 | [−0.049, 0.479] | 0.109 | 201 | 201 |
| without country fixed effects | 0.786 | 0.137 | [0.515, 1.057] | <0.001 | 198 | 198 |
| C. Timing checks on the decade variation | ||||||
| Earlier growth on later change in the share (placebo) | −0.177 | 0.152 | [−0.477, 0.124] | 0.248 | 205 | 205 |
| Later growth on earlier change in the share | 0.313 | 0.202 | [−0.085, 0.712] | 0.123 | 187 | 187 |
Notes: Outcome: ln real GDP per capita (Panel A, rows 1–2), its k-year change (Panel A, row 3) or its change between three-year averages (Panels B and C). Coefficients are multiplied by 100. Panel A uses region and country×year fixed effects (row 3: country×year only, since the region effects are differenced out) and SEs clustered by region. Panels B and C are cross-sections of regions with country fixed effects and heteroskedasticity-robust SEs; initial conditions are initial ln real GDP per capita, ln population density and tertiary attainment. Placebo: change in ln real GDP per capita from 2012–14 to 2015–17 on the change in the foreign-student share from 2015–17 to 2018–20. Last row: change from 2015–17 to 2019–21 on the change in the share from 2011–13 to 2014–16. Leave-one-country-out estimates of the long difference range from 0.145 (FI) to 0.235 (PT), significant at 5% in 27 of 31 cases.
Disclaimer/Publisher’s Note: The statements, opinions and data contained in all publications are solely those of the individual author(s) and contributor(s) and not of MDPI and/or the editor(s). MDPI and/or the editor(s) disclaim responsibility for any injury to people or property resulting from any ideas, methods, instructions or products referred to in the content. |
© 2026 by the authors. Licensee MDPI, Basel, Switzerland. This article is an open access article distributed under the terms and conditions of the Creative Commons Attribution (CC BY) license (http://creativecommons.org/licenses/by/4.0/).
Copyright: This open access article is published under a Creative Commons CC BY 4.0 license, which permit the free download, distribution, and reuse, provided that the author and preprint are cited in any reuse.