

Submitted:
13 November 2026
Posted:
16 November 2026
You are already at the latest version
Abstract
The interpretation of missense variants requires the integration of sequence, structural and evolutionary evidence, yet most computational predictors operate on specialised representations rather than curator-readable descriptions. We investigate whether a typed-decision language model can use this evidence directly. Using GLiDE-9B, we construct four increasingly informative text representations and evaluate them on a gene-disjoint ClinVar benchmark derived from 199,243 germline missense variants. On 33,478 commonly scored test variants, zero-shot ROC-AUC rises from 0.817 with variant-level information alone to 0.933 with conservation. Low-rank adaptation on 20,000 gene-disjoint ClinVar training variants yields ROC-AUC 0.976 and average precision 0.944, compared with 0.973 and 0.941 for REVEL; the difference in ROC-AUC is significant (DeLong p = 4.5 × 10⁻⁵), whereas the average-precision difference is not (p = 0.14). A second adapter trained using population- and primate-derived proxy labels, without ClinVar labels as optimisation targets, achieves ROC-AUC 0.940 and average precision 0.862; however, ClinVar validation labels are still used for checkpoint selection and calibration. The ClinVar- trained model achieves a calibrated Brier score of 0.054 and validation-derived thresholds corresponding to PP3/BP4 evidence strengths up to Strong. These results are qualified by lower performance than leading comparators when ranking variants within individual genes, more modest associations with functional assays, and near-chance performance in autism and congenital heart disease case–control comparisons. The findings support evidence-aware decision modelling as a complementary approach to missense variant prioritisation, while emphasising the need for prospective, independently curated validation before clinical use
Keywords:
Openjev
; missense variants
; classification
1. Introduction
Interpretation of missense variants remains a major challenge in genomic diagnosis. Individual substitutions must be assessed against several kinds of evidence, including population frequency, evolutionary constraint, protein context and experimentally established function. Under the ACMG/AMP framework, computational predictions may contribute to the PP3 (pathogenic) and BP4 (benign) criteria [1]; their evidential weight depends on explicit calibration rather than on arbitrary score cut-offs [2,3].
Current computational approaches combine several complementary strategies. Protein language and evolutionary models, including ESM-1b, ESM-1v, ESM-2 and EVE, estimate constraints from sequence data [4,5,6,7]. PrimateAI-3D and AlphaMissense incorporate primate variation, structural information or populationconstraint [8,11]. Supervised methods and ensemble scores such as REVEL and CADD integrate further features [9,10]. These systems are effective, but their input representations are generally purpose-built and do not directly test whether heterogeneous evidence expressed in ordinary text can inform variant prioritisation.
Here, we examine that alternative with GLiDE-9B, a typed-decision model that returns probabilities for predefined answers without generating free-form text. We represent each missense variant through a deterministic, curator-readable description and ask a binary question about predicted pathogenicity. This design permits the same backbone to be tested with increasing levels of evidence and subsequently adapted using either clinical classifications or independent population-derived proxy labels. We refer to the resulting evaluation framework as JevMissense.
Our analyses address four questions: how much information each text block contributes before fine-tuning; whether clinical-label fine-tuning improves performance on genes absent from training; whether population- and primate-based proxy labels are informative without being treated as clinical ground truth; and how pooled performance, within-gene ranking, calibration and external functional evidence differ. We also analyse the effects of information added between nested prompts. These contrasts measure context sensitivity, not causal or token-level explanations.
2. Data and Evaluation Protocol
Variants and splits.
Using the November 2026 ClinVar [12] snapshot, we selected germline missense variants on GRCh38 with at least one review star, no conflicts, a pathogenic/likely-pathogenic (P/LP) or benign/likely-benign (B/LB) classification, and a MANE Select [13] transcript whose reference residue matches: 9,345,867 submitted records reduce to 199,243 unique variants (59,552 P/LP) on 15,206 proteins. Three primary partitions are gene-disjoint, with no gene appearing in more than one: training comprises 121,401 variants from 10,484 genes, validation 18,777 variants from 1,664 genes, and test 37,998 variants from 2,989 genes. We additionally analyse variants classified after March 2026 (10,065) and after September 2026 (5,566). These date-defined subsets are retrospective strata; they should not be interpreted as prospective evaluations without establishing the model training cut-off and the date each classification became accessible. Primary comparisons use the 33,478 variants scored by every comparator, representing 2,716 test genes and a pathogenic prevalence of 0.297.
Context.
Four cumulative text inputs (Figure 1a) are rendered by a deterministic template: none (gene, transcript, protein change, relative position), window (plus 15 residues either side and the class, hydropathy and volume of both residues), struct (plus AlphaFold DB [14] pLDDT, relative solvent accessibility, contact density, three-state secondary structure, the nearest annotated functional residue in 3-D, and UniProt [15] features covering the residue) and msa (plus orthologue conservation projected from Ensembl Compara gene trees over 194 vertebrate species [16]). Mean token counts are 299 (struct) and 507 (msa). Coverage over all 199,243 variants is 0.995 for structure, 0.996 for UniProt and 0.998 for conservation.
No label leakage in the text.
UniProt natural-variant, mutagenesis and disease features are never requested, and any annotation whose description matches disease, variant, pathogen, translocation or breakpoint vocabulary is dropped. No rendered text contains pathogenic, benign, uncertain, ClinVar, likely or VUS; this is tested on 2,000 variants per arm and re-checked on 20,200 msa texts.
Baselines and audits.
AlphaMissense, REVEL, CADD v1.7, ESM-1b, ESM-1v, PrimateAI-3D, EVE, BLOSUM62 [17] and Grantham distance [18] are taken from published score files; ESM-2 650M log-likelihood ratios, an ESM-2 embedding classifier and two LightGBM [19] models are computed here on the same gene-disjoint training split. We assess potential circularity by recording predictor-related ClinVar evidence codes and by considering possible overlaps between clinical reference datasets and the development data of published methods. Of the 33,478 common test variants, 19,320 have records citing computational evidence. The subset with explicit evidence documentation but no cited computational criterion is analysed separately (Section 3.4). Published predictors cannot be retrospectively subjected to our gene-disjoint training protocol. EVE covers a different, smaller and much higher-prevalence subset; it is reported separately in the supplement and never ranked against the rest.
External sets.
ProteinGym v1.3 [20]: 96 human deep mutational scanning assays, 27,938 variants. Developmental disorders: 27,101 de novo missense variants from DDD probands [21] against 1,759 control de novo variants from denovo-db [22], with the primary analysis restricted to DDG2P monoallelic definitive/strong genes [23]. Autism and congenital heart disease de novo variants from the same source. Genebass [24]: 507 gene–trait pairs over 90 genes with per-variant burden-signed effect sizes.
3. Results
3.1. Contribution of Text Context Without Fine-Tuning
Without task-specific adaptation, adding sequence, structural and conservation evidence produces non-monotonic changes in discrimination (Table 1). The variant-only input yields ROC-AUC 0.817; adding the local sequence window reduces it to 0.789. Structural annotation improves ROC-AUC to 0.837, whereas the addition of cross-vertebrate conservation increases it to 0.933. This final value is close to that of ESM-1b (0.936) and CADD (0.932) on the common test subset. The marked contribution of the conservation block indicates that an explicit text summary of comparative evidence is more useful to the unadapted decision model than an unannotated amino-acid window. These observations describe changes in predictive performance and do not establish that the model reasons about evolutionary mechanisms.
3.2. Fine-Tuning on ClinVar Labels
A low-rank adaptation (LoRA) [25] trained on 20,000 variants from the gene-disjoint training split (rank 16, 32, attention and MLP projections, checkpoint selected on a balanced 1,000-variant validation set) reaches ROC-AUC 0.9755 (0.9741–0.9770) and average precision 0.9443 (0.9402–0.9479) on the common test set (Figure 2, Table 1). The resulting ROC-AUC exceeds that of REVEL, the strongest published comparator in the pooled evaluation (0.9727/0.9414; DeLong for ROC-AUC, paired bootstrap for average precision), above AlphaMissense (0.9623/0.9168) and PrimateAI-3D (0.9510/0.8838), and is higher than the other comparison scores under the reported paired evaluation. Significance tests were adjusted within the specified comparison family; they should not be interpreted as evidence of clinical superiority. Relative to zero-shot scoring of the same msa text, fine-tuning increases ROC-AUC by 0.043 and average precision by 0.107.
3.3. Fine-Tuning with Population-Derived Proxy Labels
To assess whether variant-related information could be learned without clinical labels as optimisation targets, we repeated fine-tuning with heuristic categories derived from population and comparative genomic data. Putatively tolerated rows are changes seen in gnomAD v4.1 [26] at allele frequency or tolerated in at least two of 23 primate genomes; putatively deleterious rows are changes not observed in gnomAD that fall inside regionally constrained windows, with the conservation block stripped of primate species so that the label source cannot be read off the prompt. Each putatively tolerated row is paired with a proxy-deleterious row in the same gene and a similar sequence context (total variation distance between the two context distributions 0.139). No ClinVar classification is used as a training target. However, ClinVar validation labels are used to choose a checkpoint and to calibrate predictions; consequently, this condition is clinical-label-free for weight optimisation, not clinically independent end-to-end.
The selection of proxy-label criteria substantially affected performance. The initial design — putatively tolerated variants observed in gnomAD above or in one primate and proxy-deleterious variants defined by absence — reduced validation performance relative to zero-shot scoring and was discontinued (Figure 3a). The final design (D3) improves validation AUROC from 0.949 to 0.961 and gives test ROC-AUC 0.940 (0.938–0.943) and average precision 0.862 (0.856–0.869): better than zero-shot on both (), slightly above ESM-1b in pooled ROC-AUC, but 0.036 ROC-AUC and 0.082 average precision below the ClinVar-trained model. As an indirect diagnostic of label ambiguity, AlphaMissense assigns a likely-benign prediction to 52% of D3’s proxy-deleterious rows, compared with 63% under the initial weak-label design. AlphaMissense predictions were not used as optimisation targets, although their use in design selection may introduce indirect dependence.
3.4. Pooled Discrimination, Within-Gene Performance and Label Circularity
Pooled ROC-AUC reflects both differences among genes and discrimination between variants within a gene. The latter is particularly relevant when a candidate gene has already been prioritised. Restricted to the 209 test genes with at least five variants of each class (15,184 variants) and averaging AUROC computed inside each gene, the ordering inverts (Figure 4a): AlphaMissense 0.974 and REVEL 0.973 lead, PrimateAI-3D follows at 0.965, and the fine-tuned model reaches 0.956 — better than AlphaMissense in 58 of 209 genes and worse in 117 (Wilcoxon, Holm ), and behind REVEL (72 versus 107 genes, ) and PrimateAI-3D (74 versus 100, ). The proxy-label model reaches 0.943 and the zero-shot model 0.922. Thus, superior pooled discrimination does not imply superior within-gene prioritisation; the latter is a substantial limitation of the approach.
Two sensitivity analyses examine, but cannot eliminate, concerns about label circularity (Figure 4b). Among variants first classified after March 2026 and after September 2026, the fine-tuned model retains ROC-AUC values of 0.974 and 0.971 whereas the other reported methods generally have lower discrimination than on the common test set. Because these temporal subsets are based on retrospective classifications, their independence from historical model development requires an explicit provenance audit. On the 4,719 test variants with documented ClinVar evidence that does not cite a computational predictor, the fine-tuned model achieves 0.961 and REVEL 0.963; this difference is not statistically significant (). In this subset, the zero-shot and proxy-label models drop furthest, to 0.887 and 0.907. Excluding 2,832 test variants described as public by the REVEL development cut-off leaves its ROC-AUC at 0.971. This sensitivity analysis reduces one possible source of overlap, but cannot exclude other forms of training-set circularity.
3.5. Calibration and ACMG Evidence Strength
Before post-hoc scaling, the ClinVar-trained model shows better probability calibration than the other GLiDE variants (expected calibration error 0.046, Brier 0.061); the zero-shot model over-calls pathogenicity badly (ECE 0.295) and the proxy-label model moderately (ECE 0.186, mean predicted probability 0.48 against a prevalence of 0.30). Platt scaling fitted on ClinVar validation data, without use of the test labels, reduces error across all three (Figure 5): ECE 0.006, 0.022 and 0.030 respectively. After calibration the fine-tuned model has the lowest Brier score of any method tested (0.054 against REVEL 0.055 and AlphaMissense 0.070; paired bootstrap Holm ), and its calibration error is indistinguishable from calibrated REVEL ().
Using calibrated scores to estimate candidate ACMG/AMP evidence thresholds under the local-posterior procedure of Pejaver et al. [2], fitted on validation data with one-sided 95% bootstrap bounds (Table 2), the fine-tuned model reaches numerical thresholds corresponding to PP3 evidence up to Strong — a threshold reached by 8.6% of test variants, of which 98.9% are indeed pathogenic — and BP4 up to Strong for 20.1% of variants at 99.9% precision. The proxy-label model also reaches the numerical PP3 Strong threshold, for 2.7% of variants. Neither reaches Very Strong under the specified assumptions. These are research calibration results, not a recommendation to apply PP3/BP4 evidence in patient care without independent clinical validation and verification of the prior and score-interval assumptions.
3.6. Beyond ClinVar
We next examined performance on external measurements with different labels and ascertainment mechanisms (Figure 6).
On de novo missense variants from developmental-disorder probands, restricted to DDG2P monoallelic genes, the fine-tuned model reaches 0.777 (0.740–0.814) case-versus-control ROC-AUC, statistically indistinguishable from AlphaMissense (0.790) and PrimateAI-3D (0.777) and above zero-shot (0.735); the proxy-label model reaches 0.758. Over all genes every method sits near 0.59, because the contrast is then dominated by which gene a variant falls in rather than which variant it is.
On ProteinGym, the fine-tuned model reaches a mean per-assay Spearman of 0.415 over 96 human assays, below AlphaMissense (0.463) and ESM-1v (0.452); the proxy-label model reaches 0.382, clearly above zero-shot (0.327; Wilcoxon over assays ). Because no functional assay data were used as optimisation targets, the positive association suggests that part of the learned signal tracks molecular consequences, although it does not exclude overlap through other training resources.
On Genebass rare-variant burden effects, all methods are weak and close: 0.126 mean per-pair Spearman for the fine-tuned model against 0.131 for AlphaMissense and 0.127 for PrimateAI-3D, with the proxy-label model at 0.117.
On autism and congenital heart disease de novo variants, every method lands between 0.51 and 0.55 ROC-AUC. Most reported confidence intervals exclude chance, although their small effect sizes and cohort structure limit the interpretation of this signal; none of the methods differs significantly from the fine-tuned model, so none of them exploits it better than the others. These analyses provide little support for disease-specific prioritisation in these cohorts.
3.7. Sensitivity to Added Evidence Blocks
Because the four input representations are nested, the change in predicted log-odds between consecutive representations measures sensitivity to the newly introduced evidence block for the same variant (Figure 7a). Added alone, the window shift separates the classes at AUROC 0.599, the structure block at 0.756 and the conservation block at 0.779; the shift produced by fine-tuning on the identical msa prompt separates them at 0.947. The conservation shift grows with the depth of the alignment and is roughly twice as large when the alternate residue is seen in no orthologue (Figure 7b) — a pattern consistent with the model using conservation information, although it is not a mechanistic explanation. It also shifts benign variants upward by a median of 1.0 log-odds, which is exactly the over-calling that calibration later removes.
Two illustrative variants show how the model’s score responds to context. For ECHS1 p.Asn59Ser, a pathogenic variant at a position identical in 185 of 185 aligned species, the zero-shot score moves from 0.367 with structure to 0.961 once conservation is supplied. For ITGA9 p.Glu697Gly, a benign variant whose alternate residue occurs in 24 species — all fishes — the zero-shot model is misled to 0.911 while the fine-tuned model returns 0.007.
4. Discussion
This study examines a simple but underexplored representation choice for missense variant prediction: supplying a general decision model with sequence, structure, functional annotation and evolutionary conservation as structured prose. On a common, gene-disjoint ClinVar test subset, the strongest zero-shot gain arises from conservation. Clinical-label fine-tuning further improves pooled discrimination, reaching ROC-AUC 0.976 and average precision 0.944, while proxy-label fine-tuning without ClinVar optimisation targets achieves 0.940 and 0.862, respectively. Both results suggest that evidence presented in textual form can support useful ranking without requiring the model to generate an explanation.
The pooled comparison needs careful interpretation. The margin over REVEL in ROC-AUC is small, and the average-precision difference is not statistically significant. More importantly, when performance is computed within genes, AlphaMissense, REVEL and PrimateAI-3D outperform the ClinVar-trained decision model. This distinction matters because many practical analyses already prioritise genes using inheritance, phenotype or pathway evidence. A model that is strong at separating genes need not resolve nearby variants within a selected gene as reliably.
The proxy-label experiment helps separate adaptation to evidence structure from direct training on ClinVar classifications. However, variants absent from gnomAD or located in constrained regions are not necessarily pathogenic, and common or primate-tolerated variants are not automatically benign. The training targets are therefore noisy proxies for evolutionary or population tolerance, rather than independent clinical truth. Moreover, ClinVar validation labels informed checkpoint selection and calibration; the experiment does not establish performance without any clinical supervision. Future evaluations should reserve a fully independent validation cohort for model and threshold selection.
The analyses of evidence-code subsets and classification-date strata are additional safeguards, not proofs of immunity to circularity. Published comparison scores have their own training histories, and a date attached to a ClinVar classification is not necessarily the first date the variant or its evidence became available to the modelling community. Genuine prospective comparisons would require an immutable training snapshot and subsequently acquired, independently interpreted variants. External studies also reveal limited transfer: the model trails leading protein-specific methods on ProteinGym and shows weak associations with Genebass burden effects. Case–control discrimination for autism and congenital heart disease is close to chance for all evaluated tools.
The proposed ACMG/AMP mappings demonstrate how a decision score might be converted into evidence strength on a specified reference set. Their validity depends on the calibration cohort, prior odds, labelling quality and independence assumptions, none of which should be transferred automatically to clinical use. Similarly, differences between nested prompts measure model sensitivity to text blocks but are not causal feature attributions.
Finally, the computational trade-off is substantial. The msa representation requires approximately 0.13 s per variant on a 24 GB GPU in the reported implementation, whereas precomputed scores may be retrieved almost instantaneously. Textual decision modelling may therefore be most relevant in focused prioritisation workflows or as a complementary evidence channel rather than as a replacement for proteome-wide precomputation.
Future directions.
Important next steps include refining proxy labels with coverage-aware population frequencies, testing positive–unlabelled learning objectives, assessing multiple random seeds and training-set sizes, and evaluating residue-local constraints to improve within-gene ranking. A fully prospective benchmark, independent calibration data and blinded clinical review are prerequisites for any claim of diagnostic utility.
Limitations.
The reported training runs use one random seed; there is no between-seed uncertainty estimate. AlphaMissense scores informed the evaluation of candidate proxy-label designs, creating possible indirect dependence even though these scores were not optimisation targets. Secondary structure derives from a three-state approximation rather than DSSP [27], with agreement of 0.816 on a 29-protein comparison. Only 58.3% of variants lie in regions with AlphaFold pLDDT . Comparator coverage is incomplete for some date-defined subsets and ProteinGym assays. The analyses were not independently recomputed here. All reported findings are for research use only.
5. Methods
Model.
GLiDE-9B (Fastino; publicly documented model at https://huggingface.co/fastino/GLiDE-9B; analysis revision ab54df5) has 7.94 B parameters, a Qwen3.5 backbone with hybrid linear and full attention, bfloat16 weights, and a 255-way decision readout supporting choice, noul (binary) and score question types. We use one noul question — Is this missense variant pathogenic? — and take as the score. Nothing is generated. In the reported implementation, the trainable forward pass agreed with the inference path to a maximum absolute probability difference of on 20 variants.
Fine-tuning.
We applied LoRA [25] adapters (rank 16, ) to attention and MLP projections. Fine-tuning used an effective batch size of 32 for 625 steps over 20,000 training variants and a single random seed. Checkpoints were evaluated every 50 steps on a balanced 1,000-variant ClinVar validation subset, with selection based on validation performance. Training with the msa prompt required approximately 19.5 s per step on a 24 GB GPU. For inference, the adapter was merged into the base weights; the mean absolute prediction difference relative to unmerged inference was 0.0009 across 500 test variants.
Weak labels.
Candidate designs were screened on CPU before any GPU training. The final design (D3) comprises 20,000 proxy-labelled rows spanning 5,536 genes, balanced within genes. Putatively tolerated changes are drawn from gnomAD v4.1 observations with allele frequency or substitutions seen in at least two of 23 primate genomes; the 10,000 proxy-deleterious changes are absent from gnomAD and fall in windows whose missense observed/expected ratio, normalised by the local synonymous ratio, is in the constrained half. Primate species are omitted from the conservation block of proxy-labelled training rows to reduce direct recovery of one labelling criterion. Each putatively tolerated row is matched to a proxy-deleterious row in the same gene and similar sequence context. The learning rate is . Training stops if validation ROC-AUC falls below the zero-shot score in two successive evaluations. The selection criteria identify distinct, potentially overlapping sources of proxy-tolerated variation; the composition of the final sample should be established from the underlying variant identifiers.
Calibration and ACMG mapping.
Temperature, Platt and isotonic calibration are fitted on ClinVar validation variants excluding the checkpoint-selection subset () and applied unchanged to test. Provisional computational-evidence strengths follow Pejaver et al. [2], using a prior pathogenic probability of 0.0441 and the stated Bayesian odds thresholds (1,124 for Very Strong and its square-, fourth- and eighth-root strengths). A score threshold is assigned only where the one-sided 95% bootstrap bound of the estimated local posterior meets the target. Thresholds are reported as exploratory calibration results and are not clinical recommendations.
Statistics.
ROC-AUC differences use DeLong’s test; average-precision differences use a paired bootstrap with 2,000 resamples (so p-values are reported as <0.001 rather than smaller); per-gene comparisons use the Wilcoxon signed-rank test over genes; ProteinGym comparisons use the Wilcoxon test over assays; Genebass uses a gene-clustered bootstrap. All families of comparisons are Holm-corrected. Thresholds and calibration are fixed on validation data and never on test.
Compute.
All GPU work ran on a single 24 GB card. Zero-shot scoring takes 0.023 s per variant for none and 0.132 s for msa; the complete pipeline reported here is roughly 56 GPU-hours.
Supplementary Materials
The following supporting information can be downloaded at the website of this paper posted on Preprints.org.
Data Availability Statement
The underlying third-party input resources (ClinVar, MANE, UniProt, AlphaFold DB, Ensembl Compara, gnomAD, ProteinGym and Genebass) are available from the original providers and are cited in this article. The derived split identifiers, rendered inputs, analysis scripts, fine-tuned adapters and prediction tables are not included in this version of the manuscript. Redistribution of third-party per-variant scores is subject to their original licences and terms. Public release of reproducibility materials, including third-party score licensing checks, remains necessary for complete computational reproducibility.
References
- Richards, S.; et al. Standards and guidelines for the interpretation of sequence variants. Genet. Med. 2015, 17, 405–424. [Google Scholar] [CrossRef] [PubMed]
- Pejaver, V.; et al. Calibration of computational tools for missense variant pathogenicity classification and ClinGen recommendations for PP3/BP4 criteria. Am. J. Hum. Genet. 2022, 109, 2163–2177. [Google Scholar] [CrossRef] [PubMed]
- Tavtigian, S. V.; et al. Modeling the ACMG/AMP variant classification guidelines as a Bayesian classification framework. Genet. Med. 2018, 20, 1054–1060. [Google Scholar] [CrossRef] [PubMed]
- Rives, A.; et al. Biological structure and function emerge from scaling unsupervised learning to 250 million protein sequences. Proc. Natl. Acad. Sci. 2021, 118, e2016239118. [Google Scholar] [CrossRef] [PubMed]
- Meier, J.; et al. Language models enable zero-shot prediction of the effects of mutations on protein function. Adv. Neural Inf. Process. Syst. 2021, 34. [Google Scholar]
- Lin, Z.; et al. Evolutionary-scale prediction of atomic-level protein structure with a language model. Science 2023, 379, 1123–1130. [Google Scholar] [CrossRef] [PubMed]
- Frazer, J.; et al. Disease variant prediction with deep generative models of evolutionary data. Nature 2021, 599, 91–95. [Google Scholar] [CrossRef] [PubMed]
- Gao, H.; et al. The landscape of tolerated genetic variation in humans and primates. Science 2023, 380, eabn8197. [Google Scholar] [CrossRef] [PubMed]
- Ioannidis, N. M.; et al. REVEL: an ensemble method for predicting the pathogenicity of rare missense variants. Am. J. Hum. Genet. 2016, 99, 877–885. [Google Scholar] [CrossRef] [PubMed]
- Rentzsch, P.; et al. CADD: predicting the deleteriousness of variants throughout the human genome. Nucleic Acids Res. 2019, 47, D886–D894. [Google Scholar] [CrossRef] [PubMed]
- Cheng, J.; et al. Accurate proteome-wide missense variant effect prediction with AlphaMissense. Science 2023, 381, eadg7492. [Google Scholar] [CrossRef] [PubMed]
- Landrum, M. J.; et al. ClinVar: improving access to variant interpretations and supporting evidence. Nucleic Acids Res. 2018, 46, D1062–D1067. [Google Scholar] [CrossRef] [PubMed]
- Morales, J.; et al. A joint NCBI and EMBL–EBI transcript set for clinical genomics and research. Nature 2022, 604, 310–315. [Google Scholar] [CrossRef] [PubMed]
- Varadi, M.; et al. AlphaFold Protein Structure Database in 2024: providing structure coverage for over 214 million protein sequences. Nucleic Acids Res. 2024, 52, D368–D375. [Google Scholar] [CrossRef] [PubMed]
- The UniProt Consortium. UniProt: the Universal Protein Knowledgebase in 2023. Nucleic Acids Res. 2023, 51, D523–D531. [Google Scholar] [CrossRef] [PubMed]
- Ensembl Project. Ensembl Compara: comparative genomics resources and gene trees. Available online: https://www.ensembl.org/info/genome/compara/ (accessed on 2026).
- Henikoff, S.; Henikoff, J. G. Amino acid substitution matrices from protein blocks. Proc. Natl. Acad. Sci. 1992, 89, 10915–10919. [Google Scholar] [CrossRef] [PubMed]
- Grantham, R. Amino acid difference formula to help explain protein evolution. Science 1974, 185, 862–864. [Google Scholar] [CrossRef] [PubMed]
- Ke, G.; et al. LightGBM: a highly efficient gradient boosting decision tree. Adv. Neural Inf. Process. Syst. 2017, 30. [Google Scholar]
- Notin, P.; et al. ProteinGym: large-scale benchmarks for protein fitness prediction and design. Adv. Neural Inf. Process. Syst. 2023, 36. [Google Scholar]
- Kaplanis, J.; et al. Evidence for 28 genetic disorders discovered by combining healthcare and research data. Nature 2020, 586, 757–762. [Google Scholar] [CrossRef] [PubMed]
- Turner, T. N.; et al. denovo-db: a compendium of human de novo variants. Nucleic Acids Res. 2017, 45, D804–D811. [Google Scholar] [CrossRef] [PubMed]
- Thormann, A.; et al. Flexible and scalable diagnostic filtering of genomic variants using G2P with Ensembl VEP. Nat. Commun. 2019, 10, 2373. [Google Scholar] [CrossRef] [PubMed]
- Karczewski, K. J.; et al. Systematic single-variant and gene-based association testing of thousands of phenotypes in 394,841 UK Biobank exomes. Cell Genom. 2022, 2, 100168. [Google Scholar] [CrossRef] [PubMed]
- Hu, E. J.; et al. LoRA: low-rank adaptation of large language models. International Conference on Learning Representations, 2022. [Google Scholar]
- gnomAD Production Team. gnomAD v4.1 release notes. 19 April 2024. Available online: https://gnomad.broadinstitute.org/news/2024-04-gnomad-v4-1/.
- Kabsch, W.; Sander, C. Dictionary of protein secondary structure: pattern recognition of hydrogen-bonded and geometrical features. Biopolymers 1983, 22, 2577–2637. [Google Scholar] [CrossRef] [PubMed]
Figure 1.
What the model reads, what it is trained on, and what it returns. (a) Each prompt block is computed from a public resource for the MANE Select protein; the four context arms are cumulative. (b) A fully rendered msa prompt for a test variant, coloured by block. (c) The decision model and the two LoRA models: one trained on gene-disjoint ClinVar labels, one trained without ClinVar training targets. (d) Proposed outputs: raw score, calibrated probability, validation-derived computational evidence strength and nested-context sensitivity.
Figure 1.
What the model reads, what it is trained on, and what it returns. (a) Each prompt block is computed from a public resource for the MANE Select protein; the four context arms are cumulative. (b) A fully rendered msa prompt for a test variant, coloured by block. (c) The decision model and the two LoRA models: one trained on gene-disjoint ClinVar labels, one trained without ClinVar training targets. (d) Proposed outputs: raw score, calibrated probability, validation-derived computational evidence strength and nested-context sensitivity.
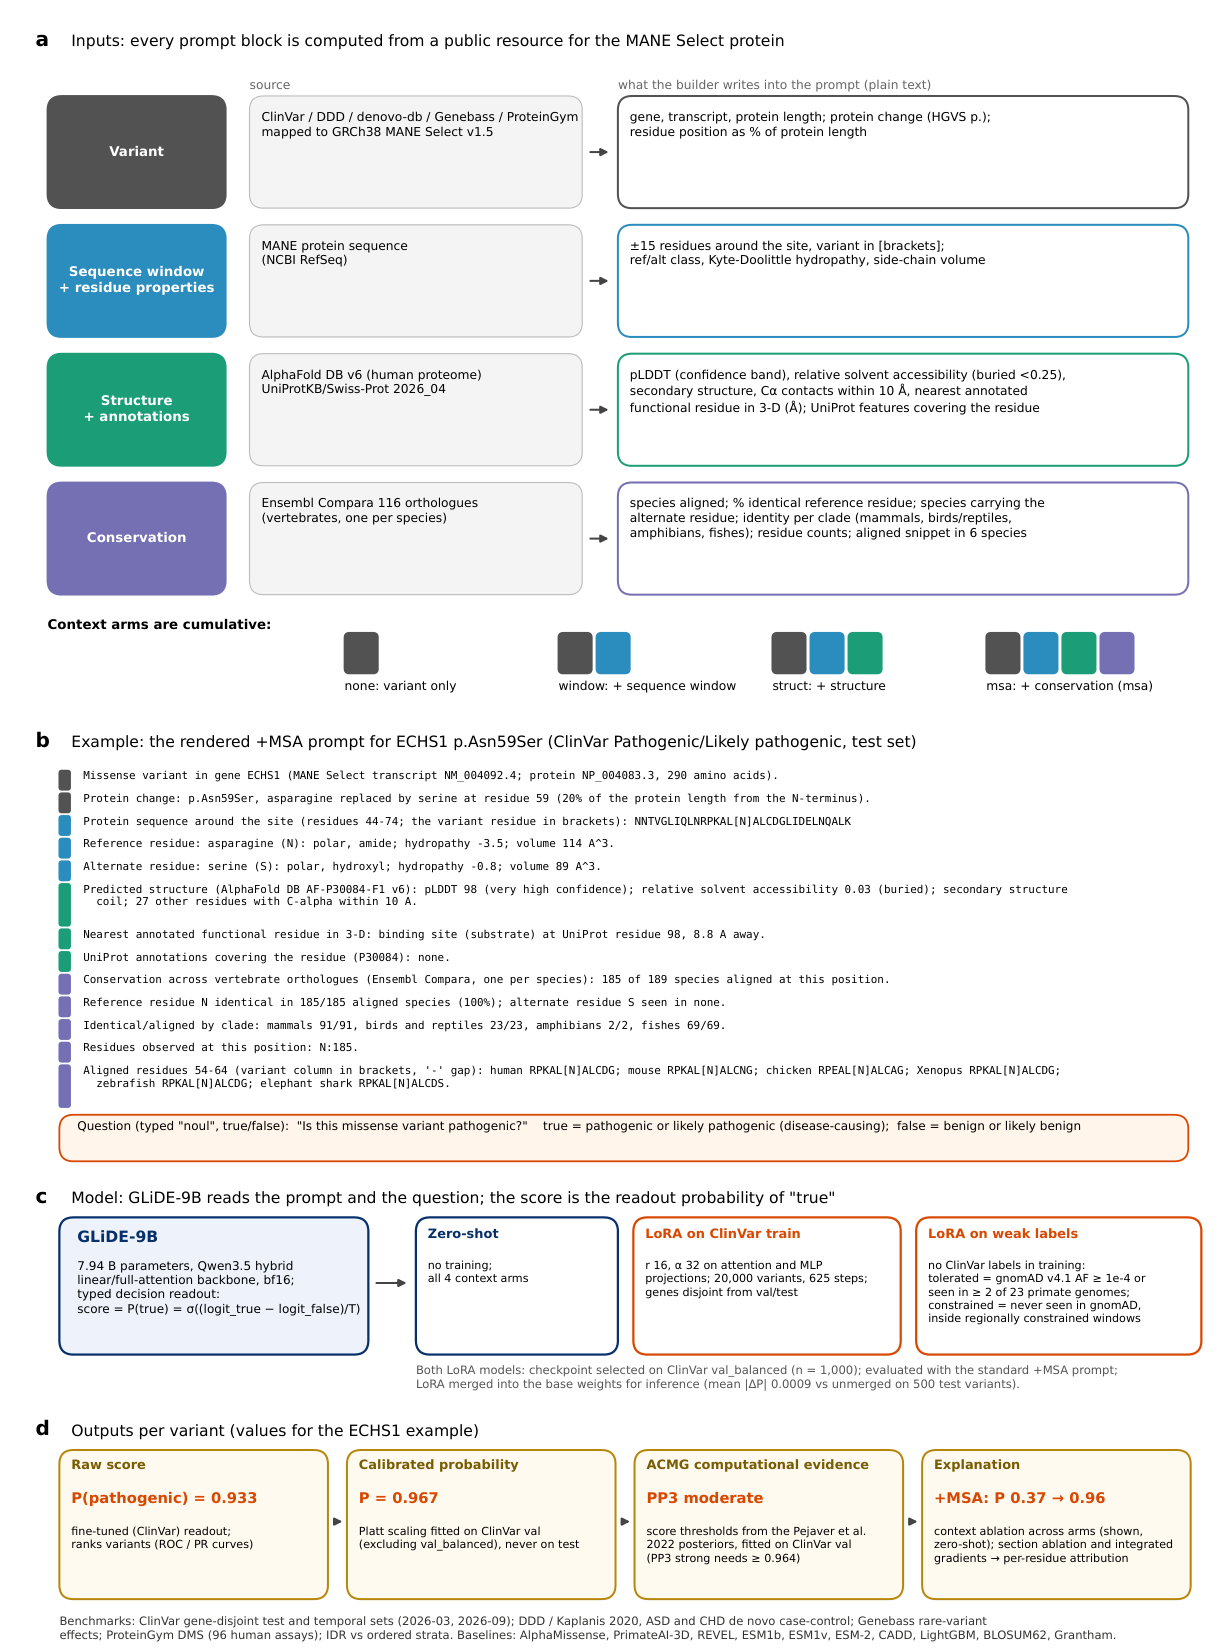
Figure 2.
ClinVar gene-disjoint test set, identical variants for every method (; prevalence 0.297). (a) ROC-AUC, (b) average precision, with 95% bootstrap confidence intervals. Bars are shaded by what each method was trained on; the four zero-shot GLiDE arms run light to dark with increasing context. Stars denote Holm-adjusted paired comparisons against the fine-tuned model as reported in the source analysis.
Figure 2.
ClinVar gene-disjoint test set, identical variants for every method (; prevalence 0.297). (a) ROC-AUC, (b) average precision, with 95% bootstrap confidence intervals. Bars are shaded by what each method was trained on; the four zero-shot GLiDE arms run light to dark with increasing context. Stars denote Holm-adjusted paired comparisons against the fine-tuned model as reported in the source analysis.
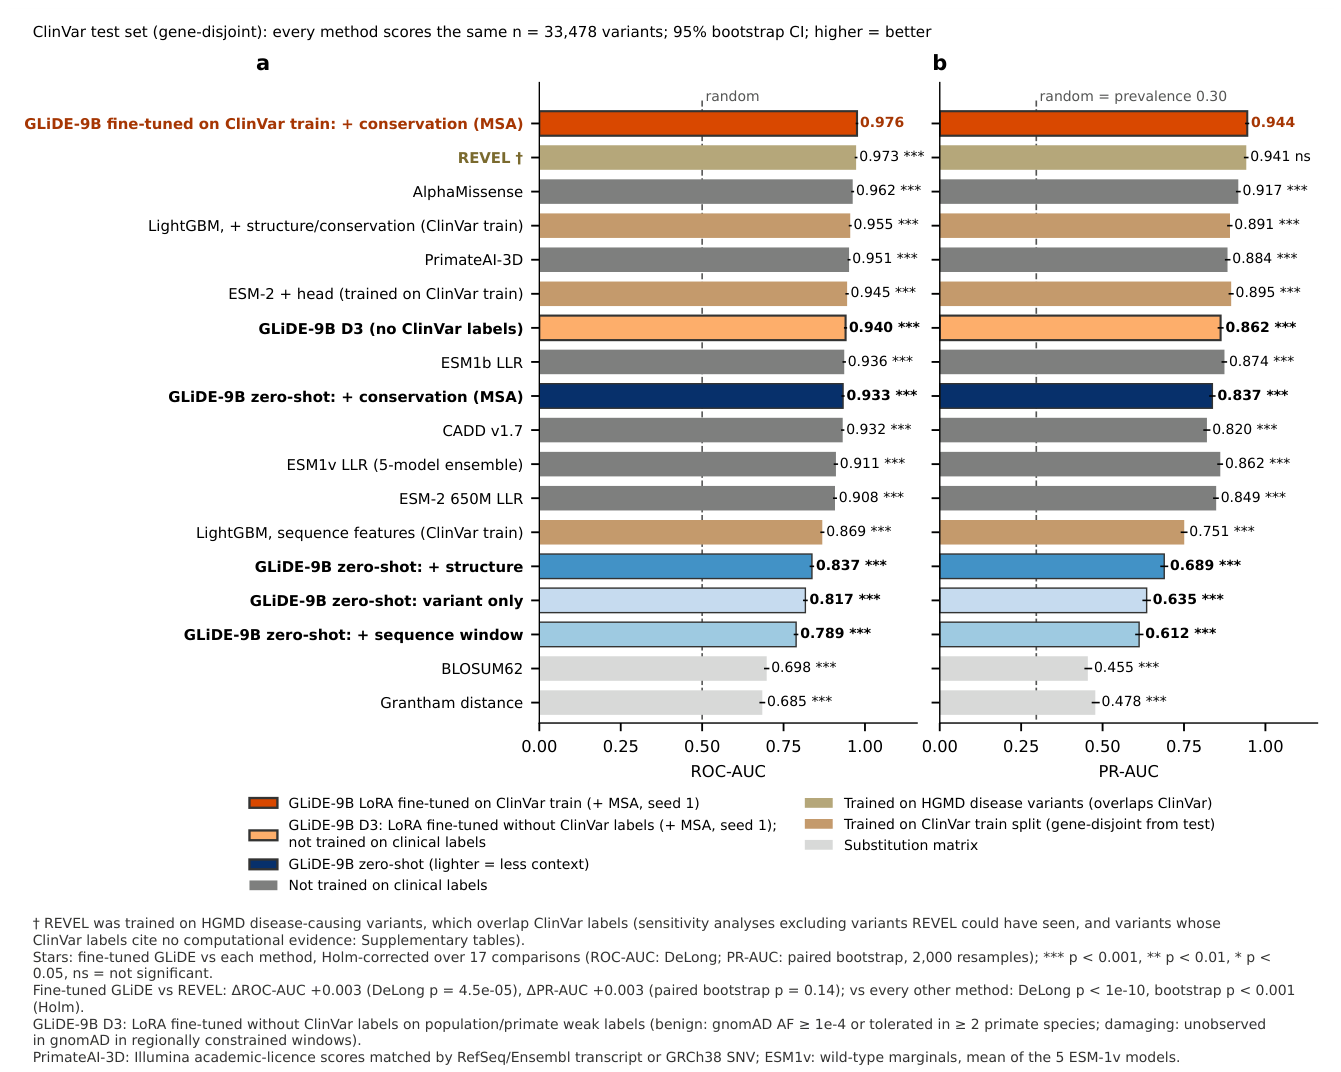
Figure 3.
Fine-tuning without ClinVar training targets. (a) Validation AUROC during training for the original weak labels (harmful), the relabelled set D3, and the ClinVar-label reference. (b) Label-noise diagnostics for four candidate designs, judged by AlphaMissense as an external yardstick only. (c) Downstream effect on four benchmarks: D3 improves on zero-shot everywhere and stays below the ClinVar-trained model.
Figure 3.
Fine-tuning without ClinVar training targets. (a) Validation AUROC during training for the original weak labels (harmful), the relabelled set D3, and the ClinVar-label reference. (b) Label-noise diagnostics for four candidate designs, judged by AlphaMissense as an external yardstick only. (c) Downstream effect on four benchmarks: D3 improves on zero-shot everywhere and stays below the ClinVar-trained model.
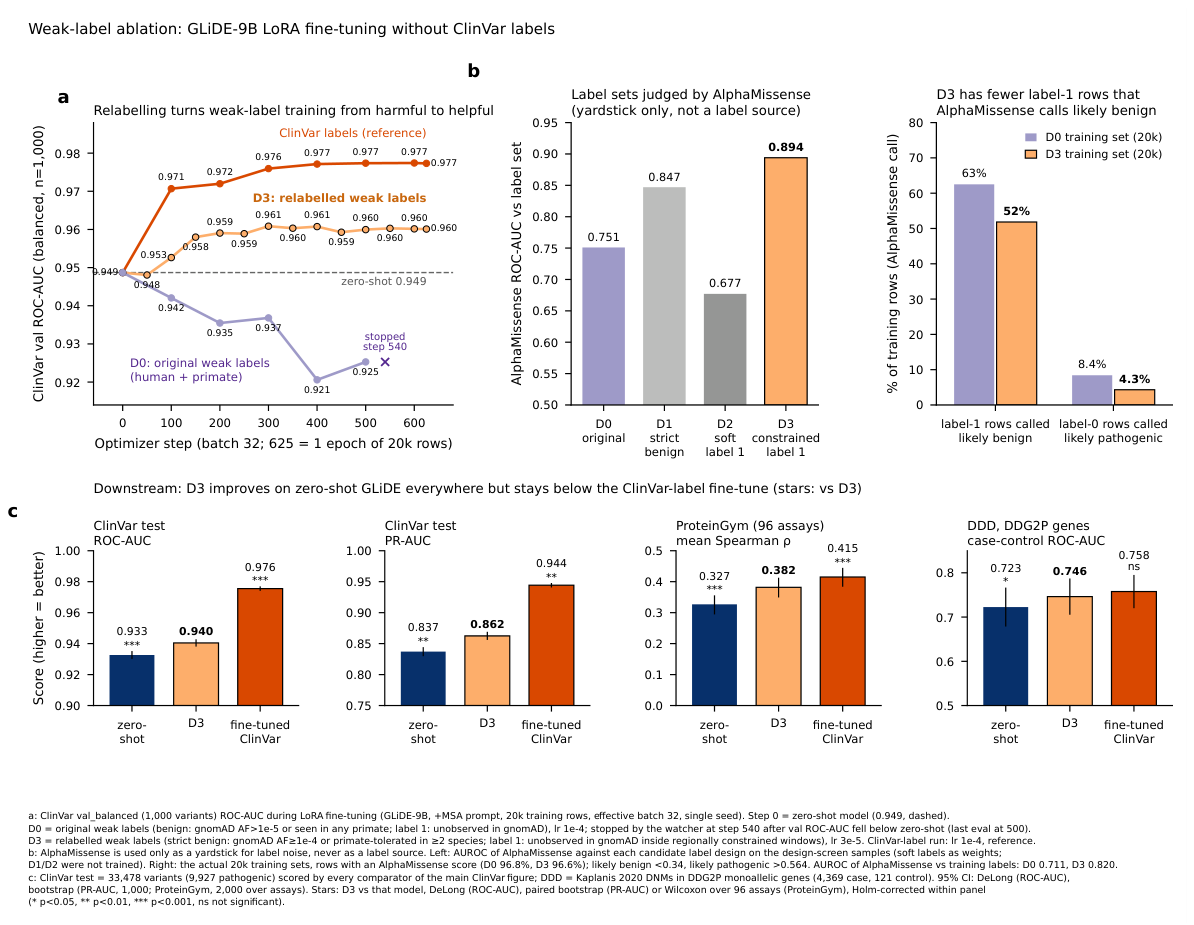
Figure 4.
Within-gene ranking and robustness of the comparison. (a) AUROC computed inside each of 209 test genes with variants per class (15,184 variants); one point per gene, large marker = median over genes. (b) ROC-AUC on the full test set, in two classification-date strata (after March and September 2026), and on test variants whose ClinVar labels cite no computational evidence (, 9,611, 5,311 and 4,719; prevalence 0.30, 0.43, 0.43 and 0.57). Error bars are DeLong 95% intervals. PrimateAI-3D and ESM-1v scores are not available for the temporal sets and are omitted from (b). † REVEL’s training data overlap ClinVar.
Figure 4.
Within-gene ranking and robustness of the comparison. (a) AUROC computed inside each of 209 test genes with variants per class (15,184 variants); one point per gene, large marker = median over genes. (b) ROC-AUC on the full test set, in two classification-date strata (after March and September 2026), and on test variants whose ClinVar labels cite no computational evidence (, 9,611, 5,311 and 4,719; prevalence 0.30, 0.43, 0.43 and 0.57). Error bars are DeLong 95% intervals. PrimateAI-3D and ESM-1v scores are not available for the temporal sets and are omitted from (b). † REVEL’s training data overlap ClinVar.
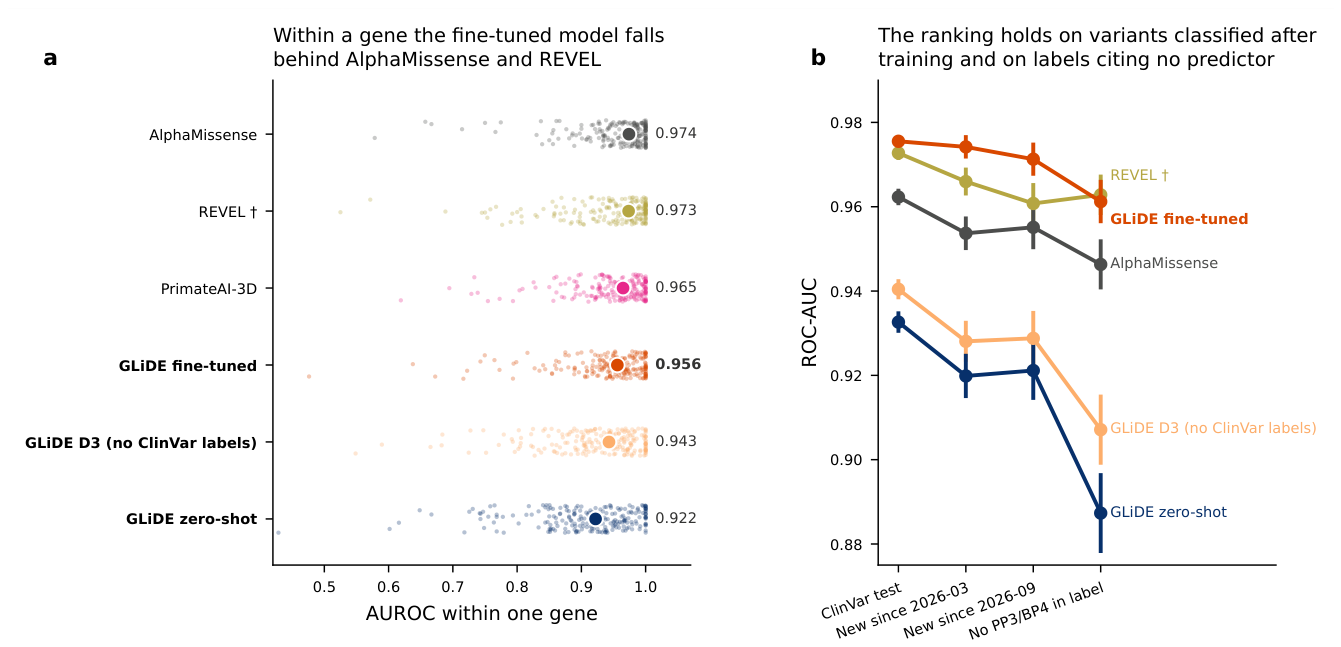
Figure 5.
Calibration on the ClinVar test set. (a) Raw reliability curves with score histograms; (b) after Platt scaling fitted on ClinVar validation variants, never on test; (c) expected calibration error and Brier score, hatched = after scaling. ESM-type log-likelihood ratios are not probabilities and are not shown.
Figure 5.
Calibration on the ClinVar test set. (a) Raw reliability curves with score histograms; (b) after Platt scaling fitted on ClinVar validation variants, never on test; (c) expected calibration error and Brier score, hatched = after scaling. ESM-type log-likelihood ratios are not probabilities and are not shown.
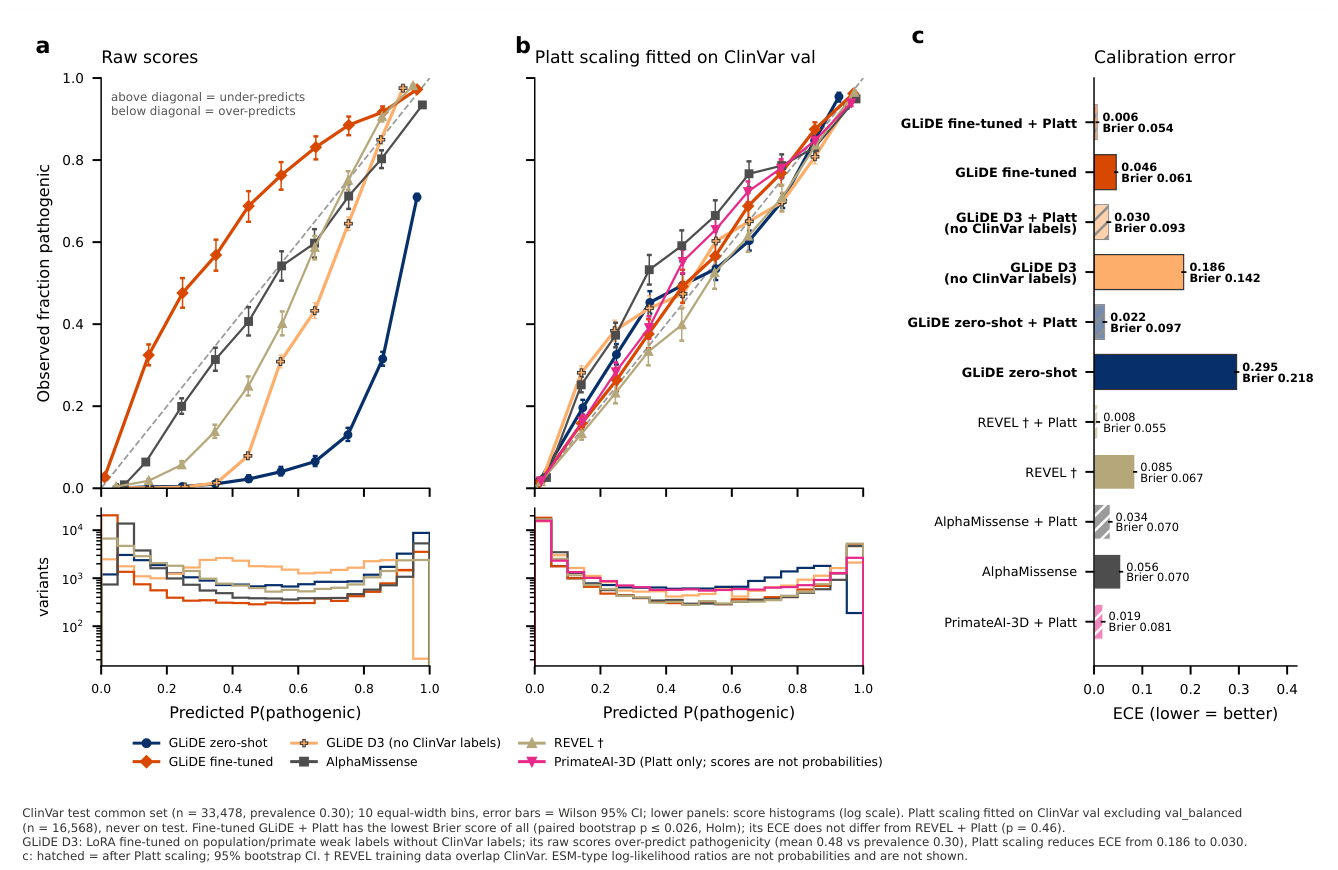
Figure 6.
Four benchmarks outside ClinVar. (a) De novo missense variants from DDD probands versus controls, restricted to DDG2P monoallelic genes (5,202 case / 121 control variants). (b) ProteinGym, mean per-assay Spearman correlation over 96 human assays; PrimateAI-3D covers too few assays to be comparable (n.d.). (c) Genebass, mean per-pair Spearman correlation between score and burden-signed effect size (507 gene–trait pairs, 90 genes). (d) Autism (circles, 4,249 versus 1,649) and congenital heart disease (squares, 1,140 versus 1,649) de novo variants, all genes; five of six intervals exclude chance in each cohort, but no method differs significantly from the fine-tuned model. Error bars are 95% intervals.
Figure 6.
Four benchmarks outside ClinVar. (a) De novo missense variants from DDD probands versus controls, restricted to DDG2P monoallelic genes (5,202 case / 121 control variants). (b) ProteinGym, mean per-assay Spearman correlation over 96 human assays; PrimateAI-3D covers too few assays to be comparable (n.d.). (c) Genebass, mean per-pair Spearman correlation between score and burden-signed effect size (507 gene–trait pairs, 90 genes). (d) Autism (circles, 4,249 versus 1,649) and congenital heart disease (squares, 1,140 versus 1,649) de novo variants, all genes; five of six intervals exclude chance in each cohort, but no method differs significantly from the fine-tuned model. Error bars are 95% intervals.
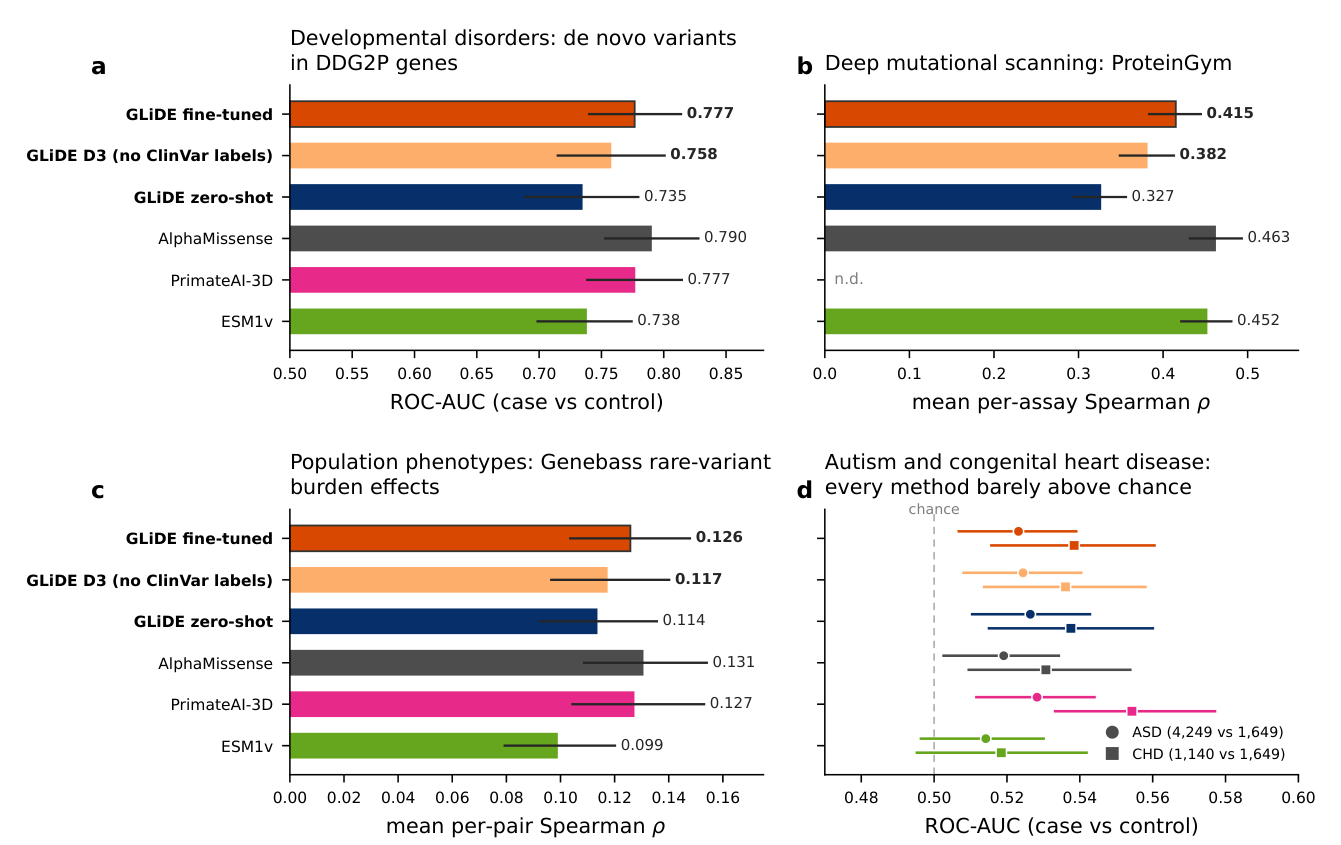
Figure 7.
Context ablation on nested prompts. (a) Change in log-odds contributed by each added block, by true class, with the AUROC of the shift alone. (b) The conservation shift as a function of how conserved the reference residue is and whether the alternate residue is seen in orthologues. (c, d) Two test variants: scores across the four arms and the fine-tuned model, with the relevant prompt excerpt.
Figure 7.
Context ablation on nested prompts. (a) Change in log-odds contributed by each added block, by true class, with the AUROC of the shift alone. (b) The conservation shift as a function of how conserved the reference residue is and whether the alternate residue is seen in orthologues. (c, d) Two test variants: scores across the four arms and the fine-tuned model, with the relevant prompt excerpt.
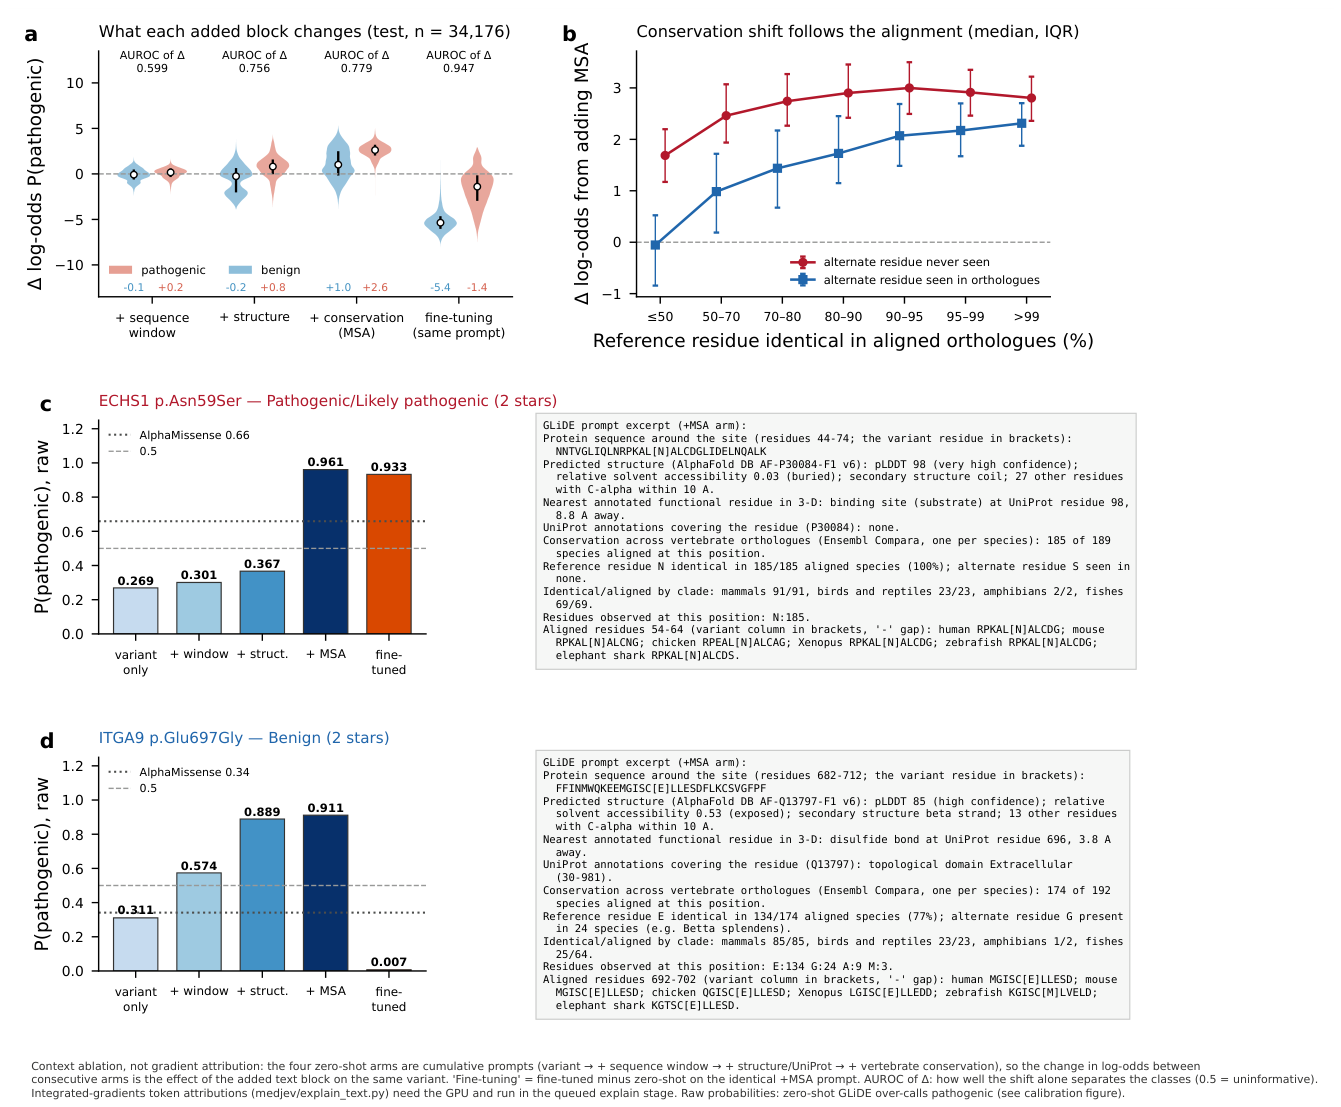

Table 1.
ClinVar test split, 33,478 variants scored by every method (prevalence 0.297). 95% confidence intervals: DeLong for ROC-AUC, 2,000-resample bootstrap for average precision. Under the reported paired tests and Holm correction, differences from the fine-tuned model are significant except for REVEL’s average precision. The ROC-AUC difference from REVEL has .
Table 1.
ClinVar test split, 33,478 variants scored by every method (prevalence 0.297). 95% confidence intervals: DeLong for ROC-AUC, 2,000-resample bootstrap for average precision. Under the reported paired tests and Holm correction, differences from the fine-tuned model are significant except for REVEL’s average precision. The ROC-AUC difference from REVEL has .
| Method | Training labels | ROC-AUC | PR-AUC |
|---|---|---|---|
| GLiDE-9B fine-tuned (ClinVar) | ClinVar train | 0.976 (0.974–0.977) | 0.944 (0.940–0.948) |
| REVEL | HGMD/ClinVar | 0.973 (0.971–0.974) | 0.941 (0.937–0.946) |
| AlphaMissense | none (clinical) | 0.962 (0.960–0.964) | 0.917 (0.912–0.922) |
| LightGBM, + struct./cons. | ClinVar train | 0.955 (0.953–0.957) | 0.891 (0.885–0.897) |
| PrimateAI-3D | none (clinical) | 0.951 (0.949–0.953) | 0.884 (0.878–0.890) |
| ESM-2 + head | ClinVar train | 0.945 (0.943–0.948) | 0.895 (0.890–0.900) |
| GLiDE-9B D3 (proxy training labels) | population/primate | 0.940 (0.938–0.943) | 0.862 (0.856–0.869) |
| ESM-1b LLR | none | 0.936 (0.933–0.939) | 0.874 (0.868–0.880) |
| GLiDE-9B zero-shot, + conservation | none | 0.933 (0.930–0.935) | 0.837 (0.830–0.844) |
| CADD v1.7 | none (clinical) | 0.932 (0.929–0.934) | 0.821 (0.812–0.829) |
| ESM-1v LLR (5-model) | none | 0.911 (0.907–0.915) | 0.862 (0.855–0.867) |
| ESM-2 650M LLR | none | 0.908 (0.904–0.912) | 0.849 (0.842–0.855) |
| LightGBM, sequence | ClinVar train | 0.869 (0.865–0.873) | 0.751 (0.742–0.759) |
| GLiDE-9B zero-shot, + structure | none | 0.837 (0.833–0.842) | 0.689 (0.680–0.698) |
| GLiDE-9B zero-shot, variant only | none | 0.817 (0.812–0.822) | 0.635 (0.625–0.646) |
| GLiDE-9B zero-shot, + window | none | 0.789 (0.783–0.794) | 0.612 (0.602–0.623) |
| BLOSUM62 | — | 0.698 (0.692–0.704) | 0.455 (0.447–0.466) |
| Grantham distance | — | 0.685 (0.678–0.691) | 0.478 (0.468–0.489) |
Table 2.
Exploratory ACMG/AMP computational evidence thresholds, fitted on ClinVar validation variants (excluding the balanced checkpoint-selection subset, ; prior 0.0441, 200 bootstrap resamples) and applied to the 33,478 test variants. “Assigned” is the share of test variants reaching the strength; “correct” is the share of those that carry the matching ClinVar class. Very Strong is not reached by either model.
Table 2.
Exploratory ACMG/AMP computational evidence thresholds, fitted on ClinVar validation variants (excluding the balanced checkpoint-selection subset, ; prior 0.0441, 200 bootstrap resamples) and applied to the 33,478 test variants. “Assigned” is the share of test variants reaching the strength; “correct” is the share of those that carry the matching ClinVar class. Very Strong is not reached by either model.
| Model | Criterion | Threshold | Assigned | Correct class |
|---|---|---|---|---|
| GLiDE fine-tuned (ClinVar) | PP3 Supporting | 28.2% | 89.7% | |
| PP3 Moderate | 22.9% | 94.5% | ||
| PP3 Strong | 8.6% | 98.9% | ||
| BP4 Supporting | 57.3% | 98.8% | ||
| BP4 Moderate | 38.7% | 99.7% | ||
| BP4 Strong | 20.1% | 99.9% | ||
| GLiDE D3 (proxy training labels) | PP3 Supporting | 26.5% | 81.0% | |
| PP3 Moderate | 16.7% | 89.5% | ||
| PP3 Strong | 2.7% | 98.0% | ||
| BP4 Supporting | 50.6% | 98.7% | ||
| BP4 Moderate | 42.7% | 99.4% | ||
| BP4 Strong | 10.9% | 99.8% |
Disclaimer/Publisher’s Note: The statements, opinions and data contained in all publications are solely those of the individual author(s) and contributor(s) and not of MDPI and/or the editor(s). MDPI and/or the editor(s) disclaim responsibility for any injury to people or property resulting from any ideas, methods, instructions or products referred to in the content. |
© 2026 by the authors. Licensee MDPI, Basel, Switzerland. This article is an open access article distributed under the terms and conditions of the Creative Commons Attribution (CC BY) license (http://creativecommons.org/licenses/by/4.0/).
Copyright: This open access article is published under a Creative Commons CC BY 4.0 license, which permit the free download, distribution, and reuse, provided that the author and preprint are cited in any reuse.