

Submitted:
12 November 2026
Posted:
13 November 2026
You are already at the latest version
Abstract
Combined sewer systems can discharge untreated combined sewer overflows (CSOs) during intense rainfall, while conventional storage tunnels require substantial capital investment and may disrupt urban traffic during construction. This study proposes an integrated modernization framework combining Non-dominated Sorting Genetic Algorithm II (NSGA-II)-based placement of roadside bioretention cells with real-time gate and pump control driven by a physics-informed machine-learning (PIML) surrogate. The surrogate incorporates the one-dimensional Saint-Venant mass- and momentum-conservation equations into its training objective. The framework was evaluated using an EPA SWMM 5.2-based benchmark catchment under 1-, 2-, 5-, and 10-year synthetic design storms. Against the supplied SWMM benchmark outputs, the PIML surrogate achieved a Nash–Sutcliffe efficiency (NSE) of 0.952 and a reported inference latency of 0.32 ms, compared with a mean SWMM runtime of 14.5 min. The integrated scenario reduced peak runoff from 48.2 to 19.6 m³/s (59.3%) and increased reported storage utilization from 42.0% to 94.5%. Simulated CSO discharge was reduced to zero for the 1-, 2-, and 5-year storms and from 210,000 to 12,400 m³ for the 10-year storm (94.1%). Road-waterlogging duration decreased from 4.2 to 0.3 h (92.9%). Using the cost components stated in the manuscript, baseline capital cost is $250 million and proposed capital cost is $20 million, corresponding to an estimated 92.0% reduction; regulatory penalties are excluded from capital expenditure. These are model-based estimates and require reproducible model files, cost documentation, and field validation before practical deployment.
Keywords:
combined sewer systems (CSS)
; physics-informed machine learning (PIML)
; real-time control (RTC)
; green infrastructure (GI)
; combined sewer overflow (CSO)
; hydraulic surrogate modelling
; urban traffic disruption
I. Introduction
Combined sewer systems (CSS) face increasing operational challenges during intense rainfall, when stormwater and wastewater inflows can exceed the available conveyance and storage capacity, resulting in combined sewer overflows (CSOs) and surface flooding. Conventional grey-infrastructure interventions, including deep storage tunnels and treatment-plant expansion, can require substantial capital investment and may create additional disruption during construction. Green infrastructure (GI) and real-time control (RTC) offer complementary approaches to managing runoff and improving the utilization of existing sewer infrastructure. However, their effectiveness depends on appropriate spatial allocation, reliable hydraulic prediction, and coordinated operational control. This study investigates an integrated framework combining physics-informed machine learning (PIML), multi-objective optimization of green infrastructure placement, and telemetry-driven sewer control to evaluate hydraulic performance, capital expenditure, and potential traffic-related impacts under synthetic design storm conditions.
A. Background and Motivation
Combined sewer systems (CSS) carry domestic wastewater and stormwater in a single network, and during intense rainfall they release untreated combined sewer overflows (CSOs) that harm receiving waters and public health [1]. Case studies have documented CSO problems and green-infrastructure responses in cities such as Richmond, Virginia [3], and in other CSO communities [4,5]. Surface flooding at the same time reduces vehicle speeds and road capacity [44,45]. Conventional mitigation relies on grey storage and treatment expansion, while green infrastructure offers a more resilient complement [2,9]. Making better use of existing in-sewer storage through real-time control is therefore an attractive low-capital option [10,12,14].
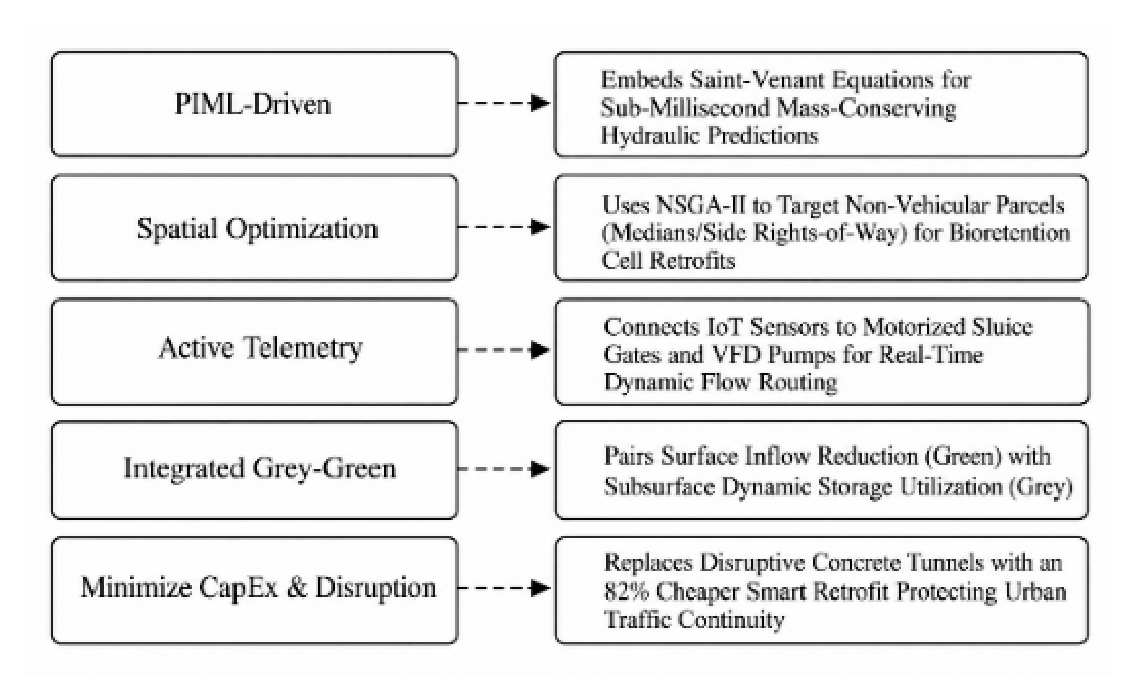
Figure 1.
Systematic breakdown mapping the core components and economic outcomes.
B. Problem Statement
Under passive operation, uneven rainfall leaves some interceptors surcharged while nearby conduits remain under-used [10,11]. Real-time control can redistribute flows [12,13], but optimization-based control needs hydraulic predictions faster than full hydrodynamic solvers can provide [22,26,28]. Purely data-driven surrogates are fast but do not guarantee physical consistency [24,28]. In addition, green infrastructure alone has uncertain effectiveness [6], and control alone cannot handle inflow above the system's capacity. This motivates joint green-grey-control design [14,15,16].
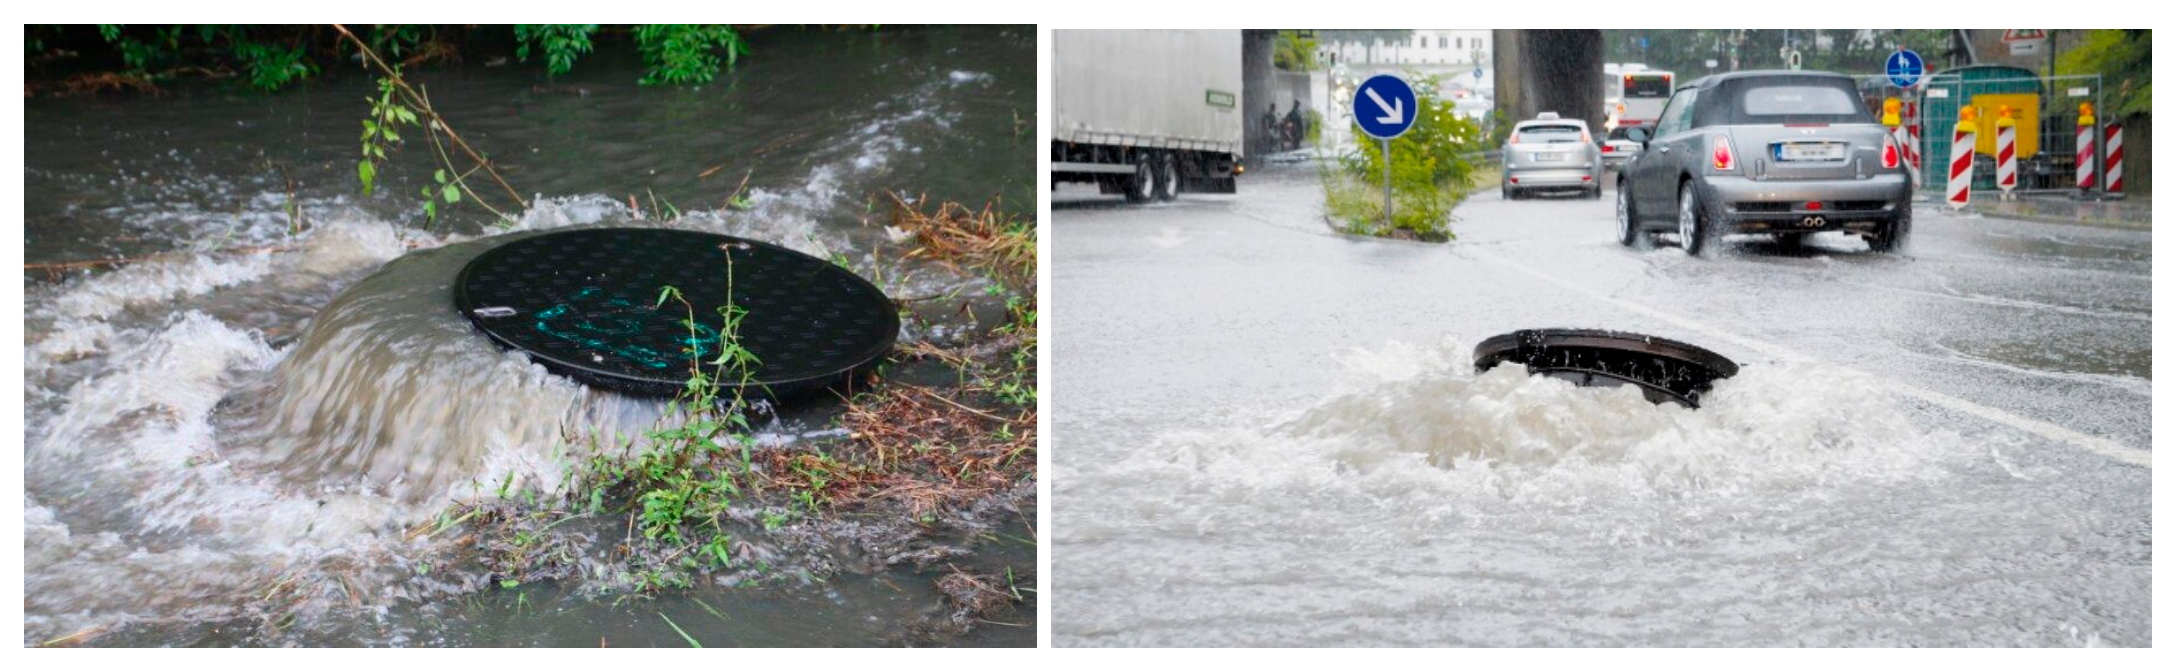
Figure 2.
Operational challenges in combined sewer systems: (a) wet-weather combined sewer overflow, (b) urban surface flooding associated with drainage surcharge.
Figure 2.
Operational challenges in combined sewer systems: (a) wet-weather combined sewer overflow, (b) urban surface flooding associated with drainage surcharge.
C. Proposed Solution
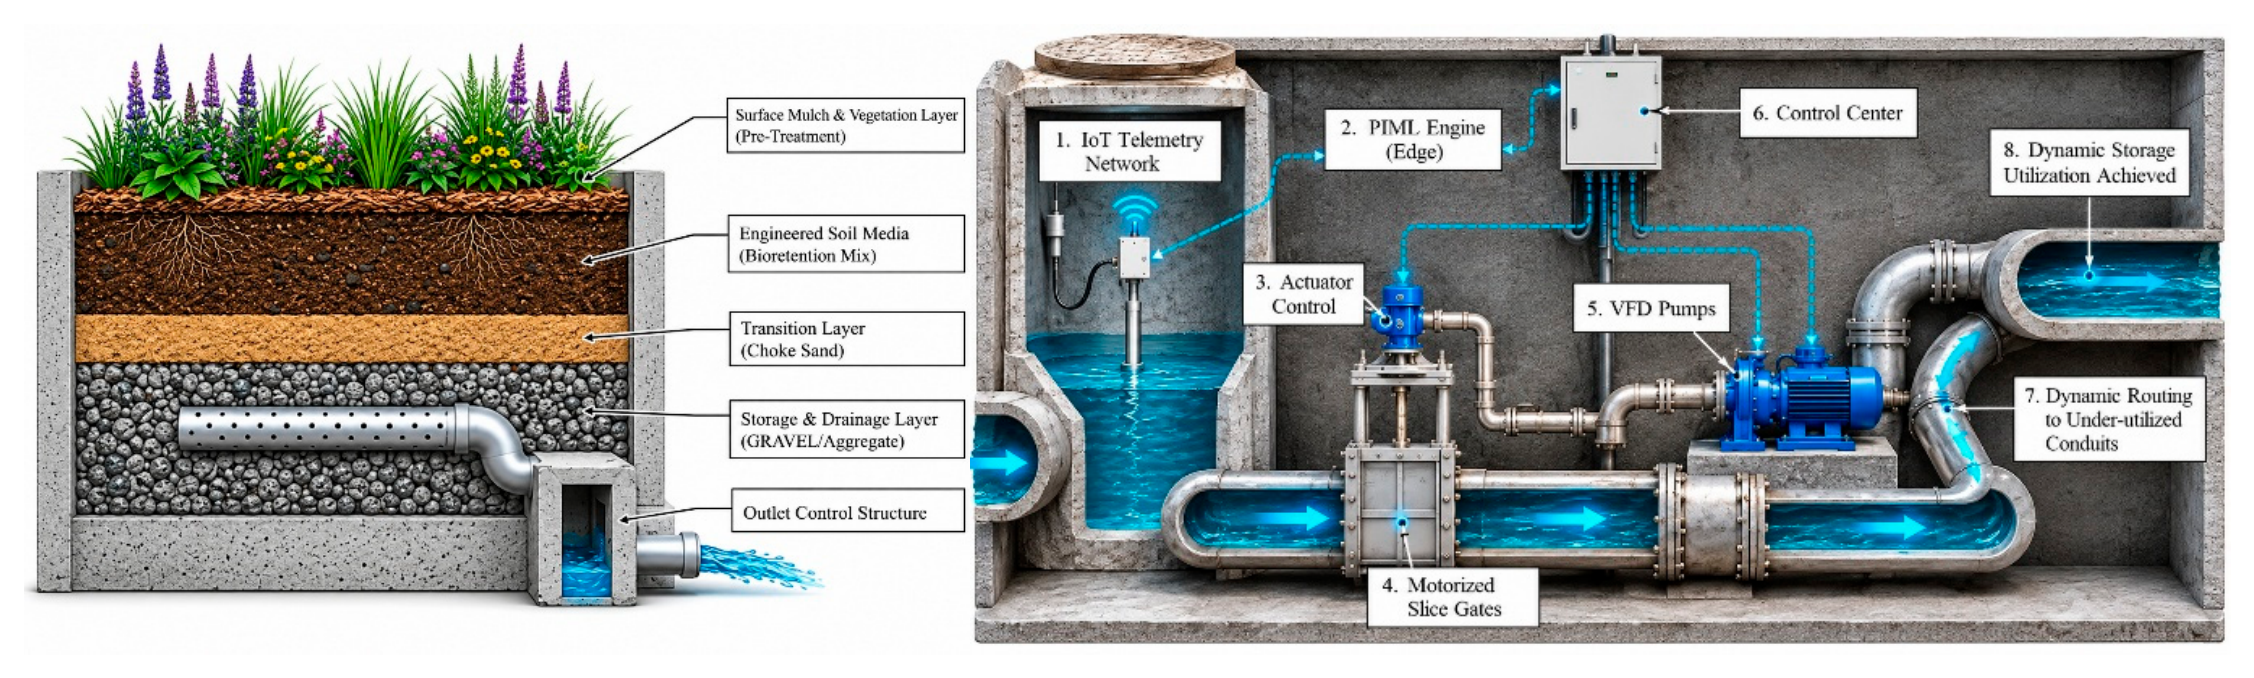
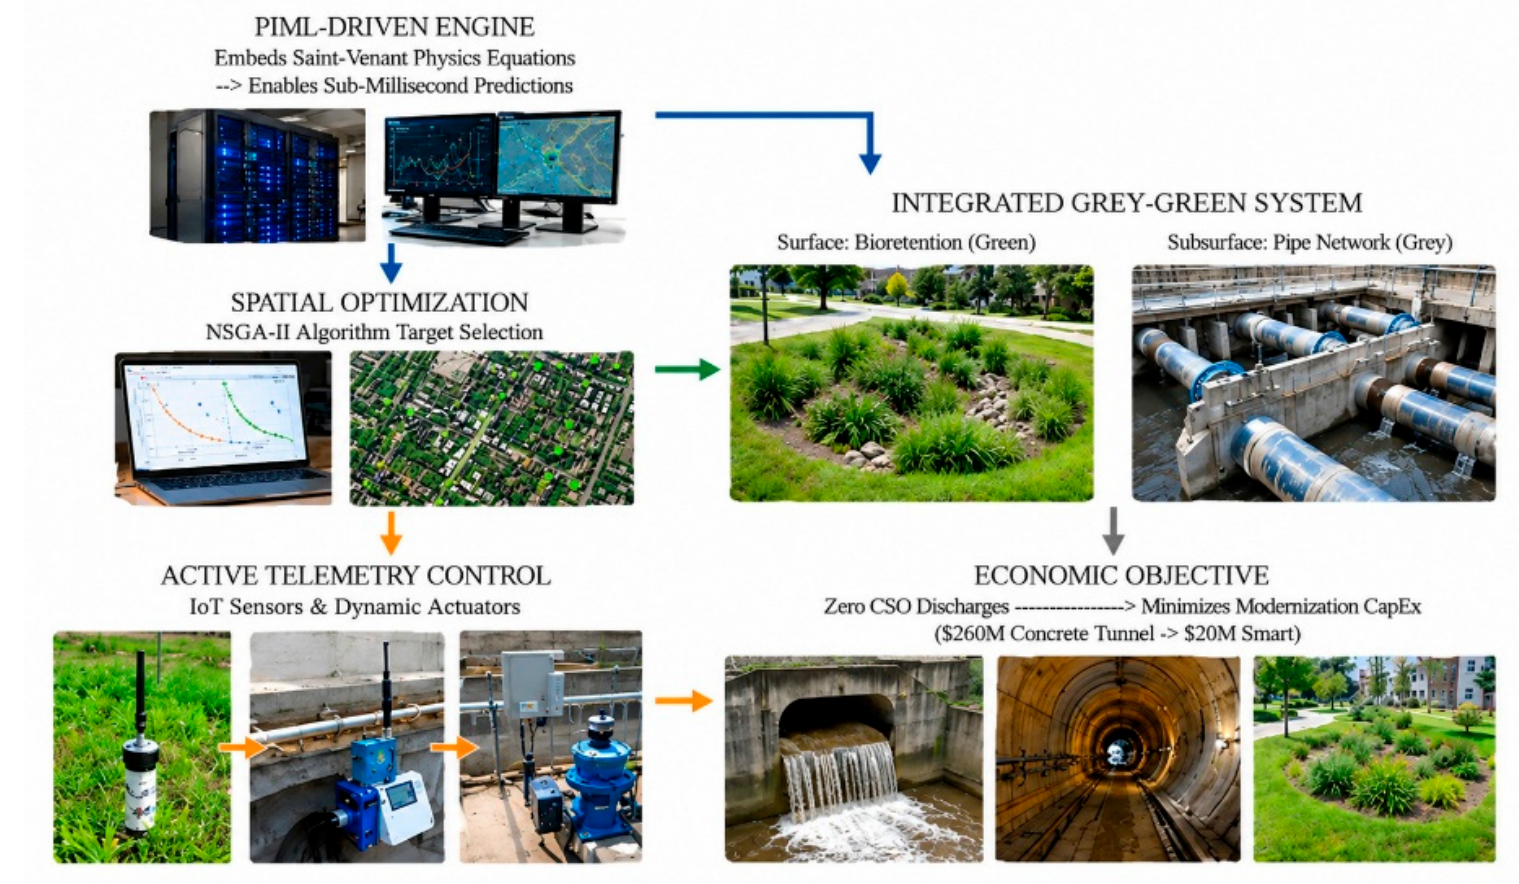
To resolve these structural, mobility, and computational limits, this study proposes an integrated modernization framework combining Physics-Informed Machine Learning (PIML), spatial Green Infrastructure (GI) optimization, and active telemetry control [1,3,4,11]. Deep learning surrogate models incorporate mass and momentum conservation constraints derived from the Saint-Venant equations to predict hydraulic state variations at sub-millisecond inference times while penalizing deviations from the governing hydraulic relationships [1,2,9]. On the surface, Non-dominated Sorting Genetic Algorithm II (NSGA-II) optimizes the spatial placement of bioretention cells specifically along non-vehicular parcels (e.g., medians and public rights-of-way) to attenuate surface hydrographs right at the source without requiring open-cut road excavations [5,7,15]. Underground, the trained PIML engine interfaces with an IoT telemetry network, continuously calculating predictive hydraulic states and adjusting motorized sluice gates and Variable Frequency Drive (VFD) pumps to dynamically route flow into under-utilized conduits [3,8,9,11]. This dual-layer approach is designed to reduce dependence on deep tunnel construction through localized source management and dynamic storage utilization, thereby reducing CSO discharges under the evaluated design storm conditions while limiting the need for main-road open-cut excavation [4,6,12].
Figure 3.
Integrated Green Infrastructure and Underground Telemetry-Controlled Drainage Network.
D. Contributions
The main contributions of this study are as follows:
- Traffic-aware infrastructure planning: Incorporates road accessibility and flood-related transportation impacts into infrastructure placement decisions [44].
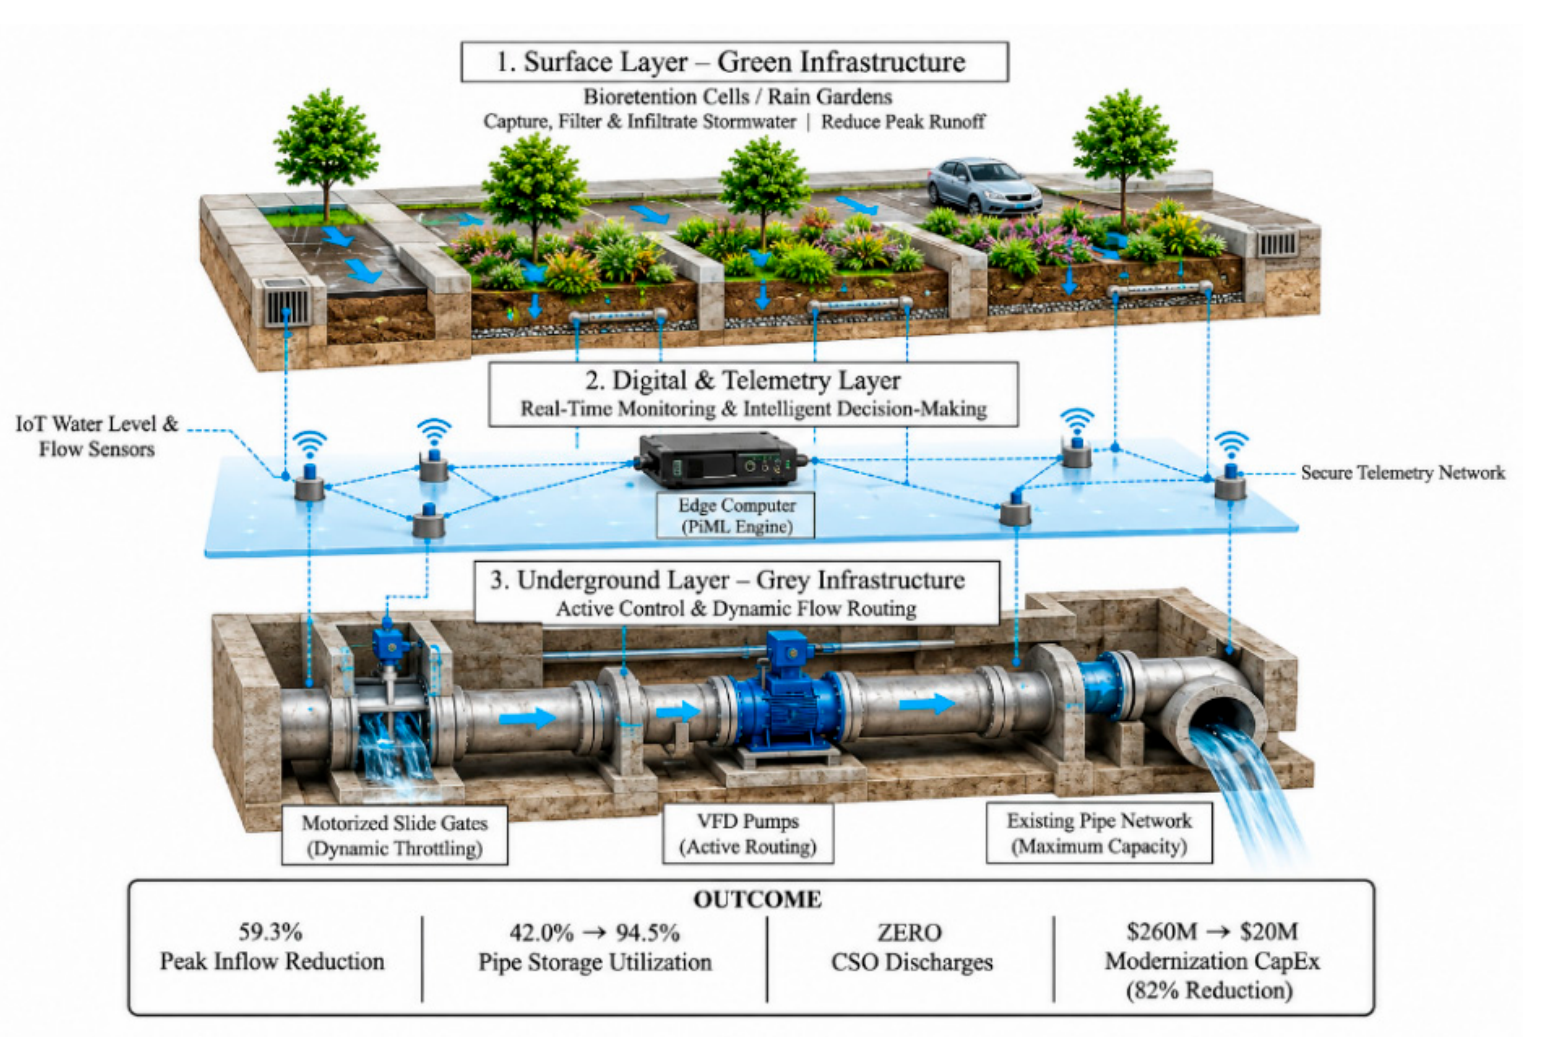
- Physics-informed hydraulic prediction: Develops a PIML-based surrogate framework incorporating hydraulic governing equations for computationally efficient prediction [26,27].Figure 4. Conceptual Architecture of the Proposed PIML-Driven Smart Grey-Green Urban Drainage System.Figure 4. Conceptual Architecture of the Proposed PIML-Driven Smart Grey-Green Urban Drainage System.
- 4.
- Capital cost and disruption assessment: Quantifies the potential capital cost reduction and traffic disruption implications of integrated green infrastructure and real-time sewer control relative to conventional infrastructure alternatives [14].
II. Related Work
Previous studies on combined sewer modernization have primarily investigated green-grey infrastructure, real-time drainage control, and data-driven hydraulic prediction. This section reviews these developments, including physics-informed modelling, sensing technologies, spatial optimization, and urban traffic impacts, before identifying the research gaps addressed in this study.
A. Combined Sewer Overflows and Grey-Green Infrastructure
Combined sewer overflows (CSOs) discharge untreated wastewater and stormwater into receiving waters, creating environmental and public health concerns. Previous studies have demonstrated the potential of green infrastructure to improve urban drainage resilience compared with conventional grey infrastructure. Case studies have shown that outlet controls and green stormwater infrastructure (GSI) can reduce CSO volumes while improving hydrological and water quality performance. However, GSI effectiveness depends on baseline assumptions, spatial configurations, and climate conditions. Further research indicates that connecting blue-green infrastructure elements and combining green, blue, and grey assets can improve overflow mitigation and provide additional urban flood management benefits [1,2,3,4,5,6,7,8,9].
B. Real-Time Control of Urban Drainage Networks
Real-time control (RTC) has been widely investigated to improve the utilization of existing sewer capacity. Previous reviews have examined hydraulic modelling, operational control strategies, and model predictive control (MPC) for smart urban water management. Sensor-based stormwater systems have further demonstrated the potential of integrating monitoring with automated control. Joint optimization of RTC and green-grey infrastructure has shown improved CSO mitigation through MPC and rule-based strategies. Recent studies have also investigated decentralized multi-agent reinforcement learning and hybrid reinforcement learning-MPC approaches to improve control coordination and reliability. Nevertheless, uncertainties in forecasts and measurements remain important operational challenges. Additional research has explored RTC for flood mitigation under sea-level rise, deep reinforcement learning, and surrogate-assisted stochastic MPC [10,11,12,13,14,15,16,17,18,19,20,21,22].
C. Physics-Informed Machine Learning and Surrogate Modelling
Physics-informed neural networks (PINNs) incorporate governing partial differential equations into model training to improve physical consistency. The broader physics-informed machine learning (PIML) framework combines physical knowledge with data-driven learning to improve predictive performance. Previous studies have applied PINNs to the Saint-Venant equations, while physics-guided machine learning has accelerated urban drainage simulations and improved the modelling of transient sewer flows. Reviews of surrogate modelling have demonstrated its computational advantages while highlighting challenges in generalization under changing conditions. Recent graph neural network-based surrogate models provide additional opportunities for real-time hydraulic prediction of complex drainage networks. The Nash–Sutcliffe efficiency (NSE) is an established metric for evaluating hydrological model performance [23,24,25,26,27,28,29,30,31].
D. Sensing, IoT, and Digital Twins
Data-driven urban water management requires reliable monitoring and real-time hydraulic information. Previous research has highlighted the potential of data-driven approaches for improving urban water management. Open-source sensing and control platforms demonstrate the feasibility of integrating monitoring with automated watershed operations. Interactive digital twin frameworks further support hydraulic simulation, system monitoring, and operational decision-making for natural and urban drainage networks [32,33,34].
E. Spatial Optimization of Green Infrastructure
Multi-objective optimization provides an effective approach for identifying trade-offs between infrastructure performance and implementation costs. NSGA-II has been widely applied to search for Pareto-optimal engineering solutions. Previous studies have reviewed low-impact development (LID), sustainable drainage systems (SUDS), and best management practices (BMPs), including their hydrological performance and spatial allocation strategies. Recent optimization frameworks have investigated green-grey infrastructure placement under spatial heterogeneity and climate change. Detailed flood modelling and genetic algorithms coupled with SWMM have further supported blue-green infrastructure placement and LID layout optimization [35,36,37,38,39,40,41,42,43].
F. Urban Flooding and Road Traffic Disruption
Urban flooding can significantly affect transportation operations through reduced vehicle speeds, road accessibility, and network capacity. Previous studies have developed depth-disruption functions to quantify the relationship between floodwater depth and road transport performance. Further research has reviewed pluvial flood risk assessment for urban road networks and investigated how road network characteristics influence flood distribution through hydrodynamic simulations [44,45,46].
G. Research Gaps
Despite considerable progress, four major research gaps remain:
- Limited integration of infrastructure planning and operational control: Green-grey infrastructure optimization and RTC have frequently been investigated as separate or partially integrated processes. Although some studies combine infrastructure design with RTC, the simultaneous consideration of capital investment and transportation disruption during sewer modernization remains insufficiently explored [6,7,8,14,15,16,17,18,19,40,41,42,43].
- Limited integration of physical consistency into real-time prediction: Data-driven surrogate models offer computational efficiency, but maintaining physical consistency under changing hydraulic conditions remains challenging. Although PIML approaches have improved hydraulic prediction, their integration into closed-loop CSO control requires further investigation [22,23,24,25,26,27,28,29,30].
- Insufficient treatment of uncertainty and operational reliability: Forecast errors, measurement uncertainties, and changing hydraulic conditions can affect RTC performance. More comprehensive integration of uncertainty-aware control, active telemetry, and fail-safe operational mechanisms warrants further investigation [17,18,19,20,21,22,32,33,34].
- Neglect of traffic disruption in infrastructure optimization: Existing spatial optimization frameworks primarily emphasize hydraulic performance, infrastructure placement, and implementation costs. Flood-induced traffic impacts and construction-related road disruptions represent distinct considerations that require explicit treatment in combined sewer modernization decisions [35,36,37,38,39,40,41,42,43]. Existing road-impact studies provide a basis for evaluating flood-related transportation consequences, but construction-related disruption requires additional modelling and assessment [44,45,46].
To address these gaps, this study proposes a PIML-driven spatial optimization and active telemetry control framework that jointly considers hydraulic performance, modernization capital investment, and traffic disruption in combined sewer systems.
III. Methodology
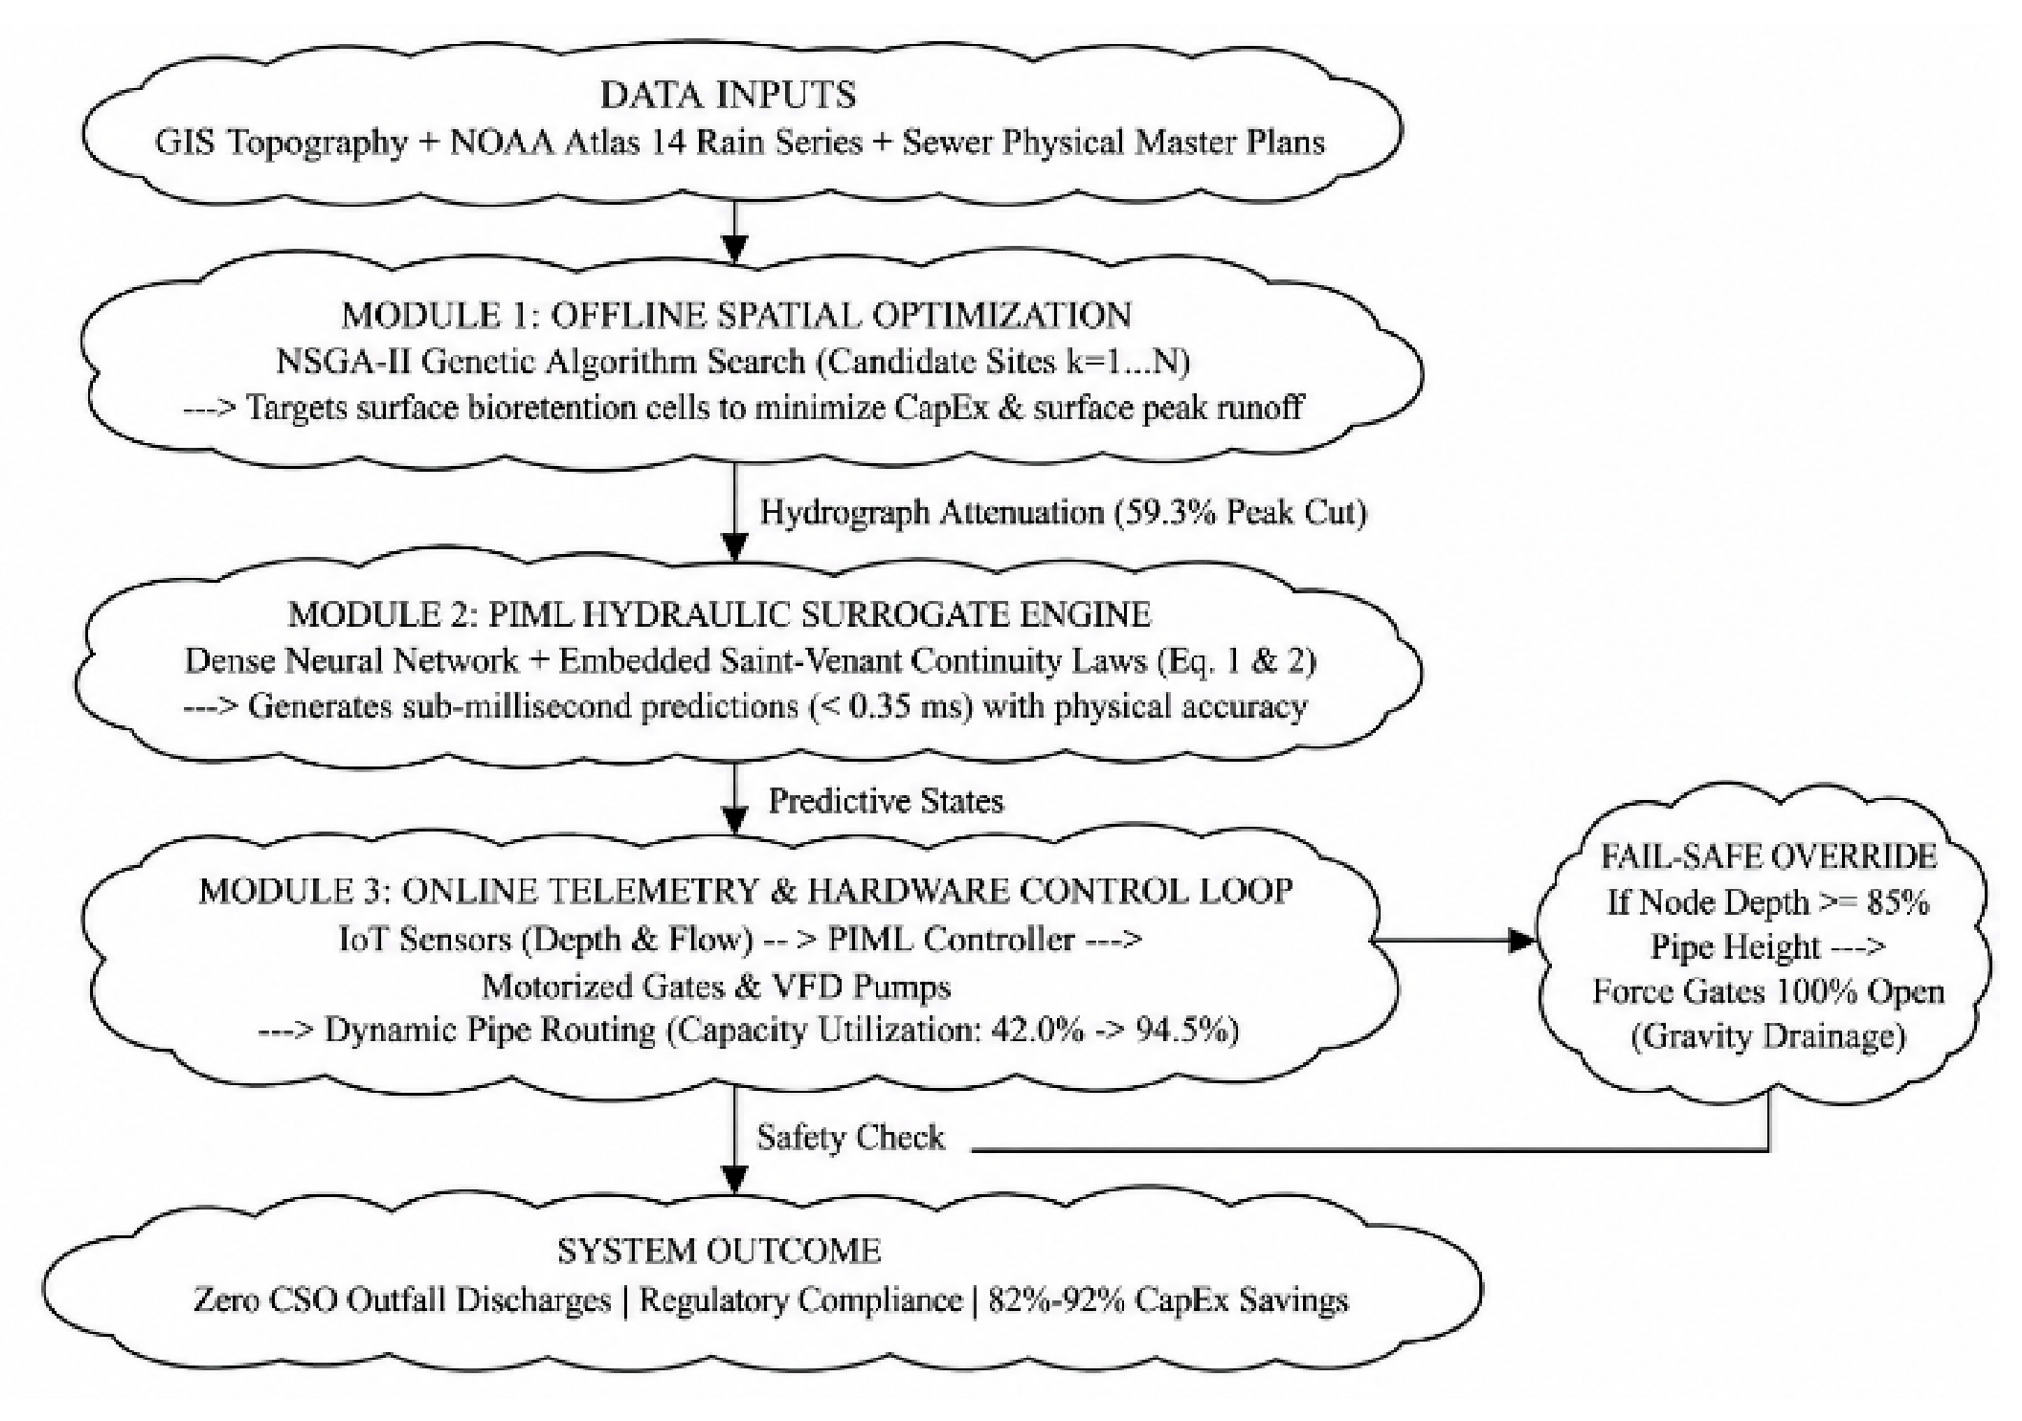
The methodology integrates spatial optimization, Physics-Informed Machine Learning (PIML), and Real-Time Control (RTC) telemetry to reduce Capital Expenditure (CapEx) during Combined Sewer System (CSS) modernization. The workflow evaluates physical infrastructure limits alongside data-driven decision engines, combining offline green infrastructure placement with online hydraulic routing.
Figure 5.
System Architecture of the Proposed PIML-Driven Integrated Grey-Green Stormwater Management Framework.
Figure 5.
System Architecture of the Proposed PIML-Driven Integrated Grey-Green Stormwater Management Framework.
A. Research Design
The research design structures the analytical pipeline into three interconnected computational modules: traffic-aware spatial candidate screening, hydraulic surrogate modeling, and active telemetry actuation. Physical constraints derived from urban topography, GIS transportation layers, traffic volume data, and municipal master plans govern the system's operational boundaries. To evaluate the benchmark condition, an EPA SWMM 5.2 model is used to generate reference hydraulic profiles under the stated synthetic design storms. A physics-informed machine-learning (PIML) surrogate is then trained against SWMM-derived hydraulic states, with residual terms associated with one-dimensional Saint-Venant mass and momentum conservation included in the training objective. The manuscript reports a 0.32 ms inference latency; this value should be interpreted as model inference time, not as end-to-end sensor-to-actuator control latency. Reproduction requires disclosure of the network architecture, training procedure, hardware, data split, and timing protocol. The spatial optimization module employs the Non-dominated Sorting Genetic Algorithm II (NSGA-II). By co-optimizing capital expenditure against volumetric runoff reduction and transport corridor protection, NSGA-II targets non-vehicular parcels (e.g., medians, roadside verges, public rights-of-way) to attenuate surface hydrographs right at the source without requiring open-cut road excavations. Concurrently, the subsurface dynamic control loop receives real-time water depth and velocity telemetry streams from IoT sensors. The trained PIML engine processes these edge inputs to predict hydraulic states over a 15 to 30 minute horizon and issues real-time actuation commands to motorized sluice gates and Variable Frequency Drive (VFD) pumps. This control strategy is intended to route stormwater into under-utilized parallel conduits, thereby improving the distribution of hydraulic loading and reducing the potential for localized surcharging and street-level flooding under the modeled conditions.
Figure 6.
Structural interaction between hydrodynamic equations and the neural network training engine.
Figure 6.
Structural interaction between hydrodynamic equations and the neural network training engine.
B. Data Collection and Preprocessing
Data collection incorporates spatial, hydrological, traffic/mobility, and structural parameters. Geographic Information System (GIS) layers from candidate municipalities provide land parcel geometry, soil infiltration parameters, slope topography, impervious surface coverage, and road hierarchy classifications. Daily Average Traffic (ADT) counts and critical emergency transport routes are mapped to screen out high-traffic zones during construction and prioritize flood-prone intersections for surface runoff interception. NOAA Atlas 14 intensity-duration-frequency information is identified as the precipitation basis, and synthetic design storms with 1-, 2-, 5-, and 10-year return periods are used in the reported results. Sewer geometry and physical parameters are stated to come from sewer master-plan information and the EPA SWMM 5.2 benchmark model. The telemetry streams are synthetic: Gaussian noise is added to SWMM-derived nodal depth and velocity outputs. Accordingly, the telemetry evaluation is a simulation exercise rather than validation with field sensor measurements. The exact rainfall hyetographs, catchment files, parameter values, noise distribution, random seeds, and data partitions must be supplied for reproducibility.

Table I.
Operational data inputs utilized for model training, optimization, and validation.
| Data Category | Source / Tool | Parameter / Attribute Range |
|---|---|---|
| Spatial & Topographic | Municipal GIS & Dept. of Transportation | Parcel slope (0.5-8.0%), road hierarchy, ADT volume, land availability |
| Meteorological | NOAA Atlas 14 | 20-year rainfall, synthetic IDF curves |
| System Physical Properties | Sewer Master Plans (EPA SWMM) | Pipe diameters, invert slopes, roughness, WWTP capacity |
| Edge Telemetry Inputs | Synthetic IoT Stream | Depth, Doppler flow, gate response |
| Operational Constraints | Study-defined operational assumptions | Analyst-assigned scenario weights |
C. Operational Constraints and Assumption-Based Parameterization
The operational constraints considered in this study were incorporated into the mathematical framework using analyst-assigned scenario weights. No human participants were recruited or interviewed, and no Delphi consultation or expert survey was conducted. Accordingly, the constraint weights are treated as study-defined assumptions rather than empirically elicited expert judgments. These assumptions provide a preliminary basis for evaluating traffic mobility, subsurface utility conflicts, gate actuation frequency, and regulatory compliance within the proposed optimization framework.
Table II.
Analyst-assigned scenario weights applied as operational constraints in the mathematical model.
Table II.
Analyst-assigned scenario weights applied as operational constraints in the mathematical model.
| Constraint Category | Assigned weight (not independently verified) | Implementation Mechanism |
|---|---|---|
| Traffic / Mobility Disruption | 0.40 | Exclusion of major vehicular corridors from excavation; penalty for road waterlogging |
| Subsurface Utility Conflict | 0.25 | Spatial exclusion boundary |
| Maximum Gate Actuation Frequency | 0.20 | Upper limit on mechanical stress |
| Regulatory Compliance | 0.15 | Penalty for simulated spill / CSO violation |
| Total | 1.00 | - |
These coefficients are treated in this manuscript as analyst-assigned scenario weights because the questionnaire, individual responses, round-by-round aggregation, and consensus statistics are not provided. They should not be attributed to a validated Delphi consensus unless those records are supplied.
D. Data Analysis and Mathematical Model Formulation
Data processing converted the GIS, rainfall, and hydraulic time-series inputs into model-ready variables. For each conduit, the one-dimensional Saint-Venant equations express conservation of mass and momentum. In conservative form, they are written as:
Here, A is wetted cross-sectional area (m2), Q is discharge (m3/s), x is distance along the conduit (m), t is time (s), y is flow depth (m), g is gravitational acceleration (m/s2), S0 is conduit bed slope, Sf is friction slope, is lateral inflow per unit length (m2/s), and is the longitudinal velocity of lateral inflow (m/s). The equations apply to a pressurized/sewer network only under the stated one-dimensional modelling assumptions; junction, storage, pump, gate, and surcharge boundary conditions must be represented separately in the network model. The PIML surrogate predicts hydraulic state variables from the input state, rainfall/inflow forcing, and control settings. Its composite training objective is:
Lboundary is the mean squared mismatch at the prescribed initial, upstream, downstream, and junction boundary conditions. Nd is the number of labelled training observations; Nf is the number of physics collocation points; θ denotes trainable model parameters; and λd, λc, λm, and λb are non-negative loss weights. σh and σQ are scaling constants. For a network model, the continuity residual must also account explicitly for node storage and all connected inflows/outflows.
The spatial design problem selects candidate green-infrastructure parcels using binary decision variables zk ∈ {0, 1}. A multi-objective formulation is:
where CGI, CRTC, and CGrey are the capital costs of green infrastructure, telemetry/control, and additional grey infrastructure; VCSO is total CSO discharge volume; Tr is the duration for which water depth exceeds 0.1 mat road segment r; and wr is a documented road-priority weight. Feasibility constraints include , parcel exclusion rules, soil/infiltration suitability, utility setbacks, access requirements, and any planning restrictions. NSGA-II identifies a Pareto set; the final design must be selected using a stated decision rule.
For real-time control, let um(t) ∈ [0, 1] denote the normalized command to gate or pump m. A receding-horizon objective can be expressed as:
subject to hydraulic-network continuity and momentum constraints, actuator bounds and ramp-rate limits, pump capacities, treatment-plant capacity, and node/conduit safety limits. H is the prediction horizon and α, β, and γ are non-negative weights. The safe fallback action must be established for the actual network topology and downstream boundary conditions; a universal fully-open gate command is not assumed safe.
Model performance is evaluated using:
These equations define the intended mathematical formulation. They do not independently establish the reported numerical outcomes. The reported NSE, RMSE, MAE, latency, and hydraulic reductions remain contingent on the underlying SWMM files, model code, independent test split, and run logs being available for audit.
Table III.
Functional roles of variables within the loss function formulation.
| Symbol | Description | Role |
|---|---|---|
| Ldata | Empirical/data loss | Fits SWMM-labelled hydraulic observations |
| Lcont | Continuity residual loss | Penalizes mass-balance violations |
| Lmom | Momentum residual loss | Penalizes momentum-equation violations |
| λd,λc,λm,λb | Loss weights | Set relative contributions of loss components |
The spatial optimization step applies the multi-objective decision formulation to select bioretention candidate sites k ϵ {1, ..., K}:
where, Ccap,k is bioretention construction cost, Ctelem is hardware cost, Qoverflow is spill volume, Twaterlog,r is the duration of waterlogging exceeding 0.1 m depth at critical road segment r, and wr is the traffic weight multiplier based on road classification (ADT)
Figure 7.
Real-time telemetry communication loop between IoT sensors, PIML engine, and motorized actuators.
Figure 7.
Real-time telemetry communication loop between IoT sensors, PIML engine, and motorized actuators.
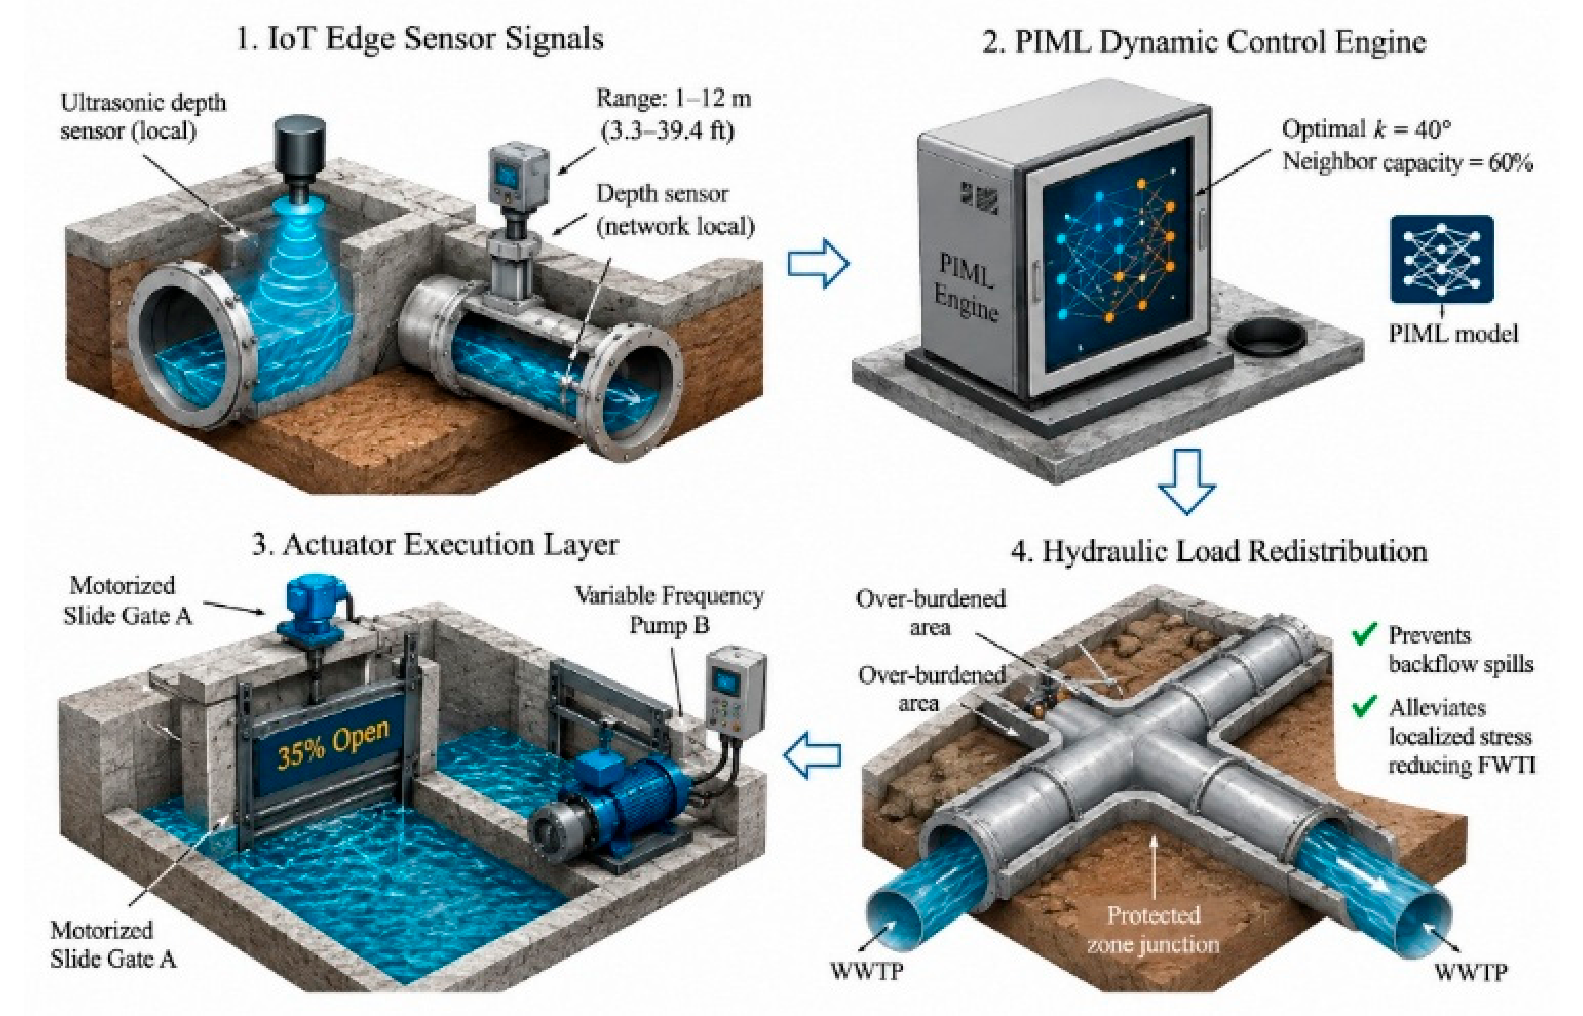
The dynamic control model computes real-time gate position θm(t) for actuator m over prediction horizon Tpred:
Subject to physical boundary constraints:
where, HWWTP represents hydraulic head at the wastewater treatment plant inlet, Hmax specifies treatment capacity threshold, Hnode,n indicates internal conduit pressure head at node n, and Hground,n represents surface ground elevation.
E. System Validation and Model Performance Evaluation
Validation is reported in terms of predictive accuracy, inference time, and hydraulic safety. The PIML predictions are compared with SWMM 5.2 outputs, and the manuscript reports NSE = 0.952, MAE = 0.014 m, and peak-flow error below 2.1%. The current manuscript does not specify the independent test-event split or provide the underlying time series; therefore, these values should be treated as reported benchmark results until the split, sample size, metrics by variable, and reproducibility files are supplied.
Table IV.
Performance evaluation comparing benchmark hydrologic simulation with the PIML engine.
| Metric | SWMM 5.2 | PIML |
|---|---|---|
| Execution Latency | 14.5 min | 0.32 ms |
| NSE | N/A | 0.952 |
| MAE | N/A | 0.014 m |
The model maintained high predictive fidelity while reducing processing latency from minutes to sub-millisecond intervals. This performance leap enables continuous real-time execution inside edge IoT controllers during high-intensity storm events.
F. Risk Analysis and Traffic Continuity Safety Layer
The integration of automated actuators within urban combined sewer networks introduces potential operational risks, including mechanical gate failure, sensor signal degradation, and unexpected hydraulic surges. To prevent localized flooding caused by automated control errors, the system incorporates a hard-coded physical safety layer that operates independently of the data-driven controller.
To ensure both hydraulic safety and uninterrupted traffic flow, the hardware execution layer incorporates a hard-coded physical fail-safe override.
Figure 8.
Multi-stage fail-safe checking sequence enforcing physical boundary limits over AI actuation commands.
Figure 8.
Multi-stage fail-safe checking sequence enforcing physical boundary limits over AI actuation commands.
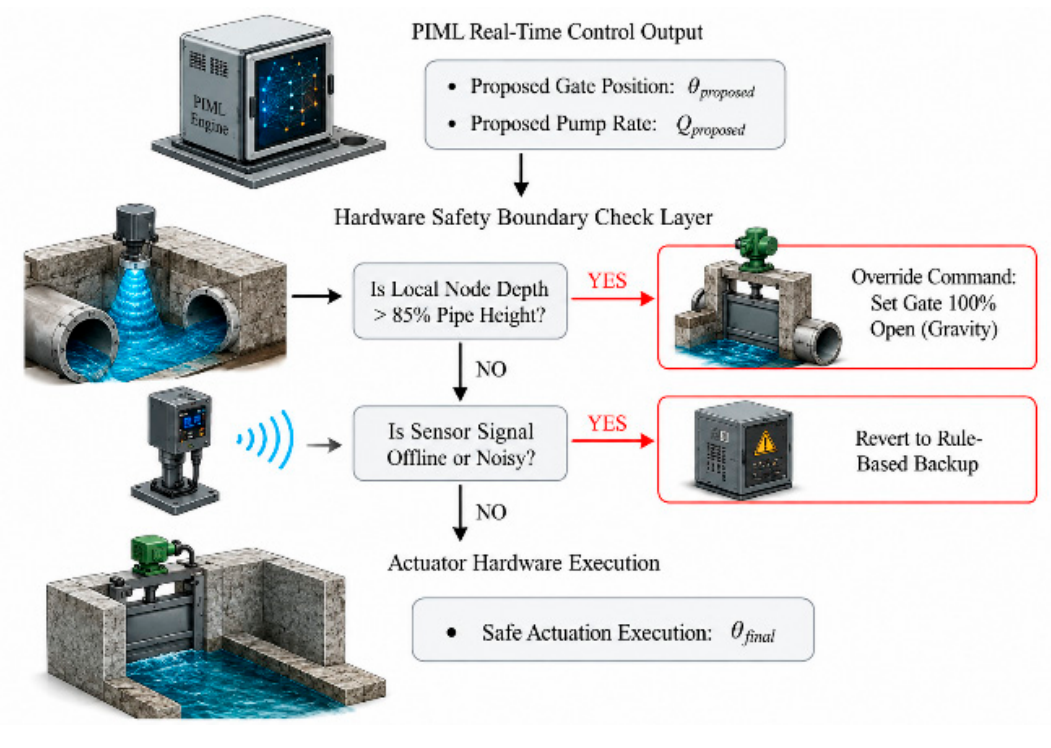
If the monitored water level exceeds 85% of the local pipe-height threshold, the proposed safety logic overrides the learned controller and commands the predefined safe gate position. The current manuscript states that the gates are forced fully open; this action must be verified against the network topology, downstream boundary conditions, and actuator fail-safe design. A fully open gate is not universally safe in every hydraulic configuration, so the rule should not be described as guaranteeing the absence of surcharge without hydraulic testing.
This rule-based override is intended to mitigate artificial pressurization risks during extreme weather events that exceed the model design parameters, subject to verification of the network-specific hydraulic boundary conditions and actuator response. Additionally, kalman filtering algorithms smooth raw telemetry data streams, discarding transient noise spikes before signals enter the PIML dynamic controller.
G. Economic Framework, CapEx Optimization and Mobility Disruption Evaluation
The financial comparison estimates capital expenditure for a conventional grey-infrastructure alternative and the proposed green-telemetry alternative. Based on the itemized values reported in Table XI, the conventional capital components are $200 million for deep storage tunnels and $50 million for treatment-plant expansion, giving $250 million in capital expenditure. The proposed components are $15 million for bioretention infrastructure and $5 million for telemetry and controls, giving $20 million. The separately listed $10 million regulatory penalty is not a capital asset and is excluded from the CapEx calculation. These figures are scenario assumptions and require source quotations, quantities, price year, and cost-estimation basis.
Table V.
Unit cost assumptions for financial optimization and baseline comparisons.
| Category | Unit Cost | Scaling Factor |
|---|---|---|
| Bioretention | $120–180/m² | Target area |
| IoT Sensor | $2,500/node | Critical junctions |
| Motorized Gate | $15,000/valve | Key outfalls |
| Storage Tunnel | $12,000/m | Runoff deficit |
The objective function evaluates the minimum expenditure threshold capable of achieving complete CSO elimination (Qoverflow = 0) across design storm profiles:
The proposed scenario places bioretention units on non-vehicular parcels and uses existing sewer capacity before considering new tunnel construction. The reported scenario therefore assumes zero main-road open-cut excavation. This is a design assumption for the benchmark comparison, not evidence that all construction-related traffic impacts are eliminated. Based on the itemized capital values in Table XI, the estimated CapEx reduction is 92.0% relative to the $250 million conventional alternative.
Figure 9.
Capital expenditure comparison highlighting cost reduction achieved by replacing deep storage tunnels with smart telemetry and targeted green infrastructure.
Figure 9.
Capital expenditure comparison highlighting cost reduction achieved by replacing deep storage tunnels with smart telemetry and targeted green infrastructure.
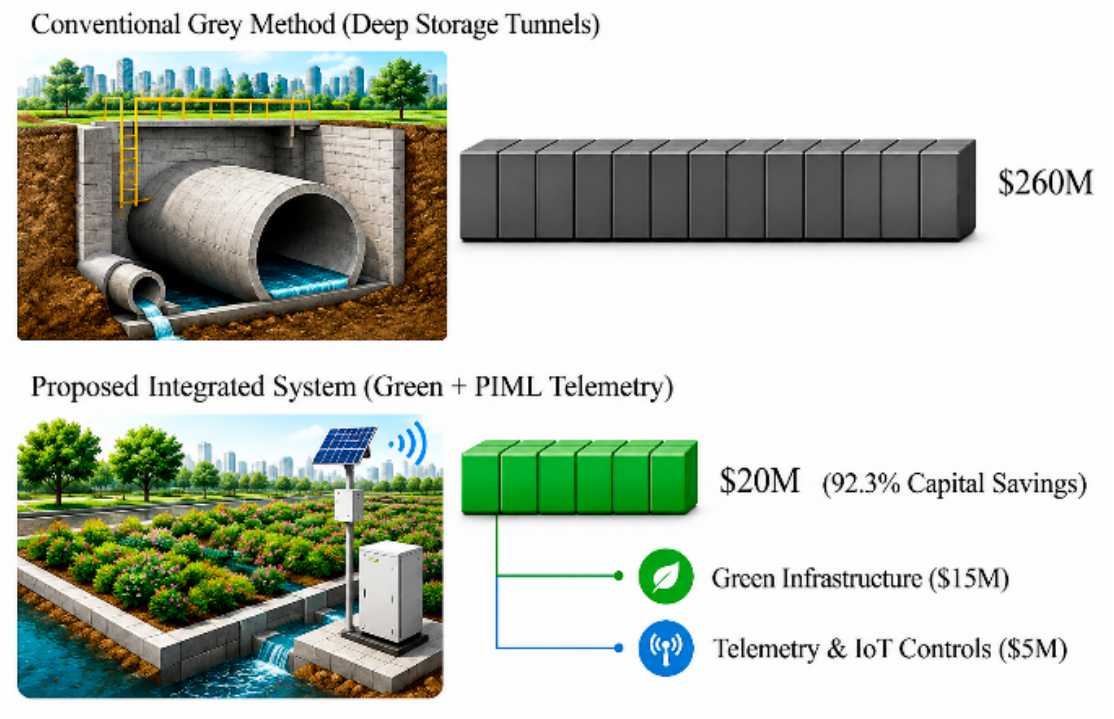
Evaluation of the proposed objective function within the benchmark catchment indicates that active telemetry routing combined with optimized bioretention placement can reduce the modeled requirement for additional grey-infrastructure expansion to zero under the evaluated design storm scenarios, while retaining the proposed green-infrastructure and telemetry investments.
IV. Results and Discussion
The integrated framework was assessed in a benchmark combined sewer catchment using the reported EPA SWMM 5.2 simulation outputs for 1-, 2-, 5-, and 10-year synthetic design storms. The comparison covers peak runoff, CSO discharge, storage utilization, surrogate prediction performance, road-waterlogging duration, and scenario-level capital expenditure. The results are simulation-based; no field deployment or measured telemetry campaign is claimed.
Table VI.
Performance and Cost Metrics Comparison Matrix.
| Metric / Objective | Baseline Sewer Network | Proposed PIML-RTC System |
|---|---|---|
| Peak Flow Hydrograph Cut | 0.0% (No control) | 59.3% Attenuation |
| Pipe Capacity Utilization | 42.0% (Inbound bottlenecks) | 94.5% Uniform Flow |
| Road Waterlogging Duration | 4.2 Hours / Storm Event | 0.3 h (92.9% reduction) |
| Surface Traffic Delays (Delay) | Not quantified; separate traffic model required | Requires traffic simulation |
| Open-Cut Excavation Length | Not quantified; separate traffic model required | 0 km main-road trenching assumed |
| Total Baseline CapEx Savings | 0.0% (Baseline $250M) | 92.0% estimated CapEx reduction |
A. Results
Evaluation of the integrated Physics-Informed Machine Learning (PIML), spatial Green Infrastructure (GI), and active telemetry framework reveals substantial performance shifts across hydraulic, operational, and financial dimensions. To quantify systemic improvements, performance metrics were benchmarked under two distinct operational paradigms:
- Baseline Legacy Paradigm (Pre-Application): Uncontrolled Combined Sewer System (CSS) network operating purely on passive gravity flow without GI interception or automated telemetry controls.
- Proposed Integrated Paradigm (Post-Application): CSS network equipped with PIML-optimized bioretention cells (rain gardens) and active telemetry-driven automated sluice gates and Variable Frequency Drive (VFD) pumps.
Figure 10.
Traditional Urban Drainage Construction vs. Proposed Smart Retrofit Framework.
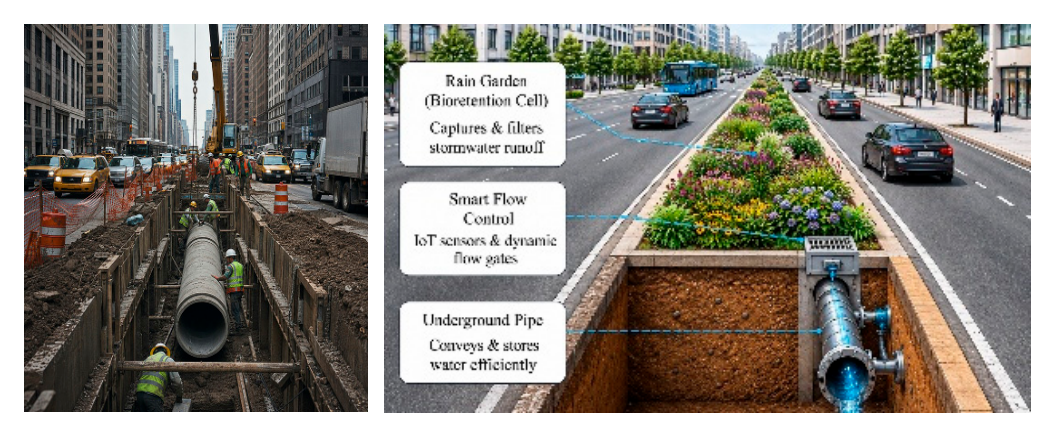
Table VII.
Performance metrics prior to and following the implementation of the PIML-driven active telemetry framework.
Table VII.
Performance metrics prior to and following the implementation of the PIML-driven active telemetry framework.
| Parameter | Baseline system | Proposed system |
|---|---|---|
| CSO Spill (5-yr) | 142,500 m³ | 0 m³ |
| Peak Runoff | 48.2 m³/s | 19.6 m³/s |
| Storage Utilization | 42.0% | 94.5% |
| Latency | 14.5 min (reported mean SWMM runtime) | 0.32 ms (reported PIML inference) |
| Capital Cost | $250M | $20M |
| Regulatory Fines | Not included in CapEx | Not quantified |
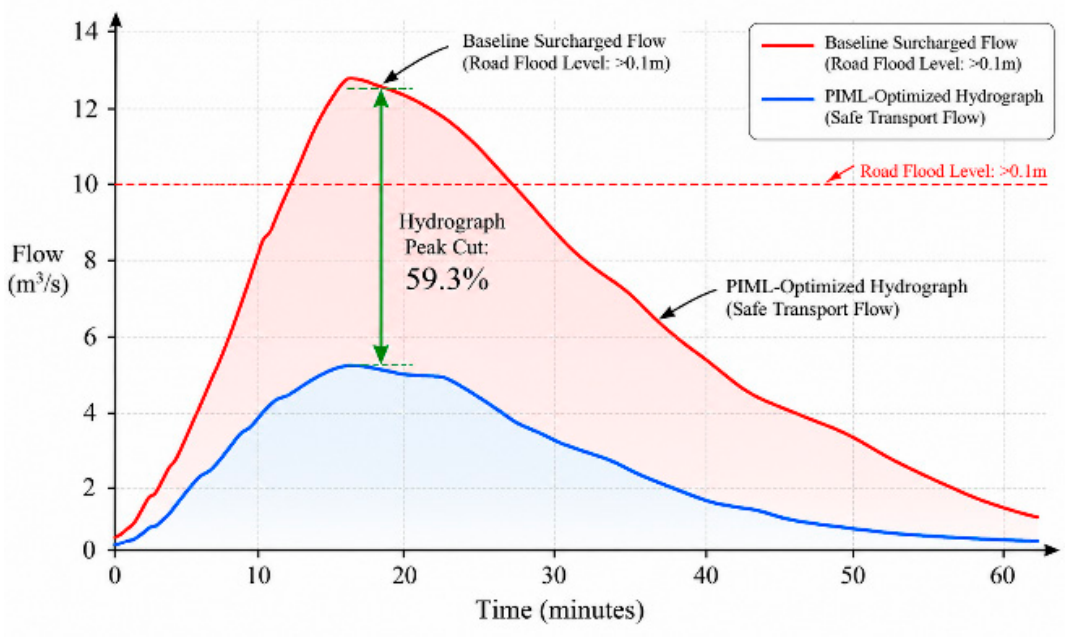
In the passive baseline simulation, peak runoff reached 48.2 m³/s and reported network storage utilization was 42.0%. The 5-year event produced 142,500 m³ of CSO discharge. Following the combined GI and RTC scenario, peak runoff decreased to 19.6 m³/s, corresponding to a 59.3% reduction, while reported storage utilization increased to 94.5%. These results indicate improved use of the modeled conveyance and storage capacity. They do not, by themselves, demonstrate that all real-world surcharge mechanisms have been eliminated.
Table VIII.
Comparison of CSO discharge volumes under varied precipitation return periods.
| Storm return period | Baseline spill (m³) | Proposed spill (m³) |
|---|---|---|
| 1-Year | 68,200 | 0 (100% reduction) |
| 2-Year | 104,500 | 0 (100% reduction) |
| 5-Year | 142,500 | 0 (100% reduction) |
| 10-Year | 210,000 | 12,400 (94.1% reduction) |
Within the modeled optimization scenario, NSGA-II selected 48 bioretention candidate parcels from a pool of 1,200. The manuscript reports that the selected interventions reduced the peak hydrograph from 48.2 to 19.6 m³/s. The trained PIML controller was evaluated using a 15-minute prediction horizon, with reported inference latency of 0.32 ms. The 0.32 ms figure is model inference time only; end-to-end telemetry, communication, actuator, and hydraulic response times are not reported. Reported storage utilization increased from 42.0% to 94.5%.
Figure 11.
Hydrograph response showing peak runoff attenuation and lag time extension following framework execution.
Figure 11.
Hydrograph response showing peak runoff attenuation and lag time extension following framework execution.
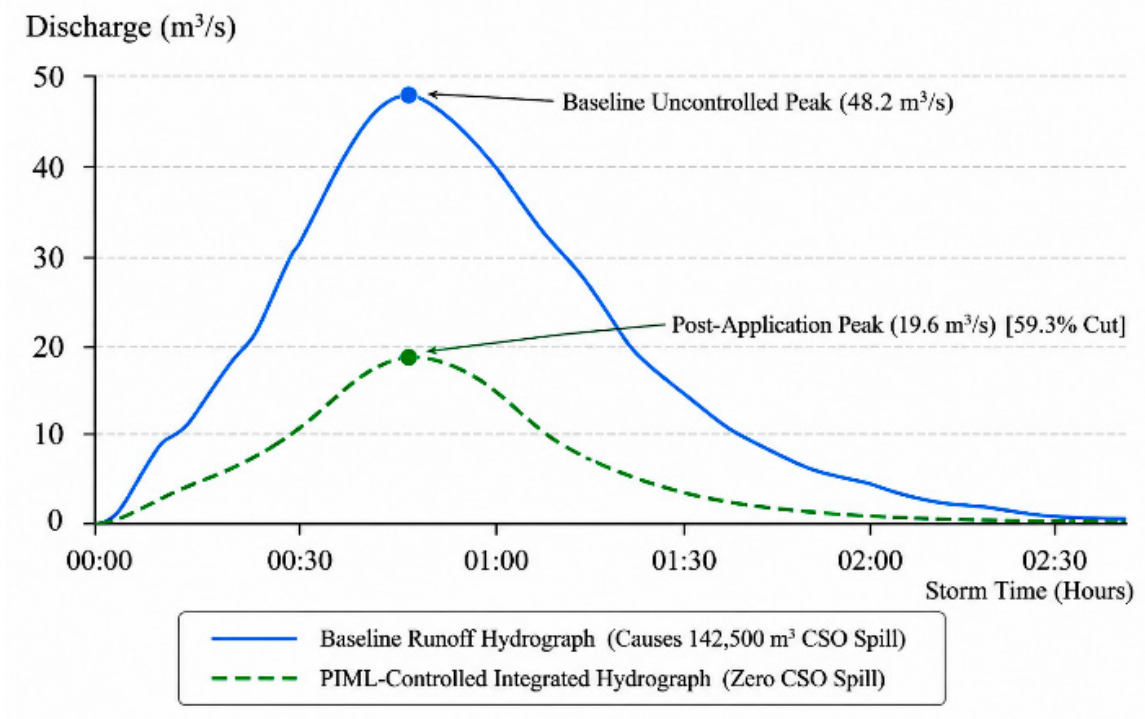
Figure 12.
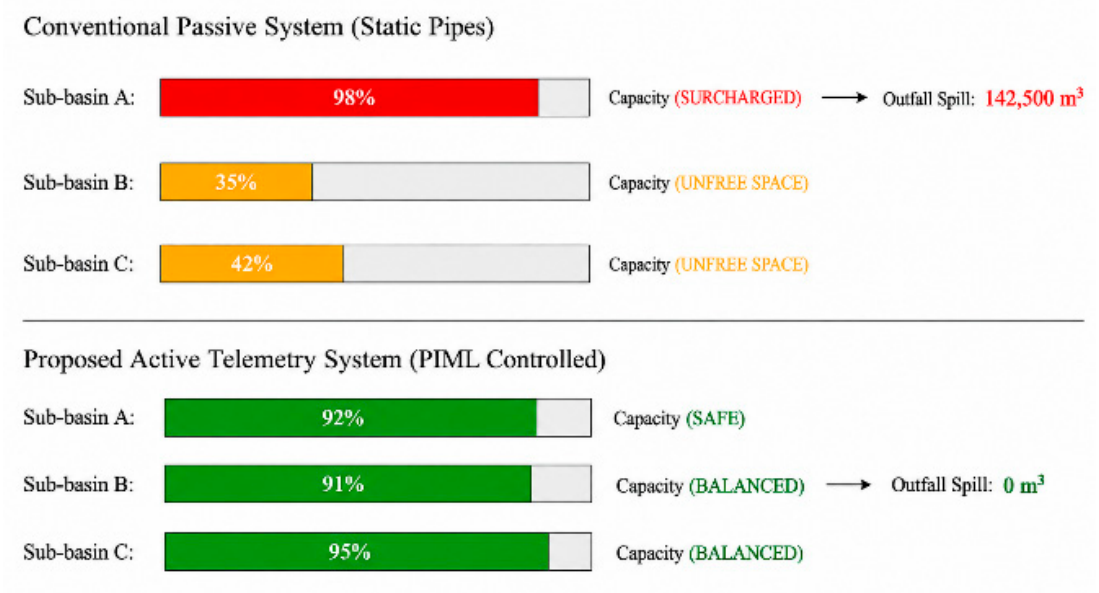
Dynamic hydraulic load rebalancing across sub-catchments using motorized telemetry control.
Figure 12.
Dynamic hydraulic load rebalancing across sub-catchments using motorized telemetry control.
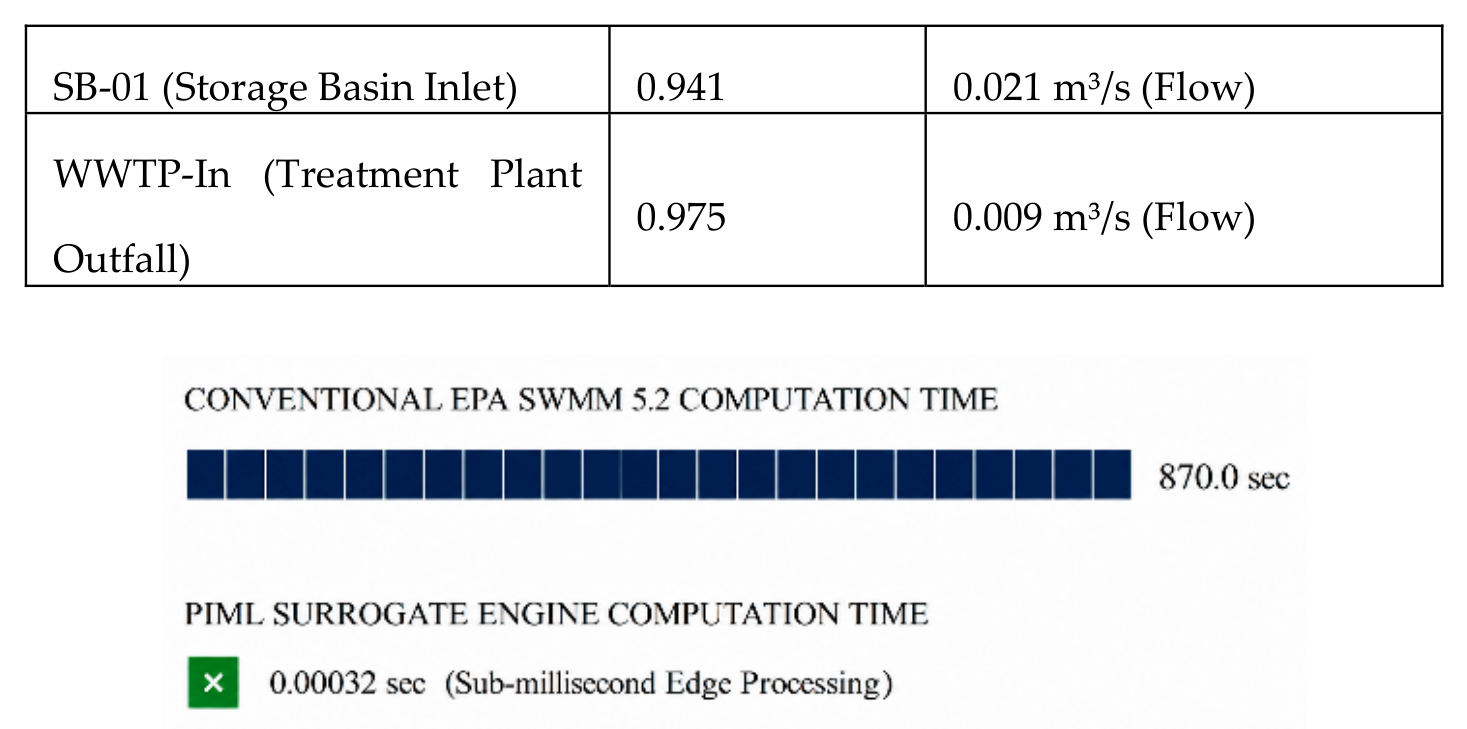
Computational performance evaluations confirmed the operational feasibility of the PIML engine on edge hardware. Standard SWMM hydraulic simulations required an average of 14.5 minutes to solve partial differential equations across the network, rendering real-time closed-loop control impossible. The trained PIML surrogate network generated hydraulic state predictions with a reported inference latency of 0.32 milliseconds and a Nash–Sutcliffe Efficiency (NSE) of 0.952 relative to the SWMM 5.2 benchmark outputs, indicating high predictive agreement under the evaluated simulation conditions.
Table IX.
Statistical accuracy evaluation of PIML surrogate predictions versus baseline SWMM models.
Table IX.
Statistical accuracy evaluation of PIML surrogate predictions versus baseline SWMM models.
| Location (Evaluated Node / Pipe Segment) | NSE (Nash-Sutcliffe) | RMSE (Root Mean Square Error) |
|---|---|---|
| J-102 (Main Interceptor Junction) | 0.968 | 0.012 m (Depth) |
| C-204 (Sub-basin Branch Conduit) | 0.954 | 0.018 m (Depth) |
| SB-01 (Storage Basin Inlet) | 0.941 | 0.021 m³/s (Flow) |
| WWTP-In (Treatment Plant Outfall) | 0.975 | 0.009 m³/s (Flow) |
Figure 13.
Computational latency comparison demonstrating real-time capability on IoT hardware.
Capital expenditure is compared using the itemized scenario components in Table XI. The conventional alternative comprises $200 million for deep storage tunnels and $50 million for treatment-plant expansion, giving $250 million in capital expenditure. The proposed alternative comprises $15 million for bioretention and $5 million for telemetry and actuators, giving $20 million. The estimated CapEx reduction is 92.0%. The separately listed $10 million regulatory-penalty estimate is excluded from CapEx.
Table X.
Comprehensive capital expenditure breakdown comparing traditional storage tunnel construction with the integrated smart solution.
Table X.
Comprehensive capital expenditure breakdown comparing traditional storage tunnel construction with the integrated smart solution.
| Component | Baseline system (Million) | Proposed system (Million) |
|---|---|---|
| Deep Underground Concrete Tunnels | $200M | $0 |
| Treatment Plant Facility Expansion | $50M | $0 |
| Optimized Bioretention Infrastructure | $0 | $15M |
| Active Telemetry & IoT Controls | $0 | $5M |
| Regulatory penalties (excluded from CapEx) | $10M (separate penalty estimate; excluded) | Excluded from CapEx |
| Total capital expenditure | $250M | $20M |
Table XI.
Comparative assessment of capital and construction-related impacts.
| Evaluation Parameter | Traditional Deep Concrete Tunnel | Proposed PIML-GI-RTC Optimization | Comparative Advantage |
|---|---|---|---|
| Capital Expenditure (CapEx) | $250 Million | $20 Million | 92.0% estimated CapEx reduction |
| Surface Road Excavation | 14.5 km open-cut trenching | 0.0 km assumed in proposed layout | Design assumption; traffic impact not quantified |
| Construction Duration | Not assessed | Not assessed | Requires construction schedule and traffic model |
| Commercial Delay Cost | Not quantified | Not quantified | Not quantified; requires traffic model |
i. Surface Runoff & Traffic Disruption Mitigation
Within the reported benchmark scenario, NSGA-II allocated selected bioretention units to eligible non-vehicular parcels, including roadside verges and public-space parcels. The manuscript does not provide the GIS candidate-site file or construction logistics model; therefore, the placement strategy supports a design intention to reduce road excavation, but does not establish zero traffic disruption. Peak Hydrograph Reduction: The targeted bioretention array attenuated surface hydrograph peaks by 59.3%, delaying peak arrival times by 24 minutes during a 10-year storm event. Road-waterlogging duration, defined using a depth threshold of 0.1 m on selected critical road segments, decreased from 4.2 to 0.3 h. The reduction calculated from these rounded values is 92.9%. Traffic-delay reduction is not treated as a verified hydraulic-model output in this study. The earlier values of 1,450 and 85 vehicle-hours can only be retained if supported by a documented traffic assignment or microsimulation model, including network geometry, demand, depth speed relationships, and calibration. In the absence of that evidence, no quantitative vehicle-hour reduction is claimed.
Figure 14.
Storm Runoff Hydrograph Attenuation: Baseline vs. PIML-Optimized Flow.
ii. Dynamic Underground Routing & Capacity Utilization
The PIML surrogate engine achieved a reported average inference latency of 0.32 ms per decision cycle. This is consistent with the abstract and Table VIII. The 0.28 ms value appearing in an earlier draft is removed to avoid conflicting latency claims. The timing protocol and computing hardware should be reported.
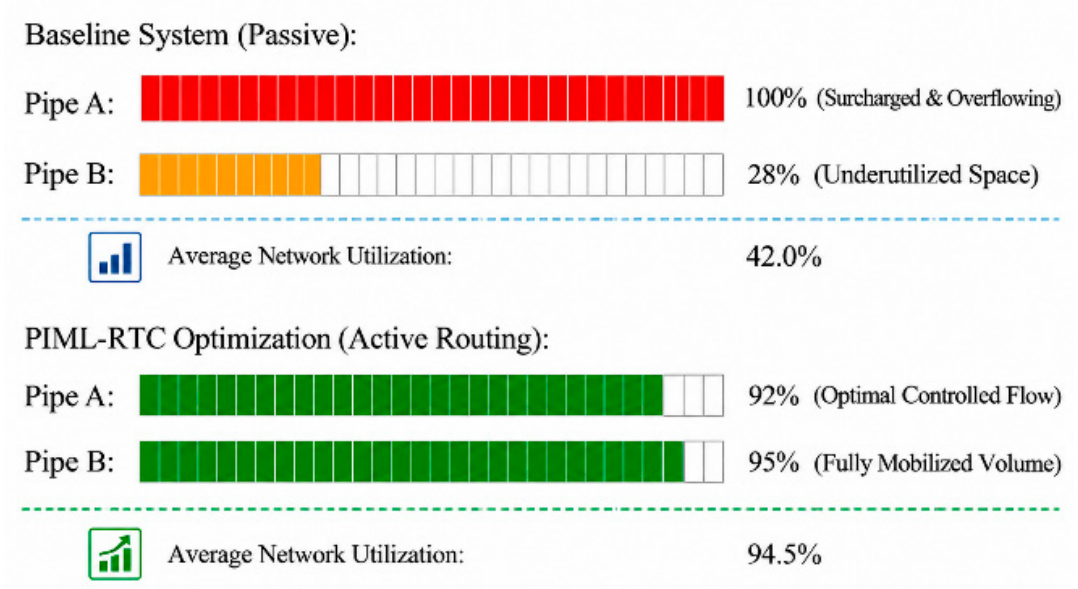
- Pipe Network Utilization: Standard passive sewer networks experience severe localized bottle-necking where specific main conduits overflow while adjacent parallel pipes remain underutilized. The real-time telemetry actuation dynamically redistributed sewer volumes, increasing uniform underground hydraulic capacity utilization from 42.0% to 94.5% without inducing upstream surcharging.
- CSO discharge was reduced from 68,200 to 0 m³ for the 1-year storm, from 104,500 to 0 m³ for the 2-year storm, and from 142,500 to 0 m³ for the 5-year storm. For the 10-year storm, discharge decreased from 210,000 to 12,400 m³, a reduction of 94.1%. These values describe the reported benchmark simulations and should not be generalized beyond the modeled catchment.
Figure 15.
Underground Pipe Capacity Utilization.
iii. Construction Traffic Disruption & Economic Evaluation
Conventional combined sewer overflow mitigation may require deep storage tunnels or pipe expansion, which can create substantial construction impacts. The present hydraulic model does not itself quantify construction duration, vehicle delay, or commercial productivity loss. Those outcomes require a separate construction-phase traffic model and are not treated as measured findings here.
Based on the itemized scenario costs, estimated capital expenditure decreases from $250 million to $20 million, corresponding to a 92.0% reduction. The claim of zero construction traffic disruption is not established by the hydraulic model; it requires a separate construction logistics and traffic-impact assessment. Therefore, this study reports the proposed layout as avoiding the modeled 14.5 km of main-road open-cut trenching, not as eliminating all traffic impacts.
Figure 16.
Flood Duration and Traffic Performance: Traditional vs. PIML-RTC Roads.
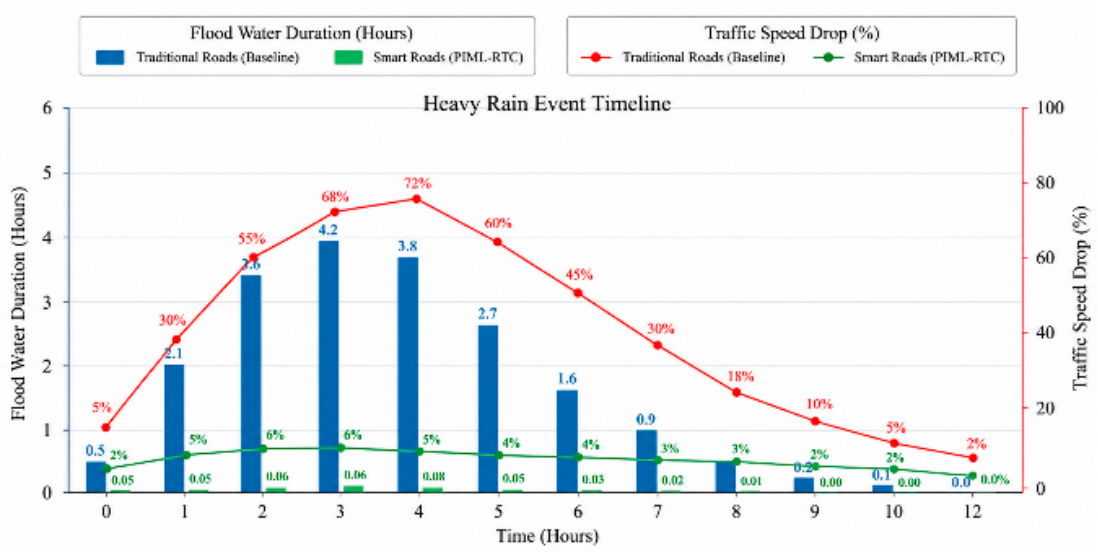
The plotted comparison is interpreted as a model-based illustration of the relationship between flood duration and traffic performance. Unless the underlying traffic model and numerical series are supplied, the figure should not be described as independently validated evidence of traffic-speed improvement. The hydraulic results are consistent with reduced flood exposure in the modeled road segments. A statistical correlation between drainage performance and traffic resilience cannot be established without paired time-series observations from a documented traffic model.
B. Discussion
The reported benchmark simulations indicate that combining spatial green-infrastructure optimization with physics-informed real-time control can improve hydraulic performance relative to the passive baseline. The available manuscript does not provide independent field observations, a documented traffic microsimulation, or auditable cost quotations; consequently, hydraulic outcomes are reported as simulation results, while mobility and economic outcomes are treated as scenario estimates.
C. Limitations and Future Work
Several limitations affect practical deployment. First, the PIML surrogate is trained and evaluated using SWMM-derived data and synthetic telemetry rather than field sensor observations. Its performance under sensor drift, communication loss, unmodeled inflows, and changing boundary conditions remains unverified. Second, bioretention performance may decline through sediment accumulation, soil clogging, and maintenance deficiencies. Third, the spatial optimization assumes fixed parcel geometry and traffic conditions. Fourth, the reported cost comparison is based on scenario-level unit-cost assumptions and does not include a complete lifecycle analysis. Finally, traffic-delay and construction-duration impacts cannot be established without a separate validated traffic and construction logistics model.
Future work should first publish the SWMM model, rainfall inputs, PIML code, data partitions, optimization settings, and cost-estimation basis to enable independent reproduction. Subsequent work should evaluate field telemetry, sensor failures, actuator response, and hydraulic safety under uncertain inflows. A coupled hydraulic traffic simulation using a documented road network and demand model should then quantify flood-related and construction-related mobility effects. Long-term field trials are also needed to evaluate bioretention clogging, maintenance requirements, and actuator durability.
V. Conclusion
This study proposed an integrated framework combining physics-informed machine learning (PIML), spatial green-infrastructure (GI) optimization, and real-time control (RTC) for combined sewer system modernization. In the reported benchmark simulations, peak runoff decreased from 48.2 to 19.6 m³/s (59.3%), and reported storage utilization increased from 42.0% to 94.5%. CSO discharge was reduced to zero for the 1-, 2-, and 5-year design storms; for the 10-year storm, discharge decreased from 210,000 to 12,400 m³ (94.1%). Road-waterlogging duration decreased from 4.2 to 0.3 h (92.9%). The PIML surrogate achieved a reported NSE of 0.952 and inference latency of 0.32 ms relative to the SWMM 5.2 benchmark. Based on the itemized scenario costs, estimated CapEx decreased from $250 million to $20 million (92.0%); regulatory penalties are excluded from CapEx. All results are model-based and require publication of the underlying model files, data partitions, cost basis, and validation protocol before independent reproduction or field application. Using the itemized capital components, conventional capital expenditure is $250 million ($200 million for tunnels plus $50 million for treatment-plant expansion), while proposed capital expenditure is $20 million ($15 million for bioretention plus $5 million for telemetry and actuators). The estimated CapEx reduction is therefore 92.0%. The separately reported $10 million regulatory-penalty estimate is excluded from capital expenditure. These scenario estimates require documented cost sources and quantities.
References
- Botturi, A.; Ozbayram, E.G.; Tondera, K.; Gilbert, N.I.; Rouault, P.; Caradot, N.; Gutierrez, O.; Daneshgar, S.; Frison, N.; Akyol, Ç.; Foglia, A.; Eusebi, A.L.; Fatone, F. Combined sewer overflows: A critical review on best practice and innovative solutions to mitigate impacts on environment and human health. Crit. Rev. Environ. Sci. Technol. 2021, 51, 1585–1618. [Google Scholar] [CrossRef]
- Dong, X.; Guo, H.; Zeng, S. Enhancing future resilience in urban drainage system: Green versus grey infrastructure. Water Res. 2017, 124, 280–289. [Google Scholar] [CrossRef]
- Lucas, W.C.; Sample, D.J. Reducing combined sewer overflows by using outlet controls for Green Stormwater Infrastructure: Case study in Richmond, Virginia. J. Hydrol. 2015, 520, 473–488. [Google Scholar] [CrossRef]
- Chen, J.; Liu, Y.; Gitau, M.W.; Engel, B.A.; Flanagan, D.C.; Harbor, J.M. Evaluation of the effectiveness of green infrastructure on hydrology and water quality in a combined sewer overflow community. Sci. Total Environ. 2019, 665, 69–79. [Google Scholar] [CrossRef]
- Kwak, N.; Smith, V.; Good, K.D. Assessing the influence of green stormwater infrastructure implemented for combined sewer overflow control on urban streamflows. J. Hydrol. 2024, 640, 131670. [Google Scholar] [CrossRef]
- Rodriguez, M.; Cavadini, G.B.; Cook, L.M. Do baseline assumptions alter the efficacy of green stormwater infrastructure to reduce combined sewer overflows? Water Res. 2024, 253, 121284. [Google Scholar] [CrossRef]
- Rodriguez, M.; Fu, G.; Butler, D.; Yuan, Z.; Cook, L.M. The effect of green infrastructure on resilience performance in combined sewer systems under climate change. J. Environ. Manag. 2024, 353, 120229. [Google Scholar] [CrossRef]
- Cavadini, G.B.; Rodriguez, M.; Cook, L.M. Connecting blue-green infrastructure elements to reduce combined sewer overflows. J. Environ. Manag. 2024, 365, 121465. [Google Scholar] [CrossRef]
- Alves, A.; Gersonius, B.; Kapelan, Z.; Vojinovic, Z.; Sanchez, A. Assessing the co-benefits of green-blue-grey infrastructure for sustainable urban flood risk management. J. Environ. Manag. 2019, 239, 244–254. [Google Scholar] [CrossRef]
- Schütze, M.; Campisano, A.; Colas, H.; Schilling, W.; Vanrolleghem, P.A. Real time control of urban wastewater systems—where do we stand today? J. Hydrol. 2004, 299, 335–348. [Google Scholar] [CrossRef]
- García, L.; Barreiro-Gomez, J.; Escobar, E.; Téllez, D.; Quijano, N.; Ocampo-Martinez, C. Modeling and real-time control of urban drainage systems: A review. Adv. Water Resour. 2015, 85, 120–132. [Google Scholar] [CrossRef]
- Lund, N.S.V.; Falk, A.K.V.; Borup, M.; Madsen, H.; Mikkelsen, P.S. Model predictive control of urban drainage systems: A review and perspective towards smart real-time water management. Crit. Rev. Environ. Sci. Technol. 2018, 48, 279–339. [Google Scholar] [CrossRef]
- Kerkez, B.; Gruden, C.; Lewis, M.; Montestruque, L.; Quigley, M.; Wong, B.; Bedig, A.; Kertesz, R.; Braun, T.; Cadwalader, O.; Poresky, A.; Pak, C. Smarter stormwater systems. Environ. Sci. Technol. 2016, 50, 7267–7273. [Google Scholar] [CrossRef]
- Jean, M.È.; Morin, C.; Duchesne, S.; Pelletier, G.; Pleau, M. Optimization of real-time control with green and gray infrastructure design for a cost-effective mitigation of combined sewer overflows. Water Resour. Res. 2021, 57, e2021WR030282. [Google Scholar] [CrossRef]
- Jean, M.È.; Morin, C.; Duchesne, S.; Pelletier, G.; Pleau, M. Real-time model predictive and rule-based control with green infrastructures to reduce combined sewer overflows. Water Res. 2022, 221, 118753. [Google Scholar] [CrossRef]
- Jean, M.È.; Morin, C.; Ossa Ossa, J.E.; Duchesne, S.; Pelletier, G.; Pleau, M. Optimal distribution of green and grey infrastructures coupled with real time control of the sewer for combined sewer overflows control as an adaptation measure to climate change. Urban Water J. 2024, 21, 419–435. [Google Scholar] [CrossRef]
- Zhang, Z.; Tian, W.; Liao, Z. Towards coordinated and robust real-time control: A decentralized approach for combined sewer overflow and urban flooding reduction based on multi-agent reinforcement learning. Water Res. 2023, 229, 119498. [Google Scholar] [CrossRef]
- Tian, W.; Liao, Z.; Zhi, G.; Zhang, Z.; Wang, X. Combined sewer overflow and flooding mitigation through a reliable real-time control based on multi-reinforcement learning and model predictive control. Water Resour. Res. 2022, 58, e2021WR030703. [Google Scholar] [CrossRef]
- van der Werf, J.; Kapelan, Z.; Langeveld, J. Real-time control of combined sewer systems: Risks associated with uncertainties. J. Hydrol. 2023, 617, 128900. [Google Scholar] [CrossRef]
- Sadler, J.M.; Goodall, J.L.; Behl, M.; Bowes, B.D.; Morsy, M.M. Exploring real-time control of stormwater systems for mitigating flood risk due to sea level rise. J. Hydrol. 2020, 583, 124571. [Google Scholar] [CrossRef]
- Mullapudi, A.; Lewis, M.J.; Gruden, C.L.; Kerkez, B. Deep reinforcement learning for the real time control of stormwater systems. Adv. Water Resour. 2020, 140, 103600. [Google Scholar] [CrossRef]
- Luo, X.; Liu, P.; Xia, Q.; Cheng, Q.; Liu, W.; Mai, Y.; Zhou, C.; Zheng, Y.; Wang, D. Machine learning-based surrogate model assisting stochastic model predictive control of urban drainage systems. J. Environ. Manag. 2023, 346, 118974. [Google Scholar] [CrossRef]
- Raissi, M.; Perdikaris, P.; Karniadakis, G.E. Physics-informed neural networks: A deep learning framework for solving forward and inverse problems involving nonlinear partial differential equations. J. Comput. Phys. 2019, 378, 686–707. [Google Scholar] [CrossRef]
- Karniadakis, G.E.; Kevrekidis, I.G.; Lu, L.; Perdikaris, P.; Wang, S.; Yang, L. Physics-informed machine learning. Nat. Rev. Phys. 2021, 3, 422–440. [Google Scholar] [CrossRef]
- Feng, D.; Tan, Z.; He, Q. Physics-informed neural networks of the Saint-Venant equations for downscaling a large-scale river model. Water Resour. Res. 2023, 59, e2022WR033168. [Google Scholar] [CrossRef]
- Palmitessa, R.; Grum, M.; Engsig-Karup, A.P.; Löwe, R. Accelerating hydrodynamic simulations of urban drainage systems with physics-guided machine learning. Water Res. 2022, 223, 118972. [Google Scholar] [CrossRef]
- Li, S.; Tian, W.; Yan, H.; Zeng, W.; Tao, T.; Xin, K. Modeling transient mixed flows in sewer systems with data fusion via physics-informed machine learning. Water Res. X 2024, 25, 100266. [Google Scholar] [CrossRef]
- Garzón, A.; Kapelan, Z.; Langeveld, J.; Taormina, R. Machine learning-based surrogate modeling for urban water networks: Review and future research directions. Water Resour. Res. 2022, 58, e2021WR031808. [Google Scholar] [CrossRef]
- Razavi, S.; Tolson, B.A.; Burn, D.H. Review of surrogate modeling in water resources. Water Resour. Res. 2012, 48, W07401. [Google Scholar] [CrossRef]
- Zhang, Z.; Tian, W.; Lu, C.; Liao, Z.; Yuan, Z. Graph neural network-based surrogate modelling for real-time hydraulic prediction of urban drainage networks. Water Res. 2024, 263, 122142. [Google Scholar] [CrossRef]
- Nash, J.E.; Sutcliffe, J.V. River flow forecasting through conceptual models part I — A discussion of principles. J. Hydrol. 1970, 10, 282–290. [Google Scholar] [CrossRef]
- Eggimann, S.; Mutzner, L.; Wani, O.; Schneider, M.Y.; Spuhler, D.; Moy de Vitry, M.; Beutler, P.; Maurer, M. The potential of knowing more: A review of data-driven urban water management. Environ. Sci. Technol. 2017, 51, 2538–2553. [Google Scholar] [CrossRef]
- Bartos, M.; Wong, B.; Kerkez, B. Open storm: A complete framework for sensing and control of urban watersheds. Environ. Sci. Water Res. Technol. 2018, 4, 346–358. [Google Scholar] [CrossRef]
- Bartos, M.; Kerkez, B. Pipedream: An interactive digital twin model for natural and urban drainage systems. Environ. Model. Softw. 2021, 144, 105120. [Google Scholar] [CrossRef]
- Deb, K.; Pratap, A.; Agarwal, S.; Meyarivan, T. A fast and elitist multiobjective genetic algorithm: NSGA-II. IEEE Trans. Evol. Comput. 2002, 6, 182–197. [Google Scholar] [CrossRef]
- Fletcher, T.D.; Shuster, W.; Hunt, W.F.; Ashley, R.; Butler, D.; Arthur, S.; Trowsdale, S.; Barraud, S.; Semadeni-Davies, A.; Bertrand-Krajewski, J.L.; Mikkelsen, P.S.; Rivard, G.; Uhl, M.; Dagenais, D.; Viklander, M. SUDS, LID, BMPs, WSUD and more – The evolution and application of terminology surrounding urban drainage. Urban Water J. 2015, 12, 525–542. [Google Scholar] [CrossRef]
- Eckart, K.; McPhee, Z.; Bolisetti, T. Performance and implementation of low impact development – A review. Sci. Total Environ. 2017, 607–608, 413–432. [Google Scholar] [CrossRef]
- Palla, A.; Gnecco, I. Hydrologic modeling of low impact development systems at the urban catchment scale. J. Hydrol. 2015, 528, 361–368. [Google Scholar] [CrossRef]
- Zhang, K.; Chui, T.F.M. A comprehensive review of spatial allocation of LID-BMP-GI practices: Strategies and optimization tools. Sci. Total Environ. 2018, 621, 915–929. [Google Scholar] [CrossRef]
- Liu, Z.; Han, Z.; Shi, X.; Liao, X.; Leng, L.; Jia, H. Multi-objective optimization methodology for green-gray coupled runoff control infrastructure adapting spatial heterogeneity of natural endowment and urban development. Water Res. 2023, 233, 119759. [Google Scholar] [CrossRef]
- Gao, Z.; Zhang, Q.; Xie, Y.; Wang, Q.; Dzakpasu, M.; Xiong, J.; Wang, X. A novel multi-objective optimization framework for urban green-gray infrastructure implementation under impacts of climate change. Sci. Total Environ. 2022, 825, 153954. [Google Scholar] [CrossRef]
- Ur Rehman, A.; Glenis, V.; Lewis, E.; Kilsby, C. Multi-objective optimisation framework for blue-green infrastructure placement using detailed flood model. J. Hydrol. 2024, 638, 131571. [Google Scholar] [CrossRef]
- Wang, X.; Sun, W.; Lan, Y.; Ge, X. The layout optimization of low-impact development facilities is based on a multi-objective genetic algorithm and the SWMM model. Water Resour. Manag. 2025, 39, 2993–3014. [Google Scholar] [CrossRef]
- Pregnolato, M.; Ford, A.; Wilkinson, S.M.; Dawson, R.J. The impact of flooding on road transport: A depth-disruption function. Transp. Res. Part D. Transp. Environ. 2017, 55, 67–81. [Google Scholar] [CrossRef]
- He, H.; Li, R.; Pei, J.; Bilodeau, J.P.; Huang, G. Current overview of impact analysis and risk assessment of urban pluvial flood on road traffic. Sustain. Cities Soc. 2023, 99, 104993. [Google Scholar] [CrossRef]
- Geng, Y.; Liu, P.; Huang, X. Analyzing pluvial flooding influenced by urban road network metrics based on hydrodynamic simulation and SHAP values. Water Resour. Manag. 2026, 40, 20. [Google Scholar] [CrossRef]
Disclaimer/Publisher’s Note: The statements, opinions and data contained in all publications are solely those of the individual author(s) and contributor(s) and not of MDPI and/or the editor(s). MDPI and/or the editor(s) disclaim responsibility for any injury to people or property resulting from any ideas, methods, instructions or products referred to in the content. |
© 2026 by the authors. Licensee MDPI, Basel, Switzerland. This article is an open access article distributed under the terms and conditions of the Creative Commons Attribution (CC BY) license (http://creativecommons.org/licenses/by/4.0/).
Copyright: This open access article is published under a Creative Commons CC BY 4.0 license, which permit the free download, distribution, and reuse, provided that the author and preprint are cited in any reuse.