
Submitted:
11 November 2026
Posted:
13 November 2026
You are already at the latest version
Abstract
The scale of ESG reporting is expanding more rapidly than the internal application of such data for management accounting and financial risk assessment, particularly in emerging markets. This study examines the relationship between ESG metrics and corporate financial risk, drawing on balanced panel data from six major Kazakhstani companies for the period 2017–2024. Financial risk is assessed as a multidimensional category through two channels: debt burden (financial leverage) and the ability to generate cash (free cash flow, or FCF, margin). Panel modeling of normalized ESG metrics reveals that these metrics vary in their significance regarding financial risk, with specific connections emerging between individual ESG factors and financial risk. Carbon intensity shows a significant positive correlation with financial leverage, indicating that debt-related risk is closely tied to environmental factors. Employee turnover exhibits a significant negative correlation with the FCF margin – a consistent pattern across both models – underscoring how personnel instability affects a company’s ability to generate cash flows. Meanwhile, the proportion of independent directors shows negative, yet statistically insignificant, coefficients in both models. These findings provide a foundation for risk-oriented ESG analysis, in which the importance of specific metrics is determined by the particular financial risk channel they influence, rather than through their mechanical aggregation into a single, unified index. The study broadens the analytical scope of managerial accounting, demonstrating that ESG data can be transformed from mere reporting information into a tool for the differentiated assessment of corporate risks. The results point to an association – rather than a direct causal relationship – between ESG factors and financial risk. These findings pave the way for the further evolution of ESG analytics, shifting from generalized assessments toward empirically grounded models. This approach makes it possible to account for the heterogeneity of ESG factors and the mechanisms through which they relate to various components of corporate financial risk.
Keywords:
financial risk
; ESG factors
; financial leverage
; free cash flow margin
; carbon intensity
; staff turnover
1. Introduction
Modern companies are increasingly required to generate and manage large volumes of ESG (environmental, social, and governance) information. Managers, analysts, and researchers recognize that the impact of sustainability-related risks is becoming a decisive factor for the long-term viability of a business and its access to capital. The today’s challenge is not in a lack of ESG data. Global practice shows that companies are striving not only to generate such data but also to integrate it into their corporate governance. For instance, companies like BHP (BHP Climate-Related Physical Risk and Adaptation, n.d.; Sustainability | BHP, n.d.) and Maersk (Maersk: Decarbonising Our Ocean Business, n.d.; Maersk: We Act as a Catalyst for the Energy Transition in Shipping and Logistics., n.d.) assess climate risks to inform capital expenditure (CAPEX) decisions and evaluate the physical risks facing specific corporate assets, such as terminals and warehouses. The primary objective is to reduce the likelihood of operational disruptions caused by climate-related events. Siemens (Siemens: Sustainability Report 2024, n.d.), Unilever (Unilever: Addressing Climate Change with Action, n.d.), and Kazatomprom (NAC Kazatomprom: Operating and Financial Review for 2025, 2026) utilize ESG data to manage supply-chain risks, improve energy efficiency, guide operational decision-making, and support strategic planning. Furthermore, the use of ESG data is expanding within financial institutions and the broader field of investment management. Organizations such as UBS (Sustainability Reports | UBS Global, n.d.), NBIM (NBIM: Norges Bank Investment Management. Responsible Investment 2025, 2026), and Rio Tinto (Rio Tinto. Strategic Context, n.d.) demonstrate the application of various technologies to transform raw ESG data into actionable risk information. By employing climate scenarios for stress-testing investment portfolios, firms can practice responsible investment through sustainability-focused financial risk management. Moreover, regulatory frameworks – such as the requirements under IFRS S1/S2 (IFRS. Sustainability. Introduction to the ISSB and IFRS Sustainability Disclosure Standards., n.d.) – compel companies to disclose not only ESG data but also the processes used to identify, assess, and monitor sustainability-related risks. ESG is evolving from a mere reporting tool into an integral component of the risk management architecture. Nevertheless, academic research (Jitmaneeroj & Tonghui, 2026; Zhao et al., 2025) and industry reports from major consulting firms (the "Big 4" and "Big 3") (PricewaterhouseCoopers, n.d.-a; Private Investment Insights: McKinsey on Investment | Private Capital | McKinsey & Company, n.d.) indicate that this topic remains highly relevant. While some leading companies have begun integrating ESG data into their risk management processes, this practice is neither widespread, universal, nor systematic. The increasing availability of ESG data does not necessarily lead to its effective integration into a company’s internal management accounting systems or risk management framework. Existing research primarily focuses on the disclosure of ESG-related information, ESG metrics, and their impact on firm value. Less attention has been paid to the internal integration of ESG data into management accounting and its role in corporate risk management.
The purpose of this study is to examine how ESG data can be integrated into management accounting and utilized as a tool for corporate risk management in Kazakhstan. The research questions that guided this study are as follows:
RQ1 How ESG data is collected and organized within companies?
RQ2 To what extent ESG data is integrated into management accounting?
RQ3 How ESG data is used for corporate risk identification and monitoring?
RQ4 What organizational and technological factors determine effective ESG data integration?
The research findings offer the following contributions:
First, the theoretical contribution lies in a reconceptualization of ESG integration. The core shift is from a framework focused primarily on disclosure to an understanding of ESG as an integral component of a company’s financial risk management system. The proposed conceptual model links the quality of ESG data and its integration into management accounting with the processes of identifying ESG-related risks, assessing financial risks, and ongoing monitoring. Thus, the novelty of this work lies in establishing a direct connection between non-financial ESG information, management accounting, and corporate risk management systems.
Second, the methodological and empirical contribution is based on the use of disaggregated ESG data, rather than relying solely on a composite ESG rating. The study examines individual environmental, social, and governance indicators using panel data analysis. This approach makes it possible to identify the heterogeneous impact of risks across various ESG dimensions, preventing significant risk channels at the firm level from being obscured or neutralized within an aggregated rating.
Third, the contextual contribution consists of providing empirical evidence from large companies operating in sectors highly sensitive to ESG factors within an emerging economy. The panel dataset, covering the period from 2017 to 2024, integrates information from financial statements, annual reports, and sustainability reports. This approach expands an empirical base that has historically been dominated by data from developed markets, allowing for an assessment of the relationship between ESG and risk in an environment where sustainability reporting practices are less mature.
Finally, the practical significance of this work lies in the potential to apply empirically relevant ESG indicators within risk management processes. The findings provide a foundation for integrating ESG metrics into management accounting systems, risk dashboards, and risk control mechanisms at the board level. For investors, this approach facilitates the interpretation of non-financial reporting by linking ESG indicators to specific corporate risk channels.
2. Literature Review
Recent research (publications from 2026) on the quality and content of ESG information indicates that experts and scholars view ESG data as more than just a means of disclosing a company’s sustainability. A significant number of research works focuses on the role of ESG metrics as a source of data for assessing future risks. Scholars note that ESG indicators themselves are not management tools. For instance, data on emissions become a management risk indicator only when a company links them to future carbon pricing, potential costs, credit risk, and investment requirements. Research from 2026 clearly outlines the trajectory for the further transformation of ESG data (Figure 1, Appendix A).
The academic papers reviewed were grouped according to the main research areas relevant to the objective of our study.
2.1. ESG Disclosure and the Quality of ESG Information as the Foundation of a Risk-Control System
One area of research focuses on the transformation of ESG disclosure from a tool for external reporting into an element of internal risk control. A study by Tsai, Wang, and Wu (Tsai et al., 2026) demonstrates that mandatory CSR disclosure can reduce legal violations, ESG-related incidents, and financial penalties. The authors attribute this effect to increased transparency, stronger oversight by stakeholders, market pressure, and external assurance. Consequently, ESG disclosure serves a purpose beyond mere information provision; it acts as a control signal for management, facilitating the early detection of issues. This concept is significant for the organization of managerial accounting: ESG metrics can be incorporated into internal KPIs and utilized within compliance systems. In practice, they are also actively integrated into risk dashboards.
However, the mere availability of ESG information does not guarantee its usefulness. Jitmaneeroj and Tonghui (Jitmaneeroj & Tonghui, 2026) show that ESG reporting and ESG performance can mitigate firm-specific risk, though this effect is contingent upon the quality of the institutional environment: in contexts with high levels of corruption, the ability of ESG reporting to reduce risk is diminished. Therefore, it is not just the existence of ESG data that matters, but rather its accuracy, comparability, and reliability. The issue of information quality is also related to "greenwashing." Liu et al. (Liu et al., 2026) indicate that management attitudes can influence a company’s propensity to engage in risky ESG greenwashing. Our research underscores that if disclosed information fails to reflect a company’s actual state, the ESG data itself becomes a source of risk. This triggers a chain reaction: poor-quality data → greenwashing → loss of trust → reputational risk → financial consequences. For this reason, managerial accounting must reconcile ESG claims with actual operational outcomes.
2.2. ESG Controversies and Reputational Risk as a Mechanism for the Transformation of an ESG Signal
Presented below is a collection of studies centered on the topic of ESG controversies and their impact on financial performance. Karunarathne, Luong, and Kuruppuarachchi (Karunarathne et al., 2026) demonstrate that an increase in political risk is associated with a rise in ESG controversies. This suggests that ESG incidents may reflect not only a company’s internal issues but also the influence of the external environment. ESG controversies thus serve as a significant mechanism for risk transmission. Political and institutional shifts can increase the likelihood of negative ESG events (Pham & Trung, 2026), which in turn heighten a company’s reputational vulnerability. Consequently, reputational losses can affect the cost of capital and market valuation. Research by Suhasmoro et al. (Suhasmoro et al., 2026) confirms the significance of this mechanism, showing that controversies can alter the relationship between ESG factors and financial performance, as well as strengthen the link to the cost of capital. Therefore, it is appropriate to view ESG controversies as early-warning indicators, allowing risks to be identified before they fully manifest in financial terms. This logic is particularly relevant to management accounting; our study emphasizes that a control system can track the frequency and severity of ESG incidents, while also accounting for their potential impact on reputation, the cost of capital, and firm value.
2.3. ESG Information, Climate and Regulatory Factors as Sources of Financial Risk
Research papers in this group focuses on the direct transformation of ESG factors into financial risk metrics. Borsuk and Shrimali (Borsuk & Shrimali, 2026) demonstrate a link between emission volumes and the market-implied probability of default: higher emission levels are associated with greater credit risk. At the same time, financial stability and robust ESG practices can mitigate this relationship. Thus, in our view, environmental data can be transformed into financial risk indicators. For instance, Scope 1–3 emission metrics can be used to assess carbon risk, which, in turn, can be linked to the probability of default and overall credit risk. This establishes a direct connection between an ESG metric and a financial outcome. Zhao et al. (Zhao et al., 2026) extend this logic by introducing a firm-level climate policy uncertainty metric. The authors employ large language models (LLMs) to analyze corporate disclosures and derive a quantitative indicator of climate uncertainty: an increase in this indicator leads to wider credit spreads. The primary mechanisms driving this are financial distress and reduced liquidity, while ESG disclosure can help reduce these negative effects. Conversely, disagreement among ESG ratings can exacerbate them. Furthermore, regulatory risk must be considered separately. Rafi (Rafi, 2026) shows that the market’s perception of ESG uncertainty varies depending on the regulatory regime: the transition from voluntary disclosure to mandatory compliance alters market reactions. Governance uncertainty, for example, may be perceived as oversight risk. In this context, we emphasize that management accounting should look beyond mere ESG performance: it must also continuously monitor shifts in ESG regulation and the associated compliance costs.
2.4. ESG Information as a Basis for Management Decision-Making and an Integrated Risk Management System
The research findings grouped into this subcategory relate to the use of ESG information in managerial decision-making. Ma et al. (Ma et al., 2026) demonstrate that ESG ratings link managerial sentiment to default risk. Sun, Du, and Du (Sun et al., 2026) expand upon this finding, showing that ESG performance influences digital innovation via a firm’s willingness to innovate – an effect particularly pronounced in companies with a high propensity for risk. Taken together, these studies allow us to identify a sequence: ESG information → assessment of its quality → identification of ESG and climate-related risks → financial consequences → managerial response. Financial outcomes in this context may include the cost of capital, financial leverage, the probability of default, and free cash flow.
2.5. The Impact of ESG on a Company’s Financial Performance and Financial Risk Management
A significant part of research examines the impact of ESG metrics on corporate financial performance. For instance, Friede et al. (Friede et al., 2015) provide a meta-analysis of over 2,000 studies on the relationship between ESG and financial performance, demonstrating that the vast majority of these studies identify a non-negative correlation between ESG factors and corporate financial outcomes. Berg et al. (Berg et al., 2022) highlight substantial discrepancies in ESG ratings across different providers, identifying three primary sources of divergence: scope, measurement, and weighting. Notably, 56% of these discrepancies are related to measurement of the underlying metrics – a finding that directly underscores the necessity of standardizing raw ESG data before it can be effectively utilized in risk management. Lee & Koh (Lee & Koh, 2024) explore the relationship between corporate risk and ESG, focusing specifically on the interplay between leverage, risk, and ESG factors. Furthermore, a review by Gillan et al. (Gillan et al., 2021) synthesizes research on ESG/CSR within the field of corporate finance, illustrating the links between ESG and a company’s risk profile, valuation, and financial characteristics.
Consequently, ESG information is increasingly becoming an integral component of risk management systems. Its value lies not in the sheer volume of disclosure, but in its capacity to identify risks and provide a sound basis for managerial decision-making. This justifies the development of an integrated ESG risk framework – one that synthesizes ESG data, data quality assessments, information on controversies, and climate- or regulatory-related risks with core financial metrics.
2.6. Research Gap and Hypotheses
Existing research provides compelling evidence that ESG metrics are associated with various forms of corporate risk. However, the literature remains fragmented regarding the internal transformation mechanism. Much of this literature relies on aggregated ESG metrics, which may obscure the distinct risk channels linked to specific aspects of a company’s performance. The processes through which ESG data are translated into management information – for the purposes of risk assessment and decision-making – remain under-researched. Most studies treat ESG primarily as external disclosure, a rating, or a market signal, while paying less attention to its integration into management accounting systems, risk-related key performance indicators (KPIs), internal cost metrics, and forward-looking risk scenarios. This gap is particularly relevant for emerging markets, where the quality of ESG data and the state of institutional and legal frameworks can influence the utility of such data for risk management. Accordingly, the following hypotheses are proposed:
H1: Non-financial ESG indicators have incremental explanatory power for corporate financial risk beyond conventional financial metrics.
H2: Individual environmental, social, and governance indicators have heterogeneous effects on corporate financial risk, with the direction, magnitude, and significance of these effects varying across ESG indicators.
3. Conceptual Framework
The conceptual framework links the integration of ESG data with the management of corporate financial risks (Figure 2).
High-quality ESG data provide an information base for incorporating non-financial data into management accounting. This integration facilitates the identification of material ESG risks and their assessment in terms of potential financial consequences. Once identified, these risks can be incorporated into monitoring processes and risk-based decision-making. The concept is founded on the premise that individual ESG aspects may vary in their significance regarding financial risk. Existing risk management frameworks support the integration of ESG information into the broader risk management process. The novelty of this proposed concept lies in positioning the integration of ESG data as a mechanism that transforms non-financial information, shifting it from a reporting output into an input for identifying, assessing, and monitoring financial risks. Unlike approaches based primarily on aggregated ESG metrics, this concept treats heterogeneous ESG indicators as distinct potential channels of risk, linking them directly to a company’s management accounting and risk management practices.
4. Materials and Methods
4.1. Research Design
This study aims to assess the relationship between ESG metrics, the financial stability and risk of major industrial enterprises in Kazakhstan. The analysis is based on panel data from the following companies: KMG (KMG Published the 2024 Sustainability Report, n.d.), KTO («KazTransOil» JSC - Annual Reports, n.d.), QazaqGaz (Integrated Annual Report of JSC "NC “QazaqGaz” (KZTG) - Kazakh Stock Exchange (KASE) (in Russian), n.d.), Kazchrome (Kazchrome - Disclosures - Annual Report, n.d.), KTZh (KTZh - Financial Statements, n.d.), and Kazatomprom (NAC Kazatomprom: Operating and Financial Review for 2025, 2026). These companies were selected based on their economic significance, their representation of key ESG-sensitive sectors, and the availability of consistent financial and non-financial disclosures for the 2017–2024 period. An additional criterion was the availability of comparable data from financial statements, annual reports, and sustainability reports, sufficient to construct firm-level ESG and financial risk indicators. Two complementary metrics are used as the primary dependent variables. The first (y1) is financial leverage, calculated as the ratio of liabilities – comprising loans, borrowings, and debt securities – to equity. The second dependent variable (y2) is the free cash flow (FCF) margin, calculated as the ratio of free cash flow to revenue. Employing these two models allows for the examination of financial risks from two complementary perspectives. The financial leverage model characterizes the impact of ESG factors on a company’s debt burden and its reliance on external financing. High staff turnover, significant structural changes in headcount, or a high level of carbon intensity may be associated with operational uncertainty and, consequently, a company’s need for additional funding. The FCF margin model complements this analysis by illustrating the link between ESG factors and a company’s internal capacity to generate cash. While financial leverage primarily reflects debt-related risk, the FCF margin characterizes a company’s ability to cover its financial obligations through its own operational activities. The selection of these variables is also supported by a literature review of relevant academic research (Berg et al., 2022; Pham & Trung, 2026). Consistency in modeling results strengthens the robustness of conclusions regarding the impact of ESG factors on financial risks, while differences between models help identify the specific financial mechanism through which the ESG effect manifests.
4.2. Database and ESG Indicators
The database is compiled from corporate reporting, including dedicated sustainability sections and standalone sustainability reports covering the period 2017–2024. It incorporates both financial and ESG metrics. The varying levels of detail in ESG disclosures represent a limitation of the database; however, the absence of a reported figure is not treated as a zero value. While this limitation does not preclude the inclusion of ESG metrics in the modeling, it necessitates a cautious interpretation of the resulting coefficients. Consequently, the findings reflect an empirical correlation between ESG metrics and financial performance, rather than a universal causal relationship. To enhance comparability, ESG metrics are normalized based on company scale: social and human resources-related indicators are adjusted relative to the number of employees, while environmental indicators are adjusted relative to the company’s economic scale – specifically, its revenue.
4.3. Empirical Analysis and Normalized Approach
Min-max normalization was used to compare the ESG characteristics of companies. This method allows indicators with different units of measurement to be mapped onto a common scale. Such normalization is essential for integrating ESG data into a corporate risk management system and for subsequent cross-firm comparisons.
For indicators where an increase signifies higher risk, direct normalization was applied:
where:
xi – is the value of a company’s indicator,
Xmin and Xmax are the minimum and maximum values in the sample. As a result, the values fall within a range from 0 to 1. A value close to 1 indicates a higher relative level of the corresponding risk.
For indicators where an increase signifies a reduction in risk, inverse normalization is applied:
In this study, this approach is applied to metrics concerning staff turnover, changes in headcount, training expenditure, and the proportion of women in the workforce. Here, indicators reflecting workforce diversity are interpreted as characteristics of social sustainability rather than as direct measures of financial risk. To ensure comparability, relative values representing changes in headcount over the studied period were used. Training costs were normalized against the number of employees, which prevented the distortion of results that might otherwise arise from differences in the scale of the enterprises.
This approach makes it possible to transform heterogeneous ESG data into comparable metrics, which can then be used to identify areas of heightened environmental, social, and governance (ESG) risk. In other words, normalization serves as a preparatory step for ESG data rather than as an independent gauge of financial risk. This is particularly significant in the context of financial risk management, as empirical research confirms a link between ESG metrics and a company’s financial performance (Friede et al., 2015). At the same time, variations in how ESG indicators are measured and aggregated can substantially influence the approach taken toward risk assessment (Gillan et al., 2021).
4.4. Econometric Modeling
In this study, financial risk is defined as a multidimensional criterion rather than a single, aggregate indicator. Under this framework, financial leverage and free cash flow margin are modeled separately.
The primary model assesses the relationship between ESG and financial burden:
LEVit = β0 + β1ESGit + β2Controlsit + µit + λit + εit
The second model assesses the relationship between ESG and financial resilience.
FCFMit = β0 + β1ESGit + β2Controlsit + µit + λit + εit
The first model (LEVit) describes the debt-related component of financial risk, while the second model characterizes a company’s ability to generate cash flows from internal resources. The impact of ESG factors is assessed using both models, without imposing constraints such as coefficient equality or requiring specific statistical significance. Consistency in the findings strengthens the argument for a link between ESG factors and financial risk, whereas any divergence in results makes it possible to identify the specific financial mechanism through which an ESG factor exerts its influence. This approach preserves the economic rationale behind of each dependent variable and avoids the loss of information that typically occurs when such variables are aggregated.
4.5. Econometric Diagnostics
The selection of the panel data specification is based on a sequential diagnostic process. First, a comparison is made between pooled OLS, fixed effects (FE), random effects (RE), and a two-way fixed effects model. The Hausman test is used to choose between the FE and RE models. The necessity of including time effects is assessed by considering common temporal variations across the companies. Additionally, the model is checked for heteroskedasticity, within-panel autocorrelation, cross-panel dependence, and multicollinearity, and the robustness of the coefficients to alternative specifications is evaluated. The Variance Inflation Factor (VIF) is used to assess multicollinearity, while the Wooldridge test is applied to detect serial correlation. In the presence of heteroskedasticity and/or serial correlation, standard errors are adjusted using an appropriate robust estimation method.
4.6. Strategy for Integration of the Results
The two dependent variables are not combined into a single index; rather, they are used to examine two complementary aspects of financial risk. The first model (y1 LEV) addresses the question of whether ESG characteristics are associated with a company’s level of financial leverage. The second model explores whether ESG metrics are linked to a company’s ability to generate free cash flow. The results are integrated at the level of economic interpretation: if an ESG factor is associated with both lower financial leverage and higher free cash flow (FCF), the findings are viewed as consistent evidence of a potential link to the company’s financial stability. If the results differ, this is not considered a contradiction, as financial leverage and cash flow reflect distinct risk mechanisms. For instance, as of the end of 2024, Kazchrome exhibits a relatively high debt burden (3.2) while simultaneously maintaining a positive free cash flow (183.0 billion tenge) (Kazchrome - Disclosures - Annual Report, n.d.).
4.7. Implications for Management Accounting and Risk Management
Normalized ESG metrics provide a comparable information base for management analysis. An econometric model can be used to identify which ESG factors have a statistically significant relationship with financial leverage and cash flow stability. This enables the integration of ESG data into traditional management accounting systems. Consequently, ESG metrics can serve as early indicators of potential financial outcomes. For instance, an increase in staff turnover may signal future recruitment and training costs. A rise in environmental impact may point to potential regulatory or investment risks. Changes in the quality of corporate governance may be linked to information-related and agency risks.
5. Results
5.1. ESG Data Management and Management Accounting Practices
5.1.1. Organizational Structure
In Kazakhstani companies, ESG management is structured around the principle of distributed responsibility among functional departments. The Board of Directors and its specialized committees define strategic goals, approve ESG-related KPIs, and oversee the preparation of reports. Strategy and sustainability departments coordinate ESG processes and consolidate information gathered from other units. The HSE (Health, Safety, and Environment) function is responsible for environmental performance, operational safety, emissions, resource consumption, and occupational health. The HR department manages data regarding personnel, training, staff turnover, and social programs. Compliance, legal, and internal audit functions provide information on corporate governance and regulatory adherence. The finance function participates in integrating ESG metrics into budgeting, investment analysis, and corporate reporting, though it typically does not own the ESG function itself. IT departments support databases, ERP systems, and business intelligence (BI) tools, although the specific roles they play and the solutions they employ are only disclosed to a limited extent in the public reporting of Kazakhstani companies. It should be noted that ESG units most often report to a Chief Sustainability Officer (CSO) or the company’s executive leadership, meaning they are organizationally separate from finance departments. This can hinder the direct integration of ESG metrics into financial risk management and budgetary control processes.
5.1.2. ESG Data Collection
Primary ESG data is generated directly within the departments where the relevant operations and events take place. Environmental metrics are sourced from HSE, production, and technical departments. Social data is collected by the HR function, drawing on personnel statistics, training records, working conditions, and injury-related metrics. Information regarding corporate governance is compiled by legal departments, compliance teams, and internal audit functions. The responsible departments record this data in corporate systems (such as SAP, Anaplan, or specialized ESG digital solutions), internal forms, or spreadsheets. The verification process includes checking for completeness, cross-referencing metrics, and obtaining confirmation from the relevant staff. Once verified, the data is forwarded to the strategy department, the sustainability unit, or an ESG project office for consolidation. A current limitation based on the fact that data collection is distributed across various departments, which increases the risk of methodological inconsistencies and variations in data quality. The absence of standardized verification procedures may reduce the reliability of ESG information when it is used to assess financial risks.
5.1.3. ESG Digital Platforms
A review of the world practices for using digital platforms for collecting, processing, and storing ESG data allows us to identify the advantages and certain limitations that must be considered when implementing them in Kazakhstan. Thus, the use of platforms specialized or adapted for working with ESG data allows, first and foremost, to reduce labor costs and human error. A unified data warehouse with detailed analysis ensures the consistency of business processes and reduces the time required for their analysis. It also guarantees the reliability of the data required for KPIs and long-term strategy. At the same time, it simplifies the monitoring of decarbonization goals, especially in the face of a shortage of specialized personnel. The lack of emissions accounting makes it impossible to objectively assess the environmental component of ESG and develop KPIs for departments. This undoubtedly helps ensure compliance with regulatory requirements and quick access to up-to-date indicators. Kazakh companies usually do not publicly disclose the names of the ESG platforms they use. As a result, the digital environment remains largely internal and the level of automation varies between companies. For Kazakhstani companies, implementation will undoubtedly entail significant costs for integration and staff training, on the one hand. On the other hand, this requires adapting business processes and the information systems themselves, as well as updating internal regulations.
5.1.4. ESG Data Processing
The processing of ESG data in Kazakhstani companies involves systematizing, verifying, and aggregating data, as well as transforming it into KPIs. Internal ERP and BI systems are primarily used for storage and analysis, with relevant ESG metrics extracted from the corresponding operational systems. The consolidated data is then used to calculate absolute and relative indicators, including emission intensity and resource consumption rates. Subsequently, actual results are compared against target values to identify any deviations. Many Kazakhstani companies do not disclose the information systems they employ, often relying on internal or fragmented solutions rather than specialized ESG platforms. This limits the automation of analysis, the timeliness of data acquisition, and the ability to conduct comprehensive ESG risk assessments, while also leading to the duplication of ESG data processing functions.
5.1.5. Integration into Management Accounting
Integration begins with transforming collected ESG data into measurable indicators and corporate KPIs. These KPIs are used to monitor emissions, energy efficiency, occupational safety, social programs, and the quality of corporate governance. In some companies, ESG metrics are incorporated into management control systems and benchmarked against key business performance indicators. Data regarding resource consumption, environmental commitments, and social initiatives may be factored into the preparation of budgets and long-term plans. Management analysis involves comparing planned versus actual results, identifying variances, and evaluating the effectiveness of ESG initiatives. The findings are then shared with finance departments, strategic planning units, and investment committees to assist in the assessment of capital projects. ESG information is utilized when considering equipment upgrades, improvements in energy efficiency, decarbonization efforts, and the procurement of green financing. This establishes a management chain: ESG data → KPIs → budgets → management analysis → investment decisions → risk management. While ESG metrics are employed for monitoring and reporting purposes, their integration into investment analysis and financial risk management remains inconsistent. Currently, ESG data serves more as informational support for decision-making rather than as an integral component of financial models or the valuation of the cost of capital.
5.2. ESG Data as a Tool for Corporate Risk Management
Inter-firm comparison plays a significant role in the benchmarking used within management analysis. In this context, companies compare their ESG metrics and processes against benchmark ESG practices. This enables the improvement of internal processes, both in terms of ESG-oriented management accounting and risk management.
5.2.1. Environmental
An analysis of environmental indicators reveals significant heterogeneity in environmental risk among Kazakhstani companies. The most pronounced disparity is observed in direct CO2 emissions. Most of the companies studied (Qazaqgaz, Kazchrom, KMG, KTZh) are characterized by high absolute emission volumes. This increases their sensitivity to stricter climate regulations and rising carbon costs. Consequently, it is advisable to consider emission metrics when assessing long-term investment risks. Kazatomprom and KazTransOil have significantly lower absolute volumes of direct emissions. For Kazatomprom, this is due to the specific nature of its uranium extraction technology – in-situ leaching. For KazTransOil, the pipeline-based mode of transport plays a significant role.

Table 1.
Normalized profile of environmental ESG indicators for Kazakhstani companies.
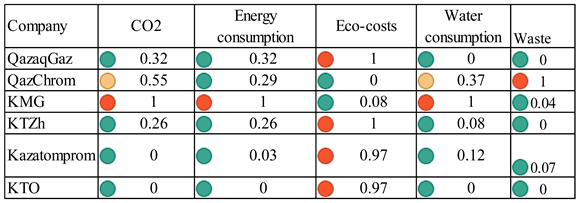
The data presented reflect normalized values ranging from 0 to 1, which allows to compare various indicators (despite differences in units of measurement) and identify the areas requiring heightened attention. In this context, low absolute emission levels (marked in green) are not interpreted as representing a higher level of environmental performance; however, this factor should be taken into account when conducting cross-industry comparisons. Energy consumption data further underscore the necessity of normalizing environmental indicators by industry. Similar issues arise regarding water consumption and waste generation, where companies fall into two distinct groups.
Methodological discrepancies limit the comparability of certain indicators. A notable example is KazTransOil, where a change in the approach to accounting for water consumption created a structural break in the time series. In the case of Kazchrome, the comparability of environmental protection expenditures is also limited by the inclusion of both operational and capital expenditures within a single category. Consequently, while environmental indicators can be used for risk management, they require standardization, industry-specific normalization, and careful consideration of how data is disclosed. The most informative approach is to incorporate these indicators into a comprehensive environmental risk assessment framework, rather than relying on isolated absolute metrics.
5.2.2. Social
Social ESG metrics influence a company’s financial risks through several channels. The most direct channel is industrial safety. Significant investments in occupational health and safety can be viewed as preventive expenditures that reduce the likelihood of accidents, operational downtime, and unforeseen cash outflows. The case of QazaqGaz is illustrative: an increase in investments in industrial safety – complemented by organizational measures – led to a 33% reduction in workplace injuries in 2024 (JSC «NC «QazaqGaz» - Sustainable Development, n.d.). From a risk management perspective, this demonstrates a link between social-related expenditures and the management of operational risk. The calculation of normalized social ESG values is presented in the table below.
Table 2.
Normalized social ESG profile of Kazakhstani companies.
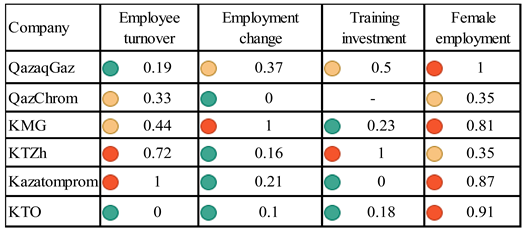
Furthermore, high staff turnover rates at Kazatomprom, KTZh, and KMG increase the potential costs associated with recruitment, training, and onboarding. For capital-intensive enterprises, this can drive up operating expenses and reduce the predictability of cash flows. The increase in training expenditures at Kazatomprom suggests that human capital development can serve as a tool for mitigating personnel-related risks, particularly in environments with high turnover. The share of in-country value in procurement serves as an indicator of supply chain resilience; low figures – as seen in the case of Kazchrome – point to a greater potential reliance on external suppliers, as well as increased exposure to currency fluctuations and logistical risks. This profile helps identify which ESG factors are appropriate for inclusion in subsequent financial risk analysis. Consequently, the study suggests that "staff turnover" and "changes in headcount" can be utilized as independent variables within the "Social" component. Staff turnover may reflect personnel instability, recruitment and training costs, and operational risks themselves, while changes in headcount characterize a company’s structural transformation. Training expenditures represent investments in human capital and the capacity to mitigate personnel or operational risks; however, because companies categorize different types of costs under this heading – and given that data for some firms (such as Kazchrome) is unavailable – this metric is not currently suitable for modeling purposes. The proportion of women in the workforce reflects staff diversity, which may be more heavily influenced by the specific industry profile of a business; therefore, a direct link to financial risks is not readily apparent (within the scope of this study).
5.2.3. Governance
An analysis of ESG governance indicators reveals significant differences in the quality of corporate control mechanisms and financial risk management. The most direct correlation can be observed in areas such as industrial safety, procurement policy, and the structure of governance bodies. QazaqGaz demonstrates a shift from merely tracking social expenditures toward active risk management. Increased investment in industrial safety has been accompanied by adjustments to executive KPIs, including the incorporation of non-occupational fatality rates into the annual remuneration system. This approach links ESG metrics to management accountability and has the potential to enhance the effectiveness of internal controls. For Kazchrome, the share of in-country value (local content) in procurement is of particular importance; its relatively low level suggests a potentially higher dependence on external suppliers. This increases the sensitivity of cash flows to currency, logistical, and geopolitical risks.
Table 3.
Normalized profile of ESG governance indicators for Kazakhstani companies.
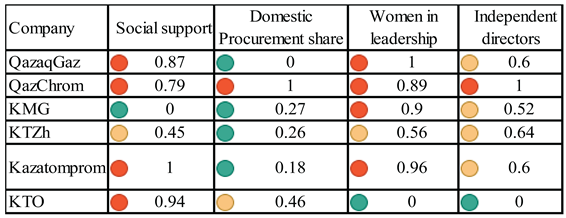
The proportion of independent directors serves as an indicator of the mechanism for overseeing management decisions. For most companies, the presence of independent members provides an additional layer of oversight regarding management and risk. KMG maintains consistent levels of social support for its employees, which points to a coherent policy in this area. At the same time, the absolute value of such expenditures is not a sufficient basis for evaluating management effectiveness. Consequently, ESG-related management data are most valuable for financial analysis when linked to oversight mechanisms, management KPIs, supply chain resilience, and the prevention of operational losses. In this context, "domestic procurement share" and "independent directors share" were selected for modeling purposes.
5.2.4. ESG Data and Financial Risk
ESG factors can be linked to various sources of financial risk. High emissions, energy consumption, and environmental costs can increase sensitivity to regulatory requirements and the cost of capital. For instance, KMG has approved a low-carbon development program through 2060, which includes investments in energy efficiency, renewable energy sources (RES), methane monitoring, and CO2 emission reductions. At the same time, KMG has continued to reduce its debt burden – by 8.6% in 2024. This was achieved by spreading long-term energy-related investments out until 2060, allowing current revenues to be directed toward debt repayment (KMG Energy Consumption and Energy Efficiency - Sustainability Report 2025, n.d.). Furthermore, improvements in energy efficiency and methane monitoring lower production costs, thereby freeing up capital. A carbon strategy boosts a company’s ESG ratings, improving its access to green financing. Social indicators, such as staff turnover, are linked to operational resilience; for example, a 33% reduction in workplace injuries at QazaqGaz highlights the connection between health, safety, and environment (HSE) expenditures, operational stability, and the mitigation of loss-related risks. Governance indicators reflect the quality of corporate management and the resilience of supply chains. Kazchrome, for example, has implemented a responsible approach to supply chain management, which has been recognized through its "Responsible Chromium" status (Kazchrome Awarded the Responsible Chromium Label, n.d.). This points to a reduction in both the company’s operational and investment risks. Taken together, ESG factors can influence the stability of operating cash flows, investment risks, and the likelihood of operational losses. Therefore, it is appropriate to view them as additional financial risk factors, rather than as standalone metrics for the cost of capital or volatility.
6. Empirical Results
For the empirical analysis, a balanced panel dataset covering six Kazakhstani companies over the 2017–2024 period (48 firm-year observations) was constructed and utilized. In accordance with the adopted methodology, two dependent variables were defined to capture distinct channels through which financial risks exert influence: LEV, representing debt burden, and FCFM, reflecting the capacity to generate internal cash flows. ESG indicators were categorized into groups pertaining to environmental factors (x5–x7), social responsibility (x8–x9), and corporate governance (x10–x11). Financial and operational metrics (x1–x4) were selected as potential control variables. Preliminary data analysis involved the use of Pearson and Spearman correlation coefficients, diagnostics based on the interquartile range (IQR), and the Variance Inflation Factor (VIF). The selection of parsimonious specifications (E+S+G) – as opposed to an over-saturated model – was justified by the presence of strong pairwise correlations (x1–x2, x5–x6, and x7–x11). Various combinations of variables were evaluated using Pooled OLS, fixed effects (FE), random effects (RE), and two-way fixed effects (two-way FE) estimation methods. The final model specification was determined based on p-values, panel diagnostic results, and the stability of the estimated coefficients.
Model 1. Financial Leverage
For the LEV metric, the most robust specification includes carbon intensity (x6), staff turnover (x8), and the presence of independent directors (x10). The resulting working model is as follows:
LEVit = α + β1x6it + β2x8it + β3x10it + μi + λt + εit
The pooled specification was rejected, as there is significant heterogeneity among the companies. The Hausman test supported the random-effects (RE) model at the 5% significance level (χ² = 6.947, p = 0.074); however, this result is close to the 10% threshold. Given this, the results from both fixed-effects (FE) and random-effects (RE) models were evaluated alongside diagnostic tests for model errors. The Breusch–Pagan and Wooldridge tests indicated the presence of heteroskedasticity and serial correlation. Consequently, the findings were verified using standard errors clustered by company, with an adjustment for small samples.
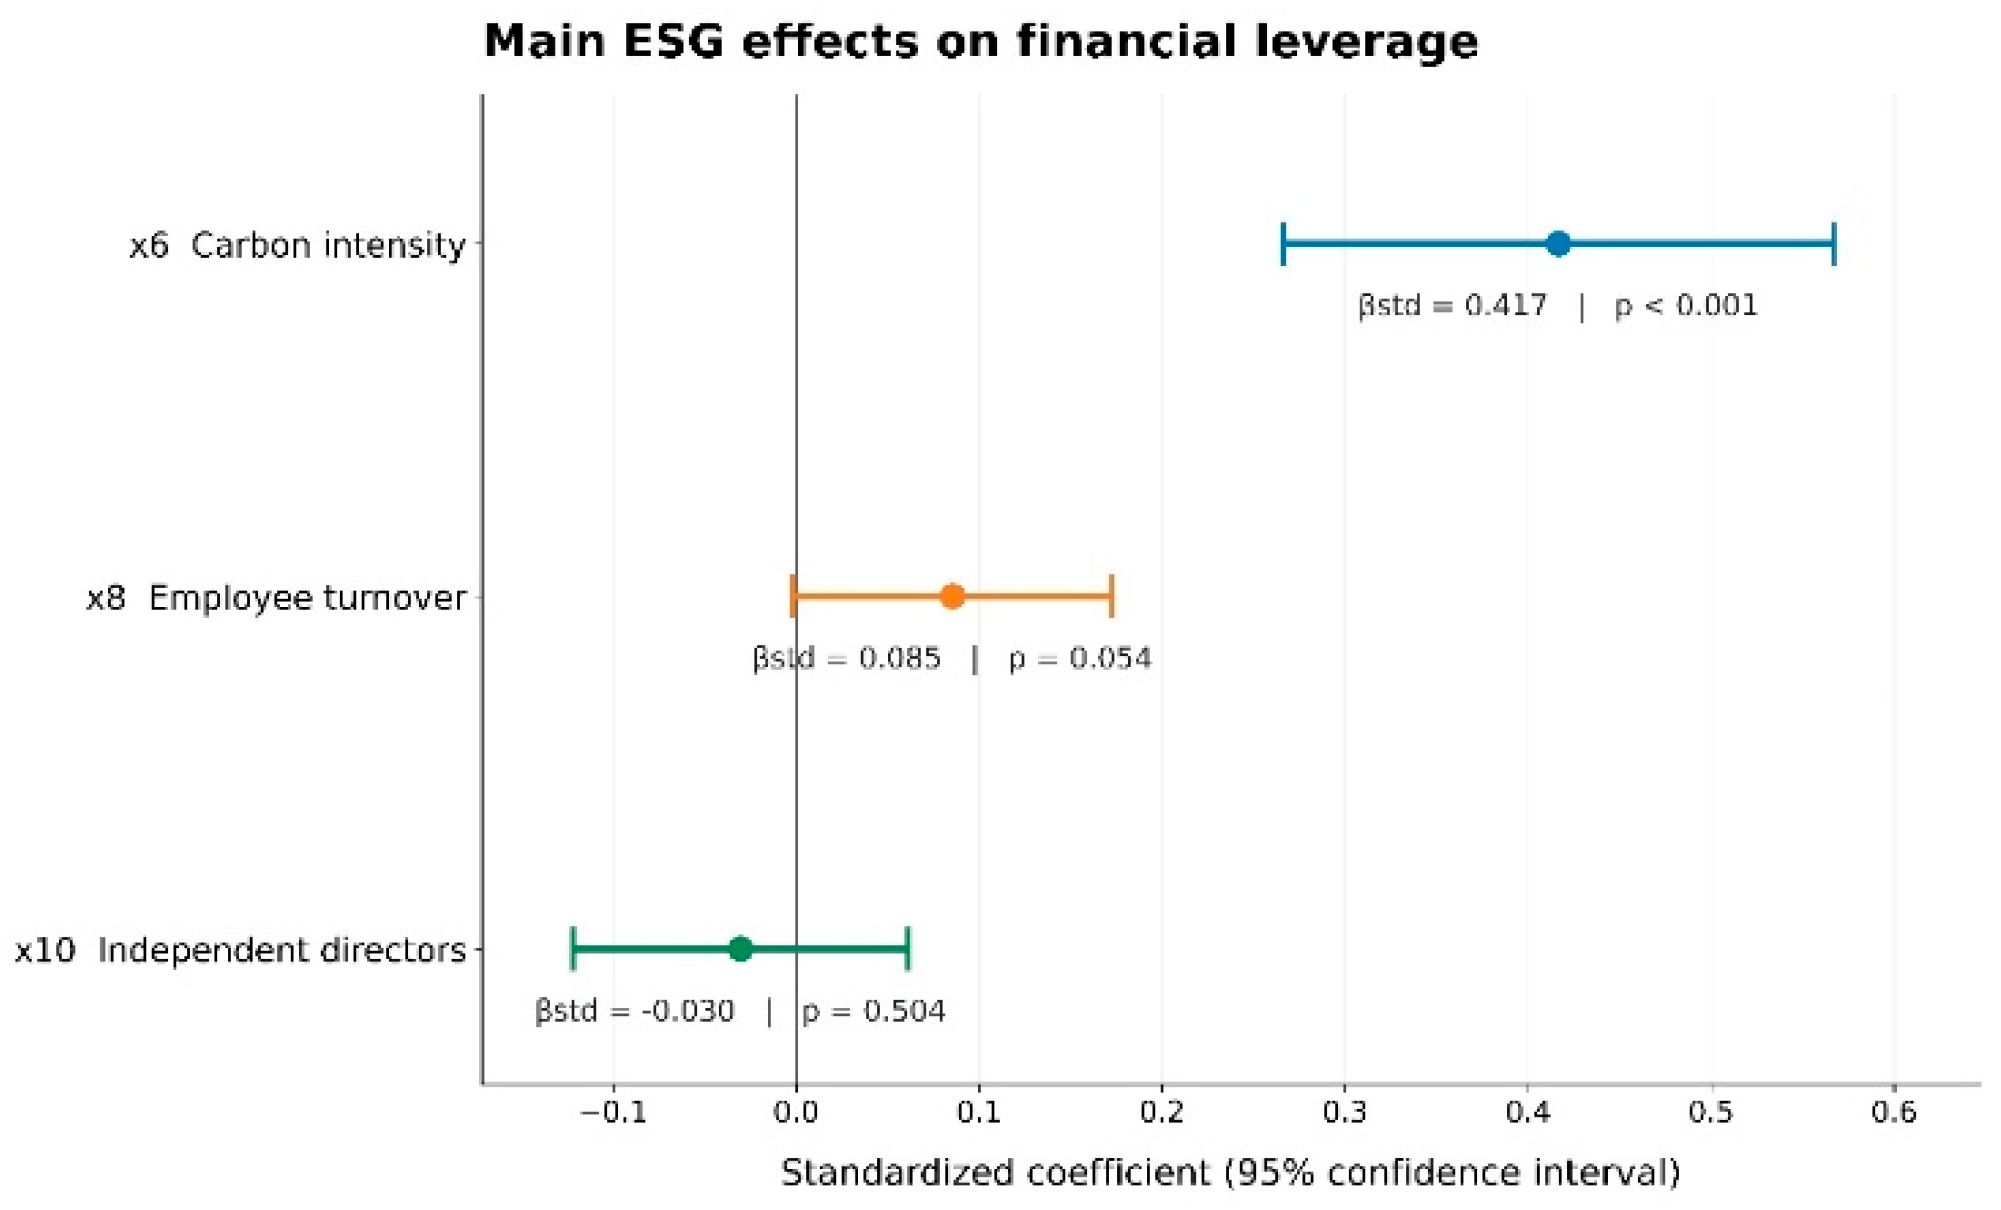
The primary result concerns variable x6: higher carbon intensity is associated with a higher level of financial leverage. In the standardized model with two-way fixed effects, the coefficient βstd was 0.417 (p < 0.001). The effect of staff turnover was positive but less pronounced (βstd = 0.085; p = 0.054). The coefficient for independent directors was negative and statistically insignificant (βstd = −0.030; p = 0.504). The inclusion of the control variable x3 resulted in only negligible changes to the standardized ESG coefficients (0.417 shifted to 0.414; 0.085 rose to 0.089; −0.030 fell to −0.034). This indicates the robustness of the model specification.
Figure 3.
Standardized ESG coefficients in a two-way FE model for financial leverage.
Model 2: FCF Margin
For the FCF Margin (FCFM) model, the same approach – consisting of a sequence of diagnostic steps – was applied. This allows for a direct comparison based on vectors representing the impact on financial risk. Alternative combinations of E, S, and G factors were evaluated, taking into account model fit, statistical diagnostics, the control of multicollinearity, and the stability of coefficient estimates. The selected ESG specification includes the intensity of environmental expenditures (x7), employee turnover (x8), and the proportion of independent directors (x10):
FCFMit = α + γ1x7it + γ2x8it + γ3x10it + μi + λt + εit
For this criterion, the Hausman test strongly rejects the random-effects (RE) model (χ²(3) = 231.66; p < 0.001), confirming the validity of using a fixed-effects (FE) approach. Taking into account the time effects, the analysis is conducted within the framework of a two-way FE model. Residual diagnostics revealed no evidence of heteroskedasticity (Breusch–Pagan test: LM p=0.506; F p=0.528). The Wooldridge test result is not significant at the 5% level (p=0.092), although it indicates the presence of temporal dependence close to the threshold value. Consequently, to ensure the rigor and comparability of the results, standard errors clustered by company were employed.
In Model 2, staff turnover (x8) emerged as the most robust predictor. A 1-percentage-point increase in this variable is associated with a 0.0103 decrease in FCFM, holding other factors constant. The standardized effect is βstd = −0.317 (p=0.0095). The coefficient for the variable representing the intensity of environmental expenditures is also negative (βstd = −0.251) but statistically insignificant. The indicator for independent directors likewise shows a negative value and remains statistically insignificant (βstd = −0.100; p=0.516). The inclusion of variable x3 results in only minor changes to the standardized estimates: the coefficient for x7 remains at −0.251, the coefficient for x8 shifts from −0.317 to −0.314, and the coefficient for x10 changes from −0.100 to −0.103.
Figure 4.
Standardized ESG coefficients in a two-way FE model for FCFM.
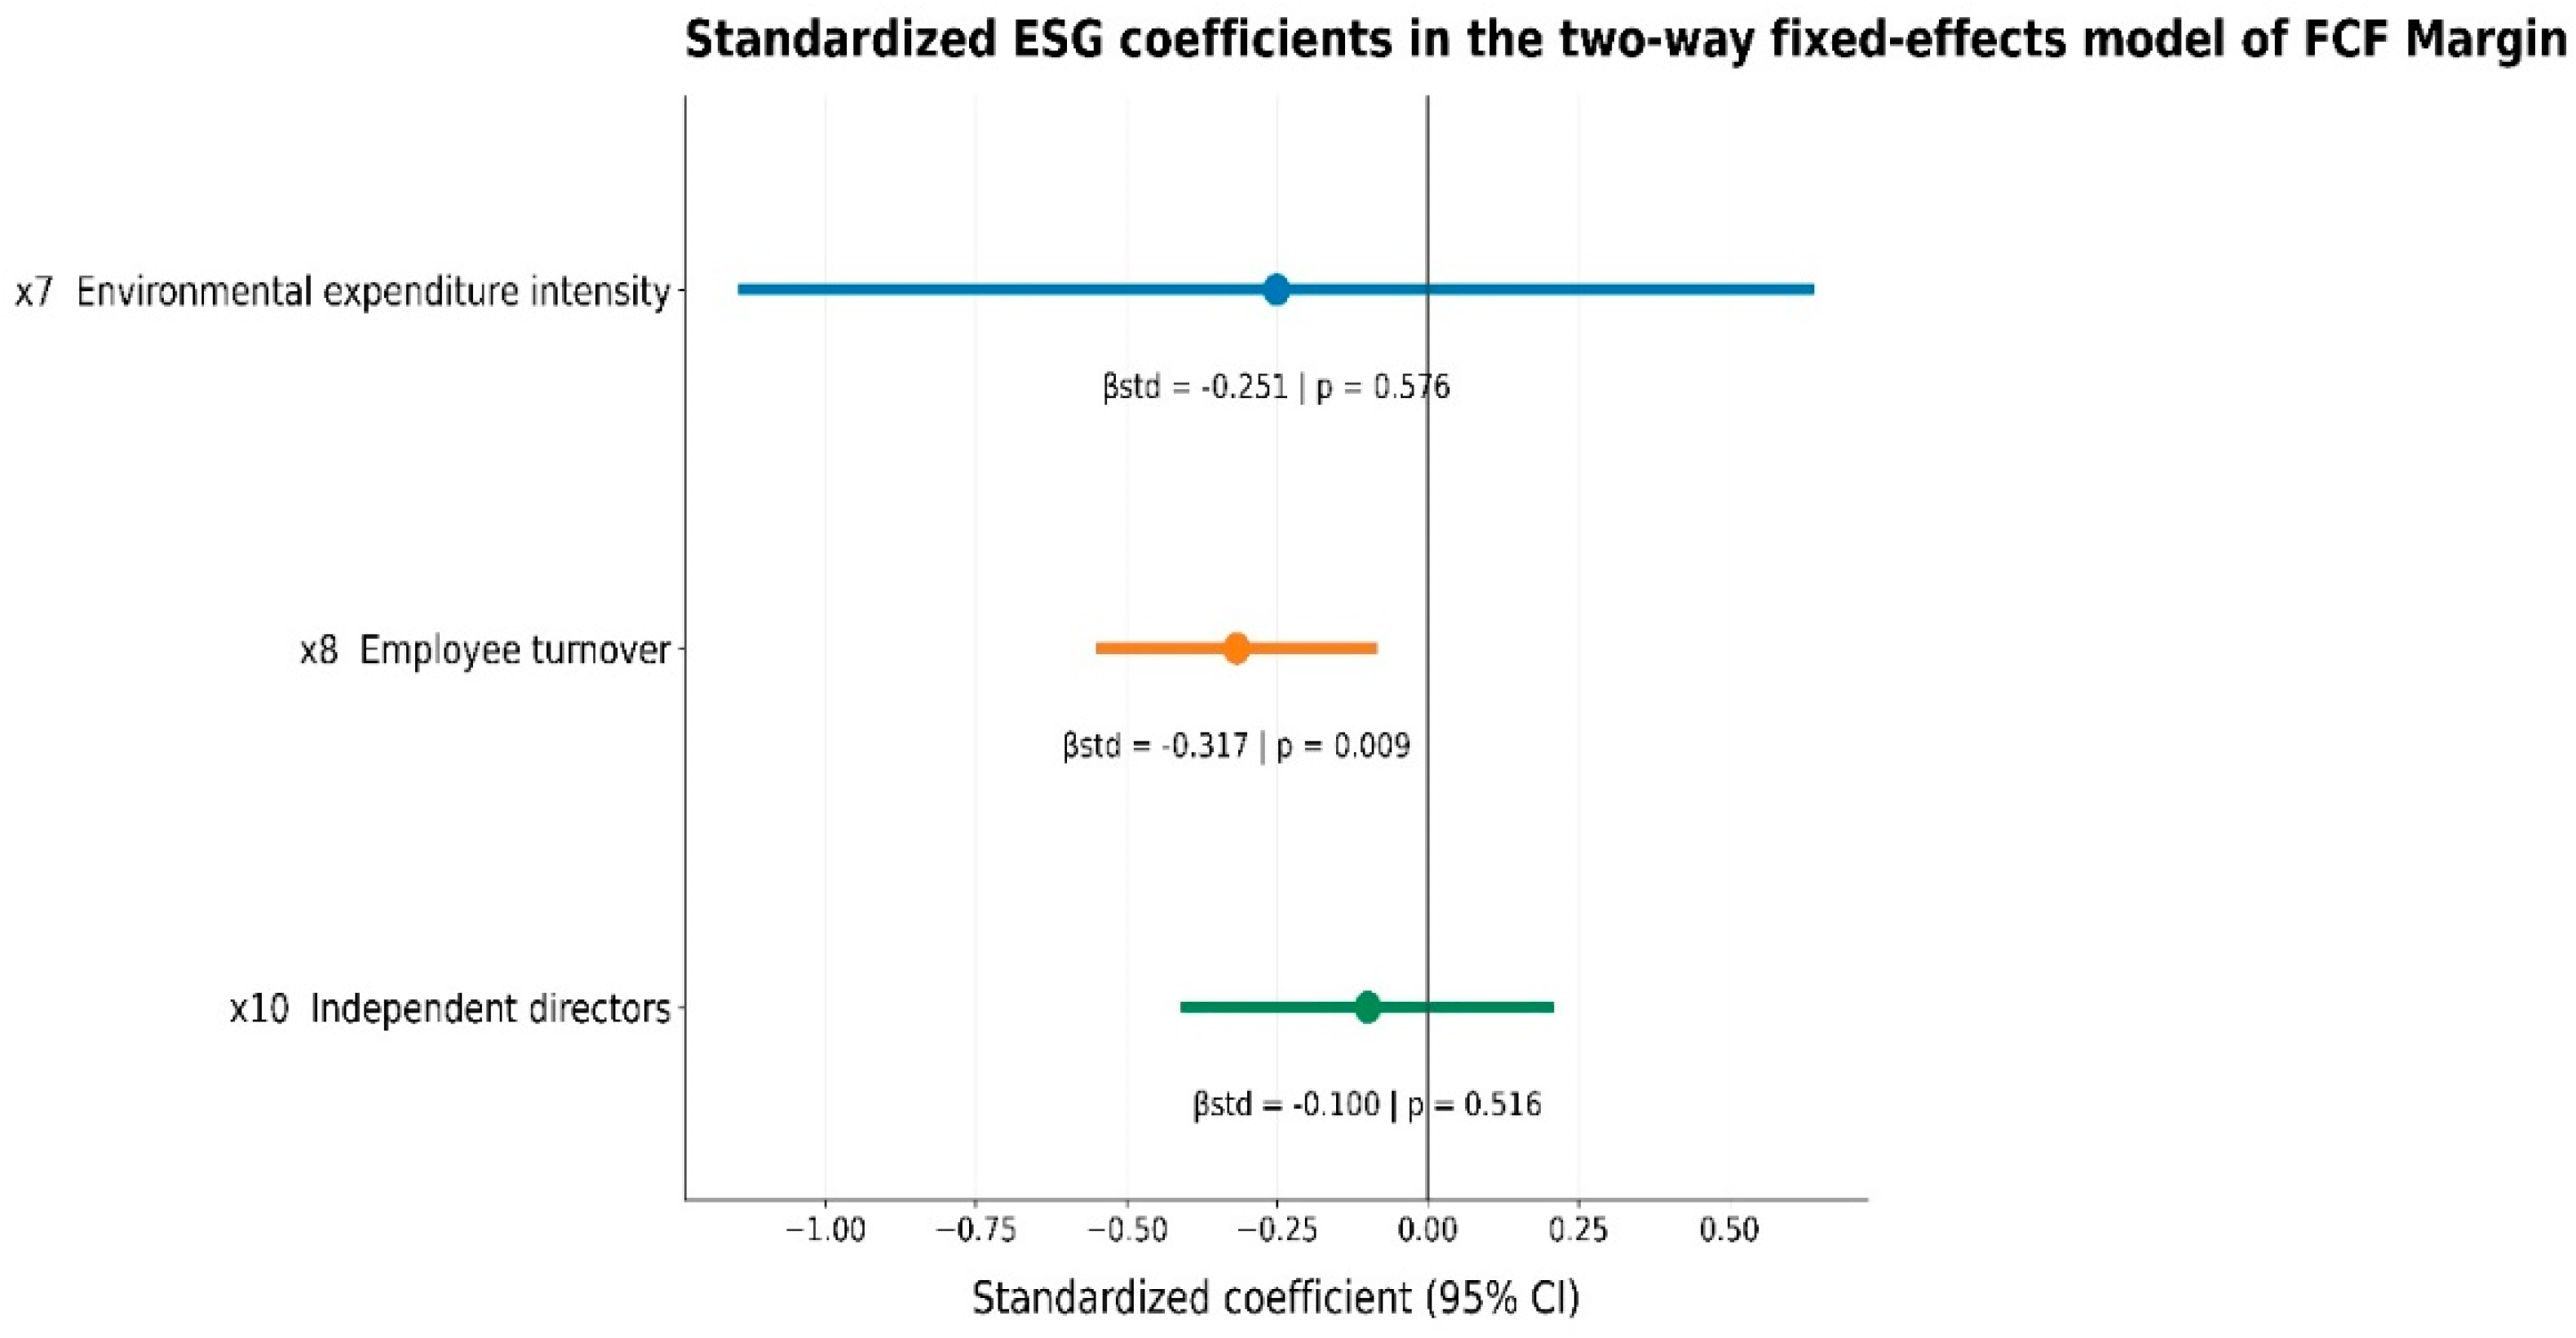
Table 4.
Comprehensive reconciliation of final model specifications and diagnostic results.
| Diagnostic/result | Financial Leverage (LEV) | FCF Margin |
| Core ESG specification | x6+x8+x10 | x7+x8+x10 |
| Hausman test | χ²=6.947; p=0.074 | χ²(3)=231.66; p<0.001 |
| Error diagnostics | Heteroskedasticity + serial correlation | H0 BP heteroskedasticity; Wooldridge p=0.092 |
| Strongest standardized result | x6: βstd = 0.417; p<0.001 | x8: βstd = ‒0.317; p=0.0095 |
| Robustness control | x3; ESG estimate stable | x3; ESG estimate stable |
Joint Interpretation of Models and Implications for Management Accounting
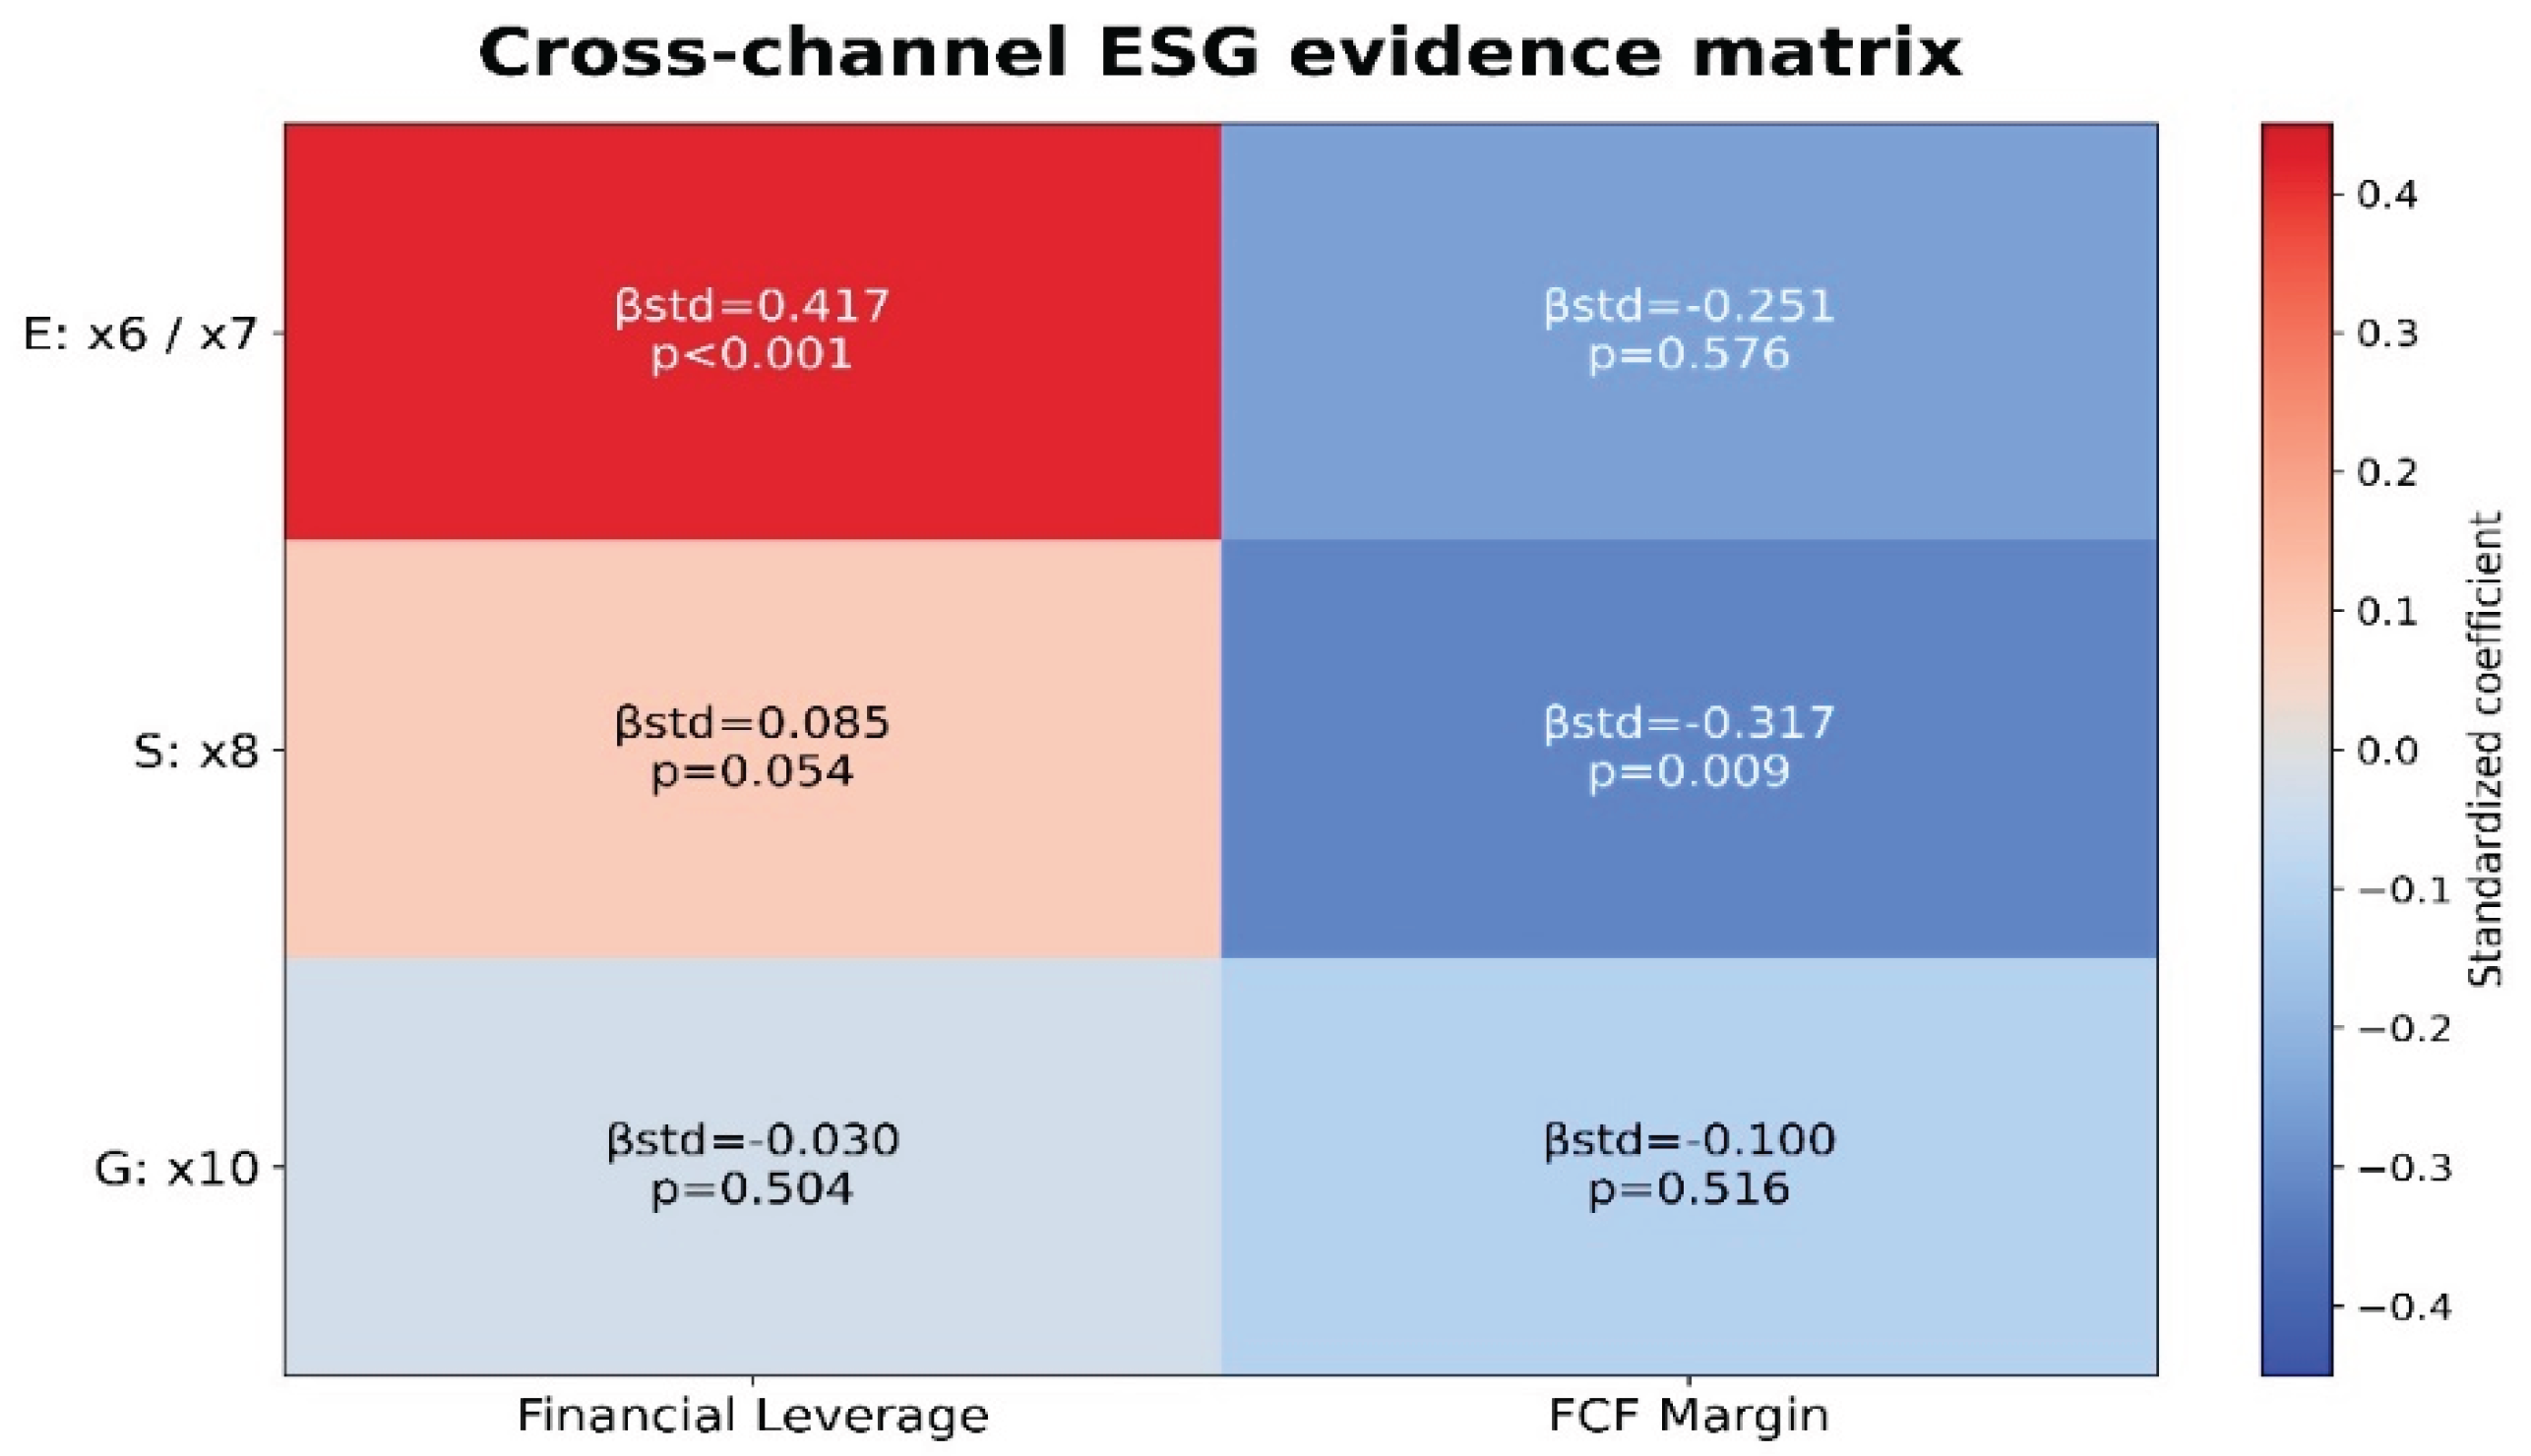
The two models reveal distinct mechanisms through which ESG factors influence corporate financial risk. Model 1 identifies carbon intensity as a primary driver of financial risk related to corporate debt: companies with higher levels of this environmental metric exhibit higher debt levels. Model 2 points to employee turnover as a significant factor affecting cash flows: higher turnover is associated with lower free cash flow margins. For the variable χ²8, the direction of the effect is consistent across all results; calculations indicate that higher employee turnover corresponds to both higher debt levels and a reduced capacity to generate free cash flows. It should be noted, however, that the statistical evidence is stronger for cash flows. Arguments pertaining to corporate governance are considerably weaker; the coefficient for independent directors (χ²10) is negative in both models but remains statistically insignificant. Given that the environmental factors differ between the two models – represented by χ²6 in Model 1 and χ²7 in Model 2 – they cannot be treated as indicators of a single, unified variable. This finding suggests that specific environmental factors play distinct roles depending on the particular channel of financial risk.
Figure 6.
Matrix of interrelationships between ESG indicators and financial risk channels.
From a management accounting perspective, these findings argue for the integration of specific ESG indicators into internal risk analysis processes. Treating ESG reporting merely as a standalone disclosure tool is insufficient. For instance, carbon intensity metrics provide information essential for assessing financing structures and debt burdens, while staff turnover rates serve as an indicator of cash flow stability. This suggests that traditional financial metrics can be effectively supplemented with ESG-based data. In particular, there is a pressing need to incorporate such data into budgeting, performance monitoring, the development of risk dashboards, and the foundation for managerial decision-making.
The study’s results also highlight a shift away from the mechanical aggregation of all ESG variables into a single composite index. The materiality and specific nature of how individual ESG indicators influence financial outcomes vary. An approach that evaluates impacts across distinct areas preserves granular information and ensures transparency regarding how ESG data is utilized in analysis. The research indicates that, for Kazakhstani companies, environmental and social data provide more robust information for assessing financial risks than metrics related to corporate governance quality.
Thus, the models developed and examined in this study demonstrate that financial risks arise through complementary mechanisms rather than as a single, undifferentiated outcome. It is established that ESG effects depend on the specific financial risk channel being evaluated. Assessing these factors collectively makes it possible not only to confirm the existence of a link between ESG factors and financial risks but also to identify the specific financial mechanism through which this relationship manifests.
7. Discussion
The results confirm that ESG integration is linked to corporate risk through environmental, social, and governance channels. Environmental factors influence regulatory and transition risks, social indicators reflect the stability of human capital, and governance factors determine the quality of monitoring and strategic control. This finding is consistent with the results of a study by Sassen et al. (Sassen et al., 2016), which showed that higher ESG scores are associated with lower corporate risk, particularly through environmental and social aspects. Similar data for emerging markets indicate that the risk-reduction effect provided by ESG factors depends on the quality of the institutional framework and the reliability of disclosed information (Jitmaneeroj & Tonghui, 2026; Sassen et al., 2016).
The metrics for carbon intensity, the scale of environmental expenditures, staff turnover, and the presence of independent directors are particularly significant, as these variables represent three distinct channels of ESG-related risk. Carbon intensity – measured as emissions per unit of revenue – reflects transition risk: companies with higher emissions per unit of revenue potentially face greater costs related to decarbonization, environmental regulation, and technological adaptation. This finding aligns with research by Bolton and Kacperczyk (Bolton & Kacperczyk, 2021), who identified a "carbon risk premium" in stock markets. For Kazakhstan, this effect is especially relevant to the oil and gas, mining, transport, and other carbon-intensive sectors. For instance, KMG explicitly incorporates climate risks and decarbonization targets into its sustainability and risk management framework (KMG Published the 2024 Sustainability Report, n.d.).
Staff turnover serves as a channel for both social and operational risks. High turnover can drive up recruitment and training costs, diminish company-specific knowledge, and disrupt operational continuity. M. Bratti et al. (Bratti et al., 2021) show that staff turnover correlates with weaker future performance and increased uncertainty. This interpretation is consistent with the practice of incorporating ESG metrics within the companies studied. Data on staff turnover, training, and occupational health and safety are primarily generated by HR departments and operational units, and are subsequently integrated into internal analyses of ESG factors.
Given that the proportion of independent directors yielded a negative coefficient in both financial risk models – with the relationship proving statistically insignificant – it can be concluded that there is no systematic link between this metric and financial risk within the companies studied. This finding suggests that the mere formal presence of independent directors is insufficient for a comprehensive assessment of the effectiveness of corporate governance mechanisms. In contrast, a study by E. Arioglu (Arioglu, 2021) found that the effectiveness of a board of directors is inversely proportional to a company’s level of risk. Environmental metrics may play a more significant role in carbon-intensive industries, whereas social metrics carry greater weight for labor-intensive sectors. This heterogeneity is consistent with the findings of previous studies, which demonstrate that the nature of the relationship between ESG factors and risks depends on the industry and company characteristics (Sassen et al., 2016).
The situation in Kazakhstan also differs from conditions in developed markets. In Europe and North America, the practice of preparing ESG reports, obtaining external assurance, and analyzing climate risks is generally more standardized and integrated into financial and strategic planning systems. In Kazakhstan, ESG reporting practices are evolving, but the process of institutionalization is uneven. ESG-related data is often generated by individual operational units, whereas international companies increasingly consolidate such information using standardized digital systems. Centralized ESG data infrastructures are primarily found in large companies, such as KMG, QazaqGaz, and KazTransOil. This may account for a less pronounced or more heterogeneous impact of ESG factors on risks.
Thus, digital infrastructure serves as a crucial prerequisite for process efficiency. Integrated ESG platforms enhance data consistency, timeliness, and traceability. Integration with ERP, BI, and IoT systems enables the automation of the collection of environmental and operational metrics. PwC emphasizes that centralized ESG data architectures facilitate high-quality investment planning, supply chain management, and climate risk assessment (PricewaterhouseCoopers, n.d.-b). Consequently, digitalization transforms ESG information – which might otherwise merely reflect past performance – into a risk management tool. Corporate governance complements this process, as ESG information becomes relevant for risk assessment once it is integrated into the decision-making framework. This aligns with international trends, such as the strengthening of the board of directors' role and the implementation of... external assurance of reporting and the assessment of the materiality of information, as documented in the KPMG Survey of Sustainability Reporting 2024 (The Move to Mandatory Reporting, n.d.).
Overall, the study’s findings point to three complementary channels through which ESG-related risks emerge: the carbon intensity of business activities, the resilience of human capital, and the quality of corporate governance. The significance of factors such as the carbon intensity of revenue, staff turnover, and the presence of independent directors corroborates the conclusions of previous research. However, the nature of their impact varies depending on industry specifics, the institutional environment, the level of digital maturity, and the quality of corporate governance.
Practical Implications
These findings have practical significance for integrating ESG-related information into a company’s financial risk management system, rather than treating it merely as a component of corporate reporting.
For CFOs, it is essential to incorporate material ESG metrics into management accounting, budgeting, investment appraisal, and financial planning processes. This enables the assessment of their potential impact on cash flows, operating and capital expenditures, financing terms, and the cost of capital – alongside traditional financial indicators. Such an approach aligns with IFRS S1 and S2 standards, which link sustainability-related risks and opportunities to an organization’s cash flows, access to finance, and cost of capital (IFRS. Sustainability. Introduction to the ISSB and IFRS Sustainability Disclosure Standards., n.d.).
For risk management professionals, material ESG metrics can be integrated into risk dashboards and early-warning systems. Rather than relying solely on aggregate ESG ratings, these systems should identify specific, individual metrics. These metrics must have a demonstrated link to risks, and their fluctuations should be monitored against pre-established thresholds. This approach is consistent with the COSO ERM framework, which emphasizes the integration of emerging risks with strategy and performance (COSO - Enterprise Risk Management, n.d.).
For departments responsible for ESG and sustainability, a key priority is to strengthen their analytical role within the management decision-making process. These units can coordinate information flowing from various functional responsibility centers and translate key metrics into KPIs that are meaningful for risk management. This would allow for a tighter integration of existing ESG data collection processes with management accounting and the risk management system. Such an approach is also consistent with KPMG’s recommendations regarding the combination of a decentralized distribution of operational ESG tasks with strengthened strategic coordination of sustainability-related activities (KPMG - ESG Target Operating Model, n.d.).
For investors, linking specific ESG indicators to particular channels through which they influence financial risks can enhance the value of sustainability-related information for decision-making. Comparable, industry-specific, and financially material ESG indicators can facilitate a more informed assessment of a company’s future risks and financial prospects. This aligns with the investor-focused architecture of the standards developed by the ISSB (IFRS Foundation). Overall, the practical significance of this research lies in the integration of ESG information into risk management frameworks. In this context, material non-financial indicators complement traditional financial metrics across areas such as management accounting, risk monitoring, corporate control, and investment analysis.
8. Conclusions
This study examines the integration of ESG data into corporate financial risk management, utilizing panel data from six large Kazakhstani companies for the period 2017–2024. The findings confirm that ESG factors are relevant to corporate risk, although their impact varies across specific indicators. Carbon intensity of revenue and staff turnover were identified as the most significant factors, representing channels for environmental and social/governance risks, respectively. Consequently, both hypotheses (H1 and H2) are supported.
The results contribute to the existing literature by framing ESG data not merely as a component of sustainability disclosure, but as a source of information for identifying and assessing financial risks. The analysis further indicates that ESG units are increasingly performing functions economically analogous to management accounting and analysis – providing leadership with data for performance evaluation, resource allocation, monitoring, and decision-making. This is consistent with observed practices within ESG departments, sustainability offices, and related functional units. However, the expanding analytical role of ESG units may blur the lines of responsibility between sustainability, finance, and risk management functions, potentially creating gaps in data ownership and accountability. At the same time, this functional convergence offers opportunities to develop a cross-functional ESG risk management framework. Such an approach allows financial analysis to be complemented by expert professional insight into sustainability, without duplicating existing management functions.
From a practical perspective, these findings also support a shift from simply expanding the set of ESG metrics toward selecting them based on the criterion of financial risk-materiality. Integrating such metrics into management accounting and risk monitoring makes it possible to develop ESG-based risk indicators capable of identifying non-financial sources of risk before they are fully reflected in traditional financial indicators.
Limitations and Future Research
When interpreting the results, several limitations should be taken into account. The sample is limited to six large companies; however, these were selected because they provide the most consistent data on ESG performance over the study period and represent the key ESG-sensitive sectors of Kazakhstan’s economy. Thus, the relatively small sample size reflects the current stage of ESG reporting development rather than an arbitrary design constraint. Differences in disclosure formats also limit direct comparability between companies and preclude the inclusion of a broader range of firms. At the same time, this heterogeneity is significant in itself, as it illustrates the absence of fully standardized methods for handling ESG data in an emerging market. While publicly disclosed information may not fully capture internal risk management processes, it remains the most transparent and verifiable source for cross-corporate benchmarking and management analysis. Consequently, these limitations do not diminish the scientific value of the study; rather, they define the institutional context in which ESG integration is currently evolving in Kazakhstan.
Future research could focus on improving the comparability and analytical usefulness of ESG information, rather than simply extending the observation period. One promising avenue is the development of standardized procedures for converting disparate ESG data into comparable metrics at the individual company level. Further research might combine quantitative analysis with case studies, expert interviews, and internal management data (where available and accessible). Another area of inquiry involves examining how ESG metrics are integrated into budgeting, investment appraisal, risk dashboards, and management control systems. Future studies could also test alternative financial risk indicators and assess the sensitivity of results to different methodologies used to construct ESG data. Such approaches will provide a deeper understanding of how ESG information is transformed from a disclosure resource into a practical tool for managing corporate financial risks.
Author Contributions
Conceptualization – N.А. and A.A.; methodology – N.А. and A.A.; software – A.M. and A.O.; validation – A.O., R.A. and G.S.; formal analysis – N.A. and A.A.; investigation – A.O.; resources – G.S.; data curation – R.A. and N.A.; writing – original draft preparation – N.A.; writing-review and editing – A.A.; visualization – A.O. and A.M.; supervision – A.A.; project administration – A.M. All authors have read and agreed to the published version of the manuscript.
Funding
This research received no external funding.
Institutional Review Board Statement
Not applicable.
Informed Consent Statement
Not applicable.
Data Availability Statement
The data presented in this study are openly available in the Mendeley Data Repository under the following DOI: 10.17632/d4jyhngs4z.1 and at the following link: https://data.mendeley.com/preview/d4jyhngs4z (accessed on 6 November 2026).
Conflicts of Interest
The authors declare no conflicts of interest.
Abbreviations
The following abbreviations are used in this manuscript:
| MDPI | Multidisciplinary Digital Publishing Institute |
| DOAJ | Directory of open access journals |
| TLA | Three-letter acronym |
| LD | Linear dichroism |
| ESG | Environmental, Social, Governance |
| FCF | Free Cash Flow |
| CAPEX | Capital Expenditure |
| CSR | Corporate Social Responsibility |
| KPI | Key Performance Index |
| OLS | Ordinary least squares |
| ERP | Enterprise Resource Planning |
| HSE | Health, Safety, Environment |
Appendix A
Table A1.
Results of a literature review on the role of ESG information in financial risk management.
Table A1.
Results of a literature review on the role of ESG information in financial risk management.
| Research | Method | Object | Risk/ESG factor | ESG data to risk information transformation mechanism | Recommendations/Main Conclusions |
| Tsai et al., 2026 | Quasi-experiment panel | 1,500 companies in Taiwan, 2010–2019 | ESG disclosure ESG incidents |
Disclosure – transparency – monitoring – ESG control | Mandatory disclosure reduces regulatory violations, fines, and ESG-related incidents. |
| Jitmaneeroj & Tonghui, 2026 | Panel regression | Companies in 7 emerging markets, Asia-Pacific, 2010–2022 | ESG, firm-specific risk | ESG- information credibility – idiosyncratic risk | The impact of ESG factors depends on the level of corruption and the stage of economic development. |
| Liu et al., 2026 | Empirical analysis | Chinese publicly listed companies, 2012–2022 | Green cognition, greenwashing | Executive cognition – ESG reporting quality – greenwashing risk | Higher "green cognition" (awareness/understanding of green issues) lowers the risk of greenwashing. |
| Karunarathne et al., 2026 | Panel OLS | 12517 firms from G7 countries, 2002-2021 | Political risk ESG controversies | Political risk -ESG controversy – reputational exposure | There is a direct positive correlation between political risk and ESG controversies. |
| Pham & Trung, 2026 | FE panel, DUVOL | Vietnam, 187 companies, 2018–2024 | ESG disclosure, crash risk |
Disclosure -information environment – crash risk | The relationship is non-linear; the sheer volume of disclosure is not sufficient on its own. |
| Suhasmoro et al., 2026 | Panel FE, forward – looking model | Asia-Pacific 1858 firms, 2017-2023 | ESG controversies | ESG -controversy- reputation – WACC/value | Controversies increase the cost of capital and alter the overall ESG effect. |
| Ma et al., 2026 | FE, mediation, 2 SLS, PSM | 1939 Chinese firms. 2010-2022 | Managerial sentiment, ESG, default risk | Non-financial signal – ESG rating – finan-cial constraints – default risk | ESG ratings serve as one channel for reducing default risk. |
| Lohia & Maji, 2026 | FE panel | 12606 observations 12 Asia -Pacific countries. 2013-2023 | ESG controversies | Controversy – stakeholder reaction – financial loss | The impact of a controversy depends on the level of investor protection and geopolitical risk. |
| Sun et al., 2026 | High dimensional FE, DID/ robustness | 3143 Chinese firms, 2010-2021 | ESG, innovation, risk appetite | ESG – innovation willingness – investment decision | ESG factors influence managerial behavior and innovation. |
| Rafi, 2026 | Local projections | 23 markets, 2002-2025 | Sustainability uncertainty | ESG uncertainty – regulatory signal – market repricing | The response depends on the specific ESG regulatory regime. |
| Polat et al., 2026 | Robust panel, PCA | EU countries. 2010-2022 | Climate degradation, ESG | Climate data – ESG performance – financial development | Climate-related pressure negatively affects ESG performance; carbon pricing and more robust disclosure are required. |
| Borsuk & Shrimali, 2026 | Credit risk analysis | Major emerging economy. 647 firms, 2005-2023 | Carbon risk | Emissions – carbon exposure – PD- credit risk | High emissions increase the probability of default. |
| Zhao et al., 2026 | Text analysis, LLM, panel | China, 578 listed non-financial firms, 2008-2022 | Climate policy uncertainty | Corporate disclosure – FCPUE – distress/ liquidity – credit spread | ESG disclosure mitigates the impact of climate-policy uncertainty on financial spreads. |
| Karim et al., 2026 | Bibliometric analysis | 72 Scopus publications | Green fintech, ESG analytics | Digital ESG data – transparency – climate finance | AI, blockchain, and ESG analytics expand the capabilities for working with ESG data. |
References
- Arioglu, E. Board age and value diversity: Evidence from a collectivistic and paternalistic culture. Borsa Istanbul Review 2021, 21(3), 209–226. [Google Scholar] [CrossRef]
- Berg, F.; Kölbel, J. F.; Rigobon, R. Aggregate Confusion: The Divergence of ESG Ratings. Review of Finance 2022, 26(6), 1315–1344. [Google Scholar] [CrossRef]
- BHP Climate-related physical risk and adaptation. n.d. Available online: https://www.bhp.com/sustainability/climate-change/climate-related-physical-risk-and-adaptation.
- Bolton, P.; Kacperczyk, M. Do investors care about carbon risk? Journal of Financial Economics 2021, 142(2), 517–549. [Google Scholar] [CrossRef]
- Borsuk, M.; Shrimali, G. Carbon risk and corporate creditworthiness: Evidence from a major emerging economy. Energy Economics 2026, 158, 109315. [Google Scholar] [CrossRef]
- Bratti, M.; Conti, M.; Sulis, G. Employment protection and firm-provided training in dual labour markets. Labour Economics 2021, 69, 101972. [Google Scholar] [CrossRef]
- COSO - Enterprise Risk Management COSO. n.d. Available online: https://www.coso.org/enterprise-risk-management.
- Friede, G.; Busch, T.; Bassen, A. ESG and financial performance: Aggregated evidence from more than 2000 empirical studies. Journal of Sustainable Finance & Investment 2015, 5(4), 210–233. [Google Scholar] [CrossRef]
- Gillan, S. L.; Koch, A.; Starks, L. T. Firms and social responsibility: A review of ESG and CSR research in corporate finance. Journal of Corporate Finance 2021, 66, 101889. [Google Scholar] [CrossRef]
- IFRS. Sustainability. Introduction to the ISSB and IFRS Sustainability Disclosure Standards.; IFRS, n.d.; Available online: https://www.ifrs.org/sustainability/knowledge-hub/introduction-to-issb-and-ifrs-sustainability-disclosure-standards/.
- Integrated Annual Report of JSC "NC “QazaqGaz” (KZTG) – Kazakh stock exchange (KASE) (in russian). n.d. Available online: https://kase.kz/files/emitters/KZTG/kztgp_2023_rus.pdf.
- Jitmaneeroj, B.; Tonghui, T. ESG and firm-specific risk: The moderating effects of corruption and economic development in Asia-Pacific emerging markets. Humanities and Social Sciences Communications 2026, 13(1), 1035. [Google Scholar] [CrossRef]
- JSC «NC «QazaqGaz» – Sustainable development. n.d. Available online: https://qazaqgaz.kz/en/socialnaya-otvetstvennost.
- Karim, R.; Roshid, Md. M.; Dhar, B. K.; Waaje, A. Mapping green fintech and sustainability transitions: A bibliometric analysis of digital finance research. Sustainable Futures 2026, 12, 102074. [Google Scholar] [CrossRef]
- Karunarathne, D.; Luong, H.; Kuruppuarachchi, D. Firm-level political risk and ESG controversies: International evidence. Meditari Accountancy Research 2026, 34(7), 97–136. [Google Scholar] [CrossRef]
- Kazchrome awarded the Responsible Chromium Label Kazchrome. n.d. Available online: https://www.kazchrome.com/en/media/news/kazchrome_awarded_the_responsible_chromium_label/://www.kazchrome.com/en/media/news/kazchrome_awarded_the_responsible_chromium_label/.
- Kazchrome – Disclosures – Annual Report; Kazchrome, n.d. Available online: https://www.kazchrome.com/en/investors/disclosures/://www.kazchrome.com/en/investors/disclosures/.
- «KazTransOil» JSC - Annual reports. n.d. Available online: https://kaztransoil.kz/en/to_shareholders_and_investors/annual_reports/.
- KMG Energy Consumption and Energy Efficiency – Sustainability Report 2025. n.d. Available online: https://www.kmg.kz/interactive/report_2025/en/environmental-energy-efficiency.html.
- KMG Published the 2024 Sustainability Report. n.d. Available online: https://www.kmg.kz/en/press-center/press-releases/our-2024/.
- KPMG - ESG Target Operating Model; KPMG, n.d.; Available online: https://kpmg.com/de/en/services/audit/sustainability-reporting-and-governance/ESG-Target-Operating-Model.html.
- KTZh – Financial statements. n.d. Available online: https://railways.kz/en/investors/financial-statements/.
- Lee, J.; Koh, K.; Rachel. ESG performance and firm risk in the U.S. financial firms. Review of Financial Economics 2024, 42(3), 328–344. [Google Scholar] [CrossRef]
- Liu, G.; Lin, Y.; Wang, H.; Liu, Z. Executive green cognition, risk preference, and ESG greenwashing. Humanities and Social Sciences Communications 2026, 13(1), 1329. [Google Scholar] [CrossRef]
- Lohia, P.; Maji, S. G. When do ESG controversies erode firm value? The role of investor protection and geopolitical risks. Borsa Istanbul Review 2026, 26(5), 100847. [Google Scholar] [CrossRef]
- Ma, E.; McDowell, S.; Onuk, C. B.; Zhang, J. Managerial Sentiment and Default Risk: Evidence from China. Journal of Risk and Financial Management 2026, 19(2), 128. [Google Scholar] [CrossRef]
- Maersk: Decarbonising our Ocean business. n.d. Available online: https://www.maersk.com/sustainability/climate/decarbonising-ocean-shipping.
- Maersk: We act as a catalyst for the energy transition in shipping and logistics. n.d. Available online: https://www.maersk.com/sustainability/climate.
- NAC Kazatomprom: Operating and Financial Review for 2025. 20 March 2026. Available online: https://www.kazatomprom.kz/en/investors/finansovaya_otchetnost/page-1.
- NBIM: Norges Bank Investment Management. Responsible investment 2025; Norges Bank Investment Management, 26 February 2026; Available online: https://www.nbim.no/en/news-and-insights/reports/2025/responsible-investment-2025/.
- Pham, N. T.; Trung, H. L. T. Too Much of a Good Thing? ESG Disclosure, the Social Dimension, and Future Stock Price Crash Risk Evidence of a Nonlinear Effect from an Emerging Market. Journal of Risk and Financial Management 2026, 19(7), 541. [Google Scholar] [CrossRef]
- Polat, M. A.; Radulescu, M.; Yürük, M. F.; Güngör, H. Y.; Şi̇t, A. The impact of climate degradation originating from the aviation sector on financial development and ESG index: EU member states’ case. Journal of Air Transport Management 2026, 137, 103067. [Google Scholar] [CrossRef]
- PricewaterhouseCoopers. PwC’s Global Investor Survey 2025; Pwc, n.d.-a; Available online: https://www.pwc.com/gx/en/1/issues/c-suite-insights/global-investor-survey.html.
- PricewaterhouseCoopers. PwC’s Global Sustainability Reporting Survey; PwC, n.d.-b; Available online: https://www.pwc.com/gx/en/issues/esg/global-sustainability-reporting-survey.html.
- Private investment insights: McKinsey on investment | Private Capital | McKinsey & Company. n.d. Available online: https://www.mckinsey.com/industries/private-capital/our-insights/mckinsey-on-investing.
- Rafi, M. K. H. Sustainability uncertainty and stock prices: Conditional effects across regulatory regimes. International Review of Economics & Finance 2026, 109, 105442. [Google Scholar] [CrossRef]
- Tinto, Rio. Strategic context. n.d. Available online: https://www.riotinto.com/en/invest/reports/annual-report/strategic-context.
- Sassen, R.; Hinze, A.-K.; Hardeck, I. Impact of ESG factors on firm risk in Europe. Journal of Business Economics 2016, 86(8), 867–904. [Google Scholar] [CrossRef]
- Siemens: Sustainability Report 2024; Siemens, n.d. Available online: https://resources.sw.siemens.com/en-US/analyst-report-sustainability-report/.
- Suhasmoro, A. R.; Novianti, T.; Achsani, N. A.; Andati, T. When ESG Signals Fail: The Moderating Role of ESG Controversies in Shaping Firm Value, Returns, and Cost of Capital. Journal of Risk and Financial Management 2026, 19(7), 524. [Google Scholar] [CrossRef]
- Sun, Z.; Du, Q.; Du, A. M. ESG performance as a catalyst for digital innovation: Unveiling the role of firm willingness and risk appetite in Chinese listed companies. International Review of Economics & Finance 2026, 111, 105709. [Google Scholar] [CrossRef]
- Sustainability | BHP. n.d. Available online: https://www.bhp.com/sustainability.
- Sustainability Reports | UBS Global Sustainability and Social Impact. n.d. Available online: https://www.ubs.com/global/en/sustainability-impact/sustainability-reporting.html.
- The Move to Mandatory Reporting: KPMG’s 2024 Survey of Sustainability Reporting; KPMG, n.d.; Available online: https://kpmg.com/us/en/media/news/the-move-to-mandatory-reporting-2024.html.
- Tsai, C.; Wang, Y.-K.; Wu, S.-Y. The effects of mandatory corporate social responsibility disclosure on corporate ESG performance: Evidence from quasi-experiments in Taiwan. Cogent Business & Management 2026, 13(1), 2608438. [Google Scholar] [CrossRef]
- Unilever: Addressing climate change with action; Unilever, n.d.; Available online: https://www.unilever.com/sustainability/climate/.
- Zhao, Y.; Manaf, K. B. bin A.; Ayoup, H. bt. ESG, Climate Risk, and Debt Management – Evidence from Chinese Listed Companies. International Journal of Financial Studies 2025, 13(3), 118. [Google Scholar] [CrossRef]
- Zhao, Y.; Nagayasu, J.; Tian, J.; Geng, X. Corporate bond pricing under climate policy uncertainty: Evidence from firm-level exposure. Structural Change and Economic Dynamics 2026, 79, 459–481. [Google Scholar] [CrossRef]
Figure 1.
Transformation of ESG data in ESG research. Note: prepared by the authors.

Figure 2.
Conceptual Framework. Note: prepared by the authors.
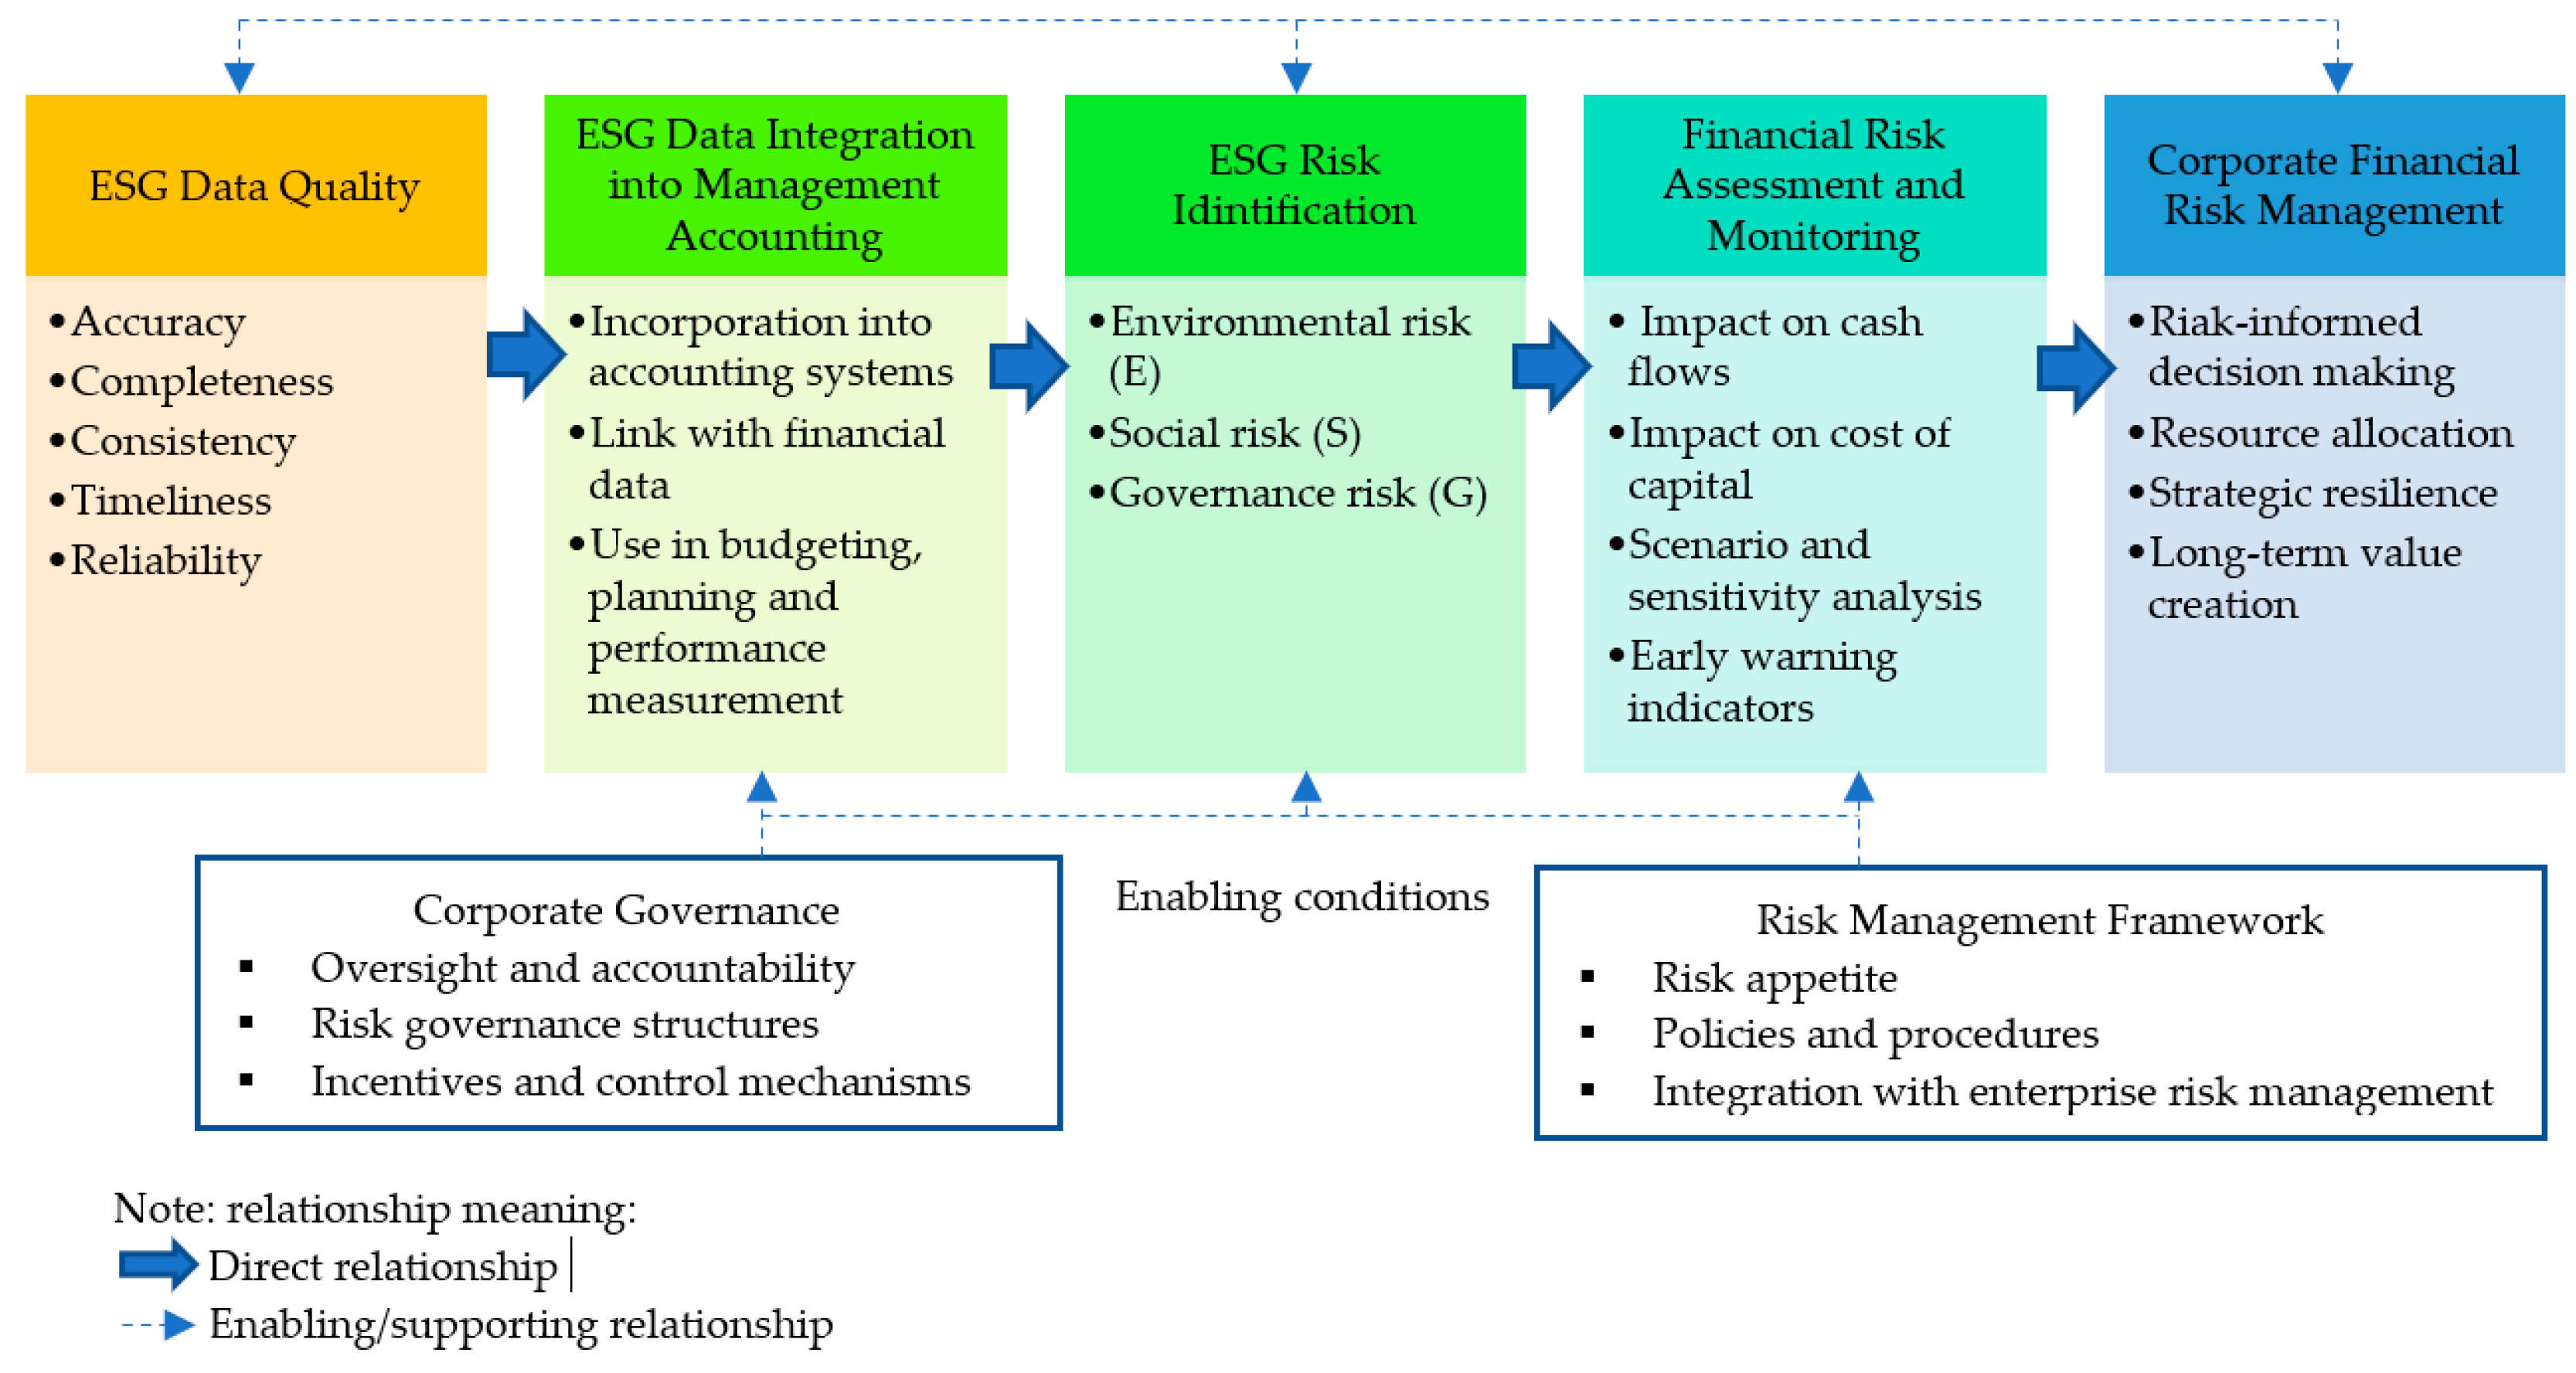
Disclaimer/Publisher’s Note: The statements, opinions and data contained in all publications are solely those of the individual author(s) and contributor(s) and not of MDPI and/or the editor(s). MDPI and/or the editor(s) disclaim responsibility for any injury to people or property resulting from any ideas, methods, instructions or products referred to in the content. |
© 2026 by the authors. Licensee MDPI, Basel, Switzerland. This article is an open access article distributed under the terms and conditions of the Creative Commons Attribution (CC BY) license (http://creativecommons.org/licenses/by/4.0/).
Copyright: This open access article is published under a Creative Commons CC BY 4.0 license, which permit the free download, distribution, and reuse, provided that the author and preprint are cited in any reuse.