
Submitted:
11 November 2026
Posted:
12 November 2026
You are already at the latest version
Abstract
Arabic Sign Language (ArSL) is the main means of communication for many deaf people in the Arab world, and automatic alphabet recognition can support their access to technology and services. However, most existing studies classify static images and evaluate on signers already seen during training, which overestimates real-world performance. To address this, we propose a video-based recognition system that uses hand landmarks only, is evaluated on unseen signers, and is deployed as a live browser–server application. The method uses the 39 alphabet signs of the KArSL-502 dataset, MediaPipe hand landmarks normalized to wrist and palm size, and three models (Transformer, BiLSTM and temporal convolutional network), evaluated with leave-one-signer-out validation, five seeds and exact McNemar tests with Holm correction. Across 15 leave-one-signer-out runs on the three KArSL signers, the augmented Transformer with a 28-frame input achieved a mean accuracy of 79.42 ± 6.81% and a mean top-5 accuracy of 95.34 ± 3.20%. Averaging the five seed predictions within each held-out fold yielded a pooled accuracy of 81.67%. In a single-participant live feasibility test using a separately trained deployment checkpoint, 235 of 255 displayed predictions were correct (92.16%). The median time from the first frame with a detected hand to the displayed result was 1.43 s. These results describe recognition of isolated alphabet signs in the three-signer benchmark and the feasibility of the live prototype under the tested conditions.
Keywords:
Arabic sign language
; fingerspelling
; alphabet recognition
; signer-independent evaluation
; hand landmarks
; MediaPipe
; transformer
; real-time recognition
1. Introduction
Fingerspelling enables signers to spell names, technical terms or words letter by letter [1]. Automatic recognition of manual alphabets can support communication between deaf and hearing persons and could assist people who study sign languages. Video-based sign language recognition has advanced significantly due to deep learning. Nevertheless, as noted in a recent review, the accuracy of the model falls with signers not included in the training dataset [2].
As for the Arabic Sign Language (ArSL) alphabet, earlier studies relied mostly on still images. Convolutional and hybrid models achieve high accuracy results on the images of letters, belonging to ArSL [3,4]. What is important to mention is that in many of these studies image datasets were divided into training and testing sets randomly [3,4]. It means that images of the very same signer can appear in both groups. This can be regarded as the evaluation of sign language recognition systems performance based on signer-dependent methodology. Additional researchers state that some letters of the Arabic sign language alphabet have very similar hand shapes [5,6].
This approach can be misleading, because it may overestimate what the model has learned: a model trained on a particular signer gets an opportunity to recognize the patterns of the same signer [7]. When the signer is new, accuracy drops in both fingerspelling and word recognition [8,9,10]. This gap is large with KArSL, the main video dataset for ArSL. KArSL-502 has digits, letters and word signs presented in it, recorded by three signers [9,11,12], and the signer-independent results on this dataset remain far below the signer-dependent performance [11,12,13,14].
A number of manual alphabets possess letter forms that rely on movement instead of solely hand shape [15,16,17]. Static pictures cannot depict movement [8], and research involving other sign languages has argued for temporal models of dynamic fingerspelling [18]. KArSL’s signs with hamza or madda are the longest signs in the alphabet (Section 4.1), which suggests that there is another movement that takes place after that of the base letter. Therefore, it becomes important to employ a video-based model for full alphabet recognition.
Hand landmarks constitute a minimal input for the model. Pose-based models are compact and quick enough for real-time use [14,19]. In addition, skeletal data do not have any identifiable facial features [20]. However, many studies leave to future works the test of the model in real time [5,14,21], while a recent review suggests testing models with deployment criteria such as inference latency [2]. Also, comparisons between models are often given as single numbers without paired statistical tests [22], and common tests such as the paired t-test are often used in the wrong way [23].
The present paper attempts to bridge the outlined deficiencies in the studies of the ArSL alphabet. This study presents the evaluation of the video recognition of the 39 alphabet signs of KArSL-502 only on the basis of hand landmarks, employing a leave-one-signer-out paradigm, alongside the method of paired statistical tests and a live test of the deployed application. The contributions of the paper are as follows:
- Evaluation of three sequence models, namely Transformer, bidirectional long short-term memory (BiLSTM) and temporal convolutional network (TCN), using no augmentation and augmentation at three input lengths, three folds and five seeds in total (195 training runs). Under this three-signer protocol, the deployed Transformer model had a mean signer-independent accuracy of 79.42 ± 6.81% and a top-5 accuracy of 95.34 ± 3.20% on the held-out signers.
- Performing paired comparisons based on the same 5,843 videos with the help of exact McNemar tests, bootstrap confidence intervals and Holm correction. The gains from augmentation and from the Transformer were statistically significant after Holm correction and were observed on all three test signers, while longer inputs showed no consistent overall accuracy gain.
- Carrying out a per-letter error analysis that revealed the tendency for errors to take place in cases of alif and hamza forms and in the yaa group.
- Conducting robustness tests for camera frame rate, window shift, missing detections, noise from the landmarks, and mirroring, together with CPU timing (2.496 ms per sign for the deployed model).
- Creating a browser–server web application that runs the same preprocessing and model code as the experiments, and a single-participant live feasibility test in which the first author, who is not a KArSL signer, obtained 235 correct of 255 displayed predictions (92.16%), with a median time of 1.43 s from the first frame with a detected hand to the displayed result.
The rest of the paper is organized as follows. The second section reviews the related work. The third section focuses on the data, models, and means of evaluation. In section four, the results are presented while section five discusses them, and section six concludes the paper.
2. Related Work
2.1. Static-Image Recognition of the ArSL Alphabet
The majority of research with regard to the ArSL alphabet focuses on the classification of still images. Al Ahmadi et al. implemented transfer learning using a pre-trained residual network applied to 3 ArSL image datasets [3]. Alasmari enhanced the features from images using text embeddings when creating a lightweight model [4]. Alasmari and Asiri used a residual encoder and U-Net like architecture [5]. Alamri et al. employed YOLOv8 for the detection and tested it in real time with non-professional signers [6]. Shin et al. used both the distances and the angles between hand landmarks, together with deep learning features, and also tested their model on an ArSL image dataset [21]. The study conducted by Yayla et al. focused on the classification of MediaPipe landmarks using still images for the Turkish, Arabic, and American alphabets [24].
Most of these studies report high accuracy; however, they usually rely on random splits of the data [3,6], where the images of each signer get mixed for training and testing purposes. Moreover, static pictures cannot convey letters that require a certain movement. This shortcoming has also been mentioned in regard to the static fingerspelling recognition [8].
2.2. Landmark-Based and Real-Time Fingerspelling Recognition
Landmark-based data are widely used in real-time alphabet systems for other sign languages as well. Alsharif et al. used MediaPipe keypoints together with a YOLOv11 detector for the American Sign Language (ASL) alphabet [25]. Ali et al. calculated distances between the MediaPipe landmarks and applied classical classifiers for New Zealand Sign Language, and ran the system on a web camera [17]. MediaPipe landmarks were drawn on images of Mexican Sign Language letters and were tested on individuals who were not included in the training process, as reported by Sánchez-Vicinaiz et al. [16]. In addition, Uddin et al. utilized MediaPipe and a long short-term memory (LSTM) network for the recognition of the Norwegian Sign Language numerals [19]. A hybrid variant of convolutional neural networks (CNN) with Vision Transformers was reported by Aly and Fathi as a fast model designed for the analysis of the images depicting ASL [26]. Morillas-Espejo and Martinez-Martin created a real-time platform for the analysis of Spanish letters with a test set from a new person, in which the letters that include movement turned out to be the most difficult [15]. Static ASL fingerspelling was evaluated by Mohamed et al. with the help of the leave-one-signer-out cross-validation approach and paired tests [8].
The researchers Kondo et al. developed a model for dynamic fingerspelling that relies on the solution involving finger angle features obtained through MediaPipe and combined the design of Vision Transformers with convolutional neural networks (CNN) [27]. Also, Hirooka et al. created a model based on a spatial–temporal Transformer with the use of skeleton information, with user-independent splits [18]. According to Kang et al., trajectory and velocity features were combined with a large language model in their model for the analysis of Japanese words [1]. Outside sign language, Habib et al. showed that skeleton-based gesture recognition can run in real time on consumer hardware [20].
2.3. Video-Based and Signer-Independent ArSL Recognition on KArSL
So far, not so many studies are available that report signer-independent results on KArSL. For instance, the research of Alamri et al. dealt with deep CNN and involved transformed skeletal features, trained on two signers and tested on the third [11]. The study of Alyami et al. described the combination of MediaPipe hand and facial feature points with LSTM, TCN and Transformer models on KArSL-100 under the same protocol, where the Transformer gave the best signer-independent result [14]. The study of Kausar et al. combined keypoint and shape descriptors with attention and an LSTM; however, their paper states both that the official KArSL splits were used and that each signer was kept in either the training or the test set, which makes their protocol unclear [9]. The researchers Almufareh et al. focused on RGB crops of the 39 KArSL letters with the help of the existing Swin-Transformer model and LSTM, which is the closest task to the present one [13]. Algabri et al. emphasized that in their work on a Saudi sign language dataset with more signers, the number of training signers affected accuracy more than the number of repetitions [10]. None of these KArSL studies reports a live test, and none compares models with paired statistical tests.
2.4. Evaluation Practice
On the issue of evaluation, signer-dependent testing can overstate effectiveness [7]. Moreover, a recent review stated that signer-independent protocols need to be a standard requirement in the area [2]. For two classifiers evaluated on the same set of signs, using paired testing is recommended [22,23]. With cross-validation, t-tests on fold accuracies are problematic because the training folds overlap, while McNemar’s test can be applied to the pooled predictions of one round [28].

Table 1.
Comparison of related studies with the present work. SD = signer-dependent; SI = signer-independent. ASL = American Sign Language; JSL = Japanese Sign Language; KSL = Korean Sign Language; LSE = Spanish Sign Language; MSL = Mexican Sign Language; NSL = Norwegian Sign Language; NZSL = New Zealand Sign Language; TSL = Turkish Sign Language; LLM = large language model.
Table 1.
Comparison of related studies with the present work. SD = signer-dependent; SI = signer-independent. ASL = American Sign Language; JSL = Japanese Sign Language; KSL = Korean Sign Language; LSE = Spanish Sign Language; MSL = Mexican Sign Language; NSL = Norwegian Sign Language; NZSL = New Zealand Sign Language; TSL = Turkish Sign Language; LLM = large language model.
| Study | Input | Model | Dataset | Protocol | SD/SI | Real-Time |
| Al Ahmadi et al. [3] | Static images | Pretrained ResNet | Three ArSL image sets | Random image split | SD | No |
| Alasmari [4] | Static images and text | EfficientNet with text encoder | ArASL2018, ArASL21L | Random image split | SD | No |
| Alasmari and Asiri [5] | Static images | ResNet with U-Net-like part | ArASL2018, ArSL21L | Cross-validation on images | SD | No |
| Alamri et al. [6] | Static images | YOLOv8 | ArSL2018, ArSL21L | Random image split; live test | SD | Yes |
| Shin et al. [21] | Landmark features and images | Handcrafted features with ResNet | KSL, ArSL21L, ASL | Random split | SD | No |
| Yayla et al. [24] | Landmarks from still frames | ConvNeXt, Swin, VMamba | Pooled ArSL, TSL and ASL image sets | Test set; user test with 10 new participants | SD (test set); new users in live test | Yes |
| Alsharif et al. [25] | Images with keypoints | YOLOv11 | ASL alphabet | Random split | SD | Yes |
| Ali et al. [17] | Landmark distances per frame | Random forest and others | NZSL alphabet | Random split | SD | Yes |
| Sánchez-Vicinaiz et al. [16] | Images with drawn landmarks | CNN | MSL static letters | Train on one person, test on others | SI | Yes |
| Uddin et al. [19] | Landmark sequences | LSTM | NSL numbers | Random split | SD | Yes |
| Aly and Fathi [26] | Static images | CNN with Vision Transformer | ASL alphabet | Random split | SD | Speed only |
| Morillas-Espejo and Martinez-Martin [15] | Skeleton images | CNN, RNN, ViViT | LSE alphabet | Test on a new person | SI | Yes |
| Mohamed et al. [8] | Static images | CNN | Massey ASL | Leave-one-signer-out | SI | No |
| Kondo et al. [27] | Landmark angle sequences | Hybrid Vision Transformer–CNN | JSL fingerspelling | Validation split | SD | No |
| Hirooka et al. [18] | Skeleton sequences | Spatial–temporal Transformer | JSL, KSL, WLASL | User-independent split | SI | No |
| Kang et al. [1] | Landmark sequences | TCN, Transformer, LLM | Japanese fingerspelling | Sample-level split | SD | No |
| Alamri et al. [11] | Kinect skeleton | Deep CNN | KArSL-100, -190, -502 | Two signers train, one tests | SD and SI | No |
| Alyami et al. [14] | Landmark sequences (hands, face) | LSTM, TCN, Transformer | KArSL-100 | Two signers train, one tests | SD and SI | No |
| Kausar et al. [9] | RGB keypoints and shape descriptors | Attention fusion with LSTM | KArSL-100, -190, -502 | Unclear (official splits and signer-disjoint folds both stated) | Unclear | No |
| Almufareh et al. [13] | RGB hand and arm crops (video) | Swin Transformer with LSTM | KArSL-502 letters and digits | Per test signer | SD and SI | No |
| Algabri et al. [10] | Landmark sequences | BiGRU with attention | KSU-SSL, ArSL | Signer-dependent and signer-independent | SD and SI | Latency only |
| This work | Hand landmark sequences (video) | Transformer, BiLSTM, TCN | KArSL-502 alphabet (39 signs) | Leave-one-signer-out, five seeds, paired tests | SI | Yes (live test) |
3. Materials and Methods
3.1. Dataset and Cleaning
The hand landmarks of all KArSL-502 [12] alphabet videos were extracted once and stored per signer, partition and sign; they were reloaded for this study without a new extraction. The index lists 5,876 alphabet videos: 1,952 for signer 01, 1,951 for signer 02 and 1,973 for signer 03 (Table 2).
The test partition holds 312 videos per signer, that is, 8 videos for each of the 39 signs. These original partitions were not used for evaluation: all videos of a signer, from both partitions, were assigned to the same fold (Section 3.7).
A video was removed if it had no frames, could not be read, or if MediaPipe detected no hand in any of its frames. No video had zero frames or a read error. Thirty-three videos (0.56%) were removed because no hand was detected in any frame (Figure 1), and all of them belong to signer 03: 25 videos of alif with hamza above (أ, sign 0061) and 8 videos of alif maqsura (ى, sign 0068). The cleaned dataset contains 5,843 videos.
3.2. Hand Landmarks and Data Integrity
For every frame obtained, it was possible to extract hand landmarks using the MediaPipe HandLandmarker (Tasks API, version 0.10.35) [29,30] tool in image mode, detecting at most two hands with a minimum detection confidence of 0.5. Each hand produces 21 landmarks with (x, y, z) coordinates, and therefore, every frame is a vector of dimension 126: 63 values of the hand referred to as “Left” by the MediaPipe tool, and 63 of the hand referred to as “Right.” No frames were mirrored in any way. A zero vector is created for an undetected hand, while a binary frame mask indicates whether or not any hand has been detected.
Before starting the model training, a total of two integrity checks were performed on all 5,843 cleaned videos.
Frame order. Video is presented as a collection of image frames, each having a unique file name, and the position of each frame in the video is known by the number that comes after the letter “c” in its file name. The landmark extraction process read the files according to their names in alphabetical order. So, if these numbers were sorted as text rather than numerically, the order would have been distorted; for instance, it could have led to the situation when frame 10 is read out before frame 2, which would break the temporal order of the recording. To avoid this situation, the frame number was taken from the file name of every frame in all 5,843 videos, and the order in which the frames had been read was checked against their real numeric order. The two orders were identical in every video, so the frame sequences follow the original temporal order of the recordings and no video needed to be reordered.
Hand slots. The first 63 values contain the hand labeled “Left” by MediaPipe, while the last 63 correspond to the hand labeled “Right.” The alphabet signs are performed with one hand, but the KArSL dataset records them alternately with the left and the right hand of the signer [12]. The results can be found in Table 3 as for all three signers about 60% of frames with one hand referred to as “Left” hand, while approximately 40% are from the “Right” hand and both hands appear together in at most 3.7% of frames. This split most likely reflects the alternation of the signing hand in the recordings [12]; since MediaPipe distinguishes between hands based on their appearance [30], some frames may also be labeled with the wrong side. Similar results were obtained for the three signers, so the split does not favor any of them. The landmarks were used as MediaPipe produced them, in the same way as in the live system.
3.3. Video Length Analysis
Sequence models need a fixed input length, so the length of every cleaned video (its number of frames) was measured before the input lengths were fixed. For each of the 39 signs, the minimum, mean, median and maximum length were computed, together with the share of videos longer than each candidate input length, that is, the share of videos that would be truncated.
The 5,843 videos have a mean length of 21.0 ± 6.9 frames (median 21, range 9–70 frames). Three input lengths were compared on this basis:
- 28 frames, the decision window of the deployed live system (0.93 s at 30 frames per second [12]); 11.1% of the videos are longer.
- 29 frames, the 90th percentile of video length; 8.4% of the videos are longer.
- 42 frames, close to the 99th percentile of video length; 1.0% of the videos are longer.
Comparing these lengths shows whether keeping the end of the longer signs improves recognition, or whether the shortest window, which gives the fastest live response, can be used without a loss in accuracy. The results of this comparison are reported in Section 4.2 and Section 4.3.
3.4. Preprocessing and Datasets
Each detected hand was normalized on its own, frame by frame, so that the features do not depend on where the hand is in the image, how far it is from the camera, or how large it is. For hand h in frame t, the wrist landmark p₀ becomes the origin, and all 21 landmarks are divided by the distance between the wrist and the base of the middle finger (landmark 9):
where:
- pₜ,ₕ,ₖ = (x, y, z) is the position of landmark k of hand h in frame t, as returned by MediaPipe;
- t is the frame index within the video;
- h is the hand slot (“Left” or “Right”);
- k is the landmark index, from 0 to 20 (21 landmarks per hand);
- pₜ,ₕ,₀ is the wrist landmark (k = 0), which becomes the new origin;
- pₜ,ₕ,₉ is the base of the middle finger (k = 9, the metacarpophalangeal joint);
- ‖·‖ is the Euclidean distance, so ‖pₜ,ₕ,₉ − pₜ,ₕ,₀‖ is the wrist-to-middle-finger distance, used as a measure of palm size;
- p̃ₜ,ₕ,ₖ is the normalized position of landmark k, used as input to the models.
A hand that was not detected stays a vector of zeros. Because each frame is normalized using only its own landmarks, no statistic is computed across videos or signers, and no information from a test signer can reach the training data.
Each normalized sequence was then fitted to the input length L: the first L frames were kept, and shorter sequences were padded with zero frames at the end. The frame mask was cut and padded in the same way, so that padded frames and frames without a detected hand both have a mask value of 0. Four datasets were built from the same 5,843 videos, in the same order (Table 4).
The datasets hold 1,952 videos of signer 01, 1,951 of signer 02 and 1,940 of signer 03. The same preprocessing code was used for training and was exported unchanged as the preprocessing module of the live application, so the input seen by the deployed model is computed exactly as in training. A checksum of the four datasets (MD5, beginning cbb314b8) was stored with every training run, so that each reported result can be traced to this exact data.
3.5. Models
Three sequence models were compared. They share the same input (a sequence of L frames with 126 features and a frame mask) and the same output stage, so they differ only in how they model the temporal structure of a sign. The output stage is masked mean pooling followed by a classifier. Masked mean pooling averages the hidden states of the frames in which a hand was detected, so that padded frames and frames without a hand do not affect the decision:
where z is the pooled feature vector of the sequence, L is the input length, m_t ∈ {0, 1} is the frame mask of frame t (1 if a hand was detected in frame t, and 0 if no hand was detected or the frame was added by padding), and h_t is the hidden state of frame t produced by the sequence model. The lower bound of 10⁻⁶ in the denominator prevents a division by zero when no hand is detected in any frame.
The classifier is a fully connected layer of 64 units with ReLU activation, followed by a 39-way output layer.
All three models use dropout [31] with a rate of 0.2, both inside the sequence model and before the output layer. Dropout randomly switches off a share of the units during training, which reduces overfitting; this matters here because each model is trained on the recordings of only two signers. The same rate and the same classifier were used for every model, so that a difference in accuracy reflects the temporal model and not a difference in regularization. We reviewed the source code of the earlier system versions to trace the development decisions. The numerical hyperparameters, including the model dimensions, dropout rate, learning rate, weight decay, label smoothing, batch size and augmentation ranges, were carried over unchanged from the first implementation. During preliminary development, we compared the Transformer with and without augmentation and the BiLSTM using signer 03 as the test signer. The result of that comparison informed the selection of the augmented Transformer for the live application.
The input window was initially set to 29 frames, then increased to 42 frames based on the video-length distribution. It was subsequently shortened to 28 frames after informal use of the live application by the first author. Accuracy on signer 03 did not inform these window-length changes. The present study evaluated all 12 main configurations across the three LOSO folds, including the previously selected configuration (Section 3.7); the possible effect of the preliminary decisions is discussed in Section 5.5.
Transformer. The frame vectors are projected to 128 dimensions by a linear layer, and sinusoidal positional encodings of length L are added. Three Transformer encoder layers [32] follow, each with 4 attention heads and a feed-forward size of 256. Frames with a mask value of 0 are excluded from attention through a key-padding mask; if a sequence contains no detected hand at all, its first position is kept so that attention remains defined.
BiLSTM. Two bidirectional [33] long short-term memory (LSTM) [34] layers with 96 hidden units per direction process the full sequence. Masked mean pooling then uses only the frames with a detected hand.
TCN. The temporal convolutional network (TCN) [35] uses the filter widths (64, 128 and 64) of a TCN previously used for Arabic sign language recognition [14]; the kernel size and dilations differ from that model. It contains nine residual blocks arranged in three stages of 64, 128 and 64 filters, and each stage has three blocks with dilations of 1, 2 and 4. A block applies two dilated one-dimensional convolutions (kernel size 3, with symmetric, non-causal padding that keeps the sequence length, so each output frame depends on both earlier and later frames within the receptive field), each followed by ReLU and dropout, and adds a residual connection, using a 1 × 1 convolution where the number of channels changes. The input of each convolution and the output of each block are multiplied by the frame mask. The receptive field of the network is 85 frames, which covers the longest input (42 frames).
Table 5.
Model size (all models with a 39-class output).
| Model | Parameters |
| Transformer | 424,487 |
| BiLSTM | 409,639 |
| TCN | 474,919 |
The three models have between 0.41 and 0.47 million parameters, so differences in accuracy cannot be explained by a large difference in model capacity. The Transformer code is the same code exported to the live application.
3.6. Training Settings and Data Augmentation
All models were trained with the same settings. Optimization used AdamW with a learning rate of 1 × 10⁻³ and a weight decay of 1 × 10⁻⁴, and a batch size of 32. The loss was cross-entropy with label smoothing of 0.1, which discourages over-confident predictions and is intended to help the models generalize to unseen signers. The learning rate was halved when validation accuracy did not improve for 4 epochs. Training ran for at most 50 epochs and stopped early after 10 epochs without improvement in validation accuracy, to limit overfitting to the two training signers; the weights of the epoch with the highest validation accuracy were kept. Random seeds were set for Python, NumPy, PyTorch (CPU and GPU) and the data loader to control stochastic variation across experimental runs. The training code fixed these seeds but did not enable deterministic cuDNN or PyTorch algorithms, so the runs used the default settings reported in Section 3.11, and repeating a run may give small numerical differences.
Data augmentation was applied to the training samples only, to imitate differences between signers in hand orientation, size, position and signing speed (Table 6).
For each training sample, one rotation angle, one scale factor and one shift were drawn at random and applied to the (x, y) coordinates of both hands in all frames; the z coordinate and missing hands were left unchanged. Temporal jitter, applied with probability 0.3 to sequences of more than 5 frames, removed 1 or 2 randomly chosen frames, moved the remaining frames forward in their original order, and padded the end with empty frames, with the frame mask changed in the same way. Validation and test samples were never augmented.
3.7. Study Design and Evaluation Protocol
The focus of the study is on the 39 alphabet signs of the KArSL-502 dataset [12] (from sign identifier number 0032 to 0070) enacted by three signers in the data set, referred to as signer number 01, signer number 02 and signer number 03. The original KArSL paper mentioned that there are 39 letter signs [12], however, some of the subsequent papers consider this category to be consisting of 40 letters [9,11]. The configurations and the analysis plan of the present study were fixed before its runs; Section 3.5 describes the preliminary development decisions made before the final LOSO runs.
The research examines three variables: the method of modelling (BiLSTM or Transformer), whether the data augmentation is applied or not, and the input length, which has three possible values of 28, 29, or 42 frames at the sampling rate of 30 frames/second. The configuration for the live application was fixed before the final runs as the Transformer with data augmentation at 28 frames (Section 3.5). One ablation was run on this configuration, with the use of a temporal convolutional network (TCN) instead of the Transformer.
Each configuration has been trained using five random seeds: 42, 7, 123, 2024 and 31337. The evaluation was performed according to the leave-one-signer-out (LOSO) protocol in three folds. In each fold, videos of one signer were used as the test data and the videos of the other two signers were used for training and validation. Each signer gets to be the test signer exactly once. 15% of the training data were withheld for validation (using stratified sampling based on sign and a fixed seed of 42), so all signs were included in validation and validation videos remain the same in every run. For each final LOSO fold, the held-out signer’s recordings were reserved for testing. Model fitting, validation, learning-rate scheduling, early stopping and checkpoint selection used data from the other two signers. Section 3.5 describes the preliminary development decisions made before the final LOSO runs.
The main analysis comprised 195 training runs: 12 configurations formed by crossing two architectures, two augmentation settings and three input lengths, plus one TCN ablation. Each configuration was evaluated in three LOSO folds with five random seeds. We also ran 15 additional experiments using raw image coordinates in place of normalized landmarks (dataset L28raw, Table 4). These runs remained at chance-level accuracy (2.58 ± 0.03%; 1/39 = 2.56%) and were excluded from the main comparisons; this outcome applies to the tested raw-coordinate configuration only and does not by itself establish that normalization is necessary. To complete each run, the accuracy, macro-averaged precision, recall, F1 score, and top-five accuracy were calculated for the test signer, and the predicted class probabilities were recorded for each test video to conduct pooled confusion matrices and paired statistical tests (Section 3.8). Moreover, the weights of the deployed configuration and of the TCN were recorded for the respective folds and seeds, for the robustness tests (Section 3.9). The results reported are mean ± standard deviation over the 15 runs of each configuration (3 folds × 5 seeds), and per test signer.
3.8. Statistical Analysis
Configurations are compared in pairs on the same set of test videos. For each configuration, the class probabilities of the five seeds were averaged for each test video (soft voting). As each video belongs to only one held-out signer, this gives one prediction per video for the 5,843 videos, and the two configurations of a pair are evaluated on identical videos.
The major test here was the exact McNemar test [36,37]. To evaluate pair A and B with regard to the number of video classifications correctly done exclusively by A that can be represented as b and the number of video classifications correctly done exclusively by B that can be denoted as c; the two-tailed p-value is described as the exact binomial test of minimum (b, c) successes among a total of (b + c) trials, with the probability equal to 0.5. The 95% confidence interval with regard to the difference in accuracies (A-B) was computed via the paired percentile bootstrap method that was implemented upon resampling the 5,843 videos with replacement 2,000 times (with random seed equal to 0) [22,38].
Additionally, two further checks were reported with each test. The first of them refers to the check of the agreement among signers: the number of the three test signers on which A has a higher mean accuracy (over seeds) than B. The second test refers to the sensitivity check: McNemar test reproduced with the predictions obtained using one seed (in this case it was seed 42) instead of the soft vote, aiming to show the dependency of the obtained result on the averaging. The Wilcoxon signed-rank test [23] on the 15 paired run accuracies (3 signers × 5 seeds) is presented as supporting evidence only, since runs with different seeds on the same test signer are not independent [23,28].
All comparisons in this project were grouped into four families which were fixed in the analysis code before the runs were made, namely: augmentation (with versus without; 6 comparisons, 2 models × 3 lengths), architecture (Transformer versus BiLSTM; 6 comparisons, 2 augmentation settings × 3 lengths), input length (12 comparisons, three pairs of all lengths for each model and augmentation setting) and finally ablation (the deployed configuration versus the TCN; 1 comparison). Holm’s step-down correction [22] has been applied within each family to both the McNemar and the Wilcoxon p-values in isolation. A difference has been regarded statistically significant when the Holm-adjusted McNemar p-value has been less than 0.05, and robust if, additionally, A has performed better than B over all the three test signers. The bootstrap intervals were not adjusted for multiple comparisons. The paired tests and bootstrap intervals used individual recordings as the analysis unit. Recordings from the same signer may be related, so the resulting p-values and confidence intervals should be interpreted in the context of these three signers and the clip-level analysis. We also checked whether the direction of each accuracy difference was consistent across the three held-out signers. This check describes the pattern across the available signers (Section 5.5).
3.9. Robustness Tests and Speed Measurement
The live system receives sequences that differ from the recorded test videos: the recording may be done with a lower frame rate, the 28-frame window may start before or after the sign, the hand detector misses some frames, the landmarks may be shaking, or the image is mirrored. The cost of every modification is calculated by re-checking the 15 models of the deployed configuration and of the TCN (3 folds × 5 seeds) on the videos of the withheld signer after one controlled change to every video. The modifications given were made to the whole normalized sequence. The sequences were then either truncated or padded to 28 frames just the way the training was done. Each evaluation began with random number generation with a resetting number (seed=0), so each model met the same perturbed input. Meanwhile, the videos were recorded at a pace of 30 frames per second, so 3 frames equal 0.1 second.
The specific conditions were made as follows.
- Low frame-rate of a camera means that only every second frame was kept (15 frames per second), and the sequence was then brought back to 30 frames per second by nearest-neighbor selection on a uniform time grid, with the same function the live application uses.
- Late starting means that several frames (3, 6, or 9 corresponding to 0.1, 0.2 or 0.3 s) were deleted from the very beginning of the sequence, so the window begins after the sign has started.
- Early starting means that several empty frames (3, 6 or 9, with no hand detected and mask 0) were added at the beginning of the sequence, so the window begins before the sign and, after truncating it to 28 frames, loses the same number of frames at the end.
- Missing detections mean that each frame was independently marked as undetected (all coordinates set to zero, mask 0) with probability of 0.1, 0.2 or 0.3.
- Noise in the landmarks means that Gaussian noise with a standard deviation of 0.02, 0.05 or 0.1 was added to every coordinate of a detected hand; because the coordinates are normalized by palm size (Section 3.4), these values correspond to 2%, 5% and 10% of the palm size.
- For mirrored input, the x coordinate was negated and the two hand slots were swapped, similar to the flipping of the camera image horizontally.
An assessment of the evaluation code was made by comparing the accuracy of clean, unaltered videos to the results attained by the same models using the LOSO method (Section 4.2), and the results coincided completely (the difference being equal to 0.000 points).
The model size and inference time were calculated locally in Colab on its CPU, using a single thread for processing one sign at a time (batch size of 1, 28 frames, all frames marked as detected). The input was already stored in the memory, hence the time measured reflected only the forward pass and excluded the time of hand detection and network transfer, which are part of the live pipeline. Each model was run ten times for warming up, and then timed over 200 forward passes; the median and 95th percentile are reported. The model size is the file size of the saved model weights (PyTorch state dictionary).
3.10. Real-Time System and Deployment
The model that would be used in the real-time application has been trained only after the series of experiments presented in Section 4 were conducted, which means that the results of the paper cannot be influenced by this trained model. The model represents the deployed configuration (the usage of the Transformer, augmentation, and 28 frames; see Section 3.5 and Section 3.6) and was trained on all the 5,843 videos of the three signers with seed number 42.
Given that all three signers were used for training purposes, there have not been any data available for validation and early stopping could not be used in order to decide when to stop. Therefore, the number of epochs has been fixed in advance from the LOSO runs: in each of the 15 LOSO runs of the deployed configuration, early stopping had selected the epoch with the highest validation accuracy, and the median of these 15 epochs, 24, was used. The model was trained for precisely 24 epochs instead of maximum 50 that were previously imposed in LOSO runs. Because the learning-rate halving described in Section 3.6 depends on validation accuracy, it was not applied in this run, and the learning rate stayed constant at 1 × 10⁻³ for all 24 epochs. All the other parameters of the model were unchanged as compared to the earlier LOSO runs. This model has no held-out signer of its own, and hence its expected accuracy on a new signer is taken from the LOSO results (Section 4.2), and its behavior in live use is measured in the live study (Section 4.7).
Checkpoint verification: the trained weights were saved and reloaded, and the reloaded model gave identical outputs to the original on 256 videos, confirming the integrity of the saved file. The positional-encoding table of the saved model covered 28 positions (28 × 128) corresponding to the input length.
For the need of deployment, the trained weights were exported together with the model description, the preprocessing script, the label map that associates each output index with the corresponding sign ID and Arabic letter, and a config file. The configuration file documents: (1) architecture type, (2) the input layout having 126 values for each frame: 63 for the hand that MediaPipe labels “Left” and then 63 for “Right”, each 21 landmarks × (x, y, z), from non-mirrored frames; (3) preprocessing phase, (4) training process, (5) results of LOSO, (6) live settings (mirror input off); and (7) hashes of data and of code that make it possible to follow the deployed model back to the experiment that produced it. The live application reads the model, preprocessing, and configuration from the saved files, so the code that ran in the experiments is the code that runs live. The trained model, the live application and the code are not publicly released; they are available from the corresponding author upon reasonable request.
The live application runs as a web application. The hand detection is performed in the user’s browser with the help of MediaPipe, and only the 126 landmark values of each frame and the timestamps of their capture are sent to the server in small batches. At the same time, a simple state machine runs on the server to determine the moment the sign has started and finished: recording starts after the hand is detected, and the segment keeps the frames that were received during the last 0.2 seconds before this moment (pre-roll). About ninety-nine percent of all training videos initiate with a visible hand (99.2% of the 5,843 videos have a detected hand in their first frame; mean number of leading frames without a hand 0.07, median 0). Therefore the pre-roll can shift the live window by up to 0.2 seconds relative to the training data. In Section 4.6 the robustness testing evaluates the cost of such change.
The recording ends if no hand was detected during a span of half a second or if the recording reaches the duration of the model input which consists of 28 frames at 30 frames per second (the duration is 0.93 seconds starting from the first frame of the segment). The segments where hand was found for less than 0.3 seconds are considered false detections and eliminated. Frames which are recorded more than 0.2 seconds after the last appearance of a hand are cut off as well. Remained frames are resampled to 30 frames per second through the nearest neighbour method on a uniform time grid identical with the function used in the robustness test described in Section 3.9, normalized and classified. The application always shows the most probable letter as the outcome along with the five most likely letters and their probabilities; no confidence threshold is applied. After a decision, the hands should go out of the scope of the camera for 0.4 seconds before the next sign is accepted.
The application also has an early decision rule, according to which three consecutive checks are needed with the probability of at least 0.80, with the first check at the 0.6 sec mark and the subsequent checks performed every 0.3 sec. In this version, however, the application’s earliest decision (1.2 secs) falls after the 0.93 sec window is full, which means that in this version, every decision happens when either the window is full or the hand leaves the view.
Live study. One participant, the first author, was testing the live system, and since she is not among the KArSL signers, each sign had been generated by a person whose signing had never been seen by this model. Since the participant is also the developer of the system, the live results describe its behaviour with an experienced user and are not an estimate for new users. Each letter has been recorded in a separate session. The way that it worked was as follows: the target letter has been chosen on the measurement panel, the participant performed this letter from five to nine times in a row, and the results were downloaded and the panel reset before the next letter. The recordings were made indoors with the help of the laptop’s built-in camera (640 × 360 pixels, target rate 15 frames per second) and in the Chrome browser on a laptop with 4 CPU threads, 8 GB of RAM, and Intel HD Graphics 530 with MediaPipe for the web (version 0.10.21) operating on GPU. In terms of server computing, the cloud CPU (Intel Xeon Platinum 8375C) has been used with two PyTorch threads. The mirror option has been turned off in all the sessions. The collected data included such information as the target letter, the predicted letter, the probability of the prediction, five most likely letters, and timing of each stage of processing of the sign. Sessions with any deviation from the above-mentioned protocol, like the mirror option being on, no target letter being set, two letters being recorded in one session, or the use of the application’s other deployment, were excluded before analysis, and each affected letter was recorded again. All signs in these excluded sessions were accurately recognized, apart from the session which has been conducted on the application’s other deployment, where all six recorded ‘alif maqsura’ signs have been misidentified; the repeated session of this letter on the standard deployment is the one reported. Earlier sessions held for the sake of application configuration and signs’ learning were not included in the research.
The application logged each completed decision together with the displayed letter, target letter and timing information. Every completed decision produced a displayed letter because the application did not use a confidence threshold for rejection. Attempts in which the hand was not detected or was visible for less than 0.3 s did not reach a decision and were not recorded in the decision log. The number of these attempts is therefore unknown. Sessions that deviated from the protocol were excluded and repeated as described above. The results are reported in Section 4.7.
Figure 2 shows the interface of the live application.
The developed application is intended to show the user the state of the state machine mentioned above and tell them when to start the sign as well as when to lower the hands. The measurement panel records, for every sign, the target letter (when set) and the predicted letter with its probability, as well as the timing of all processing steps conducted during the sign, which provides the data for the live study.
3.11. Computing Environment
All experiments were conducted on Google Colaboratory using a GPU, benefiting from the CUDA framework; the training session reported PyTorch 2.11.0 (CUDA 13.0) and NumPy 2.1.3 at its start. All results, tables, and figures were stored in a separate output folder, so the input landmarks were read but never modified. According to a later inspection of the Colab runtime, it had the following properties. Hardware: NVIDIA Tesla T4 GPU with 15.6 GB of memory (driver version 580.82.07). Software: Python 3.13.16; PyTorch 2.11.0+cu130; NumPy 2.4.6. CUDA and cuDNN: CUDA version 13.0 (version used in PyTorch build) and cuDNN (raw version identifier 92700). Reproducibility settings: deterministic cuDNN algorithms, benchmarking of cuDNN, and PyTorch deterministic algorithms were all switched off, and the variables CUBLAS_WORKSPACE_CONFIG and PYTHONHASHSEED were not set. Because Colaboratory assigns a runtime for every session, the values described above relate only to the inspected runtime and are not confirmed for the original training runs; the version of the NumPy library in the inspected runtime (2.4.6) was also different from the version recorded for the experiments (2.1.3). The GPU model and the library versions were not logged for each training run, so they cannot be confirmed for the original runs.
4. Results
4.1. Dataset Statistics
The dataset, after data cleaning, now consists of 5,843 videos for the 39 alphabet signs. There are exactly 150 videos for 28 letters (3 signers × 50 repetitions). There are 9 letters for which the number of videos lies between 149 and 160, while 2 letters have fewer videos because of the cleaning step: letter alif with hamza above (أ) is left with 125 videos, and letter alif maqsura (ى) is left with 142 videos; in both cases the removed videos were from signer 03. Complete statistics for each letter are shown in Table S1 (Supplementary tables).
Figure 3 illustrates the distribution of video durations for each letter. The duration of the 28 basic alphabets is short and similar to each other: duration median is between 19 and 25 frames and for most letters, the median is between 19 and 21 frames. The longest letters are the letter forms with hamza or madda; letter alif madda (آ) is the letter, which has the longest duration with median of 30 frames and mean of 30.3 frames, while letter waaw with hamza (ؤ) and letter yaa with hamza (ئ) were both with median of 27 frames. There are several single videos having duration much longer than the rest of the videos of their letter (the longest duration for Saad is 70 frames and the longest duration for khaa is 67 frames); such videos appear as isolated outliers above the whiskers.
Figure 4 summarizes the same lengths over all videos and shows what each input length would cut. The histogram (Figure 4a) is right-skewed: most videos are between 12 and 30 frames, with two concentrations, one around 14–15 frames and a second, broader one around 20–26 frames, and a long tail reaching 70 frames. Truncation is concentrated in the hamza and madda forms (Figure 4b). At 28 frames, 56.7% of the alif madda videos are truncated, 38.7% of the waaw with hamza and of the yaa with hamza videos, and 28.7% of the hamza-on-line videos, while 20 of the 28 basic letters lose fewer than 6% of their videos. At 42 frames, truncation almost disappears: only alif madda (18.0%) and alif maqsura (7.0%) are still truncated in more than 4% of their videos.
These statistics define the trade-off tested in Section 4.3: a 28-frame window keeps the live response short but cuts part of the longest signs, while a 42-frame window keeps almost every sign complete at the cost of a longer wait.
4.2. Signer-Independent Results
Table 7 reports the results of the 13 configurations under the leave-one-signer-out protocol. Each value is the mean ± standard deviation of 15 runs (3 test signers × 5 seeds). The Transformer trained with augmentation on 28-frame sequences, the configuration used in the live system, reached the highest mean accuracy, 79.42 ± 6.81%, with a macro F1 score of 77.30 ± 7.04% and a top-5 accuracy of 95.34 ± 3.20%.
The Transformer was more accurate than the BiLSTM in all six matched comparisons (same input length and same augmentation setting). The difference was 10.06 to 10.53 percentage points without augmentation and 7.76 to 8.80 points with augmentation. The TCN, tested at 28 frames with augmentation only, reached 69.67 ± 5.03%, which is 1.41 points below the BiLSTM and 9.75 points below the Transformer under the same setting.
Augmentation raised the mean accuracy of every model and length combination, by 5.01 to 5.87 points for the Transformer and by 7.02 to 8.06 points for the BiLSTM.
Input length had a small effect. Within each model and augmentation setting, the three lengths differed by at most 0.80 points; for the Transformer with augmentation, accuracy was 79.42% at 28 frames, 79.15% at 29 frames and 78.62% at 42 frames. Whether any of these differences is statistically significant is tested in Section 4.3.
Across the 12 main configurations, macro F1 was 2.03 to 3.42 points lower than accuracy, because a small group of letters was recognized much less reliably than the rest (Section 4.4). Top-5 accuracy ranged from 88.43% to 95.87%. For the deployed configuration, the correct letter was among the five highest-ranked letters for 95.34% of test videos on average.
The figure shows three patterns at once. At every length, the bars rise in the same order: BiLSTM without augmentation, BiLSTM with augmentation, Transformer without augmentation and Transformer with augmentation, so the gain from each design choice is present whatever the other choice is. The three groups of four bars (L28, L29 and L42) are almost identical, which is the small length effect described above. The error bars are wide (4.03 to 6.81 points for the 12 main configurations) because they include the differences between the three test signers (Table 8).
Table 8 breaks the accuracy down by test signer. Signer 02 was the hardest test signer in all 13 configurations. For the deployed configuration, accuracy was 86.30% on signer 01, 71.40% on signer 02 and 80.56% on signer 03, a spread of 14.90 points between the easiest and the hardest signer.
The gain from augmentation was not the same for every signer. For the Transformer at 28 frames, it was 10.32 points on signer 01, 3.11 points on signer 02 and 4.18 points on signer 03, and signer 01 had the largest gain of the three signers for both models at all three lengths. This uneven gain is why the standard deviation of the Transformer at 28 frames rose from 4.22 without augmentation to 6.81 with it.
4.3. Ablation and Statistical Comparisons
Table 9 isolates the contribution of each design choice by changing one component of the deployed configuration at a time and keeping everything else fixed.
Replacing the Transformer reduced accuracy by 8.33 points with a BiLSTM and by 9.75 points with a TCN, and removing augmentation reduced it by 5.87 points. Changing the input length to 29 or 42 frames changed accuracy by less than one point (−0.27 and −0.80).
Figure 6 orders the design choices by their cost. The architecture matters most (8.33 points for the BiLSTM and 9.75 points for the TCN), augmentation comes next (5.87 points), and the input length matters least (0.27 and 0.80 points).
Table S3 displays the results of paired comparisons (Section 3.8). The values for the accuracy presented in the table are obtained from a soft vote over seeds; hence, they are 1.77 to 4.01 points higher than the single-run means in Table 7 (e.g. 2.25 points in the deployed setting: 81.67% vs. 79.42%).
Augmentation and architecture. All 12 tests of the two families proved statistically significant after Holm correction (the highest adjusted p = 1.45 × 10⁻³⁰) and robust; moreover, the superiority of the model with augmentation and the Transformer was observed in every case and for all three test signers. The confidence intervals obtained by the bootstrap technique were far from zero (corresponding to augmentation as 4.55-7.43 points, with a lowest lower limit of 3.75, and architecture as 8.03-10.35 points with the lowest lower limit of 7.12 points). The results of the single-seed McNemar tests were in agreement with the findings above (the highest value of p = 1.58 × 10⁻²⁰), which was also confirmed by the supporting Wilcoxon tests (the largest adjusted p = 6.53 × 10⁻⁴).
The final LOSO evaluation supported the choice of the augmented Transformer on signers 01 and 02 as well as signer 03. In the matched comparisons (both models and all three input lengths for augmentation; both augmentation settings and all three input lengths for architecture), the Transformer’s accuracy advantage over the BiLSTM and the accuracy gain from augmentation were observed on signers 01 and 02, whose results had not informed the preliminary choice of deployment configuration. These per-signer differences are observed differences; no separate per-signer significance test was conducted.
Ablation. The result demonstrates that the Transformer in the deployed configuration yields better performance than the TCN by 7.99 points (95% CI from 7.05 to 8.93; adjusted p = 2.98 × 10⁻⁶⁴) and works better than TCN on all three signers.
Input length. Input length does not demonstrate any consistent effect. Out of 12 tests of length comparison, eight have non-significant results after the Holm correction, including the one where the number of frames used was 28 vs. 29 in case of the deployed configuration (the difference was 0.09 points, 95% CI −0.39 to 0.62; adjusted p = 1.0000). Four of the comparisons showed the adjusted p below 0.05, however, none of them is robust and they partly contradict each other: 28 frames work better vs. 29 for BiLSTM with augmentation (0.89 points, p = 0.0166); 28 and 29 frames work better vs. 42 for Transformer with augmentation (1.01 points, p = 0.0074, and 0.92 points, p = 0.0168); 42 frames work better vs. 29 for Transformer without augmentation (0.87 points, p = 0.0417). Each of the four comparisons held only for two of three signers, and no length difference exceeded 1.01 points. Besides, none of the 12 Wilcoxon tests proved significant (all adjusted p = 1.0000). The single-seed test shows p below 0.05 only for the two comparisons where Transformer with augmentation is used (1.79 × 10⁻⁴ and 0.0451, unadjusted), but not for the other two. Longer inputs showed no consistent overall accuracy gain across the three signers. The 28-frame window was retained for live use. Overall accuracy can conceal class-specific effects of truncation, particularly for longer signs such as alif with madda.
4.4. Per-Letter Analysis and Confusion Matrices
For the per-letter analysis, the predicted probabilities of the five seeds were averaged for each test video (soft voting), so each of the 5,843 videos received one prediction from models that had not seen its signer. Table 10 lists the 15 letters with the lowest F1 score for the deployed configuration; the remaining 24 letters scored 77.6% or higher. The F1 scores of all 39 letters are given in Table S2 (Supplementary tables).
Alif with hamza above (أ) was the hardest letter (F1 36.2%), followed by hamza (ء, 52.1%), raa (ر, 55.8%), alif maqsura (ى, 58.0%) and alif with madda (آ, 59.4%). Four of these five are alif or hamza forms. Alif with hamza above is also the letter with the fewest videos (125, after the cleaning in Section 3.1), and alif with madda has the longest videos, with 56.7% of them truncated at 28 frames (Section 4.1).
Figure 7 shows the F1 score of all 39 letters in sign-ID order.
The low scores are concentrated in a few letters rather than spread across the alphabet. Ghayn reached an F1 score of 100.0% (all 150 of its videos were correct, and no other video was predicted as ghayn), and ayn reached 97.4%. Raa is the only one of the 28 basic letters (alif to yaa) below 60%, whereas four of the five lowest bars belong to the hamza and alif forms that follow yaa in the sign-ID order (أ, ء, آ and ى).
Table 11 lists the ten letter pairs with the most errors, counting both directions.
Three of the ten pairs (أ–آ, ئ–ى and ا–أ) are letters whose written forms differ only by a hamza or madda mark. Alif with hamza above appears in three pairs, and 73 of its 125 videos were predicted as one of those three letters (34 as آ, 26 as ا and 13 as ئـ), which explains most of its low F1 score.
Several confusions ran almost entirely in one direction. Seventy of the 152 hamza (ء) videos were predicted as baa (ب), while no baa video was predicted as hamza. Raa (ر) was predicted as daal (د) 47 times and as baa (ب) 27 times, so 74 of its 150 videos went to these two letters. Zay (ز) was predicted as taa (ت) 40 times, against 5 in the other direction, and 35 waaw (و) videos were predicted as jiim (ج), with none in the other direction.
Figure 8 shows the pooled confusion matrix of the deployed configuration. Each row is a true letter and each column a predicted letter; the shading is the percentage of the true letter's videos, and the numbers are video counts. With soft voting over the five seeds, 4,772 of the 5,843 videos were classified correctly (81.67%), 2.25 points above the 79.42% mean of the single runs in Table 7.
Most of the matrix mass lies on the diagonal. Ayn and ghayn were recognized in all 150 of their videos, and nine letters reached a recall of at least 95% (ayn, ghayn, siin, thaal, Daad, kaaf, laam, yaa and alif with hamza below). The errors are concentrated in a few rows. Five letters had a recall below 55%: hamza (56 of 152 videos, 36.8%), alif with hamza above (47 of 125, 37.6%), raa (75 of 150, 50.0%), haa (82 of 150, 54.7%) and alif with madda (82 of 150, 54.7%).
The matrix also separates two kinds of error that the F1 score in Table 10 combines. Hamza had the lowest recall but a high precision: only 7 videos of other letters were predicted as hamza, so 56 of the 63 hamza predictions (88.9%) were correct. Baa shows the opposite pattern. Its own recall was high (135 of 152, 88.8%), but it attracted 119 videos of other letters (70 hamza, 27 raa and 22 miim), so only 135 of its 254 predictions (53.1%) were correct. Jiim behaved in a similar way and received 63 videos of other letters (35 waaw, 19 haa, 6 Haa and 3 waaw hamza).
Several off-diagonal clusters fall between letters that share a base shape in written Arabic and differ in dots or a diacritic mark: Saad predicted as Daad (15 videos), Zaa as Taa (25), jiim, Haa and khaa among themselves (jiim as Haa 12, Haa as jiim 6, Haa as khaa 15, khaa as Haa 9), and the alif group in the lower right, where alif with hamza above was predicted as alif with madda 34 times and as alif 26 times, alif with madda as alif with hamza above 48 times and as alif 17 times, and alif as these two letters 18 and 10 times.
The confusion matrices of the other 12 configurations are available from the corresponding author on request.
4.5. Comparison with the Literature
Table 12 places the deployed configuration beside published signer-independent results on KArSL. The studies differ in the classes they recognize, so the table also states whether each result can be compared directly with ours. Only Almufareh et al. [13] report signer-independent accuracy on the same 39 letters as a task of its own. Alamri et al. [11] report the same 39 letters (described by them as 40), but as part of a 190-class classifier (KArSL-190), so their letter accuracy was measured in a harder task with more competing classes. Alyami et al. [14] and Kausar et al. [9] work on word signs or on larger KArSL subsets and are listed for context only. All values were checked against the original papers.
Table 13 compares the two letter results signer by signer.
Against the directly comparable result of Almufareh et al. [13], the deployed configuration was 6.89 points higher on average and higher on each test signer: by 13.74 points on signer 01, 2.71 on signer 02 and 4.22 on signer 03. Both studies found signer 02 the hardest test signer, which suggests that the difficulty lies in the recordings of this signer rather than in a particular model.
Three points limit this comparison. First, Almufareh et al. report one run per signer, without a measure of variance or a statistical test, so the differences cannot be tested formally. Second, on signer 02 our margin (2.71 points) is smaller than the seed-to-seed standard deviation of our own model on that signer (3.18 points), so it may not hold for every training run. Third, the two systems use different inputs: Almufareh et al. classify RGB crops of the hands and arms with a Swin Transformer backbone, whereas the present system uses only 126 hand-landmark coordinates per frame.
The difference from Alamri et al. [11] is larger, 33.39 points on average, but part of this gap comes from their 190-class setting, and it should not be read as a like-for-like improvement. Almufareh et al. [13] also report that a MediaPipe-based pipeline stayed at 25–35% in the signer-independent mode, but the only source given for this figure is the MediaPipe framework paper, and no details of that experiment are reported, so the figure is not used here.
4.6. Robustness and Speed
Table 14 shows the accuracy of the deployed configuration and of the TCN under each condition of Section 3.9. Change is the difference from the clean accuracy, in points.
The deployed Transformer was hardly affected by the frame rate, the missing detections or the landmark noise. A 15 fps camera cost 0.15 points, losing 30% of the detections cost 0.43 points, and noise of up to 10% of the palm size cost at most 0.45 points. The TCN was equally insensitive to the frame rate and the noise, but it lost 2.27 points with 20% and 5.63 points with 30% missing detections. A likely reason is that the Transformer excludes undetected frames through its attention mask, whereas in the TCN the zeroed frames still sit inside the receptive field of the convolutions.
The position of the window was the main weakness of the Transformer. A shift of 0.1 s cost 1.61 points (late) and 0.92 points (early), but a shift of 0.3 s cost 9.92 and 11.23 points. A late start also made the results much less stable across signers: the standard deviation rose from 6.81 to 17.48 points at 0.3 s. The TCN was less sensitive to a late start (5.61 points at 0.3 s) and was not affected by an early start at all (changes of +0.03 to +0.27 points). Both models lose the same final frames when the window starts early, so the difference between them may come from the absolute positional encoding of the Transformer: when empty frames are added in front, every real frame moves to a new position, whereas the convolutions of the TCN respond in the same way wherever a pattern occurs in time. For the live system, this result means that the 28-frame window should start close to the moment the hand appears; within 0.1 s the cost is below 2 points.
Mirroring the input reduced the accuracy of the Transformer by 3.81 points and of the TCN by 2.63 points. Orientation therefore matters, but less than a large window shift. The training videos already contain both signing hands [12], which may explain why mirroring cost only 3.81 points. The live application feeds frames in the same orientation as the training videos (mirror option off by default).
Figure 9 shows the two profiles side by side. The Transformer line stays flat across the frame-rate, missing-frame and noise conditions and dips only where the window is shifted, with the widest error bars at a late start of 0.3 s. The TCN line lies below the Transformer line in every condition except an early start of 0.3 s, where the two models are close (68.18% and 69.94%), and it falls as more frames are missing.
Table 15 compares the size and speed of the three architectures.
All three models are small (1.64 to 1.92 MB) and fast on a single CPU thread. The deployed Transformer classified one sign in 2.496 ms (median; 3.699 ms at the 95th percentile). This is slower than the BiLSTM (1.642 ms) and faster than the TCN (4.688 ms), and at under 4 ms it is a negligible part of the time a user waits for a result. The time of the whole live pipeline (hand detection in the browser, network transfer and server processing) is reported in Section 4.7.
4.7. Live Deployment and Feasibility Test
4.7.1. Live Study
Figure 10 shows three examples of live recognition for the letters jiim (ج), Haa (ح) and khaa (خ). These three letters share the same base shape in written Arabic and differ only in the dot (above, absent or below), and in the LOSO evaluation they formed one of the clusters of confusion (Figure 8: jiim predicted as Haa in 12 videos, Haa as jiim in 6 and as khaa in 15, khaa as Haa in 9).
In all three cases the correct letter received a high probability, and the other two letters of the group received little probability: in (a), Haa received 3%; in (b), khaa received 1% and jiim did not appear among the five most probable letters; in (c), Haa received 1% and jiim did not appear among the five. The model therefore separated the three letters by the small differences in finger and hand configuration that distinguish their signs. These are selected examples that illustrate how the system behaves; they are not a measure of its accuracy, which is reported from the complete live study below.
The live feasibility analysis included 40 sessions conducted by the first author (participant P01) across two days. Across these sessions, the application recorded 255 decisions covering all 39 target classes (Table 16). Decision numbers were consecutive within each session, and all logged decisions were included in the analysis. Of the 255 displayed predictions, 235 were correct and 20 were incorrect, giving a top-1 accuracy of 92.16% among displayed predictions. The target appeared among the five highest-ranked classes for 252 of 255 decisions (98.82%). Because attempts that did not reach a decision were unlogged, end-to-end accuracy across all attempted signs could not be calculated. Alif with hamza above was recorded in two sessions, and both are included. 28 of the 39 classes were recognized correctly in every repetition.
The 20 errors were concentrated in a few classes. Alif maqsura was the only class that failed in most of its signs: 1 of its 6 signs was correct, four were predicted as yaa and one as yaa with hamza, and for three of them the correct letter was not among the five most probable letters; these were the only top-5 misses of the study. Alif with madda was correct in 5 of 9 signs, and all four errors were predicted as alif. Alif with hamza above was correct in 9 of 11 signs (one prediction as alif with madda and one as alif). The remaining errors were single signs: waaw and waaw with hamza were each confused with the other, hamza on line was predicted as hamza, yaa with hamza as miim, Zaa as hamza and as raa, shiin as siin, Taa as Haa and daal as waaw with hamza.
Most of these errors repeat the confusions found in the LOSO evaluation (Section 4.4). Fourteen of the 20 errors were made on the alif and hamza forms and on the yaa group (yaa with hamza and alif maqsura), which include most of the classes with the lowest LOSO F1 scores (Table 10), and the pairs alif with hamza above and alif with madda, alif and alif with hamza above, and yaa with hamza and alif maqsura are among the most confused pairs in Table 11. In three of the alif maqsura signs the hand was no longer detected during the last part of the window, so part of the movement did not reach the model.
The probability of the predicted letter had a median of 0.87 (interquartile range 0.73 to 0.92). Because the application answers every sign, low-probability predictions were also counted: 19 signs had a probability below 0.50, and 12 of them were still correct. Letters that share a base shape in written Arabic, such as ayn and ghayn, jiim, Haa and khaa, and Saad and Daad, were recognized without error, and hamza, the class with the second-lowest LOSO F1 score, was recognized in all 7 of its signs.
The live accuracy (92.16%) is higher than the signer-independent accuracy of the LOSO evaluation on the same 39 classes (81.67%, soft vote). The two values are not directly comparable: the live study has one participant, the first author, and 255 signs, the participant knew the target letter, practised the signs before recording and could see the camera view while signing, whereas each LOSO fold tests a full set of recordings of a signer the model has never seen.
All 255 decisions were taken when the 0.93 s window was full, and none by the early-decision rule, as expected from the timing described in Section 3.10. Table 17 breaks down the time of the live pipeline.
The decision was taken a median of 0.82 s after the first frame with a detected hand (the 0.93 s window also contains the pre-roll), and the median elapsed time from the first frame with a detected hand to the displayed result was 1.43 s. The median server-side model inference time was 2.65 ms per decision during the live test, close to the 2.496 ms median of the separate forward-pass benchmark (one CPU thread in Colab, batch size 1; Table 15), and each request was processed on the server in a median of 3.9 ms. Most of the time from the decision to the displayed result (median 0.61 s) was taken by the round trip between the browser and the server (median 384 ms per request).
5. Discussion
5.1. Main Findings
When implementing the leave-one-signer-out methodology with the three KArSL signers, the deployed configuration recognized the 39 alphabet signs of the held-out signer with an average accuracy of 79.42 percent (± 6.81), which increases to 81.67 percent if the probabilities of the five seeds are averaged. It should be noted that these values are results of this protocol, not estimates for signers in general. The correct letter was among the top five letters for 95.34 percent of the test videos. Two design choices explain most of this result: the Transformer model was proven to have better performance compared to BiLSTM in all six matched comparisons (by 7.76 points to 8.80 points with augmentation) as well as TCN (surpassing it by 9.75 points). Moreover, the contribution from augmentation should also be acknowledged (the Transformer performance increased by 5.01 points to 5.87 points due to augmentation). Both effects were significant after Holm correction, and the gains were observed on all three test signers. With only three signers, these tests show that the effects are consistent across the available signers, not that they hold for signers in general.
When it comes to comparing the results obtained with the published KArSL results, care is needed. The deployed model had 6.89 points better results than the signer-independent result reported by Almufareh et al. on the same 39 letters [13], although it uses only 126 landmark values per frame instead of RGB crops. Moreover, signer 02 was found to be the hardest test signer by both studies. On this signer, however, the margin was smaller than the seed-to-seed variation of the present model (Section 4.5). The seed-level standard deviations (0.94 to 3.19 points) were much smaller than the standard deviation over all runs (6.81 points). Therefore, most of the variation can be attributed to discrepancies among signers. This supports reports showing that accuracy is reduced in the case of signers whose signing has not been seen before [2,8] and the fact that the number of signers used for training is significant [10].
5.2. Error Groups: Alif and Hamza Forms and the Yaa Group
Errors have been concentrated in a small number of letters. Four of the five letters with the lowest F1 score were alif or hamza forms. Alif with hamza above has the lowest score (36.2%) followed by hamza (52.1%), alif maqsura (58.0%) and alif with madda (59.4%). Three out of ten most confused pairs differ in writing only by a hamza or madda mark (أ–آ, ئ–ى and ا–أ). Alif with hamza above recorded 125 videos, among which 73 were predicted as one of three neighbouring letters. Several factors might add up in this case. Alif with hamza above has the fewest videos (125) after cleaning, and all 33 removed videos belong to this letter and to alif maqsura. Finally, alif with madda holds the record for the longest videos, and 56.7% of them are truncated at 28 frames.
The yaa group represented another cluster of errors. Yaa with hamza and alif maqsura letters have been confused 68 times in the LOSO evaluation. In the live scenario, alif maqsura was identified correctly in only 1 of 6 signs, and four of its signs were predicted as yaa. Fourteen of the 20 live errors fell on the alif and hamza forms and on the yaa group, so the live errors repeat the main LOSO confusions.
Some confusions ran in one direction only. An instance of confusion was seen with hamza, where it was predicted as baa 70 times, but no baa was mistaken as hamza. Baa was assigned 119 videos showcasing other letters; thus, it may act as a default class for ambiguous inputs. Confusion between letters with similar hand shapes has been noticed in the static ArSL recognition [4,24] as well as fingerspelling across other sign languages [8,27]. Nevertheless, similarity in writing does not imply similarity in signing. The letters jiim, haa, and khaa formed a cluster of confusion during the LOSO experiment, yet they were recognized without error during the live study. The hardest letters in the two tests were hamza and madda forms, which are also the longest signs, as well as letters belonging to the yaa group.
5.3. The Window-Length Trade-Off
The 28-frame window (0.93 sec) was chosen for a short response in the live test. It truncates 11.1% of videos, mainly hamza and madda forms. The length, however, was never consistently important in terms of overall accuracy. The maximum difference in length was 1.01 points, none of the significant length differences held on all three signers, and the difference between 28 and 29 frames was unmeasurable. However, overall accuracy hides losses for single letters. Alif with madda, the longest sign (median 30 frames), loses 56.7% of its videos to truncation at 28 frames, while all four of its mistakes in the live experiment were predictions of alif, which is consistent with its second move falling out of the window.
A longer window would be beneficial for this letter but would negatively reflect on the speed of decisions. In the live system, the decision was made at a median of 0.82 seconds following the first frame with hand presence, and the outcome was displayed after 1.43 seconds. Most of the remaining lag was a result of the round trip between browser and server (median of 384 milliseconds per request) rather than that of the model latency (2.65 milliseconds per sign). Other fingerspelling systems also implement short fixed time windows [1,27] or vote over several frames’ predictions [15].
The position of the window affected the results more than its length. The Transformer lost 9.92 and 11.23 points for starting 0.3 seconds late or early, whereas with a 0.1 seconds shift the loss was less than 2 points. The live pre-roll can shift the window by up to 0.2 seconds compared to the training data. In the live experiment, the window held a median of around 0.11 seconds of pre-roll (0.93-0.82 seconds), and this shift costs 0.92 points to the Transformer in the test measuring robustness. This shift can be eliminated if the empty frames at the beginning of each segment are removed prior to the classification.
5.4. Wrist Normalization and Whole-Hand Movement
At all times, each hand was normalized with respect to its wrist and palm size in each frame (Equation (1)). This makes the features independent of the location and size of the hand, in the same way as the distance- and angle-based features of other studies [21,27]. The downside of doing that is getting rid of the information about the wrist path, since a movement of the whole hand does not affect the normalized coordinates to any significant extent. Alif maqsura is distinct from yaa mainly through the downward motion of the entire hand, and it was predicted as yaa in four of its six live signs. This explanation fits the results, but it is not yet confirmed by a dedicated analysis of the yaa group.
Other landmark systems keep the global motion as a separate input. Kang et al. carried out calculations of trajectory and velocity from the original wrist coordinates prior to normalization of the data [1], and Algabri et al. added position and velocity features [10]. A wrist-trajectory channel computed prior to normalization is a direct extension of the present model.
5.5. Limitations
The offline evaluation was limited to three KArSL signers, and each fold trained on recordings from two signers. Preliminary results on signer 03 informed the selection of the augmented Transformer for deployment. Although signer 03’s recordings were held out from model fitting and checkpoint selection in its final LOSO fold, their earlier use in configuration selection may have introduced optimistic bias for that signer. The direction of the observed gains on signers 01 and 02 provides additional evidence within the available dataset. The pooled statistical tests used recordings as the analysis unit, so their results should be interpreted in light of repeated recordings from only three signers. The accuracy differed by 14.90 points between the easiest and the hardest test signer, and all three signers are professional males aged 30–40 years [12], so the models were not trained on female, younger or non-professional signers; signer-independent accuracy is known to increase with the number of training signers [10].
The live study involved one participant, the first author, who had practised the signs, knew the targets and had used the application informally when selecting the 28-frame window. The live result therefore describes performance with a participant familiar with the system. The 92.16% accuracy is conditional on the application displaying a prediction. Since attempts that never reached a decision were unlogged, we could not estimate the proportion of all attempted signs that were correctly recognized.
In addition, the 28-frame window truncates the longest signs, and accuracy depends on where the window starts (Section 4.6). The input is limited to hand landmarks, without face or body information, and the system depends on MediaPipe detection: 33 videos were removed because no hand was detected in them, and the signing hand appears in either hand slot because KArSL alternates the signing hand [12], while MediaPipe assigns labels based on the hands’ appearance [30]. Wrist normalization also removes movement of the whole hand, which distinguishes some letters (Section 5.4). Finally, offline landmarks were extracted using the Python MediaPipe Tasks API (version 0.10.35), whereas live landmarks were extracted using the browser implementation (MediaPipe for the web, version 0.10.21). The implementations and versions differed, which may have affected the landmarks supplied to the classifier.
5.6. Future Work
In the next stage, testing will be carried out with more live participants, including deaf signers, as well as with more training signers. Additionally, the system will be tested with a wrist-trajectory channel computed before normalization, with longer or letter-specific windows for the hamza and madda forms, and with Transformer variants that use relative or no positional encoding, which may be less sensitive to window shifts. The analysis of the yaa group will also be completed.
6. Conclusions
We evaluated hand-landmark models for recognizing 39 isolated Arabic Sign Language alphabet signs from KArSL-502. The augmented Transformer with a 28-frame input achieved a mean accuracy of 79.42 ± 6.81% across the 15 LOSO runs. The pooled five-seed ensemble achieved 81.67%. The observed gains from the Transformer and augmentation were consistent across the three test signers in the matched comparisons, while longer input windows showed no consistent overall accuracy gain. In a single-participant feasibility test, the separately trained browser–server system correctly classified 235 of 255 displayed predictions (92.16%), with a median of 1.43 s from the first frame with a detected hand to the displayed result. Evaluation with additional independent signers and logging of every attempted sign would allow the live study to estimate end-to-end recognition accuracy.
Supplementary Materials
The following supporting information can be downloaded at the website of this paper posted on Preprints.org. Supplementary materials include three separate Excel workbooks. Table S1 reports the per-class dataset and video-length statistics. Table S2 reports the per-class LOSO results for all 39 classes. Table S3 reports the full paired statistical comparisons.
Author Contributions
Conceptualization, S.S.A.-J. and I.A.I.; methodology, S.S.A.-J.; software, S.S.A.-J.; validation, S.S.A.-J.; formal analysis, S.S.A.-J.; investigation, S.S.A.-J.; data curation, S.S.A.-J.; writing—original draft preparation, S.S.A.-J.; writing—review and editing, S.S.A.-J. and I.A.I.; visualization, S.S.A.-J.; supervision, I.A.I. All authors have read and agreed to the published version of the manuscript.
Funding
This research received no external funding.
AI Declaration
I used Claude (Anthropic) to improve the grammar, clarity, and academic tone of this paper. I reviewed the suggested revisions and take responsibility for the final manuscript.
Institutional Review Board Statement
Ethical review and approval were waived for this study because the only participant in the live test was the first author, and no other person was recorded.
Informed Consent Statement
The only participant is the first author, who consented to the study and to the publication of the images in Figure 10.
Data Availability Statement
The KArSL-502 dataset is available from its original authors [12]. Supplementary Table S1–S3 are included with this submission. The landmark data, the code, the trained models and the live application are available from the corresponding author upon reasonable request.
Conflicts of Interest
The authors declare no conflicts of interest.
References
- Kang, Y.; Kuzuyama, R.; Tsuta, N.; Murai, R.; Shin, D. Investigation of Word Recognition Methods for Japanese Fingerspelling Using Large Language Models. Sensors 2026, 26, 6044. [Google Scholar] [CrossRef]
- Berzhanova, U.; Yerimbetova, A.; Milosz, M.; Sakenov, B.; Oralbekova, D.; Daiyrbayeva, E.; Turgan, D. A Comprehensive Review of Deep Learning Approaches for Video-Based Sign Language Recognition: Datasets, Challenges and Insights. Multimodal Technol. Interact. 2026, 10, 58. [Google Scholar] [CrossRef]
- Al Ahmadi, S.; Muhammad, F.; Al Dawsari, H. Enhancing Arabic Sign Language Interpretation: Leveraging Convolutional Neural Networks and Transfer Learning. Mathematics 2024, 12, 823. [Google Scholar] [CrossRef]
- Alasmari, N. CLIP-ArASL: A Lightweight Multimodal Model for Arabic Sign Language Recognition. Appl. Sci. 2026, 16, 2573. [Google Scholar] [CrossRef]
- Alasmari, N.; Asiri, S. ASLDetect: Arabic Sign Language Detection Using ResNet and U-Net Like Component. Sci. Rep. 2025, 15, 18012. [Google Scholar] [CrossRef]
- Alamri, F.S.; Rehman, A.; Abdullahi, S.B.; Saba, T. Intelligent Real-Life Key-Pixel Image Detection System for Early Arabic Sign Language Learners. PeerJ Comput. Sci. 2024, 10, e2063. [Google Scholar] [CrossRef]
- Artiaga, K.; Kamila, S.; Afli, H.; Lynch, C.; Hasanuzzaman, M. Rethinking Sign Language Translation: The Impact of Signer Dependence on Model Evaluation. In Findings of the Association for Computational Linguistics: EMNLP 2025; Association for Computational Linguistics: Suzhou, China, 2025; pp. 18379–18391. [Google Scholar] [CrossRef]
- Mohamed, N.; Mustafa, M.B.; Jomhari, N.; Raja Yusof, R.J.; Abdul Sani, A. Class-Specific Data Augmentation of an Imbalanced Dataset for Signer-Independent Fingerspelling Recognition. PeerJ Comput. Sci. 2026, 12, e3784. [Google Scholar] [CrossRef]
- Kausar, Z.; Najam, S.; Alshehri, M.; AlQahtani, Y.; Alshahrani, A.; Jalal, A.; Park, J. Two-Hand Static and Dynamic Arabic Sign Language Recognition Using Keypoints and Shape Descriptors with Attention-Driven Feature Fusion. PeerJ Comput. Sci. 2025, 11, e3275. [Google Scholar] [CrossRef]
- Algabri, M.; Mekhtiche, M.A.; Bencherif, M.A.; Saeed, F. Towards a Lightweight Arabic Sign Language Translation System. Sensors 2025, 25, 5504. [Google Scholar] [CrossRef]
- Alamri, F.S.; Abdullahi, S.B.; Khan, A.R.; Saba, T. Enhanced Weak Spatial Modeling Through CNN-Based Deep Sign Language Skeletal Feature Transformation. IEEE Access 2024, 12, 77019–77040. [Google Scholar] [CrossRef]
- Sidig, A.A.I.; Luqman, H.; Mahmoud, S.; Mohandes, M. KArSL: Arabic Sign Language Database. ACM Trans. Asian Low.-Resour. Lang. Inf. Process. 2021, 20, 14. [Google Scholar] [CrossRef]
- Almufareh, M.F.; Tehsin, S.; Humayun, M.; Kausar, S.; Farooq, A. Arabic Sign Language Recognition for Differently-Abled Individuals Using Vision Transformers and Temporal Analysis. IEEE Access 2025, 13, 189255–189269. [Google Scholar] [CrossRef]
- Alyami, S.; Luqman, H.; Hammoudeh, M. Isolated Arabic Sign Language Recognition Using a Transformer-Based Model and Landmark Keypoints. ACM Trans. Asian Low.-Resour. Lang. Inf. Process. 2024, 23, 3. [Google Scholar] [CrossRef]
- Morillas-Espejo, F.; Martinez-Martin, E. A Real-Time Platform for Spanish Sign Language Interpretation. Neural Comput. Appl. 2025, 37, 2675–2696. [Google Scholar] [CrossRef]
- Sánchez-Vicinaiz, T.J.; Camacho-Pérez, E.; Castillo-Atoche, A.A.; Cruz-Fernandez, M.; García-Martínez, J.R.; Rodríguez-Reséndiz, J. MediaPipe Frame and Convolutional Neural Networks-Based Fingerspelling Detection in Mexican Sign Language. Technologies 2024, 12, 124. [Google Scholar] [CrossRef]
- Ali, M.; Hosseini, S.E.; Pervez, S.; Ahmad, M. Real-Time Recognition of NZ Sign Language Alphabets by Optimal Use of Machine Learning. Bioengineering 2025, 12, 1068. [Google Scholar] [CrossRef]
- Hirooka, K.; Miah, A.S.M.; Murakami, T.; Hasan, M.A.M.; Hwang, Y.S.; Shin, J. Stack Transformer-Based Spatial-Temporal Attention Model for Dynamic Sign Language and Fingerspelling Recognition. IEEE Open J. Comput. Soc. 2026, 7, 706–717. [Google Scholar] [CrossRef]
- Uddin, M.Z.; Boletsis, C.; Rudshavn, P. Real-Time Norwegian Sign Language Recognition Using MediaPipe and LSTM. Multimodal Technol. Interact. 2025, 9, 23. [Google Scholar] [CrossRef]
- Habib, M.K.; Yusuf, O.; Moustafa, M. Skeleton-Based Real-Time Hand Gesture Recognition Using Data Fusion and Ensemble Multi-Stream CNN Architecture. Technologies 2025, 13, 484. [Google Scholar] [CrossRef]
- Shin, J.; Miah, A.S.M.; Akiba, Y.; Hirooka, K.; Hassan, N.; Hwang, Y.S. Korean Sign Language Alphabet Recognition Through the Integration of Handcrafted and Deep Learning-Based Two-Stream Feature Extraction Approach. IEEE Access 2024, 12, 68303–68318. [Google Scholar] [CrossRef]
- Ortiz-Mata, J.D.; Muñoz-Salcedo, M.; Saquinaula-Brito, J.L.; Oleas-Vélez, X.J.; Toledo-Moncerrate, M.R. Reproducible Machine Learning for Banana Postharvest Quality Assessment: Data Provenance, Statistical Inference, and Accuracy Efficiency Trade-Offs. AgriEngineering 2026, 8, 459. [Google Scholar] [CrossRef]
- Rainio, O.; Teuho, J.; Klén, R. Evaluation Metrics and Statistical Tests for Machine Learning. Sci. Rep. 2024, 14, 6086. [Google Scholar] [CrossRef]
- Yayla, R.; Üçgün, H.; Abbas, M. Pose-Based Static Sign Language Recognition with Deep Learning for Turkish, Arabic, and American Sign Languages. Sensors 2026, 26, 524. [Google Scholar] [CrossRef]
- Alsharif, B.; Alalwany, E.; Ibrahim, A.; Mahgoub, I.; Ilyas, M. Real-Time American Sign Language Interpretation Using Deep Learning and Keypoint Tracking. Sensors 2025, 25, 2138. [Google Scholar] [CrossRef]
- Aly, M.; Fathi, I.S. Recognizing American Sign Language Gestures Efficiently and Accurately Using a Hybrid Transformer Model. Sci. Rep. 2025, 15, 20253. [Google Scholar] [CrossRef]
- Kondo, T.; Murai, R.; He, Z.; Shin, D.; Kang, Y. Recognition of Japanese Finger-Spelled Characters Based on Finger Angle Features and Their Continuous Motion Analysis. Electronics 2025, 14, 3052. [Google Scholar] [CrossRef]
- Jafrasteh, B.; Adeli, E.; Pohl, K.M.; Kuceyeski, A.; Sabuncu, M.R.; Zhao, Q. Statistical Variability in Comparing Accuracy of Neuroimaging Based Classification Models via Cross Validation. Sci. Rep. 2025, 15, 28745. [Google Scholar] [CrossRef]
- Lugaresi, C.; Tang, J.; Nash, H.; McClanahan, C.; Uboweja, E.; Hays, M.; Zhang, F.; Chang, C.-L.; Yong, M.G.; Lee, J.; et al. MediaPipe: A Framework for Building Perception Pipelines. arXiv 2019, arXiv:1906.08172. [Google Scholar]
- Zhang, F.; Bazarevsky, V.; Vakunov, A.; Tkachenka, A.; Sung, G.; Chang, C.-L.; Grundmann, M. MediaPipe Hands: On-Device Real-Time Hand Tracking. arXiv 2020, arXiv:2006.10214. [Google Scholar]
- Srivastava, N.; Hinton, G.; Krizhevsky, A.; Sutskever, I.; Salakhutdinov, R. Dropout: A Simple Way to Prevent Neural Networks from Overfitting. J. Mach. Learn. Res. 2014, 15, 1929–1958. [Google Scholar]
- Vaswani, A.; Shazeer, N.; Parmar, N.; Uszkoreit, J.; Jones, L.; Gomez, A.N.; Kaiser, Ł.; Polosukhin, I. Attention Is All You Need. In Advances in Neural Information Processing Systems 30 (NIPS 2017); Curran Associates: Red Hook, NY, USA, 2017; pp. 5998–6008. [Google Scholar]
- Schuster, M.; Paliwal, K.K. Bidirectional Recurrent Neural Networks. IEEE Trans. Signal Process. 1997, 45, 2673–2681. [Google Scholar] [CrossRef]
- Hochreiter, S.; Schmidhuber, J. Long Short-Term Memory. Neural Comput. 1997, 9, 1735–1780. [Google Scholar] [CrossRef]
- Bai, S.; Kolter, J.Z.; Koltun, V. An Empirical Evaluation of Generic Convolutional and Recurrent Networks for Sequence Modeling. arXiv 2018, arXiv:1803.01271. [Google Scholar]
- McNemar, Q. Note on the Sampling Error of the Difference between Correlated Proportions or Percentages. Psychometrika 1947, 12, 153–157. [Google Scholar] [CrossRef]
- Dietterich, T.G. Approximate Statistical Tests for Comparing Supervised Classification Learning Algorithms. Neural Comput. 1998, 10, 1895–1923. [Google Scholar] [CrossRef]
- Efron, B.; Tibshirani, R.J. An Introduction to the Bootstrap; Chapman & Hall: New York, NY, USA, 1993. [Google Scholar]
Figure 1.
Frames 1, 10, 19 and 28 of a video removed during cleaning (sign 0061, alif with hamza above). The signing hand stays at the edge of the image, and MediaPipe detected no hand in any frame of this video.
Figure 1.
Frames 1, 10, 19 and 28 of a video removed during cleaning (sign 0061, alif with hamza above). The signing hand stays at the edge of the image, and MediaPipe detected no hand in any frame of this video.
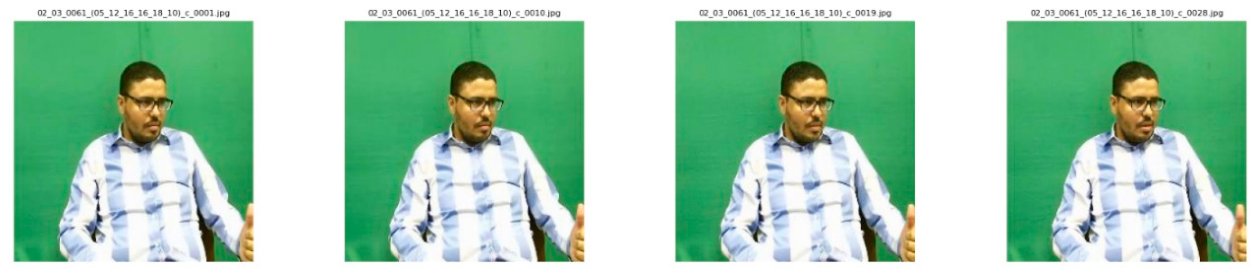
Figure 2.
Interface of the live application, shown before the camera is started. Top left: the camera view with the Start and Stop buttons, the mirror option (off by default, read from the model configuration) and an option to draw the detected hand points. Top right: the status panel, which shows the state of the recognizer (not started, ready, recording, detected) with a short instruction for the user and, after each sign, the recognized letter with the five most probable letters. Middle: the measurement panel used in the live study, with a participant code, an optional target letter that advances automatically after each sign, and buttons to download the results (CSV) and a summary (JSON) or to reset them. Bottom: a log of the events and timings of each sign (“Behind the scenes”); its last line confirms the model loaded by the server (input length 28, 39 classes, window 0.93 s). The page header states that hand detection runs in the browser and that only 126 hand-landmark values per frame are sent to the server.
Figure 2.
Interface of the live application, shown before the camera is started. Top left: the camera view with the Start and Stop buttons, the mirror option (off by default, read from the model configuration) and an option to draw the detected hand points. Top right: the status panel, which shows the state of the recognizer (not started, ready, recording, detected) with a short instruction for the user and, after each sign, the recognized letter with the five most probable letters. Middle: the measurement panel used in the live study, with a participant code, an optional target letter that advances automatically after each sign, and buttons to download the results (CSV) and a summary (JSON) or to reset them. Bottom: a log of the events and timings of each sign (“Behind the scenes”); its last line confirms the model loaded by the server (input length 28, 39 classes, window 0.93 s). The page header states that hand detection runs in the browser and that only 126 hand-landmark values per frame are sent to the server.
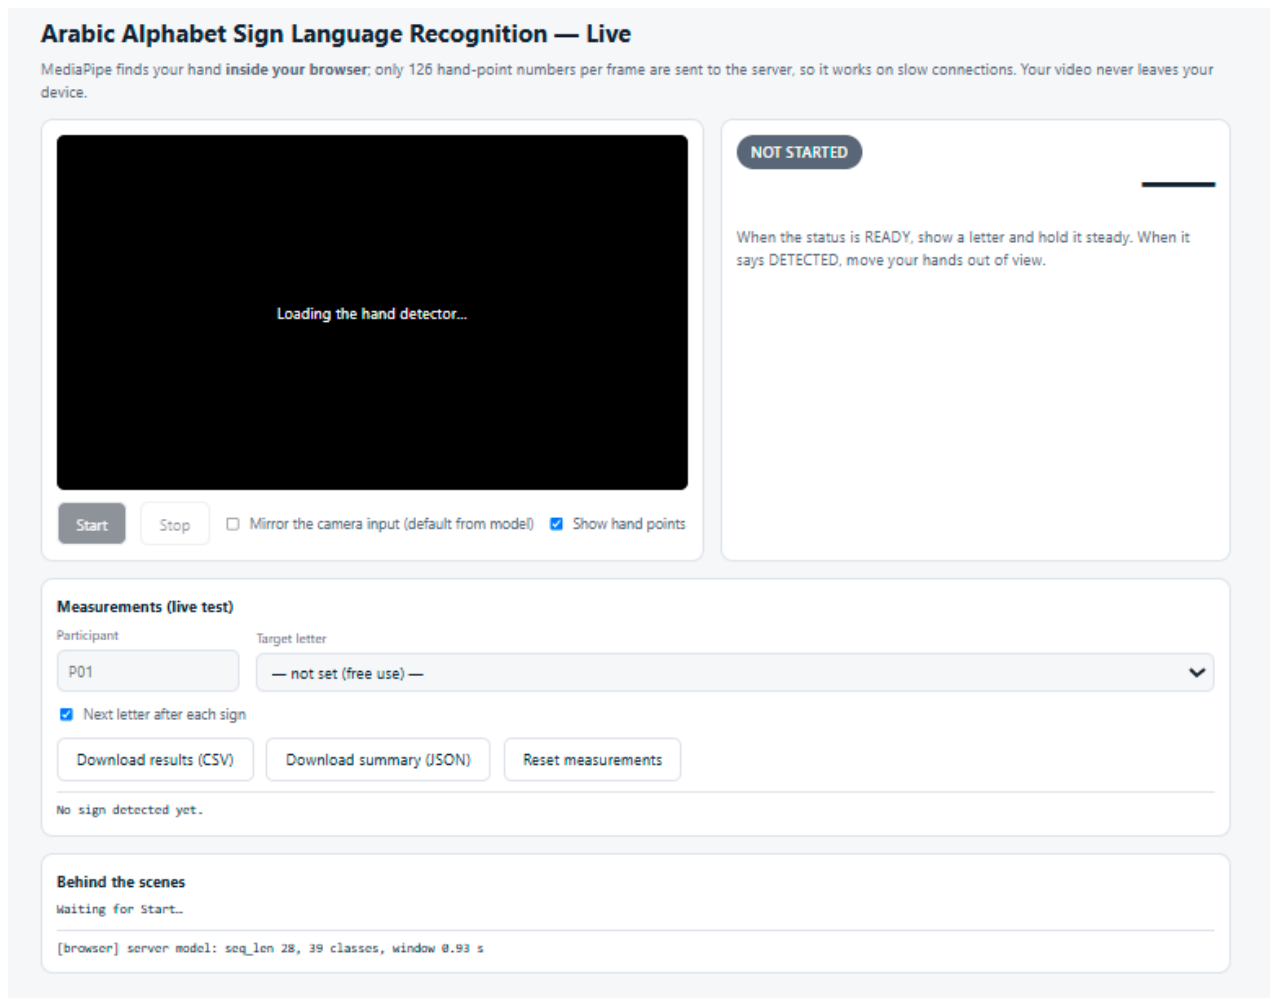
Figure 3.
Video length (number of frames) of the 39 KArSL-502 alphabet signs after cleaning. Each box spans the interquartile range, the orange line marks the median, the whiskers extend to 1.5 times the interquartile range, and circles mark outlying videos. Dashed horizontal lines mark the three input lengths compared in this study: 28 frames (red), 29 frames (blue) and 42 frames (green).
Figure 3.
Video length (number of frames) of the 39 KArSL-502 alphabet signs after cleaning. Each box spans the interquartile range, the orange line marks the median, the whiskers extend to 1.5 times the interquartile range, and circles mark outlying videos. Dashed horizontal lines mark the three input lengths compared in this study: 28 frames (red), 29 frames (blue) and 42 frames (green).
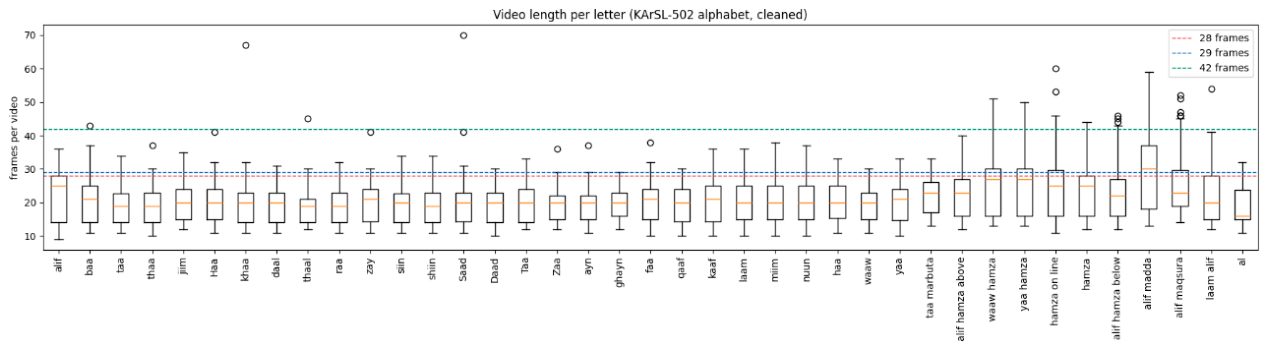
Figure 4.
(a) Histogram of video length for all 5,843 cleaned videos, with the three input lengths marked by dashed lines. (b) Share of videos of each sign that are longer than 28 (red), 29 (blue) and 42 (green) frames, and are therefore truncated at that input length.
Figure 4.
(a) Histogram of video length for all 5,843 cleaned videos, with the three input lengths marked by dashed lines. (b) Share of videos of each sign that are longer than 28 (red), 29 (blue) and 42 (green) frames, and are therefore truncated at that input length.
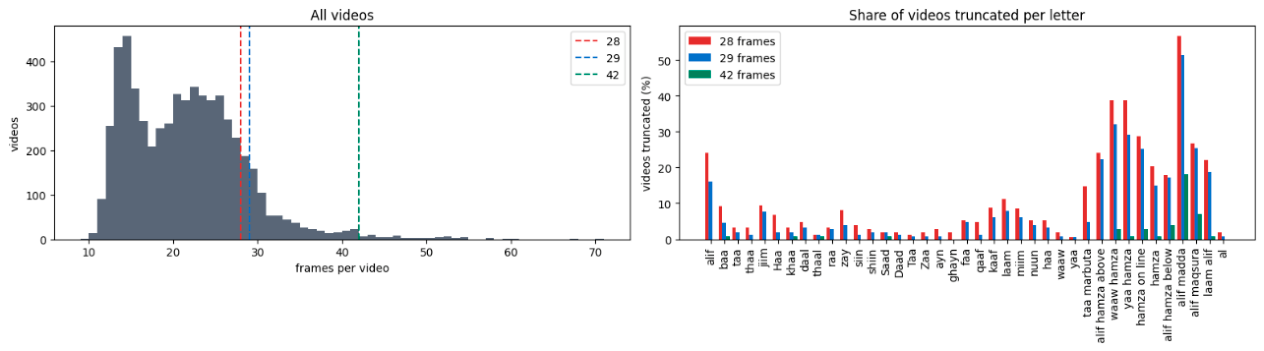
Figure 5.
Signer-independent accuracy of all 13 configurations (mean ± SD over 3 LOSO folds × 5 seeds). Blue: Transformer; orange: BiLSTM; green: TCN. Each label gives the input length (L28, L29, L42), the model and the augmentation setting (aug = with, noaug = without). Error bars are one standard deviation over the 15 runs.
Figure 5.
Signer-independent accuracy of all 13 configurations (mean ± SD over 3 LOSO folds × 5 seeds). Blue: Transformer; orange: BiLSTM; green: TCN. Each label gives the input length (L28, L29, L42), the model and the augmentation setting (aug = with, noaug = without). Error bars are one standard deviation over the 15 runs.
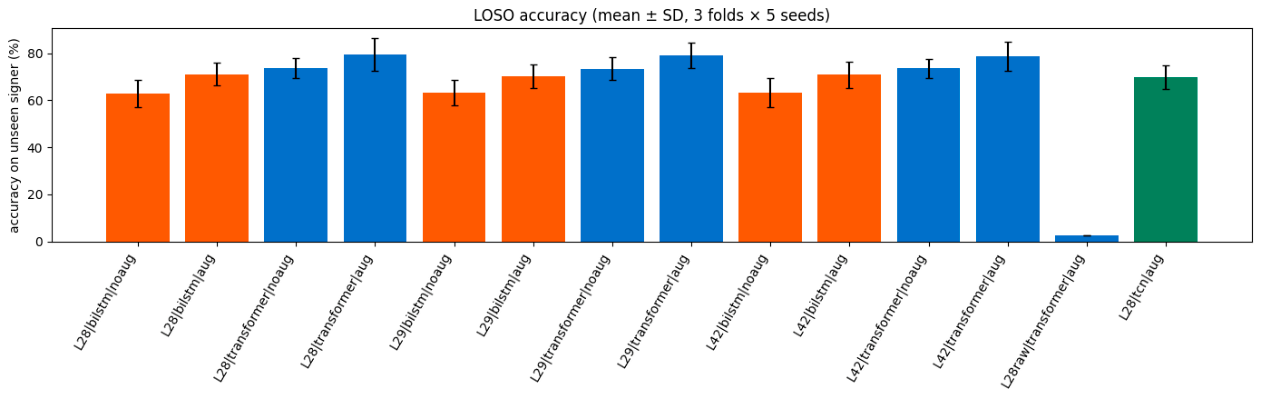
Figure 6.
Ablation around the deployed configuration: change in mean LOSO accuracy, in percentage points, when one component of the full model (Transformer, augmentation, normalization, 28 frames) is changed (values in Table 9).
Figure 6.
Ablation around the deployed configuration: change in mean LOSO accuracy, in percentage points, when one component of the full model (Transformer, augmentation, normalization, 28 frames) is changed (values in Table 9).
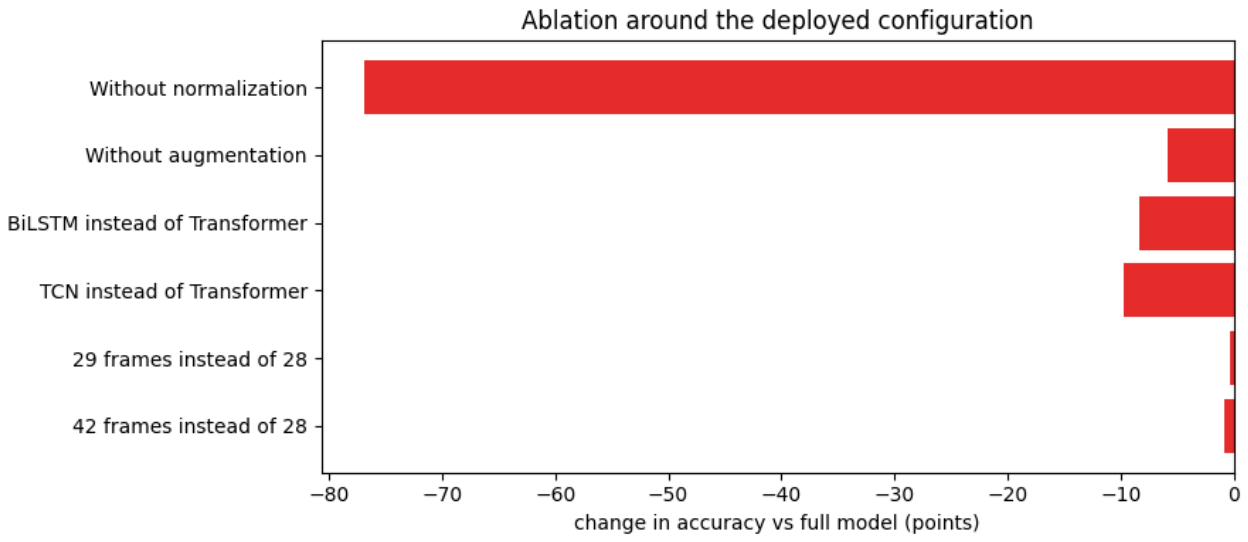
Figure 7.
Per-letter F1 score of the deployed configuration (soft vote over five seeds, all three LOSO folds pooled, 5,843 videos), in sign-ID order from alif (0032) to al (0070).
Figure 7.
Per-letter F1 score of the deployed configuration (soft vote over five seeds, all three LOSO folds pooled, 5,843 videos), in sign-ID order from alif (0032) to al (0070).
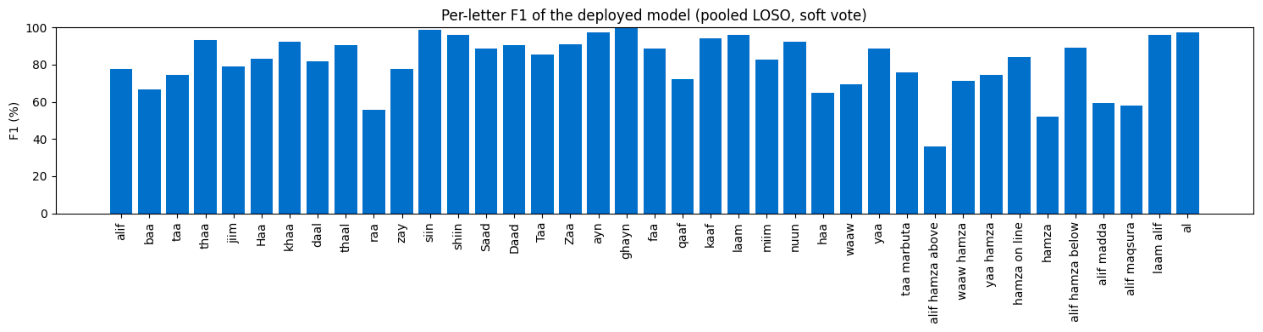
Figure 8.
Pooled signer-independent confusion matrix of the deployed configuration (Transformer, augmentation, L = 28). Each video was predicted by the models of the fold in which its signer was held out, with probabilities averaged over five seeds, and the three folds are pooled (5,843 videos). Rows are true letters and columns predicted letters, in sign-ID order from alif (0032) to al (0070). Colour gives the percentage of the true letter's videos (row-normalized); numbers are video counts, and empty cells are zero.
Figure 8.
Pooled signer-independent confusion matrix of the deployed configuration (Transformer, augmentation, L = 28). Each video was predicted by the models of the fold in which its signer was held out, with probabilities averaged over five seeds, and the three folds are pooled (5,843 videos). Rows are true letters and columns predicted letters, in sign-ID order from alif (0032) to al (0070). Colour gives the percentage of the true letter's videos (row-normalized); numbers are video counts, and empty cells are zero.
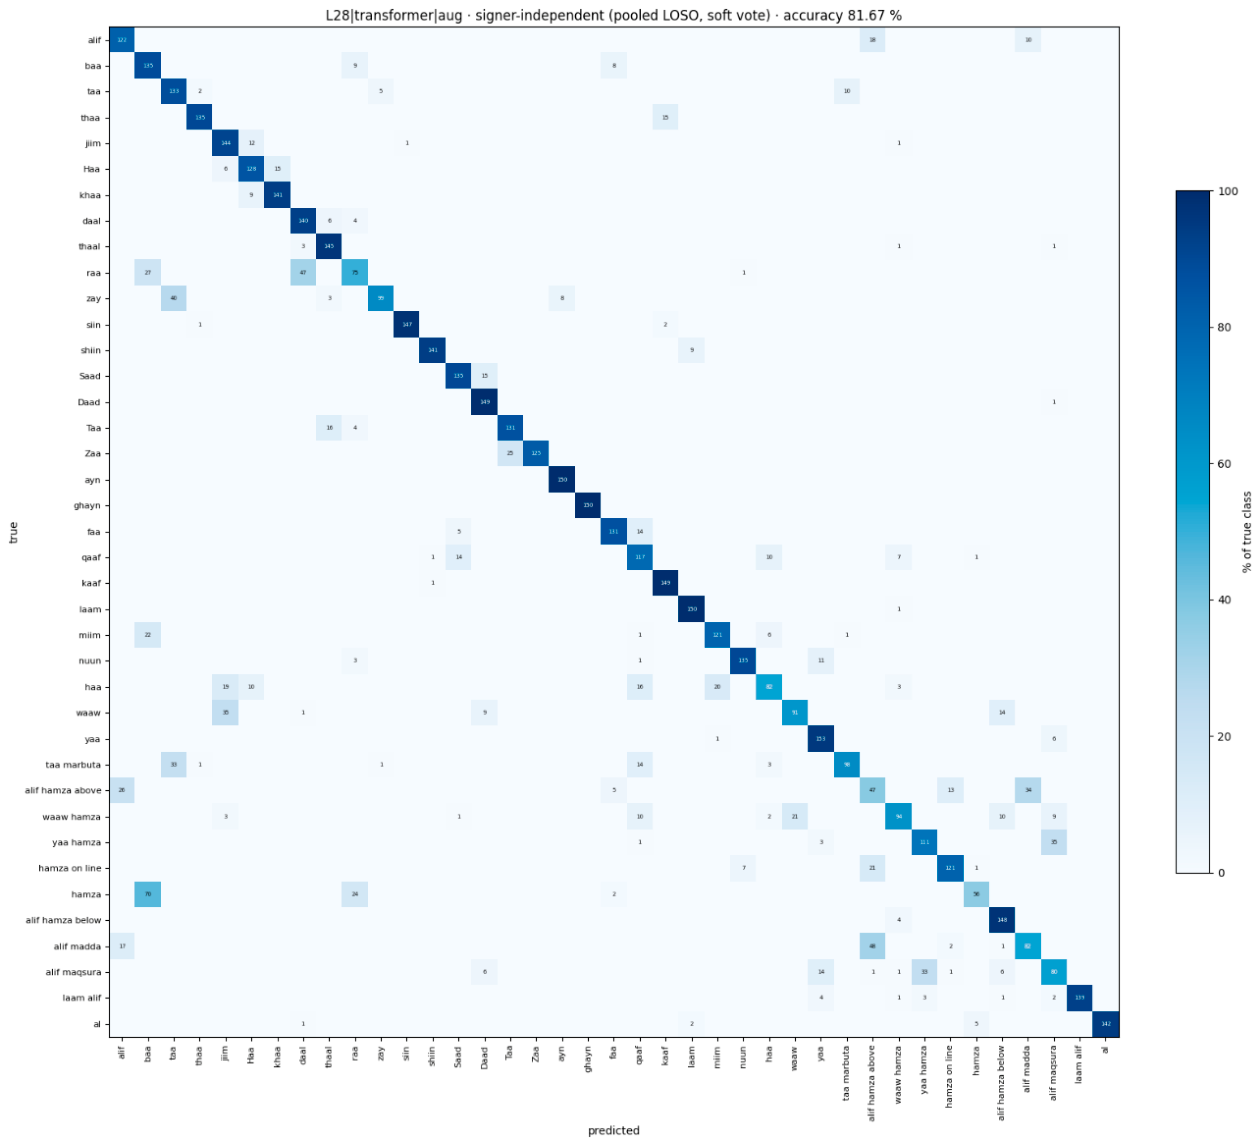
Figure 9.
Accuracy of the deployed Transformer (blue) and of the TCN (green) on their held-out signers under each test condition of Section 3.9 (mean ± SD over 15 fold models; values in Table 14).
Figure 9.
Accuracy of the deployed Transformer (blue) and of the TCN (green) on their held-out signers under each test condition of Section 3.9 (mean ± SD over 15 fold models; values in Table 14).
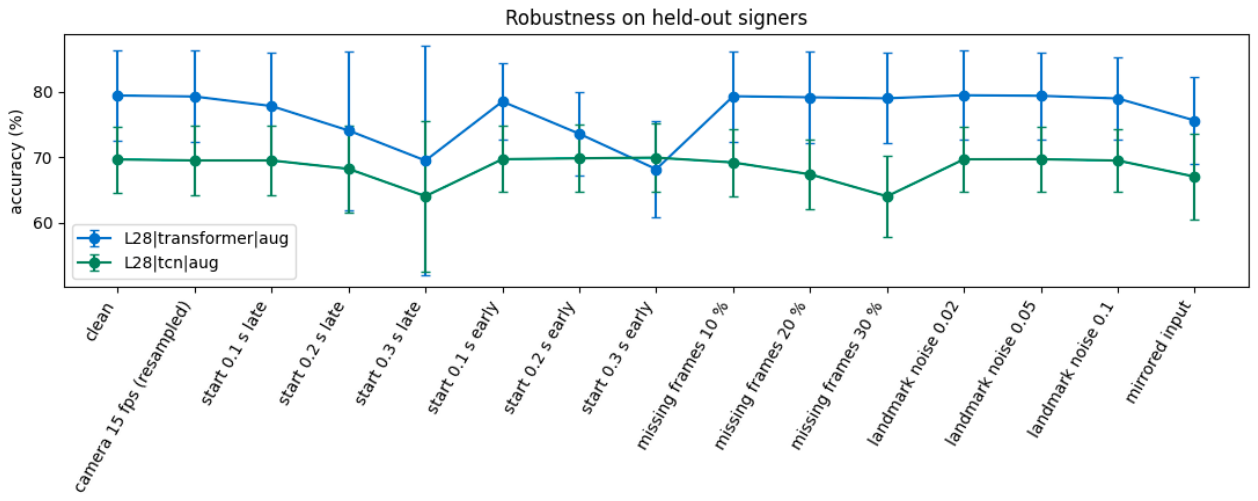
Figure 10.
Live recognition of three letters with similar handshapes by the deployed system: (a) jiim (ج), recognized with a probability of 86%; (b) Haa (ح), 76%; (c) khaa (خ), 87%. Left: camera view with the hand landmarks detected in the browser (the face is masked for privacy). Right: the status panel with the recognized letter and the five most probable letters.
Figure 10.
Live recognition of three letters with similar handshapes by the deployed system: (a) jiim (ج), recognized with a probability of 86%; (b) Haa (ح), 76%; (c) khaa (خ), 87%. Left: camera view with the hand landmarks detected in the browser (the face is masked for privacy). Right: the status panel with the recognized letter and the five most probable letters.
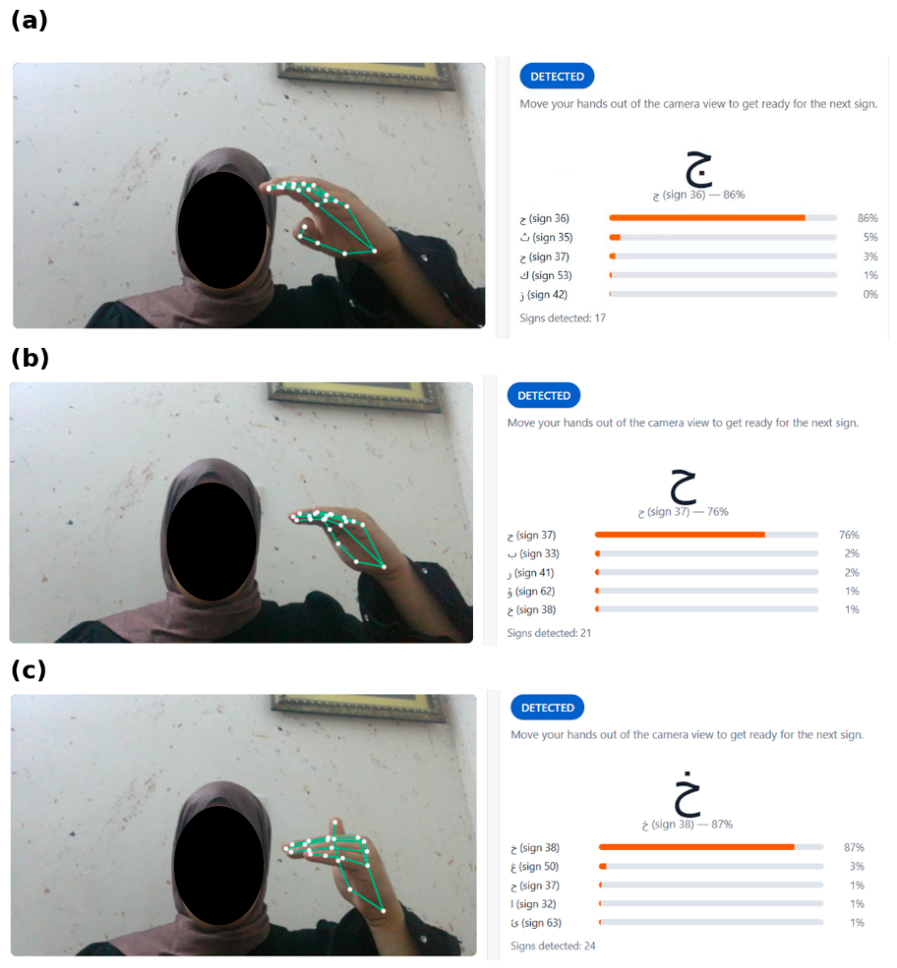
Table 2.
Alphabet videos per signer and dataset partition, before and after cleaning.
| Signer | Train Partition | Test Partition | Total | Removed | Kept |
| 01 | 1,640 | 312 | 1,952 | 0 | 1,952 |
| 02 | 1,639 | 312 | 1,951 | 0 | 1,951 |
| 03 | 1,661 | 312 | 1,973 | 33 | 1,940 |
| Total | 4,940 | 936 | 5,876 | 33 | 5,843 |
Table 3.
Frames with a detected hand, by MediaPipe hand slot (%).
| Signer | “Left” Slot Only | “Right” Slot Only | Both Slots |
| 01 | 60.4 | 39.6 | 0.0 |
| 02 | 58.1 | 38.2 | 3.7 |
| 03 | 61.7 | 37.9 | 0.3 |
Table 4.
Datasets used in the experiments.
| Dataset | Input Length L (Frames) | Duration at 30 fps (s) | Normalization | Array shape (Videos × Frames × Features) | Use |
| L28 | 28 | 0.93 | Yes | 5,843 × 28 × 126 | Main comparison; deployed configuration |
| L29 | 29 | 0.97 | Yes | 5,843 × 29 × 126 | Main comparison |
| L42 | 42 | 1.40 | Yes | 5,843 × 42 × 126 | Main comparison |
| L28raw | 28 | 0.93 | No (raw image coordinates) | 5,843 × 28 × 126 | Normalization ablation (training failed; not reported, Section 3.7) |
Table 6.
Data augmentation applied to the training samples.
| Transformation | Range |
| Rotation of the (x, y) coordinates | ±0.15 rad |
| Scaling | 0.9 to 1.1 |
| Translation | ±0.05 in x and y (in units of palm size, i.e. after normalization) |
| Temporal jitter | 1 or 2 frames dropped, with probability 0.3 |
Table 7.
Signer-independent results (LOSO, mean ± SD over 3 folds × 5 seeds = 15 runs per configuration). L = input length in frames; Aug = training-time augmentation. The deployed configuration is the Transformer with augmentation at L = 28.
Table 7.
Signer-independent results (LOSO, mean ± SD over 3 folds × 5 seeds = 15 runs per configuration). L = input length in frames; Aug = training-time augmentation. The deployed configuration is the Transformer with augmentation at L = 28.
| Model | L | Aug | Accuracy (%) | Macro Precision (%) | Macro Recall (%) | Macro F1 (%) | Top-5 (%) |
| BiLSTM | 28 | No | 63.02 ± 5.80 | 64.58 ± 6.63 | 62.60 ± 5.30 | 59.60 ± 6.45 | 88.57 ± 5.02 |
| BiLSTM | 28 | Yes | 71.08 ± 4.91 | 72.22 ± 5.79 | 70.68 ± 4.57 | 67.83 ± 5.75 | 92.50 ± 4.50 |
| Transformer | 28 | No | 73.55 ± 4.22 | 75.26 ± 3.97 | 73.11 ± 3.95 | 70.80 ± 4.13 | 93.25 ± 3.84 |
| Transformer (deployed) | 28 | Yes | 79.42 ± 6.81 | 81.19 ± 6.41 | 78.98 ± 6.77 | 77.30 ± 7.04 | 95.34 ± 3.20 |
| BiLSTM | 29 | No | 63.33 ± 5.42 | 65.87 ± 5.94 | 62.92 ± 4.89 | 60.29 ± 5.73 | 88.72 ± 4.69 |
| BiLSTM | 29 | Yes | 70.35 ± 5.03 | 72.14 ± 6.55 | 69.97 ± 4.79 | 67.57 ± 5.59 | 92.54 ± 5.12 |
| Transformer | 29 | No | 73.39 ± 4.80 | 75.17 ± 5.23 | 72.93 ± 4.47 | 70.66 ± 4.87 | 93.42 ± 3.86 |
| Transformer | 29 | Yes | 79.15 ± 5.44 | 81.57 ± 4.66 | 78.72 ± 5.39 | 77.12 ± 5.62 | 95.87 ± 2.91 |
| BiLSTM | 42 | No | 63.34 ± 6.13 | 65.45 ± 7.59 | 62.97 ± 5.66 | 60.34 ± 6.67 | 88.43 ± 4.46 |
| BiLSTM | 42 | Yes | 70.86 ± 5.67 | 71.92 ± 7.48 | 70.45 ± 5.42 | 68.05 ± 6.71 | 92.60 ± 4.64 |
| Transformer | 42 | No | 73.61 ± 4.03 | 75.29 ± 3.86 | 73.19 ± 3.77 | 70.86 ± 3.97 | 93.24 ± 4.28 |
| Transformer | 42 | Yes | 78.62 ± 6.09 | 79.68 ± 6.27 | 78.17 ± 5.95 | 76.25 ± 6.54 | 95.28 ± 3.17 |
| Ablation: TCN | 28 | Yes | 69.67 ± 5.03 | 71.47 ± 6.73 | 69.27 ± 4.86 | 67.17 ± 5.40 | 91.61 ± 4.09 |
Table 8.
Accuracy (%) per test signer, mean of five seeds. Each column is one LOSO fold, named by the signer held out for testing.
Table 8.
Accuracy (%) per test signer, mean of five seeds. Each column is one LOSO fold, named by the signer held out for testing.
| Model | L | Aug | Signer 01 | Signer 02 | Signer 03 |
| BiLSTM | 28 | No | 62.36 | 56.89 | 69.81 |
| BiLSTM | 28 | Yes | 73.23 | 64.71 | 75.32 |
| Transformer | 28 | No | 75.98 | 68.29 | 76.38 |
| Transformer (deployed) | 28 | Yes | 86.30 | 71.40 | 80.56 |
| BiLSTM | 29 | No | 62.24 | 57.74 | 69.99 |
| BiLSTM | 29 | Yes | 73.40 | 64.04 | 73.61 |
| Transformer | 29 | No | 75.28 | 67.97 | 76.92 |
| Transformer | 29 | Yes | 84.73 | 72.51 | 80.22 |
| BiLSTM | 42 | No | 62.53 | 56.84 | 70.66 |
| BiLSTM | 42 | Yes | 74.67 | 63.28 | 74.64 |
| Transformer | 42 | No | 75.66 | 69.07 | 76.09 |
| Transformer | 42 | Yes | 84.23 | 70.87 | 80.76 |
| Ablation: TCN | 28 | Yes | 73.64 | 63.35 | 72.03 |
Table 9.
Ablation around the deployed configuration (LOSO, mean ± SD over 15 runs). Change is the difference in mean accuracy from the full model, in percentage points. Changes were computed from unrounded values.
Table 9.
Ablation around the deployed configuration (LOSO, mean ± SD over 15 runs). Change is the difference in mean accuracy from the full model, in percentage points. Changes were computed from unrounded values.
| Setting | Accuracy (%) | Macro F1 (%) | Change (Points) |
| Full model (Transformer, augmentation, normalization, 28 frames) | 79.42 ± 6.81 | 77.30 ± 7.04 | 0.00 |
| Without augmentation | 73.55 ± 4.22 | 70.80 ± 4.13 | −5.87 |
| BiLSTM instead of Transformer | 71.08 ± 4.91 | 67.83 ± 5.75 | −8.33 |
| TCN instead of Transformer | 69.67 ± 5.03 | 67.17 ± 5.40 | −9.75 |
| 29 frames instead of 28 | 79.15 ± 5.44 | 77.12 ± 5.62 | −0.27 |
| 42 frames instead of 28 | 78.62 ± 6.09 | 76.25 ± 6.54 | −0.80 |
Table 10.
The 15 letters with the lowest F1 score, deployed configuration (soft vote over five seeds, all three LOSO folds pooled).
Table 10.
The 15 letters with the lowest F1 score, deployed configuration (soft vote over five seeds, all three LOSO folds pooled).
| Sign ID | Letter | Name | F1 (%) |
| 0061 | أ | alif hamza above | 36.2 |
| 0065 | ء | hamza | 52.1 |
| 0041 | ر | raa | 55.8 |
| 0068 | ى | alif maqsura | 58.0 |
| 0067 | آ | alif madda | 59.4 |
| 0057 | ه | haa | 64.8 |
| 0033 | ب | baa | 66.5 |
| 0058 | و | waaw | 69.5 |
| 0062 | ؤ | waaw hamza | 71.5 |
| 0052 | ق | qaaf | 72.2 |
| 0063 | ئ | yaa hamza | 74.7 |
| 0034 | ت | taa | 74.7 |
| 0060 | ة | taa marbuta | 75.7 |
| 0032 | ا | alif | 77.5 |
| 0042 | ز | zay | 77.6 |
Table 11.
The ten most confused letter pairs, deployed configuration (soft vote, all folds pooled). A → B is the number of videos of the first letter predicted as the second; B → A is the reverse.
Table 11.
The ten most confused letter pairs, deployed configuration (soft vote, all folds pooled). A → B is the number of videos of the first letter predicted as the second; B → A is the reverse.
| Pair | Arabic | Errors | A → B | B → A |
| alif hamza above – alif madda | أ – آ | 82 | 34 | 48 |
| baa – hamza | ب – ء | 70 | 0 | 70 |
| yaa hamza – alif maqsura | ئ – ى | 68 | 35 | 33 |
| daal – raa | د – ر | 51 | 4 | 47 |
| taa – zay | ت – ز | 45 | 5 | 40 |
| alif – alif hamza above | ا – أ | 44 | 18 | 26 |
| taa – taa marbuta | ت – ة | 43 | 10 | 33 |
| baa – raa | ب – ر | 36 | 9 | 27 |
| jiim – waaw | ج – و | 35 | 0 | 35 |
| alif hamza above – hamza on line | أ – ئـ | 34 | 13 | 21 |
Table 12.
Signer-independent results on KArSL reported in the literature and in this work. Signer-level values are given in the order of signers 01/02/03.
Table 12.
Signer-independent results on KArSL reported in the literature and in this work. Signer-level values are given in the order of signers 01/02/03.
| Study | Input | Model | Classes | Protocol | Signer-Independent Accuracy | Directly Comparable |
| Alamri et al. [11] | Skeletal feature transformation | CNN (SCT-DCNN) | 39 letters (signs 0032–0070; described as 40 in [11]) within a 190-class classifier (KArSL-190) | Train on two signers, test on the third | 46.03% (43.0/46.0/49.1), mean computed from the Letters row of Table 10 in [11] | Partly: letter category evaluated inside a 190-class task |
| Almufareh et al. [13] | RGB hand and arm crops, 30 frames | Swin-T + stacked LSTM | 39 letters | Per signer (LOSO implied), single run | 72.53% (72.56/68.69/76.34) | Yes |
| Alyami et al. [14] | MediaPipe hands (+ face), 30 frames | Transformer | KArSL-100 (words) | LOSO | 64.4% hands; 68.2% hands + face | No |
| Kausar et al. [9] | Handcrafted keypoint and shape descriptors | Attention fusion + LSTM | KArSL-100/190/502 | Unclear (official splits and signer-disjoint folds both stated) | 77.34/62.53/47.58% | No |
| This work | MediaPipe hands, wrist and palm normalization, 28 frames | Transformer + augmentation | 39 letters | LOSO, 5 seeds, paired tests | 79.42 ± 6.81% (86.30/71.40/80.56) | — |
Table 13.
Accuracy (%) per test signer: this work against the two studies that report the 39 KArSL letters. Differences are this work minus the published value, in points.
Table 13.
Accuracy (%) per test signer: this work against the two studies that report the 39 KArSL letters. Differences are this work minus the published value, in points.
| Test Signer | Alamri et al. [11] | Almufareh et al. [13] | This work (Mean ± SD, 5 Seeds) | Difference vs Alamri et al. | Difference vs Almufareh et al. |
| 01 | 43.00 | 72.56 | 86.30 ± 0.94 | +43.30 | +13.74 |
| 02 | 46.00 | 68.69 | 71.40 ± 3.18 | +25.40 | +2.71 |
| 03 | 49.10 | 76.34 | 80.56 ± 3.19 | +31.46 | +4.22 |
| Average | 46.03 | 72.53 | 79.42 ± 6.81 | +33.39 | +6.89 |
Table 14.
Robustness of the fold models on their held-out signers (accuracy %, mean ± SD over 15 fold models: 3 folds × 5 seeds). Changes were computed from unrounded values.
Table 14.
Robustness of the fold models on their held-out signers (accuracy %, mean ± SD over 15 fold models: 3 folds × 5 seeds). Changes were computed from unrounded values.
| Condition | Transformer (Deployed) | TCN | Change, Transformer | Change, TCN |
| Clean | 79.42 ± 6.81 | 69.67 ± 5.03 | 0.00 | 0.00 |
| Camera at 15 fps (resampled) | 79.26 ± 6.96 | 69.52 ± 5.23 | −0.15 | −0.15 |
| Start 0.1 s late | 77.81 ± 8.21 | 69.52 ± 5.25 | −1.61 | −0.16 |
| Start 0.2 s late | 74.09 ± 12.09 | 68.24 ± 6.66 | −5.33 | −1.44 |
| Start 0.3 s late | 69.50 ± 17.48 | 64.06 ± 11.49 | −9.92 | −5.61 |
| Start 0.1 s early | 78.50 ± 5.80 | 69.71 ± 5.04 | −0.92 | 0.03 |
| Start 0.2 s early | 73.58 ± 6.45 | 69.84 ± 5.13 | −5.84 | 0.17 |
| Start 0.3 s early | 68.18 ± 7.41 | 69.94 ± 5.21 | −11.23 | 0.27 |
| Missing frames 10% | 79.31 ± 6.88 | 69.21 ± 5.14 | −0.11 | −0.46 |
| Missing frames 20% | 79.15 ± 6.93 | 67.40 ± 5.29 | −0.27 | −2.27 |
| Missing frames 30% | 78.99 ± 6.90 | 64.04 ± 6.25 | −0.43 | −5.63 |
| Landmark noise 0.02 | 79.46 ± 6.83 | 69.70 ± 4.98 | 0.04 | 0.02 |
| Landmark noise 0.05 | 79.37 ± 6.67 | 69.70 ± 4.89 | −0.05 | 0.03 |
| Landmark noise 0.1 | 78.97 ± 6.31 | 69.50 ± 4.76 | −0.45 | −0.17 |
| Mirrored input | 75.61 ± 6.55 | 67.05 ± 6.46 | −3.81 | −2.63 |
Table 15.
Model size and CPU inference time per sign (batch size 1, 28 frames, one CPU thread, 200 timed runs after 10 warm-up runs).
Table 15.
Model size and CPU inference time per sign (batch size 1, 28 frames, one CPU thread, 200 timed runs after 10 warm-up runs).
| Model | Parameters | File Size (MB) | Median Time (ms) | 95th Percentile (ms) |
| Transformer (deployed) | 424,487 | 1.73 | 2.496 | 3.699 |
| BiLSTM | 409,639 | 1.64 | 1.642 | 2.723 |
| TCN | 474,919 | 1.92 | 4.688 | 6.157 |
Table 16.
Live recognition results for 39 classes in the single-participant feasibility test. The table includes all 255 displayed predictions from the 40 analyzed sessions. Class accuracy is calculated using the number of displayed predictions for each target class. Median probability = median probability of the predicted letter over the decisions of that class. Wrong predictions lists the predicted letter and its probability for each wrong decision.
Table 16.
Live recognition results for 39 classes in the single-participant feasibility test. The table includes all 255 displayed predictions from the 40 analyzed sessions. Class accuracy is calculated using the number of displayed predictions for each target class. Median probability = median probability of the predicted letter over the decisions of that class. Wrong predictions lists the predicted letter and its probability for each wrong decision.
| Sign ID | Letter | Name | Decisions | Correct | Accuracy (%) | Median Probability | Wrong Predictions (Letter, Probability) |
| 0032 | ا | alif | 7 | 7 | 100.0 | 0.95 | — |
| 0033 | ب | baa | 6 | 6 | 100.0 | 0.88 | — |
| 0034 | ت | taa | 6 | 6 | 100.0 | 0.91 | — |
| 0035 | ث | thaa | 6 | 6 | 100.0 | 0.95 | — |
| 0036 | ج | jiim | 6 | 6 | 100.0 | 0.88 | — |
| 0037 | ح | Haa | 7 | 7 | 100.0 | 0.90 | — |
| 0038 | خ | khaa | 6 | 6 | 100.0 | 0.90 | — |
| 0039 | د | daal | 7 | 6 | 85.7 | 0.59 | waaw hamza, 0.58 |
| 0040 | ذ | thaal | 7 | 7 | 100.0 | 0.62 | — |
| 0041 | ر | raa | 6 | 6 | 100.0 | 0.86 | — |
| 0042 | ز | zay | 6 | 6 | 100.0 | 0.92 | — |
| 0043 | س | siin | 6 | 6 | 100.0 | 0.66 | — |
| 0044 | ش | shiin | 7 | 6 | 85.7 | 0.60 | siin, 0.70 |
| 0045 | ص | Saad | 6 | 6 | 100.0 | 0.87 | — |
| 0046 | ض | Daad | 6 | 6 | 100.0 | 0.81 | — |
| 0047 | ط | Taa | 7 | 6 | 85.7 | 0.76 | Haa, 0.56 |
| 0048 | ظ | Zaa | 8 | 6 | 75.0 | 0.87 | hamza, 0.43; raa, 0.85 |
| 0049 | ع | ayn | 6 | 6 | 100.0 | 0.89 | — |
| 0050 | غ | ghayn | 6 | 6 | 100.0 | 0.89 | — |
| 0051 | ف | faa | 6 | 6 | 100.0 | 0.87 | — |
| 0052 | ق | qaaf | 7 | 7 | 100.0 | 0.74 | — |
| 0053 | ك | kaaf | 7 | 7 | 100.0 | 0.90 | — |
| 0054 | ل | laam | 6 | 6 | 100.0 | 0.70 | — |
| 0055 | م | miim | 8 | 8 | 100.0 | 0.92 | — |
| 0056 | ن | nuun | 5 | 5 | 100.0 | 0.92 | — |
| 0057 | ه | haa | 7 | 7 | 100.0 | 0.93 | — |
| 0058 | و | waaw | 5 | 4 | 80.0 | 0.76 | waaw hamza, 0.49 |
| 0059 | ي | yaa | 6 | 6 | 100.0 | 0.86 | — |
| 0060 | ة | taa marbuta | 6 | 6 | 100.0 | 0.95 | — |
| 0061 | أ | alif hamza above | 11 | 9 | 81.8 | 0.82 | alif madda, 0.40; alif, 0.82 |
| 0062 | ؤ | waaw hamza | 6 | 5 | 83.3 | 0.78 | waaw, 0.39 |
| 0063 | ئ | yaa hamza | 6 | 5 | 83.3 | 0.66 | miim, 0.23 |
| 0064 | ئـ | hamza on line | 7 | 6 | 85.7 | 0.88 | hamza, 0.66 |
| 0065 | ء | hamza | 7 | 7 | 100.0 | 0.94 | — |
| 0066 | إ | alif hamza below | 6 | 6 | 100.0 | 0.94 | — |
| 0067 | آ | alif madda | 9 | 5 | 55.6 | 0.74 | alif, 0.91; alif, 0.59; alif, 0.47; alif, 0.36 |
| 0068 | ى | alif maqsura | 6 | 1 | 16.7 | 0.66 | yaa, 0.61; yaa, 0.72; yaa, 0.70; yaa, 0.84; yaa hamza, 0.62 |
| 0069 | لا | laam alif | 6 | 6 | 100.0 | 0.92 | — |
| 0070 | ال | al | 6 | 6 | 100.0 | 0.94 | — |
| Total | 255 | 235 | 92.16 | 0.87 | 20 errors |
Table 17.
Timing of the live pipeline over the 255 decisions of Table 16 (median and interquartile range). Camera frames are resampled to the 28 model steps (Section 3.10).
Table 17.
Timing of the live pipeline over the 255 decisions of Table 16 (median and interquartile range). Camera frames are resampled to the 28 model steps (Section 3.10).
| Measure | Unit | Median | Interquartile Range |
| First frame with a hand to the decision | s | 0.82 | 0.80 to 0.84 |
| Camera frames received per sign | frames | 14 | 13 to 14 |
| Browser frame rate | frames/s | 12.9 | 12.5 to 13.3 |
| Hand detection in the browser, per frame | ms | 64.4 | 61.7 to 67.7 |
| Server processing per request | ms | 3.9 | 3.2 to 5.9 |
| Model inference per sign | ms | 2.65 | 2.45 to 3.04 |
| Browser–server round trip per request | ms | 384 | 289 to 475 |
| Decision to displayed result | s | 0.61 | 0.48 to 0.79 |
| First detected hand frame to displayed result | s | 1.43 | 1.31 to 1.64 |
Disclaimer/Publisher’s Note: The statements, opinions and data contained in all publications are solely those of the individual author(s) and contributor(s) and not of MDPI and/or the editor(s). MDPI and/or the editor(s) disclaim responsibility for any injury to people or property resulting from any ideas, methods, instructions or products referred to in the content. |
© 2026 by the authors. Licensee MDPI, Basel, Switzerland. This article is an open access article distributed under the terms and conditions of the Creative Commons Attribution (CC BY) license.
Copyright: This open access article is published under a Creative Commons CC BY 4.0 license, which permit the free download, distribution, and reuse, provided that the author and preprint are cited in any reuse.