
Submitted:
11 November 2026
Posted:
12 November 2026
You are already at the latest version
Abstract
Background: Clinical resuscitation of pediatric diabetic ketoacidosis (DKA) using intravenous fluids and insulin coincides with unpredictable complications, including acute kidney injury, long-term neurocognitive deficits, and rare but catastrophic cerebral edema. The precise molecular mechanisms connecting acute rehydration to post-hydration microvascular strain and blood-brain barrier breakdown remain poorly defined. Methods: We synthesized multi-cohort biomarker data from pediatric DKA cases to map the temporal kinetics of systemic inflammatory signaling, proteolytic matrix remodeling, and metabolic toxicity during rehydration. Results: Rehydration triggers a biphasic molecular shift rather than immediate resolution. Protective IL-10 precipitously declines within 6-8 hours, permitting a surge in pro-inflammatory cytokines (IL-1β, IL-1α, IL-6, IL-8) and Th17 mediators (IL-17, GM-CSF) between 6 and 24 hours. Concurrently, rehydration drives alternative complement activation (C3a, Bb), matrix metalloproteinase spikes (MMP-3, MMP-9), reactive dicarbonyl accumulation ("3-deoxyglucosone" ), and soluble RAGE depletion. Central nervous system tissue reveals post-treatment blood-brain barrier degradation via claudin-5 and ZO-1 loss, astrocytosis, and microvascular RAGE expression. Additionally, neurotoxic quinolinic acid steadily accumulates post-resuscitation, remaining elevated for up to 3 months. Conclusions: Intravenous rehydration acts as a biological trigger that amplifies sterile inflammation, dicarbonyl toxicity, and proteolytic blood-brain barrier breakdown. Mitigating post-hydration neurovascular signaling represents a key therapeutic target to prevent secondary end-organ injury.
Keywords:
diabetic ketoacidosis
; cerebral edema
; systemic inflammatory response
; intravenous rehydration
1. Introduction
Significant technological advances have transformed type 1 diabetes (T1D) management, markedly improving glycemic control and reducing acute mortality. These innovations encompass optimized basal-bolus regimens combining long-acting basal insulin analogs (e.g., glargine, degludec) with rapid- or ultra-rapid-acting mealtime formulations (e.g., lispro, aspart, glulisine), continuous subcutaneous insulin infusion [1], and inhaled mealtime insulin for eligible adolescents and adults [2]. Furthermore, automated insulin delivery systems link continuous glucose monitors to insulin pumps via predictive algorithms to dynamically modulate basal delivery and administer correction boluses [3], while advances in allogeneic pancreatic islet [4] and whole-pancreas transplantation [5] have broadened therapeutic options.
Despite these clinical strides, diabetic ketoacidosis (DKA) persists as a life-threatening acute complication defined by absolute or relative insulin deficiency, severe metabolic decompensation, autoimmunity [6] and systemic inflammation [7]. Although standard treatment effectively corrects hyperglycemia and acidemia, the profound systemic inflammatory response mobilized during DKA remains critically underappreciated. This inflammatory cascade operates through many interconnected molecular networks, including the tryptophan/kynurenine pathway [8], the α-dicarbonyl/AGE-RAGE axis [9], prostaglandin synthesis [7], von Willebrand factor (vWF) release [10], elevated arginine vasopressin secretion [11,12], and acute-phase reactants such as C-reactive protein [13]. Historically, life-threatening complications, most notably subclinical neurocognitive deficits [14] and catastrophic cerebral edema [15,16] were attributed almost exclusively to rapid iatrogenic osmotic shifts [11,17] or idiopathic vascular events [18].
However, emerging evidence challenges the traditional view of intravenous fluid resuscitation as mere passive osmotic volume expansion. In practice, fluid administration acts as an active biological mediator: it alters vascular hemodynamics, temporarily depresses metabolic pH before definitive correction, and mobilizes circulating metabolic factors [19,20,21]. Rather than mitigating risk immediately, this rapid resuscitation can trigger transient, synergistic molecular interactions that amplify immune activation and drive secondary immunovascular and neuronal injury [22,23].
To address these unresolved mechanistic questions and define a timeline of cellular activation, we conducted a comprehensive, multi-tiered biomarker evaluation compiled from published clinical cohorts of pediatric and adolescent DKA cases managed with rehydration. Rather than assessing isolated metabolic endpoints, this study maps the simultaneous longitudinal trajectories of immune mediators, complement assembly, matrix metalloproteinases, endothelial shear markers, and neuroinjury indicators across multiple time points compiled from the published studies. By delineating the temporal kinetics of these intersecting cascades, we provide a unified molecular framework illustrating how standard intravenous fluid intervention actively shapes systemic and neurovascular inflammation during acute DKA recovery.
2. Materials and Methods
Study Design and Cohort Aggregation
To delineate the temporal kinetics of systemic inflammation and concurrent end-organ injury during DKA resuscitation, we synthesized patient-level data from an aggregated cohort of pediatric and adolescent T1D cases. All included patients met standardized diagnostic criteria for DKA, defined by marked hyperglycemia (blood glucose > 200-250 mg/dL), high anion gap metabolic acidosis (venous pH < 7.30 or arterial pH < 7.25; serum bicarbonate < 15 mEq/L; anion gap > 12 mEq/L), and elevated ketone production (serum β-hydroxybutyrate > 3.0 mmol/L and/or urine ketones ≥ 2+).
Clinical management followed standardized protocols for intravenous fluid resuscitation and insulin replacement. To separate treatment-induced inflammatory kinetics from baseline infectious confounders, published studies excluded patients with active clinical infections or major secondary systemic comorbidities. We grouped disparate time points into consistent phases (Baseline/0 h, early resuscitation/2-12 h, active therapy/24 h, and recovery/120 h to 3 months). Across the aggregate cohort, we stratified subjects into five specialized analytical biomarker modules based on sample availability and assay focus (Table 1). We believe this is the first time that these data have been assimilated from multiple studies into a coherent timeline during DKA resuscitation.
Generative artificial intelligence assisted in analyzing, synthesizing, and interpreting the timeline studies across the five specialized analytical biomarker modules.
3. Results
3.1. Phase-by-Phase Summary of Cytokine and MMP Changes
Across clinical studies of DKA in children and adolescents, the initiation of intravenous fluid and insulin therapy triggers a distinct, biphasic systemic inflammatory response syndrome [13,22,25]. Prior to intravenous fluids and insulin, IL-10 concentrations are markedly elevated, often reaching the highest absolute levels among all measured cytokines, particularly in children with moderate-to-severe DKA [22,25]. Mild-to-moderate elevations are seen in IL-6, IL-1β, IL-8, IL-2, and TNF-α prior to intervention [13,22,25]. Admission pH correlated negatively with IL-8 and IL-6 [25], indicating that systemic cytokine release parallels acidosis severity.
In the early resuscitation window (6 to 12 hours post-initiation, circulating IL-10 drops dramatically back to normal or near-baseline levels [22,25] (Figure 1). In severe DKA, the magnitude of this rapid IL-10 decline correlates with admission serum osmolality [25]. In contrast to the IL-10 crash, pro-inflammatory cytokines (IL-1β, TNF-α, IL-6, and IL-8) surge to higher levels between 6 and 12 hours after starting insulin and rehydration [13,22,28] (Figure 1). Over 69% (27 of 39) of assayed cytokines and chemokines peak during this 6- to 12-hour window [28]. In contrast to these findings, Nett et al. found that IL-6 and TNF-α declined during this time [23]. Unlike other pro-inflammatory markers, IL-2 levels plummet sharply at 6 to 8 hours in most patients before rebounding later in treatment [22]. A broad multiplex screen confirmed significant alterations during acute therapy in IL-1RA, IL-6, IL-8, IL-10, IL-18, CXCL5, CXCL10 (downregulated), CCL27, TRAIL, and G-CSF compared with non-DKA type 1 diabetes reference controls [24]. These cytokines were associated with clinical manifestations. This 6 to 12 hour inflammatory surge corresponded to the typical timeframe in which subclinical brain edema progresses, interstitial pulmonary edema accentuates, and clinical brain edema manifests [13,22,25]. In patients exhibiting transient cardiac diastolic abnormalities at 6 to 12 hours, nine cytokines/chemokines were significantly altered, including prominent Th17-related cytokines: IL-17, GM-CSF, G-CSF, and IL-12p40 [28]. Patients who developed DKA-related cerebral edema had higher concentrations of IL-2, IL-6, and TNF-α than uncomplicated DKA and non-DKA controls [27].
In the sub-acute treatment window (24 hours post-initiation, median concentrations of IL-1β, TNF-α, and IL-8 remain significantly elevated at 24 hours compared to post-resolution baseline values [22] and a secondary rise in IL-2 begins around 24 hours [22] (Figure 1). By 24 hours, circulating IL-1β, IL-6, and IL-8 correlate significantly with peripheral lymphocytes [22]. High-sensitivity C-reactive protein shows strong positive correlations with IL-6, IL-8, and IL-1β [13,25].
During the convalescent/resolution period 120 hours to 2 to 5 days post-DKA) there is a general inflammatory clearance (Figure 1). After 120 hours, pro-inflammatory cytokines such as IL-6, IL-8, and TNF-α return to baseline levels in most patients [22,25]. In a subset of individuals, modest elevations in IL-1β, IL-6, and TNF-α persist, reflecting prolonged systemic cellular activation [13,22]. However, in comprehensive profiling 2 to 5 days post-DKA resolution, interleukin-1 receptor antagonist remains significantly elevated alongside tissue remodeling markers (MMP-3, MMP-10, TIMP-1), indicating ongoing, delayed immune modulation after metabolic recovery [24] (Figure 1).
At 2 h post-resuscitation, MMPs were altered. MMP-9 was significantly higher in children with DKA than in diabetic controls and remained elevated during therapy; MMP-2 was depressed and rose during this time, while MMP-3 was initially low but increased [26] (Figure 1). MMP-9 levels were positively associated with HbA1C but remained significantly elevated in DKA after adjusting for chronic glycemic control. Circulating MMP-2 levels directly correlated with initial serum pH at both 2 h and 4-16 h, and with initial bicarbonate at 4-16 h, and MMP-3 levels correlated inversely with sodium concentrations [26]. Xu et al. supported these observations, finding MMP-3 markedly elevated in DKA patients with cerebral edema compared with uncomplicated DKA and baseline T1DM controls. MMP-9 was the highest among DKA patients with cerebral edema, followed by uncomplicated DKA and T1DM controls. In contrast to MMP-3 and MMP-9, circulating MMP-2 was significantly depressed in DKA patients with cerebral edema compared to uncomplicated DKA and T1DM controls [27].
3.2. Phase-by-Phase Summary of Innate Immune Cells and Complement Activation
Studies found that hydration perturbed C3a, Bb, and the terminal membrane attack complex (sC5b-9) (Figure 2). Plasma C3a levels were elevated in 3 of 5 patients at presentation [29]. After treatment initiation, all patients showed further increases in C3a levels at 6 to 8 hours, and 4 of 5 patients continued to see increases at 24 hours. At 24 hours, levels were significantly higher than baseline, and at 120 hours, 4 patients still showed elevated levels. During the first 24 hours, C3a’s upward trajectory was significantly inversely related to falling glucose levels [29]. Factor Bb (a marker of alternative pathway activation) was elevated in 2 of 5 patients on admission. It increased across all patients from 6 to 8 hours and was significantly higher at 24 hours than at 120 hours. Elevated C3a and minimal classical pathway activation (C4a was elevated in only one patient) point to the alternative pathway as the primary route of complement activation during DKA treatment. The terminal membrane attack complex, sC5b-9, was elevated in all patients at admission and during the first 6 to 8 hours of therapy. In contrast to C3a and Bb, sC5b-9 decreased significantly from pretreatment levels by 24 hours in 4 of 5 patients [29].
Initial levels of HLA − DR+CD3+ activation (Figure 3) were relatively low prior to treatment, with a significant increase in the percentage of activated HLA-DR+/CD3+ peripheral T-lymphocytes after 24 hours of DKA therapy [30], occurring in 5 out of 6 patients. Total T-cell counts, CD4+, CD8+, and γδ TCR subsets did not change significantly over the study period. CD3+ T cell activation showed no correlation with admission glucose, osmolality, or electrolytes, though lower admission pH showed a non-significant trend toward greater activation [30]. Baseline absolute neutrophil count was markedly elevated at presentation and declined significantly over time following rehydration and insulin administration, dropping to an overall mean of 5,765.2/mm3 at 24 hours and normalizing to 2,967/mm3 at 120 hours [25]. The elevation and subsequent drop in absolute neutrophil count were most pronounced in the moderate/severe DKA group compared to the mild group [25]. White blood cell counts were evaluated by Hoffman et al. [30] and Karavanaki et al. [25]. In Hoffman et al. [30], mean admission white blood cell count was elevated to 19,300/mm3 and this strongly correlated with admission blood glucose levels. In Karavanaki et al. [25], the overall baseline white blood cell count was 15,238.4/mm3, with significantly higher levels in children with moderate/severe DKA and a strong negative correlation with arterial pH. Both papers reported that the white blood cell count dropped significantly during therapy [25,30], resolving without antibiotic therapy as stress hormones subsided.
3.3. Phase-by-Phase Summary of Neuroinjury Markers
Tryptophan, 5-OH-tryptophan, 5-HIAA, and kynurenine pathway metabolites were perturbed. Tryptophan concentrations reached their lowest levels during early treatment (6 to 12 hours) in 11 of 15 patients, then rebounded significantly at 2 weeks and 3 months [8] (Figure 4A). Metabolites downstream of tryptophan followed a similar depletion trajectory: 5-OH-tryptophan and 5-hydroxyindoleacetic acid were lowest at early treatment (6 to 12 hours) and rose significantly at follow-up [8]. Plasma kynurenine was also lower during early treatment and progressively increased at 2 weeks and 3 months. Quinolinic acid, an N-methyl-D-aspartate receptor agonist and neurotoxin, was lowest early in treatment and rose steadily through 2 weeks and 3 months. Both xanthurenic acid and picolinic acid followed the typical tryptophan/kynurenine pathway pattern: depressed early during treatment (6 to 12 hours), followed by subsequent rises at 2 weeks and 3 months [8] (Figure 4A).
Amino acid classes, including branched-chain, glucogenic/Krebs-derived, and urea cycle/basic, were also altered (Figure 4B). Glutamate and glutamine were depressed at 6 to 12 hours of treatment and increased significantly by 3 months [8]. N-acetylglutamate exhibited marked suppression during early treatment before rebounding significantly at 2 weeks and 3 months [8]. Aspartate showed an inverse pattern: it peaked during early treatment (6 to 12 hours), declined sharply at 2 weeks, and rebounded at 3 months [8]. Taurine (a cytoprotective, osmoregulatory amino acid) was lowest during early treatment and rose continuously through 3 months [8] (Figure 4B). While these sections did not quantify specific branched-chain amino acids (leucine, isoleucine, valine) individually, Hoffman et al. noted that amino acid availability influences the transport and synthesis of kynurenine pathway metabolites [8]. In addition, Carl et al. (2003) noted that essential amino acid depletion (such as arginine and tryptophan) occurs prior to and during early DKA treatment, influencing endothelial and hemostatic function [10].
Glial fibrillary acidic protein was measurable in plasma in 45% of pediatric DKA patients [23]. Levels did not change significantly over the first 24 hours of therapy, but surprisingly, glial fibrillary acidic protein correlated positively with mental status. Patients with a normal Glasgow Coma Scale (GCS = 15) had significantly higher plasma GFAP levels at consent than those with depressed mental status. S100β was detectable in only 2 out of 30 patients [23].
3.4. Phase-by-Phase Summary of Endothelial Shear and Osmoregulation
Both vWF antigen and vWF activity were markedly elevated on admission prior to treatment across all patients, reflecting severe acute endothelial cell activation and injury [10] (Figure 5A). Following fluid and insulin management, both values declined significantly. Although half the patients returned toward normal by 24 hours, mean vWF antigen and vWF activity remained significantly above the upper reference limit even at 120 hours, indicating sustained endothelial perturbation.
Protein C activity was significantly depressed by DKA before treatment vs. the post-treatment baseline at 120 hours (Figure 5B). It remained depressed at 6 and 24 hours before slowly recovering by 120 hours [10]. Protein C antigen was initially elevated above the reference range and trended downward toward the normal range during the initial 24 hours of therapy before returning to a high-normal baseline [10] (Figure 5B). Free protein S remained consistently depressed below the lower limit of normal across all time points (admission through 120 hours) (Figure 5B). This chronic/persistent reduction is attributed to elevated binding by acute-phase reactants (such as C4b-binding protein), which was not measured [10]. Homocysteine was significantly decreased below normal on admission and rose rapidly to the normal reference range within 6 h with therapy and then remained stable to 120 h, but Protein S remained below the normal limits [10] Figure 5B).
Subclinical brain edema was present on admission before treatment in 6 of 7 patients. Lateral ventricular size, quantified by intercaudate diameter, was significantly narrowed on admission and at 6 hours compared to convalescence/discharge [37] (Figure 5C). Baseline brain edema correlated directly with blood glucose but inversely with plasma HCO3- levels. The change in effective plasma osmolality was the predominant predictor of worsening brain edema during therapy [37]. Plasma vasopressin and hematocrit levels were markedly elevated at admission and dropped following fluid administration at 6 hours, with a further decline at 12 hours [37] (Figure 5C).
In Durr et al., admission glucose correlated with baseline edema, and the rate of glucose reduction correlated with edema at 6 hours [37]. However, in Tiwari et al.’s clinical cohort, neither admission glucose nor the rate of glucose decline in the first 12 hours differed between children with and without cerebral edema [33]. Mean admission osmolarities were elevated [10,33,37] (Figure 5D). Tiwari et al. found that the decline in serum osmolality during the first 12 hours was not associated with overall cerebral edema, though absolute osmolality remained persistently higher at 6 to 12 hours and 24 hours in the cerebral edema group due to severe dehydration/azotemia [33]. Sodium rose gradually with treatment [10,33,37] (Figure 5D), and there were no differences in serum sodium between edema and non-edema groups across time points [33]. Baseline BUN was moderately elevated [10,33,37]. In Tiwari et al., azotemia at admission was an independent predictor for cerebral edema, and these patients maintained significantly higher blood urea throughout 24 h [33]. Creatinine was significantly higher in cerebral edema patients at admission and continued to remain high at 6 to 12 hours and at 24 hours. Baseline pH ranged from severe acidemia across studies. Tiwari et al. showed that admission pH was significantly lower in patients developing cerebral edema [33]. Severe admission depletion of HCO3- was characteristic and was strongly and inversely correlated with initial brain edema [37] throughout 6 to 12 hours and at 24 hours. Admission hypocapnia was severe [25,33]. At 6 to 12 hours of treatment, cerebral edema patients exhibited lower PaCO2 consistent with deeper acidosis, respiratory compensation, and severe microvascular dysregulation (Figure 5D).
Copeptin was markedly elevated at admission (0 hours), and this correlated with a severely hyperosmolar state [11]. During active treatment (6 to 24 hours), copeptin progressively declined, and osmolality normalized. By 72 hours, copeptin had normalized, and the final osmolality values had stabilized [11] (Figure 5C).
3.5. Phase-by-Phase Summary of Carbonyl Stress, Advanced Glycation, and Oxidative Pathways
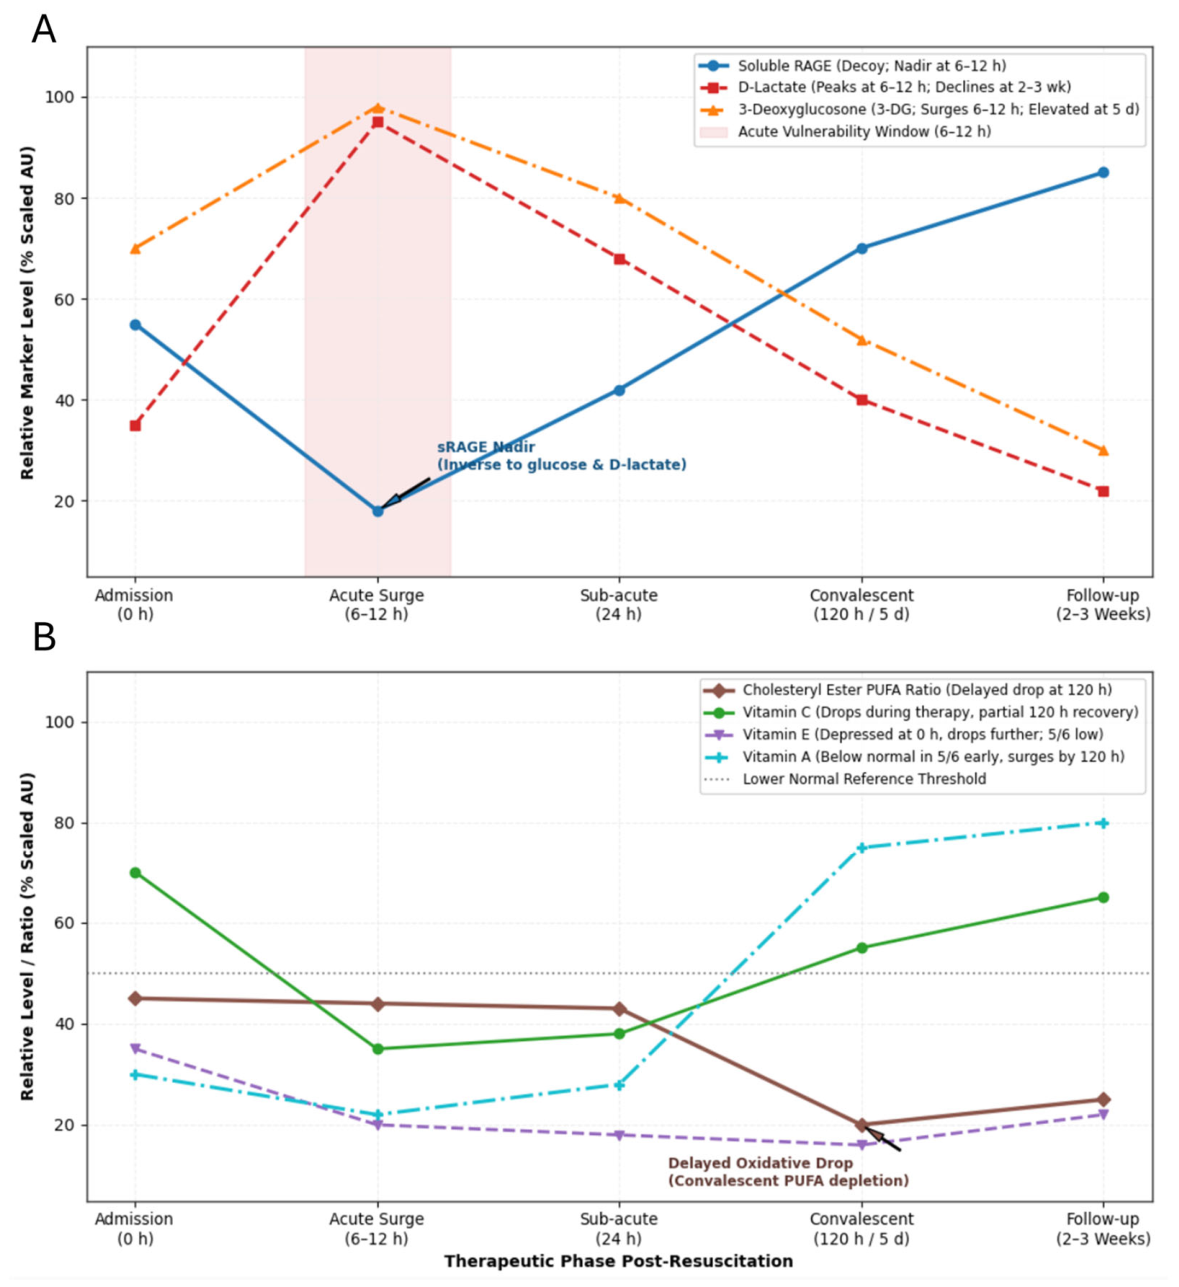
Median circulating soluble RAGE at 6 to 12 hours was lowest and showed a strong negative correlation with admission blood glucose and a negative correlation with elevated D-lactate [34] (Figure 6A). Serum D-Lactate concentrations peaked between 6 and 12 hours and then declined by 2 to 3 weeks. 3-DG was already significantly elevated before treatment (0 hours), and it surged further by 6 to 12 hours. 3DG levels correlated with the initial hyperglycemia [35]. 3DG levels remained mildly elevated between 120 hours and 5 days relative to nondiabetic controls [35] (Figure 6A).
Lipid peroxidation indices and antioxidant vitamins were altered during therapy [36]. Cholesteryl ester fatty acid ratios were measured via the relative depletion of polyunsaturated fatty acids in cholesteryl esters: R1 (C20/C16) and R2 (C18/C16). Lower ratios indicate greater oxidative consumption of unsaturated fatty acids. At pretreatment (0 hours), both indices were borderline low, indicating mild baseline oxidative stress before therapy. These ratios remained largely unchanged during the active 6- to 24-hour treatment window, but dropped significantly during convalescence (120 hours/5 days) [36]. Vitamin C also dropped during therapy but partially recovered by 120 hours [36]. Vitamin E was depressed on admission and dropped even further during therapy, and in 5 of 6 patients remained below normal levels [36]. Vitamin A was below normal in 5 of 6 patients and had significantly increased by 120 hours after therapy [36].
4. Discussion
Over several decades, research into pediatric DKA resuscitation and cerebral edema has shifted from a macroscopic, iatrogenic osmotic hypothesis toward a molecular model driven by cerebral hypoperfusion, neurovascular unit disruption, and sterile neuroinflammation [19,33,37,38,39,40]. Historically, clinical dogma held that rapid rehydration or hypotonic solutions drove cytotoxic edema through passive transcellular osmotic dilution. Historically, clinical dogma posited that rapid rehydration or hypotonic solutions drove cytotoxic edema through passive transcellular osmotic dilution. However, definitive clinical trial evidence overturned this paradigm: the multicenter PECARN FLUID Trial (n = 1,389) demonstrated that neither fluid infusion rates nor sodium chloride concentrations dictated rates of neurological deterioration or neurocognitive decline [38]. Instead, prospective data indicate that cerebral vulnerability correlates with baseline biochemical severity, namely profound acidemia, compensatory hypocapnia, and severe azotemia reflecting vascular collapse and baseline tissue ischemia [33,39,40]. At the cellular level, these metabolic derangements initiate ischemic microvascular injury and trigger subclinical vasogenic swelling prior to intervention, as evidenced by lateral ventricular narrowing on pre-treatment cranial imaging [19,37,39]. Rather than acting as an inert crystalloid vehicle, fluid rehydration delivers sudden shear stress to an already hypoxic, cytokine-primed cerebrovascular endothelium [10,19,21]. This sudden reperfusion mobilizes circulating inflammatory mediators and initiates downstream proteolytic cascades, transitioning baseline ischemic hypoperfusion into active neurovascular barrier breakdown [10,41].
Growing clinical and experimental evidence indicates that, rather than operating solely through macroscopic fluid dynamics, intravenous resuscitation actively triggers a biological response that interfaces with a metabolically and immunologically vulnerable neurovascular unit [10,19,21]. Our multi-tiered biomarker synthesis indicates that standard fluid and insulin administration functions not as passive volume expansion, but as an amplifier of sterile systemic inflammation, proteolytic activation, and microvascular permeability [10,13,22,24,25,26,27,28,29,35]. Rather than promptly quenching inflammatory signaling, early resuscitation initiates a marked biphasic molecular shift within the 6 to 12 hour therapeutic window [13,22,28]. This phase is defined by the rapid clearance of counter-regulatory feedback via an abrupt plunge in circulating IL-10, unmasking an acute transcriptional and secretion surge of pro-inflammatory cytokines (IL-1-β, TNF-α, IL-6, IL-8) and Th17 effectors (IL-17, GM-CSF) [13,22,25,28]. Concurrently, this interval exhibits alternative complement pathway cascade activation (elevations in C3a and Factor Bb), the rapid induction of inducible gelatinases and stromelysins (MMP − 9 and MMP − 3), and heightened dicarbonyl toxicity driven by accumulating 3-deoxyglucosone amid a nadir of protective soluble decoy RAGE [26,27,29,34,35]. Crucially, this coordinated molecular burst converges precisely within the 6 to 12 hour window during which subclinical brain edema progresses, end-organ endothelial shear stress peaks, and rare but catastrophic clinical cerebral edema typically emerges [10,13,22,25,28].
A central finding of this aggregate analysis is the rapid uncoupling of counter-regulatory, anti-inflammatory feedback signaling during the initial hours of resuscitation. At clinical presentation, hyperosmolar and acidotic stress induces a robust compensatory elevation in circulating IL-10, particularly in moderate-to-severe DKA [22,25]. However, within 6 to 8 hours of initiating crystalloid rehydration and insulin, this protective IL-10 reserve precipitously plummets toward baseline, a rate of decay that correlates directly with presenting hyperosmolality [22,25]. In classical leukocyte signaling, IL-10 receptor engagement activates the STAT3 pathway to potently repress nuclear factor-κB pendent transcription and downstream cytokine mRNA stability. The sudden post-hydration collapse of circulating IL-10 removes this tonic suppression, permitting an unchecked surge in classical NF-κB–driven pro-inflammatory cytokines, including IL-1β, TNF-α, IL-6, and IL-8, alongside prominent Th17 lineage effectors such as IL-17 and GM-CSF [13,22,28]. Consequently, over two-thirds (69%) of assayed inflammatory cytokines and chemokines reach their peak expression during this 6 to 12 hour window [28]. Although Nett et al. observed early decreases in circulating IL-6 and TNF-α [23], the broader molecular evidence confirms an acute inflammatory burst that directly parallels acidemia severity, hepatic synthesis of high-sensitivity C-reactive protein [13,25], and downstream vascular end-organ vulnerability. At the same time, absolute neutrophil counts decline rapidly as adrenergic and glucocorticoid stress signaling wanes [25], while delayed cell-surface HLA-DR expression on peripheral CD3+ T-lymphocytes by 24 hours [30] suggests a transitioning immune response, where a sterile innate inflammation gives way to sustained, antigen-independent adaptive leukocyte activation well beyond metabolic resolution.
The sterile inflammatory cascade triggered during rehydration actively recruits the innate complement system and matrix metalloproteinases, which could directly impact microvascular integrity. The preferential elevation and progressive post-treatment rise of C3a and Factor Bb, occurring inversely with falling plasma glucose [29] indicate that fluid-induced metabolic shifts stimulate the alternative complement pathway rather than classical immune-complex pathways. Anaphylatoxin generation, such as C3a, alters endothelial permeability and stimulates microvascular leukocyte engagement.
Parallel to complement-mediated microvascular injury, rapid shifts in matrix metalloproteinases (MMPs) directly compromise basal lamina integrity and neurovascular extracellular matrix architecture [26,27]. While constitutive, protective gelatinase-A (MMP-2) expression positively tracks baseline metabolic parameters (pH and bicarbonate) and increases gradually during recovery, the inducible, zinc-dependent endopeptidases stromelysin-1 (MMP-3) and gelatinase-B (MMP-9) spike precipitously upon fluid resuscitation [26,27]. This acute proteolytic elevation uncouples the stoichiometric balance between active MMPs and endogenous tissue inhibitors of metalloproteinases (TIMP-1 and TIMP-2), shifting the microvascular microenvironment into an unchecked catabolic state [24,26]. Strikingly, pediatric patients exhibiting clinical cerebral edema demonstrate pronounced elevations in circulating MMP-3 and MMP-9 alongside severe depression of constitutive MMP-2 relative to both uncomplicated DKA and non-DKA diabetic controls [26,27]. In the central nervous system, this circulating proteolytic milieu mirrors the histopathological damage observed in post-mortem fatal DKA brain tissue, wherein neurovascular basement membrane degradation is accompanied by endopeptidase-mediated cleavage of the critical tight-junction proteins claudin-5 and zonula occludens-1 (ZO-1), extensive GFAP upregulation, and intense perivascular extravasation [41]. Consequently, the immediate post-resuscitation burst of MMP-3 and MMP-9 acts as an enzymatic driver of paracellular junctional breakdown, transforming subclinical osmotic stress into severe vasogenic hyperpermeability and secondary microvascular injury [26,27,41].
Fluid administration further modulates oxidative stress and non-enzymatic dicarbonyl pathways. The reactive α-dicarbonyl intermediate 3-deoxyglucosone generated via non-enzymatic glucose degradation and polyol pathway flux accumulates markedly at baseline due to profound hyperglycemic stress and surges further during the critical 6 to 12 hour resuscitation window. Crucially, this dicarbonyl surge coincides with a pronounced nadir in circulating soluble RAGE, the endogenous circulating decoy receptor responsible for sequestering advanced glycation end-products, alongside an acute peak in serum D-lactate [34]. In vascular tissue, soluble RAGE functions as a cytoprotective buffer; its acute post-resuscitation depletion removes competitive ligand antagonism, uncoupling 3-DG and downstream AGEs to bind transmembrane RAGE directly. This unbuffered receptor ligation triggers intracellular signal transduction chiefly through nuclear factor-κB (NF-κB) and mitogen-activated protein kinase cascades driving intense microvascular RAGE upregulation, pro-inflammatory gene transcription, and sustained cellular stress in cerebrovascular end-organs. Parallel to dicarbonyl signaling, treatment-induced hemodynamic shear and inflammatory activation produce sustained endothelial injury. This perturbation is evidenced by dramatic admission elevations in von Willebrand factor (vWF) antigen [10]. Notably, circulating vWF indices remain markedly above physiological reference thresholds even at 120 hours post-initiation despite rapid volume expansion [10]. This prolonged endothelial activation is compounded by persistent suppression of free protein S, driven in part by complexation with acute-phase reactants such as C4b-binding protein, and the delayed enzymatic recovery of activated protein C [10]. Together, this reciprocal disruption of natural anticoagulant pathways perpetuates a microvascular prothrombotic, hyperpermeable state throughout the entire post-resuscitation period.
Beyond acute vascular injury, rehydration initiates prolonged perturbations in central and systemic amino acid catabolism and neurochemical signaling networks [8,31]. During the critical 6 to 12 hour resuscitation phase, circulating pools of both essential neutral amino acids (such as tryptophan) and cytoprotective osmoregulatory sulfonated amino acids (notably taurine) plummet to severe nadirs [8,10,31]. This depletion coincides with extensive metabolic reprogramming along the tryptophan–kynurenine pathway [8,31]. Driven in part by systemic cytokine activation (such as TNF-α and IFN-γ) that induces indoleamine 2,3-dioxygenase-1, tryptophan flux shifts away from serotonin and melatonin synthesis and is channeled down the kynurenine enzymatic cascade [8]. Most critically, the downstream catabolite quinolinic acid, a potent endogenous agonist of the N-methyl-D-aspartate receptor, rises steadily following acute resuscitation and remains markedly elevated for weeks to months post-discharge [8]. Sustained hyperactivation of neuronal NMDA receptors by quinolinic acid stimulates pathological intracellular calcium influx, precipitating mitochondrial dysfunction, reactive oxygen species generation, and structural dendritic injury [8,9] This protracted excitotoxic and neuroinflammatory milieu provides a clear biochemical mechanism explaining the long-term, subclinical neurocognitive deficits and hippocampal-dependent memory impairments frequently documented in pediatric cohorts following acute DKA resolution [8,42].
Historically, acute neurological deterioration in DKA was attributed almost exclusively to aggressive crystalloid boluses causing rapid, passive osmotic transcellular dilution. While steep declines in effective plasma osmolality and hypervasopressinemia exacerbate neurovascular fluid accumulation, evidenced by narrowing of the intercaudate diameter on cranial computed tomography, macroscopic osmotic gradients alone fail to explain why cerebral edema occurs unpredictably despite conservative fluid titration [32,37]. Significantly, subclinical brain swelling is already established prior to any intravenous intervention in over 85% (6 of 7) of evaluated pediatric patients, manifested by lateral ventricular compression and narrowing of the intercaudate diameter at presentation compared with convalescent baselines [32,37].
Across aggregated clinical cohorts, presentation severity markers, most notably profound azotemia, severe hypocapnia, and marked metabolic acidemia, emerge as the primary predictors of neurovascular injury [25,33,37]. At the cellular level, these clinical hallmarks reflect severe microvascular hypoperfusion, tissue hypoxia, and sterile cellular stress that prime the cerebrovascular endothelium. Intravenous rehydration abruptly alters hemodynamics and endovascular shear stress, rapidly mobilizing sequestered cytokines and reactive carbonyl species across a compromised neurovascular unit [10,19,21]. Consequently, while subclinical edema and barrier stress originate during the untreated metabolic decompensation phase, fluid resuscitation acts as an active biological catalyst that accelerates this vulnerability, particularly within the critical 6 to 12 hour recovery window [9,13,22,25]. During this vulnerable interval, rapid transmembrane osmotic shifts converge with a synergistic molecular cascade: the uncoupling of anti-inflammatory feedback, a multi-lineage pro-inflammatory and Th17 cytokine burst, alternative complement activation (Factor Bb and C3a generation), acute dicarbonyl accumulation, and endopeptidase-mediated basement membrane degradation via MMP-3 and MMP-9 [22,26,27,29,43].
Several methodological and biological limitations warrant acknowledgment. First, data were synthesized across disparate historical biomarker sub-cohorts characterized by modest sample sizes and heterogeneous assay platforms, precluding unified multivariate regression modeling across all biochemical targets in the same individuals. Second, because these studies span several clinical eras, subtle differences in crystalloid infusion rates, sodium chloride concentrations, and concurrent insulin titration could contribute to inter-cohort variance in hemodynamic shear stress and electrolyte kinetics. Third, the temporal sampling across most protocols relied on discrete, intermittent intervals (e.g., 0, 6–8, 24, and 120 hours), which may obscure the true kinetic zeniths or nadirs of rapid-turnover signaling intermediates during the earliest hours of rehydration. Fourth, the majority of evaluated circulating mediators (such as matrix metalloproteinases and complement proteins) were quantified by immunoreactive protein mass rather than direct functional enzymatic assays or active-to-zymogen cleavage ratios, leaving the exact local stoichiometric balance against endogenous inhibitors (such as TIMPs) to be fully defined. Fifth, while strict clinical trial exclusions eliminated overt infectious triggers, subclinical microbial stimuli or individual genetic differences in innate immune receptor sensitivity cannot be completely excluded. Finally, and most importantly, while peripheral vascular kinetics correlated closely with post-mortem neuropathology in fatal cerebral edema brains, direct extrapolation of circulating inflammatory mediators to central nervous system microvascular dynamics in surviving pediatric patients remains constrained by the reliance on surrogate cranial imaging and clinical neurocognitive scores rather than real-time parenchymal or cerebrospinal fluid sampling. Future prospective studies employing synchronized, high-frequency multi-omics profiling within a single uniform cohort will be necessary to definitively map the crosstalk between peripheral immune signaling and central neurovascular unit disruption.
5. Conclusions
Synthesizing longitudinal biomarker data reveals that standard intravenous rehydration and insulin therapy in pediatric DKA acts not merely as passive osmotic replacement, but as an active biological amplifier of sterile inflammation, alternative complement activation, dicarbonyl toxicity, and microvascular barrier degradation. The confluence of these cascades between 6 and 12 hours defines an acute window of systemic and neurovascular vulnerability that explains the timing of secondary end-organ complications. Furthermore, our findings lead to three broader molecular conclusions:
- Divergence of Metabolic and Biological Recovery: Macro-metabolic normalization (euglycemia and acid-base clearance) occurs long before the resolution of cellular stress; sustained microvascular endothelial activation (vWF), alternative complement generation (C3a), and tissue remodeling persists for days to weeks post-resuscitation.
- Vasogenic Nature of Blood–Brain Barrier Injury: Neurovascular vulnerability is primarily driven by proteolytic breakdown of tight-junction complexes (claudin − 5, ZO − 1) mediated by an inducible endopeptidase surge (MMP − 3, MMP − 9) and hemodynamic reperfusion shear, rather than simple transcellular osmotic dilution.
- Persistent Excitotoxicity and Neurocognitive Risk: Post-resuscitation metabolic shunting toward quinolinic acid establishes a protracted NMDA-receptor excitotoxic state that outlasts acute hospitalization, providing a distinct molecular mechanism for long-term neurocognitive and memory deficits.
Future clinical paradigms must evolve beyond glycemic and fluid titration targets to evaluate targeted adjuvant therapies, such as early MMP inhibition, anti-inflammatory receptor stabilization, or kynurenine pathway modulation, aimed at quenching post-hydration neurovascular inflammation and protecting long-term brain health.
Funding
This research received no external funding. .
Institutional Review Board Statement
Not applicable.
Data Availability Statement
No new data were created.
Acknowledgments
During the preparation of this manuscript/study, the author(s) used Gemini 3.8 Flash for the purposes of compiling the data from the tables into a cohesive text. The authors have reviewed and edited the output and take full responsibility for the content of this publication.
Conflicts of Interest
The authors declare no conflicts of interest.
Abbreviations
The following abbreviations are used in this manuscript:
| DKA | Diabetic ketoacidosis |
| IL | Interleukin |
| MMP | Matrix metalloproteinase |
| RAGE | Receptor for advanced glycation end products |
| vWF | Von Willebrand factor |
| AGE | Advanced glycation end products |
| T1D | Type 1 diabetes |
References
- Lisco, G.; De Tullio, A.; De Geronimo, V.; Giagulli, V.A.; Guastamacchia, E.; Piazzolla, G.; Disoteo, O.E.; Triggiani, V. Once-Weekly Insulin Icodec in Diabetes Mellitus: A Systematic Review and Meta-Analysis of Randomized Clinical Trials (ONWARDS Clinical Program). Biomedicines 2024, 12. [CrossRef]
- McGill, J.B.; Mayer, O.M. Pulmonary Safety and Clinical Considerations for Inhaled Insulin: A Comprehensive Review. Diabetes Technol Ther 2026, 28, 19s-25s. [CrossRef]
- Ugur Kaval, A.; Ozturk, N.; Eviz, E.; Gökçe, T.; Can, E.; Karagözoğlu, M.; Yesiltepe Mutlu, G.; Hatun, Ş. Use of the Loop Open-Source Automated Insulin Delivery System in Children with Type 1 Diabetes: Six-Month Results from a Single Center. Horm Res Paediatr 2026, 1-11. [CrossRef]
- Wang, S.; Du, Y.; Zhang, B.; Meng, G.; Liu, Z.; Liew, S.Y.; Liang, R.; Zhang, Z.; Cai, X.; Wu, S.; et al. Transplantation of chemically induced pluripotent stem-cell-derived islets under abdominal anterior rectus sheath in a type 1 diabetes patient. Cell 2024, 187, 6152-6164.e6118. [CrossRef]
- Giri, G.; Doherty, D.; Azmi, S.; Khambalia, H.; Giuffrida, G.; Moinuddin, Z.; van Dellen, D. The impact of pancreas transplantation on diabetic complications: A systematic review. Transplant Rev 2025, 39, 100910. [CrossRef]
- Classen, J.B. Review of evidence that epidemics of type 1 diabetes and type 2 diabetes/metabolic syndrome are polar opposite responses to iatrogenic inflammation. Curr Diabet Rev 2012, 8, 413-418.
- Li, J.; Huang, M.; Shen, X. The association of oxidative stress and pro-inflammatory cytokines in diabetic patients with hyperglycemic crisis. J Diabetes Complications 2014, 28, 662-666. [CrossRef]
- Hoffman, W.H.; Whelan, S.A.; Lee, N. Tryptophan, kynurenine pathway, and diabetic ketoacidosis in type 1 diabetes. PLoS One 2021, 16, e0254116. [CrossRef]
- Hoffman, W.H.; Artlett, C.M.; Zhang, W.; Kreipke, C.W.; Passmore, G.G.; Rafols, J.A.; Sima, A.A. Receptor for advanced glycation end products and neuronal deficit in the fatal brain edema of diabetic ketoacidosis. Brain Res 2008, 1238, 154-162. [CrossRef]
- Carl, G.F.; Hoffman, W.H.; Passmore, G.G.; Truemper, E.J.; Lightsey, A.L.; Cornwell, P.E.; Jonah, M.H. Diabetic ketoacidosis promotes a prothrombotic state. Endocr Res 2003, 29, 73-82. [CrossRef]
- Burckhardt, M.A.; Gotta, V.; Beglinger, S.; Renggli, L.; Bachmann, S.; Hess, M.; Rentsch, K.; Pfister, M.; Koch, G.; Davis, E.A.; et al. Copeptin Kinetics and Its Relationship to Osmolality During Rehydration for Diabetic Ketoacidosis in Children. J Clin Endocrinol Metab 2020, 105. [CrossRef]
- Ishikawa, S.; Saito, T.; Okada, K.; Nagasaka, S.; Kuzuya, T. Prompt recovery of plasma arginine vasopressin in diabetic coma after intravenous infusion of a small dose of insulin and a large amount of fluid. Acta Endocrinol 1990, 122, 455-461. [CrossRef]
- Dalton, R.R.; Hoffman, W.H.; Passmore, G.G.; Martin, S.L. Plasma C-reactive protein levels in severe diabetic ketoacidosis. Ann Clin Lab Sci 2003, 33, 435-442.
- Barkai, L. The Impact of Diabetes on Brain Health in Childhood. Biomedicines 2026, 14. [CrossRef]
- Rocha, L.G.; Cuellar, R.K.; Vargas, L.A.; Cuellar, K. Risk Factors for Cerebral Edema in Pediatric Diabetic Ketoacidosis: a Systematic Review and Meta-Analysis of Observational Studies. J Clin Res Pediatr Endocrinol 2026. [CrossRef]
- Laor, L.; Sendi, P.; Martinez, P.; Totapally, B.R. Epidemiology and Outcomes of Cerebral Edema in Hospitalized Children. Pediatr Neurol 2023, 147, 148-153. [CrossRef]
- Brown, T.B. Cerebral oedema in childhood diabetic ketoacidosis: is treatment a factor? Emerg Med J 2004, 21, 141-144. [CrossRef]
- Evan-Wong, L.A.; Davidson, R.J.; Stowers, J.M. Alterations in erythrocytes in hyperosmolar diabetic decompensation: a pathophysiological basis for impaired blood flow and for an improved design of fluid therapy. Diabetologia 1985, 28, 739-742. [CrossRef]
- Glaser, N.S.; Ghetti, S.; Casper, T.C.; Dean, J.M.; Kuppermann, N. Pediatric diabetic ketoacidosis, fluid therapy, and cerebral injury: the design of a factorial randomized controlled trial. Pediatr Diabetes 2013, 14, 435-446. [CrossRef]
- Azova, S.; Rapaport, R.; Wolfsdorf, J. Brain injury in children with diabetic ketoacidosis: Review of the literature and a proposed pathophysiologic pathway for the development of cerebral edema. Pediatr Diabetes 2021, 22, 148-160. [CrossRef]
- Rosenbloom, A.L. Intracerebral crises during treatment of diabetic ketoacidosis. Diabetes Care 1990, 13, 22-33. [CrossRef]
- Hoffman, W.H.; Burek, C.L.; Waller, J.L.; Fisher, L.E.; Khichi, M.; Mellick, L.B. Cytokine response to diabetic ketoacidosis and its treatment. Clin Immunol 2003, 108, 175-181. [CrossRef]
- Nett, S.T.; Noble, J.A.; Levin, D.L.; Cvijanovich, N.Z.; Vavilala, M.S.; Jarvis, J.D.; Flori, H.R. Biomarkers and genetics of brain injury risk in diabetic ketoacidosis: A pilot study. J Pediatr Intensive Care 2014, 3, 59-66. [CrossRef]
- Chaffin, Z.; Ghetti, S.; Tancredi, D.; Rewers, A.; Rewers, M.; Gilles, S.; Ander, B.; Glaser, N. Inflammatory profile of diabetic ketoacidosis in children with type 1 diabetes. BMJ Open Diabetes Res Care 2026, 14. [CrossRef]
- Karavanaki, K.; Karanika, E.; Georga, S.; Bartzeliotou, A.; Tsouvalas, M.; Konstantopoulos, I.; Fotinou, A.; Papassotiriou, I.; Karayianni, C. Cytokine response to diabetic ketoacidosis (DKA) in children with type 1 diabetes (T1DM). Endocr J 2011, 58, 1045-1053. [CrossRef]
- Garro, A.; Chodobski, A.; Szmydynger-Chodobska, J.; Shan, R.; Bialo, S.R.; Bennett, J.; Quayle, K.; Rewers, A.; Schunk, J.E.; Casper, T.C.; et al. Circulating matrix metalloproteinases in children with diabetic ketoacidosis. Pediatr Diabetes 2017, 18, 95-102. [CrossRef]
- Xu, Q.; Yang, Y.; Huang, Q.; Xie, L.; Feng, Y.; Yang, L. Extracellular(Serum) Levels of Matrix Metalloproteinases in Pediatric Type 1 Diabetes Mellitus and Association with Diabetic Ketoacidosis and Cerebral Edema. Diabetes Metab Syndr Obes 2025, 18, 819-830. [CrossRef]
- Hoffman, W.H.; Passmore, G.G.; Hannon, D.W.; Talor, M.V.; Fox, P.; Brailer, C.; Haislip, D.; Keel, C.; Harris, G.; Rose, N.R.; et al. Increased systemic Th17 cytokines are associated with diastolic dysfunction in children and adolescents with diabetic ketoacidosis. PLoS One 2013, 8, e71905. [CrossRef]
- Jerath, R.S.; Burek, C.L.; Hoffman, W.H.; Passmore, G.G. Complement activation in diabetic ketoacidosis and its treatment. Clin Immunol 2005, 116, 11-17. [CrossRef]
- Hoffman, W.H.; Helman, S.W.; Passmore, G. Acute activation of peripheral lymphocytes during treatment of diabetic ketoacidosis. J.Diabetes Compl. 2001, 15, 144-149.
- Carl, G.F.; Hoffman, W.H.; Blankenship, P.R.; Litaker, M.S.; Hoffman, M.G.; Mabe, P.A. Diabetic ketoacidosis depletes plasma tryptophan. Endocr Res 2002, 28, 91-102. [CrossRef]
- Durr, J.A.; Hoffman, W.H.; Sklar, A.H.; el Gammal, T.; Steinhart, C.M. Correlates of brain edema in uncontrolled IDDM. Diabetes 1992, 41, 627-632. [CrossRef]
- Tiwari, L.K.; Jayashree, M.; Singhi, S. Risk factors for cerebral edema in diabetic ketoacidosis in a developing country: role of fluid refractory shock. Pediat Crit Care Med 2012, 13, e91-96. [CrossRef]
- Hoffman, W.H.; Ishikawa, T.; Blum, J.; Tani, N.; Ikeda, T.; Artlett, C.M. Soluble Receptor for Glycation End-products Concentration Increases Following the Treatment of Severe Diabetic Ketoacidosis. J Clin Res Pediatr Endocrinol 2020, 12, 160-167. [CrossRef]
- Hoffman, W.H.; Kappler, F.; Passmore, G.P.; Mehta, R. Diabetic ketoacidosis and its treatment increase plasma 3-deoxyglucosone. Clin Biochem 2003, 36, 269-273.
- Lee, D.M.; Hoffman, W.H.; Carl, G.F.; Khichi, M.; Cornwell, P.E. Lipid peroxidation and antioxidant vitamins prior to, during, and after correction of diabetic ketoacidosis. J Diabetes Complications 2002, 16, 294-300. [CrossRef]
- Durr, J.A.; Hoffman, W.H.; Hensen, J.; Sklar, A.H.; el Gammal, T.; Steinhart, C.M. Osmoregulation of vasopressin in diabetic ketoacidosis. Am J Physiol 1990, 259, E723-728. [CrossRef]
- Kuppermann, N.; Ghetti, S.; Schunk, J.E.; Stoner, M.J.; Rewers, A.; McManemy, J.K.; Myers, S.R.; Nigrovic, L.E.; Garro, A.; Brown, K.M.; et al. Clinical Trial of Fluid Infusion Rates for Pediatric Diabetic Ketoacidosis. New Engl J Med 2018, 378, 2275-2287. [CrossRef]
- Glaser, N.; Fritsch, M.; Priyambada, L.; Rewers, A.; Cherubini, V.; Estrada, S.; Wolfsdorf, J.I.; Codner, E. ISPAD clinical practice consensus guidelines 2022: Diabetic ketoacidosis and hyperglycemic hyperosmolar state. Pediatr Diabetes 2022, 23, 835-856. [CrossRef]
- Jayashree, M.; Williams, V.; Iyer, R. Fluid Therapy For Pediatric Patients With Diabetic Ketoacidosis: Current Perspectives. Diabetes Metab Syndr Obes 2019, 12, 2355-2361. [CrossRef]
- Hoffman, W.H.; Stamatovic, S.M.; Andjelkovic, A.V. Inflammatory mediators and blood brain barrier disruption in fatal brain edema of diabetic ketoacidosis. Brain Res 2009, 1254, 138-148. [CrossRef]
- Ghetti, S.; Kuppermann, N.; Rewers, A.; Myers, S.R.; Schunk, J.E.; Stoner, M.J.; Garro, A.; Quayle, K.S.; Brown, K.M.; Trainor, J.L.; et al. Cognitive function following diabetic ketoacidosis in young children with type 1 diabetes. Endocrinol Diabetes Metab 2023, 6, e412. [CrossRef]
- Hoffman, W.H.; Cudrici, C.D.; Zafranskaia, E.; Rus, H. Complement activation in diabetic ketoacidosis brains. Exp Molec Pa thol 2006, 80, 283-288.
Figure 1.
Phase-by-phase summary of cytokine and MMP changes during resuscitation. Created in BioRender. Artlett, C. (2026) https://BioRender.com/n5pv15h.
Figure 1.
Phase-by-phase summary of cytokine and MMP changes during resuscitation. Created in BioRender. Artlett, C. (2026) https://BioRender.com/n5pv15h.
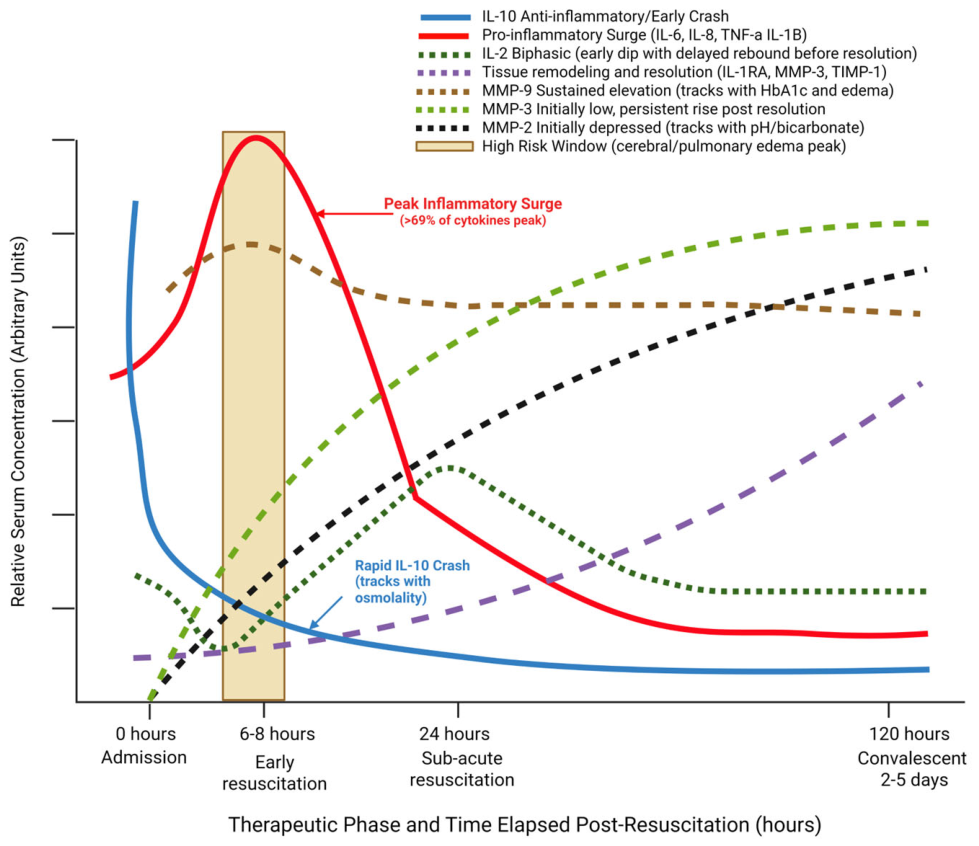
Figure 2.
Phase-by-phase summary of complement activation during DKA resuscitation. Created in BioRender. Artlett, C. (2026) https://BioRender.com/n3ythbx.
Figure 2.
Phase-by-phase summary of complement activation during DKA resuscitation. Created in BioRender. Artlett, C. (2026) https://BioRender.com/n3ythbx.
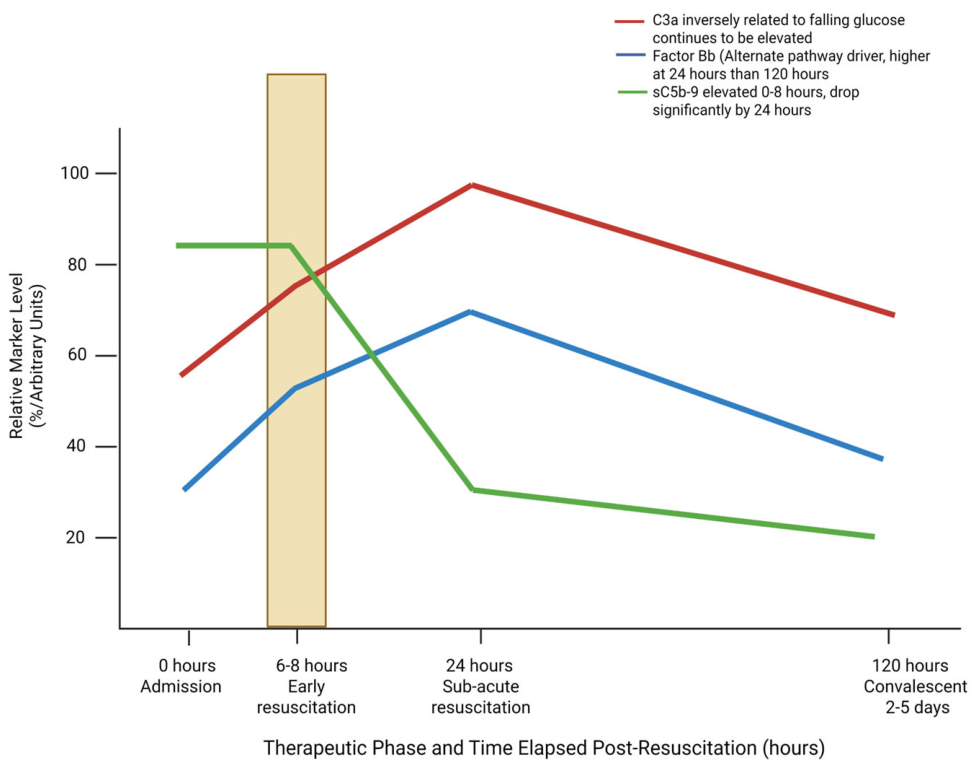
Figure 3.
Phase-by-phase summary of leukocyte clearance and T cell activation during DKA resuscitation. Created in BioRender. Artlett, C. (2026) https://BioRender.com/olqda8w.
Figure 3.
Phase-by-phase summary of leukocyte clearance and T cell activation during DKA resuscitation. Created in BioRender. Artlett, C. (2026) https://BioRender.com/olqda8w.
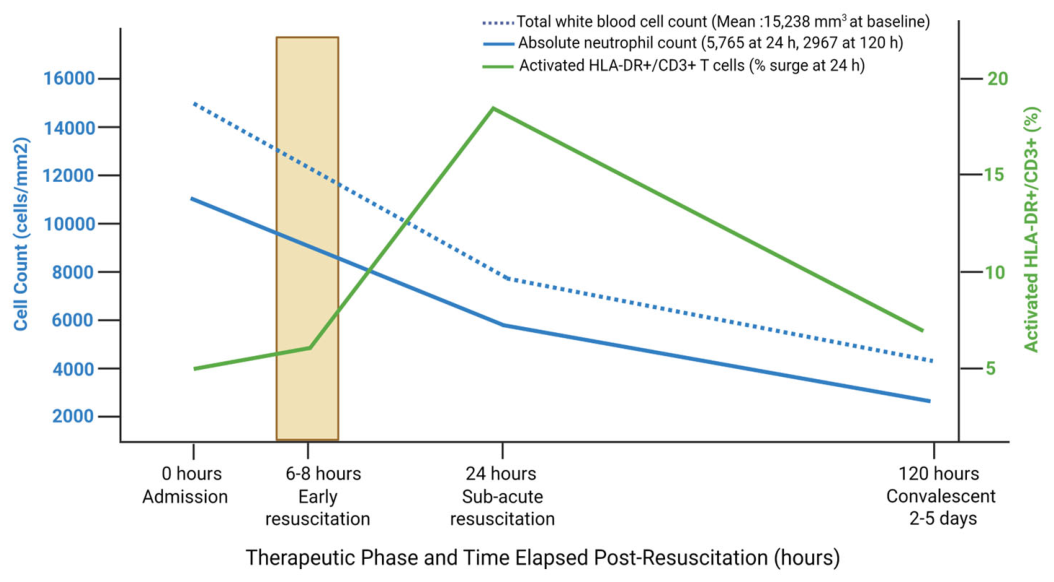
Figure 4.
Phase-by-phase summary of neuroinjury markers during DKA resuscitation. A: Tryptophan and Kynurenine pathway dynamics; B: Amino acid classes and osmolytes. Created in BioRender. Artlett, C. (2026) https://BioRender.com/e6yada3.
Figure 4.
Phase-by-phase summary of neuroinjury markers during DKA resuscitation. A: Tryptophan and Kynurenine pathway dynamics; B: Amino acid classes and osmolytes. Created in BioRender. Artlett, C. (2026) https://BioRender.com/e6yada3.
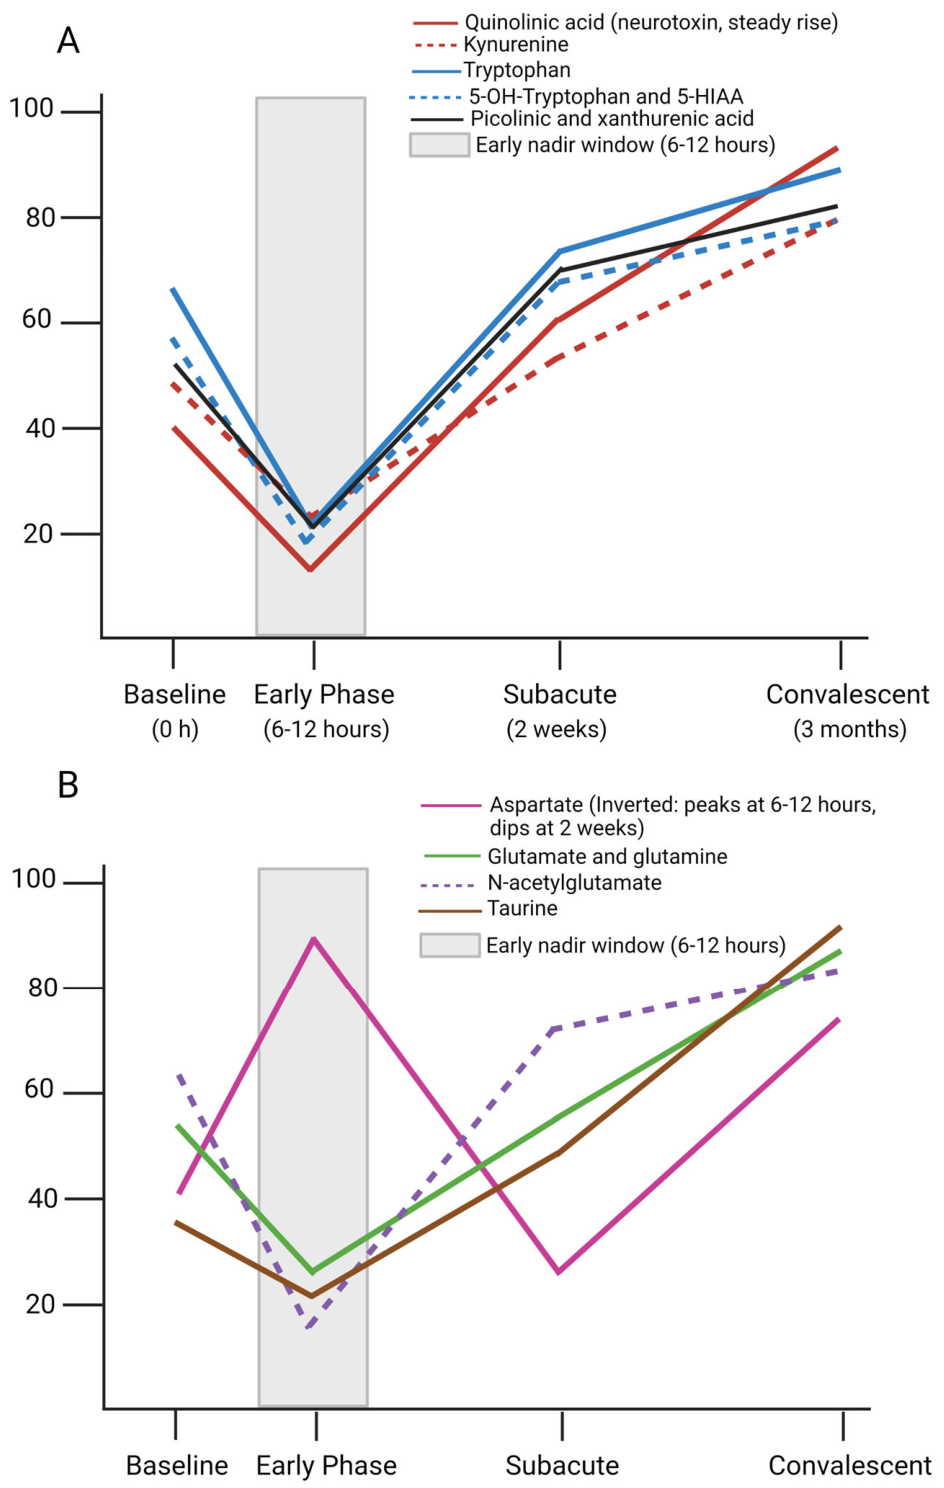
Figure 5.
Phase-by-Phase Summary of Endothelial Shear and Osmoregulation during DKA resuscitation. A: Endothelial shear and activation (vWF dynamics), B: Anticoagulant proteins and metabolic intermediates, C: Osmolality, copeptin, and subclinical brain edema, D: Acid-base, azotemia, and electrolyte trajectories. Created in BioRender. Artlett, C. (2026) https://BioRender.com/jwj4o0a.
Figure 5.
Phase-by-Phase Summary of Endothelial Shear and Osmoregulation during DKA resuscitation. A: Endothelial shear and activation (vWF dynamics), B: Anticoagulant proteins and metabolic intermediates, C: Osmolality, copeptin, and subclinical brain edema, D: Acid-base, azotemia, and electrolyte trajectories. Created in BioRender. Artlett, C. (2026) https://BioRender.com/jwj4o0a.
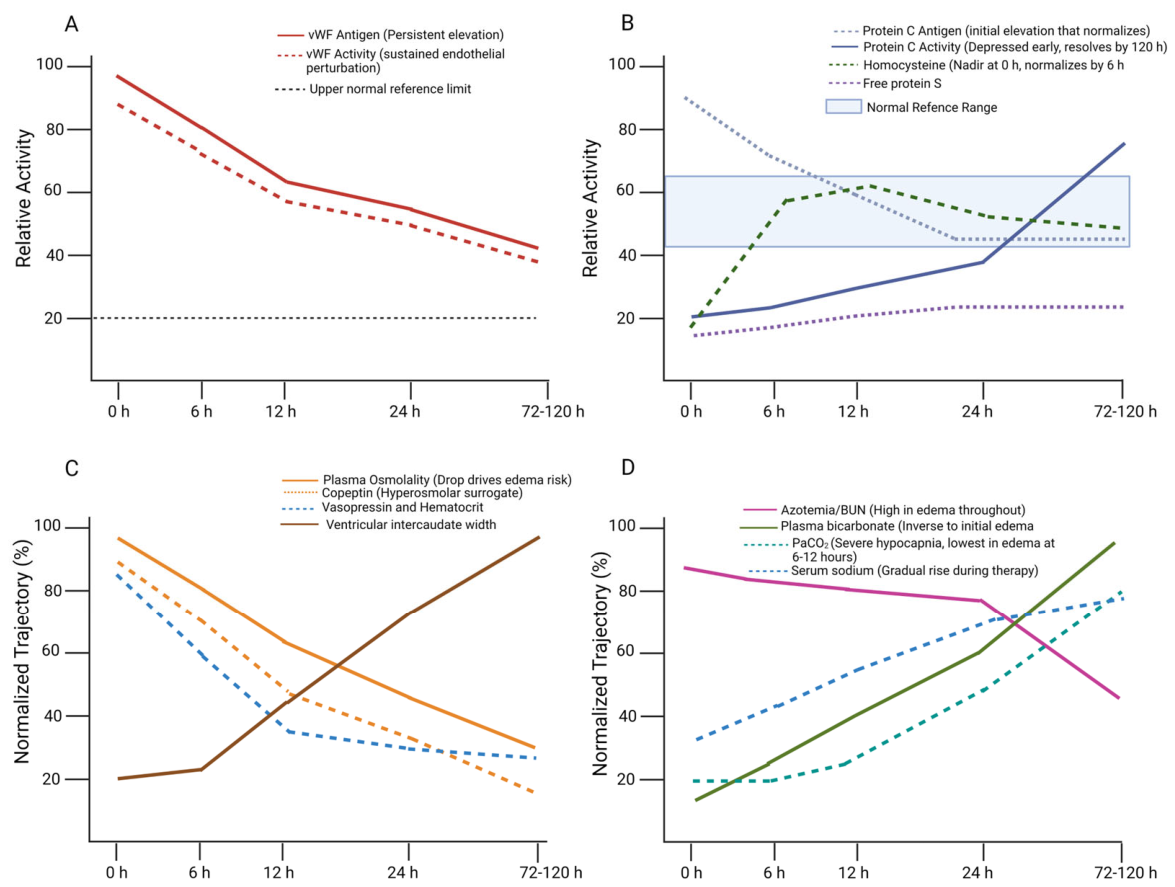
Figure 6.
Phase-by-phase summary of carbonyl stress, lipid peroxidation, and Vitamin alterations during DKA resuscitation. A: Reactive dicarbonyls and AGE-RAGE pathway, B: Lipid peroxidation and antioxidant micronutrients. Created using Python.
Figure 6.
Phase-by-phase summary of carbonyl stress, lipid peroxidation, and Vitamin alterations during DKA resuscitation. A: Reactive dicarbonyls and AGE-RAGE pathway, B: Lipid peroxidation and antioxidant micronutrients. Created using Python.

|
Biomarker Module |
Analyzed Cohort (n) |
Evaluated Targets and Pathways |
Key Sampling Time Points |
Reference |
| Cytokines, Chemokines and Matrix Metalloproteinases (MMPs) |
Cytokine kinetics (n=6) | IL-1β, IL-1α, TNF-α, IL-6, IL-8, IL-2, IL-10, IL-1RA | 0 h (Admission), 6-8 h into resuscitation, 24 h, and 120 h post- resuscitation |
[22] |
| Multiplex panel (n=88: 15 acute DKA, 14 recovery, 59 T1D controls) |
Comprehensive panel: 78 cytokines, chemokines, growth factors, MMPs, and TIMPs | 6-8 h after starting treatment, and 2-5 days after DKA resolution (compared to T1D controls) |
[24] | |
| C-reactive protein and cytokine kinetics (n=7, 2 overlapping with [22] | C-reactive protein, IL-1β, TNF-α, IL-6 | 0 h (Admission), 6-8 h into resuscitation, 24 h, and 120 h post- resuscitation |
[13] | |
| Systemic cytokines (n=38)* | IL-1β, IL-2, IL-6, IL-8, TNF-α | 0 h (Admission), 6-8 h into resuscitation, 24 h, and 120 h post- resuscitation |
[25] | |
| Cytokines (n=30)** | TNF-α and IL-6 | 0 h, 12 h, and 24 h after beginning treatment | [23] | |
| MMPs (n = 34 and 23 T1D controls) |
MMP-2, MMP-3, and MMP-9 | 2 h after starting treatment, then at 4-16 h (median 8 h) |
[26] | |
| MMPs (n=56; 17 DKA, 20 DKA with cerebral edema, and 19 T1D controls) | MMP-2, MMP-3, and MMP-9 | 0 h (Admission) and once the patients demonstrated clinical improvement | [27] | |
| Th17 axis (n=17) | IL-17, GM-CSF, IFN-γ, IL-6, IL-8, CCL7, eotaxin, MDC, sIL-2Rα, VEGF | 6-12 h after starting treatment, 2-3 weeks, and 3 months post-recovery | [28] | |
| Innate Immune and Complement Activation | Alternative complement pathway (n=5) | C3a, Bb, and terminal membrane attack complex (sC5b-9) | 0 h (Admission), 6-8 h into resuscitation, 24 h, and 120 h post- resuscitation |
[29] |
| Lymphocyte activation (n=6) | HLA-DR+CD3+ activated T- lymphocytes |
0 h (Admission) and 24 h post- resuscitation |
[30] | |
| Immune cell counts (n=38)* | Absolute neutrophil count and white blood cell count | 0 h (Admission), 6-8 h into resuscitation, 24 h, and 120 h post- resuscitation |
[25] | |
| Neuroinjury Markers |
Neurotoxic tryptophan catabolites (n=15) | Tryptophan, 5-OH-tryptophan, 5-HIAA, quinolinic acid, kynurenine, kynurenic acid, xanthurenic acid, and picolinic acid |
0 h, 6-12 h nadir, acute resolution, 2 weeks, and 3 months post-discharge | [8] |
| Tryptophan and amino acids (n=7) | Tryptophan, branched-chain amino acids, glucogenic and Krebs cycle–derived amino acids, and urea cycle and basic amino acids | 0 h (Admission), 6-8 h into resuscitation, 24 h, and 120 h post- resuscitation |
[31] | |
| Brain injury risk factors (n=30)** | Glial injury markers (GFAP, S100β) | 0 h, 12 h, and 24 h after beginning treatment | [23] | |
| Endothelial Shear and Osmoregulation |
Endothelial stress (n=6) | Hemostatic/shear markers: vWF antigen/activity, fibrinogen, protein C/S activity and antigen, homocysteine |
0 h (Admission), 6-8 h into resuscitation, 24 h, and 120 h post- resuscitation |
[10] |
| Osmoregulatory cohort (n=7) | Cranial CT edema index (intercaudate diameter), effective plasma osmolality, plasma vasopressin, sodium, and hematocrit |
0 h (Admission), 6 h, and throughout 24 h of hydration | [32] | |
| Clinical hemodynamic and cerebral edema risk cohort (n=77) | Blood glucose, osmolality, electrolytes, urea, creatinine, arterial pH, PaCO2, and HCO3. |
0 h (Admission), 6-12 h, 24 h, and >24 h | [33] | |
| Copeptin: 28 patients with DKA (20 newly diagnosed, 8 known T1D) | Serum copeptin and serum osmolality |
0, 1, 2, 3, 4, 6, 8, 10, 12, 18, 24, 36, 48, and 72 hours | [11] | |
| Carbonyl Stress, Advanced Glycation, and Oxidative Pathways |
Soluble RAGE and D-lactate cohort (n=16) |
Soluble RAGE (sRAGE) decoy and serum D-lactate. | Discharge, 2 weeks, and 3 months post-discharge | [34] |
| Reactive dicarbonyl cohort (n=7) |
3-Deoxyglucosone. | 0 h (Admission), 6-8 h into resuscitation, 24 h, and 120 h post- resuscitation |
[35] | |
| Lipid peroxidation indices and antioxidant vitamins (n=6) |
Cholesteryl ester fatty acid ratios, vitamins C, E, and A. | 0 h (Admission), 6-24 h into resuscitation, 120 h, and 5 days post-resuscitation |
[36] |
Disclaimer/Publisher’s Note: The statements, opinions and data contained in all publications are solely those of the individual author(s) and contributor(s) and not of MDPI and/or the editor(s). MDPI and/or the editor(s) disclaim responsibility for any injury to people or property resulting from any ideas, methods, instructions or products referred to in the content. |
© 2026 by the authors. Licensee MDPI, Basel, Switzerland. This article is an open access article distributed under the terms and conditions of the Creative Commons Attribution (CC BY) license (http://creativecommons.org/licenses/by/4.0/).
Copyright: This open access article is published under a Creative Commons CC BY 4.0 license, which permit the free download, distribution, and reuse, provided that the author and preprint are cited in any reuse.