

Submitted:
11 November 2026
Posted:
12 November 2026
You are already at the latest version
Abstract
Background/Objectives: As survival after colorectal cancer improves, more patients live with the consequences of the disease and its treatment, yet years lived with disability (YLDs) are rarely analysed as a primary outcome. We examined whether the colorectal cancer burden is shifting from premature death towards life with disability. Methods: Using Global Burden of Disease (GBD) 2023 estimates for the world, the five Socio-demographic Index (SDI) quintiles and China, we analysed YLDs, years of life lost (YLLs) and the age-standardised YLD share of disability-adjusted life-years (morbidity share) from 1990 to 2023 with joinpoint regression, and decomposed the change in YLD counts into population growth, population ageing and change in age-specific rates. Results: Global YLDs rose from 434,965 to 1,125,290 (+158.7%); the age-standardised YLD rate rose by 10.5% while the YLL rate fell by 22.1%. The morbidity share increased from 3.06% to 4.28% globally and from 2.06% to 4.69% in China, which overtook the global level in 2018. A rising YLD rate with a falling YLL rate was found globally, in the two higher SDI quintiles and in China; in the three lower quintiles both rates rose. The global increase in the YLD rate was confined to men (+19.8%; women −1.5%). Population growth and ageing accounted for 43.4% and 45.9% of the global increase in YLD counts. Conclusions: In higher-SDI settings and in China, the colorectal cancer burden is shifting from premature death towards life with disability, whereas in lower-SDI settings both components are still rising. Survivorship services should be planned for a disability burden concentrated among men and older adults.
Keywords:
colorectal cancer
; years lived with disability
; Global Burden of Disease
; morbidity-mortality transition
; decomposition analysis
; survivorship
1. Introduction
Colorectal cancer was the third most commonly diagnosed cancer and the second leading cause of cancer death worldwide in 2022 [1]. Its incidence and mortality differ several-fold with level of human development, and rates are still rising in many countries in transition [2], with case numbers projected to grow substantially by 2040 [3]. The Global Burden of Disease (GBD) study summarises this burden as disability-adjusted life-years (DALYs), the sum of years of life lost to premature death (YLLs) and years lived with disability (YLDs) [4,5].
Published GBD analyses of colorectal cancer have concentrated on incidence, mortality and DALYs, and report YLDs, when they report them at all, as one component of the DALY total [6,7,8,9]. The few that describe YLD trends directly report them in parallel with YLL trends, without examining the YLD share of DALYs or the sources of change [10]. The omission matters because YLDs are the part of the burden carried by people who are alive after diagnosis. GBD derives them from the prevalence of the sequelae of diagnosis, treatment and metastatic disease, weighted by disability weights [11], so they quantify the health loss that survivorship services are expected to address. Bowel dysfunction after sphincter-preserving surgery, for example, affects a substantial proportion of patients for years after treatment [12], and the population living after a colorectal cancer diagnosis continues to grow [13].
Five-year net survival after colon and rectal cancer improved in most countries with population-based registry data between 2000 and 2014 [14], although it remains much lower in many low- and middle-income settings [15]. Screening detects cancers at earlier stages and removes precursor lesions [16]. If fewer patients die prematurely and more live longer with the disease, YLLs should fall while YLDs accumulate, and the YLD share of DALYs should rise. By analogy with the epidemiological transition described for whole populations [17], we refer to this pattern as a morbidity-mortality transition. The hypothesis has not been tested systematically for colorectal cancer, and there is no particular reason to expect it to hold where survival and access to treatment remain limited.
China shows why the question matters. Colorectal cancer incidence in China has risen over the past two decades [18] while its population has aged rapidly. Both would raise YLDs, whereas any gain in survival would lower YLLs. How the balance between the two has shifted, and what that implies for follow-up and rehabilitation services, has not been quantified.
This study uses YLDs as its primary outcome. We aimed to describe trends in colorectal cancer YLDs between 1990 and 2023 globally, by SDI quintile and in China, and to test the morbidity-mortality transition hypothesis by comparing the trends in YLDs and YLLs and in the YLD share of DALYs. Secondary aims were to examine differences by sex and age, including early-onset disease, and to quantify how much of the change in YLD counts was attributable to population growth, population ageing and change in age-specific rates.
2. Materials and Methods
2.1. Data Source
We used estimates from the Global Burden of Disease Study 2023 [4,5], extracted from the GBD Results Tool (https://vizhub.healthdata.org/gbd-results/) [19] between July and September 2026. Colorectal cancer corresponds to the GBD cause colon and rectum cancer (ICD-10 C18–C21). Extracts covered the global aggregate, the five SDI quintiles and China for every year from 1990 to 2023. All-age counts and age-standardised rates were available for both sexes combined and for men and women separately. Estimates by 5-year age group, from under 5 to 95 years or older, were available for both sexes combined, and by sex from 55 years upwards. The modelling of incidence, prevalence and sequelae in GBD 2023 is described in the capstone publications [4,5]. Reporting follows the Guidelines for Accurate and Transparent Health Estimates Reporting (GATHER) [20]; the completed checklist is provided in the Supplementary Materials.
2.2. Outcomes
The primary outcome was YLDs, reported as counts and as age-standardised rates per 100,000 population. Secondary outcomes were YLLs and DALYs. The age-standardised morbidity share, referred to below as the morbidity share, was defined as the age-standardised YLD rate divided by the age-standardised DALY rate and expressed as a percentage. Because it is based on age-standardised rates, it compares locations and years independently of their age structure; the share of YLD counts in DALY counts is given in Supplementary Table S1. Published estimates are accompanied by 95% uncertainty intervals (UIs).
2.3. Statistical Analysis
Counts, age-standardised rates and their percentage change between 1990 and 2023 were tabulated by location and sex. The estimated annual percentage change (EAPC) was obtained from an ordinary least-squares regression of the natural logarithm of the age-standardised rate on calendar year, as EAPC = 100 × (exp(β) − 1), with its 95% confidence interval (CI). Crude (all-age) rates and the ratio of YLDs to YLLs are reported in Supplementary Table S1.
Changes in trend were identified by joinpoint regression [21]. A log-linear segmented model was fitted to each series by ordinary least squares on the log scale, assuming independent errors, with up to three joinpoints and at least five annual observations in each segment; the number and position of joinpoints were chosen by the Bayesian information criterion over all admissible positions. For each segment we report the annual percentage change (APC), and for the whole period the average annual percentage change (AAPC) [22], a segment-length-weighted average of the segment slopes whose CI was obtained by the delta method. Joinpoint regression was applied to the age-standardised YLD, YLL and DALY rates and to the morbidity share for each location and sex. The EAPC is reported as a single summary of the whole period and was used to compare locations; the AAPC, which allows the trend to change direction, was used to test the transition hypothesis. The morbidity-mortality transition was considered present in a location when the AAPC of the YLD rate was positive and that of the YLL rate negative, with neither CI including zero.
China was analysed as a reference location and compared with the global aggregate; because GBD 2023 assigns SDI values at the most detailed level estimated [4,23], Chinese provinces fall into several quintiles. SDI quintiles were compared on their YLD rate trajectories, their morbidity shares and the joint distribution of the YLD and YLL EAPCs. Differences by sex were summarised as the male-to-female ratio of the age-standardised YLD rate. Age-specific YLD rates were examined by 5-year group for the global aggregate and China. Early-onset burden was defined as YLDs at ages 15–49 years; because GBD assigns burden to the age at which it occurs rather than the age at diagnosis, this measure differs from early-onset incidence. Its crude YLD rate was calculated from summed counts and population denominators, which were recovered from the published age-specific counts and rates.
The change in YLD counts between 1990 and 2023 was decomposed using the Das Gupta method [24]. The count was written as the product of total population, the age distribution of the population and the age-specific YLD rates, and each factor was replaced in turn from its 1990 to its 2023 value. Averaging over all six orders of replacement yields three exactly additive components, attributed to population growth, population ageing and change in age-specific rates. The primary decomposition used 18 age groups, the 5-year groups from 15–19 to 95 years or older plus the younger ages, in which colorectal cancer YLDs are negligible, as one pooled group. Age-specific population denominators were recovered as count divided by rate, and the population of the pooled group as the residual of the all-age population. Sex-specific decompositions used four broad age groups (under 15, 15–49, 50–69 and 70 years or older).
Four sensitivity analyses were performed. The CIs of the EAPC, APC and AAPC describe variation around the fitted trend; uncertainty in the GBD estimates themselves was examined by re-estimating the EAPCs on the published lower-bound and upper-bound series. Because annual GBD series are strongly autocorrelated, the confidence intervals of the EAPC and AAPC were recomputed with Newey–West heteroskedasticity- and autocorrelation-consistent standard errors (lag 3) [25]. All trend analyses and the decomposition were repeated for 1990–2019, excluding the years affected by the COVID-19 pandemic. The early-onset analysis was repeated with ages 20–49 years. Analyses were performed in Python 3.12 with numpy 2.4, scipy 1.17 and pandas 3.0, and figures were drawn with matplotlib 3.10. Joinpoint regression and the decomposition were implemented in custom scripts, which are available from the corresponding author during peer review and will be deposited in a public repository on acceptance.
3. Results
3.1. Global Burden of Colorectal Cancer YLDs
Globally, colorectal cancer YLDs increased from 434,965 (95% UI 322,643 to 582,240) in 1990 to 1,125,290 (820,181 to 1,505,224) in 2023, an increase of 158.7% (Table 1; Figure 1A). The age-standardised YLD rate increased much less, from 11.15 (8.31 to 14.90) to 12.31 (8.99 to 16.46) per 100,000, a rise of 10.5% (EAPC 0.17, 95% CI 0.11 to 0.24). Its path was not linear. The rate rose between 1990 and 1997 (APC 0.82) and more slowly until 2009, declined between 2009 and 2018 (APC −0.37), and rose again from 2018 to 2023 (APC 0.74) (Table 2). The age-standardised YLL rate fell over the same period from 353.42 to 275.37 per 100,000 (−22.1%), and the DALY rate by 21.1% (Figure 1B; Table 1). In China the age-standardised YLD rate rose from 8.84 to 13.20 per 100,000 (+49.3%), a relative increase 4.7 times that of the global rate.
3.2. The Morbidity Share and the Morbidity-Mortality Transition
The global morbidity share rose from 3.06% in 1990 to 4.28% in 2023 (AAPC 1.05, 95% CI 1.03 to 1.07) (Figure 1C). The increase was fastest between 2003 and 2008 (APC 1.68) and slowed to 0.46 per year after 2013. The share rose in all seven locations, but for different reasons (Figure 1D; Table 2). In the global aggregate the AAPC of the YLD rate was 0.29 and that of the YLL rate −0.76. The same combination of a rising YLD rate and a falling YLL rate was found in the high-SDI quintile (0.35 and −1.04), the high-middle-SDI quintile (0.94 and −0.93) and China (1.16 and −1.45). In the middle, low-middle and low SDI quintiles the YLL rate also rose, with AAPCs of 0.80, 0.82 and 1.08; the morbidity share increased there only because YLDs grew faster than YLLs. By the definition used here, the transition was present in four of the seven locations. In the final joinpoint segment the global YLL rate rose again (APC 0.55, 95% CI 0.23 to 0.86 for 2018–2023). This upturn came from the three lower SDI quintiles, where the YLL rate rose by 1.41% to 3.84% per year after 2018; in the high and high-middle SDI quintiles and in China the final-segment change in the YLL rate did not differ from zero (Table 2). The age-standardised DALY rate, which is dominated by YLLs, followed the YLL pattern: it fell globally (AAPC −0.73), in the high and high-middle SDI quintiles and in China (−1.37), and rose in the three lower quintiles (Table 2).
3.3. Differences across SDI Quintiles
In 2023 the age-standardised YLD rate ranged from 18.59 per 100,000 in the high-SDI quintile to 3.33 in the low-SDI quintile (Figure 2A). The relative increase since 1990 was largest in the middle-SDI quintile (+83.1%; EAPC 1.88) and smallest in the high-SDI quintile (+13.1%; EAPC 0.22). The morbidity share followed the SDI gradient, from 5.39% in the high-SDI quintile to 1.68% in the low-SDI quintile, and rose fastest in the high-middle-SDI quintile (AAPC 1.89) (Figure 2B). When the EAPCs of the YLD and YLL rates were plotted against each other, the higher-SDI quintiles and China lay in the quadrant of rising YLDs and falling YLLs, while the three lower quintiles lay in the quadrant in which both rose (Figure 2C). Among the SDI quintiles, the steepest increase in any recent segment was in the low-SDI quintile, where the YLD rate rose by 4.04% per year between 2018 and 2023.
3.4. Differences by Sex
The global rise in the age-standardised YLD rate was confined to men (Table 1; Figure 3A). Among men the rate rose from 12.83 to 15.37 per 100,000 (+19.8%; EAPC 0.45, 95% CI 0.37 to 0.52), whereas among women it fell slightly, from 9.76 to 9.62 (−1.5%; EAPC −0.21, −0.27 to −0.15). In the high-SDI quintile the rate among women was nearly unchanged (+2.4%; EAPC −0.08, −0.18 to 0.01), whereas among men it rose by 18.4%. The male-to-female ratio increased from 1.32 to 1.60 globally and rose in every location; in China it rose from 1.35 to 2.01 (Figure 3B). Chinese men had a YLD rate of 17.76 per 100,000 in 2023, compared with 8.84 among Chinese women. In the low-middle and low SDI quintiles the ratio stayed close to one. The morbidity share rose in both sexes, from 3.08% to 4.39% among men and from 3.05% to 4.15% among women globally (Supplementary Table S1); in China it reached 4.69% among men and 4.72% among women, the latter reflecting a faster decline in YLLs among women.
3.5. Age Patterns and Early-Onset Disease
YLD rates increased steeply with age and were highest at 85–89 years (143.6 per 100,000 globally in 2023) (Figure 4). Above 55 years the global age-specific rates changed little between 1990 and 2023, with EAPCs between 0.08 and 0.44. In China the EAPC increased with age, from 0.74 at 55–59 years to 2.68 at 85–89 years. The divergence between the sexes was also age-specific. Globally, rates among women fell in every age group from 55–59 to 80–84 years (EAPCs −0.16 to −0.36), and in China rates among women fell at 55–64 years while rates among men rose in every age group from 55 years upwards (EAPCs 1.48 to 2.64).
The early-onset YLD rate at ages 15–49 years rose from 2.23 to 2.91 per 100,000 globally (EAPC 0.47, 0.37 to 0.57) and from 2.93 to 4.15 in China (EAPC 0.47, 0.27 to 0.66); the fastest increase was in the middle-SDI quintile (EAPC 2.17). The rise was concentrated at older ages within this range. Globally the rates at 15–29 years were slightly lower in 2023 than in 1990, and in China the rates in every 5-year group below 40 years fell, while those at 40–44 and 45–49 years rose from 5.89 to 6.59 and from 9.79 to 12.35 per 100,000.
3.6. Decomposition of the Change in YLD Counts
Of the global increase of 690,325 YLD years, population growth accounted for 299,480 (43.4%), population ageing for 317,097 (45.9%) and change in age-specific rates for 73,747 (10.7%) (Table 3; Figure 5). The balance differed with development. Ageing accounted for 59.3% of the increase in the high-SDI quintile and 11.8% in the low-SDI quintile, where population growth accounted for 56.3%. The age-specific-rate component was largest in the middle-SDI quintile (38.4%). China combined a large ageing component (55.6%) with a substantial rate component (29.6%) and a population-growth contribution (14.8%) about one third of the global share (43.4%). In the sex-specific decomposition the rate component in China was 40.4% among men and 17.9% among women (Supplementary Table S3).
3.7. China Compared with the Global Aggregate
The ratio of the Chinese to the global age-standardised YLD rate increased from 0.79 in 1990 to 1.07 in 2023 (Figure 6A). It first exceeded one in 2018 and has done so in every year since 2021, reaching 1.10 in 2022. The Chinese morbidity share crossed the global share in 2018 (Figure 6B). The AAPC of the Chinese morbidity share (2.59, 95% CI 2.55 to 2.62) was more than twice the global value (1.05), with the fastest segment between 2002 and 2008 (APC 4.30). Its YLL rate fell by 36.2%, compared with 22.1% globally. Early-onset rates in China were above the global rates in every 5-year age group in both 1990 and 2023, but the gap narrowed below 40 years and widened at 40–44 and 45–49 years; at 45–49 years the Chinese rate reached 12.35 per 100,000 in 2023, compared with 9.94 globally (Figure 6C).
3.8. Sensitivity Analyses
When the EAPCs of the YLD, YLL and DALY rates and of the morbidity share were re-estimated on the published lower-bound and upper-bound series, the direction of change was unchanged in all 84 location, sex and outcome combinations. Restricting the analysis to 1990–2019 also left every direction unchanged, although the AAPCs were smaller in the lower-SDI quintiles, where the steepest increases occurred after 2018; the global AAPC of the YLD rate was 0.21 instead of 0.29 (Supplementary Table S4). In the decomposition ending in 2019 the age-specific-rate component was smaller (7.1% globally), and population growth and ageing contributed almost equally at the global level (46.6% and 46.4%). The gradient across SDI quintiles was unchanged, with the ageing share largest in the high-SDI quintile and the growth share largest in the low-SDI quintile. With early-onset disease defined as ages 20–49 years, the EAPC was 0.39 globally and 0.33 in China (Supplementary Table S4). With Newey–West standard errors the EAPC intervals widened and the AAPC intervals changed little; no interval for the YLD or YLL rate crossed zero, so the classification of every location was unchanged (Supplementary Table S4).
4. Discussion
Between 1990 and 2023 the global number of colorectal cancer YLDs more than doubled, while the age-standardised YLD rate rose by about a tenth and the YLL rate fell by more than a fifth. The share of the colorectal cancer burden attributable to disability rose in every location examined. Only in the global aggregate, the two higher-SDI quintiles and China, however, did a rising YLD rate coincide with a falling YLL rate, which is the pattern expected if improved survival shifts the burden from death towards life with disability. In China that shift was faster than in the global aggregate, and its morbidity share overtook the global level in 2018, with rising incidence and population ageing contributing alongside survival.
Survival trends in higher-SDI settings match this pattern. Five-year survival after colorectal cancer improved in most high-income countries through the 2000s [14], screening programmes detect disease earlier [16], and patients who survive treatment accrue YLDs over longer periods. In seven high-income countries, survival from colon cancer rose between 1995 and 2014 while its incidence and mortality fell, and five-year survival from rectal cancer rose by more than 13 percentage points in Denmark, Ireland and the UK [26]. With incidence falling, a rising YLD rate in these settings is consistent with longer survival. The lower SDI quintiles tell a different story. There, YLL rates are still rising and survival remains well below that of high-income settings [15]; the morbidity share has risen because a disability burden is growing faster than a mortality burden that is itself growing. A rising morbidity share on its own is not evidence of improving outcomes, and the transition becomes visible only when both components are examined together. The global aggregate shows how the two patterns blend: since 2018 the global YLL rate has risen again, reflecting the divergence between higher-SDI settings, where the decline in premature mortality has levelled off, and lower-SDI settings, where premature mortality is rising faster than before. The transition appears to depend on the stage of development a population has reached, much as the epidemiological transition was described as a sequence of stages [17].
The relative increase in the Chinese age-standardised YLD rate (+49.3%) was 4.7 times that of the global rate (+10.5%). Population ageing accounted for more than half of the increase in YLD counts, against a background of rising colorectal cancer incidence [18]. At the same time the YLL rate fell faster in China than globally (36.2% against 22.1%), as would be expected if a growing proportion of patients survive long enough to accumulate disability. Registry data place most of the survival gain in the earlier part of the period. In 17 Chinese population-based registries, age-standardised five-year relative survival for all cancers combined rose from 30.9% in 2003–05 to 40.5% in 2012–15, with gains for most cancer types [27]; it reached 43.7% in 2019–21 across 281 registries, but colorectal cancer was not among the sites with a significant improvement between 2008 and 2021 [28]. The recent rise in the Chinese YLD rate rests more on incidence and ageing than on survival. Beyond ageing, change in age-specific rates accounted for 29.6% of the increase in YLD counts (40.4% among men and 17.9% among women in a four-group decomposition by sex), with the steepest age-specific increases at 75–89 years. Screening is unlikely to have shaped these trends much: population-based colorectal cancer screening in urban China began in 2012, and only 14.0% of high-risk participants recommended for colonoscopy underwent it [29].
The divergence by sex is the least expected finding. The global rise in the age-standardised YLD rate came entirely from men, and among women the rate fell slightly, most clearly at 55–84 years. The male-to-female ratio increased in every location and reached two in China, where sex disparities in the colorectal cancer burden have been reported previously [30], and colorectal neoplasms were detected more often in men in the national screening programme [29]. Differences in risk-factor exposure between men and women could produce such a pattern, as could differences in screening participation and stage at diagnosis; the question warrants study with individual-level data. The early-onset findings also qualify a common assumption. The YLD rate at 15–49 years increased, in keeping with the rising incidence of early-onset colorectal cancer in many countries [31], but the increase was concentrated in the older part of that range, and in China the rates below 40 years fell.
For health services the relevant quantity is the number of people living with the consequences of the disease. YLDs accumulate among patients who are alive, under follow-up and often still symptomatic; bowel dysfunction after sphincter-preserving surgery, for example, is common and persistent [12], and the number of people living after a colorectal cancer diagnosis is large and increasing [13]. An increase of about 690,000 YLD years globally, more than four fifths of it in the high and high-middle SDI quintiles, and driven about equally by population growth and ageing, implies a growing need for long-term follow-up, stoma and continence services and psychosocial support. In China, where ageing and rising age-specific rates act together, the case for planning such services is particularly strong. These estimates are more likely to understate than to overstate the burden carried by survivors. GBD does not separate colon from rectal cancer, although bowel dysfunction is concentrated after rectal resection [12]; disability weights summarise the average severity of a health state [11] and capture long-term dysfunction only in part; and YLDs exclude indirect costs and the burden on carers. The ageing projections for cancer more generally point in the same direction [32].
Previous GBD analyses of colorectal cancer reported YLDs, if at all, only as a component of the DALY total [6,7,8,9]. The closest precedent described YLL and YLD trends for three gastrointestinal cancers using GBD 2019 and found a slow decline in the colorectal cancer YLL rate [10], but did not examine the YLD share of DALYs or the sources of change. An analysis of the burden attributable to hyperglycaemia observed that YLDs continued to rise in high-SDI settings while the mortality-related burden declined [33], and a GBD 2023 study of adults aged 80 years and older reported a rising YLD share of all-cause DALYs in ten countries [34]. For breast cancer, disability has recently been analysed as a separate outcome across 204 countries [35], and a GBD 2021 decomposition of 20 cancers found that a falling burden per prevalent case reduced DALYs for colorectal, breast and prostate cancer alike [36]. How the morbidity-mortality transition differs between cancers remains to be examined, since neither study compared YLDs with YLLs. At the level of all causes combined, gains in survival since 1990 have outpaced gains in healthy life, so that people in almost every country now spend more years in poor health [37], and the share of DALYs due to YLDs is forecast to keep rising to 2050 [38]. These analyses describe an aggregate shift across all diseases; for colorectal cancer, our results show that the same rise in the morbidity share can arise from opposite mechanisms and indicates improving survival only where YLL rates are falling. None of these studies tested the transition for colorectal cancer across levels of development or examined it by sex. Our findings extend the observations to the total colorectal cancer burden and show that the transition has not yet occurred in lower-SDI settings.
5. Conclusions
The burden of colorectal cancer is moving from premature death towards life with disability in higher-SDI settings and in China, but not yet in lower-SDI settings, where both components are still increasing. The increase in the disability burden is concentrated among men and older adults. Health systems should plan survivorship care for this growing burden alongside continued efforts to reduce mortality.
Supplementary Materials
The following supporting information can be downloaded at the website of this paper posted on Preprints.org. Table S1: Counts with 95% uncertainty intervals, crude rates, YLD/YLL ratio and YLD shares of DALYs by location and sex, 1990 and 2023; Table S2: Sex-specific joinpoint regression of age-standardised YLD, YLL and DALY rates and of the morbidity share, 1990–2023; Table S3: Sex-specific decomposition of the change in colorectal cancer YLD counts, 1990–2023; Table S4: Sensitivity analyses (uncertainty bounds, exclusion of 2020–2023, decomposition ending in 2019, early-onset age range and autocorrelation-consistent confidence intervals); Table S5: GATHER checklist.
Author Contributions
Conceptualization, X.W. and L.L.; methodology, X.W. and Z.T.; software, Z.T.; validation, B.Z. and L.Y.; formal analysis, Z.T.; investigation, Z.T. and B.Z.; data curation, Z.T. and B.Z.; writing—original draft preparation, X.W. and Z.T.; writing—review and editing, X.W., Z.T., B.Z., L.Y. and L.L.; visualization, Z.T.; supervision, X.W., L.Y. and L.L.; project administration, X.W.; funding acquisition, X.W. All authors have read and agreed to the published version of the manuscript.
Funding
This research was funded by the Sichuan Science and Technology Program (Belt and Road international cooperation project), grant number 2026YFHZ0419.
Institutional Review Board Statement
Not applicable. The study used publicly available, aggregated, de-identified estimates from the Global Burden of Disease Study 2023.
Informed Consent Statement
Not applicable.
Data Availability Statement
All estimates are publicly available from the GBD Results Tool (https://vizhub.healthdata.org/gbd-results/). The analysis code is available from the corresponding author during peer review and will be deposited in a public repository on acceptance.
Acknowledgments
We thank the Institute for Health Metrics and Evaluation and the GBD collaborators for making the estimates available.
Conflicts of Interest
The authors declare no conflicts of interest.
Abbreviations
The following abbreviations are used in this manuscript:
| AAPC | average annual percentage change |
| APC | annual percentage change |
| ASR | age-standardised rate |
| CI | confidence interval |
| DALY | disability-adjusted life-year |
| EAPC | estimated annual percentage change |
| GATHER | Guidelines for Accurate and Transparent Health Estimates Reporting |
| GBD | Global Burden of Disease |
| SDI | Socio-demographic Index |
| UI | uncertainty interval |
| YLD | year lived with disability |
| YLL | year of life lost |
References
- Bray, F.; Laversanne, M.; Sung, H.; et al. Global cancer statistics 2022: GLOBOCAN estimates of incidence and mortality worldwide for 36 cancers in 185 countries. CA Cancer J. Clin. 2024, 74, 229–263. [Google Scholar] [CrossRef] [PubMed]
- Arnold, M.; Sierra, M.S.; Laversanne, M.; Soerjomataram, I.; Jemal, A.; Bray, F. Global patterns and trends in colorectal cancer incidence and mortality. Gut 2017, 66, 683–691. [Google Scholar] [CrossRef] [PubMed]
- Morgan, E.; Arnold, M.; Gini, A.; et al. Global burden of colorectal cancer in 2020 and 2040: Incidence and mortality estimates from GLOBOCAN. Gut 2023, 72, 338–344. [Google Scholar] [CrossRef] [PubMed]
- GBD 2023 Disease and Injury and Risk Factor Collaborators. Burden of 375 diseases and injuries, risk-attributable burden of 88 risk factors, and healthy life expectancy in 204 countries and territories, including 660 subnational locations, 1990–2023: A systematic analysis for the Global Burden of Disease Study 2023. Lancet 2025, 406, 1873–1922. [Google Scholar] [CrossRef] [PubMed]
- GBD 2023 Cancer Collaborators. The global, regional, and national burden of cancer, 1990–2023, with forecasts to 2050: A systematic analysis for the Global Burden of Disease Study 2023. Lancet 2025, 406, 1565–1586. [Google Scholar] [CrossRef] [PubMed]
- Safiri, S.; Sepanlou, S.G.; Ikuta, K.S.; et al. The global, regional, and national burden of colorectal cancer and its attributable risk factors in 195 countries and territories, 1990–2017: A systematic analysis for the Global Burden of Disease Study 2017. Lancet Gastroenterol. Hepatol. 2019, 4, 913–933. [Google Scholar] [CrossRef] [PubMed]
- Chang, S.; Chang, Y.; Li, F.; et al. Global, regional, national burden of colorectal cancer from 1990 to 2021, with projections of incidence to 2050: A systematic analysis of the global burden of disease study 2021. Front. Oncol. 2025, 15, 1597847. [Google Scholar] [CrossRef] [PubMed]
- Zhang, T.; Guo, Y.; Qiu, B.; Dai, X.; Wang, Y.; Cao, X. Global, regional, and national trends in colorectal cancer burden from 1990 to 2021 and projections to 2040. Front. Oncol. 2025, 14, 1466159. [Google Scholar] [CrossRef] [PubMed]
- Sun, Y.; Zhu, G.; Lian, D.; Amin, B.; Xu, G.; Wang, J.; Zhang, N.; Wang, D. Multi-dimensional analysis of the global burden of colorectal cancer disease from 1990 to 2021 and prediction of future trends: A comprehensive study based on the GBD database. PLoS ONE 2025, 20, e0337216. [Google Scholar] [CrossRef] [PubMed]
- Yu, D.; Ou, Z.; Zhang, W.; et al. Global and national trends in years of life lost and years lived with disability caused by three common gastrointestinal cancers from 1990 to 2019. BMC Gastroenterol. 2022, 22, 493. [Google Scholar] [CrossRef] [PubMed]
- Salomon, J.A.; Haagsma, J.A.; Davis, A.; et al. Disability weights for the Global Burden of Disease 2013 study. Lancet Glob. Health 2015, 3, e712–e723. [Google Scholar] [CrossRef] [PubMed]
- Croese, A.D.; Lonie, J.M.; Trollope, A.F.; Vangaveti, V.N.; Ho, Y.H. A meta-analysis of the prevalence of low anterior resection syndrome and systematic review of risk factors. Int. J. Surg. 2018, 56, 234–241. [Google Scholar] [CrossRef] [PubMed]
- Miller, K.D.; Nogueira, L.; Devasia, T.; et al. Cancer treatment and survivorship statistics, 2022. CA Cancer J. Clin. 2022, 72, 409–436. [Google Scholar] [CrossRef] [PubMed]
- Allemani, C.; Matsuda, T.; Di Carlo, V.; et al. Global surveillance of trends in cancer survival 2000–14 (CONCORD-3): Analysis of individual records for 37 513 025 patients diagnosed with one of 18 cancers from 322 population-based registries in 71 countries. Lancet 2018, 391, 1023–1075. [Google Scholar] [CrossRef] [PubMed]
- Soerjomataram, I.; Cabasag, C.; Bardot, A.; et al. Cancer survival in Africa, central and south America, and Asia (SURVCAN-3): A population-based benchmarking study in 32 countries. Lancet Oncol. 2023, 24, 22–32. [Google Scholar] [CrossRef] [PubMed]
- Bretthauer, M.; Løberg, M.; Wieszczy, P.; et al. Effect of colonoscopy screening on risks of colorectal cancer and related death. N. Engl. J. Med. 2022, 387, 1547–1556. [Google Scholar] [CrossRef] [PubMed]
- Omran, A.R. The epidemiologic transition: A theory of the epidemiology of population change. Milbank Mem. Fund. Q. 1971, 49, 509–538. [Google Scholar] [CrossRef] [PubMed]
- Han, B.; Zheng, R.; Zeng, H.; et al. Cancer incidence and mortality in China, 2022. J. Natl. Cancer Cent. 2024, 4, 47–53. [Google Scholar] [CrossRef] [PubMed]
- Global Burden of Disease Collaborative Network. Global Burden of Disease Study 2023 (GBD 2023) Results; Institute for Health Metrics and Evaluation (IHME): Seattle, WA, USA, 2025; Available online: https://vizhub.healthdata.org/gbd-results/ (accessed on 24 September 2026).
- Stevens, G.A.; Alkema, L.; Black, R.E.; et al. Guidelines for Accurate and Transparent Health Estimates Reporting: The GATHER statement. Lancet 2016, 388, e19–e23. [Google Scholar] [CrossRef] [PubMed]
- Kim, H.J.; Fay, M.P.; Feuer, E.J.; Midthune, D.N. Permutation tests for joinpoint regression with applications to cancer rates. Stat. Med. 2000, 19, 335–351. [Google Scholar] [CrossRef]
- Clegg, L.X.; Hankey, B.F.; Tiwari, R.; Feuer, E.J.; Edwards, B.K. Estimating average annual per cent change in trend analysis. Stat. Med. 2009, 28, 3670–3682. [Google Scholar] [CrossRef] [PubMed]
- Global Burden of Disease Collaborative Network. Global Burden of Disease Study 2023 (GBD 2023) Socio-Demographic Index (SDI) 1950–2023; Institute for Health Metrics and Evaluation (IHME): Seattle, WA, USA, 2025. [Google Scholar]
- Das Gupta, P. Standardization and Decomposition of Rates: A User’s Manual; Current Population Reports, Series P23-186; US Bureau of the Census: Washington, DC, USA, 1993. [Google Scholar]
- Newey, W.K.; West, K.D. A simple, positive semi-definite, heteroskedasticity and autocorrelation consistent covariance matrix. Econometrica 1987, 55, 703–708. [Google Scholar] [CrossRef]
- Arnold, M.; Rutherford, M.J.; Bardot, A.; Ferlay, J.; Andersson, T.M.-L.; Myklebust, T.Å.; et al. Progress in cancer survival, mortality, and incidence in seven high-income countries 1995–2014 (ICBP SURVMARK-2): A population-based study. Lancet Oncol. 2019, 20, 1493–1505. [Google Scholar] [CrossRef] [PubMed]
- Zeng, H.; Chen, W.; Zheng, R.; Zhang, S.; Ji, J.S.; Zou, X.; et al. Changing cancer survival in China during 2003–15: A pooled analysis of 17 population-based cancer registries. Lancet Glob. Health 2018, 6, e555–e567. [Google Scholar] [CrossRef] [PubMed]
- Zeng, H.; Zheng, R.; Sun, K.; Zhou, M.; Wang, S.; Li, L.; et al. Cancer survival statistics in China 2019–2021: A multicenter, population-based study. J. Natl. Cancer Cent. 2024, 4, 203–213. [Google Scholar] [CrossRef] [PubMed]
- Chen, H.; Li, N.; Ren, J.; Feng, X.; Lyu, Z.; Wei, L.; et al. Participation and yield of a population-based colorectal cancer screening programme in China. Gut 2019, 68, 1450–1457. [Google Scholar] [CrossRef] [PubMed]
- Zhan, Z.; Chen, B.; Lin, W.; et al. Rising burden of colon and rectum cancer in China: An analysis of trends, gender disparities, and projections to 2030. Ann. Surg. Oncol. 2025, 32, 3361–3371. [Google Scholar] [CrossRef] [PubMed]
- Siegel, R.L.; Torre, L.A.; Soerjomataram, I.; et al. Global patterns and trends in colorectal cancer incidence in young adults. Gut 2019, 68, 2179–2185. [Google Scholar] [CrossRef] [PubMed]
- Soerjomataram, I.; Bray, F. Planning for tomorrow: Global cancer incidence and the role of prevention 2020–2070. Nat. Rev. Clin. Oncol. 2021, 18, 663–672. [Google Scholar] [CrossRef] [PubMed]
- Liu, Y.; Wei, K.; Xu, Y.; Li, D. Global, regional, and national burden of hyperglycemia-associated colorectal cancer, 1990–2021: A systemic analysis for the Global Burden of Disease study. Front. Oncol. 2025, 15, 1633508. [Google Scholar] [CrossRef] [PubMed]
- Wu, J.; Zheng, Z.; Wu, J. The rising disabling share of health loss among adults aged 80 years and older: A 34-year GBD 2023 analysis across 10 selected countries, 1990–2023. Arch. Gerontol. Geriatr. 2026, 150, 106374. [Google Scholar] [CrossRef] [PubMed]
- Zhu, Z.-F.; Wu, M.-Y.; Jia, W.-C.; Chen, B.-H.; Wu, L.; Fu, X.-T.; Gu, X.-X.; Li, X.-P. Global diversities of disability caused by breast cancer in 204 countries and territories: A secondary analysis from global burden of disease study 2021. BMC Public Health 2026, 26, 2333. [Google Scholar] [CrossRef] [PubMed]
- Qiu, Z.; Huang, Y.; Qiu, Z.; Guo, Z.; Wang, L.; Xu, M.; Xuan, F. Decomposing the global burden of cancers: Quantifying the contributions of disease severity changes across regions and time (1990–2021). J. Glob. Health 2025, 15, 04161. [Google Scholar] [CrossRef] [PubMed]
- Hay, S.I.; et al. Global, regional, and national trends in the morbidity gap and contributing diseases, injuries, and risk factors, 1990–2023: A systematic analysis for the Global Burden of Disease Study 2023. Lancet Public Health 2026, 11, e487–e505. [Google Scholar] [CrossRef] [PubMed]
- GBD 2021 Forecasting Collaborators. Burden of disease scenarios for 204 countries and territories, 2022–2050: A forecasting analysis for the Global Burden of Disease Study 2021. Lancet 2024, 403, 2204–2256. [Google Scholar] [CrossRef] [PubMed]
Figure 1.
Global colorectal cancer burden, 1990–2023. (A) Global YLD count with 95% uncertainty interval. (B) Global age-standardised YLD rate (red, left axis) and YLL rate (blue, right axis). (C) Age-standardised morbidity share (YLD as a percentage of DALYs) for the global aggregate, SDI quintiles and China. (D) Average annual percentage change (AAPC) of the age-standardised YLD and YLL rates, 1990–2023, from joinpoint regression; error bars show 95% confidence intervals.
Figure 1.
Global colorectal cancer burden, 1990–2023. (A) Global YLD count with 95% uncertainty interval. (B) Global age-standardised YLD rate (red, left axis) and YLL rate (blue, right axis). (C) Age-standardised morbidity share (YLD as a percentage of DALYs) for the global aggregate, SDI quintiles and China. (D) Average annual percentage change (AAPC) of the age-standardised YLD and YLL rates, 1990–2023, from joinpoint regression; error bars show 95% confidence intervals.
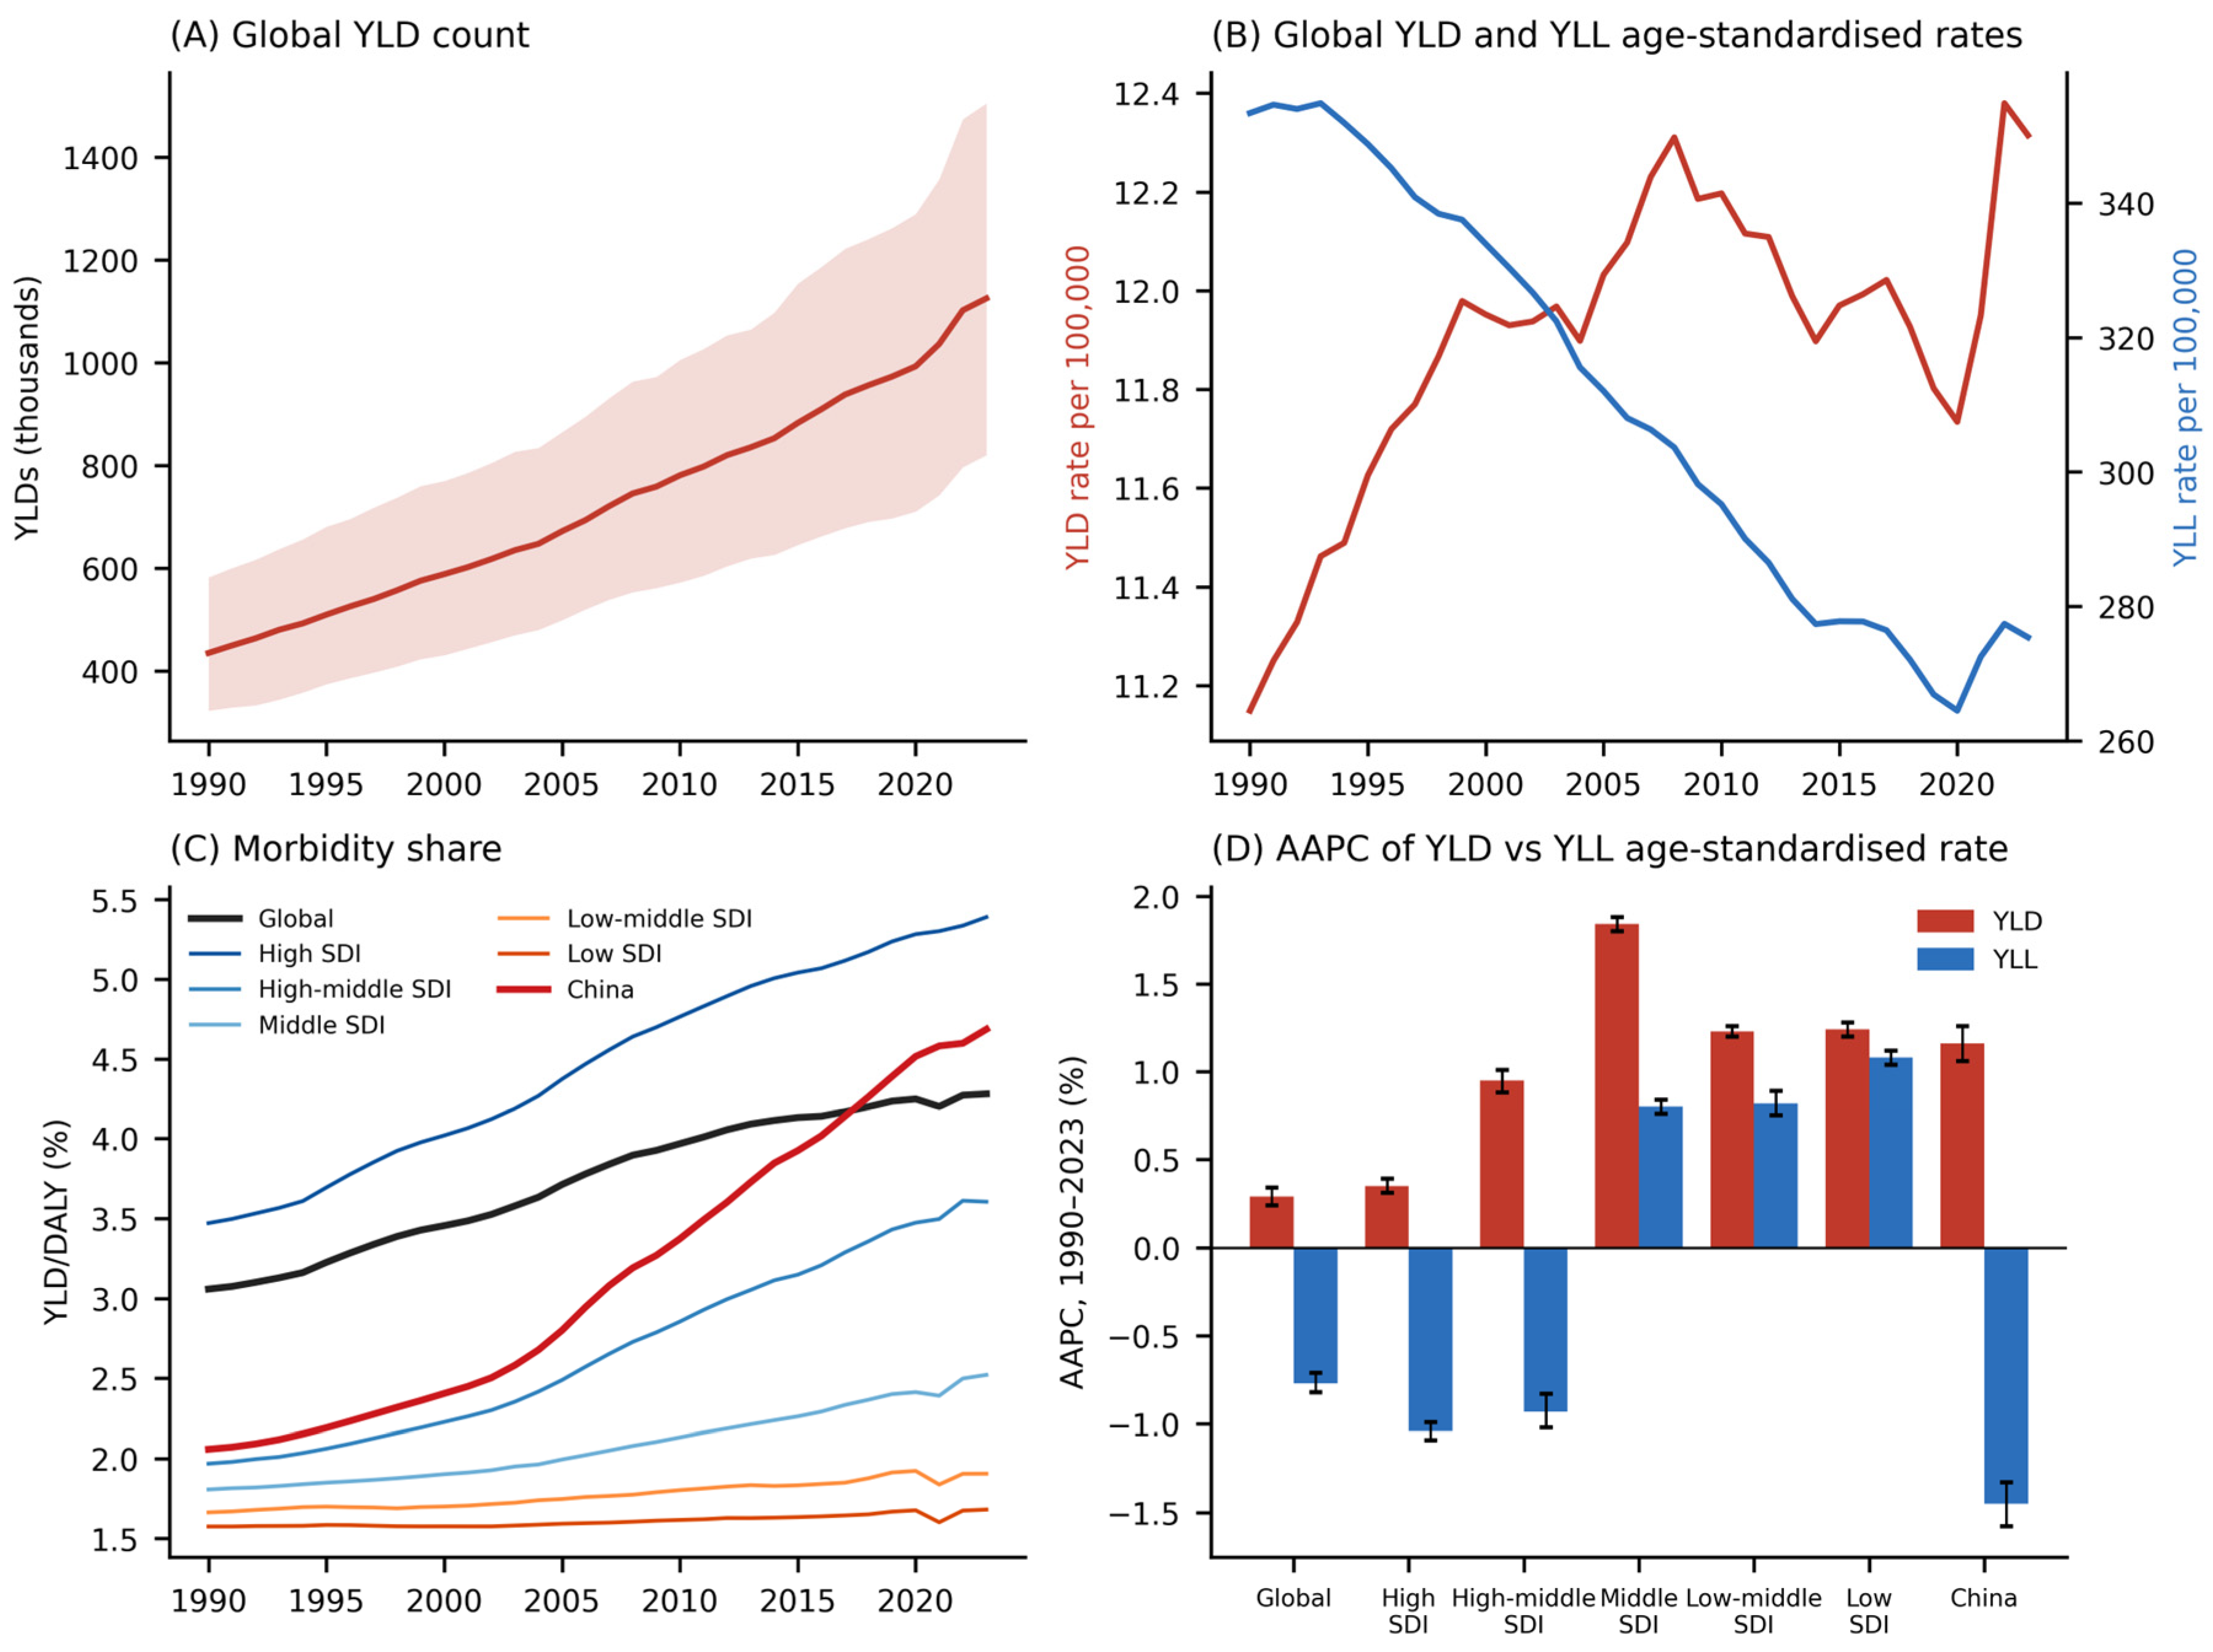
Figure 2.
Colorectal cancer YLDs by SDI quintile, 1990–2023. (A) Age-standardised YLD rate. (B) Age-standardised morbidity share. (C) Estimated annual percentage change of the age-standardised YLD rate against that of the YLL rate; bubble area is proportional to the YLD count in 2023.
Figure 2.
Colorectal cancer YLDs by SDI quintile, 1990–2023. (A) Age-standardised YLD rate. (B) Age-standardised morbidity share. (C) Estimated annual percentage change of the age-standardised YLD rate against that of the YLL rate; bubble area is proportional to the YLD count in 2023.
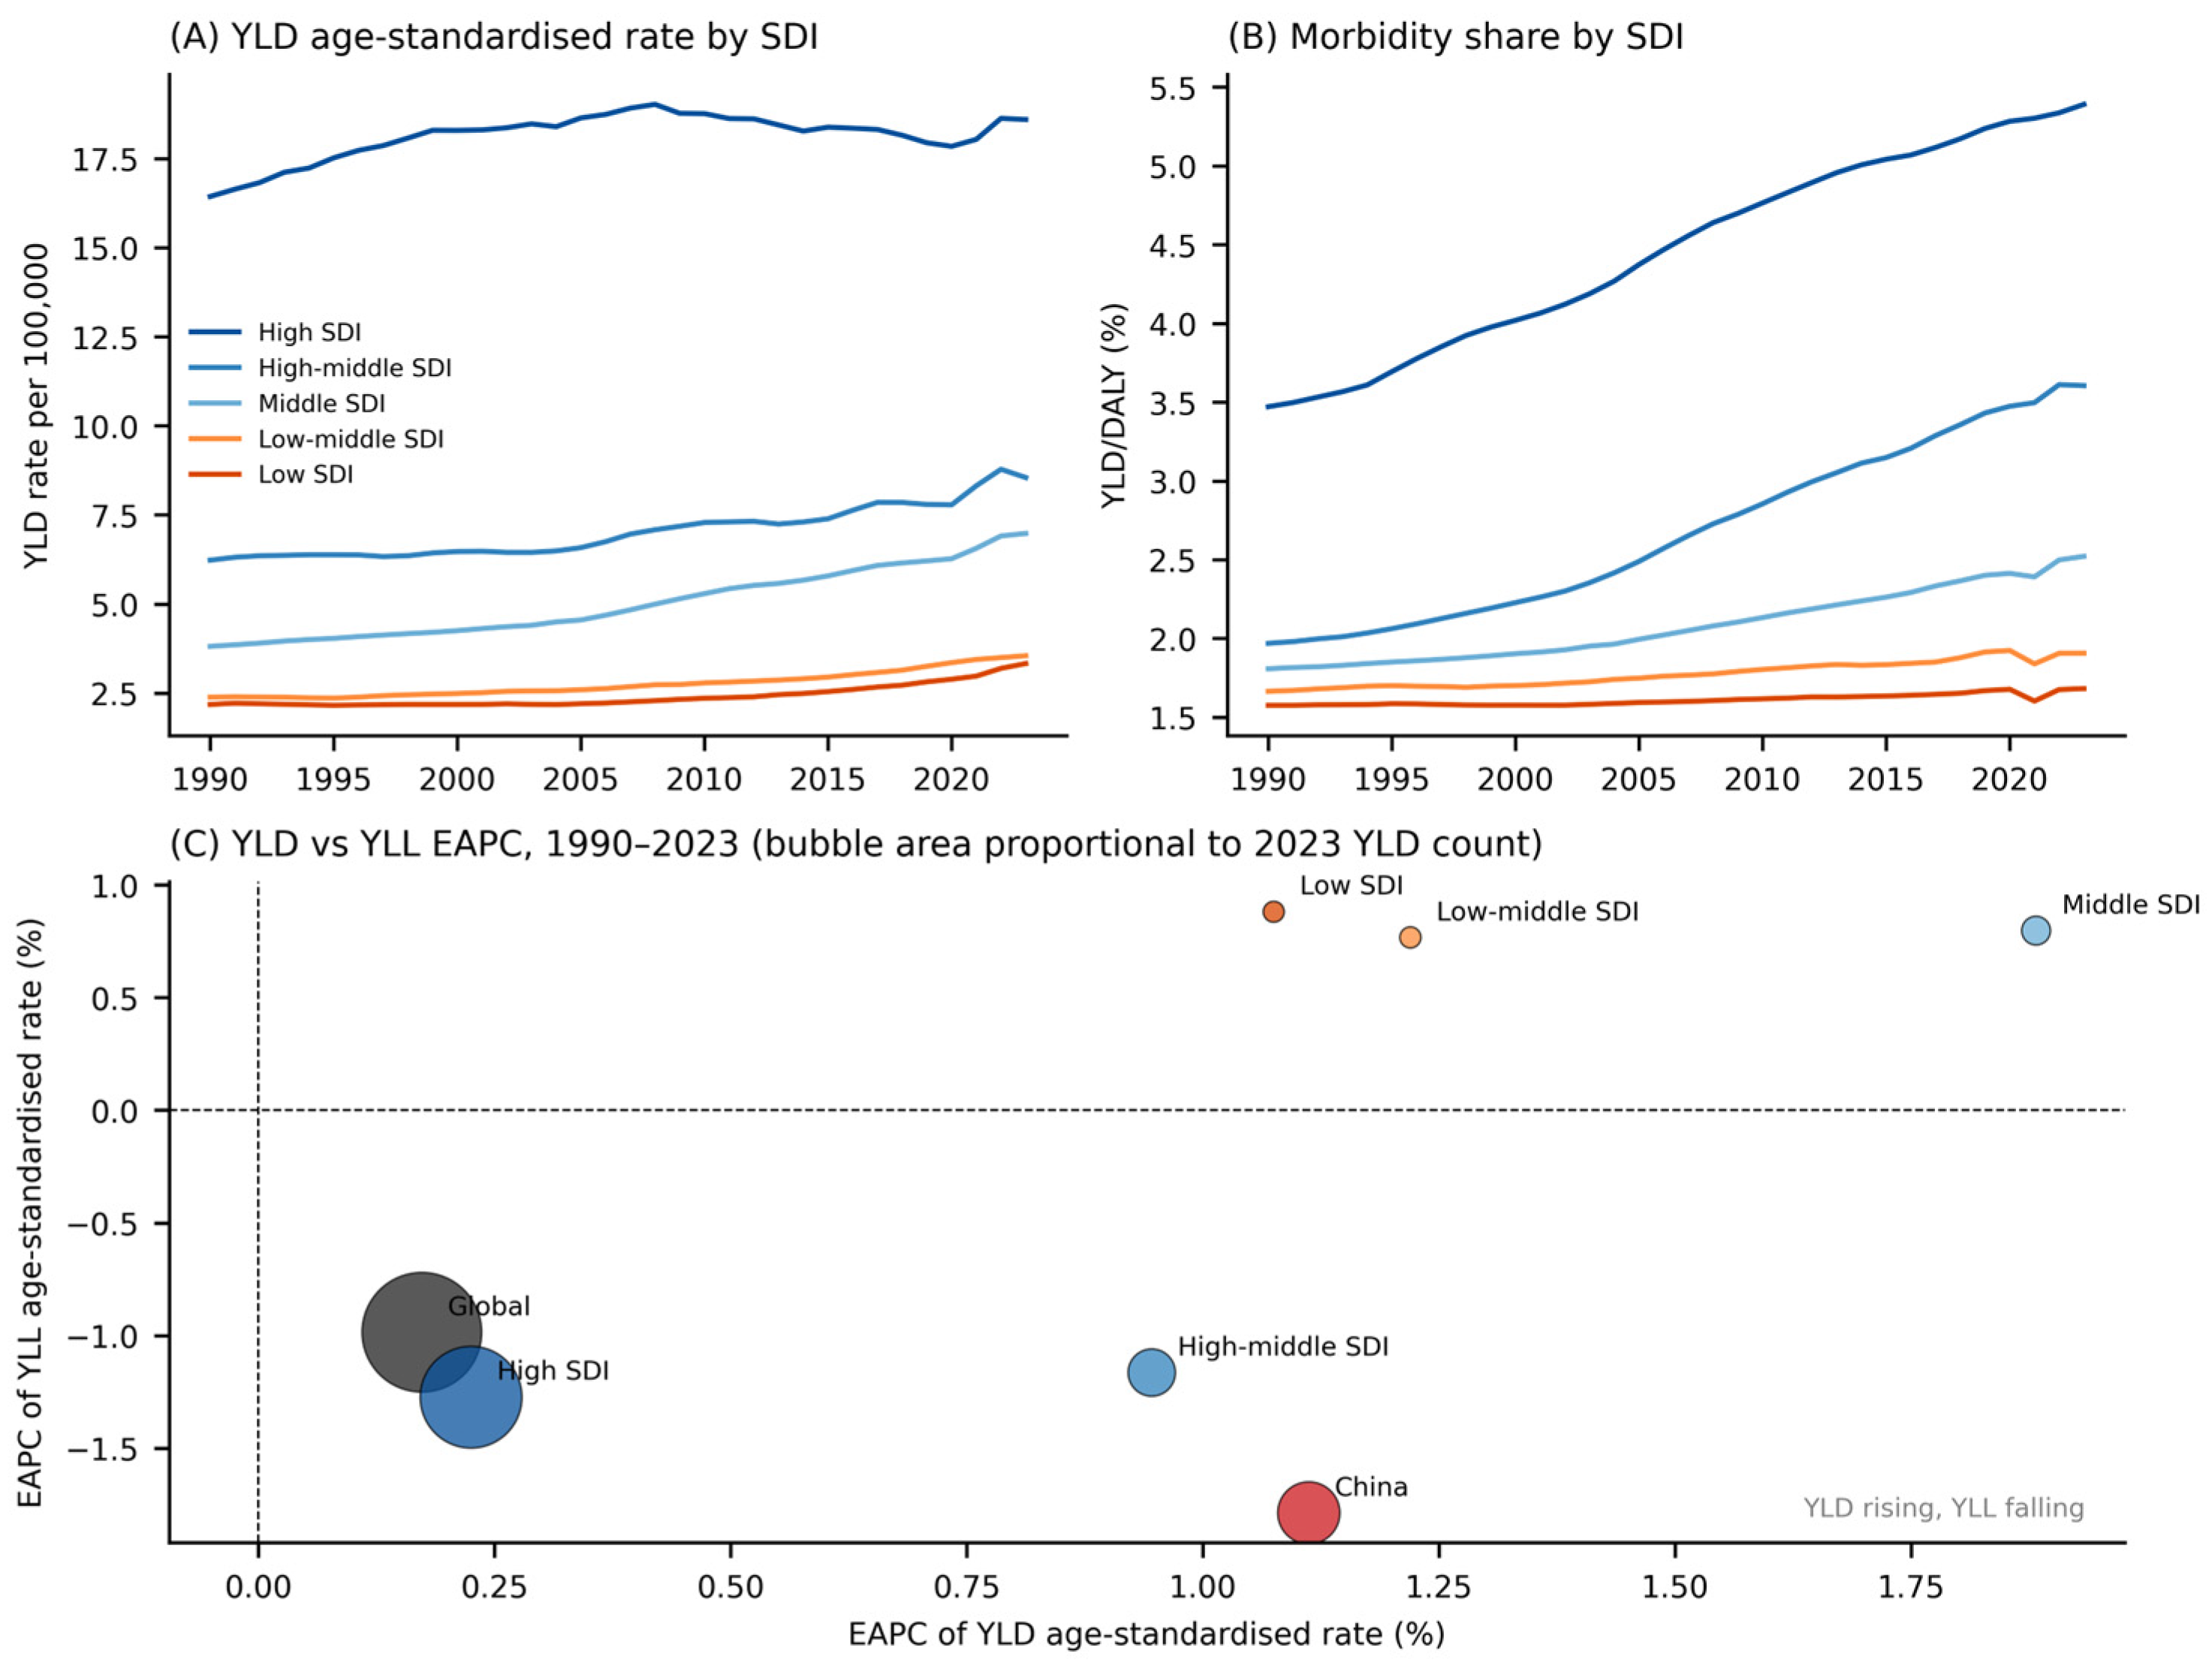
Figure 3.
Sex differences in colorectal cancer YLDs, 1990–2023. (A) Age-standardised YLD rate among men and women, globally, in the high-SDI quintile and in China. (B) Male-to-female ratio of the age-standardised YLD rate by location.
Figure 3.
Sex differences in colorectal cancer YLDs, 1990–2023. (A) Age-standardised YLD rate among men and women, globally, in the high-SDI quintile and in China. (B) Male-to-female ratio of the age-standardised YLD rate by location.
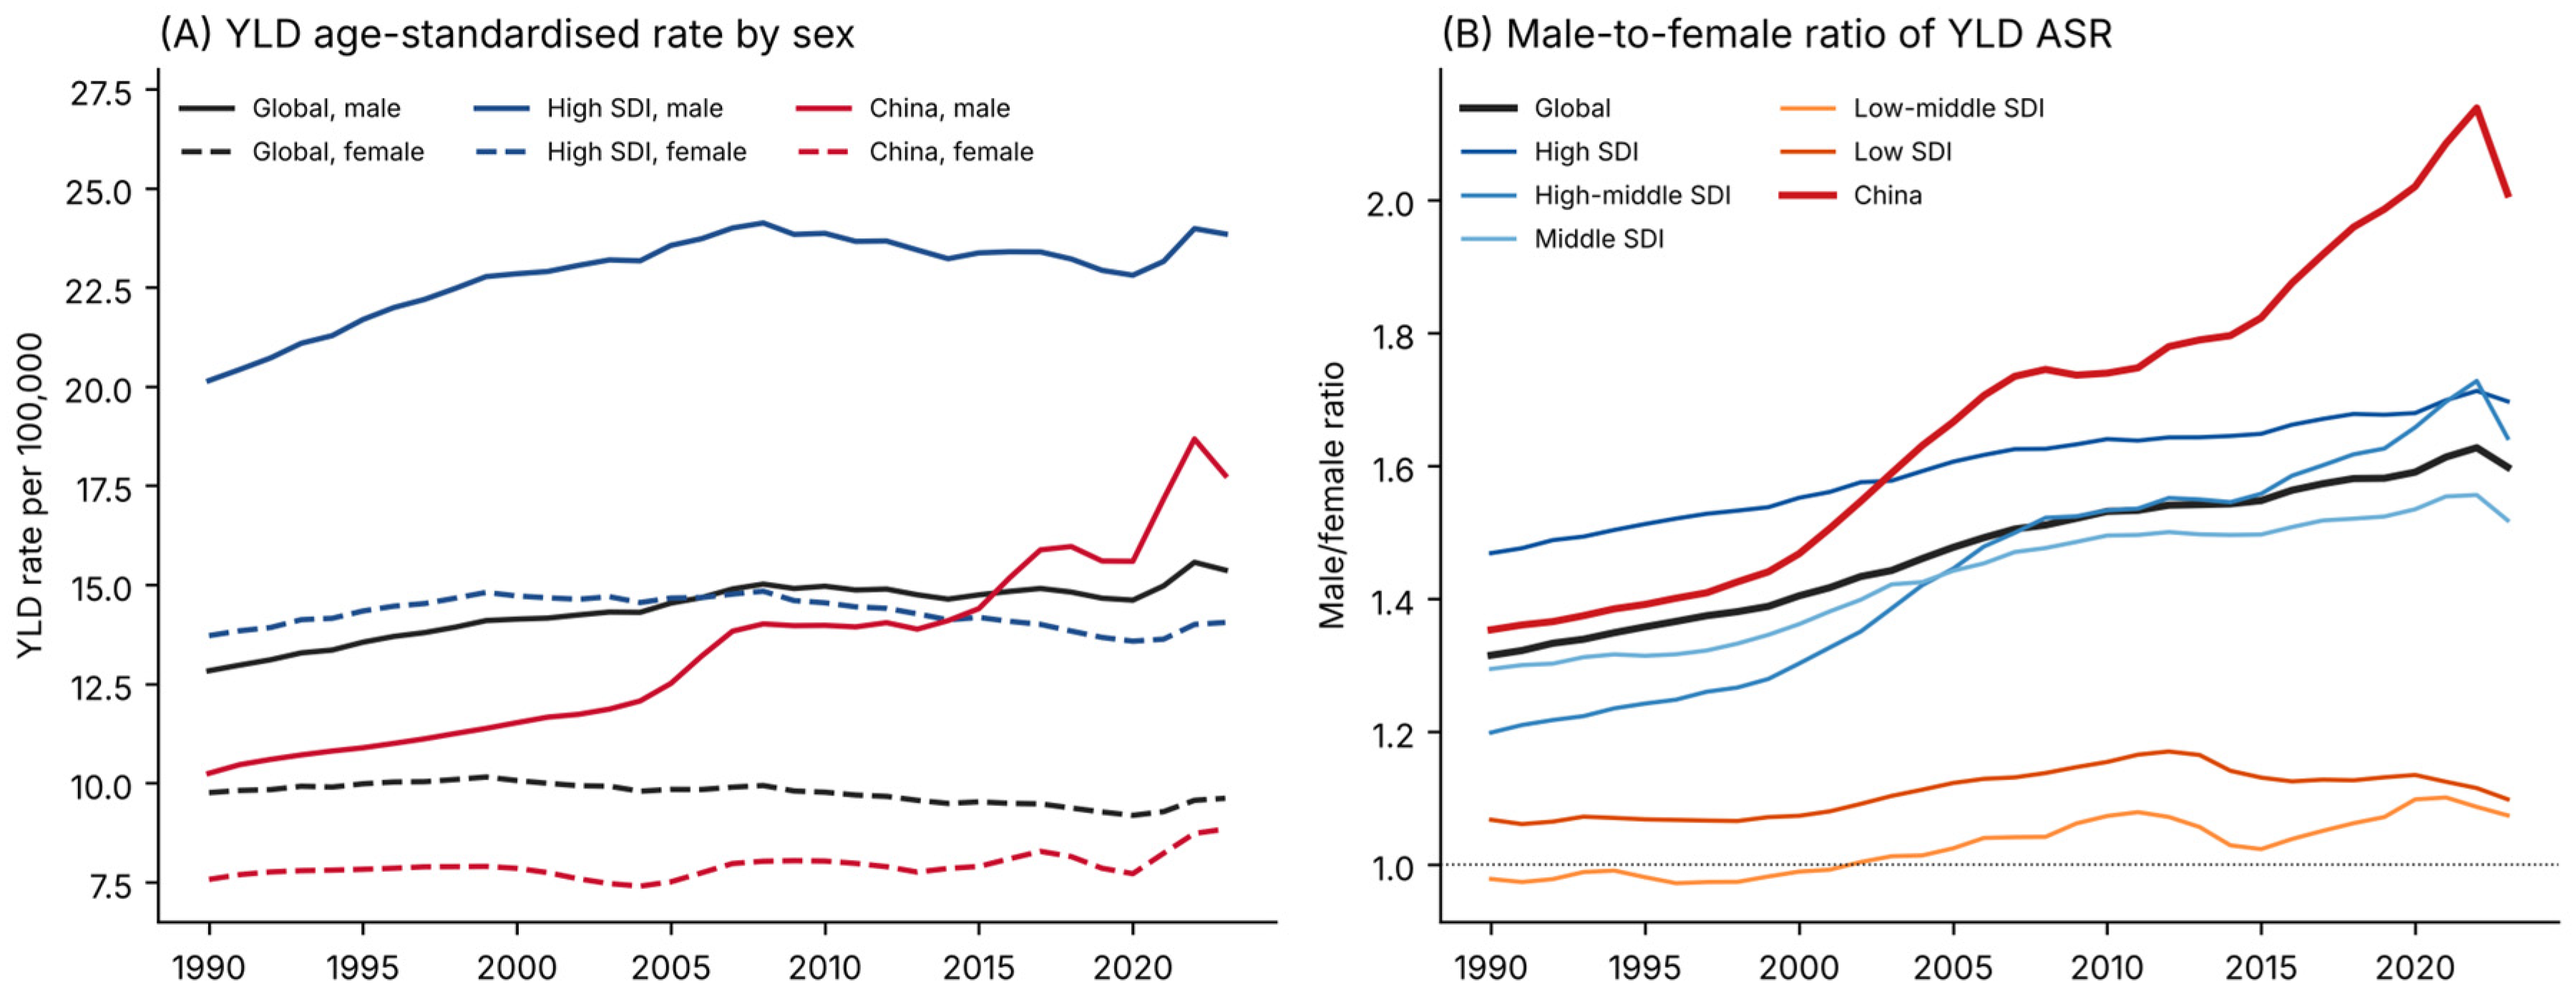
Figure 4.
Age-specific colorectal cancer YLD rates per 100,000, 1990–2023, (A) globally and (B) in China.
Figure 4.
Age-specific colorectal cancer YLD rates per 100,000, 1990–2023, (A) globally and (B) in China.
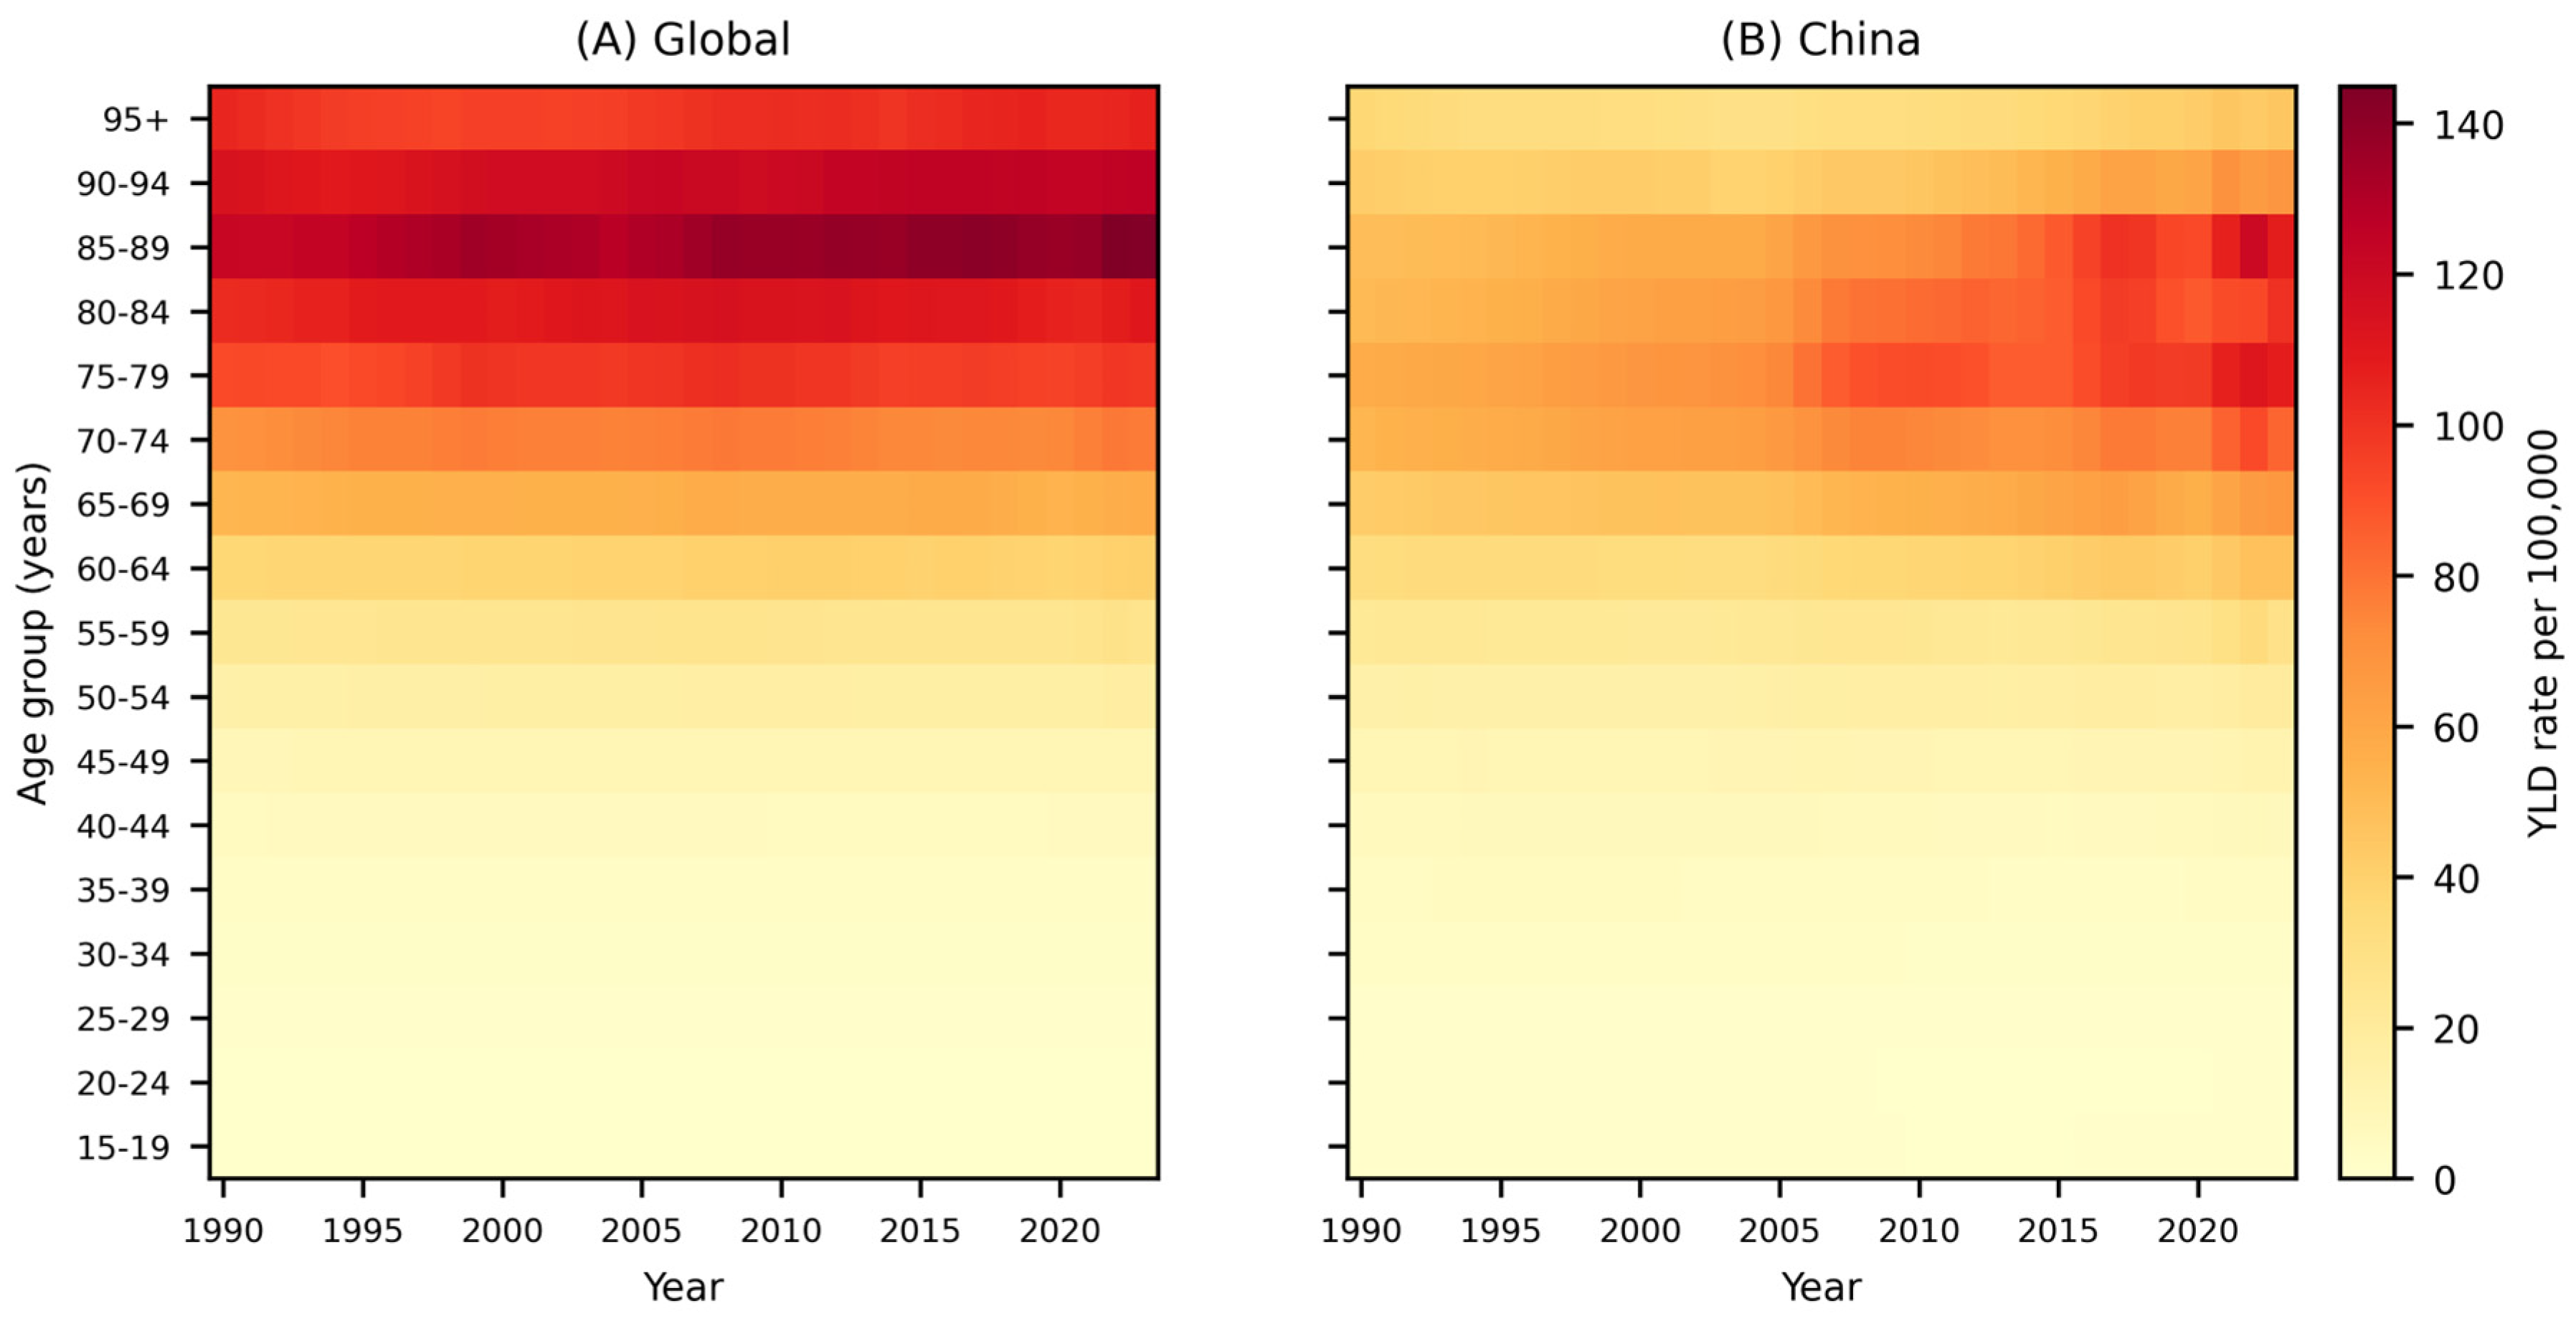
Figure 5.
Decomposition of the change in colorectal cancer YLD counts between 1990 and 2023 into population growth, population ageing and change in age-specific YLD rates, by location. Labels give the percentage contribution of each component.
Figure 5.
Decomposition of the change in colorectal cancer YLD counts between 1990 and 2023 into population growth, population ageing and change in age-specific YLD rates, by location. Labels give the percentage contribution of each component.
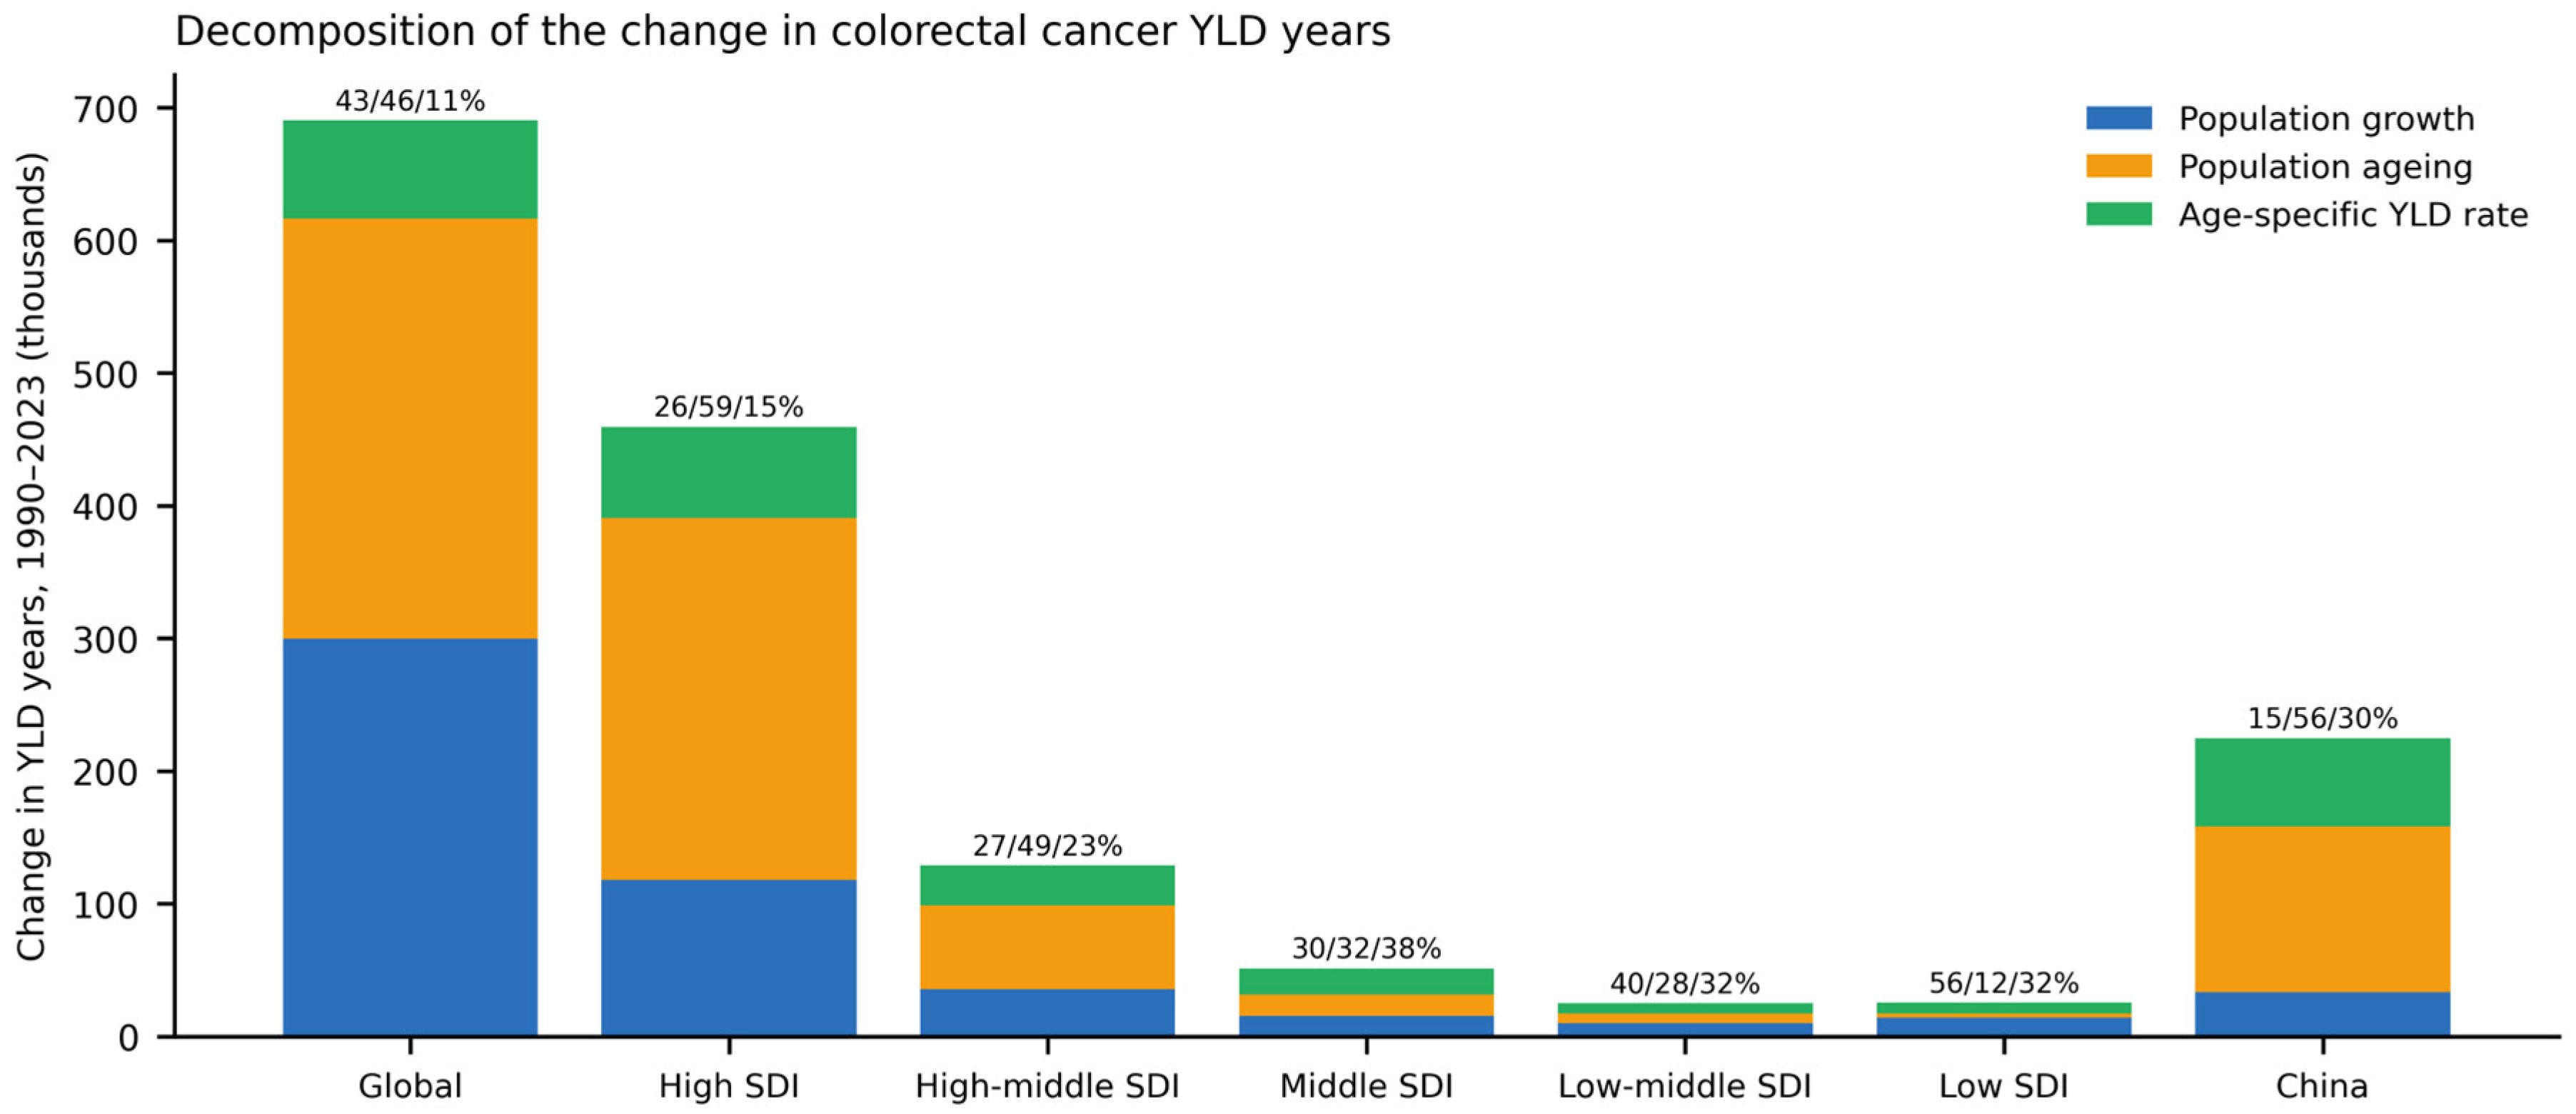
Figure 6.
China compared with the global aggregate. (A) Ratio of the Chinese to the global age-standardised YLD rate. (B) Age-standardised morbidity share; the dashed line marks 2018, when the Chinese share first exceeded the global share. (C) Early-onset YLD rates by 5-year age group, 1990 and 2023.
Figure 6.
China compared with the global aggregate. (A) Ratio of the Chinese to the global age-standardised YLD rate. (B) Age-standardised morbidity share; the dashed line marks 2018, when the Chinese share first exceeded the global share. (C) Early-onset YLD rates by 5-year age group, 1990 and 2023.
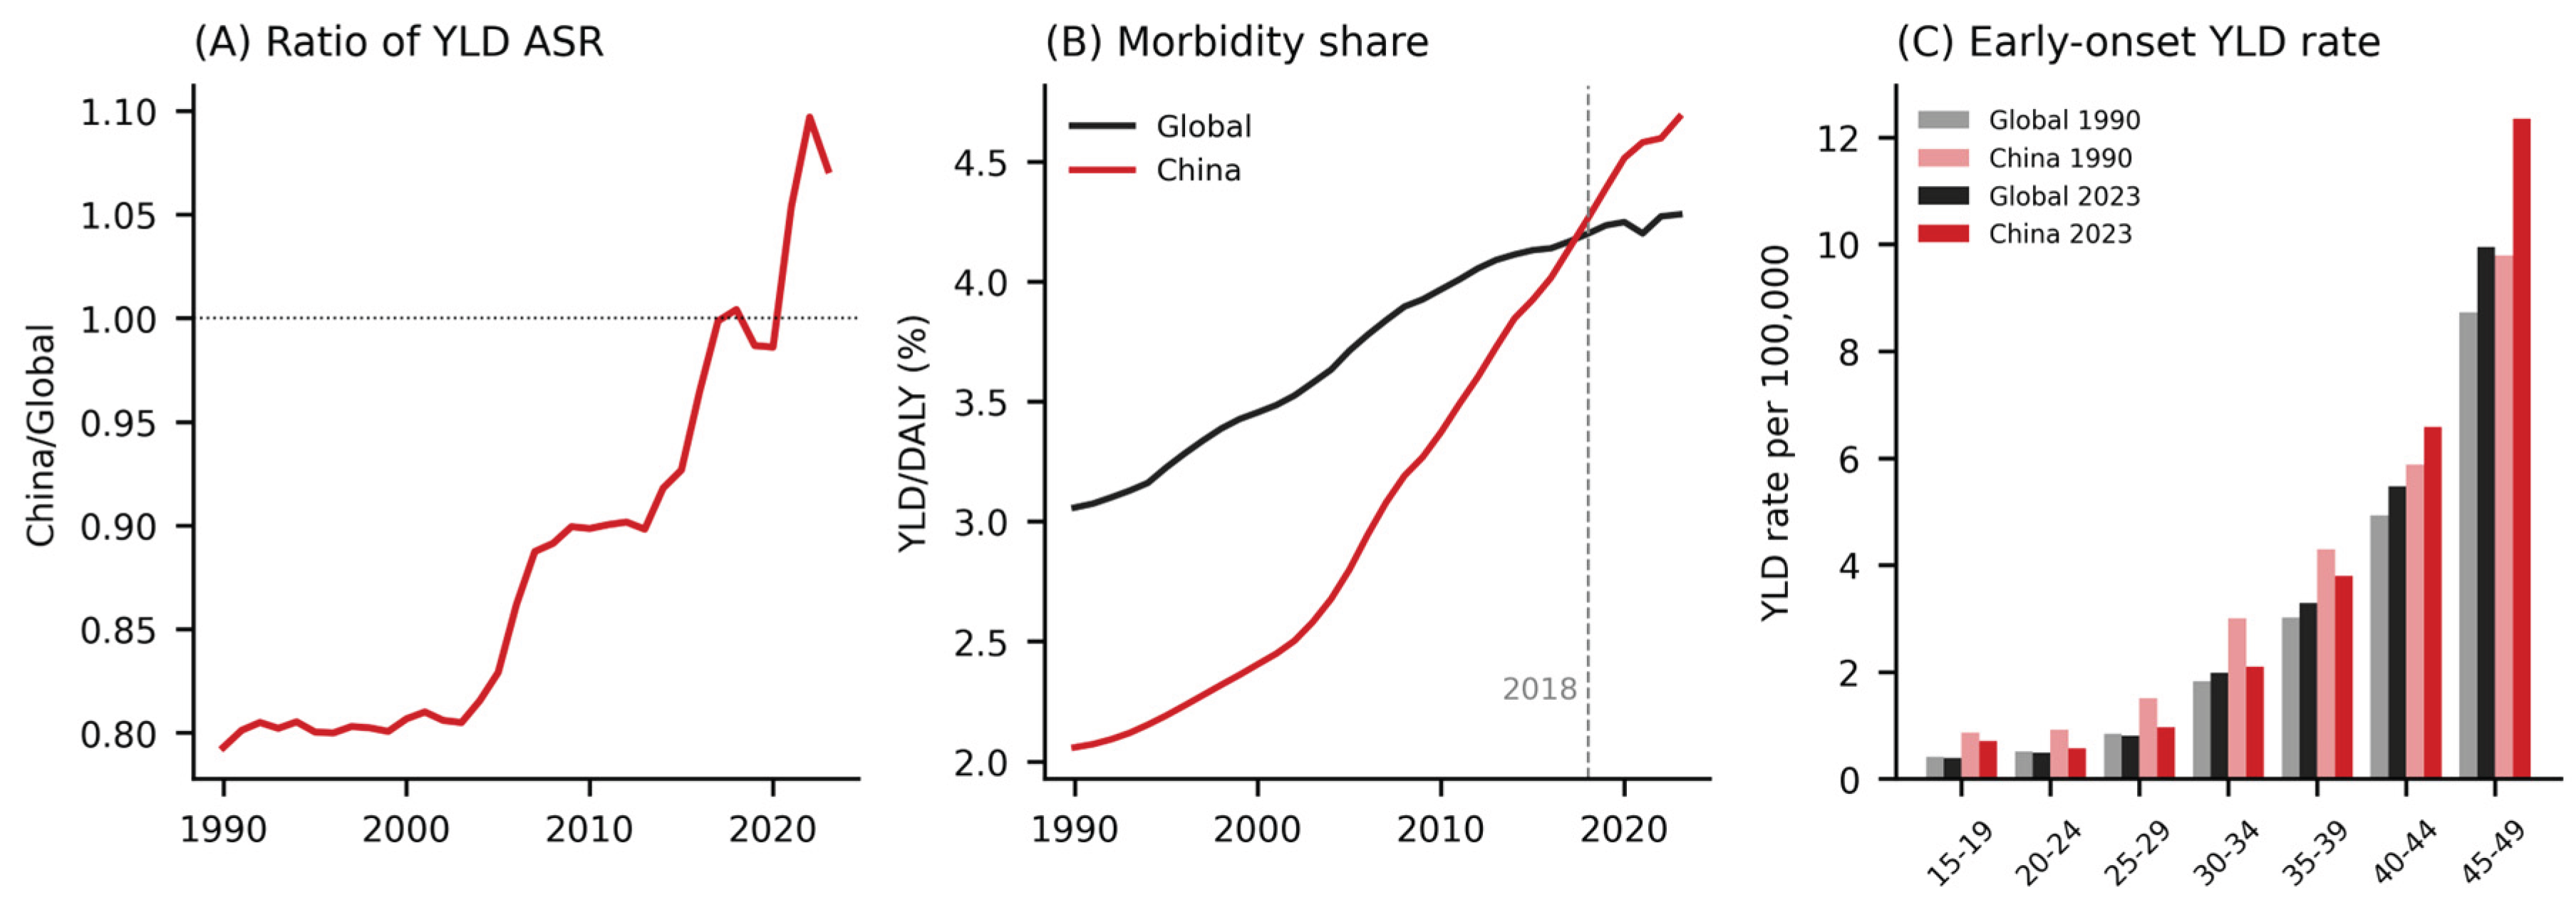

Table 1.
Colorectal cancer YLDs, YLLs and DALYs by location and sex, 1990 and 2023.
| Measure | Location | Sex | Number 1990 | Number 2023 | Change in number, % | ASR 1990 (95% UI) | ASR 2023 (95% UI) | Change in ASR, % | EAPC (95% CI) |
|---|---|---|---|---|---|---|---|---|---|
| YLD | Global | Both | 434,965 | 1,125,290 | 158.7 | 11.15 (8.31 to 14.90) | 12.31 (8.99 to 16.46) | 10.5 | 0.17 (0.11 to 0.24) |
| YLD | Global | Male | 227,738 | 655,671 | 187.9 | 12.83 (9.43 to 16.76) | 15.37 (11.11 to 20.58) | 19.8 | 0.45 (0.37 to 0.52) |
| YLD | Global | Female | 207,227 | 469,619 | 126.6 | 9.76 (7.27 to 12.93) | 9.62 (6.89 to 12.85) | −1.5 | −0.21 (−0.27 to −0.15) |
| YLD | High SDI | Both | 355,022 | 814,580 | 129.4 | 16.43 (12.02 to 22.02) | 18.59 (13.66 to 25.04) | 13.1 | 0.22 (0.12 to 0.33) |
| YLD | High SDI | Male | 185,116 | 476,979 | 157.7 | 20.15 (14.58 to 26.40) | 23.85 (17.41 to 31.99) | 18.4 | 0.37 (0.25 to 0.48) |
| YLD | High SDI | Female | 169,906 | 337,601 | 98.7 | 13.72 (10.16 to 18.54) | 14.05 (10.12 to 18.84) | 2.4 | −0.08 (−0.18 to 0.01) |
| YLD | High-middle SDI | Both | 46,681 | 175,403 | 275.7 | 6.23 (4.70 to 8.37) | 8.55 (5.96 to 11.52) | 37.2 | 0.95 (0.83 to 1.06) |
| YLD | High-middle SDI | Male | 25,189 | 105,419 | 318.5 | 6.81 (5.10 to 9.15) | 10.73 (7.47 to 14.61) | 57.5 | 1.45 (1.33 to 1.56) |
| YLD | High-middle SDI | Female | 21,492 | 69,985 | 225.6 | 5.68 (4.02 to 7.71) | 6.53 (4.60 to 8.93) | 15.0 | 0.30 (0.17 to 0.42) |
| YLD | Middle SDI | Both | 13,755 | 64,922 | 372.0 | 3.81 (2.73 to 5.31) | 6.98 (4.71 to 9.82) | 83.1 | 1.88 (1.78 to 1.99) |
| YLD | Middle SDI | Male | 7,515 | 37,964 | 405.2 | 4.33 (3.03 to 6.17) | 8.50 (5.61 to 12.09) | 96.4 | 2.15 (2.06 to 2.25) |
| YLD | Middle SDI | Female | 6,240 | 26,958 | 332.0 | 3.34 (2.32 to 4.72) | 5.60 (3.78 to 7.97) | 67.5 | 1.53 (1.41 to 1.66) |
| YLD | Low-middle SDI | Both | 10,064 | 35,062 | 248.4 | 2.38 (1.60 to 3.35) | 3.55 (2.42 to 4.92) | 48.8 | 1.22 (1.10 to 1.34) |
| YLD | Low-middle SDI | Male | 5,020 | 17,466 | 247.9 | 2.36 (1.60 to 3.53) | 3.68 (2.39 to 5.32) | 56.3 | 1.41 (1.29 to 1.54) |
| YLD | Low-middle SDI | Female | 5,044 | 17,596 | 248.9 | 2.41 (1.57 to 3.58) | 3.43 (2.31 to 5.09) | 42.3 | 1.04 (0.92 to 1.16) |
| YLD | Low SDI | Both | 8,974 | 34,235 | 281.5 | 2.18 (1.44 to 3.13) | 3.33 (2.19 to 4.65) | 52.5 | 1.07 (0.86 to 1.29) |
| YLD | Low SDI | Male | 4,650 | 17,225 | 270.4 | 2.25 (1.41 to 3.59) | 3.49 (2.12 to 5.27) | 55.1 | 1.20 (1.01 to 1.39) |
| YLD | Low SDI | Female | 4,324 | 17,010 | 293.4 | 2.11 (1.30 to 3.25) | 3.18 (1.97 to 4.83) | 50.8 | 0.96 (0.72 to 1.21) |
| YLD | China | Both | 79,268 | 303,876 | 283.4 | 8.84 (6.45 to 12.25) | 13.20 (9.03 to 18.03) | 49.3 | 1.11 (1.00 to 1.22) |
| YLD | China | Male | 44,969 | 197,543 | 339.3 | 10.25 (7.42 to 13.83) | 17.76 (12.39 to 24.69) | 73.3 | 1.66 (1.53 to 1.78) |
| YLD | China | Female | 34,299 | 106,333 | 210.0 | 7.57 (4.99 to 10.74) | 8.84 (6.05 to 12.12) | 16.7 | 0.23 (0.12 to 0.33) |
| YLL | Global | Both | 14,395,819 | 25,028,819 | 73.9 | 353.42 (330.37 to 375.47) | 275.37 (250.52 to 300.18) | −22.1 | −0.98 (−1.05 to −0.92) |
| YLL | Global | Male | 7,660,313 | 14,427,729 | 88.3 | 403.65 (372.51 to 442.56) | 334.65 (304.00 to 369.58) | −17.1 | −0.76 (−0.83 to −0.70) |
| YLL | Global | Female | 6,735,507 | 10,601,090 | 57.4 | 310.78 (283.31 to 339.44) | 222.10 (197.40 to 252.84) | −28.5 | −1.29 (−1.38 to −1.20) |
| YLL | High SDI | Both | 9,886,299 | 13,829,972 | 39.9 | 457.01 (433.27 to 479.89) | 326.32 (305.29 to 347.86) | −28.6 | −1.27 (−1.35 to −1.19) |
| YLL | High SDI | Male | 5,260,546 | 8,151,801 | 55.0 | 554.59 (526.26 to 590.02) | 416.07 (393.43 to 440.84) | −25.0 | −1.12 (−1.21 to −1.03) |
| YLL | High SDI | Female | 4,625,752 | 5,678,171 | 22.8 | 382.39 (351.43 to 408.63) | 246.76 (224.66 to 269.17) | −35.5 | −1.58 (−1.65 to −1.51) |
| YLL | High-middle SDI | Both | 2,478,776 | 4,665,416 | 88.2 | 310.19 (274.95 to 348.34) | 228.56 (210.74 to 263.24) | −26.3 | −1.16 (−1.26 to −1.07) |
| YLL | High-middle SDI | Male | 1,343,365 | 2,801,493 | 108.5 | 337.54 (286.97 to 405.37) | 284.24 (258.02 to 320.96) | −15.8 | −0.71 (−0.80 to −0.62) |
| YLL | High-middle SDI | Female | 1,135,410 | 1,863,923 | 64.2 | 283.92 (229.63 to 344.27) | 176.40 (156.44 to 221.86) | −37.9 | −1.75 (−1.89 to −1.61) |
| YLL | Middle SDI | Both | 789,984 | 2,570,854 | 225.4 | 207.03 (175.35 to 246.81) | 269.85 (223.20 to 318.68) | 30.3 | 0.80 (0.75 to 0.85) |
| YLL | Middle SDI | Male | 433,954 | 1,508,415 | 247.6 | 235.46 (188.29 to 296.69) | 327.66 (255.11 to 416.68) | 39.2 | 1.04 (0.99 to 1.09) |
| YLL | Middle SDI | Female | 356,030 | 1,062,439 | 198.4 | 181.19 (145.25 to 219.79) | 216.98 (173.08 to 271.96) | 19.8 | 0.47 (0.39 to 0.56) |
| YLL | Low-middle SDI | Both | 626,266 | 1,846,032 | 194.8 | 140.88 (111.91 to 175.82) | 182.60 (146.13 to 222.55) | 29.6 | 0.77 (0.66 to 0.88) |
| YLL | Low-middle SDI | Male | 308,895 | 906,435 | 193.4 | 138.52 (105.69 to 191.74) | 186.72 (135.91 to 251.27) | 34.8 | 0.95 (0.84 to 1.06) |
| YLL | Low-middle SDI | Female | 317,371 | 939,597 | 196.1 | 143.33 (105.86 to 192.24) | 179.54 (137.67 to 230.52) | 25.3 | 0.60 (0.47 to 0.73) |
| YLL | Low SDI | Both | 595,541 | 2,086,662 | 250.4 | 136.31 (106.26 to 178.41) | 194.62 (148.08 to 248.94) | 42.8 | 0.88 (0.68 to 1.08) |
| YLL | Low SDI | Male | 303,340 | 1,042,335 | 243.6 | 138.89 (100.94 to 204.30) | 202.95 (134.48 to 289.30) | 46.1 | 1.05 (0.88 to 1.22) |
| YLL | Low SDI | Female | 292,202 | 1,044,327 | 257.4 | 133.54 (91.81 to 189.86) | 187.15 (129.93 to 259.55) | 40.1 | 0.72 (0.49 to 0.96) |
| YLL | China | Both | 3,994,529 | 5,962,963 | 49.3 | 420.69 (355.25 to 489.56) | 268.42 (236.59 to 316.90) | −36.2 | −1.79 (−1.93 to −1.64) |
| YLL | China | Male | 2,246,722 | 3,912,571 | 74.1 | 477.77 (384.41 to 607.66) | 361.03 (308.85 to 421.65) | −24.4 | −1.21 (−1.36 to −1.05) |
| YLL | China | Female | 1,747,807 | 2,050,392 | 17.3 | 368.02 (277.46 to 471.98) | 178.42 (146.73 to 240.93) | −51.5 | −2.73 (−2.88 to −2.57) |
| DALY | Global | Both | 14,830,784 | 26,154,109 | 76.4 | 364.57 (340.59 to 387.13) | 287.69 (261.19 to 315.05) | −21.1 | −0.94 (−1.01 to −0.88) |
| DALY | Global | Male | 7,888,050 | 15,083,400 | 91.2 | 416.48 (385.18 to 455.21) | 350.03 (319.01 to 386.06) | −16.0 | −0.72 (−0.78 to −0.65) |
| DALY | Global | Female | 6,942,734 | 11,070,709 | 59.5 | 320.54 (291.61 to 351.81) | 231.72 (205.57 to 263.22) | −27.7 | −1.25 (−1.33 to −1.17) |
| DALY | High SDI | Both | 10,241,321 | 14,644,552 | 43.0 | 473.44 (449.50 to 497.72) | 344.91 (321.87 to 365.75) | −27.1 | −1.21 (−1.29 to −1.13) |
| DALY | High SDI | Male | 5,445,662 | 8,628,780 | 58.5 | 574.74 (545.49 to 609.98) | 439.92 (414.49 to 467.99) | −23.5 | −1.05 (−1.14 to −0.96) |
| DALY | High SDI | Female | 4,795,659 | 6,015,772 | 25.4 | 396.11 (364.51 to 423.14) | 260.81 (236.39 to 283.12) | −34.2 | −1.52 (−1.59 to −1.45) |
| DALY | High-middle SDI | Both | 2,525,456 | 4,840,819 | 91.7 | 316.42 (280.79 to 354.49) | 237.11 (218.79 to 272.33) | −25.1 | −1.11 (−1.21 to −1.01) |
| DALY | High-middle SDI | Male | 1,368,554 | 2,906,912 | 112.4 | 344.36 (293.15 to 412.92) | 294.97 (266.76 to 333.21) | −14.3 | −0.66 (−0.74 to −0.57) |
| DALY | High-middle SDI | Female | 1,156,902 | 1,933,908 | 67.2 | 289.61 (234.28 to 350.73) | 182.93 (161.43 to 229.22) | −36.8 | −1.70 (−1.83 to −1.56) |
| DALY | Middle SDI | Both | 803,739 | 2,635,776 | 227.9 | 210.84 (178.48 to 252.14) | 276.83 (228.93 to 327.56) | 31.3 | 0.82 (0.77 to 0.87) |
| DALY | Middle SDI | Male | 441,470 | 1,546,379 | 250.3 | 239.79 (191.76 to 301.84) | 336.16 (263.35 to 426.49) | 40.2 | 1.07 (1.02 to 1.12) |
| DALY | Middle SDI | Female | 362,269 | 1,089,397 | 200.7 | 184.54 (148.14 to 224.41) | 222.59 (177.05 to 278.43) | 20.6 | 0.50 (0.41 to 0.58) |
| DALY | Low-middle SDI | Both | 636,330 | 1,881,093 | 195.6 | 143.27 (113.66 to 179.33) | 186.14 (149.12 to 227.13) | 29.9 | 0.78 (0.67 to 0.89) |
| DALY | Low-middle SDI | Male | 313,915 | 923,901 | 194.3 | 140.88 (107.72 to 194.29) | 190.41 (138.64 to 256.56) | 35.2 | 0.96 (0.85 to 1.07) |
| DALY | Low-middle SDI | Female | 322,415 | 957,192 | 196.9 | 145.74 (107.53 to 194.85) | 182.97 (140.53 to 235.84) | 25.5 | 0.61 (0.48 to 0.74) |
| DALY | Low SDI | Both | 604,516 | 2,120,897 | 250.8 | 138.49 (108.02 to 181.31) | 197.94 (150.58 to 253.00) | 42.9 | 0.89 (0.69 to 1.09) |
| DALY | Low SDI | Male | 307,990 | 1,059,560 | 244.0 | 141.14 (102.60 to 207.44) | 206.44 (136.67 to 294.10) | 46.3 | 1.05 (0.88 to 1.23) |
| DALY | Low SDI | Female | 296,525 | 1,061,337 | 257.9 | 135.65 (93.14 to 192.73) | 190.33 (132.10 to 263.99) | 40.3 | 0.73 (0.49 to 0.96) |
| DALY | China | Both | 4,073,797 | 6,266,840 | 53.8 | 429.53 (361.57 to 499.38) | 281.61 (250.38 to 332.27) | −34.4 | −1.70 (−1.84 to −1.55) |
| DALY | China | Male | 2,291,691 | 4,110,114 | 79.3 | 488.02 (396.74 to 620.34) | 378.80 (324.91 to 439.06) | −22.4 | −1.12 (−1.27 to −0.97) |
| DALY | China | Female | 1,782,106 | 2,156,726 | 21.0 | 375.59 (283.36 to 481.50) | 187.27 (154.10 to 252.18) | −50.1 | −2.64 (−2.79 to −2.49) |
YLD, years lived with disability; YLL, years of life lost; DALY, disability-adjusted life-years; ASR, age-standardised rate per 100,000; UI, uncertainty interval; EAPC, estimated annual percentage change from a log-linear regression of the ASR on calendar year, with 95% confidence interval. Counts with 95% UIs, crude rates and YLD/YLL ratios are in Supplementary Table S1.
Table 2.
Joinpoint regression of age-standardised YLD, YLL and DALY rates and of the morbidity share, both sexes, 1990–2023.
Table 2.
Joinpoint regression of age-standardised YLD, YLL and DALY rates and of the morbidity share, both sexes, 1990–2023.
| Location | Series | Segment 1, APC (95% CI) | Segment 2, APC (95% CI) | Segment 3, APC (95% CI) | Segment 4, APC (95% CI) | AAPC 1990–2023 (95% CI) | Joinpoints |
|---|---|---|---|---|---|---|---|
| Global | YLD ASR | 1990–1997: 0.82 (0.62 to 1.02) ↑ | 1997–2009: 0.29 (0.19 to 0.38) ↑ | 2009–2018: −0.37 (−0.50 to −0.24) ↓ | 2018–2023: 0.74 (0.43 to 1.06) ↑ | 0.29 (0.24 to 0.33) ↑ | 1997, 2009, 2018 |
| Global | YLL ASR | 1990–1994: −0.16 (−0.63 to 0.32) | 1994–2000: −0.95 (−1.17 to −0.72) ↓ | 2000–2018: −1.20 (−1.26 to −1.13) ↓ | 2018–2023: 0.55 (0.23 to 0.86) ↑ | −0.76 (−0.82 to −0.71) ↓ | 1994, 2000, 2018 |
| Global | DALY ASR | 1990–1994: −0.13 (−0.59 to 0.34) | 1994–2000: −0.89 (−1.11 to −0.67) ↓ | 2000–2018: −1.16 (−1.22 to −1.09) ↓ | 2018–2023: 0.54 (0.24 to 0.85) ↑ | −0.73 (−0.78 to −0.68) ↓ | 1994, 2000, 2018 |
| Global | Morbidity share | 1990–2003: 1.30 (1.24 to 1.36) ↑ | 2003–2008: 1.68 (1.52 to 1.83) ↑ | 2008–2013: 0.99 (0.83 to 1.15) ↑ | 2013–2023: 0.46 (0.37 to 0.54) ↑ | 1.05 (1.03 to 1.07) ↑ | 2003, 2008, 2013 |
| High SDI | YLD ASR | 1990–1998: 1.20 (1.04 to 1.35) ↑ | 1998–2008: 0.44 (0.34 to 0.54) ↑ | 2008–2018: −0.48 (−0.58 to −0.37) ↓ | 2018–2023: 0.47 (0.19 to 0.75) ↑ | 0.35 (0.31 to 0.39) ↑ | 1998, 2008, 2018 |
| High SDI | YLL ASR | 1990–1994: 0.15 (−0.29 to 0.59) | 1994–2002: −0.92 (−1.08 to −0.76) ↓ | 2002–2018: −1.64 (−1.71 to −1.57) ↓ | 2018–2023: −0.26 (−0.56 to 0.05) | −1.04 (−1.09 to −0.99) ↓ | 1994, 2002, 2018 |
| High SDI | DALY ASR | 1990–1994: 0.19 (−0.25 to 0.63) | 1994–2002: −0.85 (−1.00 to −0.69) ↓ | 2002–2018: −1.57 (−1.64 to −1.50) ↓ | 2018–2023: −0.23 (−0.53 to 0.07) | −0.98 (−1.03 to −0.93) ↓ | 1994, 2002, 2018 |
| High SDI | Morbidity share | 1990–2003: 1.55 (1.49 to 1.61) ↑ | 2003–2008: 2.03 (1.87 to 2.19) ↑ | 2008–2013: 1.32 (1.16 to 1.48) ↑ | 2013–2023: 0.85 (0.76 to 0.94) ↑ | 1.38 (1.36 to 1.40) ↑ | 2003, 2008, 2013 |
| High-middle SDI | YLD ASR | 1990–2004: 0.21 (0.05 to 0.36) ↑ | 2004–2009: 2.25 (1.81 to 2.70) ↑ | 2009–2014: 0.14 (−0.33 to 0.61) | 2014–2023: 1.83 (1.55 to 2.12) ↑ | 0.94 (0.88 to 1.01) ↑ | 2004, 2009, 2014 |
| High-middle SDI | YLL ASR | 1990–1994: −0.43 (−1.11 to 0.26) | 1994–2013: −1.44 (−1.54 to −1.33) ↓ | 2013–2018: −0.88 (−1.33 to −0.43) ↓ | 2018–2023: 0.59 (−0.04 to 1.22) | −0.93 (−1.02 to −0.84) ↓ | 1994, 2013, 2018 |
| High-middle SDI | DALY ASR | 1990–1994: −0.44 (−1.13 to 0.25) | 1994–2013: −1.38 (−1.49 to −1.28) ↓ | 2013–2018: −0.81 (−1.26 to −0.35) ↓ | 2018–2023: 0.64 (0.01 to 1.28) ↑ | −0.88 (−0.97 to −0.79) ↓ | 1994, 2013, 2018 |
| High-middle SDI | Morbidity share | 1990–1994: 0.81 (0.56 to 1.05) ↑ | 1994–2002: 1.55 (1.46 to 1.65) ↑ | 2002–2011: 2.80 (2.73 to 2.88) ↑ | 2011–2023: 1.80 (1.74 to 1.86) ↑ | 1.89 (1.87 to 1.92) ↑ | 1994, 2002, 2011 |
| Middle SDI | YLD ASR | 1990–2005: 1.15 (1.07 to 1.23) ↑ | 2005–2010: 3.28 (3.05 to 3.51) ↑ | 2010–2018: 1.73 (1.57 to 1.90) ↑ | 2018–2023: 2.69 (2.37 to 3.01) ↑ | 1.85 (1.81 to 1.88) ↑ | 2005, 2010, 2018 |
| Middle SDI | YLL ASR | 1990–2005: 0.50 (0.42 to 0.58) ↑ | 2005–2011: 1.51 (1.31 to 1.71) ↑ | 2011–2018: 0.39 (0.19 to 0.58) ↑ | 2018–2023: 1.41 (1.09 to 1.74) ↑ | 0.80 (0.76 to 0.84) ↑ | 2005, 2011, 2018 |
| Middle SDI | DALY ASR | 1990–2005: 0.51 (0.43 to 0.59) ↑ | 2005–2011: 1.54 (1.35 to 1.74) ↑ | 2011–2018: 0.41 (0.22 to 0.61) ↑ | 2018–2023: 1.44 (1.12 to 1.77) ↑ | 0.82 (0.78 to 0.86) ↑ | 2005, 2011, 2018 |
| Middle SDI | Morbidity share | 1990–2002: 0.54 (0.48 to 0.60) ↑ | 2002–2023: 1.28 (1.25 to 1.31) ↑ | 1.01 (0.99 to 1.03) ↑ | 2002 | ||
| Low-middle SDI | YLD ASR | 1990–1995: −0.18 (−0.38 to 0.02) | 1995–2005: 0.96 (0.88 to 1.04) ↑ | 2005–2015: 1.21 (1.14 to 1.29) ↑ | 2015–2023: 2.48 (2.36 to 2.59) ↑ | 1.23 (1.20 to 1.26) ↑ | 1995, 2005, 2015 |
| Low-middle SDI | YLL ASR | 1990–1994: −0.63 (−1.13 to −0.14) ↓ | 1994–2013: 0.58 (0.51 to 0.66) ↑ | 2013–2018: 1.36 (1.03 to 1.70) ↑ | 2018–2023: 2.35 (1.89 to 2.82) ↑ | 0.82 (0.75 to 0.88) ↑ | 1994, 2013, 2018 |
| Low-middle SDI | DALY ASR | 1990–1994: −0.63 (−1.12 to −0.14) ↓ | 1994–2013: 0.59 (0.51 to 0.67) ↑ | 2013–2018: 1.38 (1.05 to 1.71) ↑ | 2018–2023: 2.36 (1.90 to 2.82) ↑ | 0.83 (0.76 to 0.89) ↑ | 1994, 2013, 2018 |
| Low-middle SDI | Morbidity share | 1990–2001: 0.19 (0.08 to 0.30) ↑ | 2001–2018: 0.56 (0.50 to 0.62) ↑ | 2018–2023: 0.24 (−0.05 to 0.53) | 0.39 (0.35 to 0.43) ↑ | 2001, 2018 | |
| Low SDI | YLD ASR | 1990–2004: −0.04 (−0.12 to 0.04) | 2004–2012: 1.24 (1.11 to 1.38) ↑ | 2012–2018: 1.97 (1.75 to 2.18) ↑ | 2018–2023: 4.04 (3.72 to 4.36) ↑ | 1.25 (1.21 to 1.29) ↑ | 2004, 2012, 2018 |
| Low SDI | YLL ASR | 1990–2005: −0.03 (−0.11 to 0.05) | 2005–2012: 1.01 (0.83 to 1.18) ↑ | 2012–2018: 1.68 (1.44 to 1.92) ↑ | 2018–2023: 3.84 (3.48 to 4.19) ↑ | 1.08 (1.04 to 1.12) ↑ | 2005, 2012, 2018 |
| Low SDI | DALY ASR | 1990–2005: −0.03 (−0.11 to 0.05) | 2005–2012: 1.01 (0.84 to 1.19) ↑ | 2012–2018: 1.69 (1.45 to 1.93) ↑ | 2018–2023: 3.84 (3.49 to 4.19) ↑ | 1.08 (1.04 to 1.12) ↑ | 2005, 2012, 2018 |
| Low SDI | Morbidity share | 1990–2002: 0.01 (−0.08 to 0.09) | 2002–2023: 0.27 (0.22 to 0.31) ↑ | 0.17 (0.15 to 0.20) ↑ | 2002 | ||
| China | YLD ASR | 1990–2003: 0.57 (0.31 to 0.83) ↑ | 2003–2008: 2.47 (1.80 to 3.14) ↑ | 2008–2014: −0.10 (−0.68 to 0.48) | 2014–2023: 2.14 (1.71 to 2.56) ↑ | 1.16 (1.06 to 1.25) ↑ | 2003, 2008, 2014 |
| China | YLL ASR | 1990–1997: −0.57 (−1.18 to 0.05) | 1997–2009: −1.94 (−2.25 to −1.64) ↓ | 2009–2014: −3.53 (−4.24 to −2.81) ↓ | 2014–2023: −0.32 (−0.82 to 0.18) | −1.45 (−1.58 to −1.33) ↓ | 1997, 2009, 2014 |
| China | DALY ASR | 1990–1997: −0.55 (−1.16 to 0.06) | 1997–2009: −1.86 (−2.16 to −1.56) ↓ | 2009–2014: −3.39 (−4.11 to −2.68) ↓ | 2014–2023: −0.22 (−0.72 to 0.28) | −1.37 (−1.49 to −1.25) ↓ | 1997, 2009, 2014 |
| China | Morbidity share | 1990–2002: 1.68 (1.59 to 1.78) ↑ | 2002–2008: 4.30 (4.13 to 4.47) ↑ | 2008–2018: 3.01 (2.90 to 3.12) ↑ | 2018–2023: 1.88 (1.62 to 2.15) ↑ | 2.59 (2.55 to 2.62) ↑ | 2002, 2008, 2018 |
APC, annual percentage change within a segment; AAPC, average annual percentage change over 1990–2023; both with 95% confidence intervals. ↑ and ↓ mark an increase or decrease whose 95% confidence interval excludes zero. Up to three joinpoints, at least five annual observations per segment, selected by the Bayesian information criterion. Morbidity share, age-standardised YLD rate as a percentage of the age-standardised DALY rate. Sex-specific results are in Supplementary Table S2.
Table 3.
Decomposition of the change in colorectal cancer YLD counts, 1990–2023.
| Location | Change in YLD count, 1990–2023 | Population growth, n (%) | Population ageing, n (%) | Age-specific rate change, n (%) |
|---|---|---|---|---|
| Global | 690,325 | 299,480 (43.4) | 317,097 (45.9) | 73,747 (10.7) |
| High SDI | 459,557 | 118,017 (25.7) | 272,569 (59.3) | 68,971 (15.0) |
| High-middle SDI | 128,722 | 35,364 (27.5) | 63,512 (49.3) | 29,846 (23.2) |
| Middle SDI | 51,167 | 15,267 (29.8) | 16,268 (31.8) | 19,632 (38.4) |
| Low-middle SDI | 24,998 | 9,922 (39.7) | 7,114 (28.5) | 7,962 (31.8) |
| Low SDI | 25,261 | 14,214 (56.3) | 2,976 (11.8) | 8,071 (31.9) |
| China | 224,609 | 33,276 (14.8) | 124,793 (55.6) | 66,540 (29.6) |
Das Gupta three-factor decomposition over 18 age groups, averaged over all orders of factor replacement; components sum exactly to the total change. Percentages are shares of the total change.
Disclaimer/Publisher’s Note: The statements, opinions and data contained in all publications are solely those of the individual author(s) and contributor(s) and not of MDPI and/or the editor(s). MDPI and/or the editor(s) disclaim responsibility for any injury to people or property resulting from any ideas, methods, instructions or products referred to in the content. |
© 2026 by the authors. Licensee MDPI, Basel, Switzerland. This article is an open access article distributed under the terms and conditions of the Creative Commons Attribution (CC BY) license (http://creativecommons.org/licenses/by/4.0/).
Copyright: This open access article is published under a Creative Commons CC BY 4.0 license, which permit the free download, distribution, and reuse, provided that the author and preprint are cited in any reuse.