

Submitted:
10 November 2026
Posted:
12 November 2026
You are already at the latest version
Abstract
We performed a two-sample Mendelian randomization study to evaluate the causal relationships between genetically proxied bone mineral density (BMD), osteoporosis liability, and sudden sen-sorineural hearing loss (SSNHL) using publicly available genome-wide association study summary statistics from UK Biobank and FinnGen. The primary analysis was the inverse-variance weighted multiplicative random-effects (IVW-MRE) model, supplemented by prespecified sensitivity analyses. For BMD (203 SNPs), no significant association with SSNHL risk was found (OR = 1.02, 95% CI: 0.87–1.20, p = 0.81), and leave-one-out analysis revealed that the estimate was unstable with significant horizontal pleiotropy. For osteoporosis liability (2 SNPs), despite a statistically significant IVW-MRE estimate (OR = 0.87, 95% CI: 0.82–0.92), the direction was opposite to our prespecified hypothesis, and prespecified sensitivity analyses were not estimable. In conclusion, this study did not find robust causal evidence linking BMD or osteoporosis to SSNHL. The significant but reverse-directional estimate for osteoporosis should not be interpreted as a protective causal effect due to the extremely low number of instruments and potential sample overlap.
Keywords:
Mendelian randomization
; bone mineral density
; osteoporosis
; sudden sensorineural hearing loss
; horizontal pleiotropy
; negative findings
1. Introduction
Sudden sensorineural hearing loss (SSNHL) is an idiopathic, rapid-onset auditory dysfunction that significantly impacts quality of life. Despite extensive research, its etiology remains largely elusive, involving suspected vascular, viral, and immunological mechanisms. Recent observational studies have hinted at a cross-talk between bone metabolism and auditory function. For instance, low bone mineral density (BMD) and osteoporosis have been associated with hearing loss, potentially due to shared microvascular pathologies or otoconia degeneration. However, observational studies are inherently susceptible to residual confounding and reverse causation.
Mendelian randomization (MR) leverages germline genetic variants as instrumental variables (IVs) to infer causal relationships. The approach is conceptually analogous to a randomized controlled trial, as genetic variants are randomly assorted at conception and are generally independent of environmental confounders [1,2]. This design mitigates confounding and reverse causation that often distort conventional observational findings [1]. The STROBE-MR statement explicitly recommends that MR studies justify why the design is appropriate for the research question and clearly report prespecified hypotheses and sensitivity analyses [3]. To address the growing concern regarding data-driven analyses and selective reporting (HARKing and p-hacking), we designed a strict, prespecified protocol to evaluate whether genetically proxied BMD and genetic liability to osteoporosis are causally associated with SSNHL in adults of European ancestry.
Our primary hypothesis (H1) was that higher genetically proxied BMD is associated with a lower risk of SSNHL (OR < 1). Our secondary hypothesis (H2) was that higher genetic liability to osteoporosis is associated with a higher risk of SSNHL (OR > 1). If both exposures are causally related, the results should be directionally concordant. All analysis parameters, GWAS datasets, and decision rules were locked prior to examining the SNP-level association results [6].
2. Methods
2.1. Study Design and Data Sources
This study is a two-sample summary-data MR analysis using publicly available, de-identified GWAS summary statistics. The authors certify that no individual-level data were accessed. Dataset identifiers, sample sizes, and phenotype definitions were locked prior to the extraction of variant-level data [6].
The primary exposure was heel BMD T-score from the UK Biobank (GWAS ID: ukb-b-15730, European-ancestry adults) [11]. The secondary exposure was genetic liability to osteoporosis from FinnGen (GWAS ID: finn-b-M13_OSTEOPOROSIS, 3,203 cases and 209,575 controls) [10]. The outcome was sudden idiopathic hearing loss (used as an operationalized phenotype for SSNHL) from FinnGen (GWAS ID: finn-b-H8_HL_IDIOP, 1,491 cases and 196,592 controls) [9]. Both FinnGen datasets correspond to the 2021 freeze [13].
2.2. Instrument Selection and Prespecified Rules
Instruments were extracted using the TwoSampleMR and ieugwasr R packages through the MRC IEU OpenGWAS data infrastructure [12]. The MR-Base platform provides a unified framework for automated two-sample MR analysis with integrated sensitivity analyses [4]. We applied a prespecified threshold of and linkage disequilibrium clumping at within 10,000 kb. Palindromic SNPs with ambiguous allele directions were excluded via harmonization (action = 1).
Steiger filtering was prespecified to remove variants whose effect on the outcome was stronger than on the exposure. The F-statistic was calculated to assess instrument strength, with indicating weak instruments.
2.3. Statistical Analysis
For each retained SNP, the Wald ratio was calculated. Per-SNP estimates were combined using the inverse-variance weighted multiplicative random-effects (IVW-MRE) model as the primary method. Prespecified alternative combiners were the weighted median, weighted mode, and MR-Egger regressions. The MR-Egger regression provides a sensitivity analysis for directional horizontal pleiotropy by allowing for an intercept term that captures the average pleiotropic effect across variants [5].
Model diagnostics included Cochran’s Q (heterogeneity), MR-Egger intercept (directional pleiotropy), MR-PRESSO (global heterogeneity and outliers, with a locked random seed of 2026), and leave-one-out (LOO) analyses.
A hypothesis was considered supported only if the 95% confidence interval (CI) excluded 1 in the hypothesized direction. A result was defined as "robust" only if weighted median and weighted mode estimates were directionally consistent with the primary estimate, the MR-Egger intercept was not significant at , and the LOO analysis did not show direction flipping. If the number of valid instruments was insufficient for a given sensitivity method, the estimate would be reported as not estimable rather than replaced with ad hoc alternatives.
3. Results
3.1. Instrument Characteristics
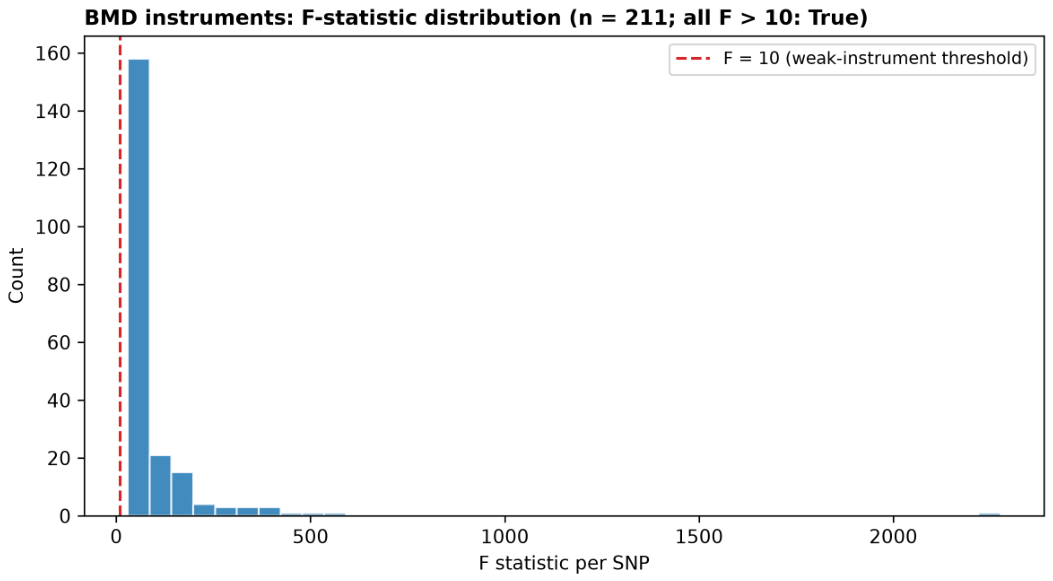
The data flow and instrument filtering process are illustrated in Figure 1. For BMD, 211 SNPs reached genome-wide significance. After harmonization, 203 SNPs were retained for the primary MR analysis. No SNPs were removed by the F-statistic filter ( for all; Figure 5). However, the prespecified Steiger filtering could not be executed due to the absence of required sample size columns (samplesize.outcome) in the extracted datasets; this protocol deviation was recorded and we proceeded without Steiger filtering.
For osteoporosis, only 2 independent SNPs were available as instruments. Consequently, prespecified sensitivity analyses requiring SNPs (weighted median, weighted mode, MR-Egger, MR-PRESSO, and Cochran’s Q) were fundamentally not estimable and are reported as such.
3.2. BMD and SSNHL (Primary Analysis)
The IVW-MRE model found no evidence that higher genetically proxied BMD reduces SSNHL risk (OR = 1.02, 95% CI: 0.87–1.20, ; Figure 2A). The direction of the point estimate was slightly opposite to H1. The weighted median (OR = 0.87, 95% CI: 0.67–1.14) and weighted mode (OR = 0.81, 95% CI: 0.57–1.14) also yielded null results.
Although Cochran’s Q indicated no significant heterogeneity (), the MR-Egger intercept was significantly non-zero (), indicating potential directional horizontal pleiotropy [5]. Furthermore, LOO analysis demonstrated that the overall IVW estimate was not stable; removing at least one SNP changed the direction of the point estimate (Figure 2B). Therefore, despite the MR-Egger slope showing a nominal protective effect (OR = 0.70, ), the violated pleiotropy assumption and the unstable LOO results dictate that BMD is not robustly causally associated with SSNHL. Scatter and funnel plots are provided in Figure 4.
3.3. Osteoporosis and SSNHL (Secondary Analysis)
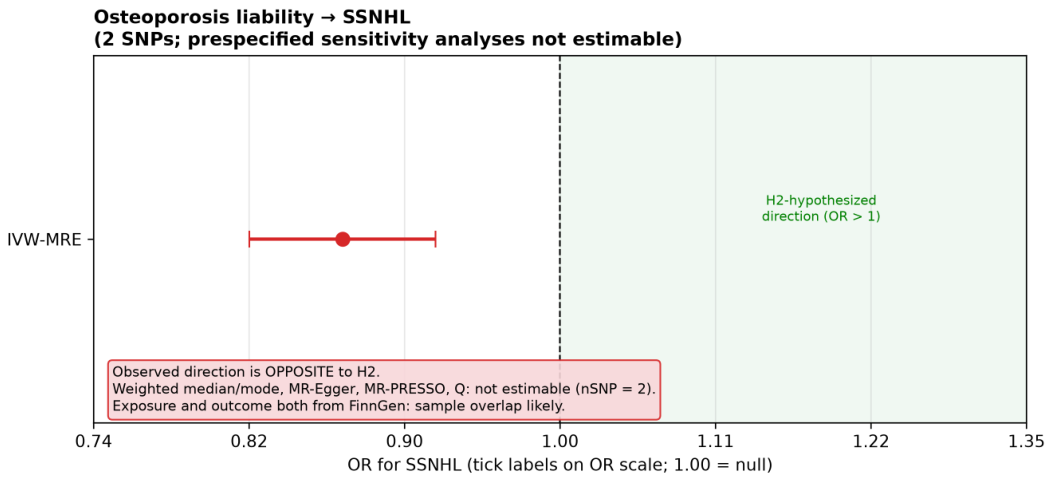
With only 2 SNPs, the IVW-MRE model yielded a statistically significant but opposite-direction estimate: OR = 0.87 (95% CI: 0.82–0.92, ; Figure 3). Because the CI excludes 1 in the direction opposite to H2 (which hypothesized OR > 1), H2 is not supported.
Given the very low number of instruments, the impossibility of assessing horizontal pleiotropy, and the fact that both the exposure and outcome originate from the FinnGen cohort (posing a high risk of sample overlap and violating the two-sample MR independence assumption), this statistical significance is highly fragile. Per our prespecified rule, this signal is reported transparently but is not interpreted as evidence of a protective causal effect.
Figure 4.
BMD instrument sensitivity visualizations. (A) Scatter plot of SNP-exposure associations against SNP-outcome associations. The non-zero MR-Egger intercept confirms directional horizontal pleiotropy. (B) Funnel plot showing the distribution of Wald ratios against their precision. Extreme outliers contribute heavily to the heterogeneity.
Figure 4.
BMD instrument sensitivity visualizations. (A) Scatter plot of SNP-exposure associations against SNP-outcome associations. The non-zero MR-Egger intercept confirms directional horizontal pleiotropy. (B) Funnel plot showing the distribution of Wald ratios against their precision. Extreme outliers contribute heavily to the heterogeneity.
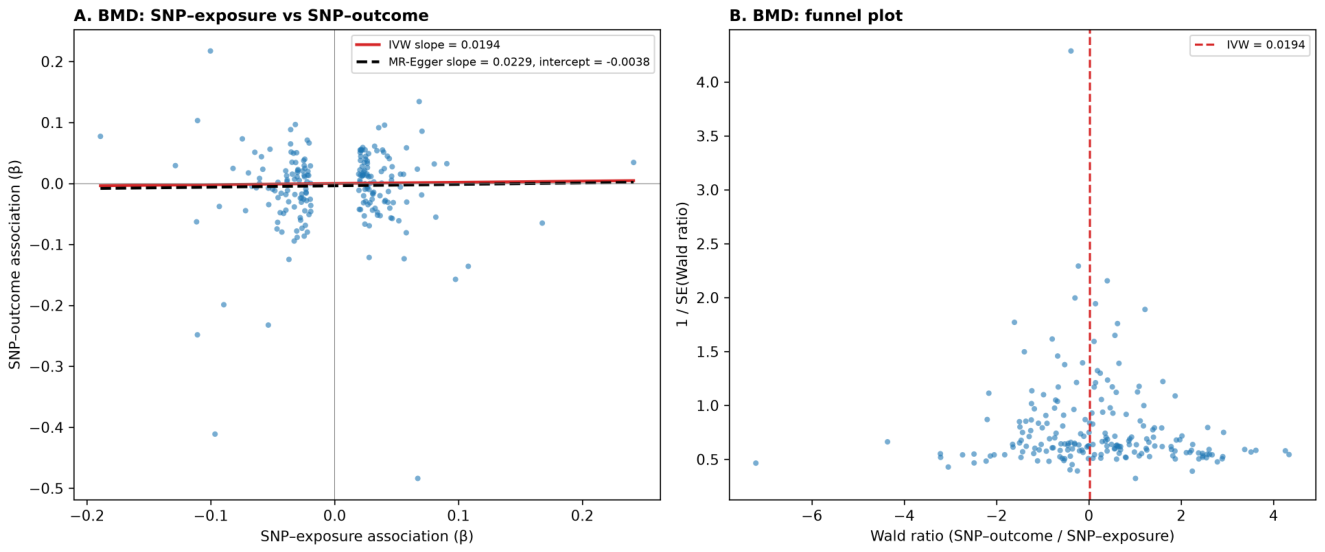
Figure 5.
Distribution of F-statistics for BMD instruments. The histogram displays the F-statistics for the 211 initially extracted BMD instruments. The red dashed line indicates the conventional weak-instrument threshold (). All instruments significantly exceeded this threshold, confirming strong instrument relevance.
Figure 5.
Distribution of F-statistics for BMD instruments. The histogram displays the F-statistics for the 211 initially extracted BMD instruments. The red dashed line indicates the conventional weak-instrument threshold (). All instruments significantly exceeded this threshold, confirming strong instrument relevance.
3.4. Consistency Check
Because BMD (higher is better) and osteoporosis liability (higher is worse) are encoded in opposite biological directions, their ORs should theoretically point in opposite directions to be considered directionally concordant with the hypotheses. In our results, both ORs were below/around 1 (BMD OR > 1; OP OR < 1), meaning the coding-direction concordance holds, but neither exposure supported our prespecified causal hypotheses.
4. Discussion
In this two-sample MR study, we found no robust causal evidence that genetically proxied BMD or osteoporosis affects the risk of SSNHL. Crucially, we encountered two scenarios that are common in MR literature but often mishandled: an unstable primary estimate despite a large number of instruments (BMD), and a statistically significant but biologically implausible and low-powered signal (osteoporosis).
For BMD, the primary IVW estimate was null. However, the significant MR-Egger intercept and the LOO direction flip strongly suggest that the few variants driving the protective trend are likely horizontal pleiotropic outliers rather than true causal mediators of BMD. Many published MR studies selectively report the MR-Egger or weighted median results when the IVW is null, or remove outliers iteratively until significance is achieved. By strictly adhering to our prespecified decision rules, we refrained from framing the nominal MR-Egger result as a positive finding.
For osteoporosis, the highly significant OR of 0.87 appears attractive but is fundamentally uninterpretable for several reasons. First, it is directionally opposite to our biological hypothesis. Second, with only 2 SNPs, standard MR assumptions (especially the InSIDE assumption for MR-Egger and the power of weighted median) cannot be tested. Third, using exposure and outcome GWAS from the same FinnGen cohort violates the independent samples assumption, as shared controls can artificially inflate the MR estimate.
This study has several strengths, notably the public preregistration of all analytic parameters, the strict adherence to reporting negative and non-estimable results, and the transparent handling of a protocol deviation (Steiger filtering). However, it also has limitations. The failure to perform Steiger filtering means we could not formally rule out reverse causation, though the genetic instruments are strongly associated with BMD. The FinnGen SSNHL phenotype (sudden idiopathic hearing loss) is a pragmatic proxy that may encompass heterogeneous etiologies. Finally, our study population is limited to European ancestry, limiting generalizability.
5. Conclusion
In summary, our prespecified MR analysis does not support a causal association between bone mineral density, osteoporosis, and SSNHL. The ostensibly significant inverse association for osteoporosis is highly unstable, based on only two SNPs, and likely confounded by sample overlap and unmeasured pleiotropy. This study serves as a methodological reminder that adherence to prespecified protocols and transparent reporting of null or unreliable findings are essential to preserving the integrity of MR research.
Funding
The authors did not receive support from any organization for the submitted work.
Data Availability Statement
The GWAS summary statistics analyzed during the current study are publicly available via the IEU OpenGWAS database [12] under the identifiers ukb-b-15730 [11], finn-b-M13_OSTEOPOROSIS [10], and finn-b-H8_HL_IDIOP [9]. The prespecified protocol is available on OSF [6]. The R analysis script and Python script used to generate the figures is available on Zenodo [7], and the derived datasets and figures are available on Zenodo [8].
Conflicts of Interest
The authors declare no conflicts of interest.
AI Usage
During the preparation of this work the author(s) used DeepSeek in order to polish the article, to improve readability, to refine logic flow and to optimize the codes which is needed for analysing the data. After using this tool/service, the author(s) reviewed and edited the content as needed and take(s) full responsibility for the content of the published article.
References
- Davey Smith, G.; Ebrahim, S. ’Mendelian randomization’: can genetic epidemiology contribute to understanding environmental determinants of disease? Int. J. Epidemiol. 2003, 32(1), 1–22. [Google Scholar] [CrossRef]
- Lawlor, D. A.; Harbord, R. M.; Sterne, J. A. C.; Timpson, N.; Davey Smith, G. Mendelian randomization: using genes as instruments for making causal inferences in epidemiology. Stat. Med. 2008, 27(8), 1133–1163. [Google Scholar] [CrossRef]
- Skrivankova, V. W.; Richmond, R. C.; Woolf, B. A. R.; Yarmolinsky, J.; Davies, N. M.; Swanson, S. A.; et al. Strengthening the Reporting of Observational Studies in Epidemiology Using Mendelian Randomization: The STROBE-MR Statement. JAMA 2021, 326(16), 1614–1621. [Google Scholar] [CrossRef]
- Hemani, G.; Zheng, J.; Elsworth, B.; Wade, K. H.; Haberland, V.; Baird, D.; et al. The MR-Base platform supports systematic causal inference across the human phenome. eLife 2018, 7, e34408. [Google Scholar] [CrossRef]
- Bowden, J.; Davey Smith, G.; Burgess, S. Mendelian randomization with invalid instruments: effect estimation and bias detection through Egger regression. Int. J. Epidemiol. 2015, 44(2), 512–525. [Google Scholar] [CrossRef]
- Gao, L. Genetically Proxied Bone Mineral Density and Osteoporosis and the Risk of Sudden Sensorineural Hearing Loss: A Two-Sample Mendelian Randomization Study. OSF 2026. [Google Scholar] [CrossRef]
- Gao, L. Analytic Code for "Genetically Proxied Bone Mineral Density and Osteoporosis and the Risk of Sudden Sensorineural Hearing Loss: A Two-Sample Mendelian Randomization Study". Zenodo. Computer software. 2026. [CrossRef]
- Gao, L. Results and Figures for "Genetically Proxied Bone Mineral Density and Osteoporosis and the Risk of Sudden Sensorineural Hearing Loss: A Two-Sample Mendelian Randomization Study" [Dataset]. Zenodo 2026. [Google Scholar] [CrossRef]
- FinnGen. Sudden idiopathic hearing loss (Version finn-b-H8_HL_IDIOP) [Data set]. OpenGWAS. 2021. Available online: https://opengwas.io/datasets/finn-b-H8_HL_IDIOP.
- FinnGen. Osteoporosis (Version finn-b-M13_OSTEOPOROSIS) [Data set]. OpenGWAS. 2021. Available online: https://opengwas.io/datasets/finn-b-M13_OSTEOPOROSIS.
- Elsworth, B. Heel bone mineral density (BMD) T-score, automated (left) (Version ukb-b-15730) [Data set]. OpenGWAS. 2018. Available online: https://opengwas.io/datasets/ukb-b-15730.
- Elsworth, B.; Lyon, M.; Alexander, T.; Liu, Y.; Matthews, P.; Hallett, J.; et al. The MRC IEU OpenGWAS data infrastructure. In bioRxiv; 2020. [Google Scholar] [CrossRef]
- Kurki, M. I.; Karjalainen, J.; Palta, P.; et al. FinnGen provides genetic insights from a well-phenotyped isolated population. Nature 2023, 613(7944), 508–518. [Google Scholar] [CrossRef]
Figure 1.
Study flowchart and instrument selection. The flowchart displays the parallel pipelines for the primary exposure (heel BMD) and the secondary exposure (osteoporosis). The yellow boxes indicate the inability to perform Steiger filtering due to missing sample size metadata. The red box indicates that prespecified sensitivity analyses for osteoporosis were not estimable due to the limited number of valid instruments ().
Figure 1.
Study flowchart and instrument selection. The flowchart displays the parallel pipelines for the primary exposure (heel BMD) and the secondary exposure (osteoporosis). The yellow boxes indicate the inability to perform Steiger filtering due to missing sample size metadata. The red box indicates that prespecified sensitivity analyses for osteoporosis were not estimable due to the limited number of valid instruments ().
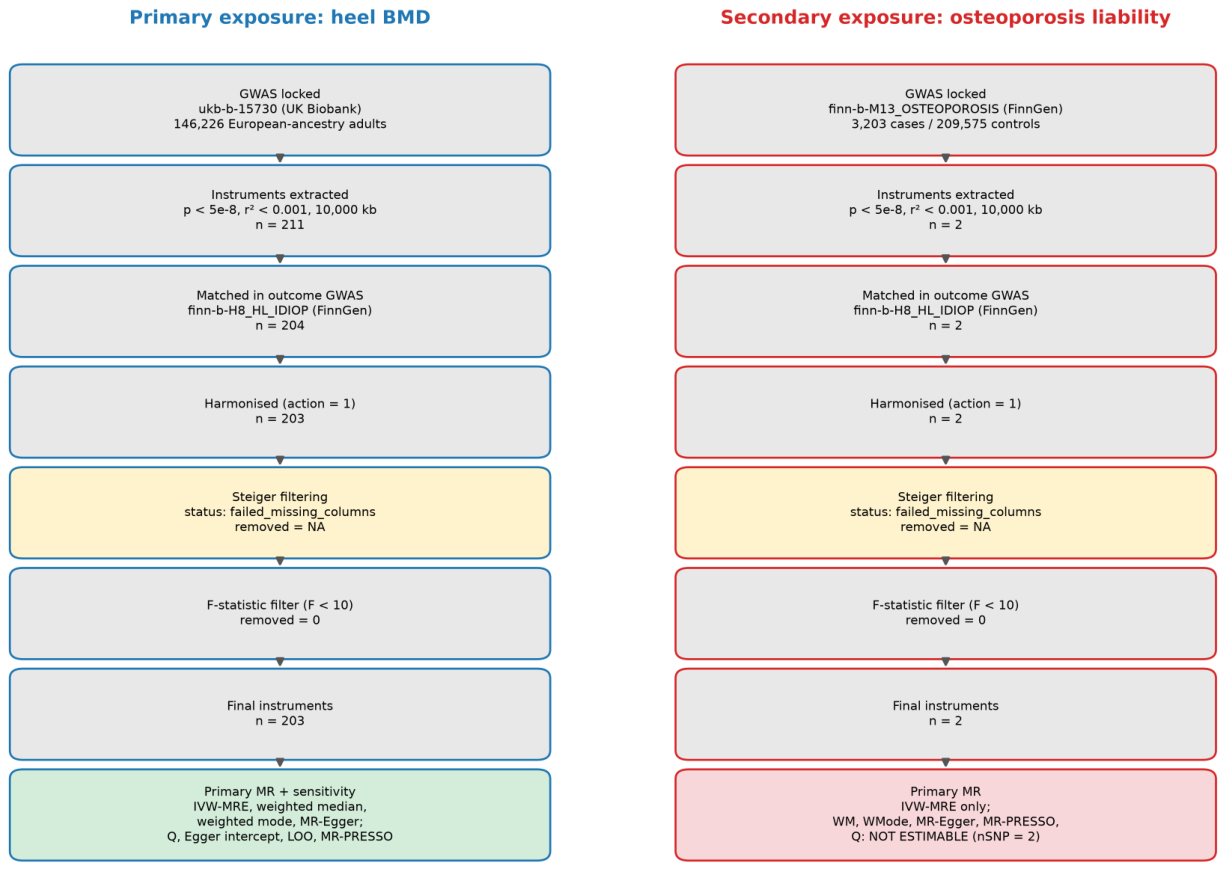
Figure 2.
BMD and SSNHL: summary estimates and leave-one-out analysis. (A) Forest plot of the primary IVW-MRE estimate and sensitivity analyses. (B) Leave-one-out analysis. The red diamond represents the overall IVW-MRE estimate including all 203 SNPs, while the gray lines represent the estimate when each SNP is sequentially removed. The annotation highlights that excluding at least one specific SNP flips the overall point estimate below the null line (direction flip).
Figure 2.
BMD and SSNHL: summary estimates and leave-one-out analysis. (A) Forest plot of the primary IVW-MRE estimate and sensitivity analyses. (B) Leave-one-out analysis. The red diamond represents the overall IVW-MRE estimate including all 203 SNPs, while the gray lines represent the estimate when each SNP is sequentially removed. The annotation highlights that excluding at least one specific SNP flips the overall point estimate below the null line (direction flip).
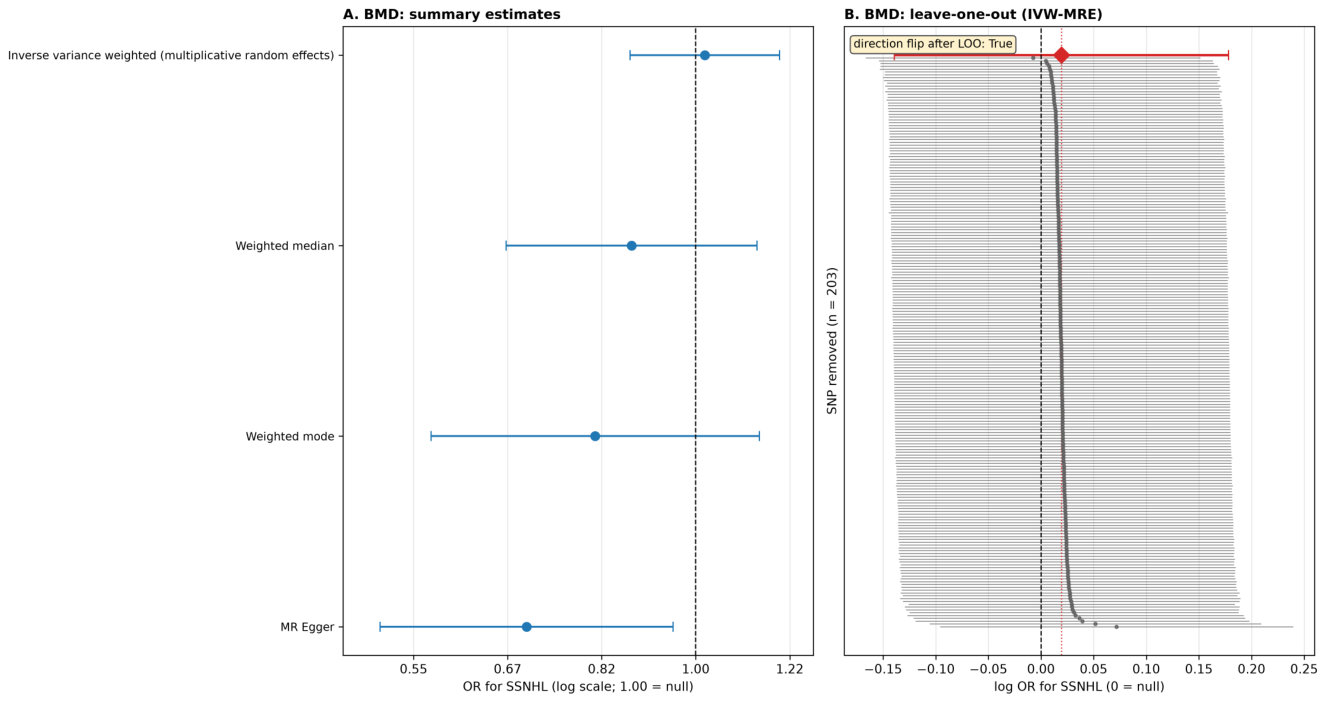
Figure 3.
Osteoporosis and SSNHL: IVW-MRE estimate. The forest plot displays the IVW-MRE estimate based on 2 SNPs. The light green shaded area represents the prespecified hypothesized direction (OR > 1). The observed estimate falls on the opposite side of the null line. A warning box highlights the lack of estimable sensitivity analyses and potential sample overlap.
Figure 3.
Osteoporosis and SSNHL: IVW-MRE estimate. The forest plot displays the IVW-MRE estimate based on 2 SNPs. The light green shaded area represents the prespecified hypothesized direction (OR > 1). The observed estimate falls on the opposite side of the null line. A warning box highlights the lack of estimable sensitivity analyses and potential sample overlap.
Disclaimer/Publisher’s Note: The statements, opinions and data contained in all publications are solely those of the individual author(s) and contributor(s) and not of MDPI and/or the editor(s). MDPI and/or the editor(s) disclaim responsibility for any injury to people or property resulting from any ideas, methods, instructions or products referred to in the content. |
© 2026 by the authors. Licensee MDPI, Basel, Switzerland. This article is an open access article distributed under the terms and conditions of the Creative Commons Attribution (CC BY) license (http://creativecommons.org/licenses/by/4.0/).
Copyright: This open access article is published under a Creative Commons CC BY 4.0 license, which permit the free download, distribution, and reuse, provided that the author and preprint are cited in any reuse.