

Submitted:
11 November 2026
Posted:
12 November 2026
You are already at the latest version
Abstract
Chronic psychological stress is associated with adverse health outcomes and substantial socioeconomic burden. Early identification of psychological stress is important for public health, but no biomarker specific to psychological stress has yet been established. Growing evidence suggests that neurovascular coupling (NVC) is impaired under stress conditions. To test this hypothesis, we investigated the relationship between NVC responses and baseline anxiety in 35 healthy participants. Cerebrovascular responses during a finger-tapping task were measured using time-domain near-infrared spectroscopy (TD-NIRS). Baseline anxiety was assessed using the State-Trait Anxiety Inventory (STAI) as an indicator related to psychological stress. After adjusting for age, resting total hemoglobin, and the integration time used for TD-NIRS measurements, the difference in NVC responses between participants with higher and lower STAI-State scores did not reach statistical significance when all participants were included (P = 0.050). After excluding two outliers identified using a 1.0 × IQR criterion, the difference in NVC responses between the two groups became statistically significant (P = 0.027). Participants with higher STAI-State scores showed lower NVC responses than those with lower scores. These findings suggest that impaired NVC may serve as a physiological indicator of psychological stress.
Keywords:
time-domain near-infrared spectroscopy (TD-NIRS)
; neuro-vascular coupling (NVC)
; the state-trait anxiety inventory (STAI)
; psychological stress
1. Introduction
Psychological stress has become an increasingly significant public health concern. Chronic psychological stress is well recognized as a major risk factor for mental health disorders, including depression. Accumulating evidence also indicates that chronic stress alters brain function by impairing emotional regulation, cognitive performance, and neural plasticity, thereby contributing to a wide range of adverse health outcomes [1]. Chronic stress also imposes substantial socioeconomic burden [2]. Consequently, the early identification of psychological stress has become increasingly important, and self-report questionnaires have been widely implemented in workplace mental health screening. However, these assessments rely on subjective responses and may be influenced by individual perception and response bias [3,4]. Therefore, objective biomarkers to assess psychological stress are needed. Although numerous physiological markers have been proposed, no single biomarker has yet been established [5]. This is likely because many physiological responses to stress are not stress-specific and can also be elicited by other conditions, such as physical exercise or emotional arousal.
Neurovascular coupling (NVC) is the physiological process in which neuronal activation is accompanied by an increase in local cerebral blood flow [6,7]. NVC has primarily served as the physiological basis for functional neuroimaging techniques, such as functional magnetic resonance imaging (fMRI) and functional near-infrared spectroscopy (fNIRS), whereas its clinical applications have remained limited. However, recent studies suggest that NVC dysfunction is associated with neurodegenerative and neuroinflammatory diseases, including Alzheimer’s disease and multiple sclerosis [8,9]. In addition, chronic stress and depression have been shown to impair cerebral microcirculation, suggesting that NVC may also be altered under these conditions [10,11]. Indeed, chronic stress has been shown to attenuate the cerebrovascular response to hindlimb electrical stimulation in rats [12]. This impairment has been attributed to dysfunction of neuronal nitric oxide synthase (nNOS)-expressing interneurons [13]. However, whether psychological stress impairs NVC in humans remains unclear.
Optical imaging techniques have been widely used to investigate NVC in animal studies. For human studies, near-infrared spectroscopy (NIRS) provides a noninvasive means of monitoring cerebral hemodynamics. Among NIRS techniques, time-domain NIRS (TD-NIRS) offers greater sensitivity to cerebral hemodynamics by reducing contamination from extracerebral tissues and enables quantitative measurement of hemoglobin (Hb) concentrations, although its temporal resolution is lower than that of continuous-wave NIRS [14]. Therefore, we employed TD-NIRS to assess NVC by measuring cerebrovascular responses to a physiological stimulus.
Finger tapping is one of the most commonly used motor activation paradigms because it reliably elicits activation of the primary sensorimotor cortex and supplementary motor area [15,16], enabling reproducible assessment of neurovascular responses. In the present study, finger tapping was selected as a motor activation task.
Baseline psychological anxiety was evaluated using the State-Trait Anxiety Inventory (STAI), a widely used measure of state and trait anxiety [17]. Given that anxiety is closely associated with psychological stress [18,19], STAI-State scores were used to characterize participants’ baseline psychological state.
The aim of this study was to investigate whether psychological stress, as reflected by baseline STAI scores, is associated with impaired NVC in humans. Specifically, we examined the relationship between cerebrovascular responses to finger tapping and baseline STAI scores using TD-NIRS.
2. Materials and Methods
2.1. Participants
Thirty-five right-handed healthy adult participants (17 men and 18 women; mean age, 45.4 ± 9.3 years; range 28-68 years) were recruited. None of the participants had a history of neurological disorders, head injury, or cerebrovascular diseases.
Written informed consent was obtained from all participants after the study was explained to them orally. The study was in accordance with the Declaration of Helsinki, and approved by the Ricoh Ethics Review Board (No. 17000123) and the Ethics Committee of Hamamatsu University School of Medicine (No. 23-277).
2.2. Time-Domain Near-Infrared Spectroscopy
An eight-channel time-domain near-infrared spectroscopy (TD-NIRS) system (TRS-80, Hamamatsu Photonics K.K., Hamamatsu, Japan) was employed to measure cerebral hemodynamic responses to neural activation during a finger-tapping task. The TRS-80 consists of three pulsed laser diodes (wavelengths: 763, 801, and 836 nm) with a pulse width of less than 100 psec and a repetition rate of 5 MHz, eight source fibers, and eight detector fibers. The source fibers are single fibers (core diameter 200 μm, numerical aperture (NA) 0.25), whereas the detector fibers are bundle fibers (diameter 3 mm, NA 0.29). Detected light was transferred to a time-correlated single-photon counting unit via high-speed photomultiplier tubes. It takes 1 sec to acquire the distribution of photon time-of-flight (DTOF) over the time range from 0 to 10.24 nsec for each wavelength. The DTOF with adequate signal-to-noise ratios (SNRs) are acquired by integration of signals for 5 sec. The adequate SNR is defined as a maximum count of DTOF greater than 1,000 and a dark count less than 10.
A TTL (Transistor-Transistor Logic) trigger generated by USB-6501(National Instruments, Austin, TX, USA) was sent to the TRS-80 at the onset and offset of the finger-tapping task to synchronize the measurements.
TRS-80 estimates the absorption and reduced scattering coefficients using the Levenberg-Marquardt curve-fitting algorithm and subsequently calculates Hb concentrations [20].
2.3. Procedure
First, the participants completed the STAI questionnaires to assess state and trait anxiety. They were then instructed on the finger-tapping task and given an opportunity to practice it.
One source fiber was placed at C3 in the international 10-20 EEG system, and 12 detector fibers were arranged at equal angular intervals on a circle with a radius of 30 mm centered on the source fiber (Figure 1). Because the TRS-80 accommodates up to eight detector fibers simultaneously, the 12 source-detector pairs were measured in two separate acquisitions: first, channels 1-6, followed by channels 7-12.
2.4. Task Design
Participants sequentially tapped the thumb with the index, middle, ring, and little fingers of their dominant hand, paced by a 1 Hz auditory cue. The task employed block design. After a 40 sec pre-task resting period, participants performed a 40 sec finger-tapping task three times, with a 30 sec rest interval between consecutive tasks, followed by a 30 sec post-task resting period (Figure 2).
The number of detected photons in the upper channels tended to be low because of anatomical characteristics. When an adequate SNR could not be achieved, the integration time was increased from 5 sec to 10 sec. Accordingly, the task protocol was modified to two 80 sec finger-tapping tasks separated by a 60 sec rest interval.
2.5. Validation of Probe Placement
To validate the probe placement, T1-weighted MRI (Signa HDxt 3.0T, GE HealthCare, Chicago, IL, USA) was performed in six participants before the experiment. Three-dimensional (3D) brain models were constructed with MRI Fusion software (Shimazu, Kyoto, Japan). Together with the position of C3 and the optical fibers measured using a digitizer (FASTRAK, Polhemus, Colchester, VT, USA), these models were used to determine the cortical region corresponding to C3 and to identify the cortical regions beneath the source-detector pairs used for the measurements.
2.6. Signal Processing
Channels with inadequate DTOF SNR were excluded from further analyses. Time-series data of oxygenated hemoglobin (oxy-Hb) and deoxygenated hemoglobin (deoxy-Hb) were smoothed using a Savitzky-Golay filter (Figure 2). In this study, changes in oxy-Hb were used as an indicator of cerebral hemodynamic responses. For each task block, the percentage change in oxy-Hb (%Δoxy-Hb) from baseline was calculated. The baseline was defined as the average of the three data points immediately preceding each task period.
Three consecutive data points centered on the peak %Doxy-Hb were averaged (Figure 3), and the maximum averaged value across the task blocks (%Δoxy-Hbmax) was used as a measure of hemodynamic response.
2.7. Data Analysis
Simple linear regression analyses were performed to examine the relationships between %Δoxy-Hbmax and STAI-State and STAI-Trait scores. For these analyses, outliers were identified using the interquartile range (IQR) method applied to the regression residuals with a 1.0 × IQR criterion [21]. Participants were then classified into higher- and lower-STAI-State-score groups based on the cut-off value for STAI-State (40) and into higher- and lower-STAI-Trait-score groups based on the cut-off value for STAI-Trait (44) [22]. Age and resting t-Hb were compared between the groups using Welch’s t-test, and integration time (5 or 10 sec) was compared using Fisher’s exact test.
To adjust for possible confounding factors, we also performed analysis of covariance (ANCOVA). For each analysis, the corresponding STAI group (higher- or lower-STAI-State-score group or higher- or lower-STAI-Trait-score group) was entered as a fixed factor, and age, resting t-Hb, and integration time were entered as covariates. ANCOVA was performed both with and without the outliers. Multicollinearity among the independent variables was checked using the variance inflation factor (VIF).
Statistical analyses were conducted using IBM SPSS Statistics version 31.0 (IBM Corp., Armonk, NY, USA). Statistical significance was set at P < 0.05.
3. Results
3.1. Validation of Probe Placement
3.1.1. Cortical Position of C3
Inter-individual and intra-individual variations in the cortical position of C3 were small across the six participants (Figure 4). C3 was consistently located close to the central sulcus and within the primary motor cortex, except for two measurements in which it was located posterior to the central sulcus within the primary somatosensory cortex.
3.1.2. Task-Evoked Oxy-Hb Responses
Figure 2 and Figure 3 show representative oxy-Hb and deoxy-Hb data expressed in μM and %Δoxy-Hb data, respectively, from one participant during three repetitions of the finger tapping task. The task periods (the areas shaded in yellow) were associated with an increase in oxy-Hb and a decrease in deoxy-Hb, followed by a gradual return toward baseline during the rest periods. Although some inter-individual variation was observed, a generally similar pattern was observed across participants. In all participants, %Δoxy-Hbmax exceeded 2% in at least one of the 12 channels.
Figure 5 shows the brain regions corresponding to the midpoint of each source-detector pair, where %Δoxy-Hbmax was elicited by the finger-tapping task in a single subject who performed 12 Tasks over six different days, with each Task consisting of three repetitions of the finger-tapping task. The C3 position was approximately consistent across the six measurement days, and the spatial distribution of brain regions showing %Δoxy-Hbmax was also similar across measurements, primarily involving channels 6-8.
Brain regions showing %Δoxy-Hbmax varied among participants. Among the 35 participants, %Δoxy-Hbmax was observed at channel 6 in six participants, the highest frequency among all channels, followed by channel 2 in five participants. The number of participants showing %Δoxy-Hbmax at each channel is presented as a histogram in Figure 6.
3.2. Relationship Between %Δoxy-Hbmax and STAI Scores
3.2.1. Participants Characteristics
The higher- and lower-STAI-State-score groups did not differ in age or resting t-Hb. However, fewer participants in the higher-STAI-State-score group were measured with the 10-sec integration time (1/15, 6.7%) than in the lower-STAI-State-score group (11/20, 55.0%; P = 0.004). The higher- and lower-STAI-Trait-score groups did not differ in age or integration time, but resting t-Hb was higher in the higher-STAI-Trait-score group (71.1 ± 16.6 µM vs. 59.1 ± 16.5 µM; P = 0.043). Accordingly, age, resting t-Hb, and integration time were included as covariates in the following analyses.
3.2.2. Regression Analysis
Figure 7(a) and 7(b) show the relationships between %Δoxy-Hbmax and STAI-State and STAI-Trait scores, respectively. %Δoxy-Hbmax tended to decrease as STAI-State scores increased; however, simple regression analysis did not reveal a significant linear association (R2 = 0.109, F (1, 33) = 4.018, P = 0.053). No significant linear association was observed between %Δoxy-Hbmax and STAI-Trait scores, either (R2 = 0.035, F (1,33) = 1.191, P = 0.283).
3.2.3. Outlier Identification and Regression Analysis
Using the 1.0 × IQR criterion, two outliers for STAI-State and one outlier for STAI-Trait were identified (dotted lines in Figure 7). After excluding the identified outliers, regression analysis revealed a significant association between %Δoxy-Hbmax and STAI-State scores (R2 = 0.280, F (1, 31) = 12.02, P =0.002), whereas no significant association was observed with STAI-Trait scores (R2 = 0.046, F (1, 32) = 1.537, P = 0.224).
3.2.4. Group Comparisons Adjusted for Covariates
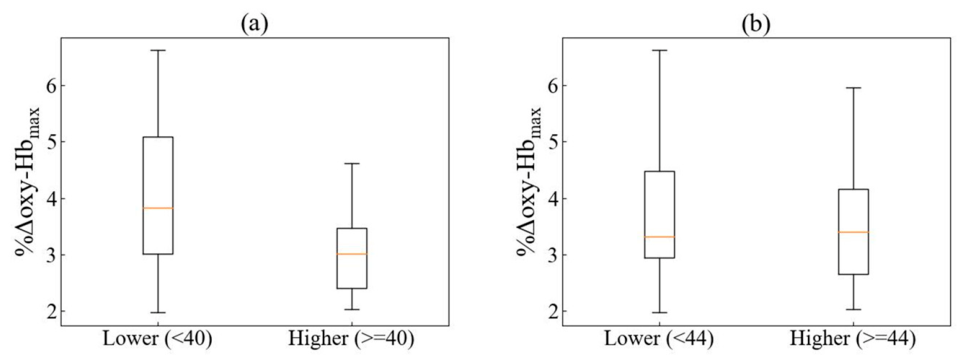
All VIF values were below 2.0 (range: 1.15-1.70), indicating no serious multicollinearity. After adjusting for age, resting t-Hb, and integration time, %Δoxy-Hbmax tended to be higher in the lower-STAI-State-score group than in the higher-STAI-State-score group when all participants were included (F(1, 30) = 4.16, P = 0.050, partial η² = 0.12). When the outliers were excluded, this difference was significant (F(1, 28) = 5.43, P = 0.027, partial η² = 0.16) (Figure 8 (a)). In contrast, no significant difference in %Δoxy-Hbmax was observed between the two groups for STAI-Trait, either when the outlier was included (F(1, 30) = 1.40, P = 0.247, partial η² = 0.04) or when it was excluded (F(1, 29) = 0.49, P = 0.489, partial η² = 0.02) (Figure 8(b).
None of the covariates were significantly related to %Δoxy-Hbmax in any model (all P > 0.15).
4. Discussion
4.1. Validity of Measurements
Although the finger sequence and tapping frequency can be standardized, the force exerted during finger tapping is difficult to standardize precisely. Nevertheless, in the present study, %Δoxy-Hbmax exceeded 2% in all participants. The location of %Δoxy-Hbmax varied among participants and was distributed over a relatively broad area around C3 (Figure 6), whereas the location was nearly identical across 12 Tasks performed over six different days in the same participant (Figure 5). These findings support that a simple, standardized finger-tapping protocol is a practical paradigm for evaluating NVC, despite the difficulty in precisely controlling tapping force.
Because a relatively long integration time was used in the present TD-NIRS measurements, temporal averaging of the hemodynamic response could potentially lead to underestimation of the peak oxy-Hb response. In addition, the integration time differed between the higher- and lower-STAI-State-score groups. However, the integration time was not related to %Δoxy-Hbmax in the ANCOVA, and the group difference remained after adjusting for it. This suggests that the difference in integration time does not explain our main finding.
4.2. Relationship Between %Δoxy-Hbmax and STAI Scores
After excluding two outliers, simple regression analysis revealed a significant association between %Δoxy-Hbmax evoked by the finger-tapping task and the STAI-State score. In addition, after adjusting for age, resting t-Hb, and the integration time, %Δoxy-Hbmax in participants with lower STAI-State scores was significantly higher than in those with higher STAI-State scores.
It has been reported that stimulus-evoked hemodynamic responses are diminished in older adults [23,24] and dependent on the level of resting cerebral blood flow [25,26]. However, the group difference remained after adjusting for age and resting t-Hb. These findings suggest that a transient psychological stress state may be associated with impairment of NVC.
The significant association between %Δoxy-Hbmax and STAI-State scores, but not STAI-Trait scores, is consistent with the distinct characteristics of state and trait anxiety. STAI-State reflects a transient psychological state at the time of assessment and can be influenced by situational factors, whereas STAI-Trait reflects a relatively stable tendency toward anxiety [27]. These findings suggest a closer relationship between NVC and psychological stress states than between NVC and a stable predisposition to anxiety.
The two outliers showed relatively large %Δoxy-Hbmax values compared with those expected based on their STAI-State scores. This discrepancy could partly be attributable to the subjective nature of self-report measures, which assess individuals’ experiences of their psychological states. Consistent with this possibility, previous studies have reported inconsistent associations between self-reported stress and physiological measures [3,28].
4.3. Possible Mechanisms of Psychological Stress-Induced NVC Impairment
Mechanisms of NVC themselves, which involve a variety of processes and interactions in the neurovascular unit [8], remain to be fully elucidated [29,30,31]. Therefore, several mechanisms have been proposed to underlie NVC impairment under psychological stress. It is postulated that chronic stress overstimulates the hypothalamic-pituitary-adrenal (HPA) axis and autonomic nervous system (ANS) and activates the renin-angiotensin system, which is associated with increases in homocysteine and cardiovascular activity, along with endothelial damage [11]. Furthermore, it was found that in rats increases in glucocorticoids under chronic stress inhibited endothelial nitric oxide synthetase (eNOS), which contributes to NO-mediated vascular responses during NVC [32].
In vivo and ex vivo experiments revealed that neuronal nitric oxide synthase (nNOS) mRNA in GABAergic interneuron was significantly decreased in chronically stressed mice [13]. This finding suggests that chronic stress may also affect the neuronal NO pathway involved in neurovascular regulation. In addition, neuronal stimulation elicited weaker vasodilatory responses in parenchymal arterioles (PAs) of amygdala slices from stressed rats. The vasodilatory response of isolated PAs to external K+ was also attenuated. A similar impairment was induced by repeated corticosterone administration, whereas inhibition of glucocorticoid receptors with RU486 (a glucocorticoid receptor antagonist) prevented the stress-induced impairment of NVC. These findings suggest that chronic stress may impair NVC through glucocorticoid-dependent alterations in vascular smooth muscle function [33]. Taken together, psychological stress-induced NVC impairment could occur via multiple mechanisms.
4.4. Future Directions
The present findings suggest that psychological stress is associated with impaired NVC, which has been investigated mainly in animal experiments. However, some issues need to be addressed before definitive conclusions can be drawn. First, although the finger-tapping task used in the present study provided a practical and reproducible paradigm for evaluating NVC, further standardization of the stimulus intensity may strengthen the assessment. In particular, objective monitoring and control of tapping force could reduce variability in the evoked hemodynamic response.
Second, in addition to age, resting t-Hb, and integration time, which were included as covariates in this study (Section 2.7 and Section 4.2), other factors can influence hemodynamic responses to physiological stimuli. It has been reported that drowsiness reduces the amplitude of evoked brain responses even under constant-intensity sensory stimulation [34]. In future studies, the level of alertness should also be monitored to distinguish the effects of psychological stress from those of reduced wakefulness. In addition, cigarette smoking is a well-established risk factor for cerebrovascular disease [35], and a past history of smoking has been reported to be strongly associated with reduced NVC, with a dose-response relationship between NVC and cumulative smoking exposure [36]. Smoking history and cumulative smoking exposure should therefore be considered.
Third, in the present study, we employed only the STAI to assess psychological stress. However, the Perceived Stress Scale (PSS) is also widely used to evaluate individuals’ perceptions of stress [37]. In addition, psychological stress can be accompanied by biochemical and physiological changes, including increased salivary cortisol levels [38], as well as somatic symptoms such as indigestion, headache, and dizziness [39]. Future research could include other measures of psychological stress, such as the PSS, in addition to the STAI, and incorporate physiological indicators of stress to better characterize the relationship between psychological stress and NVC.
Finally, the TD-NIRS instrument used in this study requires signal integration over 5 sec or longer, which may limit its ability to capture rapid hemodynamic changes associated with neuronal activation. However, recent technical advances have enabled real-time TD-NIRS measurements [40,41], which could allow more accurate characterization of the rapid hemodynamic response associated with neuronal activation and improve the assessment of NVC.
5. Conclusions
These findings suggest that NVC impairment may provide a physiological indicator of psychological stress. However, the biological responses to psychological stress are complex and multifaceted. Multiple approaches are required to determine whether NVC impairment has potential as a biomarker of psychological stress.
Author Contributions
Conceptualization: YH; Methodology: YH, KS, and MY; Investigation: KS, MY, NT, and YH; Visualization: KS; Software and Data Analysis: KS, MY, and TH; Funding acquisition: NT; Project administration: NT and YH; Supervision: SO; resources: SO; Writing (original draft): KS; Writing (review & editing): YH and TH.
Funding
This research was supported by a research contract with Ricoh Company Ltd. (Contract No. 0000017077).
Institutional Review Board Statement
The study was conducted in accordance with the Declaration of Helsinki, and approved by the Ricoh Ethics Review Board (No. 17000123) and the Ethics Committee of Hamamatsu University School of Medicine (No. 23-277).
Informed Consent Statement
Informed consent was obtained from all subjects involved in the study.
Data Availability Statement
The data and code that support the findings in this study can be made available by contacting the corresponding author, subject to a formal data sharing agreement.
Acknowledgments
The authors gratefully acknowledge Dr. Toshiki Iwabuchi for his technical support and valuable suggestions.
Conflicts of Interest
K.S.: Ricoh Company Ltd. (E, F); M.Y.: Ricoh Company Ltd. (E, F); N.T.: Ricoh Company Ltd. (E, F).
Abbreviations
The following abbreviations are used in this manuscript:
| NVC | Neurovascular coupling |
| STAI | State-trait anxiety inventory |
| TD-NIRS | Time-domain near-infrared spectroscopy |
| fNIRS | Functional near-infrared spectroscopy |
| nNOS | Neuronal nitric oxide synthase |
| DTOF | Distribution of photon time-of-flight |
| SNR | Signal-to-noise ratio |
| IQR | Interquartile range |
| ANCOVA | Analysis of covariance |
| VIF | Variance inflation factor |
| eNOS | Endothelial nitric oxide synthase |
| ANS | autonomic nervous system |
| HPA | Hypothalamic-pituitary-adrenal |
| PAs | Parenchymal arterioles |
| PSS | Perceived stress scale |
References
- Mariotti, A. The effects of chronic stress on health: new insights into the molecular mechanisms of brain-body communication. Future Sci. OA 2015, 1, FSO23. [Google Scholar] [CrossRef] [PubMed]
- Hassard, J.; Teoh, K.R.H.; Visockaite, G.; Dewe, P.; Cox, T. The cost of work-related stress to society: a systematic review. J. Occup. Health Psychol. 2018, 23, 1–17. [Google Scholar] [CrossRef] [PubMed]
- Weckesser, L.J.; Dietz, F.; Schmidt1, K.; Grass, J.; Kirschbaum, C.; Miller, R. The psychometric properties and temporal dynamics of subjective stress, retrospectively and questionnaires, and hair cortisol concentrations. Sci. Rep. 2019, 9, 1098. [Google Scholar] [CrossRef] [PubMed]
- Ganster, D.C.; Schaubroeck, J. Work stress and employee health. J. Manag. 1991, 17, 235–271. [Google Scholar] [CrossRef]
- Crosswell, A.D.; Lockwood, K.G. Best practices for stress measurement: how to measure psychological stress in health research. Health Psychol. Open. 2020, 7, 2055102920933072. [Google Scholar] [CrossRef] [PubMed]
- Mosso, A. Sulla circolazione del cervello dell’uomo. Atti. R. Accad. Lincei. 1880, 5, 237–358. [Google Scholar]
- Roy, C.S.; Sherrington, C.S. On the Regulation of the Blood-supply of the Brain. J. Physiol. 1890, 11, 85–158. [Google Scholar] [CrossRef] [PubMed]
- Iadecola, C. The neurovascular unit coming of age: a journey through neurovascular coupling in health and disease. Neuron 2017, 96, 17–42. [Google Scholar] [CrossRef] [PubMed]
- Gowdy, J.; Ahn, J.; Miller, R.H.; Islam, Y. Neurovascular dysfunction in the development and progression of neuroinflammatory diseases. Front. Cell. Neurosci. 2026, 20, 1741928. [Google Scholar] [CrossRef] [PubMed]
- Yang, X.; Wang, J.; Zhang, J.; Zhang, M.; Hao, A.; Guo, F.; Huang, X.; Yan, J.; Zheng, Y.; Xia, Y.; Wang, T.; Zhang, M.; Weng, N.; Chen, Y.; Yao, L. Cerebrovascular-mediated dynamic alterations in neurovascular coupling: a key pathological mechanism of depression. Cell Biosci. 2025, 15, 97. [Google Scholar] [CrossRef] [PubMed]
- Burrage, E.; Marshall, K.L.; Santanam, N.; Chantler, P.D. Cerebrovascular dysfunction with stress and depression. Brain Circ. 2018, 4, 43–53. [Google Scholar] [CrossRef] [PubMed]
- Lee, S.; Kang, B.M.; Shin, M.K.; Min, J.; Heo, C.; Lee, Y.; Baeg, E.; Suh, M. Chronic stress decreases cerebrovascular responses during rat hindlimb electrical stimulation. Front. Neurosci. 2015, 9, 462. [Google Scholar] [CrossRef] [PubMed]
- Han, K.; Min, J.; Lee, M.; Kang, B.K.; Park, T.; Hahn, J.; Yei, J.; Lee, J.; Woo, J.; Lee, C.J.; Kim, S.G.; Suh, M. Neurovascular coupling under chronic stress is modified by altered GABAergic interneuron activity. J. Neurosci. 2019, 39, 10081–10095. [Google Scholar] [CrossRef] [PubMed]
- Hoshi, Y. Towards the next generation of near-infrared spectroscopy. Phil. Trans. R. Soc. A 2011, 369, 4425–4439. [Google Scholar] [CrossRef] [PubMed]
- Witt, S.T.; Laird, A.R.; Meyerand, M.E. Functional neuroimaging correlates of finger-tapping task variations: an ALE meta-analysis. NeuroImage 2008, 42, 343–345. [Google Scholar] [CrossRef] [PubMed]
- Leff, D.R.; Orihuela-Espina, F.; Elwell, C.E.; Athanasiou, T.; Delpy, D.T.; Darzi, A.W.; Yang, G.Z. Assessment of the cerebral cortex during motor task behaviours in adults: a systematic review of functional near infrared spectroscopy (fNIRS) studies. NeuroImage 2011, 54, 2922–2936. [Google Scholar] [CrossRef] [PubMed]
- Spielberger, C.D.; Gorsuch, R.L. Manual for the State-Trait Anxiety Inventory (Form Y); Consulting Psychologists Press: Palo Alto, CA., USA, 1983. [Google Scholar]
- Daviua, N.; Bruchasb, M.R.; Moghaddamc, B.; Sandid, C.; Beyelere, A. Neurobiological links between stress and anxiety. Neurobiol. Stress 2019, 11, 100191. [Google Scholar] [CrossRef] [PubMed]
- Robinson, L. Stress and anxiety. Nurs. Clin. North Am. 1990, 25, 935–943. [Google Scholar] [CrossRef]
- Hoshi, Y.; Shinba, T.; Sato, C.; Doi, N. Resting hypofrontality in schizophrenia: A study using near-infrared time-resolved spectroscopy. Schizophr. Res. 2006, 84, 411–420. [Google Scholar] [CrossRef] [PubMed]
- Turky, J.W. Exploratory data analysis. In Chapter 2; Addison-Wesley: Reading, MA, USA, 1977. [Google Scholar]
- Dümmler, D.; Eck, S.; Hapfelmeier, A.; Fomenko, A.; Aktürk, Z.; Teusen, C.; von Schrottenberg, V.; Dawson, S.; Linde, K.; Schneider, A. State-Trait Anxiety Inventory (STAI) for detecting anxiety disorders in adults. Cochrane Database Syst. Rev. 2025, 12, CD015458. [Google Scholar] [CrossRef] [PubMed]
- Csipo, T.; Mukli, P.; Lipecz, A.; Tarantini, S.; Bahadli, D.; Abdulhussein, O.; Owens, C.; Kiss, T.; Balasubramanian, P.; Nyúl-Tóth, Á.; Hand, R.A.; Yabluchanska, V.; Sorond, F.A.; Csiszar, A.; Ungvari, Z.; Yabluchanskiy, A. Assessment of age-related decline of neurovascular coupling responses by functional near-infrared spectroscopy (fNIRS) in humans. GeroScience 2019, 41, 495–509. [Google Scholar] [CrossRef] [PubMed]
- Fabiani, M.; Gordon, B.A.; Maclin, E.L.; Pearson, M.A.; Brumback-Peltz, C.R.; Low, K.A.; McAuley, E.; Sutton, B.P.; Kramer, A.F.; Gratton, G. Neurovascular coupling in normal aging: A combined optical, ERP and fMRI study. NeuroImage 2014, 85, 592–607. [Google Scholar] [CrossRef] [PubMed]
- Friston, K.J.; Frith, C.D.; Liddle, P.F.; Dolan, R.J.; Lammertsma, A.A.; Frackowiak, R.S. The relationship between global and local changes in PET scans. J. Cereb. Blood Flow Metab. 1990, 10, 458–466. [Google Scholar] [CrossRef] [PubMed]
- Cohen, E.R.; Ugurbil, K.; Kim, S.-G. Effect of basal conditions on the magnitude and dynamics of the blood oxygenation level-dependent fMRI response. J. Cereb. Blood Flow Metab. 2002, 22, 1042–1053. [Google Scholar] [CrossRef] [PubMed]
- Spielberger, C.D.; Reheiser, E.C. Assessment of emotions: anxiety, anger, depression, and curiosity. Appl. Psychol. Health Well-Being 2009, 1, 271–302. [Google Scholar] [CrossRef]
- Vaessen, T.; Rintala, A.; Otsabryk, N.; Viechtbauer, W.; Wampers, M.; Claes, S.; Myin-Germeys, I. The association between self-reported stress and cardiovascular measures in daily life: A systematic review. PLoS ONE 2021, 16, 0259557. [Google Scholar] [CrossRef] [PubMed]
- Schaeffer, S.; Iadecola, C. Revisiting the neurovascular unit. Nat. Neurosci. 2021, 24, 1198–1209. [Google Scholar] [CrossRef] [PubMed]
- Alkayed, N.J.; Cipolla, M.J. The ever-evolving concept of the neurovascular unit. Stroke 2023, 54, 2178–2180. [Google Scholar] [CrossRef] [PubMed]
- Drew, P.J. Neurovascular coupling: motive unknown. Trends Neurosci. 2022, 45, 809–819. [Google Scholar] [CrossRef] [PubMed]
- Liu, Y.; Mladinov, D.; Pietrusz, J.L.; Usa, K.; Liang, M. Glucocorticoid response elements and 11 beta-hydroxysteroid dehydrogenases in the regulation of endothelial nitric oxide synthase expression. Cardiovasc. Res. 2009, 81, 140–147. [Google Scholar] [CrossRef] [PubMed]
- Longden, T.A.; Dabertrand, F.; Hill-Eubanks, D.C.; Hammack, S.E.; Nelson, M.T. Stress-induced glucocorticoid signaling remodels neurovascular coupling through impairment of cerebrovascular inwardly rectifying K+ channel function. Proc. Natl. Acad. Sci. U.S.A. 2014, 111, 7462–7467. [Google Scholar] [CrossRef] [PubMed]
- Beydoun, A.; Morrow, T.J.; Shen, J.F.; Casey, K.L. Variability of laser-evoked potentials: attention, arousal and lateralized differences. Electroencephalogr. Clin. Neurophysiol. 1993, 88, 173–181. [Google Scholar] [CrossRef] [PubMed]
- Luo, J.; Tang; Li, F.; Wen, H.; Wang, L.; Ge, S.; Tang, C.; Xu, N.; Lu, L. Cigarette smoking and risk of different pathologic types of stroke: a systematic review and dose-response meta-analysis. Front. Neurol. 2022, 12, 772373. [Google Scholar] [CrossRef] [PubMed]
- Yang, S.; Webb, A.J.S. Reduced neurovascular coupling is associated with increased cardiovascular risk without established cerebrovascular disease: a cross-sectional analysis in UK Biobank. J. Cereb. Blood Flow Metab. 2024, 45, 897–907. [Google Scholar] [CrossRef] [PubMed]
- Harris, K.M.; Gaffey, A.E.; Schwartz, J.E.; Krantz, D.S.; Burg, M.M. The perceived stress scale as a measure of stress: decomposing score variance in longitudinal behavioral medicine studies. Ann. Behav. Med. 2023, 57, 846–854. [Google Scholar] [CrossRef] [PubMed]
- Hellhammer, D.H.; Wüst, S.; Kudielka, B.M. Salivary cortisol as a biomarker in stress research. Psychoneuroendocrinology 2009, 34, 163–171. [Google Scholar] [CrossRef] [PubMed]
- Glise, K.; Ahlborg, G., Jr.; Jonsdottir, I.H. Prevalence and course of somatic symptoms in patients with stress-related exhaustion: does sex or age matter. BMC Psychiatry 2014, 14, 118. [Google Scholar] [CrossRef] [PubMed]
- Re, R.; Pirovano, I.; Contini, D.; Amendola, C.; Contini, L.; Frabasile, L.; Levoni, P.; Torricelli, A.; Spinelli, L. Reliable fast (20 Hz) acquisition rate by a TD fNIRS device: brain resting-state oscillation studies. Sensors 2023, 23, 196. [Google Scholar] [CrossRef] [PubMed]
- Ban, H.Y.; Barrett, G.M.; Borisevich, A.; Chaturvedi, A.; Dahle, J.L.; Dehghani, H.; Dubois, J.; Field, R.M.; Gopalakrishnan, V.; Gundran, A.; Henninger, M.; Ho, W.C.; Hughes, H.D.; Jin, R.; Kates-Harbeck, J.; Landy, T.; Leggiero, M.; Lerne, G.; Aghajan, Z.M.; Moon, M.; Olvera, I.; Park, S.; Patel, M.J.; Perdue, K.L.; Siepser, B.; Sorgenfrei, S.; Sun, N.; Szczepanski, V.; Zhang, M.; Zhu, Z. Kernel Flow: a high channel count scalable time-domain functional near-infrared spectroscopy system. J. Biomed. Opt. 2022, 27, 074710. [Google Scholar] [CrossRef] [PubMed]
Figure 1.
Arrangement of the source and detector fibers. (a) Fiber cap, (b) Channel layout. S, source; D, detector; Ch, channel.
Figure 1.
Arrangement of the source and detector fibers. (a) Fiber cap, (b) Channel layout. S, source; D, detector; Ch, channel.
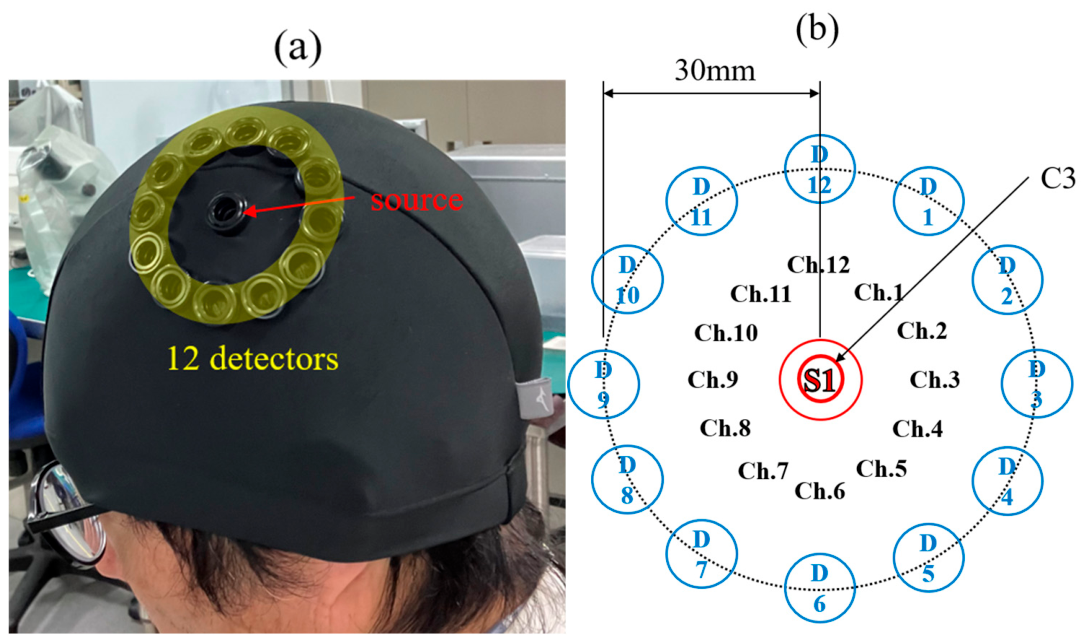
Figure 2.
Time-course of changes in oxy- and deoxy-Hb during the three finger-tapping tasks. Yellow shading indicates the task periods.
Figure 2.
Time-course of changes in oxy- and deoxy-Hb during the three finger-tapping tasks. Yellow shading indicates the task periods.
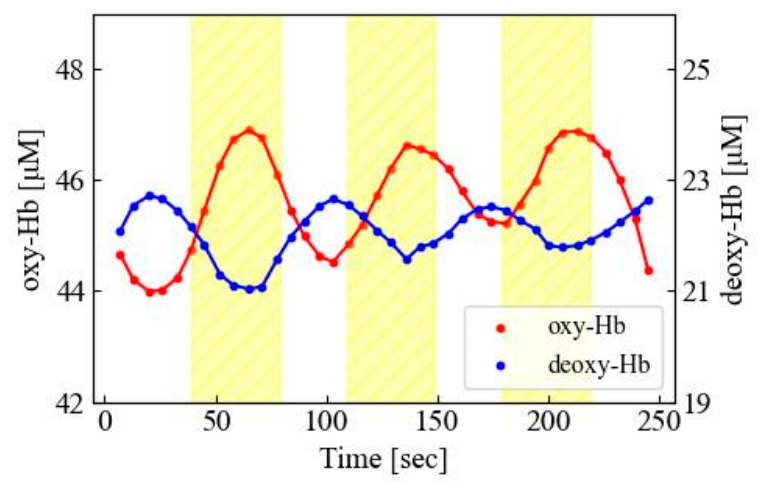
Figure 3.
Time-course of changes in %Δoxy-Hb during the three finger-tapping tasks. The dashed outline indicates the three consecutive data points centered on the peak %Δoxy-Hb in the first task block, which were averaged to calculate the hemodynamic response.
Figure 3.
Time-course of changes in %Δoxy-Hb during the three finger-tapping tasks. The dashed outline indicates the three consecutive data points centered on the peak %Δoxy-Hb in the first task block, which were averaged to calculate the hemodynamic response.
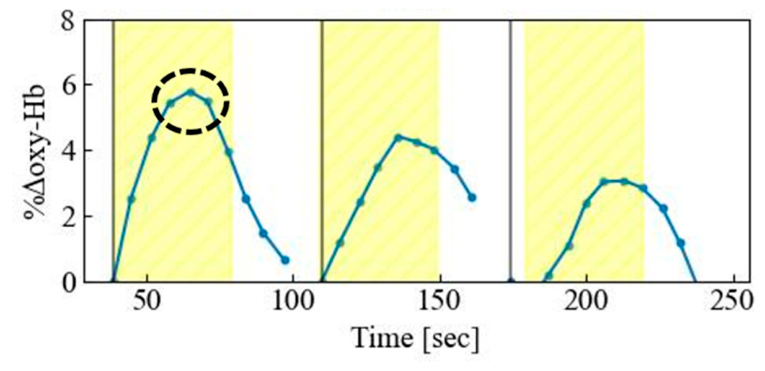
Figure 4.
Brain regions corresponding to C3 (blue dot) and the midpoint (red dot) of the source-detector pair that showed %Δoxy-Hbmax during the finger-tapping task in a representative participant.
Figure 4.
Brain regions corresponding to C3 (blue dot) and the midpoint (red dot) of the source-detector pair that showed %Δoxy-Hbmax during the finger-tapping task in a representative participant.
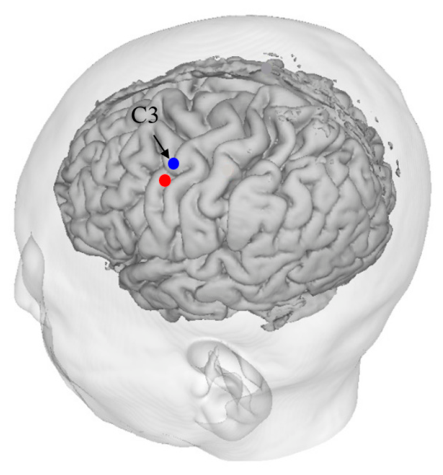
Figure 5.
The brain regions corresponding to the midpoint (red dot) of each source-detector pair showing %Δoxy-Hbmax during the finger-tapping task across 12 Tasks performed over six different days in a single participant.
Figure 5.
The brain regions corresponding to the midpoint (red dot) of each source-detector pair showing %Δoxy-Hbmax during the finger-tapping task across 12 Tasks performed over six different days in a single participant.
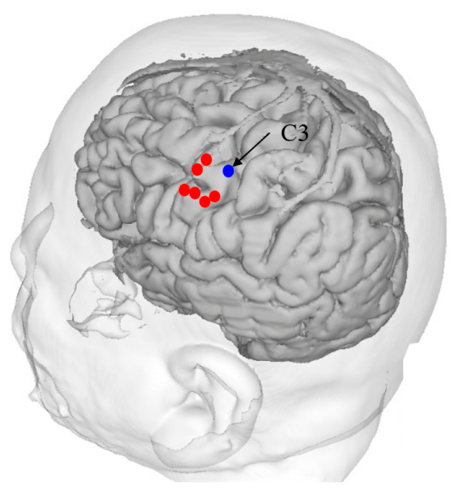
Figure 6.
The number of participants showing %Δoxy-Hbmax at each channel.
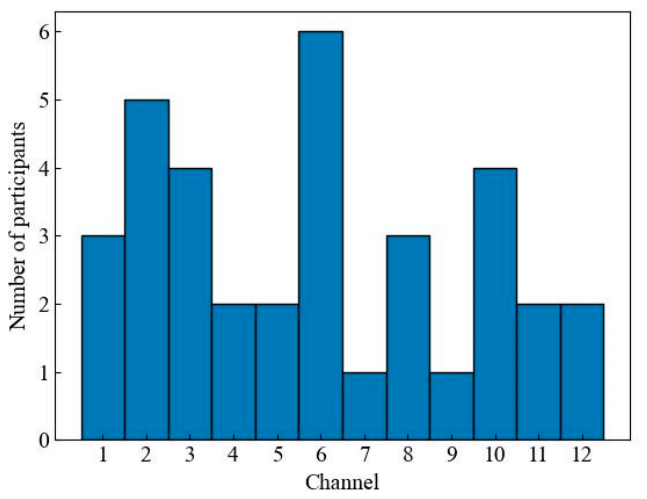
Figure 7.
Relationships between %Δoxy-Hbmax and STAI-State (a) and STAI-Trait (b) scores. Outliers are indicated by dotted lines.
Figure 7.
Relationships between %Δoxy-Hbmax and STAI-State (a) and STAI-Trait (b) scores. Outliers are indicated by dotted lines.
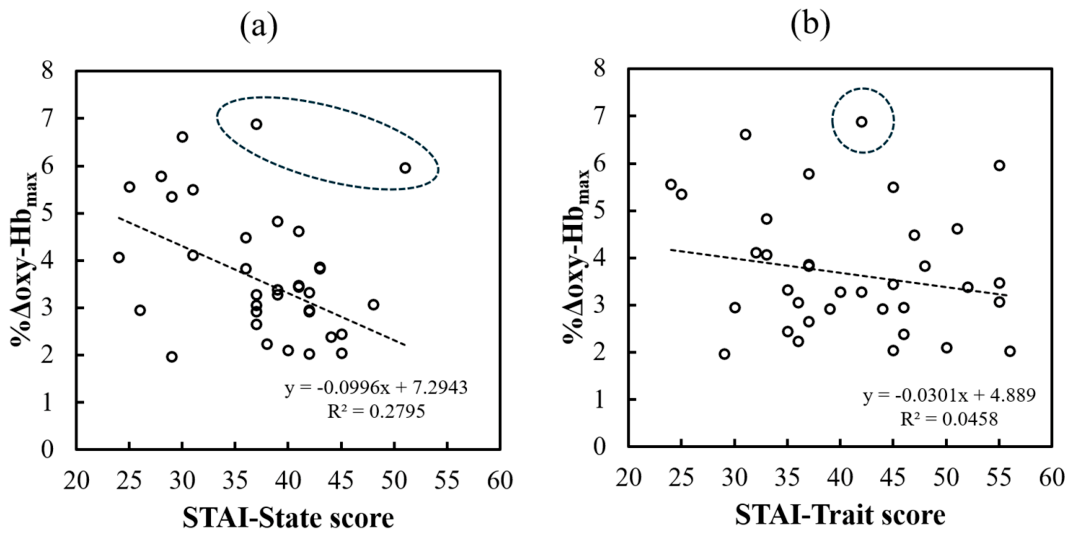
Figure 8.
Two-group comparisons of %Δoxy-Hbmax based on STAI-State (a) and STAI-Trait (b) scores after excluding outliers. Participants were divided into lower- and higher-STAI-State-score groups and lower- and higher-STAI-Trait-score groups using cutoff values of 40 for STAI-State and 44 for STAI-Trait. Values shown are unadjusted.
Figure 8.
Two-group comparisons of %Δoxy-Hbmax based on STAI-State (a) and STAI-Trait (b) scores after excluding outliers. Participants were divided into lower- and higher-STAI-State-score groups and lower- and higher-STAI-Trait-score groups using cutoff values of 40 for STAI-State and 44 for STAI-Trait. Values shown are unadjusted.
Disclaimer/Publisher’s Note: The statements, opinions and data contained in all publications are solely those of the individual author(s) and contributor(s) and not of MDPI and/or the editor(s). MDPI and/or the editor(s) disclaim responsibility for any injury to people or property resulting from any ideas, methods, instructions or products referred to in the content. |
© 2026 by the authors. Licensee MDPI, Basel, Switzerland. This article is an open access article distributed under the terms and conditions of the Creative Commons Attribution (CC BY) license (http://creativecommons.org/licenses/by/4.0/).
Copyright: This open access article is published under a Creative Commons CC BY 4.0 license, which permit the free download, distribution, and reuse, provided that the author and preprint are cited in any reuse.