

Submitted:
11 November 2026
Posted:
11 November 2026
You are already at the latest version
Abstract
Background/Objectives: Participatory arts are increasingly used to promote the mental health of older adults, but evidence from Andean Latin America is scarce. This study describes changes in quality of life, depressive and anxiety symptoms, cognitive reappraisal and loneliness among older adults who took part in a community arts and music programme in Ambato, Ecuador. Methods: We conducted a retrospective secondary analysis of single-group pre–post evaluation data from 24 older adults who completed a university-delivered programme combining visual arts, music-based activities and psychosocial accompaniment. Outcomes were the WHOQOL-BREF domains, PHQ-9, GAD-7, ERQ cognitive reappraisal and the three-item UCLA Loneliness Scale. Mean changes with 95% confidence intervals (CIs), Holm-adjusted paired tests, standardised effect sizes and individually meaningful change were estimated. Results: The psychological (+21.9 points; 95% CI 14.5 to 29.3; dz = 1.25) and social relationship (+12.0 points; 95% CI 4.6 to 19.4; dz = 0.68) domains improved, whereas the physical and environment domains did not change appreciably. Depressive (−2.50 points; 95% CI −4.02 to −0.98) and anxiety (−3.00 points; 95% CI −4.25 to −1.75) symptoms and loneliness decreased, and reappraisal increased (all Holm-adjusted p ≤ 0.010). However, only 7 and 8 of 24 participants achieved clinically important reductions in depressive and anxiety symptoms, respectively, and six had lower average quality-of-life scores at follow-up. Conclusions: Programme participation was associated with gains in psychological and social quality of life and modest, heterogeneous symptom reductions. Given the uncontrolled design, small sample and absence of longer-term follow-up, these findings are hypothesis-generating and warrant controlled evaluation.
Keywords:
older adults
; arts and health
; music
; quality of life
; WHOQOL-BREF
; depression
; anxiety
; loneliness
; emotion regulation
; Ecuador
1. Introduction
Population ageing is advancing rapidly in Latin America, and preserving the quality of life of older adults has become a public health priority for the region [1]. In Ecuador, a binational comparison using the WHOQOL-OLD found that older adults reported lower perceived quality of life than their Mexican peers in most dimensions, except sensory abilities and social participation, and concluded that quality-of-life research in the country needs to be strengthened [1]. The World Health Organization conceptualizes quality of life as a person’s subjective appraisal of their position in life, judged against their culture, values, goals and concerns, and operationalizes it through the WHOQOL-BREF, which yields physical health, psychological, social relationship and environmental domain scores [2,3]. The WHOQOL-BREF has shown acceptable psychometric properties in Ecuadorian adults [4], which makes it a practical outcome for community programs in the country.
Participatory arts are increasingly recognised as a resource for health. A World Health Organization scoping review synthesised a large body of evidence linking arts engagement with the prevention of ill health, health promotion and the management of a range of conditions across the life course [5]. Among older adults, randomised trials have reported that community group singing improved mental health-related quality of life at six months and reduced anxiety and depressive symptoms at three months [6]; that a culturally tailored community choir reduced loneliness and increased interest in life without affecting cognitive or physical outcomes [7]; that participatory art-based activities delivered in museums improved indicators of mental and physical health [8]; and that twelve months of piano practice improved the physical, psychological and environmental, but not the social, WHOQOL-BREF domains relative to music listening [9]. A recent meta-analysis of 39 controlled studies found that group arts interventions were associated with moderate reductions in depression (d = 0.70) and anxiety (d = 0.76) among older adults, although the depression estimate fell to d = 0.42 after adjustment for publication bias [10]. Not every trial has detected between-group differences, however: in the Singapore A-Health trial, within-group improvements in frailty and well-being were not accompanied by significant differences from the control group [11], a reminder that uncontrolled pre–post change can overstate program effects.
Several mechanisms may underlie these effects. A multilevel framework of how leisure activities influence health proposes psychological, biological, social and behavioral pathways that operate simultaneously [12]. Two candidate pathways are particularly relevant to group arts and music. First, creative and musical activities offer structured opportunities to express and reinterpret emotions, which may strengthen cognitive reappraisal, an emotion-regulation strategy associated with greater positive affect, better interpersonal functioning, and higher well-being [13]. Consistent with this, visual art production, compared with cognitive art evaluation, was associated with increased functional brain connectivity and psychological resilience in post-retirement adults [14]. Second, shared activities may reduce loneliness [7], which can be measured briefly with a three-item scale [15] and which prospectively predicts depressive symptoms [16] and dementia risk [17] in later life.
Most of this controlled evidence comes from high-income countries, and little is known about community arts and music programmes for older adults in Andean Latin America. In Ecuador, programmes of this kind are often delivered through university community outreach (vinculación con la sociedad) projects, as in the present case, and evaluated with routine pre–post questionnaires whose results may remain in unpublished institutional reports. Analysing such data transparently, with effect sizes, confidence intervals, individual-level change and explicit acknowledgement of design limitations, can inform the design of more rigorous evaluations. The aims of this study were therefore (i) to describe changes in WHOQOL-BREF domains, depressive and anxiety symptoms, cognitive reappraisal and loneliness among older adults who took part in a community arts and music programme in Ambato, Ecuador; (ii) to estimate the proportion of participants who experienced individually meaningful change; and (iii) to explore whether changes in reappraisal and loneliness were associated with changes in mental health outcomes. We found large improvements in the psychological and social relationship domains, symptom reductions that were mostly below clinically important thresholds, and marked inter-individual heterogeneity; given the uncontrolled design, these findings should be regarded as hypothesis-generating.
2. Materials and Methods
2.1. Study Design and Setting
This is a retrospective secondary analysis of programme evaluation data using a single group pre-post (uncontrolled before and after) design. The programme was delivered in Ambato, in the Andean province of Tungurahua, Ecuador, to the Huachi San Alfonso community group of older adults. It was delivered by the Clinical Psychology Program at the Universidad Regional Autónoma de los Andes (UNIANDES) as part of community outreach project 001-UA-UVS-PSC-2026 with the involvement of the local parish government. Baseline assessment was completed prior to the commencement of the programme; the 16 session intervention was delivered over the 8 week period from the first week of July through to the last week of August 2026. The post-intervention follow-up assessment was completed on 15th September 2026 following the completion of session 16. Programme records and results were all compiled into the institutional reports [18,19]. Reporting is in accordance with the TREND statement for non-randomised evaluations where appropriate [20] and the intervention is described in accordance with the TIDieR checklist [21].
2.2. Participants
Participants were members of the Huachi San Alfonso community group of older adults in Ambato, Tungurahua province, Ecuador. They were recruited via an open call jointly run by the parish government and the UNIANDES Clinical Psychology Program as part of community outreach project 001-UA-UVS-PSC-2026. Inclusion criteria were: (a) age 60 or over; (b) membership in the Huachi San Alfonso older adults group; and (c) written informed consent (or assent with caregiver co-signature where appropriate). Exclusion criteria were either severe cognitive impairment which would have precluded understanding of the assessment tools or missing more than 25% of the 16 programme sessions (i.e. attending less than 12 sessions). A total of 24 participants were recruited and assessed at baseline. All 24 commenced the programme, met the attendance criterion, completed the post-programme assessment on 15 September 2026 and were included in the final analysis (pseudonymised identifiers S01-S24). There were no exclusions from the programme after recruitment, no withdrawals and no losses to follow-up. The participant flow was therefore 24/24 at recruitment, baseline, programme entry and follow-up.
The sociodemographic and health characteristics of the sample are summarised in Table 1. The 24 participants had a mean age of 71.4 years (SD = 6.8; range 60–86); 17 (70.8%) were women and 7 (29.2%) were men. Fifteen participants (62.5%) reported at least one chronic condition. Complete sociodemographic data were available for all participants.
2.3. Intervention
The programme was a multicomponent, group-based community intervention comprising three elements [19]: (i) visual arts activities, including drawing, painting, collage, mural work, and symbolic expression; (ii) music-based activities, such as music listening, singing, rhythm and percussion, movement to music, and music-evoked reminiscence; and (iii) psychological accompaniment and strengthening of participants’ support networks. Details regarding intervention dose, session schedule, facilitator qualifications and training, attendance procedures, and fidelity monitoring were documented in programme records and are summarised in Table 2 according to TIDieR. The intervention is described as a community arts and music programme rather than as music therapy or art therapy, as it was not delivered as formal therapy by credentialed music or art therapists within a discipline-specific therapeutic process.
2.4. Outcome Measures
2.4.1. Quality of Life
Quality of life was assessed using the WHOQOL-BREF [2,3], a 26-item instrument that includes two general items—overall quality of life (item 1) and satisfaction with health (item 2)—each rated from 1 to 5, and 24 items grouped into four domains: physical health (7 items), psychological (6 items), social relationships (3 items), and environment (8 items). Domain scores are reported on a 0–100 scale, with higher scores indicating better perceived quality of life. The instrument is scored at the domain level and does not provide an overall score derived from the four domains [2]. In Ecuadorian adults, the original four-domain structure with correlated factors demonstrated acceptable psychometric properties, although validation was conducted in university students rather than in older adults [4].
2.4.2. Depressive and Anxiety Symptoms
Depressive symptoms were measured using the Patient Health Questionnaire-9 (PHQ-9; total score 0–27), with scores of 10 or higher indicating at least moderate depressive symptoms [22]. Anxiety symptoms were measured using the Generalized Anxiety Disorder-7 scale (GAD-7; total score 0–21), with a score of 10 or higher serving as the recommended cut-off for probable generalised anxiety disorder [23].
2.4.3. Candidate Mechanisms
Cognitive reappraisal was measured with the six-item reappraisal subscale of the Emotion Regulation Questionnaire (ERQ), with items rated from 1 (strongly disagree) to 7 (strongly agree) [13]. Scores are reported as the mean item score (range 1–7); participant-level subscale sums (range 6–42) are provided in Appendix A. Loneliness was measured with the three-item UCLA Loneliness Scale (UCLA-3), with items scored from 1 (hardly ever) to 3 (often), giving toVásqueztals of 3–9, with higher scores indicating greater loneliness [15]. The Spanish version of the UCLA-3 has shown measurement invariance and adequate psychometric properties in older adults from Spain.
2.5. Data Sources and Verification
Participant-level scores were extracted from programme evaluation records and pseudonymised prior to analysis (Table A1 and Table A2). Summary statistics were recalculated from these data and cross-checked against the institutional results report [18]; the recalculated baseline and follow-up domain means matched the reported values. An earlier summary indicated a physical domain change of +4.1 points, while recalculation from participant-level data yielded +4.0 (65.6 to 69.6), which is the value reported here. The institutional report also presented an unweighted average of the four WHOQOL-BREF domain means (60.2 at baseline and 69.4 at follow-up). As this composite is not a validated WHOQOL-BREF overall score, it was not interpreted as such. However, the unweighted participant-level average of the four domain changes was used descriptively to characterise heterogeneity of individual change (Section 3.5; Table A1). No inferential test treated this composite as a validated overall score. The two general WHOQOL-BREF items were available only as frequency distributions at each time point, without linkage between assessments, and were therefore summarised descriptively (Table A3). Item-level responses were not available, so domain scores could not be re-derived from individual items.
2.6. Statistical Analysis
For each outcome, we computed the mean and standard deviation (SD) at baseline and follow-up and the mean within-person change (follow-up minus baseline) with its 95% confidence interval (CI) based on the t distribution. Changes were tested with two-sided paired t-tests, and the family-wise error rate across the eight primary outcomes (four WHOQOL-BREF domains, PHQ-9, GAD-7, ERQ reappraisal and UCLA-3 loneliness) was controlled with the Holm procedure [24]. Because Shapiro–Wilk tests suggested non-normal change scores for the psychological domain (p = 0.016) and loneliness (p = 0.004), Wilcoxon signed-rank tests with Holm correction were run as sensitivity analyses; zero differences were discarded, and exact p values were used in the absence of ties or zeros, with a tie-corrected normal approximation otherwise.
Standardised change was expressed as dz, the mean change divided by the SD of the change scores, and as dav, the mean change divided by the average of the baseline and follow-up SDs [25]. Confidence intervals for dz were obtained from the noncentral t distribution. All effect sizes were signed so that positive values indicate improvement; for PHQ-9, GAD-7 and UCLA-3, on which lower scores indicate better status, the sign was reversed. Conventional benchmarks of 0.2, 0.5 and 0.8 were used descriptively. Because dz reflects the consistency of within-person change and increases with the pre–post correlation, whereas dav is more comparable with between-group effect sizes, both are reported [25].
Individually meaningful improvement in a WHOQOL-BREF domain was defined as an increase of at least half a baseline SD [26], corresponding to 6.41 (physical), 6.21 (psychological), 4.73 (social relationships) and 6.51 (environment) points, and deterioration as a decrease of the same magnitude. Because anchor-based minimal clinically important differences (MCIDs) for the WHOQOL-BREF have not been established in older Latin American adults, these thresholds were compared with anchor-based ranges reported for adults with neurofibromatosis (physical 3.9–7.3, psychological 4.7–8.1, social 2.6–5.9 and environment 4.1–6.6 points) [27], and sensitivity analyses applied thresholds of 0.3 and 0.8 baseline SD and the lower and upper bounds of these ranges. For the PHQ-9, a reduction of at least 5 points was considered clinically significant [28]; for the GAD-7, a reduction of at least 4 points, corresponding to its MCID, was used [29]. Among participants with baseline scores of 10 or more, response (reduction of at least 50%) and remission (follow-up score below 5) were also examined. Proportions are reported with Wilson score 95% CIs [30], and changes in the proportion of participants scoring 10 or more were assessed with exact McNemar tests.
In exploratory analyses, Spearman correlations (ρ) were calculated between improvement-coded change scores of the candidate mechanisms (reappraisal and loneliness) and those of the outcomes (PHQ-9, GAD-7 and the psychological and social relationship domains), and between symptom change and psychological domain change; 95% CIs were obtained by percentile bootstrap with 10,000 participant-level resamples using a fixed random seed (2026) for reproducibility. The unweighted average of the four WHOQOL-BREF domain changes was used only as a descriptive summary of individual heterogeneity and was not treated as a validated overall WHOQOL-BREF outcome. Because baseline–change correlations are negatively biased by measurement error and regression to the mean [31], Spearman correlations between baseline scores and change were used only descriptively, to identify domains in which change was concentrated among participants with low baseline scores. Exploratory analyses were not adjusted for multiplicity. Statistical significance was set at a two-sided α of 0.05. Analyses were performed in Python 3.12 with SciPy 1.17 and statsmodels 0.15.
2.7. Ethical Considerations
The protocol, participant information sheet, consent form and questionnaire were reviewed and approved in 2024 by the Comité de Bioética para Investigación CBISH; approval no. 2024-04. The study was conducted in accordance with applicable institutional and national requirements and the principles of the Declaration of Helsinki. Participants received a clear, non-technical explanation of the aims, questions, duration, potential risks and benefits, confidentiality protections and their right to decline any question or withdraw at any time.
3. Results
3.1. Participants and Baseline Profile
All 24 recruited participants were assessed at baseline, initiated the programme, met the attendance criterion, and completed the follow-up assessment; no participant was excluded or lost after enrolment. All 24 had complete baseline and follow-up data for every outcome. Participant characteristics are shown in Table 1. At baseline, the psychological domain had the lowest mean score (46.5, SD 12.4), and 17 participants (70.8%) scored between 26 and 50 points in this domain; mean scores were 65.6 (SD 12.8) for physical health, 59.2 (SD 9.5) for social relationships and 69.7 (SD 13.0) for environment (Table 3; Table A4). Symptom levels were elevated: the mean PHQ-9 score was 10.13 (SD 4.05) and the mean GAD-7 score 10.83 (SD 3.17), with 16 participants (66.7%) scoring 10 or more on the PHQ-9 and 18 (75.0%) on the GAD-7.
3.2. Quality of Life
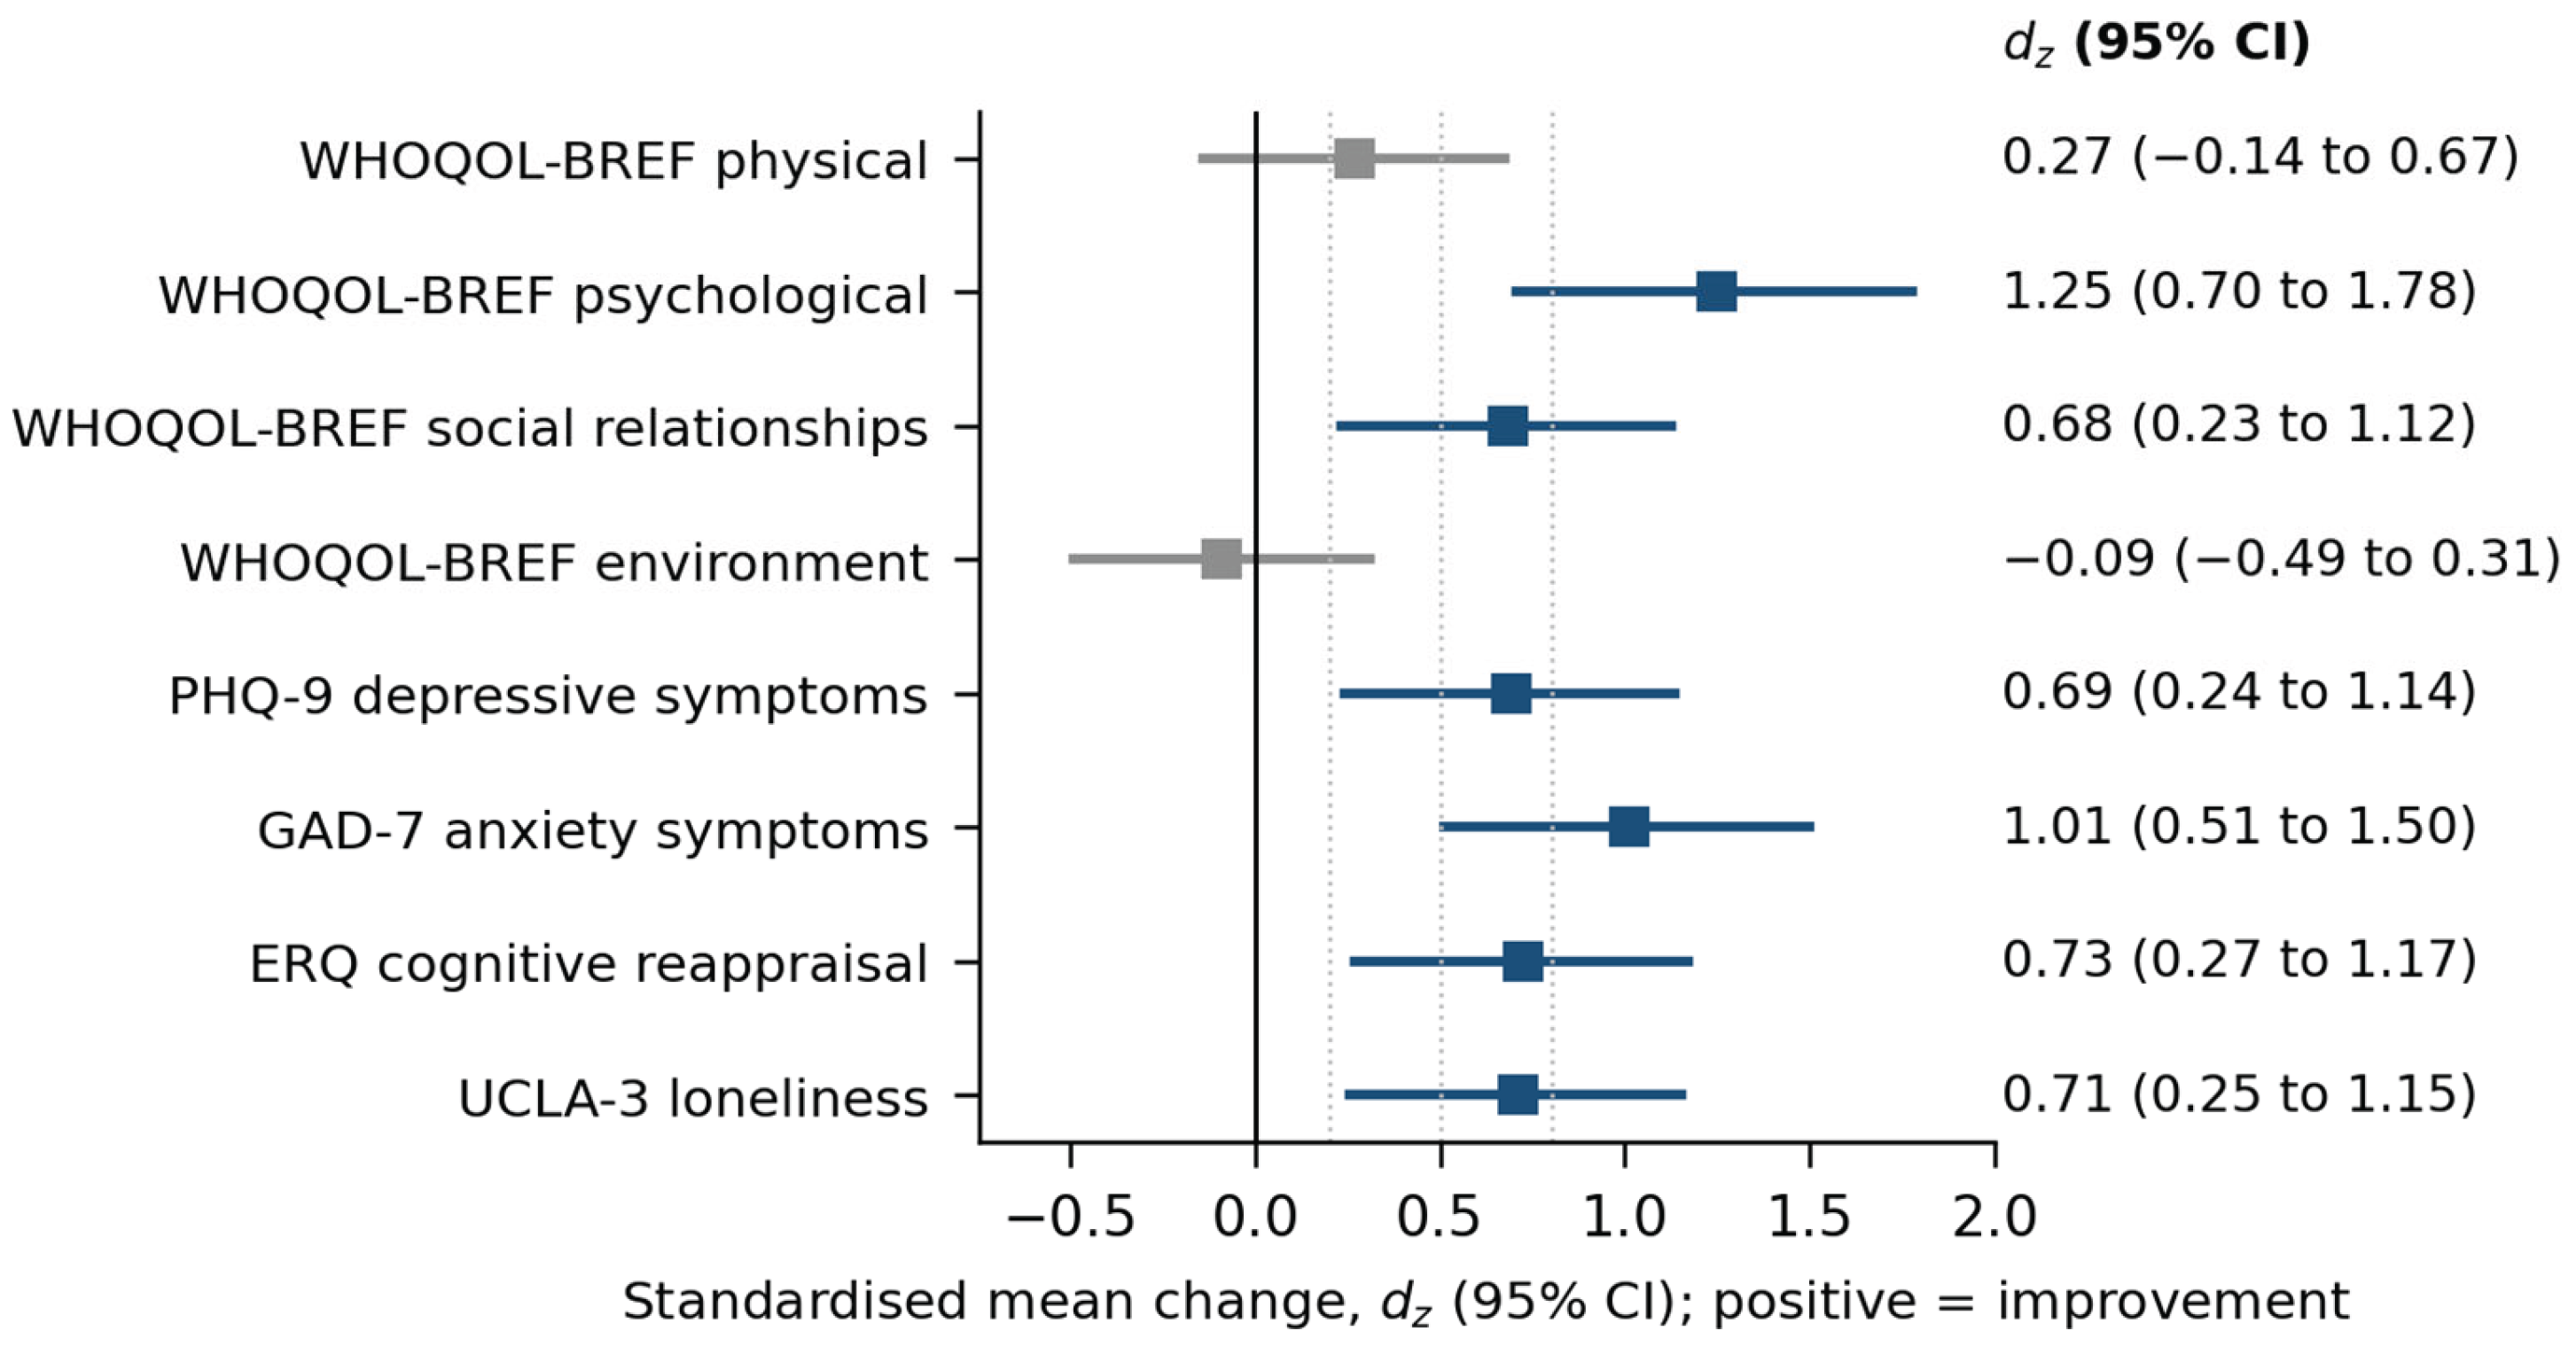
Mean scores increased in the psychological domain by 21.9 points (95% CI 14.5 to 29.3; t(23) = 6.12; Holm-adjusted p < 0.001; dz = 1.25, 95% CI 0.70 to 1.78) and in the social relationships domain by 12.0 points (95% CI 4.6 to 19.4; t(23) = 3.35; Holm-adjusted p = 0.010; dz = 0.68, 95% CI 0.23 to 1.12). Changes in the physical domain (4.0 points, 95% CI −2.3 to 10.3; Holm-adjusted p = 0.400; dz = 0.27) and the environment domain (−1.2 points, 95% CI −6.7 to 4.3; Holm-adjusted p = 0.656; dz = −0.09) were small, with confidence intervals including zero (Table 3, Figure 1a–d and Figure 2). Wilcoxon signed-rank tests gave the same pattern (Holm-adjusted p < 0.001, 0.021, 0.356 and 0.663 for the psychological, social relationships, physical and environment domains, respectively; Table B1).
The distribution of psychological domain scores shifted upwards: the number of participants scoring 50 or less fell from 17 to 3, and six participants scored above 75 at follow-up compared with none at baseline (Table A4). Gains were not uniform, however. The SD of social relationship scores approximately doubled (from 9.5 to 20.2), reflecting large increases in some participants and marked decreases in others (Figure 1c).
For the two general items (Table 4), the mean rating of overall quality of life was 3.38 (SD 0.97) at baseline and 3.71 (SD 0.91) at follow-up, and the proportion of participants rating their quality of life as good or very good was 41.7% (10/24) and 62.5% (15/24), respectively. Mean satisfaction with health was 3.33 (SD 0.87) and 3.58 (SD 0.97), and the proportion satisfied or very satisfied was likewise 41.7% and 62.5%. Because responses to these items could not be linked across time points, these differences were not tested statistically.
3.3. Depressive and Anxiety Symptoms, Reappraisal and Loneliness
The mean PHQ-9 score changed by −2.50 points (95% CI −4.02 to −0.98; t(23) = −3.40; Holm-adjusted p = 0.010; dz = 0.69, 95% CI 0.24 to 1.14) and the mean GAD-7 score by −3.00 points (95% CI −4.25 to −1.75; t(23) = −4.96; Holm-adjusted p < 0.001; dz = 1.01, 95% CI 0.51 to 1.50). Cognitive reappraisal increased by 0.60 points on the item-mean scale (95% CI 0.25 to 0.96; t(23) = 3.56; Holm-adjusted p = 0.010; dz = 0.73, 95% CI 0.27 to 1.17), and UCLA-3 loneliness decreased by 0.71 points (95% CI −1.13 to −0.29; t(23) = −3.47; Holm-adjusted p = 0.010; dz = 0.71, 95% CI 0.25 to 1.15) (Table 3, Figure 1e–h and Figure 2). Wilcoxon signed-rank tests were consistent (Holm-adjusted p ≤ 0.021; Table B1). Because pre–post correlations for these four measures were high (r = 0.68–0.83), dav values (0.44–0.84) were smaller than dz values.
At the individual level, PHQ-9 scores decreased in 19 participants and increased in 5; GAD-7 scores decreased in 18, were unchanged in 4 and increased in 2; reappraisal increased in 16, was unchanged in 2 and decreased in 6; and loneliness decreased in 16, was unchanged in 6 and increased in 2 (Table B1). The number of participants scoring 10 or more on the PHQ-9 fell from 16 (66.7%) to 9 (37.5%), with 8 moving below and 1 moving above this threshold (exact McNemar p = 0.039). On the GAD-7, the corresponding number fell from 18 (75.0%) to 9 (37.5%), with 9 moving below and none moving above the threshold (p = 0.004).
Figure 2.
Standardised within-person change (dz) with 95% confidence intervals for the eight outcomes, signed so that positive values indicate improvement. Dotted lines mark conventional benchmarks of 0.2, 0.5 and 0.8; blue markers denote intervals that exclude zero.
Figure 2.
Standardised within-person change (dz) with 95% confidence intervals for the eight outcomes, signed so that positive values indicate improvement. Dotted lines mark conventional benchmarks of 0.2, 0.5 and 0.8; blue markers denote intervals that exclude zero.
3.4. Individually Meaningful Change
Using the half-SD criterion, 19 participants (79.2%; 95% CI 59.5 to 90.8) improved meaningfully in the psychological domain, 17 (70.8%; 50.8 to 85.1) in social relationships, 8 (33.3%; 18.0 to 53.3) in physical health and 4 (16.7%; 6.7 to 35.9) in environment (Table 5), whereas deteriorations of the same magnitude occurred in 3, 4, 5 and 7 participants, respectively. The half-SD thresholds lay within the anchor-based ranges reported for adults with neurofibromatosis; applying the upper bounds of those ranges produced identical responder counts, and applying the lower bounds increased them to 13 (physical), 19 (psychological), 18 (social relationships) and 8 (environment) (Table B2).
Clinically important improvement was less frequent for symptoms. Seven participants (29.2%; 95% CI 14.9 to 49.2) had a PHQ-9 reduction of at least 5 points, while one had an increase of at least 5 points; eight (33.3%; 18.0 to 53.3) had a GAD-7 reduction of at least 4 points, and none had an increase of this size. Among the 16 participants with a baseline PHQ-9 score of 10 or more, 3 (18.8%) met the response criterion, 1 (6.3%) met the remission criterion and 8 still scored 10 or more at follow-up. Among the 18 participants with a baseline GAD-7 score of 10 or more, 4 (22.2%) responded, 2 (11.1%) remitted and 9 still scored 10 or more at follow-up (Table 5).
3.5. Heterogeneity of Individual Change
For descriptive purposes, the unweighted participant-level average of change across the four WHOQOL-BREF domains was 9.2 points (SD 13.2; range −16.6 to 27.8). This descriptive average was not interpreted as a validated overall WHOQOL-BREF score. Eleven participants improved in all four domains, whereas six (25.0%) had a lower unweighted average of the four domain scores at follow-up (Table A1). In this subgroup, mean changes were −8.8 (physical), −1.7 (psychological), −10.5 (social relationships) and −16.5 (environment) points, compared with +8.3, +29.8, +19.5 and +3.9 points among the other 18 participants. Their mean symptom changes were also less favourable (PHQ-9 +0.33 vs. −3.44; GAD-7 −1.00 vs. −3.67), and their reappraisal scores decreased slightly (−0.36 vs. +0.93).
3.6. Exploratory Associations
Greater increases in reappraisal were associated with greater gains in the psychological domain (ρ = 0.52; 95% CI 0.10 to 0.78; p = 0.010), whereas associations with improvement in PHQ-9 (ρ = 0.29; 95% CI −0.10 to 0.61; p = 0.167) and GAD-7 scores (ρ = 0.34; 95% CI −0.12 to 0.70; p = 0.103) were weaker and imprecise (Table 6). Reductions in loneliness were not clearly associated with gains in social relationships (ρ = 0.33; 95% CI −0.13 to 0.67; p = 0.111), psychological quality of life (ρ = 0.14; 95% CI −0.35 to 0.58; p = 0.515) or PHQ-9 improvement (ρ = −0.11; 95% CI −0.62 to 0.37; p = 0.602). Symptom improvements converged with psychological domain gains (PHQ-9: ρ = 0.58; 95% CI 0.19 to 0.84; p = 0.003; GAD-7: ρ = 0.51; 95% CI 0.13 to 0.78; p = 0.011). Baseline scores were inversely related to change in the physical (ρ = −0.44, p = 0.030) and environment domains (ρ = −0.46, p = 0.025), but not in the psychological (ρ = −0.10, p = 0.628) or social relationships domains (ρ = −0.14, p = 0.501).
4. Discussion
In this retrospective evaluation of a community arts and music programme for older adults in Ambato, Ecuador, follow-up assessments indicated substantially higher psychological and social relationship quality of life, lower depressive and anxiety symptoms and loneliness, and greater use of cognitive reappraisal. However, physical and environmental quality of life did not show clear changes. Three features qualify these results. First, the largest standardised change occurred in the psychological domain, which had the lowest baseline level, and its magnitude (dav = 1.41) far exceeds the between-group effects reported in controlled trials and meta-analyses of group arts interventions [6,10]. Although within-group and between-group effect sizes are not directly comparable, this discrepancy suggests that part of the observed change may reflect factors other than the programme itself. Second, group-level symptom reductions (PHQ-9 −2.5; GAD-7 −3.0 points) were smaller than accepted thresholds for clinically important individual change, and only about one-third of participants reached those thresholds. Third, change was heterogeneous, with one-quarter of participants reporting lower average quality of life at follow-up. Because there was no comparison group, none of these changes can be attributed causally to the programme.
The observed domain pattern both aligns with and diverges from findings in controlled studies. Improvements in social relationships and reductions in loneliness are consistent with the Community of Voices trial, where six months of choir participation reduced loneliness (standardised effect 0.34) and increased interest in life without affecting cognitive or physical outcomes [7]. This supports the proposition that the social nature of group activities is a central pathway to health benefits [12]. In contrast, twelve months of piano practice improved the physical, psychological, and environmental WHOQOL-BREF domains, but not the social domain, relative to an active music-listening control [9]. That trial involved individual skill acquisition over a year, with a comparator that also provided social contact, whereas the present programme was brief and intrinsically collective. Differences in dose, format, and comparison condition plausibly explain the divergent domain profiles.
The absence of change in the environment domain is also plausible. Although one environment facet concerns opportunities for leisure, which the programme directly provided, the domain is dominated by structural circumstances such as financial resources, housing, transport, access to health and social care and physical safety, which a short psychosocial programme is unlikely to modify [2]. The lack of clear change in physical health agrees with the null physical outcomes of the Community of Voices trial [7], whereas benefits on physical quality of life and frailty have mainly been reported after longer or more structured programmes [8,9].
Regarding symptoms, the meta-analysis by Quinn et al. estimated moderate between-group reductions in depression (d = 0.70; 0.42 after adjustment for publication bias) and anxiety (d = 0.76), with larger effects in care homes than in community settings [10]. The within-group dav values observed here for depressive (0.57) and anxiety symptoms (0.84) are within a similar range. However, without a control condition, these values cannot be interpreted as programme effects. The community singing trial by Coulton et al. highlights the need for longer follow-up: differences in anxiety, depression, and mental health-related quality of life were observed at the end of the programme, but the quality-of-life difference diminished three months later [6]. Importantly, the Singapore A-Health trial found within-group improvements in frailty and well-being that did not differ from those in the control group [11], demonstrating that pre–post improvements similar to those observed here can occur even when a programme has no demonstrable specific effect.
Mean PHQ-9 and GAD-7 changes were statistically significant but did not reach the 5-point and 4-point criteria for clinically important individual change [28,29]. At the individual level, fewer than one in three participants met these criteria, response rates among participants with at least moderate symptoms were low (18.8% and 22.2%), and half of those with a baseline PHQ-9 score of 10 or more still exceeded this cut-off at follow-up. The proportion of participants with PHQ-9 or GAD-7 scores of 10 or more nonetheless decreased from two-thirds or more to approximately one-third. Taken together, these findings suggest that programmes of this kind are best regarded as psychosocial support and health promotion rather than as treatment for depressive or anxiety disorders, and that participants with persistent moderate or severe symptoms require clear referral pathways to clinical care.
For the WHOQOL-BREF, the half-SD thresholds fell within anchor-based MCID ranges derived from a different clinical population [27], and responder counts were robust to the choice of threshold. However, MCIDs specific to older adults and validated in Latin American populations are lacking, so the clinical significance of domain changes remains uncertain. The heterogeneity of change warrants attention: six participants showed lower average quality of life at follow-up, with declines concentrated in the environment, social relationships, and physical domains and without symptom improvement. Health events, bereavement, financial or family stressors, and measurement error could explain this pattern, but these contextual factors were not recorded. Participant-level attendance was recorded during programme delivery but could not be linked to the pseudonymised S01–S24 outcome dataset, so whether variation in attendance contributed to this pattern could not be assessed. Assessor-level characteristics likewise could not be linked to individual outcomes.
Reappraisal and loneliness improved alongside the outcomes, which aligns with the psychological and social pathways proposed for arts and leisure engagement [12], with evidence linking habitual reappraisal to well-being [13] and with prospective associations of loneliness with later depressive symptoms [16] and dementia [17]. However, the exploratory within-sample associations provide only partial support. Increases in reappraisal correlated with psychological domain gains but only weakly and imprecisely with symptom changes, and reductions in loneliness were not clearly associated with any outcome. The restricted range of the UCLA-3 (3–9 points) and the fact that six participants had unchanged loneliness scores limit the sensitivity of these analyses. Furthermore, correlations between concurrent change scores cannot establish temporal precedence or mediation, and with 24 participants, they are imprecise. Neuroimaging evidence that visual art production enhances functional connectivity and resilience in older adults [14] offers a biological hypothesis that the present data cannot address. Future studies should measure putative mediators at intermediate time points and use designs capable of testing mediation.
This study has several strengths. It reports a programme from an under-represented setting, recalculates all statistics from participant-level data and reconciles them with institutional reports, presents effect sizes with confidence intervals, controls for multiplicity, and performs non-parametric sensitivity analyses. Individual-level responder analyses complement group means, complete sociodemographic data were available, and the intervention dose, facilitators, attendance procedures, and fidelity are described transparently according to TIDieR items.
The limitations of this study are substantial. First, the single-group design cannot separate programme effects from regression to the mean, natural fluctuation, concurrent events, expectancy and demand characteristics, or socially desirable responding, particularly if assessments were conducted by programme personnel [31]. Participants were not selected based on their scores, which limits regression to the mean at the group level, and psychological domain change was unrelated to baseline level. However, baseline symptom levels were elevated, and change in the physical and environment domains was concentrated among participants with low baseline scores. Second, the interval from baseline to immediate post-programme assessment was short, and no longer-term follow-up beyond the immediate post-programme assessment was available, so the durability of any change is unknown. Third, although intervention dose, facilitator qualifications, training, and fidelity were documented, participant-level attendance records could not be linked to the pseudonymised S01–S24 outcome dataset, precluding individual dose–response analysis. The multicomponent intervention, including psychological accompaniment, also means that any benefit cannot be attributed specifically to the arts or music components. Fourth, the sample was small, came from a single community group, and was recruited through an open call. Although all 24 enrolled participants completed follow-up and complete sociodemographic data were available, selection effects and the relative sociodemographic homogeneity of this sample limit generalisability. Fifth, the WHOQOL-BREF has been validated in Ecuadorian university students rather than older adults [4], item-level responses were not available to re-derive domain scores, the two general items could not be linked across time points, and the three-item loneliness scale has a narrow range. The unweighted average of the four WHOQOL-BREF domains was used only descriptively and is not a validated overall score. Finally, the data were collected for programme evaluation rather than under a pre-registered research protocol, and exploratory analyses were not adjusted for multiplicity.
University community outreach projects provide an effective platform for integrating evaluation into standard practice. Future programmes should specify a primary outcome in advance, maintain linkable pseudonymised attendance records for dose–response analyses, and continue structured documentation of session content, facilitator training, and fidelity using TIDieR [21]. Where feasible, independent assessors should be used, and recruitment should span multiple community groups to enhance representativeness. Follow-up several months after programme completion is recommended. A comparison condition is essential; wait-list or stepped-wedge designs across community groups, such as the cluster wait-list design of the Community of Voices trial [7], are both ethically acceptable and feasible in community settings. The use of instruments specific to older adults, such as the WHOQOL-OLD previously applied in Ecuador [1], and measures validated in older Ecuadorian populations would strengthen interpretation. Routine PHQ-9 and GAD-7 screening within such programmes can facilitate identification of participants requiring referral to mental health services.
5. Conclusions
This small uncontrolled evaluation found that participation in a community arts and music programme for older adults in Ambato, Ecuador, was associated with higher psychological and social relationship quality of life, lower depressive and anxiety symptoms and loneliness, and greater cognitive reappraisal. Physical and environmental quality of life did not change. Symptom changes were modest relative to clinically important thresholds and varied considerably between individuals. These findings support further evaluation of community arts and music programmes as a psychosocial resource for older adults in Ecuador but do not demonstrate their effectiveness. Controlled studies with documented intervention dose and fidelity, validated measures for older adults, and longer follow-up are required.
Author Contributions
Conceptualization, F.VDLB. and A.B.; methodology, F.VDLB.; formal analysis, F.VDLB.; investigation, C.J. and N.C.; data curation, C.J.; writing-original draft preparation, F.VDLB.; writing—review and editing, F.VDLB., C.J. and M.P.; supervision, A.B.; project administration, A.B. All authors have read and agreed to the published version of the manuscript.
Funding
This research was funded by the Universidad Regional Autónoma de los Andes (UNIANDES) through community outreach project 001-UA-UVS-PSC-2026.
Institutional Review Board Statement
The study protocol, participant information sheet, consent form, and questionnaire received ethics approval in 2024 from the Comité de Bioética para Investigación CBISH (approval no. 2024-04). The study complied with institutional and national requirements and the Declaration of Helsinki.
Informed Consent Statement
Written informed consent was obtained from all participants involved in the study.
Data Availability Statement
Pseudonymised participant-level domain and scale scores analysed in this study are provided in Appendix A (Table A1 and Table A2). Further programme records are available from the corresponding author on reasonable request, subject to institutional and ethical approval.
Acknowledgments
The authors thank the members of the Huachi San Alfonso older adults’ group and the local parish government for their participation and support. The authors gratefully acknowledge Universidad de Las Américas (UDLA), Quito, Ecuador, for its institutional support and commitment to promoting scientific research and academic collaboration.
Conflicts of Interest
The authors declare no conflicts of interest.
Abbreviations
The following abbreviations are used in this manuscript:
| CI | Confidence interval |
| dav | Standardised mean change using the average of baseline and follow-up SDs |
| dz | Standardised mean change using the SD of change scores |
| ERQ | Emotion Regulation Questionnaire |
| GAD-7 | Generalized Anxiety Disorder-7 scale |
| MCID | Minimal clinically important difference |
| PHQ-9 | Patient Health Questionnaire-9 |
| SD | Standard deviation |
| TIDieR | Template for Intervention Description and Replication |
| TREND | Transparent Reporting of Evaluations with Nonrandomized Designs |
| UCLA-3 | Three-item UCLA Loneliness Scale |
| UNIANDES | Universidad Regional Autónoma de los Andes |
| WHOQOL-BREF | World Health Organization Quality of Life, brief version |
Appendix A
Table A1 and Table A2 report the pseudonymised participant-level scores on which all analyses are based; Table A3 and Table A4 report the distributions of the WHOQOL-BREF general items and domain scores.

Table A1.
Participant-level WHOQOL-BREF domain scores (baseline → follow-up; 0–100).
| ID | Physical health | Psychological | Social relationships | Environment | Mean change |
|---|---|---|---|---|---|
| S01 | 82.5 → 94.7 | 42.4 → 99.5 | 65.1 → 99.4 | 93.3 → 87.0 | 24.33 |
| S02 | 70.6 → 75.0 | 63.2 → 95.3 | 37.0 → 63.6 | 88.0 → 89.8 | 16.23 |
| S03 | 71.3 → 66.9 | 56.7 → 97.9 | 63.9 → 95.9 | 62.5 → 88.4 | 23.68 |
| S04 | 62.7 → 88.8 | 46.3 → 85.4 | 69.0 → 97.3 | 59.6 → 63.3 | 24.30 |
| S05 | 34.3 → 66.5 | 32.0 → 62.6 | 54.3 → 71.4 | 55.7 → 64.4 | 22.15 |
| S06 | 63.2 → 63.7 | 38.4 → 62.4 | 53.8 → 60.1 | 53.6 → 60.1 | 9.33 |
| S07 | 70.3 → 62.2 | 33.8 → 57.2 | 57.0 → 66.2 | 64.6 → 62.2 | 5.53 |
| S08 | 58.0 → 65.5 | 37.3 → 64.0 | 44.7 → 62.9 | 56.3 → 62.1 | 14.55 |
| S09 | 85.2 → 91.5 | 37.6 → 68.8 | 63.5 → 72.9 | 88.6 → 94.1 | 13.10 |
| S10 | 64.2 → 66.5 | 41.8 → 65.9 | 60.7 → 75.0 | 61.9 → 64.2 | 10.75 |
| S11 | 64.9 → 90.9 | 33.9 → 62.3 | 58.7 → 93.4 | 64.0 → 86.1 | 27.80 |
| S12 | 63.3 → 84.0 | 35.1 → 62.9 | 58.5 → 74.0 | 68.0 → 73.1 | 17.28 |
| S13 | 67.0 → 71.7 | 41.5 → 67.9 | 66.0 → 74.5 | 67.9 → 62.4 | 8.53 |
| S14 | 61.6 → 61.0 | 46.5 → 67.1 | 67.5 → 66.5 | 70.8 → 65.1 | 3.32 |
| S15 | 71.5 → 68.4 | 64.5 → 97.3 | 64.7 → 94.5 | 94.1 → 94.5 | 14.98 |
| S16 | 40.1 → 67.3 | 32.9 → 63.6 | 50.0 → 70.0 | 60.2 → 69.8 | 21.88 |
| S17 | 86.0 → 67.2 | 70.4 → 97.5 | 68.5 → 72.1 | 80.7 → 62.7 | −1.53 |
| S18 | 67.2 → 75.0 | 50.0 → 73.0 | 58.4 → 97.1 | 66.3 → 69.7 | 18.23 |
| S19 | 90.0 → 65.4 | 67.6 → 61.3 | 71.9 → 72.9 | 93.3 → 56.8 | −16.60 |
| S20 | 65.1 → 61.6 | 62.9 → 55.1 | 68.4 → 47.5 | 61.5 → 54.4 | −9.83 |
| S21 | 66.0 → 49.7 | 61.3 → 42.9 | 67.4 → 59.9 | 69.9 → 53.8 | −14.58 |
| S22 | 56.0 → 60.6 | 39.7 → 33.6 | 37.8 → 10.4 | 52.8 → 38.3 | −10.85 |
| S23 | 55.4 → 42.8 | 45.2 → 61.8 | 60.5 → 69.7 | 71.1 → 60.3 | 0.60 |
| S24 | 58.0 → 63.5 | 35.0 → 36.3 | 53.5 → 41.6 | 68.1 → 61.4 | −2.95 |
Mean change is the unweighted average of the four domain changes and is shown only to describe individual heterogeneity; it is not a validated WHOQOL-BREF score.
Table A2.
Participant-level symptom, reappraisal and loneliness scores (baseline → follow-up).
| ID | PHQ-9 (0–27) | GAD-7 (0–21) | ERQ reappraisal, sum (6–42) | UCLA-3 (3–9) |
|---|---|---|---|---|
| S01 | 9 → 1 | 12 → 4 | 21 → 30 | 6 → 3 |
| S02 | 3 → 0 | 6 → 0 | 24 → 28 | 9 → 8 |
| S03 | 13 → 6 | 13 → 7 | 28 → 35 | 9 → 9 |
| S04 | 10 → 3 | 11 → 9 | 24 → 31 | 7 → 7 |
| S05 | 12 → 8 | 15 → 7 | 26 → 34 | 5 → 4 |
| S06 | 10 → 11 | 12 → 9 | 26 → 29 | 7 → 7 |
| S07 | 13 → 14 | 10 → 3 | 17 → 23 | 5 → 4 |
| S08 | 13 → 8 | 15 → 13 | 20 → 30 | 4 → 3 |
| S09 | 15 → 14 | 13 → 7 | 14 → 14 | 6 → 4 |
| S10 | 11 → 10 | 14 → 12 | 23 → 33 | 8 → 7 |
| S11 | 11 → 10 | 9 → 4 | 22 → 30 | 8 → 7 |
| S12 | 19 → 15 | 8 → 8 | 20 → 24 | 8 → 7 |
| S13 | 13 → 6 | 12 → 10 | 23 → 25 | 7 → 7 |
| S14 | 10 → 8 | 11 → 5 | 24 → 29 | 7 → 6 |
| S15 | 3 → 0 | 8 → 5 | 36 → 42 | 6 → 5 |
| S16 | 15 → 9 | 16 → 15 | 20 → 23 | 5 → 5 |
| S17 | 3 → 0 | 3 → 0 | 30 → 27 | 5 → 6 |
| S18 | 8 → 5 | 11 → 11 | 29 → 42 | 7 → 5 |
| S19 | 7 → 10 | 12 → 12 | 35 → 33 | 6 → 5 |
| S20 | 7 → 2 | 13 → 10 | 29 → 25 | 5 → 5 |
| S21 | 5 → 9 | 10 → 13 | 27 → 25 | 7 → 9 |
| S22 | 13 → 10 | 10 → 10 | 27 → 25 | 8 → 7 |
| S23 | 10 → 8 | 5 → 6 | 24 → 19 | 4 → 3 |
| S24 | 10 → 16 | 11 → 8 | 17 → 17 | 6 → 5 |
ERQ reappraisal sums are divided by 6 to obtain the mean item scores used in the main text.
Table A3.
Frequency distributions of the WHOQOL-BREF general items (n = 24).
| Response | Overall quality of life, baseline | Overall quality of life, follow-up | Satisfaction with health, baseline | Satisfaction with health, follow-up |
|---|---|---|---|---|
| 1 | 1 | 1 | 0 | 1 |
| 2 | 2 | 0 | 4 | 2 |
| 3 | 11 | 8 | 10 | 6 |
| 4 | 7 | 11 | 8 | 12 |
| 5 | 3 | 4 | 2 | 3 |
| Total | 24 | 24 | 24 | 24 |
1 = very poor/very dissatisfied; 5 = very good/very satisfied.
Table A4.
Distribution of WHOQOL-BREF domain scores by score band (baseline/follow-up, n).
| Domain | 0–25 | >25–50 | >50–75 | >75–100 |
|---|---|---|---|---|
| Physical health | 0/0 | 2/2 | 18/17 | 4/5 |
| Psychological | 0/0 | 17/3 | 7/15 | 0/6 |
| Social relationships | 0/1 | 4/2 | 20/15 | 0/6 |
| Environment | 0/0 | 0/1 | 18/17 | 6/6 |
Appendix B
Table B1 reports additional statistics for the paired comparisons, and Table B2 reports responder counts under alternative thresholds for individually meaningful change in WHOQOL-BREF domains.
Table B1.
Additional statistics for the paired comparisons (n = 24).
| Outcome | SD of change | Pre–post r | Shapiro–Wilk p | Paired t-test p (unadjusted) | Wilcoxon p (Holm) | Improved/unchanged/worsened, n |
|---|---|---|---|---|---|---|
| WHOQOL-BREF physical (0–100) | 14.9 | 0.33 | 0.539 | 0.200 | 0.356 | 15/0/9 |
| WHOQOL-BREF psychological (0–100) | 17.5 | 0.42 | 0.016 | <0.001 | <0.001 | 20/0/4 |
| WHOQOL-BREF social relationships (0–100) | 17.5 | 0.50 | 0.498 | 0.003 | 0.021 | 19/0/5 |
| WHOQOL-BREF environment (0–100) | 13.0 | 0.55 | 0.364 | 0.656 | 0.663 | 13/0/11 |
| PHQ-9 (0–27) | 3.60 | 0.68 | 0.303 | 0.002 | 0.021 | 19/0/5 |
| GAD-7 (0–21) | 2.96 | 0.68 | 0.337 | <0.001 | 0.003 | 18/4/2 |
| ERQ reappraisal (1–7) | 0.83 | 0.68 | 0.548 | 0.002 | 0.013 | 16/2/6 |
| UCLA-3 loneliness (3–9) | 1.00 | 0.83 | 0.004 | 0.002 | 0.021 | 16/6/2 |
Shapiro–Wilk tests refer to the change scores. Wilcoxon signed-rank tests discarded zero differences and used exact p values in the absence of ties or zeros and a tie-corrected normal approximation otherwise. Improvement refers to higher scores for WHOQOL-BREF and reappraisal and to lower scores for PHQ-9, GAD-7 and UCLA-3.
Table B2.
Participants with individually meaningful WHOQOL-BREF improvement under alternative thresholds (n/24; threshold in points).
Table B2.
Participants with individually meaningful WHOQOL-BREF improvement under alternative thresholds (n/24; threshold in points).
| Threshold | Physical health | Psychological | Social relationships | Environment |
|---|---|---|---|---|
| 0.3 baseline SD | 13/24 (≥ 3.85) | 19/24 (≥ 3.72) | 18/24 (≥ 2.84) | 8/24 (≥ 3.90) |
| 0.5 baseline SD (primary) | 8/24 (≥ 6.41) | 19/24 (≥ 6.21) | 17/24 (≥ 4.73) | 4/24 (≥ 6.51) |
| 0.8 baseline SD | 6/24 (≥ 10.26) | 19/24 (≥ 9.93) | 16/24 (≥ 7.57) | 2/24 (≥ 10.41) |
| Anchor-based range, lower bound [27] | 13/24 (≥ 3.9) | 19/24 (≥ 4.7) | 18/24 (≥ 2.6) | 8/24 (≥ 4.1) |
| Anchor-based range, upper bound [27] | 8/24 (≥ 7.3) | 19/24 (≥ 8.1) | 17/24 (≥ 5.9) | 4/24 (≥ 6.6) |
Anchor-based ranges were derived in adults with neurofibromatosis and are used here only as external reference values.
References
- Ochoa Pacheco, P.; Castro Pérez, R.; Coello-Montecel, D.; Castro Zazueta, N.P. Quality of life in older adults: Evidence from Mexico and Ecuador. Geriatrics 2021, 6, 92. [CrossRef]
- The WHOQOL Group. Development of the World Health Organization WHOQOL-BREF quality of life assessment. Psychol. Med. 1998, 28, 551–558. [CrossRef]
- Skevington, S.M.; Lotfy, M.; O’Connell, K.A. The World Health Organization’s WHOQOL-BREF quality of life assessment: Psychometric properties and results of the international field trial. A report from the WHOQOL Group. Qual. Life Res. 2004, 13, 299–310. [CrossRef]
- Lima-Castro, S.; Arias-Medina, P.; Bueno-Pacheco, A.; Peña-Contreras, E.; Aguilar-Sizer, M.; Cabrera-Vélez, M. Factor structure, measurement invariance and psychometric properties of the Quality of Life Scale WHOQOL-BREF in the Ecuadorian context. Psicol. Reflex. Crit. 2021, 34, 29. [CrossRef]
- Fancourt, D.; Finn, S. What Is the Evidence on the Role of the Arts in Improving Health and Well-Being? A Scoping Review; Health Evidence Network Synthesis Report 67; WHO Regional Office for Europe: Copenhagen, Denmark, 2019.
- Coulton, S.; Clift, S.; Skingley, A.; Rodriguez, J. Effectiveness and cost-effectiveness of community singing on mental health-related quality of life of older people: Randomised controlled trial. Br. J. Psychiatry 2015, 207, 250–255. [CrossRef]
- Johnson, J.K.; Stewart, A.L.; Acree, M.; Nápoles, A.M.; Flatt, J.D.; Max, W.B.; Gregorich, S.E. A community choir intervention to promote well-being among diverse older adults: Results from the Community of Voices trial. J. Gerontol. B Psychol. Sci. Soc. Sci. 2020, 75, 549–559. [CrossRef]
- Beauchet, O.; Cooper-Brown, L.A.; Hayashi, Y.; Deveault, M.; Launay, C.P. Improving the mental and physical health of older community-dwellers with a museum participatory art-based activity: Results of a multicentre randomized controlled trial. Aging Clin. Exp. Res. 2022, 34, 1645–1654. [CrossRef]
- Worschech, F.; Marie, D.; Sinke, C.; Kliegel, M.; Jünemann, K.; Scholz, D.S.; Krüger, T.H.C.; James, C.E.; Altenmüller, E. Quality of life in older adults is enhanced by piano practice: Results from a randomized controlled trial. Ann. N. Y. Acad. Sci. 2025, 1550, 239–254. [CrossRef]
- Quinn, E.A.; Millard, E.; Jones, J.M. Group arts interventions for depression and anxiety among older adults: A systematic review and meta-analysis. Nat. Ment. Health 2025, 3, 374–386. [CrossRef]
- Ho, A.H.Y.; Ma, S.H.X.; Tan, M.K.B.; Bajpai, R.; Goh, S.S.N.; Yeo, G.; Teng, A.; Yang, Y.; Galéry, K.; Beauchet, O. Effects of participatory ‘A’rt-Based Activity On ‘Health’ of older community-dwellers: Results from a randomized control trial of the Singapore A-Health Intervention. Front. Med. 2023, 10, 1238562. [CrossRef]
- Fancourt, D.; Aughterson, H.; Finn, S.; Walker, E.; Steptoe, A. How leisure activities affect health: A narrative review and multi-level theoretical framework of mechanisms of action. Lancet Psychiatry 2021, 8, 329–339. [CrossRef]
- Gross, J.J.; John, O.P. Individual differences in two emotion regulation processes: Implications for affect, relationships, and well-being. J. Pers. Soc. Psychol. 2003, 85, 348–362. [CrossRef]
- Bolwerk, A.; Mack-Andrick, J.; Lang, F.R.; Dörfler, A.; Maihöfner, C. How art changes your brain: Differential effects of visual art production and cognitive art evaluation on functional brain connectivity. PLoS ONE 2014, 9, e101035. [CrossRef]
- Hughes, M.E.; Waite, L.J.; Hawkley, L.C.; Cacioppo, J.T. A short scale for measuring loneliness in large surveys: Results from two population-based studies. Res. Aging 2004, 26, 655–672. [CrossRef]
- Lee, S.L.; Pearce, E.; Ajnakina, O.; Johnson, S.; Lewis, G.; Mann, F.; Pitman, A.; Solmi, F.; Sommerlad, A.; Steptoe, A.; et al. The association between loneliness and depressive symptoms among adults aged 50 years and older: A 12-year population-based cohort study. Lancet Psychiatry 2021, 8, 48–57. [CrossRef]
- Salinas, J.; Beiser, A.S.; Samra, J.K.; O’Donnell, A.; DeCarli, C.S.; Gonzales, M.M.; Aparicio, H.J.; Seshadri, S. Association of loneliness with 10-year dementia risk and early markers of vulnerability for neurocognitive decline. Neurology 2022, 98, e1337–e1348. [CrossRef]
- Informe de Resultados. Informe Comparativo Pretest–Postest: Calidad de Vida en Personas Adultas Mayores. Instrumento WHOQOL-BREF (OMS). Grupo Huachi San Alfonso; Unpublished Institutional Report; Ambato, Ecuador, 2026.
- Universidad Regional Autónoma de los Andes (UNIANDES), Clinical Psychology Program. Acta e Informe de Resultados: Socialización y Cierre del Proyecto de Vinculación. Proyecto 001-UA-UVS-PSC-2026; Unpublished Institutional Minutes; UNIANDES: Ambato, Ecuador, September 2026.
- Des Jarlais, D.C.; Lyles, C.; Crepaz, N.; TREND Group. Improving the reporting quality of nonrandomized evaluations of behavioral and public health interventions: The TREND statement. Am. J. Public Health 2004, 94, 361–366. [CrossRef]
- Hoffmann, T.C.; Glasziou, P.P.; Boutron, I.; Milne, R.; Perera, R.; Moher, D.; Altman, D.G.; Barbour, V.; Macdonald, H.; Johnston, M.; et al. Better reporting of interventions: Template for intervention description and replication (TIDieR) checklist and guide. BMJ 2014, 348, g1687. [CrossRef]
- Kroenke, K.; Spitzer, R.L.; Williams, J.B.W. The PHQ-9: Validity of a brief depression severity measure. J. Gen. Intern. Med. 2001, 16, 606–613. [CrossRef]
- Spitzer, R.L.; Kroenke, K.; Williams, J.B.W.; Löwe, B. A brief measure for assessing generalized anxiety disorder: The GAD-7. Arch. Intern. Med. 2006, 166, 1092–1097. [CrossRef]
- Holm, S. A simple sequentially rejective multiple test procedure. Scand. J. Stat. 1979, 6, 65–70.
- Lakens, D. Calculating and reporting effect sizes to facilitate cumulative science: A practical primer for t-tests and ANOVAs. Front. Psychol. 2013, 4, 863. [CrossRef]
- Norman, G.R.; Sloan, J.A.; Wyrwich, K.W. Interpretation of changes in health-related quality of life: The remarkable universality of half a standard deviation. Med. Care 2003, 41, 582–592. [CrossRef]
- Pietrzykowski, M.O.; Vranceanu, A.M.; Macklin, E.A.; Mace, R.A. Minimal clinically important difference in the World Health Organization Quality of Life Brief (WHOQOL-BREF) for adults with neurofibromatosis. Qual. Life Res. 2024, 33, 1233–1240. [CrossRef]
- Löwe, B.; Unützer, J.; Callahan, C.M.; Perkins, A.J.; Kroenke, K. Monitoring depression treatment outcomes with the Patient Health Questionnaire-9. Med. Care 2004, 42, 1194–1201. [CrossRef]
- Toussaint, A.; Hüsing, P.; Gumz, A.; Wingenfeld, K.; Härter, M.; Schramm, E.; Löwe, B. Sensitivity to change and minimal clinically important difference of the 7-item Generalized Anxiety Disorder Questionnaire (GAD-7). J. Affect. Disord. 2020, 265, 395–401. [CrossRef]
- Brown, L.D.; Cai, T.T.; DasGupta, A. Interval estimation for a binomial proportion. Stat. Sci. 2001, 16, 101–133. [CrossRef]
- Barnett, A.G.; van der Pols, J.C.; Dobson, A.J. Regression to the mean: What it is and how to deal with it. Int. J. Epidemiol. 2005, 34, 215–220. [CrossRef]
Figure 1.
Individual trajectories (grey) and group means with 95% confidence intervals (blue) at baseline and follow-up (n = 24): (a) WHOQOL-BREF physical health; (b) WHOQOL-BREF psychological; (c) WHOQOL-BREF social relationships; (d) WHOQOL-BREF environment; (e) PHQ-9 depressive symptoms; (f) GAD-7 anxiety symptoms; (g) ERQ cognitive reappraisal (mean item score); (h) UCLA-3 loneliness. Higher scores indicate better status in (a–d) and (g) and worse status in (e), (f) and (h). A small horizontal jitter was added to reduce overplotting.
Figure 1.
Individual trajectories (grey) and group means with 95% confidence intervals (blue) at baseline and follow-up (n = 24): (a) WHOQOL-BREF physical health; (b) WHOQOL-BREF psychological; (c) WHOQOL-BREF social relationships; (d) WHOQOL-BREF environment; (e) PHQ-9 depressive symptoms; (f) GAD-7 anxiety symptoms; (g) ERQ cognitive reappraisal (mean item score); (h) UCLA-3 loneliness. Higher scores indicate better status in (a–d) and (g) and worse status in (e), (f) and (h). A small horizontal jitter was added to reduce overplotting.
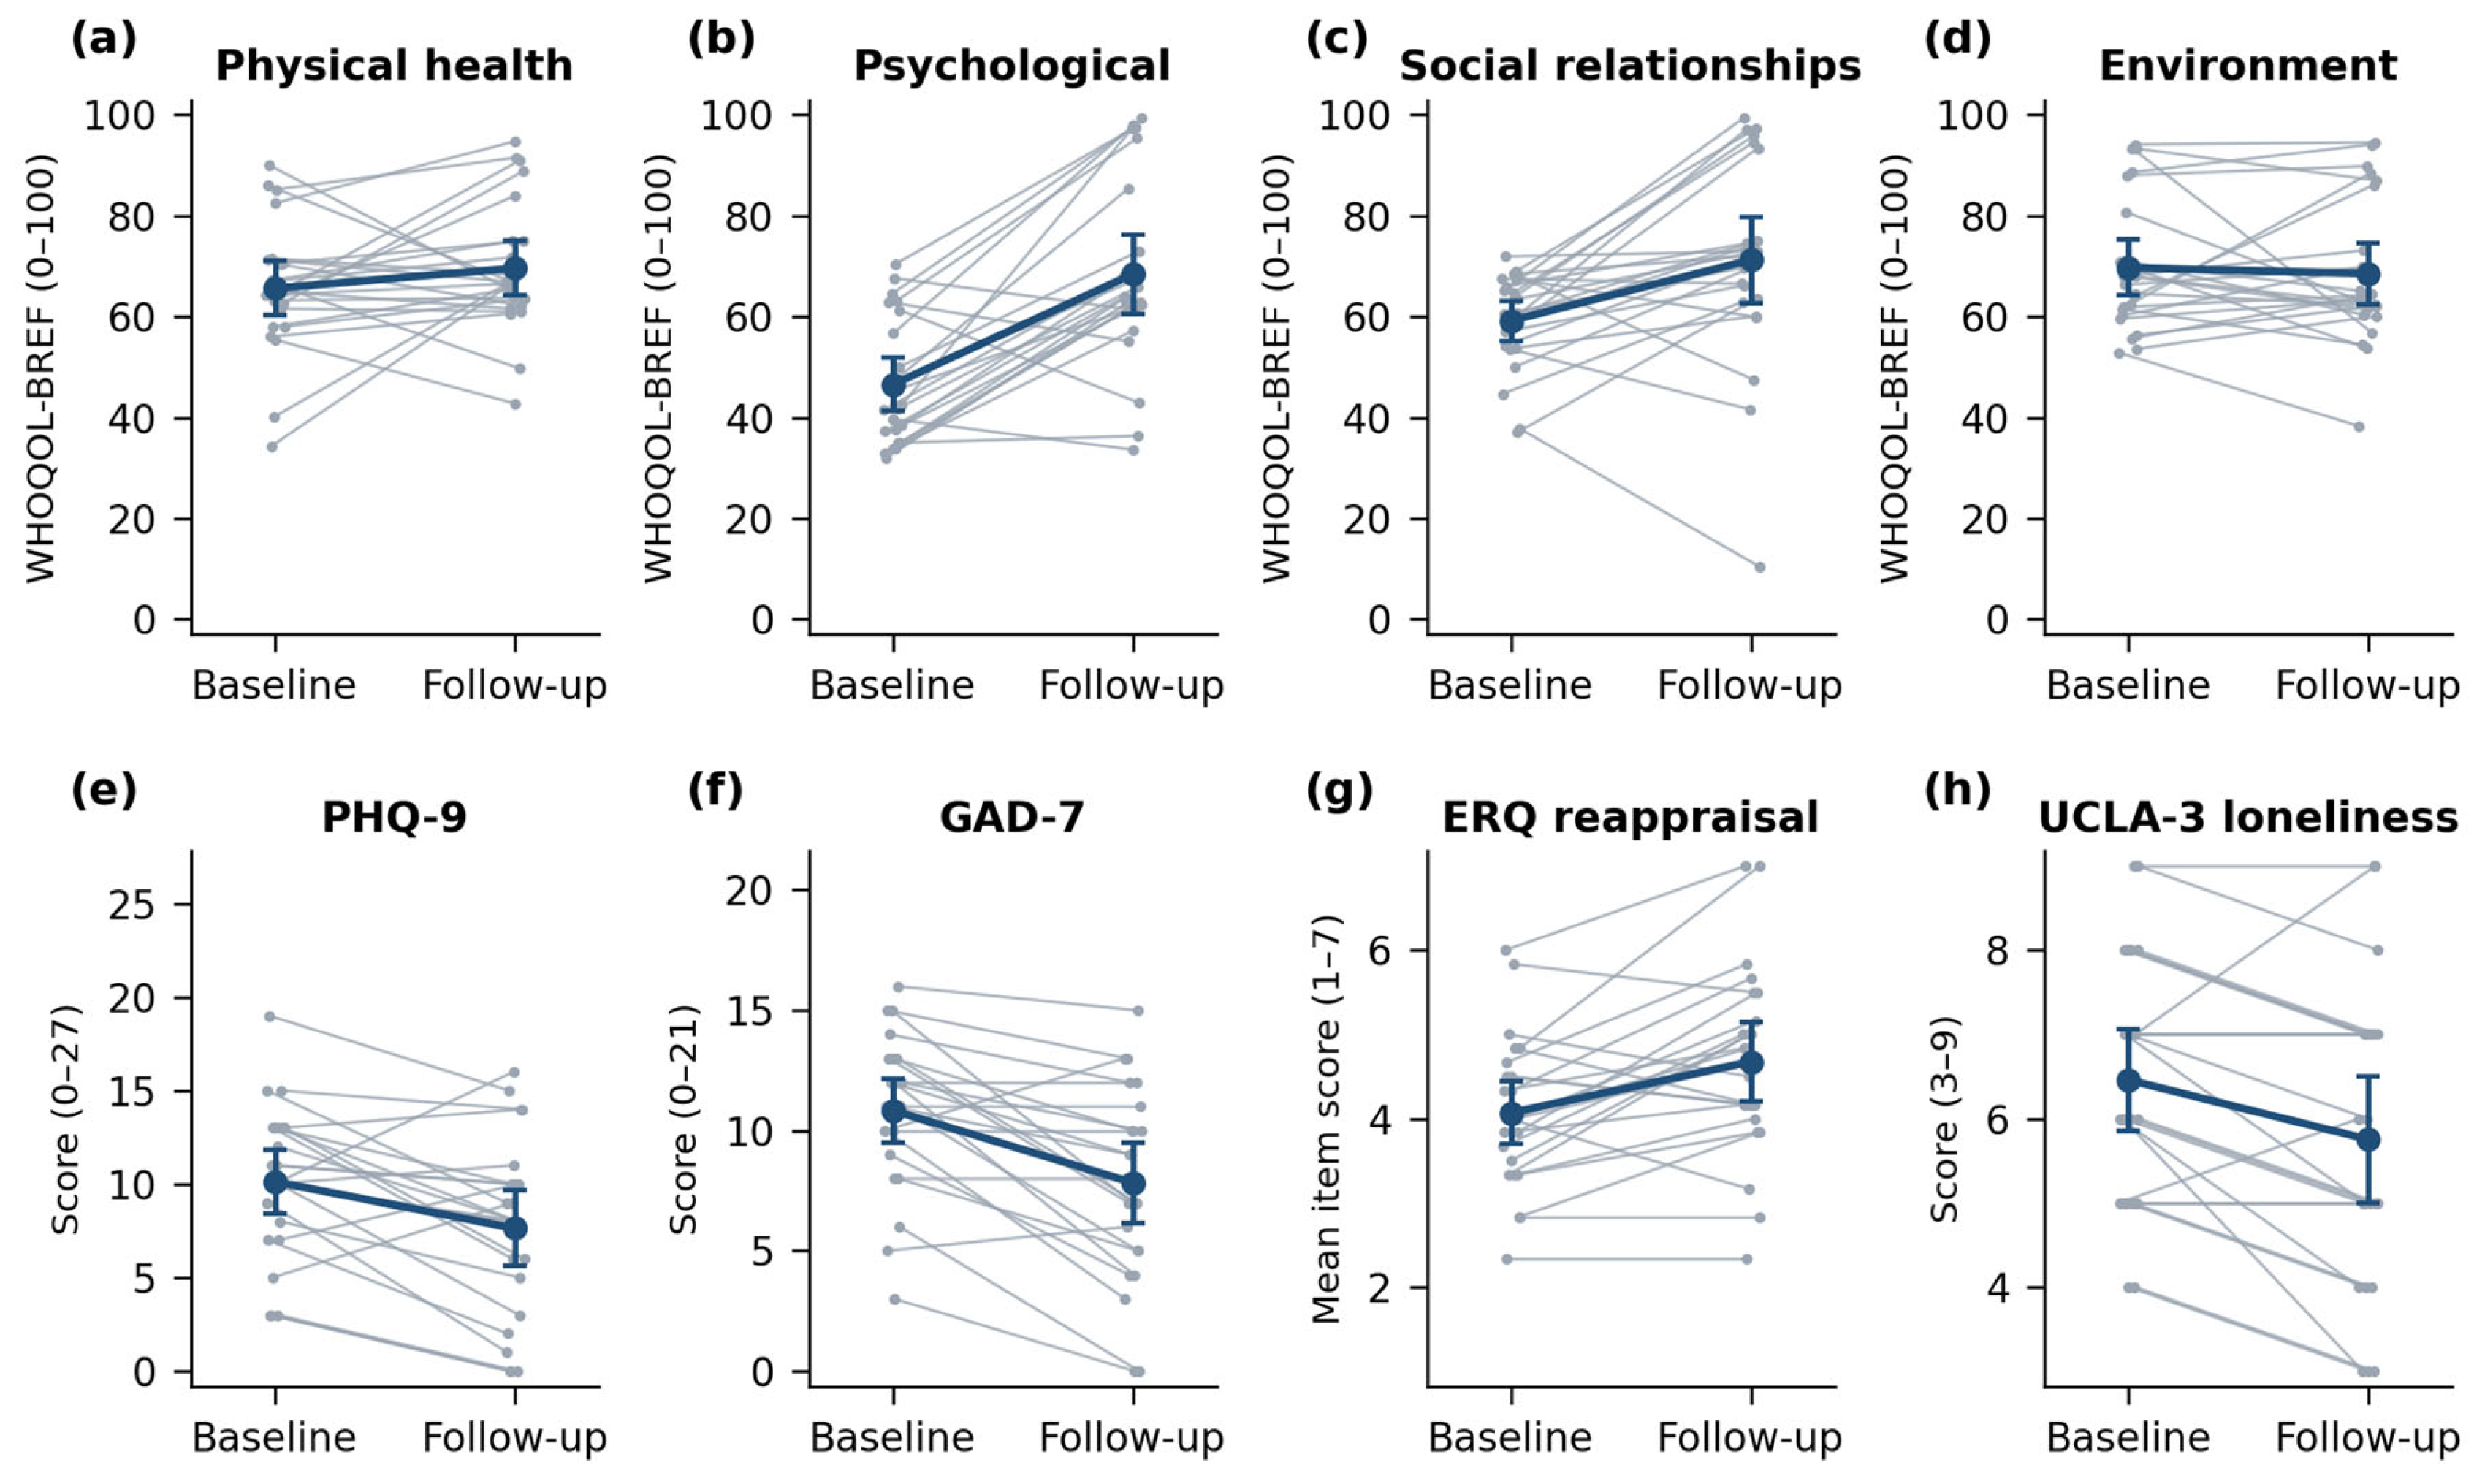
Table 1.
Participant sociodemographic and health characteristics (n = 24).
| Characteristic | n (%) or summary |
|---|---|
| Age, years | 71.4 (SD 6.8; range 60–86) |
| Age 60–74 years | 16 (66.7%) |
| Age ≥75 years | 8 (33.3%) |
| Women | 17 (70.8%) |
| Men | 7 (29.2%) |
| Married or stable union | 11 (45.8%) |
| Widowed | 9 (37.5%) |
| Separated or divorced | 3 (12.5%) |
| Single | 1 (4.2%) |
| Completed primary education | 10 (41.7%) |
| Incomplete primary education | 8 (33.3%) |
| Completed secondary education | 4 (16.7%) |
| No formal schooling | 2 (8.3%) |
| Resident in Huachi San Alfonso parish | 21 (87.5%) |
| Resident in adjacent Ambato parishes | 3 (12.5%) |
| Living with family members | 14 (58.3%) |
| Living alone | 7 (29.2%) |
| Living with spouse only | 3 (12.5%) |
| At least one self-reported chronic condition | 15 (62.5%) |
| Hypertension | 9 (37.5%) |
| Type 2 diabetes | 5 (20.8%) |
| No reported chronic condition | 9 (37.5%) |
| Self-identified mestizo | 24 (100%) |
Values are n (%) unless otherwise stated. Chronic conditions were self-reported; hypertension and type 2 diabetes categories are not mutually exclusive. SD, standard deviation.
Table 2.
Description of the community arts and music programme according to the TIDieR checklist [21].
Table 2.
Description of the community arts and music programme according to the TIDieR checklist [21].
| TIDieR item | Description (full English text for the manuscript) |
|---|---|
| Brief name | Community arts and music programme for older adults (UNIANDES community outreach project 001-UA-UVS-PSC-2026). |
| Why (rationale) | Group creative and musical activities as vehicles for emotional expression, emotion regulation and social connection, with the aim of improving quality of life and mental health. |
| What (materials) | Visual arts: Drawing paper, coloured pencils, acrylic paints, brushes, magazines for collage, poster board, and mural materials (acrylic outdoor paint). Music: A Bluetooth speaker, a laptop with a curated playlist of traditional Ecuadorian and familiar music, a set of small percussion instruments (maracas, tambourines, rhythm sticks), and printed lyric sheets in large print. Psychological accompaniment: A printed directory of local support networks and a standardised emotion-regulation worksheet used during reminiscence activities. |
| What (procedures) | Visual arts (45 min/session): Structured sessions beginning with a 10-minute guided relaxation, followed by 30 minutes of drawing, painting, or collage work focused on a symbolic theme (e.g., "My home," "A cherished memory"), and ending with a 5-minute voluntary sharing circle. Music (45 min/session): Sessions included listening to familiar songs, group singing, rhythmic percussion exercises, gentle seated movement to music, and a structured reminiscence segment where participants shared memories evoked by the songs. Psychological accompaniment: A brief check-in at the start of each session and a closing support-network strengthening discussion in the final session. |
| Who provided | The intervention was delivered by a team from the UNIANDES. Facilitators: Two licensed clinical psychologists (with 3 years of community mental health experience) and four supervised final-year psychology students. Training: All facilitators received a 4-hour pre-programme training session covering the session protocols, ethical considerations for working with older adults, and basic first aid. |
| How | Face-to-face, group format. Sessions were delivered in a single group of 24 participants, with participants seated in a circle to facilitate interaction. |
| Where | Community setting of the Huachi San Alfonso older adults' group, Ambato, Tungurahua, Ecuador, with parish government participation. Sessions were held in the parish community hall, a familiar and accessible location for participants. |
| When and how much | The programme was delivered over 8 weeks, from the first week of July 2026 to the last week of August 2026. There were 16 sessions in total, delivered twice weekly (Tuesdays and Thursdays). Each session lasted 90 minutes (45 minutes of visual arts and 45 minutes of music). Baseline assessment was completed before programme initiation; the post-programme follow-up assessment was conducted on 15 September 2026, after session 16. |
| Tailoring and modifications | The programme included planned individual tailoring within group sessions: facilitators adapted the complexity of art tasks (e.g., offering pre-cut collage materials for participants with fine motor difficulties) and the physical intensity of music-movement activities (e.g., seated versus standing options) based on participant preference and ability. No modifications were made to the overall programme structure or schedule after the start of the intervention. |
| How well (attendance, fidelity) | Attendance: Individual session attendance was recorded during programme delivery using a sign-in sheet. Participants attended a mean of 14.2 of 16 sessions (SD = 1.9; 88.8% attendance), and all 24 attended at least 12 sessions (75%), meeting the prespecified attendance criterion. For the secondary analysis, attendance records were available as aggregate programme summaries but could not be linked to the pseudonymised S01–S24 outcome dataset. Fidelity: Fidelity was monitored using a session checklist completed by the lead psychologist after each session, verifying delivery of all core components. A random audit of 4 sessions (25%) by an independent psychology faculty member not involved in delivery indicated 100% adherence to the core session protocol. |
Table 3.
Baseline and follow-up scores, within-person change and standardised effect sizes (n = 24).
Table 3.
Baseline and follow-up scores, within-person change and standardised effect sizes (n = 24).
| Outcome (range) | Baseline, mean (SD) | Follow-up, mean (SD) | Change (95% CI) | t(23) | Holm p | dz (95% CI) | dav |
|---|---|---|---|---|---|---|---|
| WHOQOL-BREF physical (0–100) | 65.6 (12.8) | 69.6 (12.7) | 4.0 (−2.3 to 10.3) | 1.32 | 0.400 | 0.27 (−0.14 to 0.67) | 0.31 |
| WHOQOL-BREF psychological (0–100) | 46.5 (12.4) | 68.4 (18.7) | 21.9 (14.5 to 29.3) | 6.12 | <0.001 | 1.25 (0.70 to 1.78) | 1.41 |
| WHOQOL-BREF social relationships (0–100) | 59.2 (9.5) | 71.2 (20.2) | 12.0 (4.6 to 19.4) | 3.35 | 0.010 | 0.68 (0.23 to 1.12) | 0.81 |
| WHOQOL-BREF environment (0–100) | 69.7 (13.0) | 68.5 (14.3) | −1.2 (−6.7 to 4.3) | −0.45 | 0.656 | −0.09 (−0.49 to 0.31) | −0.09 |
| PHQ-9 (0–27) | 10.13 (4.05) | 7.63 (4.79) | −2.50 (−4.02 to −0.98) | −3.40 | 0.010 | 0.69 (0.24 to 1.14) | 0.57 |
| GAD-7 (0–21) | 10.83 (3.17) | 7.83 (3.97) | −3.00 (−4.25 to −1.75) | −4.96 | <0.001 | 1.01 (0.51 to 1.50) | 0.84 |
| ERQ reappraisal (1–7) | 4.07 (0.89) | 4.67 (1.13) | 0.60 (0.25 to 0.96) | 3.56 | 0.010 | 0.73 (0.27 to 1.17) | 0.60 |
| UCLA-3 loneliness (3–9) | 6.46 (1.44) | 5.75 (1.78) | −0.71 (−1.13 to −0.29) | −3.47 | 0.010 | 0.71 (0.25 to 1.15) | 0.44 |
Change = follow-up minus baseline; 95% CI from the t distribution. p values from two-sided paired t-tests, adjusted with the Holm procedure across the eight outcomes. dz and dav are signed so that positive values indicate improvement (for PHQ-9, GAD-7 and UCLA-3, lower scores indicate better status); CIs for dz from the noncentral t distribution. ERQ reappraisal is expressed as the mean item score. Unadjusted p values and Wilcoxon signed-rank results are given in Table B1. CI, confidence interval; SD, standard deviation.
Table 4.
WHOQOL-BREF general items at baseline and follow-up.
| Item | Baseline, mean (SD) | Follow-up, mean (SD) | Baseline, rating 4–5, n (%; 95% CI) | Follow-up, rating 4–5, n (%; 95% CI) |
|---|---|---|---|---|
| Overall quality of life (item 1) | 3.38 (0.97) | 3.71 (0.91) | 10 (41.7; 24.5 to 61.2) | 15 (62.5; 42.7 to 78.8) |
| Satisfaction with health (item 2) | 3.33 (0.87) | 3.58 (0.97) | 10 (41.7; 24.5 to 61.2) | 15 (62.5; 42.7 to 78.8) |
Items rated from 1 to 5; ratings of 4–5 correspond to “good/very good” (item 1) and “satisfied/very satisfied” (item 2). Wilson score 95% CIs. Responses were available only as frequency distributions at each time point (Table A3), so within-person change could not be tested.
Table 5.
Individually meaningful improvement and deterioration.
| Outcome or subgroup | Criterion for improvement | Improved, n/N | % (Wilson 95% CI) | Deteriorated, n/N |
|---|---|---|---|---|
| WHOQOL-BREF physical | Increase ≥ 6.41 points | 8/24 | 33.3 (18.0 to 53.3) | 5/24 |
| WHOQOL-BREF psychological | Increase ≥ 6.21 points | 19/24 | 79.2 (59.5 to 90.8) | 3/24 |
| WHOQOL-BREF social relationships | Increase ≥ 4.73 points | 17/24 | 70.8 (50.8 to 85.1) | 4/24 |
| WHOQOL-BREF environment | Increase ≥ 6.51 points | 4/24 | 16.7 (6.7 to 35.9) | 7/24 |
| PHQ-9 | Decrease ≥ 5 points | 7/24 | 29.2 (14.9 to 49.2) | 1/24 |
| GAD-7 | Decrease ≥ 4 points | 8/24 | 33.3 (18.0 to 53.3) | 0/24 |
| PHQ-9, baseline ≥ 10 | Response (reduction ≥ 50%) | 3/16 | 18.8 (6.6 to 43.0) | — |
| PHQ-9, baseline ≥ 10 | Remission (follow-up < 5) | 1/16 | 6.3 (1.1 to 28.3) | — |
| GAD-7, baseline ≥ 10 | Response (reduction ≥ 50%) | 4/18 | 22.2 (9.0 to 45.2) | — |
| GAD-7, baseline ≥ 10 | Remission (follow-up < 5) | 2/18 | 11.1 (3.1 to 32.8) | — |
WHOQOL-BREF thresholds correspond to 0.5 baseline SD; deterioration was defined as a change of the same magnitude in the unfavourable direction. PHQ-9 and GAD-7 criteria follow published thresholds for clinically significant change and the minimal clinically important difference, respectively. Sensitivity analyses with alternative thresholds are shown in Table B2.
Table 6.
Exploratory Spearman correlations between improvement-coded change scores (n = 24).
| Pair of change scores | ρ | 95% CI (bootstrap) | p (unadjusted) |
|---|---|---|---|
| Reappraisal and PHQ-9 | 0.29 | −0.10 to 0.61 | 0.167 |
| Reappraisal and GAD-7 | 0.34 | −0.12 to 0.70 | 0.103 |
| Reappraisal and psychological domain | 0.52 | 0.10 to 0.78 | 0.010 |
| Loneliness and PHQ-9 | −0.11 | −0.62 to 0.37 | 0.602 |
| Loneliness and social relationships domain | 0.33 | −0.13 to 0.67 | 0.111 |
| Loneliness and psychological domain | 0.14 | −0.35 to 0.58 | 0.515 |
| PHQ-9 and psychological domain | 0.58 | 0.19 to 0.84 | 0.003 |
| GAD-7 and psychological domain | 0.51 | 0.13 to 0.78 | 0.011 |
Change scores were coded so that positive values indicate improvement (increases in reappraisal and WHOQOL-BREF scores; decreases in PHQ-9, GAD-7 and loneliness scores). Percentile bootstrap CIs were based on 10,000 participant-level resamples using a fixed random seed (2026). Analyses are exploratory and were not adjusted for multiplicity.
Disclaimer/Publisher’s Note: The statements, opinions and data contained in all publications are solely those of the individual author(s) and contributor(s) and not of MDPI and/or the editor(s). MDPI and/or the editor(s) disclaim responsibility for any injury to people or property resulting from any ideas, methods, instructions or products referred to in the content. |
© 2026 by the authors. Licensee MDPI, Basel, Switzerland. This article is an open access article distributed under the terms and conditions of the Creative Commons Attribution (CC BY) license (http://creativecommons.org/licenses/by/4.0/).
Copyright: This open access article is published under a Creative Commons CC BY 4.0 license, which permit the free download, distribution, and reuse, provided that the author and preprint are cited in any reuse.