
Submitted:
09 November 2026
Posted:
10 November 2026
You are already at the latest version
Abstract
Environmental noise may adversely affect sleep and well-being among students. This study examined associations between self-reported residential noise exposure, health complaints, and behaviours, and assessed temporal trends. This repeated cross-sectional study included 3,128 fourth-year medical students in Bratislava, Slovakia, surveyed across 11 waves between 2014 and 2026. Participants (69.9% women; mean age 23.2 ± 1.8 years) lived in noisy (n = 1,481) or quiet areas (n = 1,647). A questionnaire assessed noise annoyance, sleep outcomes, health complaints, and listening behaviours. Associations were examined using adjusted logistic regression models accounting for sex, age, smoking, and alcohol consumption. Compared with students in quiet areas, those in noisy areas had higher odds of frequent fatigue (44.1% vs. 33.4%; AOR = 1.59, 95% CI: 1.37–1.85), difficulty falling asleep (61.1% vs. 51.6%; AOR = 1.49, 95% CI: 1.29–1.72), waking due to noise (29.8% vs. 12.1%; AOR = 3.13, 95% CI: 2.59–3.78), and tinnitus (35.6% vs. 28.0%; AOR = 1.38, 95% CI: 1.13–1.69; all p < 0.01). These associations did not vary significantly over time. Residential noise was associated with poorer sleep and health complaints. Increasing personal listening device use and high-volume listening highlight the need for university health-promotion strategies addressing environmental and recreational sound exposure.
Keywords:
environmental noise
; noise annoyance
; sleep disturbance
; well‐being
; university students
; health promotion
1. Introduction
Environmental noise is an important environmental risk factor for health and well-being in Europe. More than one in five Europeans is exposed to harmful levels of transport noise, with road traffic being the predominant source. Beyond auditory effects, environmental noise is associated with noise annoyance, sleep disturbance, cardiovascular and metabolic outcomes, and adverse mental health effects [1,2,3]. Recent European estimates indicate that transport noise causes approximately 17 million cases of high annoyance and 4.6 million cases of severe sleep disturbance annually, highlighting the substantial population health burden of environmental noise [3]. The WHO has also recently incorporated annoyance, sleep disturbance, depression, and cognitive impairment into updated estimates of health loss attributable to environmental noise [4].
Noise annoyance is one of the most common subjective responses to environmental noise and reflects the interaction between exposure, individual characteristics, and the social and residential context. Although annoyance is not always considered a health outcome in itself, it may represent an important pathway linking noise exposure with stress and poorer mental well-being. A systematic review and meta-analysis found associations between high noise annoyance and depression, anxiety, and poorer general mental health, although the available evidence was heterogeneous [5]. Sleep disturbance is another important pathway, as environmental noise can disrupt sleep initiation and maintenance, affecting recovery, daytime functioning, and well-being [6,7].
Evidence from Denmark further supports the relevance of subjective responses to residential noise. Nationwide studies found that annoyance from neighbour and traffic noise was associated with poorer mental health and perceived stress. High annoyance from neighbour noise was also associated with fatigue, sleeping problems, and anxiety or nervousness, with a graded pattern across increasing levels of annoyance [8,9]. These findings are particularly relevant to the present study because they concern outcomes that are commonly reported by young adults and may be sensitive to environmental conditions.
University students represent an important population for investigating these relationships because academic demands, irregular schedules, and insufficient sleep may increase the relevance of the residential environment for daily functioning and well-being. Among university students, residential noise has been associated with poorer mental health, with noise annoyance and sleep disturbance proposed as potential pathways [10]. Students may also be exposed to multiple sources of environmental and social noise, including road traffic, neighbourhood activities, entertainment, amplified music, and personal listening devices.
Research conducted in Slovakia has provided important evidence on noise exposure among university students. Associations between community noise, noise annoyance, and cardiovascular risk have been reported among students in Bratislava [11], and further studies have documented substantial exposure to environmental and social noise, including leisure-related noise and personal music listening [12,13]. Research from neighbouring Central and South-Eastern European countries has likewise documented associations between environmental noise, annoyance, sleep, and other non-auditory health outcomes [14,15,16].
Despite increasing evidence on the non-auditory effects of environmental noise, data among university students remain limited. Most available studies are cross-sectional and focus on a single cohort, exposure source, or time point. Consequently, evidence on whether associations between residential noise exposure and sleep- and health-related complaints remain consistent across successive student cohorts over an extended period is limited, particularly in Central and South-Eastern Europe.
Therefore, this study examined the association between self-reported residential noise exposure and self-reported fatigue, nervousness, sleep disturbance, and tinnitus among fourth-year medical students in Bratislava, Slovakia. Using repeated cross-sectional data from 11 survey waves conducted between 2014 and 2026, we compared students living in a self-reported noisy residential area with those living in a quiet area and assessed whether the observed associations were consistent across survey waves. In addition, we described time trends in noise-related behaviors, such as leisure noise exposure and personal music listening, and in lifestyle factors (smoking and alcohol consumption).
2. Materials and Methods
2.1. Participants
A total of 3,128 fourth-year medical students from the Faculty of Medicine participated in the study on the effects of noise exposure, conducted between 2014 and 2026. The survey was administered in person to fourth-year medical students of our faculty, who completed the questionnaire on site. The study population was homogeneous in terms of age and educational level. All participants had either permanent or temporary residence in Bratislava
Participants were required to have no occupational exposure to noise during their professional training. Therefore, dentistry students were excluded because their clinical practice involved the use of noisy instruments. All participants were otologically healthy and had no diagnosed acute or chronic diseases
Based on their subjective assessment of the type of residential area, 47.3% of respondents were classified as living in a noisy area (n = 1,481), while 52.7% were classified as living in a quiet area (n = 1,647) (Table 1).
2.2. Noise Annoyance Questionnaire
Data were collected in person using a standardized Noise Annoyance Questionnaire, which was adapted over the 12-year study period. The questionnaire was based on the recommendations of Fields et al. [17], who proposed standardized questions for assessing community responses to environmental noise.
Sociodemographic Characteristics and Living Conditions
Participants reported their age, gender, nationality, and living conditions, including household characteristics, window orientation towards quiet or noisy streets, floor of residence, duration of residence at the current address, and number of household members. These variables were collected to characterize the study population and account for potential differences between participants living in noisy and quiet areas. Information was also collected on lifestyle factors potentially associated with sleep and mental well-being, including smoking status (never smoked, former smoker, current smoker consuming <20 or ≥20 cigarettes per day) and alcohol consumption (none, occasional, 1–2 drinks daily, or larger amounts daily). Gender, age, smoking status, and alcohol consumption were included as covariates in the multivariable logistic regression models.
Environmental and leisure noise exposure. This section assessed the use of personal listening devices (PLDs) with headphones during the previous week. Students who reported using PLDs were further asked about their listening time and typical listening volume. All participants were asked about the type of headphones they usually used, with responses recorded on a five-point scale. The questionnaire also assessed the time spent each month participating in noisy leisure activities, such as attending concerts, discos, and cinemas, playing a musical instrument, participating in sports, shooting, and using noisy appliances.
Subjective health complaints and noise annoyance. Participants reported the frequency of 16 subjective health complaints, including sleep disturbances, nervousness, tinnitus, and medication use. Noise annoyance was assessed for seven environmental noise sources using a five-point response scale. The assessment of noise disturbance and annoyance was based on the ICBEN recommendations for standardized community noise surveys proposed by Fields et al. [17].
2.3. Data Collection
Data were collected between 2014 and 2026 using a paper-based questionnaire. During the COVID-19 pandemic restrictions in 2020 and 2021, data were collected online. Due to this change in the data collection method, data from these two years were excluded from the present analysis and will be analysed separately.
Statistical Analysis
Statistical analyses were performed using IBM SPSS Statistics for Windows, Version 31.0 (IBM Corp., Armonk, NY, USA).and Python 3.12, including the pandas, SciPy, and statsmodels libraries. First, descriptive statistics were calculated, and participants living in self-reported noisy and quiet areas were compared. Categorical variables were compared using the chi-square test, whereas ordinal and continuous variables were compared using the Mann–Whitney U test, except for mean listening time, which was compared using Welch’s t-test. Given the ordinal nature of most questionnaire data, non-parametric methods were used for these comparisons. Associations between health complaints were examined using Spearman’s rank correlation coefficient.
To assess whether residence in a self-reported noisy area was independently associated with health complaints, separate logistic regression models were fitted for fatigue, awakening due to noise, difficulty falling asleep, nervousness, and tinnitus. Outcomes were dichotomised as follows: fatigue (often vs. occasionally/never), awakening due to noise and difficulty falling asleep (at least sometimes vs. never), nervousness (yes vs. no), and tinnitus (yes/rather yes vs. no/rather no; assessed from 2018 onwards). Residential area type (noisy vs. quiet) was the main explanatory variable, while sex, age, smoking status, and alcohol consumption were included as covariates to adjust for potential confounding. In a sensitivity analysis, models were additionally adjusted for type of temporary residence (dormitory, private housing, or living at home).
Temporal trends across survey years were assessed using logistic regression, with survey year included as a continuous predictor to estimate the annual change in odds (OR per year). For listening time and listening volume, Spearman’s rank correlation with survey year was used. Differences in temporal trends between participants living in noisy and quiet areas were assessed by including an area × year interaction term in the regression models. Results are reported as odds ratios (ORs) with 95% confidence intervals (CIs). Statistical significance was set at p < 0.05. No correction for multiple testing was applied. Missing data were handled using available-case analysis, with participants included in each analysis whenever data for the variables of interest were available. No imputation of missing values was performed.
3. Results
3.1. Participants
The study sample consisted predominantly of females (69.9%). The mean age was 23.2 ± 1.8 years, with no significant difference between students living in noisy and quiet areas (p = 0.75). Students living in noisy areas were more likely to be female, reside in dormitories, and report lower satisfaction with their residential environment. The characteristics of the study participants are presented in Table 1.
3.2. Noise-Related and Lifestyle Behaviours
Personal listening devices (PLDs) were used in the previous week by 83.7% of students, and 87.3% of those who reported the headphone type primarily used in-ear headphones. The median listening time among PLD users was 180 minutes per week (mean 296 minutes), and 35.4% of PLD users reported listening at a high volume (rating 4–5 on the 5-point scale). Students living in noisy areas were more likely to have used PLDs in the previous week than those living in quiet areas (86.9% vs. 80.8%, p < 0.001) and reported longer listening times (median 180 vs. 160 minutes, p = 0.024; mean 309 vs. 283 minutes, p = 0.083). However, headphone type and self-reported listening volume did not differ significantly between the areas (Table 1).
Among leisure activities with potential noise exposure, the most common were using noisy appliances (79.3%), visiting cinemas (47.9%), and attending discos or clubs (41.8%). Other activities included attending sports events (24.3%), playing a musical instrument (17.5%), and rock or pop concerts (14.9%). Classical music concerts (8.0%) and shooting (1.7%) were less common. Students living in noisy areas more frequently visited discos and clubs (46.4% vs. 37.8%, p < 0.001) and the cinema (50.4% vs. 45.3%, p = 0.005). In contrast, students living in quiet areas more frequently attended rock or pop concerts (16.4% vs. 13.1%, p = 0.011) and classical music concerts (9.4% vs. 6.4%, p = 0.002).
Regarding lifestyle behaviours, 12.0% of students were current smokers, and 90.4% reported consuming alcohol at least occasionally, whereas daily alcohol consumption was reported by 3.1%. Current smoking was less common among students living in noisy areas than among those living in quiet areas (10.3% vs. 13.5%, p = 0.008), whereas alcohol consumption at least occasionally was more common (91.9% vs. 89.0%, p = 0.009) (Table 1).
3.3. Health Complaints and Medication Use
After describing noise exposure and related behaviours, we examined students’ residential circumstances and health complaints. Temporary residence differed significantly between participants living in noisy and quiet areas (p < 0.001). Most students living in noisy areas lived in a dormitory (70.8%), whereas those living in quiet areas were more evenly distributed across dormitories (37.3%), private housing (27.4%), and their family homes (35.2%). Accordingly, living with family was more than twice as common among students from quiet areas than among those from noisy areas (35.2% vs. 13.5%). Over the study period, the proportion of students living in dormitories decreased in both area types (OR per year = 0.96 in noisy and 0.95 in quiet areas), while private housing became more common (OR per year = 1.10 and 1.05, respectively). Students living in quiet areas were also significantly more often satisfied with their residential environment than those living in noisy areas (78.2% vs. 33.5%, p < 0.001).
Compared with students living with their families, those residing in dormitories had higher odds of waking up due to noise (AOR = 1.62, 95% CI: 1.26–2.09, p < 0.001) and difficulty falling asleep (AOR = 1.59, 95% CI: 1.33–1.92, p < 0.001), independently of area type, sex, age, smoking, and alcohol consumption (Table 2, panel C). Students living in private housing also had higher odds of difficulty falling asleep (AOR = 1.32, 95% CI: 1.07–1.63, p = 0.009), whereas the association between private housing and waking up due to noise was not statistically significant (AOR = 1.27, 95% CI: 0.94–1.71, p = 0.116). Temporary residence was not significantly associated with fatigue, nervousness, or tinnitus.
Students living in noisy areas reported more frequent health complaints than those living in quiet areas (Table 3). The largest difference was observed for waking up due to noise, reported at least sometimes by 29.8% of students in noisy areas compared with 12.1% in quiet areas (p < 0.001). Difficulty falling asleep was also more common among students in noisy areas (61.1% vs. 51.6%, p < 0.001). Although nearly all students in both areas reported fatigue (98.1% vs. 96.5%), those living in noisy areas more often reported feeling tired and exhausted (44.1% vs. 33.4%, p < 0.001). Students in noisy areas also more frequently reported tinnitus (35.6% vs. 28.0%, p < 0.001; assessed from 2018 onwards only) and nervousness (38.5% vs. 34.6%, p = 0.025). In contrast, the use of sedatives, sleeping pills, and headache medication did not differ significantly between the two area types (all p > 0.05).
All health complaints and medication variables were positively correlated (Figure 1). The strongest correlations were between fatigue and nervousness (ρ = 0.30), sedatives and sleeping pills (ρ = 0.30), and headaches and headache medication use (ρ = 0.49). The use of sleeping pills was most strongly associated with difficulty falling asleep (ρ = 0.26), whereas sedatives use was most strongly associated with nervousness (ρ = 0.20). Waking up due to noise showed the weakest correlations with the other variables (ρ = 0.04–0.19).
In logistic regression models adjusted for sex, age, smoking status, and alcohol consumption, living in a noisy area was associated with higher odds of waking up due to noise (AOR = 3.13, 95% CI 2.59–3.78), fatigue (often vs. occasionally/never; AOR = 1.59, 95% CI 1.37–1.85), difficulty falling asleep (AOR = 1.49, 95% CI 1.29–1.72), and tinnitus (AOR = 1.38, 95% CI 1.13–1.69). A borderline association was observed for nervousness (AOR = 1.16, 95% CI 1.00–1.35) (Table 2, panel B). In a sensitivity analysis that additionally adjusted for type of temporary residence, the associations with waking up due to noise (AOR = 2.77, 95% CI 2.27–3.37) and difficulty falling asleep (AOR = 1.31, 95% CI 1.12–1.53) were attenuated. In contrast, the associations with fatigue (AOR = 1.60, 95% CI 1.37–1.88), tinnitus (AOR = 1.48, 95% CI 1.19–1.84), and nervousness (AOR = 1.21, 95% CI 1.04–1.42) remained similar or became slightly stronger (Table 2, panel C).
Female sex was associated with higher odds of fatigue, nervousness, difficulty falling asleep, and tinnitus. Former smokers and students who smoked fewer than 20 cigarettes per day had higher odds of fatigue, difficulty falling asleep, nervousness, and tinnitus. Daily consumption of 1–2 alcoholic drinks was associated with higher odds of nervousness (AOR = 1.79, 95% CI 1.07–2.99). Age was not significantly associated with any of the health complaints.
3.4. Trends over Time (2014 – 2026)
3.4.1. Noise Exposure and Behaviours
Several noise-related behaviours changed over the study period (11 survey waves conducted between 2014 and 2026). PLD use in the previous week increased from 76.8% in 2014 to 91.9% in 2026 (OR per year = 1.08, 95% CI 1.06–1.11, p < 0.001), with similar trends in noisy and quiet areas (OR = 1.09 and 1.08, respectively). The proportion of PLD users listening at a high volume (ratings 4–5) also increased, from 30.3% to 35.9% (OR per year = 1.03, 95% CI 1.01–1.05, p = 0.008). Listening time among PLD users showed a weak positive correlation with survey year (ρ = 0.06, p = 0.003). The increase in high-volume listening was statistically significant in noisy areas (OR = 1.05, p = 0.002) but not in quiet areas (OR = 1.01, p = 0.46); however, the difference between areas was not statistically significant (p for interaction = 0.090).
In contrast, participation in several leisure activities declined over the study period, including cinema attendance (47.0% to 36.4%; OR per year = 0.94), playing a musical instrument (25.1% to 10.5%; OR per year = 0.94), and attending rock or pop concerts (23.2% to 11.5%; OR per year = 0.94). The decline in rock and pop concert attendance was statistically significant only in quiet areas (OR = 0.92 vs. 0.97 in noisy areas; p for interaction = 0.041). The use of noisy appliances increased slightly (OR per year = 1.03, p = 0.003), particularly among students living in quiet areas (OR = 1.06; p for interaction = 0.014). No significant temporal changes were observed in attendance at discos or clubs, classical music concerts, sporting events, or shooting (Figure 2).
Regarding lifestyle behaviours, the proportion of students who consumed alcohol at least occasionally decreased (OR per year = 0.95, 95% CI 0.92–0.97, p < 0.001), mainly in the last two surveys (90.0–93.2% in 2014–2024, 84.0% in 2025, and 84.7% in 2026). Current smoking showed only a modest decline (OR per year = 0.97, 95% CI 0.95–1.00, p = 0.048), which was significant in quiet areas (OR per year = 0.96, p = 0.011) but not in noisy areas (OR per year = 1.00, p = 0.90). The proportion of current smokers was 17.1% in 2014, 10.1–13.9% in 2015–2025, and 7.7% in 2026.
3.4.2. Trends over Time: Health Complaints
Most health complaints became more frequent over the study period. The proportion of students who often felt tired increased from 32.4% to 43.5% (OR per year = 1.05, 95% CI 1.03–1.07, p < 0.001), while the proportion reporting nervousness increased from 33.0% to 43.5% (OR per year = 1.05, 95% CI 1.03–1.07, p < 0.001). Difficulty falling asleep also became more common, increasing from 54.7% to 60.3% (OR per year = 1.04, 95% CI 1.02–1.06, p < 0.001) (Table 4). Medication use increased over time as well, including sedatives (OR per year = 1.09, 95% CI 1.05–1.14), sleeping pills (OR per year = 1.08, 95% CI 1.04–1.11; 7.2% to 14.4%), and headache medication (OR per year = 1.05, 95% CI 1.03–1.07; 43.8% to 49.8%; all p < 0.001) (Table 4; Figure 4).
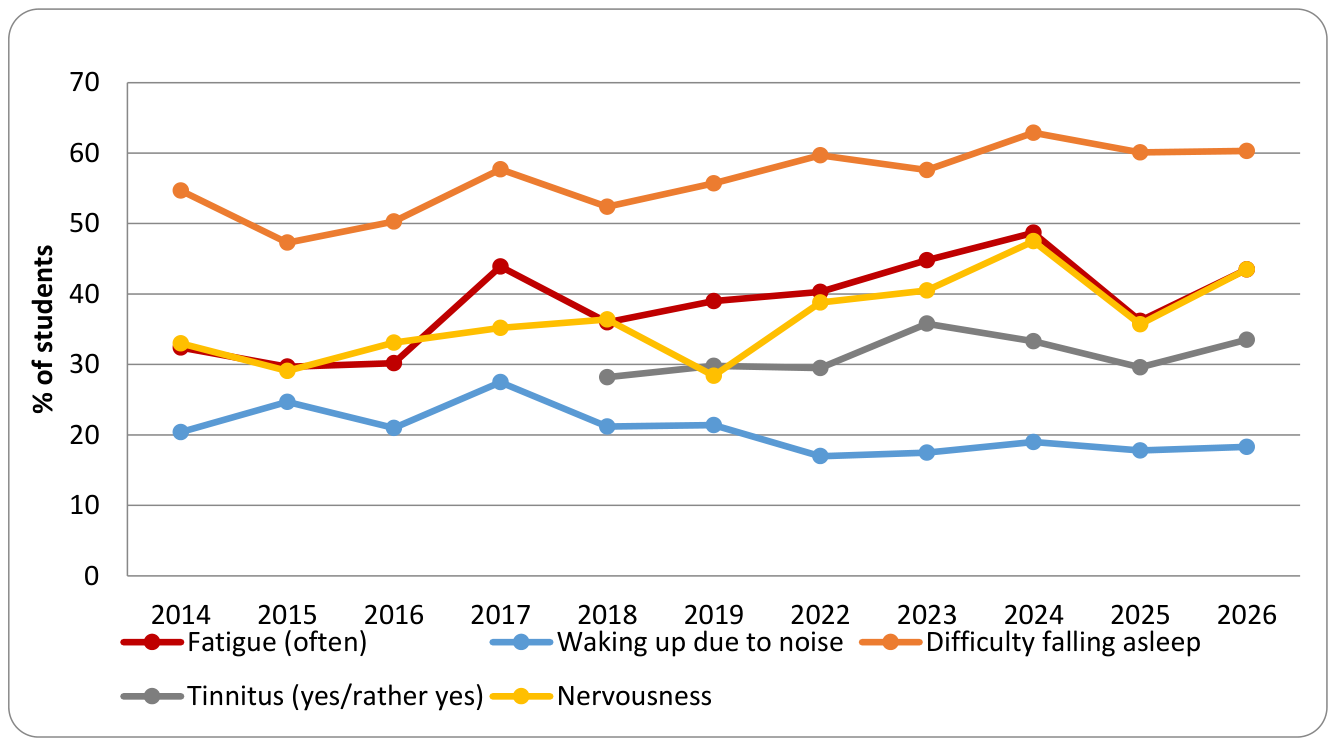
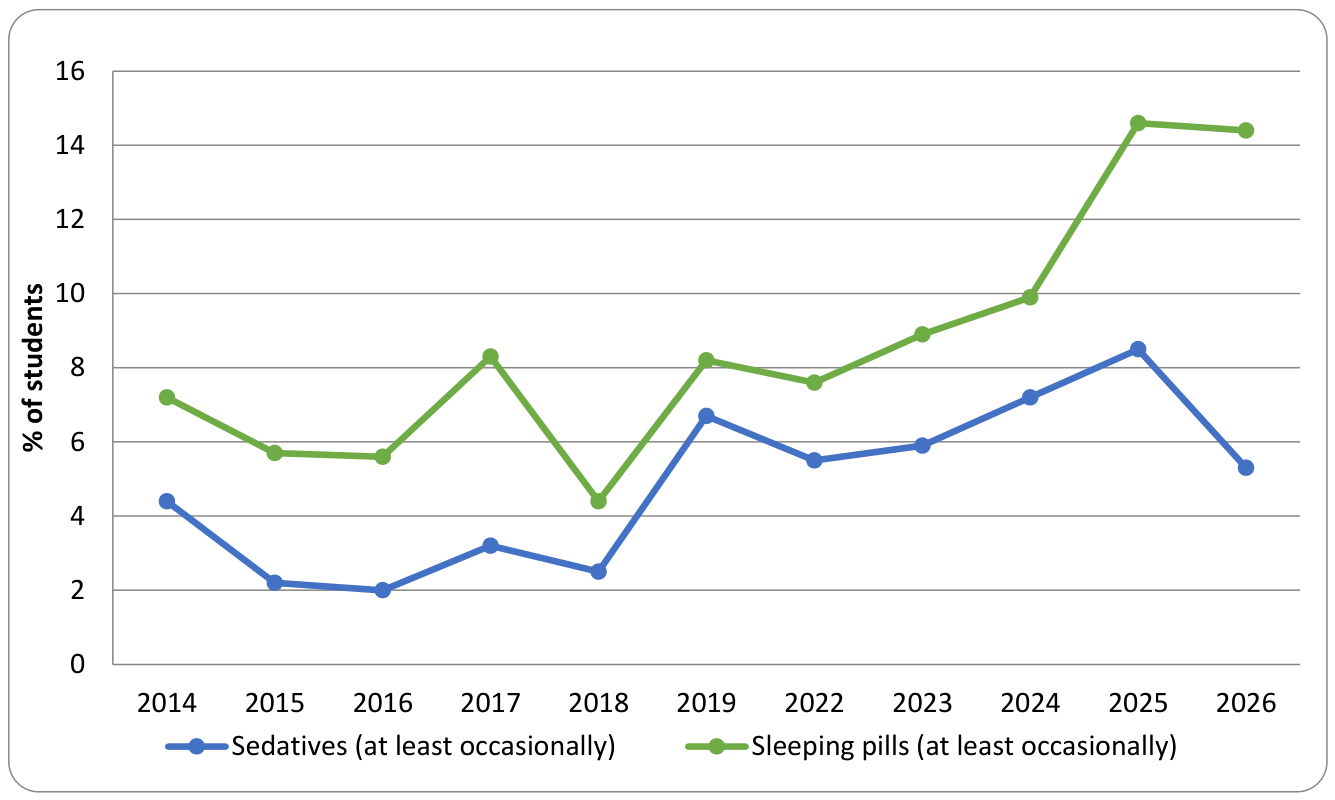
Figure 3.
Trend of health complaints 2014 – 2026 (excluding 2020, 2021).
Figure 4.
Trend of sedatives and sleeping pill use 2014–2026 (excluding 2020,2021).
In contrast, the proportion of students reporting waking up due to noise decreased slightly, from 20.4% to 18.3% (OR per year = 0.97, 95% CI 0.95–0.99, p = 0.006). This decline was statistically significant only among students living in quiet areas (OR per year = 0.95, p = 0.003). No significant temporal trend was observed for tinnitus (OR per year = 1.03, 95% CI 0.99–1.07, p = 0.21; data available from 2018 onwards).
None of the temporal trends differed significantly between noisy and quiet areas for any of the health complaints (all p-values for interaction > 0.05). Nevertheless, students in noisy areas reported fatigue, waking up due to noise, and tinnitus more often than those in quiet areas in every survey wave; the same pattern held for difficulty falling asleep in 10 of the 11 waves. Thus, differences in the prevalence of health complaints between the two area types remained broadly stable over the study period.
4. Discussion
4.1. Overall Findings
This study aimed to investigate the associations between living in self-reported noisy and quiet residential areas and health complaints and health-related behaviours among university students. The findings indicate associations between residential noise exposure and sleep disturbances, fatigue, and impaired well-being among medical students.
We observed a strong association between living in a noisy area and waking up due to noise (OR = 3.13, 95% CI 2.59–3.78), which is consistent with the well-documented effects of nocturnal noise on sleep continuity described by Basner and McGuire (2018) [6]. Difficulty falling asleep (OR = 1.49, 95% CI 1.29–1.72), frequent fatigue (OR = 1.59, 95% CI 1.37–1.85), and tinnitus (OR = 1.38, 95% CI 1.13–1.69) were also associated with living in noisy areas. In contrast, the association with nervousness was weaker and borderline statistically significant (OR = 1.16, 95% CI 1.00–1.35).
The strongest finding was the higher frequency of night-time awakenings in the self-reported noisy area. These findings are consistent with the well-established view that sleep is one of the health outcomes most sensitive to environmental noise, as noise can trigger awakenings and physiological arousals even in the absence of conscious perception [2]. Difficulty falling asleep was also more frequently reported by students living in noisy areas, although the association was weaker and was attenuated more substantially after adjustment for type of residence.
Poor sleep quality is common among university students. In a study by Becker et al. (2018) involving 7,626 college students, 62% were classified as poor sleepers, with a higher prevalence among women [18]. The prevalence of sleep difficulties in our sample was comparable to these findings, and the associations with living in noisy areas remained evident after adjustment for sex, age, smoking status, and alcohol consumption. This is particularly relevant because women were overrepresented in the noisy area (73.4% vs. 66.8%), and sex could otherwise have partly explained the observed differences.
In a sensitivity analysis that additionally accounted for type of temporary residence, the odds ratios for waking up due to noise (OR = 2.77, 95% CI 2.27–3.37) and difficulty falling asleep (OR = 1.31, 95% CI 1.12–1.53) were attenuated, whereas those for fatigue, tinnitus, and nervousness remained similar or increased slightly. Dormitory residence was itself associated with these sleep complaints and was substantially more common among students living in noisy areas. Therefore, some of the observed association between residential area type and sleep disturbances may be attributable to differences in housing conditions rather than to environmental noise alone.
Tinnitus was more frequently reported by students living in noisy areas than by those living in quiet areas (35.6% vs. 28.0%; adjusted OR = 1.38, 95% CI 1.13–1.69). As PLD use during the previous week was also more common in this group (86.9% vs. 80.8%) and median listening time was slightly longer (180 vs. 160 minutes), recreational sound exposure may represent one potential pathway linking the residential environment to auditory symptoms. However, listening volume and headphone type did not differ between the two groups, and the available data do not allow us to disentangle the respective contributions of residential and recreational noise exposure.
In a prospective cohort study of young adults in Germany, Weilnhammer et al. (2022) found that the risk of intermittent tinnitus increased with increasing total leisure noise exposure (OR = 2.04, 95% CI 1.59–2.61 for >90 dB(A) vs. <80 dB(A)), primarily due to nightclub attendance, whereas personal listening device use alone was not associated with tinnitus [19]. Thus, the higher prevalence of tinnitus among students living in noisy areas in our study cannot be attributed to PLD use alone. Similarly, Degeest et al. (2022), in a three-year follow-up study of university students, reported an increasing frequency of temporary tinnitus following leisure noise exposure with more frequent attendance at nightclubs and concerts [20]. From a public health perspective, these findings highlight the importance of addressing not only residential noise exposure but also recreational sound exposure, particularly among young adults.
Students may also use personal listening devices to mask environmental noise: in a qualitative study by Khoza-Shangase et al. (2025) of undergraduate students, noisy study and transport settings were a recurrent reason for increasing the listening volume [21]. This could explain the more frequent and longer use of PLDs in the noisy area, although we could not test it directly.
Students living in noisy areas reported more frequent fatigue and, to a lesser extent, nervousness. One possible explanation is that environmental noise affects well-being partly through sleep disturbances and noise annoyance. In a study involving 720 university students in Plovdiv, Dzhambov et al. (2018) found that noise annoyance mediated the relationship between measured noise exposure, sleep disturbance, and poorer mental health [10]. These findings suggest that the sleep-related and psychological outcomes observed in our study may be interconnected rather than representing independent effects. Noise annoyance and noise sensitivity may further amplify the effects of noise exposure and may themselves be influenced by an individual’s psychological state, suggesting a potentially self-reinforcing cycle rather than a unidirectional relationship [22]. The association with nervousness was relatively weak (adjusted OR = 1.16, 95% CI 1.00–1.35; p close to 0.05). Moreover, as no correction for multiple testing was applied, this finding should be interpreted with caution and considered exploratory.
The prevalence of fatigue, nervousness, and difficulty falling asleep increased in both residential area categories, while the use of sleeping pills doubled (from 7.2% to 14.4%). As the increases were similar in noisy and quiet areas (area × year interaction p > 0.05), they are unlikely to be attributable solely to changes in residential noise exposure. Instead, these trends may reflect a broader increase in the psychological burden among university students. International surveys have shown that approximately one-third of first-year university students meet the criteria for a mental disorder [23], while meta-analytic evidence indicates that the prevalence of depression and anxiety among college students increased during the COVID-19 pandemic [24]. The psychological burden may have remained elevated in subsequent years, potentially contributing to the increases observed in our study. However, data collected online during the pandemic years (2020–2021) were not included in the present analysis and will be evaluated separately.
In contrast, participation in noisy leisure activities, such as going to the cinema, playing a musical instrument, and attending rock and pop concerts, decreased, whereas PLD use and the proportion of PLD users reporting listening at high volumes increased (from 30.3% to 35.9%). These findings suggest that personal listening devices have become an increasingly important source of recreational sound exposure in this population, highlighting the need for preventive interventions promoting safe listening habits.
Qualitative evidence suggests that high-volume listening is sustained by optimistic perceptions of personal risk, peer norms, and noisy surroundings, and that awareness alone is insufficient to change listening behaviour [21]. Preventive programmes targeting students should therefore combine education with behaviourally informed measures, such as volume-limiting features and social-norm campaigns. Psychological approaches aimed at changing perceptions of noise and improving coping strategies, including psychoeducation, mindfulness-based stress reduction, and cognitive behavioural techniques, have also been proposed as complementary measures to noise reduction, although evidence from controlled trials remains limited [22]. Universities may provide an important setting for hearing health promotion by integrating safe listening education into student health programmes and supporting environments that encourage healthier listening practices.
4.2. Strengths and Limitations
The main strengths of this study include the large sample size (n = 3,128), the long observation period covering 11 survey waves over 12 years, and the use of a standardized questionnaire administered consistently in a relatively homogeneous population of fourth-year medical students. The repeated cross-sectional design enabled us to examine not only the associations between residential noise and health complaints but also the consistency of these associations across successive cohorts. Furthermore, the regression models were adjusted for sex, age, smoking status, and alcohol consumption, while a sensitivity analysis additionally accounted for type of temporary residence. Following these adjustments, the associations between living in a noisy area and health complaints remained statistically significant, with the exception of nervousness, for which the association was borderline statistically significant. The consistency of the findings across successive cohorts over an extended period provides further support for the robustness of the observed associations.
This study also has several limitations. First, its cross-sectional design precludes causal interpretation of the associations between residential noise and health complaints and does not allow the temporal sequence of exposure and outcomes to be established. Reverse causality is also possible, as students experiencing poorer sleep or higher stress levels may be more sensitive to noise and more likely to perceive their residential environment as noisy [22]. Furthermore, because different students participated in each survey wave, the observed temporal trends reflect differences between successive cohorts rather than changes within individuals and may partly be attributable to differences in cohort composition.
Second, the classification of residential areas as noisy or quiet was based on students’ subjective assessments rather than objective noise measurements. As both exposure and health complaints were self-reported by the same participants, common-method bias may have contributed to the observed associations. Moreover, the direction and extent of potential exposure misclassification cannot be determined. Although adjustment for several potential confounders was performed, residual confounding by other factors, such as housing quality, neighbourhood characteristics, and socioeconomic conditions, cannot be excluded.
Other limitations include the single-faculty sample, which restricts the generalizability of the findings to other student populations and age groups, and the exclusion of data collected online in 2020–2021 because of the change in data collection method. Consequently, the temporal analysis was based on 11 survey waves, with a gap during this period. Tinnitus was assessed only from 2018 onwards, and health complaints were self-reported rather than clinically verified.
5. Conclusions
In this repeated cross-sectional study of fourth-year medical students surveyed between 2014 and 2026, living in a self-reported noisy area was associated with more frequent night-time awakenings, difficulty falling asleep, fatigue, and tinnitus, and, less consistently, with nervousness. Differences between students living in noisy and quiet areas were observed across nearly all survey waves. Fatigue, nervousness, difficulty falling asleep, and the use of sleeping pills increased over time in both groups, suggesting a broader increase in the psychological burden among students that was not specific to residential noise exposure. The use of personal listening devices and listening at high volumes increased, whereas participation in several noisy leisure activities declined.
Given the cross-sectional design and reliance on self-reported exposure, causal conclusions cannot be drawn. From a public health perspective, health promotion programmes in universities should address sleep health and stress management alongside safe listening practices. Particular attention should also be paid to housing conditions, especially in student dormitories. Future studies should combine objective environmental noise measurements with validated assessments of sleep quality, psychological well-being, and listening behaviour.
These findings highlight the need for a comprehensive public health approach that integrates environmental noise reduction, healthier student housing conditions, and health promotion strategies aimed at improving sleep, mental well-being, and hearing health.
Funding
This research was supported by KEGA Grant No. 003UPJŠ-4/2024 “Updating and innovation of the Public Health study program in the field of prevention of chronic non-communicable diseases” and KEGA Grant No. 029UK-4/2025 „Implementation of New Educational Technologies in Innovation of Teaching in the Field of Health Protection and Promotion for Medical Students”.
Institutional Review Board Statement
The study design was approved by the Ethics Committee of the Faculty of Medicine, Comenius University and University Hospital in Bratislava at the start of the study in 2014 [add approval number and date] and subsequently renewed; the most recent approval was granted on 28 April 2025 (No. 6/2025).
Informed Consent Statement
Informed consent was obtained from all participants prior to their inclusion in the study. No financial or other incentives were offered for participation.
Data Availability Statement
The data that we used for the current study are available from the first author upon reasonable request.
Conflicts of Interest
The authors declare no conflicts of interest.
References
- Basner, M.; Babisch, W.; Davis, A.; Brink, M.; Clark, C.; Janssen, S.; Stansfeld, S. Auditory and Non-Auditory Effects of Noise on Health. Lancet 2014, 383, 1325–1332. [Google Scholar] [CrossRef]
- WHO Regional Office for Europe. Environmental Noise Guidelines for the European Region; WHO Regional Office for Europe: Copenhagen, Denmark, 2018. [Google Scholar]
- European Environment Agency. Environmental Noise in Europe 2025; EEA Report 05/2025; European Environment Agency: Copenhagen, Denmark, 2025. [Google Scholar]
- WHO Regional Office for Europe. Disability Weights for Noise-Related Health States in the WHO European Region; WHO/EURO:2024-9196-48968-72969; WHO Regional Office for Europe: Copenhagen, Denmark, 2024; Available online: https://www.who.int/europe/publications/i/item/WHO-EURO-2024-9196-48968-72969.
- Gong, X.; Fenech, B.; Blackmore, C.; et al. Association between Noise Annoyance and Mental Health Outcomes: A Systematic Review and Meta-Analysis. Int. J. Environ. Res. Public Health 2022, 19, 2696. [Google Scholar] [CrossRef] [PubMed]
- Basner, M.; McGuire, S. WHO Environmental Noise Guidelines for the European Region: A Systematic Review on Environmental Noise and Effects on Sleep. Int. J. Environ. Res. Public Health 2018, 15, 519. [Google Scholar] [CrossRef] [PubMed]
- Smith, M.G.; Cordoza, M.; Basner, M. Environmental Noise and Effects on Sleep: An Update to the WHO Systematic Review and Meta-Analysis. Environ. Health Perspect. 2022, 130, 076001. [Google Scholar] [CrossRef] [PubMed]
- Jensen, H.A.R.; Rasmussen, B.; Ekholm, O. Neighbour and Traffic Noise Annoyance: A Nationwide Study of Associated Mental Health and Perceived Stress. Eur. J. Public Health 2018, 28, 1050–1055. [Google Scholar] [CrossRef] [PubMed]
- Jensen, H.A.R.; Rasmussen, B.; Ekholm, O. Neighbour Noise Annoyance Is Associated with Various Mental and Physical Health Symptoms: Results from a Nationwide Study among Individuals Living in Multi-Storey Housing. BMC Public Health 2019, 19, 1508. [Google Scholar] [CrossRef] [PubMed]
- Dzhambov, A.M.; Markevych, I.; Tilov, B.; Arabadzhiev, Z.; Stoyanov, D.; Gatseva, P.; Dimitrova, D.D. Pathways Linking Residential Noise and Air Pollution to Mental Ill-Health in Young Adults. Environ. Res. 2018, 166, 458–465. [Google Scholar] [CrossRef] [PubMed]
- Sobotová, Ľ.; Jurkovičová, J.; Štefaniková, Z.; Ševčíková, Ľ.; Ághová, Ľ. Community Response to Environmental Noise and the Impact on Cardiovascular Risk Score. Sci. Total Environ. 2010, 408, 1260–1266. [Google Scholar] [CrossRef] [PubMed]
- Argalášová, Ľ.; Filová, A.; Hirošová, K.; et al. The Risks of Social Noise Exposure in the Vulnerable Population in Slovakia. Arch. Acoust. 2016, 41, 535–541. [Google Scholar] [CrossRef]
- Filová, A.; Jurkovičová, J.; Hirošová, K.; et al. Social Noise Exposure in a Sample of Slovak University Students. Int. J. Environ. Res. Public Health 2020, 17, 324. [Google Scholar] [CrossRef] [PubMed]
- Jakovljević, B.; Belojević, G.; Paunović, K.; Stojanov, V. Road Traffic Noise and Sleep Disturbances in an Urban Population: Cross-Sectional Study. Croat. Med. J. 2006, 47, 125–133. [Google Scholar] [PubMed]
- Paunović, K.; Jakovljević, B.; Belojević, G. Predictors of Noise Annoyance in Noisy and Quiet Urban Streets. Sci. Total Environ. 2009, 407, 3707–3711. [Google Scholar] [CrossRef] [PubMed]
- Ristovska, G.; Gjorgjev, D.; Polozhani, A.; Kočubovski, M.; Kendrovski, V. Environmental Noise and Annoyance in Adult Population of Skopje: A Cross-Sectional Study. Arh. Hig. Rada Toksikol. 2009, 60, 349–355. [Google Scholar] [CrossRef] [PubMed]
- Fields, J.M.; De Jong, R.G.; Gjestland, T.; et al. Standardized General-Purpose Noise Reaction Questions for Community Noise Surveys: Research and a Recommendation. J. Sound Vib. 2001, 242, 641–679. [Google Scholar] [CrossRef]
- Becker, S.P.; Jarrett, M.A.; Luebbe, A.M.; Garner, A.A.; Burns, G.L.; Kofler, M.J. Sleep in a Large, Multi-University Sample of College Students: Sleep Problem Prevalence, Sex Differences, and Mental Health Correlates. Sleep Health 2018, 4, 174–181. [Google Scholar] [CrossRef] [PubMed]
- Weilnhammer, V.; Gerstner, D.; Huß, J.; Schreiber, F.; Alvarez, C.; Steffens, T.; Herr, C.; Heinze, S. Exposure to Leisure Noise and Intermittent Tinnitus among Young Adults in Bavaria: Longitudinal Data from a Prospective Cohort Study. Int. J. Audiol. 2022, 61, 89–96. [Google Scholar] [CrossRef]
- Degeest, S.; Corthals, P.; Keppler, H. Evolution of Hearing in Young Adults: Effects of Leisure Noise Exposure, Attitudes, and Beliefs toward Noise, Hearing Loss, and Hearing Protection Devices. Noise Health 2022, 24, 61–74. [Google Scholar] [CrossRef] [PubMed]
- Khoza-Shangase, K.; Mokhethi, K. Personal Listening Devices and Hearing Health: The Psychological and Social Factors Influencing Undergraduate Students’ Safe Listening Behaviors. Int. J. Behav. Med. 2025. Available online: https://www.who.int/europe/publications/i/item/WHO-EURO-2024-9196-48968-72969. [CrossRef]
- Wicki, B.; Röösli, M.; Hahad, O. Lärm und psychische Gesundheit: Epidemiologie, Mechanismen und Handlungsansätze [Noise and Mental Health: Epidemiology, Mechanisms, and Interventions]. Z. Psychosom. Med. Psychother. 2026, 72, 248–259. [Google Scholar] [CrossRef] [PubMed]
- Auerbach, R.P.; Mortier, P.; Bruffaerts, R.; Alonso, J.; Benjet, C.; Cuijpers, P.; Demyttenaere, K.; Ebert, D.D.; Green, J.G.; Hasking, P.; et al. The WHO World Mental Health Surveys International College Student Project: Prevalence and Distribution of Mental Disorders. J. Abnorm. Psychol. 2018, 127, 623–638. [Google Scholar] [CrossRef] [PubMed]
- Li, Y.; Wang, A.; Wu, Y.; Han, N.; Huang, H. Impact of the COVID-19 Pandemic on the Mental Health of College Students: A Systematic Review and Meta-Analysis. Front. Psychol. 2021, 12, 669119. [Google Scholar] [CrossRef] [PubMed]
Figure 1.
Spearman correlations among health complaints and medication use. Higher values indicate more severe complaints or more frequent medication use. * p < 0.05, ** p < 0.01, *** p < 0.001.
Figure 1.
Spearman correlations among health complaints and medication use. Higher values indicate more severe complaints or more frequent medication use. * p < 0.05, ** p < 0.01, *** p < 0.001.
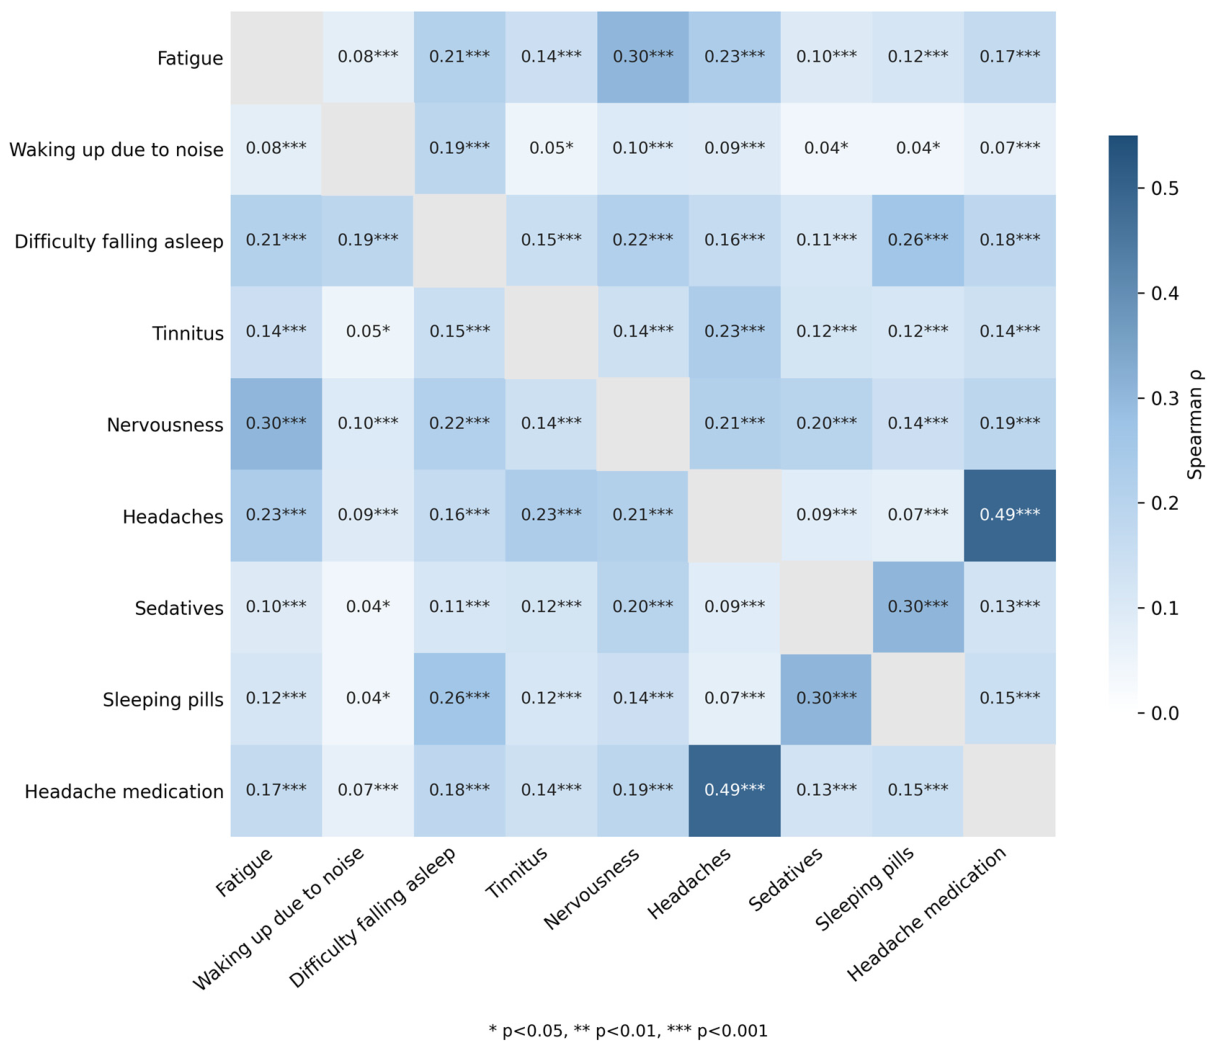
Figure 2.
Trend of leisure activities 2014–2026 (excluding 2020,2021).
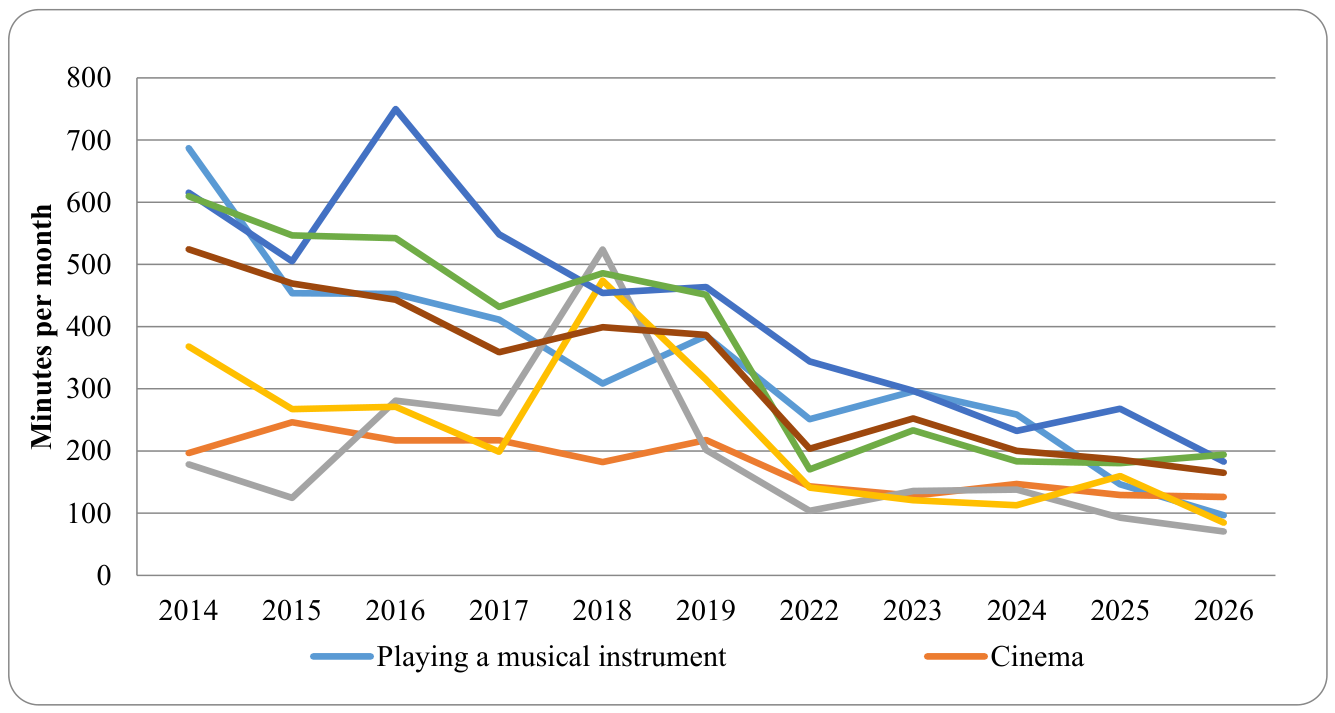

Table 1.
Study Sample Characteristics.
| Variable | Total | Noisy area | Quiet area | p-value |
| N | 3128 | 1481 | 1647 | |
| Age, years, mean (SD) | 23.2 (1.8) | 23.2 (1.6) | 23.2 (1.9) | 0.748 |
| Age, years, median (IQR) | 23 (22–24) | 23 (22–24) | 23 (22–24) | |
| Sex | <0.001 | |||
| Male | 940 (30.1%) | 394 (26.6%) | 546 (33.2%) | |
| Female | 2186 (69.9%) | 1087 (73.4%) | 1099 (66.8%) | |
| Missing | 2 | 0 | 2 | |
| Smoking | 0.023 | |||
| Never smoked | 2380 (76.6%) | 1152 (78.2%) | 1228 (75.2%) | |
| Former smoker (>6 months) | 354 (11.4%) | 170 (11.5%) | 184 (11.3%) | |
| Current smoker, <20 cigarettes/day | 355 (11.4%) | 148 (10.0%) | 207 (12.7%) | |
| Current smoker, ≥20 cigarettes/day | 17 (0.5%) | 4 (0.3%) | 13 (0.8%) | |
| Current smoker (any), yes vs. no | 372 (12.0%) | 152 (10.3%) | 220 (13.5%) | 0.008 |
| Missing | 22 | 7 | 15 | |
| Alcohol consumption | 0.017 | |||
| None | 300 (9.6%) | 120 (8.1%) | 180 (11.0%) | |
| Occasionally | 2726 (87.3%) | 1318 (89.1%) | 1408 (85.7%) | |
| Daily, 1–2 drinks | 84 (2.7%) | 38 (2.6%) | 46 (2.8%) | |
| Daily, larger amounts | 12 (0.4%) | 3 (0.2%) | 9 (0.5%) | |
| At least occasionally, yes vs. no | 2822 (90.4%) | 1359 (91.9%) | 1463 (89.0%) | 0.009 |
| Missing | 6 | 2 | 4 | |
| Temporary residence | <0.001 | |||
| Dormitory | 1658 (53.2%) | 1046 (70.8%) | 612 (37.3%) | |
| Private housing | 682 (21.9%) | 232 (15.7%) | 450 (27.4%) | |
| At home (no temporary residence) | 777 (24.9%) | 199 (13.5%) | 578 (35.2%) | |
| Missing | 11 | 4 | 7 | |
| Satisfaction with the residential environment | <0.001 | |||
| Satisfied | 1781 (57.1%) | 494 (33.5%) | 1287 (78.2%) | |
| Partially satisfied | 1087 (34.8%) | 797 (54.0%) | 290 (17.6%) | |
| Dissatisfied | 252 (8.1%) | 184 (12.5%) | 68 (4.1%) | |
| Missing | 8 | 6 | 2 | |
| Personal listening devices (PLDs) | ||||
| Use of PLDs in the previous week | <0.001 | |||
| No | 511 (16.3%) | 194 (13.1%) | 317 (19.2%) | |
| Yes | 2617 (83.7%) | 1287 (86.9%) | 1330 (80.8%) | |
| Missing | 0 | 0 | 0 | |
| Type of headphones (usual) | 0.255 | |||
| In-ear | 2460 (87.3%) | 1200 (88.0%) | 1260 (86.5%) | |
| Over-ear | 359 (12.7%) | 163 (12.0%) | 196 (13.5%) | |
| Missing | 309 | 118 | 191 | |
| Typical listening volume (scale 1–5; PLD users) | 0.956 | |||
| Low (1–2) | 345 (13.2%) | 172 (13.4%) | 173 (13.1%) | |
| Moderate (3) | 1341 (51.4%) | 657 (51.2%) | 684 (51.7%) | |
| Loud (4–5) | 922 (35.4%) | 455 (35.4%) | 467 (35.3%) | |
| Missing | 9 | 3 | 6 | |
| Listening time in the previous week among PLD users, min | n = 2570 | n = 1265 | n = 1305 | |
| Median (IQR) | 180 (80–360) | 180 (90–360) | 160 (60–330) | 0.024 |
| Mean (SD) | 296 (382) | 309 (402) | 283 (362) | 0.083 |
| Notes: values are n (%) unless stated otherwise. p-values: chi-square test (categorical variables); Mann–Whitney U test (age; listening time, median); Welch t-test (listening time, mean). Percentages are calculated from valid responses. Listening time is reported in minutes among PLD users. IQR, interquartile range; SD, standard deviation. Area type (noisy/quiet) is based on participants’ self-assessment. Bold, p < 0.05. The p-values in the smoking and alcohol section rows refer to the distribution across all categories; the rows ‘Current smoker (any)’ and ‘At least occasionally’ represent 2 × 2 comparisons, for which the chi-square test with continuity correction was used. PLD use and listening time refer to the previous week. Listening time and typical listening volume were assessed only among students who reported PLD use during the previous week, whereas information on the type of headphones used was collected from all students. | ||||
Table 2.
Crude (bivariate) and adjusted (multivariable) odds ratios (95% confidence intervals) of health complaints.
Table 2.
Crude (bivariate) and adjusted (multivariable) odds ratios (95% confidence intervals) of health complaints.
| Predictor | Fatigue (often) | Waking up due to noise | Difficulty falling asleep | Nervousness | Tinnitus |
| A. Crude OR (95% CI) | |||||
| Noisy vs. quiet area | 1.58 (1.37–1.83) | 3.14 (2.60–3.78) | 1.49 (1.29–1.72) | 1.18 (1.02–1.37) | 1.41 (1.15–1.72) |
| Female vs. male sex | 1.26 (1.07–1.48) | 1.25 (1.03–1.52) | 1.27 (1.09–1.48) | 1.50 (1.27–1.77) | 1.30 (1.04–1.62) |
| Age (per year) | 0.97 (0.93–1.02) | 1.03 (0.98–1.08) | 1.01 (0.97–1.05) | 0.99 (0.95–1.03) | 1.02 (0.96–1.09) |
| Former smoker vs. never smoked | 1.32 (1.05–1.65) | 0.76 (0.56–1.02) | 1.55 (1.23–1.96) | 1.36 (1.08–1.71) | 1.65 (1.23–2.22) |
| Smoking <20 cigarettes/day vs. never smoked | 1.58 (1.26–1.98) | 0.86 (0.64–1.14) | 1.47 (1.16–1.85) | 1.25 (0.99–1.57) | 1.47 (1.08–2.01) |
| Alcohol occasionally vs. none | 1.21 (0.94–1.55) | 1.11 (0.81–1.50) | 1.22 (0.96–1.55) | 1.23 (0.95–1.58) | 1.26 (0.90–1.75) |
| Alcohol daily 1–2 drinks vs. none | 1.84 (1.12–3.03) | 1.45 (0.81–2.61) | 1.68 (1.01–2.79) | 1.91 (1.16–3.16) | 1.28 (0.63–2.62) |
| B. Adjusted OR (95% CI): adjusted for area, sex, age, smoking, and alcohol consumption | |||||
| Noisy vs. quiet area | 1.59 (1.37–1.85) | 3.13 (2.59–3.78) | 1.49 (1.29–1.72) | 1.16 (1.00–1.35) | 1.38 (1.13–1.69) |
| Female vs. male sex | 1.30 (1.10–1.53) | 1.16 (0.94–1.42) | 1.31 (1.12–1.54) | 1.57 (1.32–1.86) | 1.32 (1.05–1.65) |
| Age (per year) | 0.97 (0.92–1.01) | 1.04 (0.99–1.09) | 1.01 (0.97–1.05) | 0.99 (0.95–1.03) | 1.03 (0.97–1.09) |
| Former smoker vs. never smoked | 1.36 (1.08–1.71) | 0.74 (0.55–1.01) | 1.59 (1.25–2.01) | 1.41 (1.12–1.77) | 1.67 (1.24–2.25) |
| Smoking <20 cigarettes/day vs. never smoked | 1.69 (1.34–2.13) | 0.91 (0.67–1.23) | 1.53 (1.21–1.94) | 1.30 (1.03–1.64) | 1.55 (1.13–2.13) |
| Alcohol occasionally vs. none | 1.06 (0.82–1.37) | 1.03 (0.75–1.41) | 1.09 (0.85–1.39) | 1.12 (0.87–1.45) | 1.13 (0.80–1.58) |
| Alcohol daily 1–2 drinks vs. none | 1.50 (0.90–2.51) | 1.47 (0.80–2.72) | 1.41 (0.84–2.38) | 1.79 (1.07–2.99) | 1.00 (0.48–2.09) |
| N | 3095 | 3084 | 3096 | 3095 | 1790 |
| C. Sensitivity analysis: additionally adjusted for temporary residence | |||||
| Noisy vs. quiet area | 1.60 (1.37–1.88) | 2.77 (2.27–3.37) | 1.31 (1.12–1.53) | 1.21 (1.04–1.42) | 1.48 (1.19–1.84) |
| Dormitory vs. at home | 0.94 (0.77–1.13) | 1.62 (1.26–2.09) | 1.59 (1.33–1.92) | 0.86 (0.71–1.04) | 0.79 (0.61–1.03) |
| Private housing vs. at home | 0.85 (0.68–1.06) | 1.27 (0.94–1.71) | 1.32 (1.07–1.63) | 0.94 (0.76–1.17) | 0.89 (0.67–1.19) |
| N | 3084 | 3075 | 3085 | 3084 | 1783 |
Notes: OR, odds ratio; CI, confidence interval; Bold, p < 0.05. Crude ORs are from separate univariable logistic regressions; adjusted ORs (AORs)(panel B) are from one multivariable model including area (self-reported), sex, age, smoking and alcohol consumption; panel C additionally includes temporary residence (reference: living at home). All models use complete cases. Smokers of ≥20 cigarettes/day (n = 17) and daily heavier drinkers (n = 12) were included in the models but are not shown because of very small numbers. Reference categories: quiet area, male, never smoked, no alcohol. Fatigue, often vs. occasionally/never; waking up due to noise and difficulty falling asleep, at least sometimes vs. never; nervousness, yes vs. no; tinnitus, yes/rather yes vs. no/rather no (assessed from 2018 only).
Table 3.
Health complaints and medication use by area type.
| Variable | Total | Noisy area | Quiet area | p-value |
| N | 3128 | 1481 | 1647 | |
| Fatigue (feeling tired and exhausted) | <0.001 | |||
| Never | 86 (2.8%) | 28 (1.9%) | 58 (3.5%) | |
| Occasionally | 1838 (58.8%) | 800 (54.1%) | 1038 (63.1%) | |
| Often | 1202 (38.5%) | 652 (44.1%) | 550 (33.4%) | |
| Missing | 2 | 1 | 1 | |
| Waking up due to noise | <0.001 | |||
| No | 2477 (79.5%) | 1036 (70.1%) | 1441 (87.9%) | |
| Sometimes | 583 (18.7%) | 405 (27.4%) | 178 (10.9%) | |
| Regularly | 56 (1.8%) | 36 (2.4%) | 20 (1.2%) | |
| Missing | 12 | 4 | 8 | |
| Difficulty falling asleep | <0.001 | |||
| No | 1373 (43.9%) | 576 (38.9%) | 797 (48.4%) | |
| Occasionally | 1443 (46.1%) | 721 (48.7%) | 722 (43.8%) | |
| Regularly | 311 (9.9%) | 183 (12.4%) | 128 (7.8%) | |
| Missing | 1 | 1 | 0 | |
| Nervousness | 0.025 | |||
| No | 1986 (63.5%) | 909 (61.5%) | 1077 (65.4%) | |
| Yes | 1140 (36.5%) | 570 (38.5%) | 570 (34.6%) | |
| Missing | 2 | 2 | 0 | |
| Tinnitus | <0.001 | |||
| No | 420 (23.3%) | 175 (20.7%) | 245 (25.7%) | |
| Rather no, sporadically | 813 (45.1%) | 370 (43.7%) | 443 (46.4%) | |
| Rather yes, irregularly | 428 (23.8%) | 218 (25.8%) | 210 (22.0%) | |
| Yes, regularly | 140 (7.8%) | 83 (9.8%) | 57 (6.0%) | |
| Missing | 1327 | 635 | 692 | |
| Use of sedatives during the day | 0.712 | |||
| No | 2977 (95.2%) | 1413 (95.5%) | 1564 (95.0%) | |
| Occasionally | 117 (3.7%) | 51 (3.4%) | 66 (4.0%) | |
| Regularly | 32 (1.0%) | 15 (1.0%) | 17 (1.0%) | |
| Missing | 2 | 2 | 0 | |
| Use of sleeping pills | 0.575 | |||
| No | 2867 (91.7%) | 1350 (91.2%) | 1517 (92.2%) | |
| Occasionally | 233 (7.5%) | 118 (8.0%) | 115 (7.0%) | |
| Regularly | 26 (0.8%) | 12 (0.8%) | 14 (0.9%) | |
| Missing | 2 | 1 | 1 | |
| Use of headache medication | 0.135 | |||
| No | 1628 (52.1%) | 743 (50.3%) | 885 (53.8%) | |
| Occasionally | 1367 (43.8%) | 674 (45.6%) | 693 (42.1%) | |
| Regularly | 128 (4.1%) | 61 (4.1%) | 67 (4.1%) | |
| Missing | 5 | 3 | 2 | |
| Notes: values are n (%). P-values: chi-square test comparing the distribution of response categories between noisy and quiet areas. Percentages are calculated from valid responses. Area type is based on participants’ self-assessment. Tinnitus was not asked in the earliest survey years, which explains the lower number of valid responses. Out-of-range or non-numeric values were treated as missing or recoded to the nearest valid category. | ||||
Table 4.
Trends in health complaints and medication use over the survey period (2014–2026), all students.
Table 4.
Trends in health complaints and medication use over the survey period (2014–2026), all students.
| Outcome | 2014, % | 2026, % | OR per year (95% CI) | p (trend) | p (area × year) |
| Fatigue (often) | 32.4% | 43.5% | 1.05 (1.03–1.07) | <0.001 | 0.29 |
| Waking up due to noise | 20.4% | 18.3% | 0.97 (0.95–0.99) | 0.006 | 0.07 |
| Difficulty falling asleep | 54.7% | 60.3% | 1.04 (1.02–1.06) | <0.001 | 0.34 |
| Tinnitus | 28.2% | 33.5% | 1.03 (0.99–1.07) | 0.21 | 0.52 |
| Nervousness | 33.0% | 43.5% | 1.05 (1.03–1.07) | <0.001 | 0.65 |
| Sedatives | 4.4% | 5.3% | 1.09 (1.05–1.14) | <0.001 | 0.46 |
| Sleeping pills | 7.2% | 14.4% | 1.08 (1.04–1.11) | <0.001 | 0.94 |
| Headache medication | 43.8% | 49.8% | 1.05 (1.03–1.07) | <0.001 | 0.08 |
Notes: OR, odds ratio; CI, confidence interval. Percentages are for the first and the last survey year (2014 and 2026; tinnitus 2018 and 2026, as it was assessed from 2018 only). OR per year is from logistic regression with survey year as a continuous predictor, using all 11 survey waves (data collected online in 2020–2021 are not included). p (interaction) tests whether the trend differs between students living in noisy and quiet areas (area × year). Complaints are defined as in Table 2; medication use, at least occasionally. Bold, p < 0.05.
Disclaimer/Publisher’s Note: The statements, opinions and data contained in all publications are solely those of the individual author(s) and contributor(s) and not of MDPI and/or the editor(s). MDPI and/or the editor(s) disclaim responsibility for any injury to people or property resulting from any ideas, methods, instructions or products referred to in the content. |
© 2026 by the authors. Licensee MDPI, Basel, Switzerland. This article is an open access article distributed under the terms and conditions of the Creative Commons Attribution (CC BY) license (http://creativecommons.org/licenses/by/4.0/).
Copyright: This open access article is published under a Creative Commons CC BY 4.0 license, which permit the free download, distribution, and reuse, provided that the author and preprint are cited in any reuse.