

Submitted:
06 November 2026
Posted:
09 November 2026
You are already at the latest version
Abstract
Background. Immune checkpoint inhibitors changed cancer treatment, and the patents behind them shape who can develop the next generation of these drugs. China’s role in checkpoint drug development and licensing has grown quickly, but its share of checkpoint patenting, where Chinese applicants seek protection and what they protect have not been measured systematically.Methods. We analysed 3,320 patent documents on immune checkpoint therapy exported from Lens.org in January 2024 (application years 1997–2023). We measured the share of documents with Chinese and US applicants over time, the patent office where each document was filed, the size of its patent family, and what each country protects, using keyword labels for checkpoint targets and therapeutic strategies checked against 200 hand-coded documents. We tested the main result with five robustness checks. Results. The share of documents with a Chinese applicant rose from 21.6% (95% CI 16.8–27.3) in 2015–16 to 39.1% (36.2–41.9) in 2020–21, while the US share fell from 50.8% to 35.4%; China overtook the United States in 2020. China’s share also nearly doubled outside the Chinese patent office (9.1% to 17.7%; p = 0.004). Yet in 2010–2021, 70.1% of Chinese documents were filed in the Chinese office, Chinese applicants used the international PCT route half as often as US applicants (13.5% vs 26.9%), and Chinese patent families were smaller (median 2 vs 7 documents). Chinese documents more often named PD-1 (55.5% vs 42.9%) and PD-L1 (44.6% vs 30.5%) and more often described bispecific molecules (10.6% vs 4.2%), including 19 of the 21 PD-1/PD-L1 × VEGF bispecific documents. US documents more often described combination therapies (53.8% vs 33.5%) and CTLA-4 (14.6% vs 8.7%). Conclusions. China became the largest source of immune checkpoint patent filings in 2020. Most of its filings protect the home market and focus on the PD-1 axis and bispecific formats, the same formats that later drove large international licensing deals. An open interactive explorer with all data is available at cognosx.ca/dashboards/immune-checkpoint.
Keywords:
immune checkpoint inhibitors
; PD-1
; patents
; China
; bispecific antibodies
; patent landscape
; health policy
Introduction
Immune checkpoint inhibitors that block CTLA-4, PD-1 and PD-L1 are now standard treatment for many cancers. Their development has always been tied to patents: a small number of foundational patents decided who could sell the first antibodies, and later filings on new targets, combinations, formulations and biomarkers decide who controls the next steps [2,3,4]. Patent records therefore give an early view of where innovation in this field is going, often years before products reach the clinic.
The geography of this innovation is changing. Chinese companies built many PD-1 and PD-L1 programmes, with development strategies that differ from those of global companies [5]. Across all drugs, the share of first launches that took place in China rose from 3.3% in 2004 to 28.7% in 2024 [6]; since 2023, China’s regulator has approved more novel oncology drugs each year than the US Food and Drug Administration, although the United States still leads in first-in-class approvals [7,8]. A growing share of the compounds that enter US phase 3 trials also comes from China, much of it from young companies [9]. Chinese companies have also become a major source of licensed drug candidates: deals signed by companies in Greater China reached US$137.7 billion in 2025, almost ten times the 2021 value [10].
PD-1-based bispecific antibodies are a visible part of this shift. In 2022, Akeso licensed ivonescimab, a PD-1 × VEGF bispecific antibody, to Summit Therapeutics in a deal worth up to US$5 billion [11]. In a Chinese phase 3 trial, ivonescimab doubled progression-free survival compared with pembrolizumab in PD-L1-positive non-small cell lung cancer (median 11.1 vs 5.8 months) [12], and an interim analysis in 2026 reported longer overall survival [13]. The US Food and Drug Administration is reviewing ivonescimab for EGFR-mutant lung cancer, with a decision expected in November 2026 [14]. Other PD-1 or PD-L1 × VEGF bispecifics developed in China were licensed to Merck, Pfizer and AbbVie between 2024 and 2026 [15]. At the same time, core patents on pembrolizumab, the best-selling checkpoint inhibitor, start to expire in 2028, and its maker is moving patients to a new subcutaneous form [16].
Patent landscape studies of checkpoint inhibitors have mostly described the early, US-led period or reviewed selected patents [2,3,4]. Less is known about how fast Chinese applicants have grown, whether this growth reaches beyond China’s own patent office, and whether Chinese and US applicants protect the same kinds of inventions. These questions matter because patent counts from China can be inflated by domestic incentives and do not always reflect international reach [17]. They also matter for companies looking for partners, for investors, and for policy makers who track technological capacity.
This short report answers three questions with patent data up to 2023, using a method we previously applied to phage therapy [1]:
- How has the share of checkpoint patent documents with Chinese and US applicants changed?
- Where do Chinese and US applicants seek protection?
- What do they protect: which checkpoint targets, and which therapeutic strategies?
All results can be explored further, by year, target, strategy and applicant type, in an open interactive explorer (cognosx.ca/dashboards/immune-checkpoint).
Methods
Data
We searched Lens.org [19] on 28 January 2024 for patent documents that mention approved or investigational checkpoint inhibitors (for example pembrolizumab, nivolumab, ipilimumab, atezolizumab, camrelizumab, tislelizumab, toripalimab), checkpoint inhibitor terms (“immune checkpoint inhibitor”, “anti-PD-1”, “anti-PD-L1”, “anti-CTLA-4”) or brand names (for example Keytruda, Opdivo, Yervoy). The full query is in Supplementary Table S1. The search returned 3,439 documents. We removed 61 without a title or abstract and 58 whose title and abstract repeated those of another document, leaving 3,320 documents with application years 1997–2023. The export contains about one document per patent family (3,262 distinct first priority filings). We cleaned applicant names, assigned each applicant a country and a type (commercial, academic or research, individual, government), and grouped legal status into granted or in force, pending, discontinued or expired, and other.
Measures
A document counts for a country when at least one applicant has an address in that country. Of the 3,226 documents with a known applicant country, 1,158 had a Chinese applicant and 1,304 a US applicant; only 12 had both. For comparisons between countries we used the complete application years 2010–2021, because patents are published about 18 months after filing and the 2022–2023 counts are incomplete. For the composition analyses we compared documents with Chinese but no US applicants (n = 780) with documents with US but no Chinese applicants (n = 962).
Filing route is the office where the document was filed: the Chinese office, the international Patent Cooperation Treaty route (WIPO, “WO”), the US office, or other offices. Because a filing route describes only one document, we also used the simple patent family size reported by Lens.org (the number of documents that share the same priority filings) as a measure of geographic reach. A family of one document has not been extended to any other office.
Checkpoint targets (PD-1, PD-L1, CTLA-4, LAG-3, TIM-3, TIGIT) and therapeutic strategies (combination therapy, bispecific or multispecific molecule, biomarker or diagnostic, cell therapy, formulation or delivery, small molecule) were labelled with keyword rules on titles and abstracts (Supplementary Table S2). A document can carry several labels. Because many Chinese abstracts are machine-translated, we checked the rules on samples from both countries and widened the combination rule to include phrasing such as “combined for use” and “synergistic”. PD-1 or PD-L1 × VEGF bispecifics are documents with a PD-1 or PD-L1 label, a bispecific label and the term “VEGF”.
To check label accuracy, the author coded a random sample of 200 documents from 2010–2021 (100 with Chinese and 100 with US applicants) without seeing the rule labels. Agreement was high for every label (Cohen’s kappa 0.92–1.00 across all 200 documents; Supplementary Table S3). Combination therapy, the label with the largest difference between countries, had a kappa of 0.98 in US documents and 0.89 in Chinese documents (recall 100% and 91%). China’s combination share may therefore be slightly underestimated; correcting for precision and recall would narrow the US–China gap by about two points.
Statistics and robustness
We report shares with Wilson 95% confidence intervals and compare two shares with a two-sided two-proportion z-test. The main result, the change in China’s share between 2015–16 and 2020–21, was tested in five ways: (1) excluding documents filed in the Chinese office; (2) international PCT filings only; (3) documents with a known applicant country only; (4) using the earliest priority year instead of the application year; and (5) fractional counting, in which a document with applicants from k countries counts 1/k for each. Analyses used Python 3.12 (pandas, matplotlib). Code and processed data are openly available (see Data availability).
Results
China overtook the United States in 2020
Filing on checkpoint therapies grew from fewer than 25 documents a year before 2013 to 594 in 2021. Over the same period the share of documents with a Chinese applicant rose from 21.6% (95% CI 16.8–27.3) in 2015–16 to 39.1% (36.2–41.9) in 2020–21, while the US share fell from 50.8% (44.5–57.2) to 35.4% (32.6–38.2). China passed the United States in 2020 (36.6% vs 35.2%) and the gap widened in 2021 (41.2% vs 35.5%) (Figure 1).
The rise is not only a home-office effect. Outside the Chinese patent office, China’s share nearly doubled, from 9.1% to 17.7% (p = 0.004). The increase was similar with priority years, with fractional counting and among documents with a known applicant country (Table 1). In international PCT filings the share rose from 14.0% to 24.4%, but the early period had only 57 PCT documents, so this change is uncertain (p = 0.09).
Chinese applicants file mostly at home
In 2010–2021, 70.1% of documents with Chinese (and no US) applicants were filed in the Chinese office, 13.5% used the international PCT route and 6.5% were filed in the US office (Figure 2, Table 2). US applicants spread their filings: 35.1% in the US office, 26.9% through the PCT route, 8.9% in the Chinese office and 29.0% in other offices. Applicants from other countries followed a pattern similar to that of US applicants.
Patent family size confirms this pattern. Chinese families had a median of 2 documents (interquartile range 1–4), against 7 (3–13) for US families, and 31.8% of Chinese documents belonged to a family of one, against 12.5% of US documents (p < 0.001). Many Chinese inventions are therefore extended to at least one other office, but to fewer offices than US inventions.
Documents with Chinese applicants were more often granted or in force (36.4% vs 18.0%). This reflects the filing route rather than a difference in quality: PCT applications are never granted themselves, and grant rates in the Chinese and US offices were similar (36.8% and 34.8%).
Chinese patenting was also less concentrated. The 10 most active Chinese organisations held 20.5% of Chinese documents, against 33.8% for the 10 most active US organisations. The leading Chinese applicants were Jiangsu Hengrui Medicine (32 documents), Chia Tai Tianqing (23), Innovent Biologics (16) and Suzhou Shengdiya (15); the leading US applicants were Bristol Myers Squibb (78), Genentech (40) and Merck Sharp & Dohme (38). Academic and research applicants appeared on the same share of documents in both countries (32.4%).
China focuses on the PD-1 axis and bispecifics; the United States on combinations
Chinese documents more often named PD-1 (55.5% vs 42.9%) and PD-L1 (44.6% vs 30.5%), and less often CTLA-4 (8.7% vs 14.6%) (Figure 3). Newer targets were rare in both: LAG-3, TIM-3 or TIGIT appeared in 2.6% of Chinese and 4.7% of US documents.
The largest difference was in strategy. Combination therapies appeared in 53.8% of US documents but 33.5% of Chinese documents (difference 20.4 points, p < 0.001). Bispecific or multispecific molecules were more common in Chinese documents (10.6% vs 4.2%, p < 0.001), as were small molecules (6.5% vs 2.7%). Formulation and delivery patents were more common in US documents (6.2% vs 3.6%). Biomarker or diagnostic and cell therapy labels did not differ clearly. Chinese documents cited research papers more often (54.2% vs 42.8%).
The PD-1 or PD-L1 × VEGF bispecific class, which includes ivonescimab, appeared in the data from 2019. Of the 21 documents in this class, 19 had a Chinese applicant and one a US applicant (Supplementary Table S5).
Discussion
By 2020, applicants based in China filed more immune checkpoint patent documents than applicants based in the United States. This shift is large, appears under every way of counting we tried, and is visible outside China’s own patent office. It matches the wider rise of China in drug launches, oncology approvals and licensing [6,7,8,9,10], and China’s position as the largest source of international patent applications across all fields [18].
The shift has a clear shape. Most Chinese documents were filed in China, belong to smaller patent families, and use the international PCT route about half as often as US documents. Much of China’s checkpoint patenting therefore still serves a large domestic market, in line with earlier evidence that domestic incentives can raise patent counts in China without the same international reach [17]. The share of Chinese filings outside China, which nearly doubled, is the better signal of global competition. If this share keeps growing after 2021, as the 2025 licensing figures suggest [10], it should appear in the next data update.
Chinese and US applicants also protect different things. Chinese filings concentrate on PD-1 and PD-L1 antibodies and on bispecific formats. US filings more often describe combinations and CTLA-4, which fits the long effort of US companies to extend first-generation antibodies through combinations, new uses and new formulations as core patents approach expiry [16]. Newer targets such as LAG-3, TIM-3 and TIGIT remained rare in both countries up to 2023.
The bispecific result shows how patent data can give early warning. Almost all PD-1 or PD-L1 × VEGF bispecific documents in our data, from 2019 onward, came from Chinese applicants. This was before the ivonescimab trial results [12,13] and before the 2024–2026 licensing deals for this class with Merck, Pfizer and AbbVie [15]. Chinese strength in this format was therefore visible in patent records several years before it was visible in deal values.
For companies and investors, the results point to two practical uses. First, partner searches for PD-1-axis and bispecific assets should look beyond international filings, because many Chinese inventions are visible only in Chinese-office records or in small families. Second, freedom-to-operate and competition analyses for combination therapies should still centre on US applicants.
Limitations
- Documents, not inventions or products. We counted patent documents. Counts are not drug candidates, and many applications are never granted.
- Keyword labels. Targets and strategies come from keyword rules. Machine-translated Chinese abstracts may describe the same invention in different words. We widened the rules after a spot check, and agreement with 200 hand-coded documents was high (kappa 0.88 or more for every label and country), but the combination rule still missed some Chinese documents (recall 91%). The coding was done by one person, so we could not measure agreement between coders.
- Applicant country is the address on the patent, not where the research was done, and applicant names were not merged across related companies (for example, subsidiaries of the same group).
- Coverage. One search in one database, exported in January 2024. Documents that use none of our search terms are missed, and 2022–2023 are incomplete. Events after 2023, such as licensing deals and trial results, come from company announcements and news reports, not from our data.
- Small early numbers. The 2015–16 baseline is small for PCT filings (57 documents), so that comparison is uncertain.
Conclusion
China became the largest source of immune checkpoint patent filings in 2020, but it is strong mainly at home: most Chinese filings stay in China, belong to small families and centre on the PD-1 axis and bispecific formats, while US applicants file globally and focus on combinations. The early Chinese lead in PD-1 × VEGF bispecifics shows that these home filings can still carry inventions of global value. Tracking China’s share of international filings will show whether this home strength turns into global reach. The open explorer at cognosx.ca/dashboards/immune-checkpoint lets readers test these patterns for any target, strategy, applicant type or period.
Supplementary Materials
The following supporting information can be downloaded at the website of this paper posted on Preprints.org.
Author Contributions
MDMF designed the study, collected and analysed the data, coded the validation sample and wrote the manuscript.
Funding
This work received no specific funding.
Ethics approval and consent
This study used only publicly available patent records. It involved no human
participants, no patient data and no intervention, so ethics approval and informed consent were not required.
Competing interests
The author founded CognosX, which provides science-intelligence services, including
patent landscape analyses. The author has no other competing interests to declare.
Data availability
Processed data, the search query, the label-check sample and code for every number, table
and figure (scripts/paper_analysis.py) are openly available at github.com/descartesmbogning/immunecheckpoint-
patent-explorer. The interactive explorer is at cognosx.ca/dashboards/immune-checkpoint. Raw
patent records are available from Lens.org under its terms of use.
Use of AI tools
An AI assistant (Claude, Anthropic) helped write analysis code and draft and edit the text. The
author checked all analyses, coded the validation sample and takes full responsibility for the content.
Reporting guideline
No EQUATOR reporting guideline applies to patent landscape studies. The search,
cleaning, labelling and analysis steps are fully reported in the Methods, the supplementary material and the
public code.
References
- Mbogning Fonkou MD, et al. Leveraging machine learning and big data techniques to map the global patent landscape of phage therapy. Nat Biotechnol. 2024. [CrossRef]
- Collin M. Immune checkpoint inhibitors: a patent review (2010–2015). Expert Opin Ther Pat. 2016;26(5):555–64. [CrossRef]
- Storz U. Intellectual property issues of immune checkpoint inhibitors. mAbs. 2016;8(1):10–26. [CrossRef]
- Guo L, Wei R, Lin Y, Kwok HF. Clinical and recent patents applications of PD-1/PD-L1 targeting immunotherapy in cancer treatment: current progress, strategy, and future perspective. Front Immunol. 2020;11:1508. [CrossRef]
- Li G, Jiang Y, Qin Y, Yuan S, Chen X. Comparing development strategies for PD1/PDL1-based immunotherapies. Nat Rev Drug Discov. 2022;21:484. [CrossRef]
- Feyman Y, O’Brien JM, Campbell JD. The changing landscape of global biopharmaceutical leadership, 2004–2024. Ther Innov Regul Sci. 2026;60(6):1687–96. [CrossRef]
- Collins G, Pandita D, Andrews H, Navarro-Serer B, Levi-D’Ancona E, Allen J, Stewart M. A cross-national review of novel oncology approvals in the United States and China (2020–2025). Health Aff Sch. 2026;4(7):qxag183. [CrossRef]
- Yao G, Shi L, Zheng Y. The landscape of innovative oncology drug targets. Drug Discov Today. 2026;31(1):104571. [CrossRef]
- Okuyama R. Shifting global drug discovery landscape and the critical role of startups in strengthening national capabilities. Drug Discov Today. 2026;31(1):104576. [CrossRef]
- Wu K, Silver A. China biotech licensing boom to hit record in 2026 as pipeline swells. Reuters. 13 February 2026. https://finance.yahoo.com/news/analysis-china-biotech-licensing-boom-092338804.html.
- Summit Therapeutics. Summit Therapeutics partners with Akeso in deal for up to $5 billion to in-license ivonescimab. Press release, 6 December 2022. https://www.biospace.com/summit-therapeutics-partners-with-akeso-inc-in-deal-for-up-to-5-billion-to-in-license-breakthrough-innovative-bispecific-antibody-500-million-upfront-payment-to-activate-the-partnership-for-ivonescimab.
- Xiong A, Wang L, Chen J, et al. Ivonescimab versus pembrolizumab for PD-L1-positive non-small cell lung cancer (HARMONi-2): a randomised, double-blind, phase 3 study in China. Lancet. 2025;405(10481):839–49. [CrossRef]
- OncLive. Ivonescimab meets OS end point vs pembrolizumab in first-line PD-L1+ NSCLC. 3 September 2026. https://www.onclive.com/view/ivonescimab-meets-os-end-point-vs-pembrolizumab-in-first-line-pd-l1-nsclc.
- Summit Therapeutics. U.S. FDA acceptance of Biologics License Application seeking approval for ivonescimab in combination with chemotherapy in EGFRm NSCLC post-TKI therapy. Business Wire, 29 January 2026. https://www.businesswire.com/news/home/20260129109846/en/.
- Pharmaceutical Technology. JPM26: AbbVie and RemeGen kick off deals with $5.6bn oncology agreement. 12 January 2026. https://www.pharmaceutical-technology.com/news/abbvie-remegen-pd-1-vegf-bispecific-licensing-deal/ ; and Fierce Biotech. Pfizer pays 3SBio $1.25B for PD-1xVEGF bispecific. May 2025. https://www.fiercebiotech.com/biotech/pfizer-pays-3sbio-125b-pd-1xvegf-bispecific-joining-biontech-merck-and-summit-red-hot-race.
- pharmaphorum. FDA clears subcutaneous Keytruda in a boost to MSD. 22 September 2025. https://pharmaphorum.com/news/fda-clears-subcutaneous-keytruda-boost-msd.
- Dang J, Motohashi K. Patent statistics: a good indicator for innovation in China? Patent subsidy program impacts on patent quality. China Econ Rev. 2015;35:137–55. [CrossRef]
- World Intellectual Property Organization. Patent Cooperation Treaty Yearly Review 2026: executive summary. Geneva: WIPO; 2026. https://www.wipo.int/web-publications/executive-summary-patent-cooperation-treaty-yearly-review-2026-the-international-patent-system/en/patent-cooperation-treaty-yearly-review-2026-executive-summary.html.
- The Lens. Patent search, exported 28 January 2024. https://www.lens.org.
Figure 1.
Share of immune checkpoint patent documents with Chinese and US applicants, 2014–2023. Solid lines: all documents, with 95% confidence bands. Dashed: Chinese share outside the Chinese patent office. Dotted: Chinese share among international PCT filings. Years with fewer than 30 documents are not shown. Shaded: incomplete years (2022–2023). Explore by target or strategy at cognosx.ca/dashboards/immune-checkpoint.
Figure 1.
Share of immune checkpoint patent documents with Chinese and US applicants, 2014–2023. Solid lines: all documents, with 95% confidence bands. Dashed: Chinese share outside the Chinese patent office. Dotted: Chinese share among international PCT filings. Years with fewer than 30 documents are not shown. Shaded: incomplete years (2022–2023). Explore by target or strategy at cognosx.ca/dashboards/immune-checkpoint.
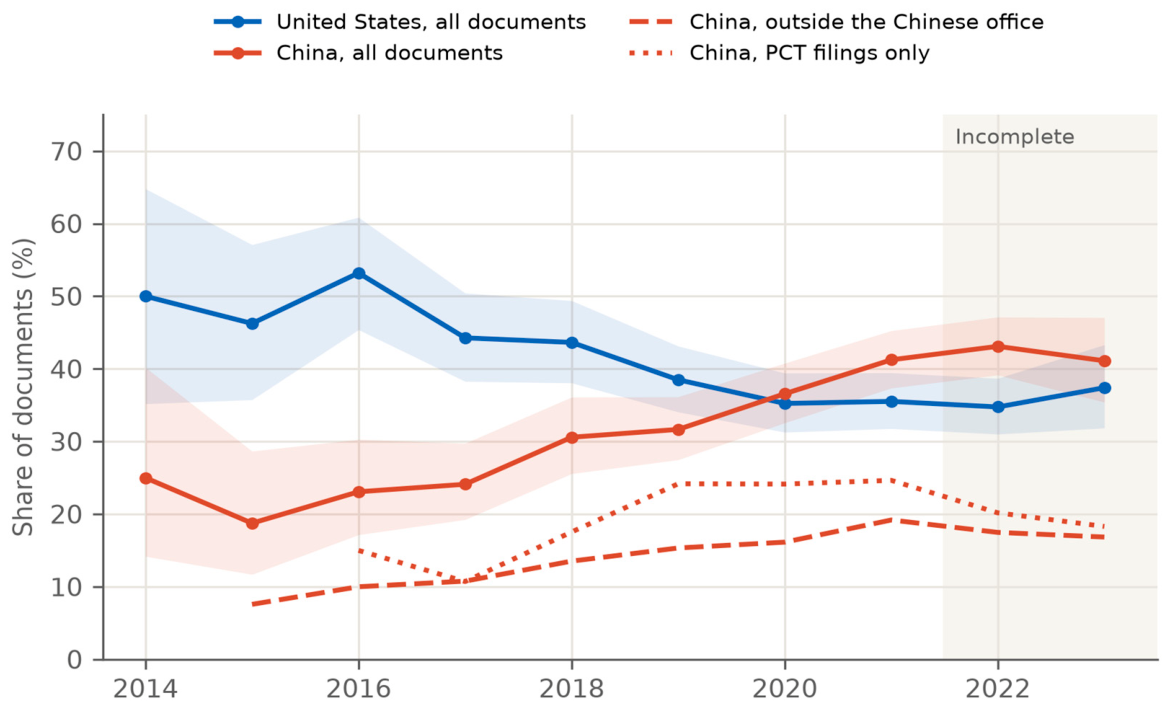
Figure 2.
Where applicants seek protection, 2010–2021. Share of documents filed in each office, for documents with Chinese (and no US) applicants, US (and no Chinese) applicants and applicants from other countries. Explore filing offices by year at cognosx.ca/dashboards/immune-checkpoint.
Figure 2.
Where applicants seek protection, 2010–2021. Share of documents filed in each office, for documents with Chinese (and no US) applicants, US (and no Chinese) applicants and applicants from other countries. Explore filing offices by year at cognosx.ca/dashboards/immune-checkpoint.
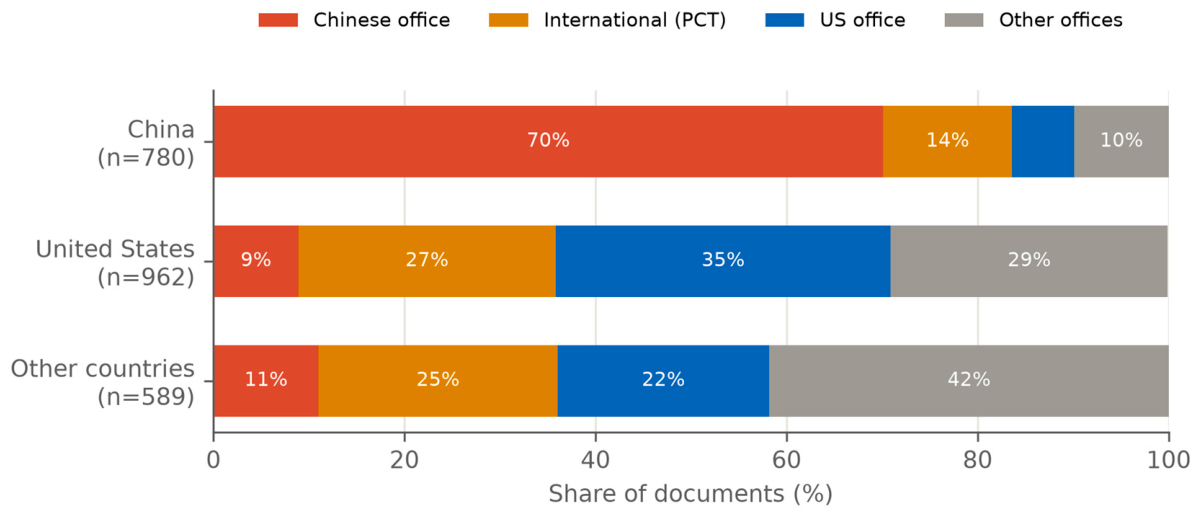
Figure 3.
What Chinese and US applicants protect, 2010–2021. Share of documents with each target or strategy label, with 95% confidence intervals. Labels come from keyword rules on titles and abstracts; a document can carry several. Explore by target and strategy at cognosx.ca/dashboards/immune-checkpoint.
Figure 3.
What Chinese and US applicants protect, 2010–2021. Share of documents with each target or strategy label, with 95% confidence intervals. Labels come from keyword rules on titles and abstracts; a document can carry several. Explore by target and strategy at cognosx.ca/dashboards/immune-checkpoint.
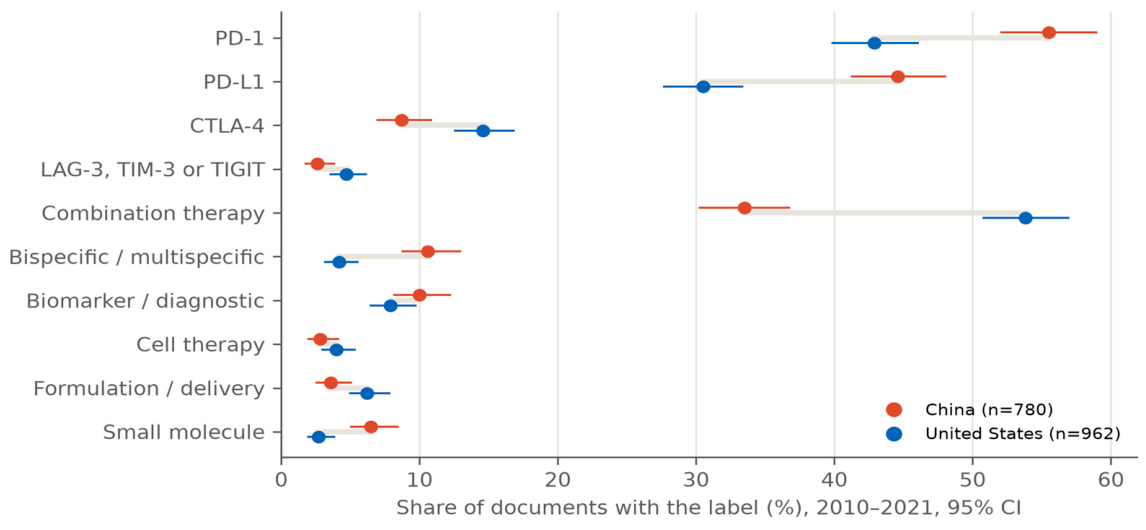

Table 1.
China’s share of immune checkpoint patent documents, 2015–16 vs 2020–21, under five checks. Shares (%) with Wilson 95% confidence intervals; p from a two-sided two-proportion z-test.
Table 1.
China’s share of immune checkpoint patent documents, 2015–16 vs 2020–21, under five checks. Shares (%) with Wilson 95% confidence intervals; p from a two-sided two-proportion z-test.
| Check | 2015–16, % (95% CI), n | 2020–21, % (95% CI), n | Ratio | p |
|---|---|---|---|---|
| All documents (main) | 21.6 (16.8–27.3), 236 | 39.1 (36.2–41.9), 1,119 | 1.81 | <0.001 |
| Outside the Chinese office | 9.1 (5.8–14.1), 186 | 17.7 (15.1–20.7), 717 | 1.94 | 0.004 |
| International (PCT) filings only | 14.0 (7.3–25.3), 57 | 24.4 (19.6–30.0), 258 | 1.74 | 0.09 |
| Known applicant country only | 22.2 (17.3–28.0), 230 | 40.3 (37.4–43.2), 1,085 | 1.82 | <0.001 |
| By earliest priority year | 17.0 (13.7–20.8), 430 | 40.9 (38.0–43.9), 1,078 | 2.41 | <0.001 |
| Fractional counting | 21.5 | 39.9 | 1.85 | – |
Table 2.
Filing route and geographic reach, 2010–2021. Documents with Chinese (and no US) applicants, US (and no Chinese) applicants and applicants from other countries. Shares (%) with Wilson 95% confidence intervals.
Table 2.
Filing route and geographic reach, 2010–2021. Documents with Chinese (and no US) applicants, US (and no Chinese) applicants and applicants from other countries. Shares (%) with Wilson 95% confidence intervals.
| Measure | China (n = 780) | United States (n = 962) | Other countries (n = 589) |
|---|---|---|---|
| Filed in the Chinese office | 70.1 (66.8–73.2) | 8.9 (7.3–10.9) | 11.0 (8.8–13.8) |
| Filed through the PCT route | 13.5 (11.2–16.0) | 26.9 (24.2–29.8) | 25.0 (21.6–28.6) |
| Filed in the US office | 6.5 (5.0–8.5) | 35.1 (32.2–38.2) | 22.2 (19.1–25.8) |
| Filed in other offices | 9.9 (8.0–12.2) | 29.0 (26.2–31.9) | 41.8 (37.8–45.8) |
| Family of one document | 31.8 (28.6–35.1) | 12.5 (10.5–14.7) | 16.3 (13.5–19.5) |
| Family size, median (IQR) | 2 (1–4) | 7 (3–13) | 6 (2–13) |
| Granted or in force | 36.4 | 18.0 | 20.4 |
Disclaimer/Publisher’s Note: The statements, opinions and data contained in all publications are solely those of the individual author(s) and contributor(s) and not of MDPI and/or the editor(s). MDPI and/or the editor(s) disclaim responsibility for any injury to people or property resulting from any ideas, methods, instructions or products referred to in the content. |
© 2026 by the author. Licensee MDPI, Basel, Switzerland. This article is an open access article distributed under the terms and conditions of the Creative Commons Attribution (CC BY) license.
Copyright: This open access article is published under a Creative Commons CC BY 4.0 license, which permit the free download, distribution, and reuse, provided that the author and preprint are cited in any reuse.